1. Introduction
The process of determining the equation of a line passing through two points is one of the elementary tasks carried out in the computational geometry field. As it was pointed out in the article [
1], the mentioned tool will be applied in machine learning, in Data Gravitation Classification (DGC). Gravitational classification applies the principles of the gravitational model presented in 1977 by Wright W.E. [
2]. Its details were described by Peng L. et al. in the article from 2005 [
3]. The methods based on the gravitational model were applied successfully in many prediction tasks in various areas, for example in the identification of problems and dangers concerning Internet traffic based on imbalanced data sets [
4].
Many extensions of original DGC were developed [
3], while focusing on the issues linked with the classification of imbalanced data sets. In this context, the Amplified Gravitation Coefficient (AGC), which contains information concerning the classes imbalance, was elaborated [
5]. Two methods of data sampling were proposed as well. The first one is Under-Sampling Imbalanced Data Gravitation Classification (UI-DGC) [
6] and the second one is Synthetic Minority Oversampling Technique Data Gravitation Classification (SMOTE-DGC) [
7].
The imbalanced data sets may be met in the above-mentioned problem of the Internet traffic dangers identification [
4], in the prediction of blood donation [
8,
9], in occupancy indoor detection [
10], and in many other fields. The aforesaid occupancy detection is a very popular issue undertaken recently by many researchers [
11,
12,
13,
14,
15].
In the context of gravitational classification, a line passing through two points constitutes the main mathematical instrument of the Geometrical Divide (GD) method in a division of data particles belonging to two-dimensional feature space. The history of data particles geometrical divide started in 2020 and its details were presented in the article [
1]. At the time, the research results showed that the Geometrical Divide method implemented to the gravitational classifier is efficient in the classification process of two-dimensional balanced Moons and Circles data sets, in which a linear decision boundary does not exist, the centroids are close to each other and the objects belonging to various classes overlap in a feature space. As reported in published papers, the potential of the Geometrical Divide method application in the process of data sets classification, in which the majority and minority classes can be identified, has not been researched yet. Thereupon, the next stage in the research concerning the GD approach can constitute an analysis of its efficiency and the potential development of the algorithm in the process of imbalanced data sets classification [
1]. Another direction of further researches can be testing of the GD method in application for purposes related to Radio Detection And Ranging (RADAR) [
16].
Hereby, the article constitutes the next step in the research on data particle geometrical divide. The purpose thereof is the efficiency testing of the Geometrical Divide approach and its variant Unequal Geometrical Divide (UGD) in the process of imbalanced data sets classification in two-dimensional feature space. The research was conducted on 16 imbalanced Moons and Circles data sets. However, to verify the potential of practical application of the mentioned methods, the second experiment was conducted on 10 data sets, which were built based on occupancy real data set coming from the repository of the University of California in Irvine (UCI) [
17].
In the research, the results obtained by GD [
1], UGD, and a popular method of data particle creating based on classes by a compound of 1 ÷ 1 cardinality (1CT1P) were compared. 1CT1P approach comes from the definition of the Gravitation Model [
18] whose good efficiency was demonstrated in the document classification problem. Moreover, in comparison, the approach of creating data particle based on a single data set element, 1CT1P significantly reduces the number of elements that will be processed in the next operations. Each of the mentioned approaches were combined with basic Nearest Centroid algorithm (NC) and three algorithms defining the data particle mass-n-Mass Model (n-MM) [
19], Stochastic Learning Algorithm (SLA), and Bath-update Algorithm (BLA) [
18]. In the experiments, k-fold cross validation method with k = 10 was applied and the obtained findings were expressed as precision, recall, and F-measure values.
The results of the experiments constitute contribution to the state of the art concerning the data particles geometrical divide. They also prove that the approaches creating data particle through its geometrical divide outperform the popular method of constructing data particle based on classes by a compound of 1 ÷ 1 cardinality in the process of imbalanced data sets classification, in two-dimensional feature space. Moreover, they find a practical application in the process of occupancy detection, which was presented in the third section of this paper.
2. Materials and Methods
The overall idea of the pattern recognition process applying the principia of data gravitation classification was described in details in the article [
3]. It is based on the processing of data particles, which are a representation of analysed data set. In the feature space of dimension R
n a data particle can be expressed as vector
p, described by three components:
label l, the value of which may result directly from the information stored in the training data set or may be assigned in the classification process;
mass m, which is expressed by a scalar quantity determined through applying one of the published approaches: Stochastic Learning Algorithm [
18], Bath-update Algorithm [
18], or n-Mass Model [
19];
centroid expressed by the vector µ with length |µ| = n, which defines the position of data particle in a feature space.
The decision making concerning the belonging of a new sample
x to one of the predefined classes belonging to the set
C is based on the determination and comparison of the values of the gravitational force F(
p,
x) between each of the existing particles
p and the atomic data particle
x related to the newly classified object. The result of the described operation is information, of which the test sample
p takes the greatest similarity with the newly classified object
x. Thereafter, the label of the data particle, for which the force between them was the biggest, will be assigned to the label of analysed object l
x [
3].
2.1. Line Passing through Two Centroids in the Data Particle Geometrical Divide Approaches
In the publication [
1], it was demonstrated that it is possible to create new data particles based on already existing data particles through their geometrical divide. Such a strategy provides better matching of the decision boundary to the characteristics of data set than the one applied by the popular method of data particle creation based on class by a compound of 1 ÷ 1 cardinality (1CT1P).
A line passing through two points is an elementary tool applied in the geometrical divide of data particles belonging to two-dimensional feature space [
1]. In space of dimension R
2, the line passing through two points
Pi = [x
i, y
i] and
Pj = [x
j, y
j] is expressed by Equation (1).
Taking into consideration that the Geometrical Divide method [
1] in each iteration executes the divide of all data particles, this can be a problem in the classification of imbalanced data sets, in which a minority class can limit the possibility to perform the sufficiently deep divide of data particles. To solve the problem mentioned in this article, the new method was developed, which is a modification of the Geometrical Divide approach. In the proposed algorithm, the selection process of data particles to be divided depends on their size.
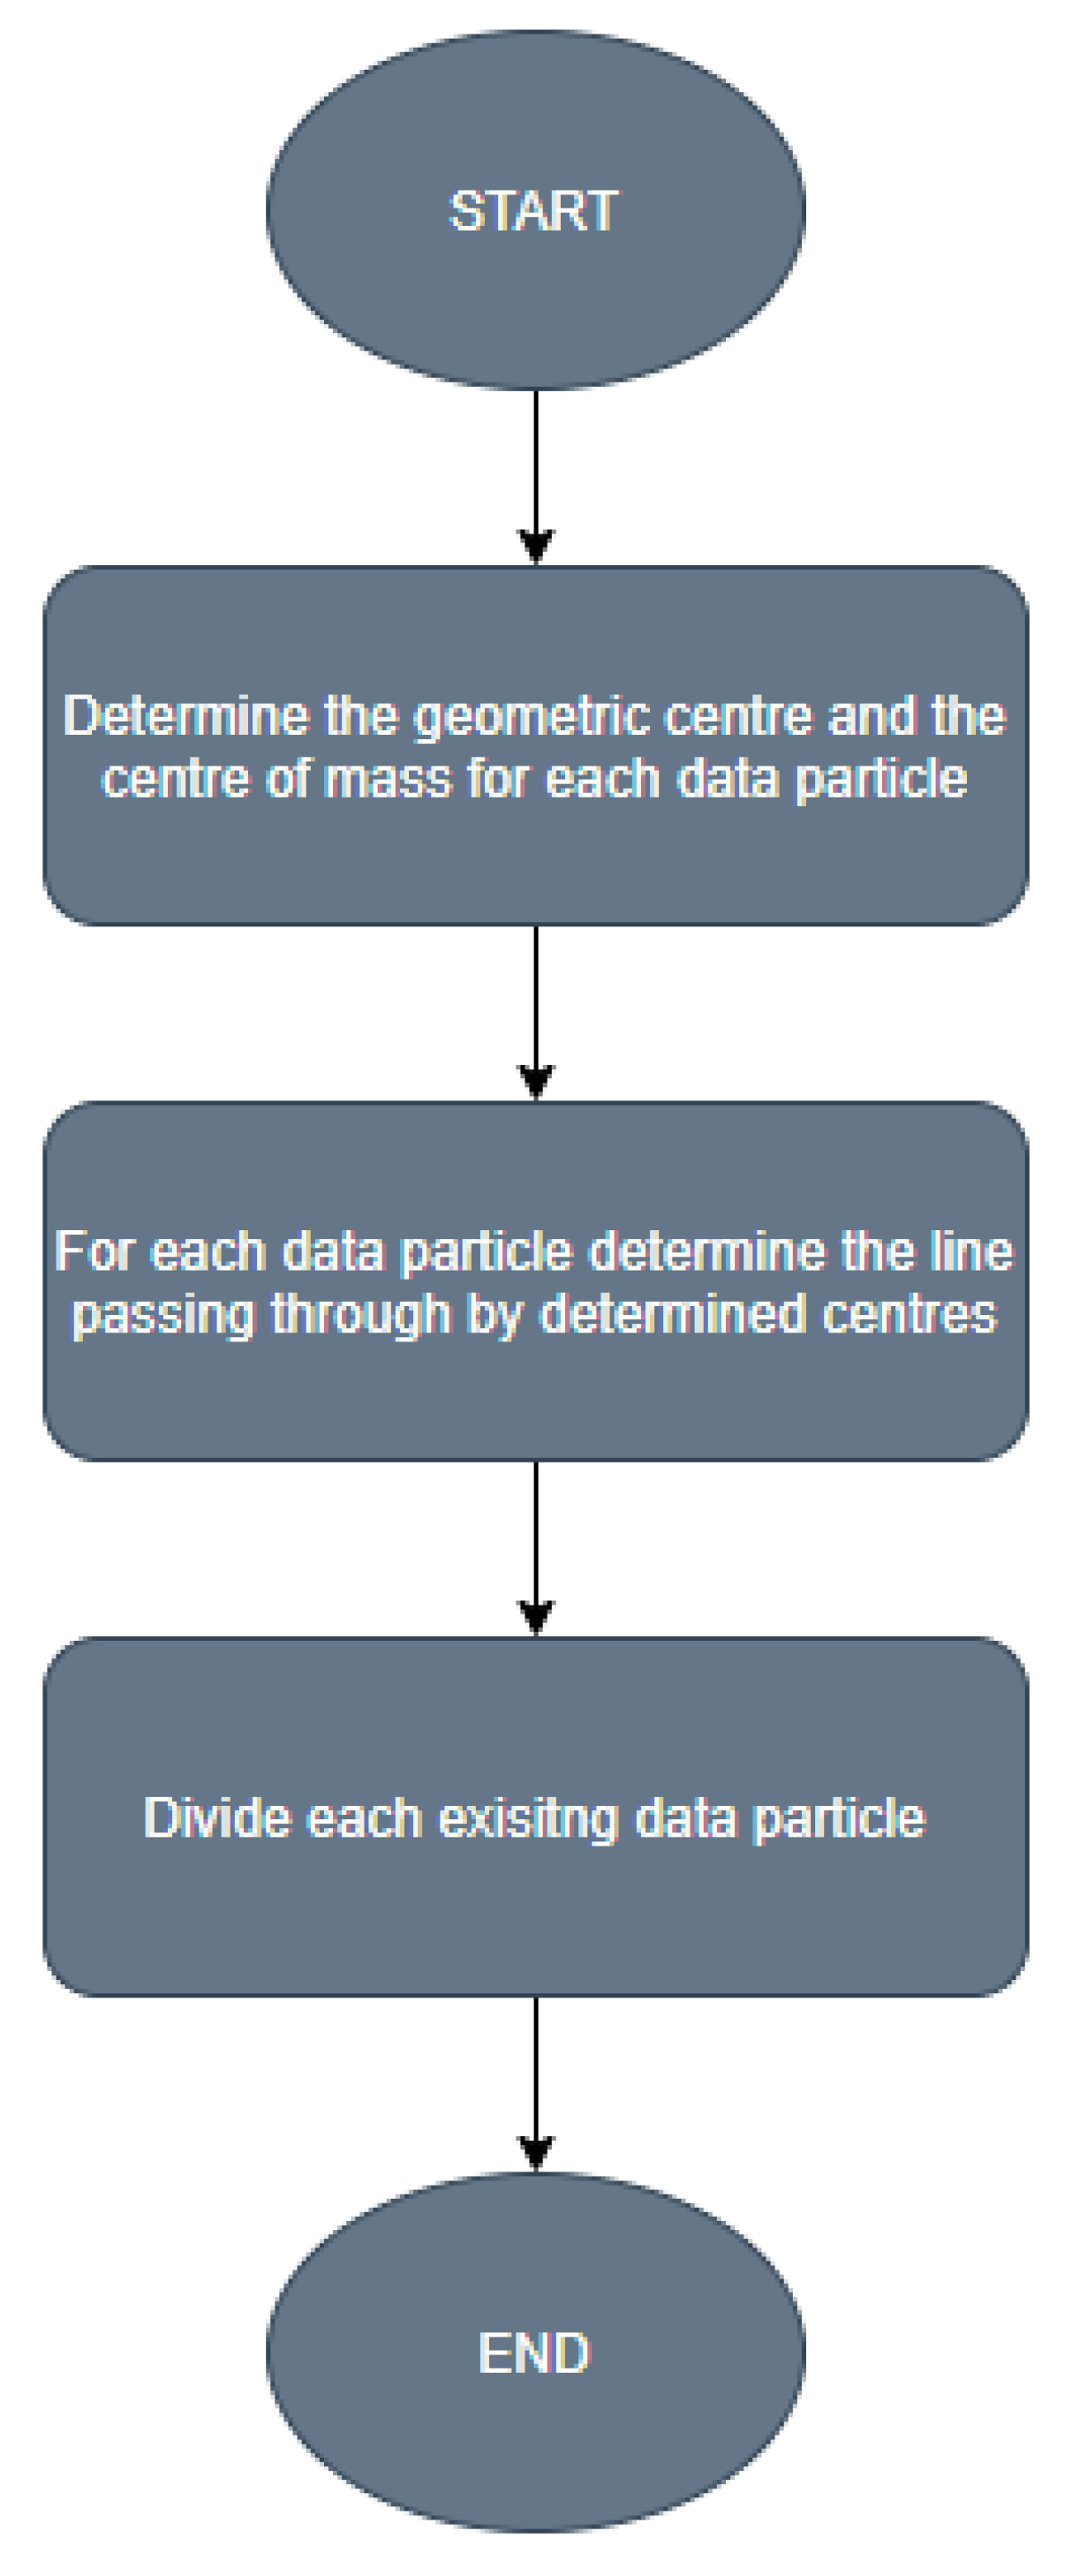
In the geometric division methods, in order to divide the data particles with respect to the line, in the first step, two points have to be ascertained: the centre of mass and the geometric centre [
1]. Determining the geometric centre
c = [c
1, c
2] consists in finding the range of a given feature, and then in reducing its maximum value by a half of the range value.
The procedure of determining the centre of mass µ = [µ1, µ2] is based on establishing the mean value for each component of the feature vector. The vector ascertained in that way is the centre of mass for the analysed data particle.
As a result of the actions described in the previous paragraphs, two points are created for an individual data particle: the geometric centre and the centre of mass. An assumption for the geometrical divide methods, which was not clearly defined in a previous research concerning this field [
1], should be introduced at this point. According to it, the vectors expressing the mentioned centres have to be different. It is necessary to find the line which will divide the data particle in the next step of the method. Otherwise the process of data particle geometrical divide will not be possible. In accordance to the above-mentioned the Lemma 1 is defined as:
Lemma 1. Geometrical divide of data particle in a two-dimensional feature space is possible if the vectors expressing the centre of mass and the geometric centre are different.
In the next step of the algorithm, a line dividing the analysed data particle will pass through those two points. By inserting the created points into the equation of the straight line expressed by Equation (1), the equation of the straight line expressed by the Equation (2) was obtained.
The above-described stages of the data particle geometrical divide algorithms for an exemplary data set were visualized in
Figure 1.
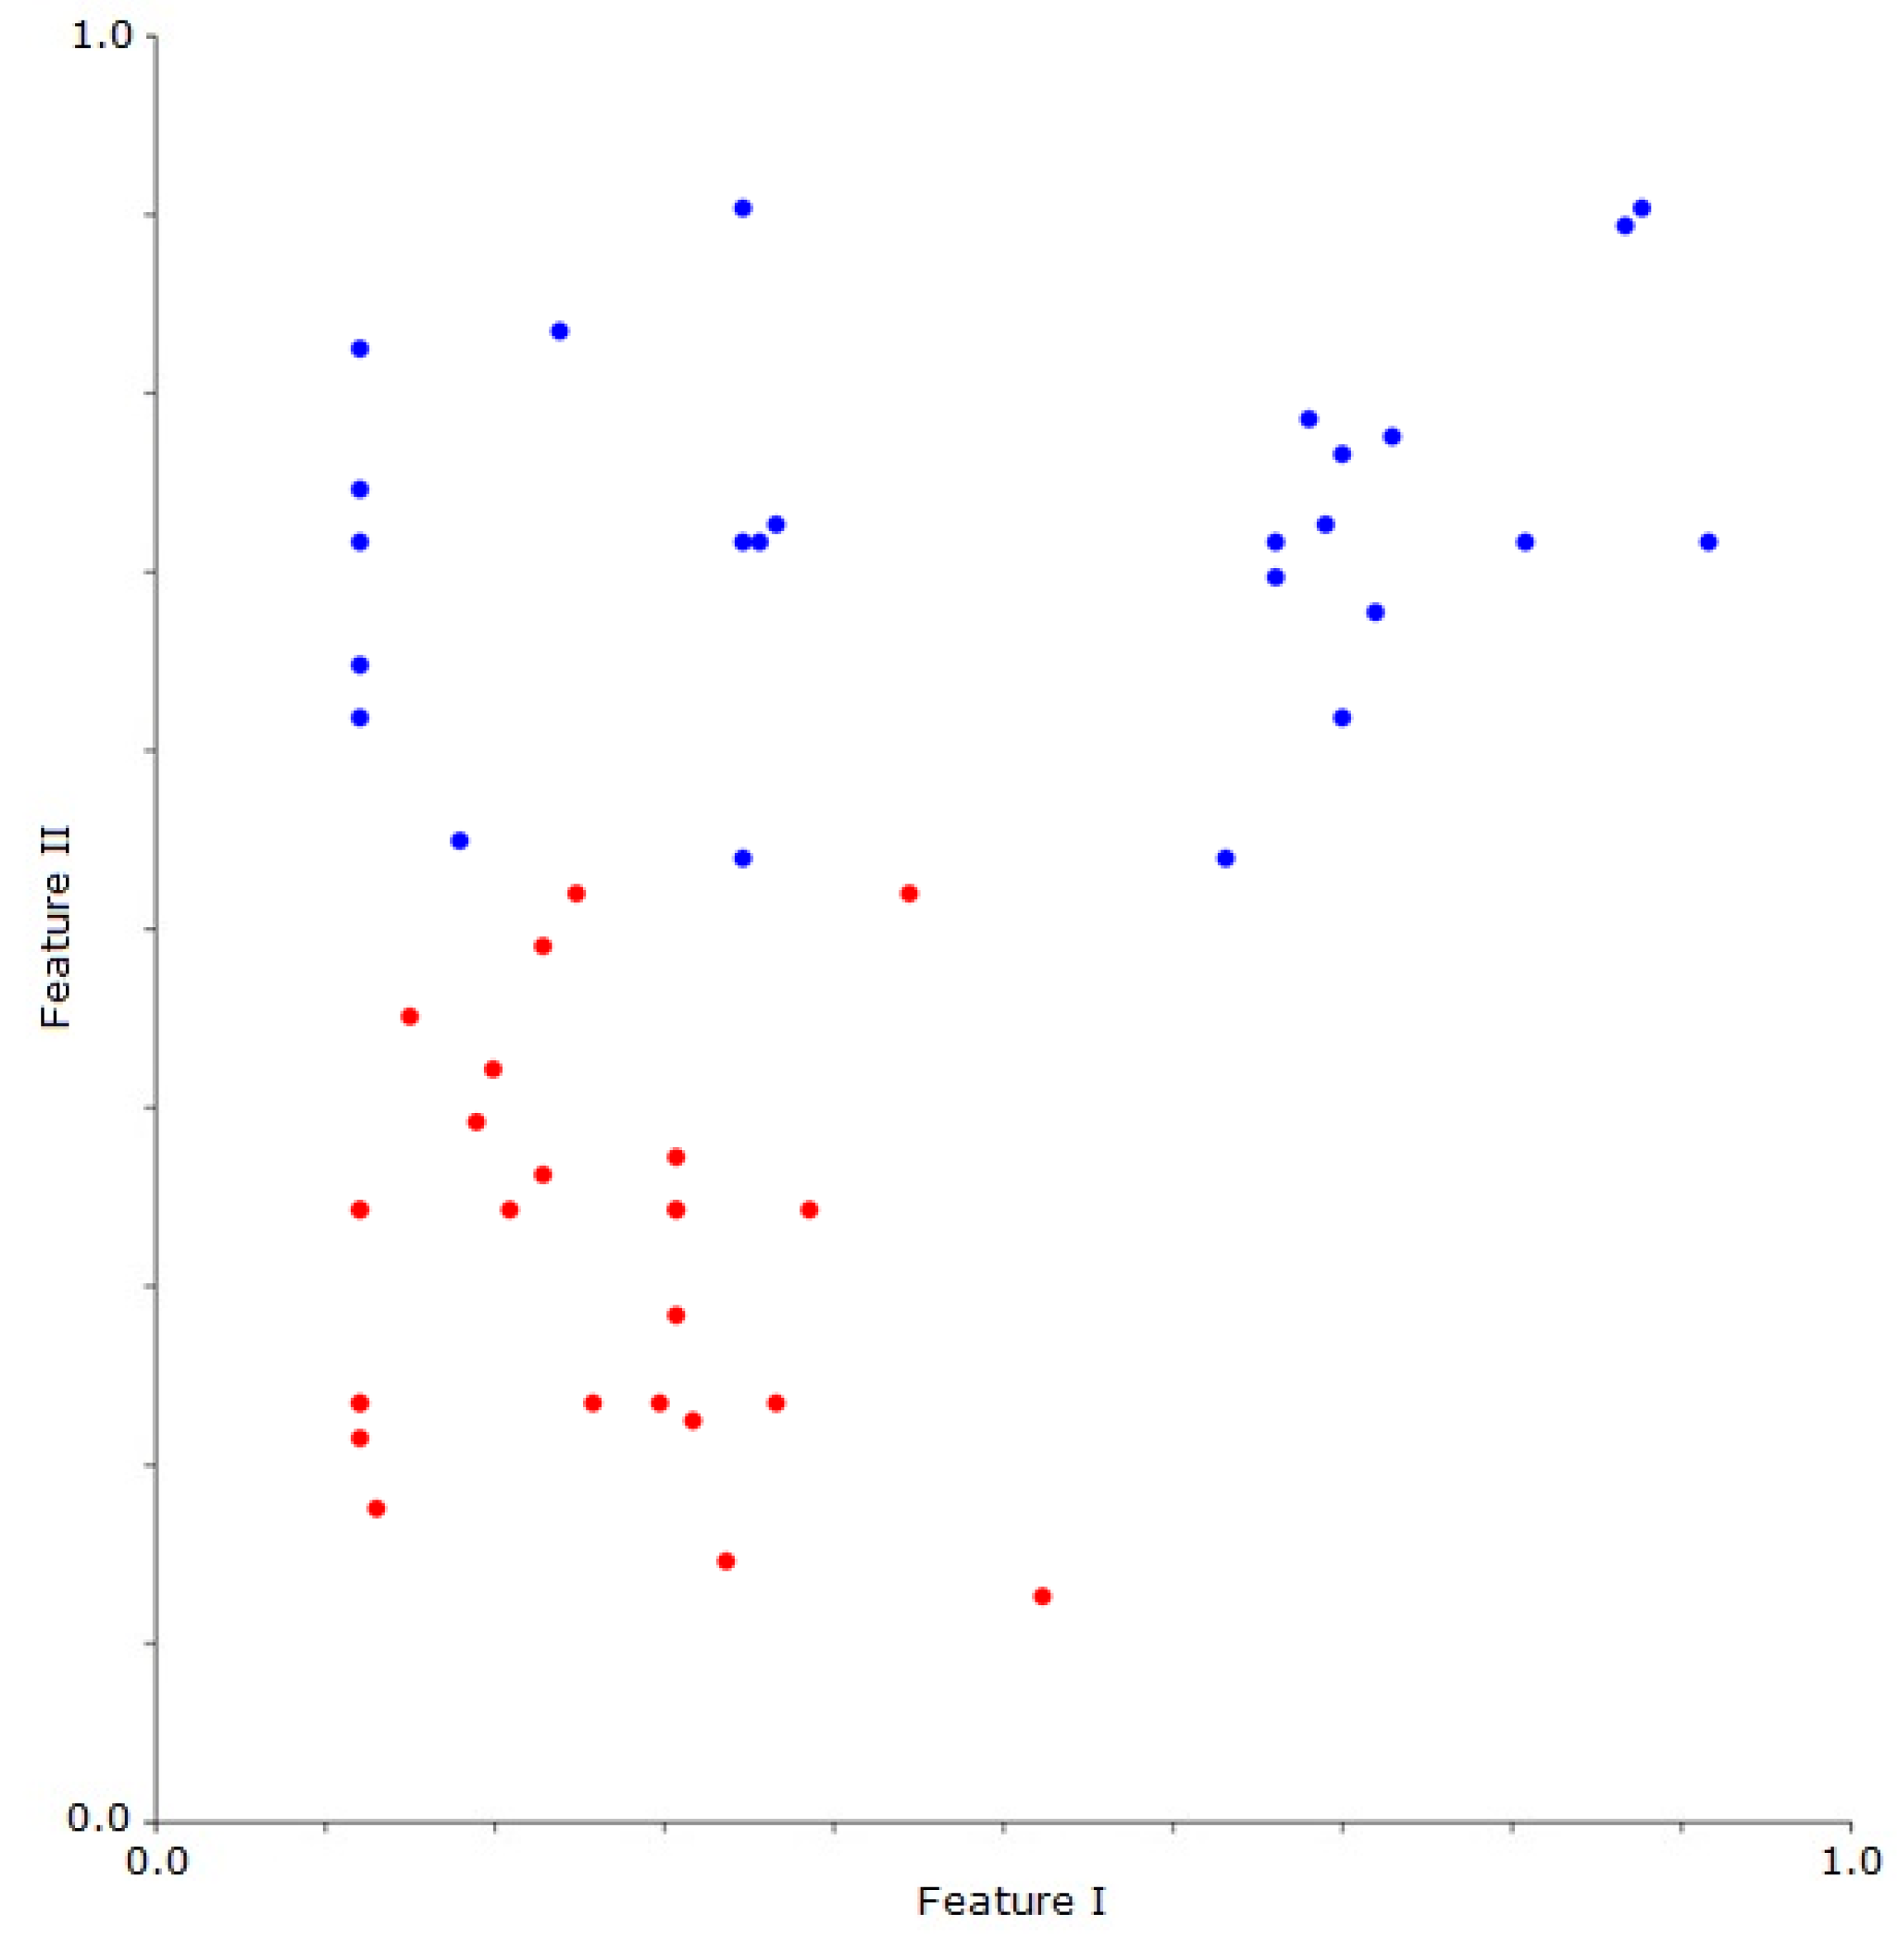
The last stage in the data particle geometrical divide algorithms is to verify whether each of the atomic data particles belonging to the analysed sample lie under, on, or above the drawn line. This step is realised by inserting the vector components of an analysed atomic data particle to the equation of line passing through two centroids (Equation (2)). The result of the described stage, namely the information which concerns the belonging of each atomic data particle to one of two newly created data particles, is shown in
Figure 2. The red and blue dots represent the atomic data particles and are creating two groups relating to the two new data particles.
In accordance with the above-described state of the art concerning data particle geometrical divide approaches, their idea can be briefly presented as the sequence of three steps, which was illustrated in
Figure 3.
The main contribution to the state of the art on the data particle geometric divide methods, following the development of the new Unequal Geometrical Divide method, results from the new selection strategy of data particle to be divided. As aforementioned, the GD method in a single iteration performs the divide of all data particles. It is an effective approach in the classification process of balanced data sets [
1]. The idea accompanying the genesis of the Unequal Geometrical Divide was to enable the divide of larger particles regardless of the size of those referring to the minority class samples, which in the base algorithm significantly limited the possibility of divide. Therefore, the UGD method is the data particle geometrical divide approach dedicated to applications in the classification process of imbalanced data sets. The effectiveness of the new approach in this problem is determined by the fact that the UGD method in a single iteration divides only the data particle consisting of the largest number of atomic data particles.
By making the synthesis of the above-introduced lemma and the above-placed description of works concerning the development of the Unequal Geometrical Divide approach, the extended idea of the geometrical divide methods can be visualised in the form of the schema presented in
Figure 4.
In
Figure 4, the orange elements refer to Lemma 1, and the blue element presents the new selection strategy of data particle, which will be divided. According to the schema, the idea of improved geometrical divide starts from determining the centre of mass and the geometric centre. Next, the comparison of vectors expressing these centres is conducted in consonance with the introduced lemma. If they are different, the divide of data particle can be realised. Otherwise, the divide of data particle is not possible. In the last step, the selection of data particle/-s is conducted. At this stage, two strategies can be applied. Pursuant to the first one, all existing data particles, whose centre of mass and geometric centre are different, will be divided. However, the second strategy, which was developed in this article, can be used as well and in accordance to its idea only the largest data particle will be divided. The described sequence of tasks can be repeated until the established number of data particles is reached.
2.2. Evaluation: Platform, Data Sets, Methods, and Metrics
All algorithms, which were examined in this research, were implemented at the Java Platform Standard Edition. Any external libraries and frameworks were not used.
The above-mentioned methods of data particles creation were examined on two groups of imbalanced data sets. The first group consisted of 16 artificially generated data sets whose objects form the Moons and Circles shapes in the two-dimensional feature space. The data sets of this type can be generated by using the scikit-learn free library for Python [
20]. However, the data sets used in this research were created by the self-implemented program in the Java language. The procedure of generating a class of data sets focuses on the combination of the circle equation with the conditional instructions. The information concerning the imbalance of individual data sets is presented in
Table 1.
The balanced variants of these data sets were presented in details in article [
1], and at this time it was mentioned that these types of data sets have features that are problematic for classifiers based on centroids. Therefore, having the knowledge that the developed variant of geometrical divide is based on Centroid Based Classifier, its examination is important in terms of the inheritance of the mentioned feature. On the other hand, the second group of data sets was built based on real occupancy data set, which is available in the repository of the University of California in Irvine (UCI) [
17]. There are three files in the directory downloaded from the mentioned source: one is a training data set and the two others are test data sets [
21]. Due to the fact that in this study the k-fold cross validation method was used, those files were merged, and then based on that, the test and training sets were created. Taking into account that the discussed methods of creating data particles find application in the classification of two-dimensional data sets, it was possible to create 10 different two-dimensional sets based on the attributes offered by occupancy data set:
Temperature (°C),
Humidity/Relative humidity (%), which expresses the present state of absolute humidity in relation to the maximum humidity,
Light (lx),
CO2 (ppm),
Humidity Ratio/Absolute humidity (kgwater_vapor × kgair−1), which expresses the present total mass of water vapor in relation to the volume or mass of air.
Each data set consisted of 20,560 elements, where 4750 objects belonged to a positive class and the other 15,810 belonged to a negative class. The attributes applied therein are presented in
Table 2, and before further processing the range of values for each attribute was mapped to the range [0, 1].
In the process of creating a predictive model, the purpose is to maximize its effectiveness. However, at the stage of its evaluation, particular attention should be paid to whether the model has not been overfitted in the design process. Symptoms of the occurrence of such a phenomenon are very good results on one specific data set and low efficiency at the moment of implementing such a classifier to another problem, in which a different data set is used [
22]. The application of the k-fold cross validation method in the algorithm evaluation process prevents the aforesaid situation. It can be considered as a good practice, which is used in many field publications [
23,
24]. The authors of this article, drawing on the experience of other researchers, also applied the above-mentioned method and parameterized it by setting the parameter k = 10.
Information concerning the classification result of each sample was registered in the confusion matrix (CM) consisting of the following elements: TP—true positive, TN—true negative, FP—false positive, and FN—false negative. Expressing the efficiency of the classifier applied to the binary classification of imbalanced data sets required the use of a metric that would provide relevant information about the quality of prediction model. In accordance with that, the precision, recall, and F-measure were applied. Precision is expressed as P = TP/(TP + FP), recall is described by formula R = TP/(TP + FN), whereas F-measure uses both of them and is expressed by equation F = 2 × P × R/(P + R).
3. Results
The research was divided into two experiments. The imbalanced data sets with different characteristic were applied in each of them. The mentioned experiments revolve around the comparison of results expressed by precision, recall, and F-measure and were obtained by the methods of data particles creation listed below:
Each of the mentioned methods was combined with the standard Centroid Based Classifier (CBC) and with three algorithms of data particle mass determination:
n-Mass Model (n-MM) [
19], which determines the value of data particles masses based on a size of classes;
Stochastic Learning Algorithm (SLA) [
18], in which:
- ○
maximum number of iterations maxIters = 50;
- ○
coefficient of the mass value update ξ = 0.0001;
- ○
expected error threshold ε = 0.00;
Batch-update Algorithm [
18], in which the coefficient of the mass value update ξ = 0.0001.
As a result, 12 hybrid approaches combining each of the data particle creating methods with each algorithm of the data particle mass determination and with Centroid Based Classifier were implemented:
1CT1P-SLA,
1CT1P-BLA,
1CT1P-n-MM,
1CT1P-CBC,
GD-SLA,
GD-BLA,
GD-n-MM,
GD-CBC,
UGD-SLA,
UGD-BLA,
UGD-n-MM,
UGD-CBC.
Therefore, for a single data set, 12 values of precision, recall and F-measure were obtained, which were classified into 3 groups, in the criterion of applied data particle creation algorithm:
Each group consisted of four precision, recall, and F-measure values referring to results obtained by one of the mentioned approaches, which was combined with three algorithms of data particle mass determination and Centroid Based Classifier. Each of the three groups was pre-processed, by rejecting the maximum and minimum values, then the arithmetic mean for one group was calculated based on the results of the two others. In this way, a single precision, recall, and F-measure value was obtained for each method of data particle creation. These acquired results constituted the object for further analysis.
As a result of applying k-fold cross validation, each data set was divided in accordance with the pseudocode presented in Algorithm 1.
| Algorithm 1. k-Fold Cross Validation. |
| 1: D ← {e0, …, en} //set of data set elements |
| 2: V ← ∅ //set of validation data set elements |
| 3: T ← ∅ //set of training data set elements |
| 4: I ← ∅ //set of cross validation iterations; single iteration is element consisting of V and T |
| 5: k ← 10 |
| 6: for i ← 0 to k − 1 do |
| 7: begin_idx ← i * n/k |
| 8: end_idx ← begin_idx + n/k − 1 |
| 9: for i ← 0 to n do |
| 10: if j >= begin_idx and j <= end_idx then |
| 11: V ← V ∪ Dj |
| 12: else |
| 13: T ← T ∪ Dj |
| 14: end if |
| 15: end for |
| 16: I ← I ∪ new Iteration(V, T) |
| 17: V ← ∅ |
| 18: T ← ∅ |
| 19: end for |
3.1. First Experiment
The first experiment examined the efficiency of the above-mentioned data particle creation methods in the process of imbalanced data sets classification, in which a linear decision boundary does not exist, the centroids are close to each other and objects belonging to various classes overlap in a feature space. As a preliminary point, the target numbers of data particles were determined, which may be the basis for the GD and UGD methods in the classification process of individual imbalance data sets having aforesaid features. Taking into consideration that the examined data sets have two classes, and the GD method conducts the division of each data particle in a single iteration, the established values were powers of two and they are presented in
Table 3.
The results expressed by precision, recall, and F-measure and obtained by 1CT1P, GD and UGD on the individual imbalanced Moons and Circles data sets are presented in
Table 4.
Analysing the data presented in
Table 4, it can be observed that the Unequal Geometrical Divide method reaches the highest F-measure values in 9 of the 16 imbalanced Moons and Circles data sets. Furthermore, it gains the mean result of F-measure, which within the entire experiment equals F-measure = 0.633. The Geometrical Divide method obtains the best results on the seven remaining data sets and it reaches the mean value of F-measure = 0.642. It can be seen as well that the 1CT1P approach obtains the lowest results of F-measure on all analysed data sets and it reaches the mean value F-measure = 0.214. Taking into consideration the characteristics of data, it can be remarked that each time the Unequal Geometrical Divide method gives the best results on the data sets in which the objects belonging to other classes overlap in a feature space (names with postfix NU).
Based on values of precision obtained by individual approaches, it can be observed that the UGD obtained the highest precision on all data sets. It should be emphasized that on four data sets the results of that method were identical as those obtained by using the GD approach. Analysis of recall values allows to observe that the Geometrical Divide method achieved the highest results of this measure on the all data sets.
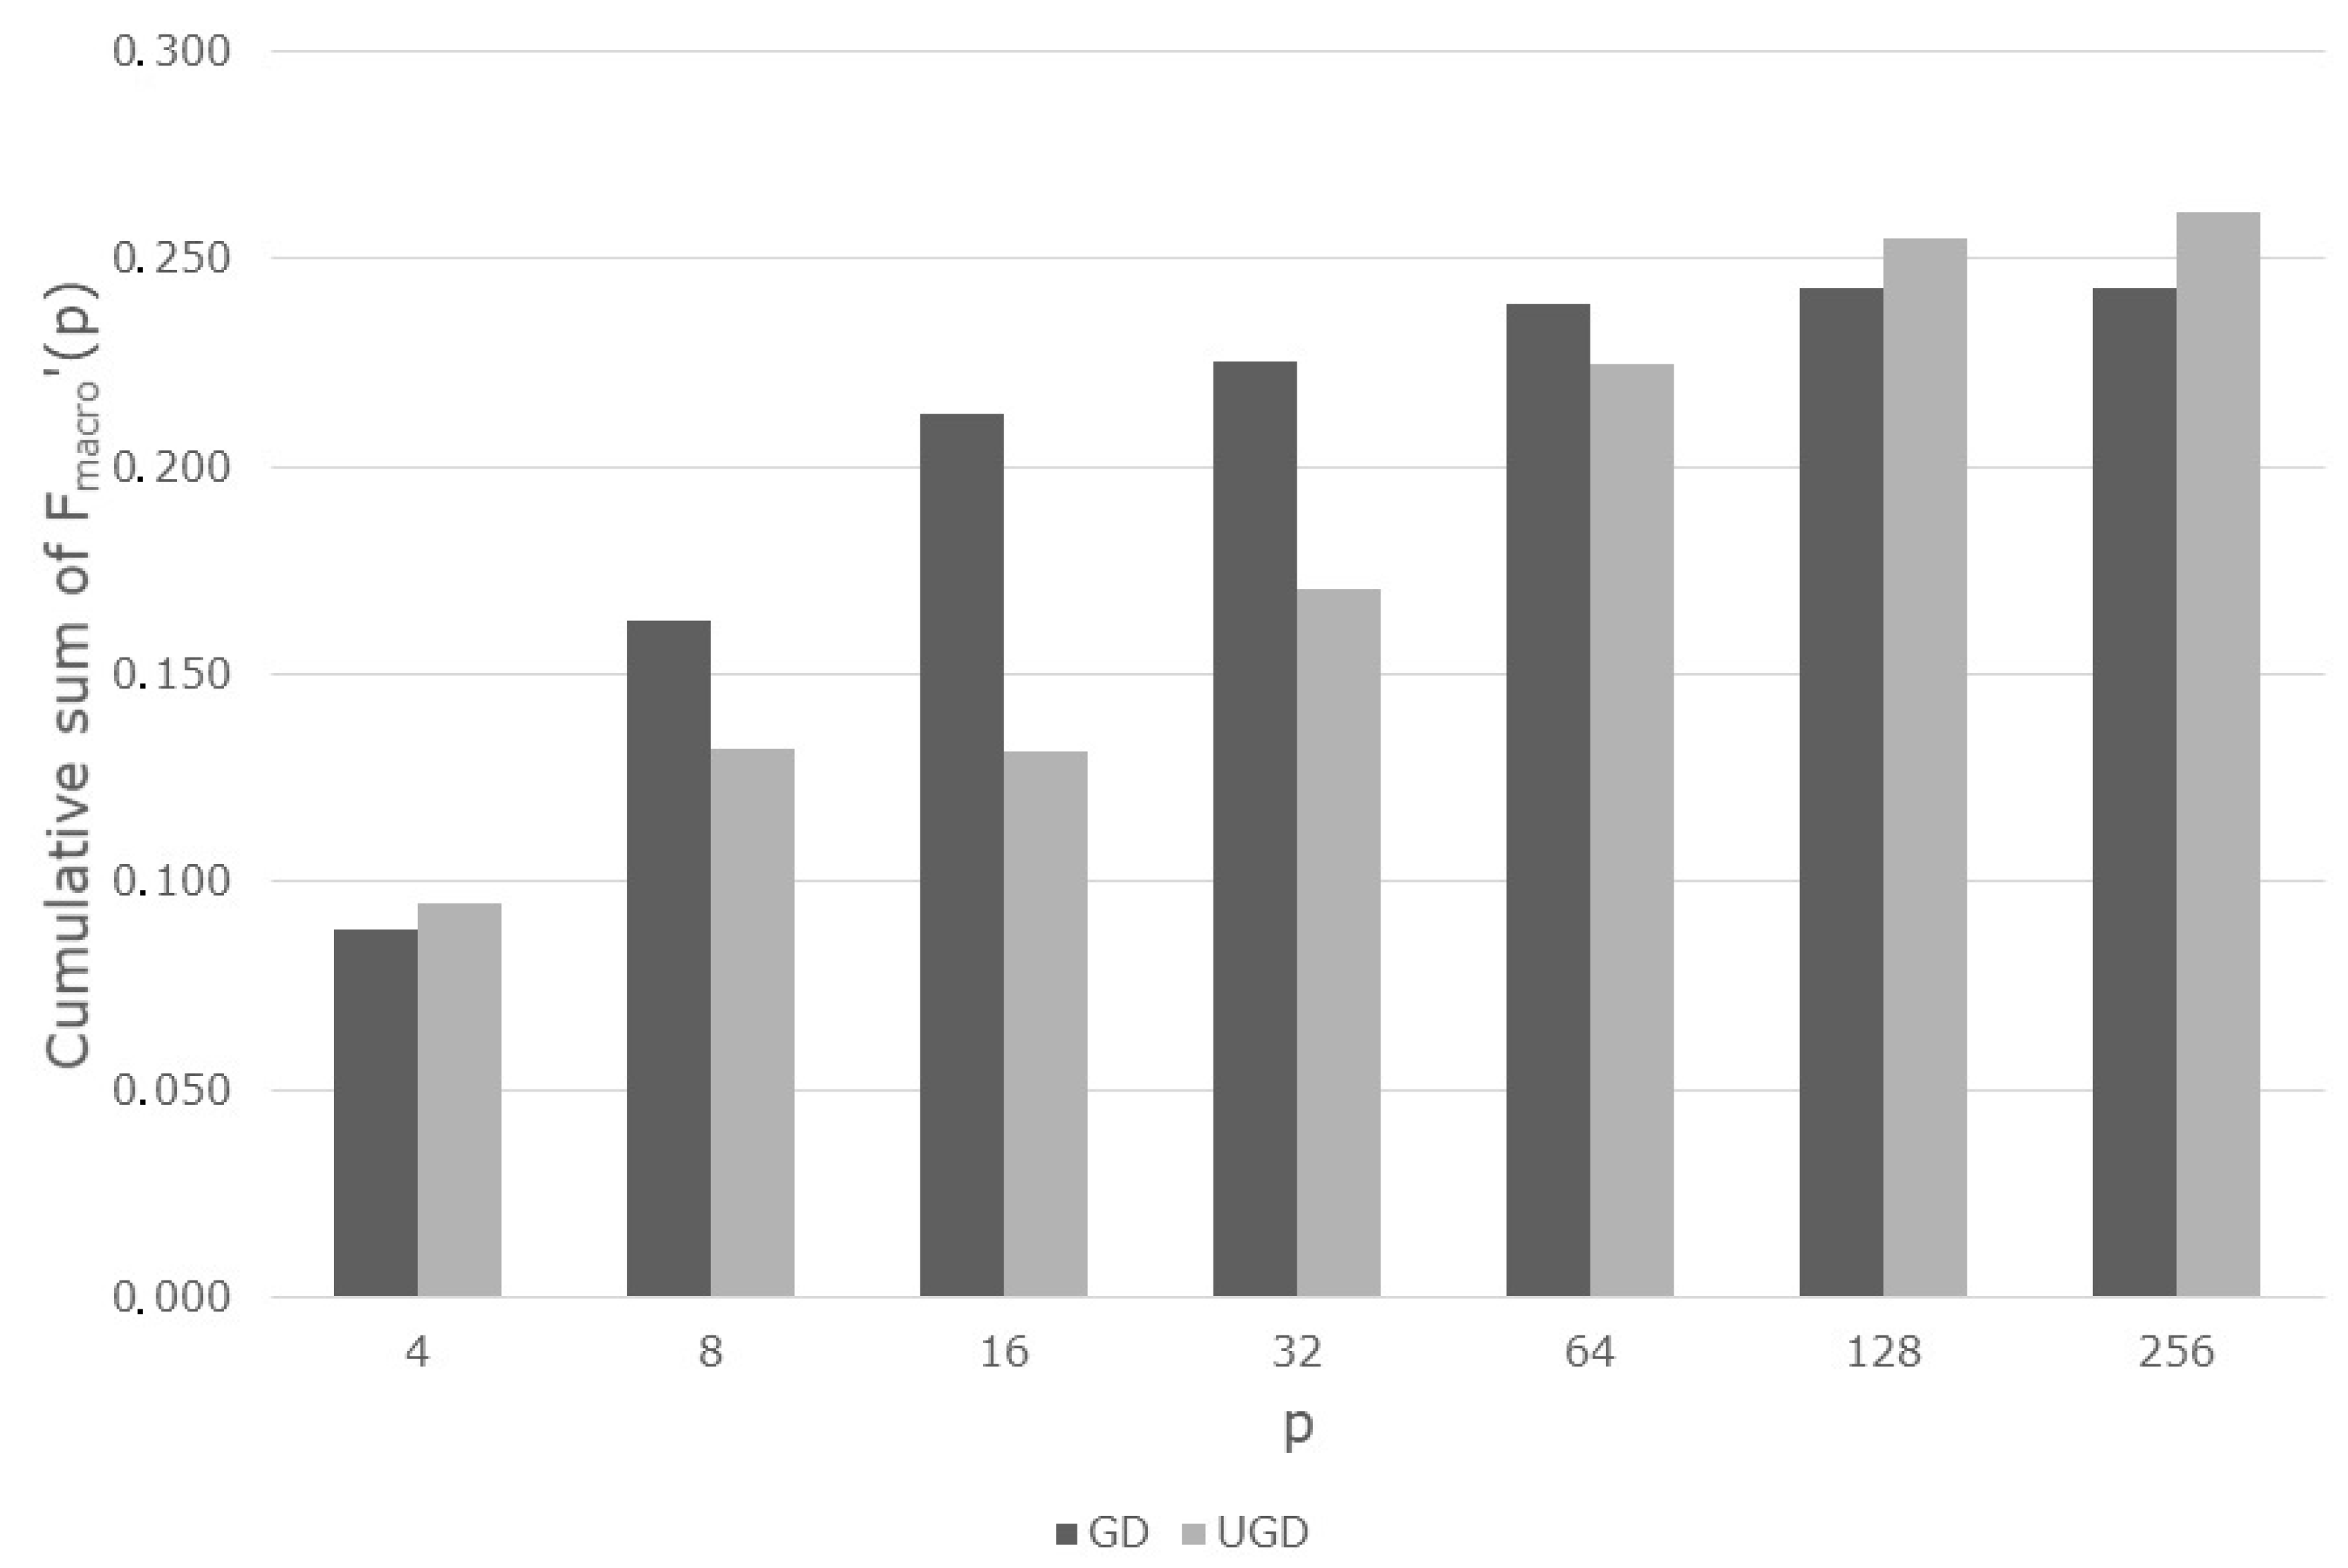
In the second part of the first experiment, the sensitivity to change the F-measure (p) function value was examined, depending on the change of the applied number of data particles. With this purpose, the methods were parametrised a few times. Given that the examining data sets have two classes, and the GD method conducts the division of each class, in the first iteration the number of data particles was equal to the value of the exponential function with base = 2 and the exponent x = 2. In subsequent iterations, the exponent was incremented until it reached the value of exponential function equal to the number of data particles presented in
Table 2. The results of differentiation procedure of F-measure (p) function for the GD and UGD methods were visualised on
Figure 5.
Based on
Figure 5, it can be observed that for the GD and UGD methods the change of applied data particles number from 2 to 4 causes a comparable increase of obtaining F-measure values and it oscillates around the value of 0.145. At this stage, a slight predominance of UGD over GD can be noted. In the next two ranges:
The derivatives of function F-measure’(p) for both approaches are significantly different and the Geometrical Divide method comes out more favourably than the Unequal Geometrical Divide algorithm. Analysing the next ranges:
[16, 32],
[32, 64],
[64, 128],
It can be pointed out that the derivative of function F-measure’(p) for UGD obtains substantially higher values than the derivative of the function for the GD method. Furthermore, in the mentioned ranges a considerable decrease of the derivative for the GD approach can be seen.
Figure 6 was prepared in order to examine the full improvement of results by both methods in comparison to the results obtained without geometrical data particles divide.
Analysing
Figure 6 it can be noticed that both methods improve the base result of nearly 0.145 if four data particles are applied. For the Geometrical Divide method, a significant improvement of results can be observed for the number of data particles from range [8, 32] as well. On the other hand, for the Unequal Geometrical divide approach, using the same data particles number, an increase of results is quasi linear. The GD and UGD methods, applying 64 data particles, obtained similar results of F-measure measure, which oscillated in the range from 0.395 to 0.425. It is worth paying attention to the fact that in case of the GD approach, the further increase of the data particles number does not improve the results. However, the GD algorithm slightly outperformed the UDG method, when 128 data particles are applied in divide process. It can be noted as well that the final improvement of base results, obtained by using one of the geometrical divide methods, is asymptotically convergent to the value of 0.425.
3.2. Second Experiment
In the second experiment, the efficiency of examined methods was compared, where the parameterisation was the same as in the first experiment and was presented at the beginning of chapter 3. Results. In this stage of the research, the algorithms were examined on the imbalanced data sets built on the basis of the known set of data concerning occupancy detection [
10].
The first step of this research stage consisted in establishing the maximal effective number of data particles, on which the GD and UGD methods can base in the classification process of individual imbalanced data sets. Established values were presented in
Table 5.
Table 6 presents the values of F-measure obtained by the 1CT1P approach, as well as the GD and UGD methods, which divided individual data sets into data particles with values given in
Table 5.
Data included in
Table 6 show that the UGD algorithm achieves the highest values of F-measure on eight analysed imbalanced data sets created on the basis of the real occupancy data set. The GD approach reaches the highest F-measure value on one data set (occupancy_25), similar as the 1CT1P method (occupancy_35). The Unequal Geometrical Divide reaches the F-measure mean value of 0.805. The Geometrical Divide approach obtains insignificantly lower F-measure values, whose mean result equals 0.797. The approach of data particle creation based on class by a compound of 1 ÷ 1 cardinality achieves the lowest results on nine two-dimensional variants of imbalanced occupancy data sets. In conducted experiment the mean F-measure value for 1CT1P amounted to 0.740. It should be emphasized that higher results cannot be reached by the GD method because in this experiment it uses the deepest for itself divide of data particles. On the other hand, the next divide within the UGD method do not bring a significant increase of F-measure values. The obtained results were verified by a statistical test. Using the STAC tool [
25], the non-parametric Friedman Aligned Ranks test [
26] with Holm post-hoc multiple comparison [
27] was conducted with the significant level α = 0.05. The results were presented in
Table 7.
Based on the information presented in
Table 7, it can be stated that the methods of data particles geometrical divide which apply the line passing through two points significantly outperform the 1CT1P approach in the occupancy detection process that is grounded on the imbalanced data set. On the other hand, there is no significant statistical difference between the results obtained by the Geometrical Divide and the Unequal Geometrical Divide methods.
Analysing the values of precision and recall obtained by individual approaches, it can be stated that the UGD obtained the highest precision on nine data sets, whereas in the criterion of recall the UGD reached the highest result on two data sets-occupancy_23 and occupancy_35. However, it should be mentioned that on the occupancy_23 all approaches obtained the same value, and on the occupancy_35 UGD and GD achieved the identical level of recall. The best performance in the aspect of recall value was obtained by the GD approach, which scored the highest result on nine data sets, including the afore-mentioned two data sets.
By comparing the differences between the obtained precision and recall by each approach on the individual data sets,
Table 8 was created.
Based on the data presented in
Table 8, it can be observed that the UGD reached the lowest difference between precision and recall on the eight data sets. The 1CT1P approach obtained the lowest value of difference on the other data sets.
The non-parametric Friedman Aligned Ranks test with Holm post-hoc multiple comparison was conducted for the data presented in
Table 8 with the significant level α = 0.05. The obtained results were presented in
Table 9.
Analysing the information presented in
Table 9, it can be stated that the Unequal Geometrical Divide method achieves significantly lower values of difference between precision and recall than the Geometrical Divide method and 1CT1P in occupancy detection process, which is grounded on the imbalanced data set. On the other hand, there is no statistically significant difference between the results obtained by the Geometrical Divide and the 1CT1P methods.
4. Discussion
A new variant of the geometrical divide approach called the Unequal Geometrical Divide (UGD) was proposed in this article. It is the modification of the existing Geometrical Divide (GD) method.
The conducted experiments showed that in the classification of imbalanced data sets the feature of the Geometrical Divide approach is the improvement of recall value in relation to the method creating data particle based on class by a compound of 1 ÷ 1 cardinality (1CT1P). The GD outperforms UGD on the Moons and Circles data sets, in which atomic data particles do not overlap in the feature space. On the other hand, on the data sets whose elements overlap in the feature space, better results are obtained by the Unequal Geometrical Divide algorithm. This research showed that the UGD method allows to improve precision value in relation to the 1CT1P method. However, the second experiment reported that in the problem of occupancy detection the UGD strives to the balanced improvement of the precision and recall.
Based on the above-mentioned observations it can be stated that in the occupancy detection problem, which for instance will be oriented on the chasing of intrusions, the Geometrical Divide will be a better choice, because in this problem the correct prediction of a small number of samples constituting a minority class will be the most important. On the other hand, the Unequal Geometrical Divide will be a better choice in the occupancy detection problem oriented on the overall monitoring, in which the correct information if the room is occupied or unoccupied are equally important,
The second experiment showed as well that the best results were obtained on the following data sets:
occupancy_13,
occupancy_23,
occupancy_34,
occupancy_35.
Referring to
Table 2, it can be stated that each of the above-listed data sets based on the attribute storing the value from light measurement. Therefore, it can be concluded that the light value is the most relevant in the process of occupancy detection.
The obtained results showed that the geometrical divide approaches (GD and UGD) improves the results obtained by the 1CT1P method in the classification process of imbalanced data sets, in which a linear decision boundary does not exist, the centroids are close to each other and objects belonging to various classes overlap in a feature space. Through the obtained results, it was demonstrated that the methods of data particles creation by their geometrical divide outperform the approach of creating data particle based on class by a compound of 1 ÷ 1 cardinality in the occupancy detection problem.
The disadvantage of the existing data particle geometrical divide approaches is a necessity of the manual selection of the target data particles number to be achieved as a result of their divide. The problem is exacerbated by the fact demonstrated in both experiments, as the mentioned number is usually different for each of the analysed data sets.
When discussing the results, the threats for the research cannot be forgotten. In the article, the methods were compared in the strictly defined problem constituting a part of the reality. Despite that the correct evaluation methods and metrics were applied, it cannot be stated that the geometrical divide of data particle approaches outperform the method of data particle creation based on class by a compound of 1 ÷ 1 cardinality in many other fields.
5. Conclusions
The Unequal Geometrical Divide and the Geometrical Divide approaches can be efficiently applied in the occupancy detection based on the light measurement.
In the occupancy detection problem, the Unequal Geometrical Divide is a method, which strives to high overall correctness of model. On the other hand, the Geometrical Divide is recall-oriented.
In the occupancy detection problem based on the attributes set consisting of temperature, humidity, light, CO2 and humidity ratio, the value of light delivers the most relevant information.
Furthermore, this article presents the practical application of the line passing through two points in the machine learning algorithms focusing on the data particle divide.
With regard to the previously mentioned disadvantage of the existing data particle geometrical divide approaches, the subject of future research, which may constitute a significant contribution to the development of the data particles geometrical divide methods, is to devise the approaches or rules dedicated to determining an optimal target data particles number in the criterion of classifier efficiency maximisation. To resolve the mentioned problem, the scientists can search the inspiration in the backward error propagation applied in the artificial neural networks [
28]. Another direction for further research could be the comparison of the developed UGD and GD methods in the other real problems and with other well-known algorithms, which do not belong with a group of gravitational classifiers. It may constitute a valuable contribution to the state of the art. Moreover, other selection strategies of data particles to be divided can be developed.


