Review

Thermodynamics of Soil Microbial Metabolism: Applications and Functions

Department of Applied Physics, University of Santiago de Compostela, 15782 Santiago de Compostela, Spain
Appl. Sci. 2021, 11(11), 4962; https://doi.org/10.3390/app11114962
Submission received: 27 April 2021 / Revised: 24 May 2021 / Accepted: 26 May 2021 / Published: 28 May 2021
(This article belongs to the Special Issue Hide and Seek of Soil Microbes—Who Is Where with Whom and Why?)

Abstract

:

Featured Application

Energy rules life. All living systems keep themselves alive by balancing the energy input and output by universal thermodynamic principles. Soils are not an exception to this; however, their extraordinary complexity makes them poorly described as a thermodynamic system. This review shows how thermodynamics can be applied to study the role of the microbial community to keep the soil alive.

Abstract

The thermodynamic characterization of soils would help to study and to understand their strategies for survival, as well as defining their evolutionary state. It is still a challenging goal due to difficulties in calculating the thermodynamic state variables (enthalpy, Gibbs energy, and entropy) of the reactions taking place in, and by, soils. Advances in instrumentation and methodologies are bringing options for those calculations, boosting the interest in this subject. The thermodynamic state variables involve considering the soil microbial functions as key channels controlling the interchange of matter and energy between soil and the environment, through the concept of microbial energy use efficiency. The role of microbial diversity using the energy from the soil organic substrates, and, therefore, the who, where, with whom, and why of managing that energy is still unexplored. It could be achieved by unraveling the nature of the soil organic substrates and by monitoring the energy released by the soil microbial metabolism when decomposing and assimilating those substrates. This review shows the state of the art of these concepts and the future impact of thermodynamics on soil science and on soil ecology.

1. Introduction

Soil is one of the main primary resources on earth, together with water. Both act together, playing an essential role in our survival. Soil is the main source of nutrients for living systems, and acts as a platform supporting structures for those living systems, at macro- and micro-scale, from humans to microorganisms. Soil science has been closely attached to human activity for those reasons. From the introduction of agriculture in the Neolithic to our days, the requirement for knowledge about soil has been constant.
Nowadays, soil research continues to be a vast multidisciplinary research area. In our era, our coexistence with a global climate change process has shown the scarcity of knowledge about the impact of temperature on soil fertility and soil structure. Temperature is one of the variables affecting thermodynamic state functions. When the interest in temperature on soil arises, the immediate addition of the term “thermodynamics” is unavoidable to discover next that soil is still not characterized as such. The fact that thermodynamics of soil systems is a vastly unexplored area is boosting the interest in the subject, because of important applications, such as controlling the role of temperature on soil fertility, characterizing the maturity state of soil ecosystems, or predicting their evolution [1,2]. The role of thermodynamics in ecology is not new and has been a matter of concern and development since the beginning of the last century, yielding not only relevant and high-impact, but also controversial, publications [3,4].
What is new now is that technology and the development of different methodologies make it possible to go beyond the existing thermodynamic theoretical approaches to soil ecology by calculating the missing thermodynamic state variables for soil reactions until recently: enthalpy, Gibbs energy, and entropy changes. This opens the possibility to apply them for all the biotic and abiotic reactions taking place in soils to achieve thermodynamic soil characterization. The task is large. Therefore, it can be useful for future work to center the current situation about soil thermodynamics and to focus on what we need, what we have, and how to do it.
Soil is an extraordinary complex media, thermodynamically considered as an open system interchanging matter and energy with the environment. The interchange of the matter is responsible for nutrient cycling and has been investigated since the 19th century [5]. Most of the soil chemical and biochemical studies focus on the elemental composition, such as carbon content, C; nitrogen, N, and other mass products from its decomposition, such as CO2. C and CO2 have been widely used for settling soil as a carbon sink and as a source of CO2 to the atmosphere by different mass balances [6]. The interchange of matter takes place by different abiotic and biotic reactions. The biotic part involves a high number of different microorganisms, such as bacteria, fungi, and yeast, working as drivers in the interchange of different nutrients through microbial metabolic reactions. Without microorganisms, soil becomes an inorganic substrate incapable of sustaining life on Earth.
Soil microbiomes need different substrates feeding their metabolisms. On a mass basis, those soil substrates act as suppliers of single chemical elements through complex molecules constituting the soil organic matter, SOM. The chemical characterization of SOM is a challenge facing both technological and methodological limitations linked to the high chemical and physical complexity of SOM, and the lack of knowledge about SOM chemical and biochemical transformations. This is because most of the existing knowledge is published and spread across different areas of knowledge with poor contact among them [7,8,9].
Along the last century, soil began to be considered as a source of energy, too, and the soil microbial metabolism (SMM) began to be monitored on heat basis [10,11]. The development of highly sensitive isothermal calorimeters makes it possible to quantify the heat released by SMM [12] and to consider soil as a thermodynamic system where SOM is the reservoir of energy fueling the soil microbial community. Therefore, we have the two main ingredients to develop soil thermodynamics: mass and energy. We also have all the bioenergetics developed for microbial metabolism along the end of the 19th century and throughout the entire 20th century until now [13,14,15].
What we need for the thermodynamic characterization of soil is to connect the SOM energy budget to the dissipation of that energy by SMM through the thermodynamic state variables. It is essential to be able to calculate them for the SOM and for the SMM responsible for SOM decomposition. It is challenging, but not impossible now.

2. Materials and Methods

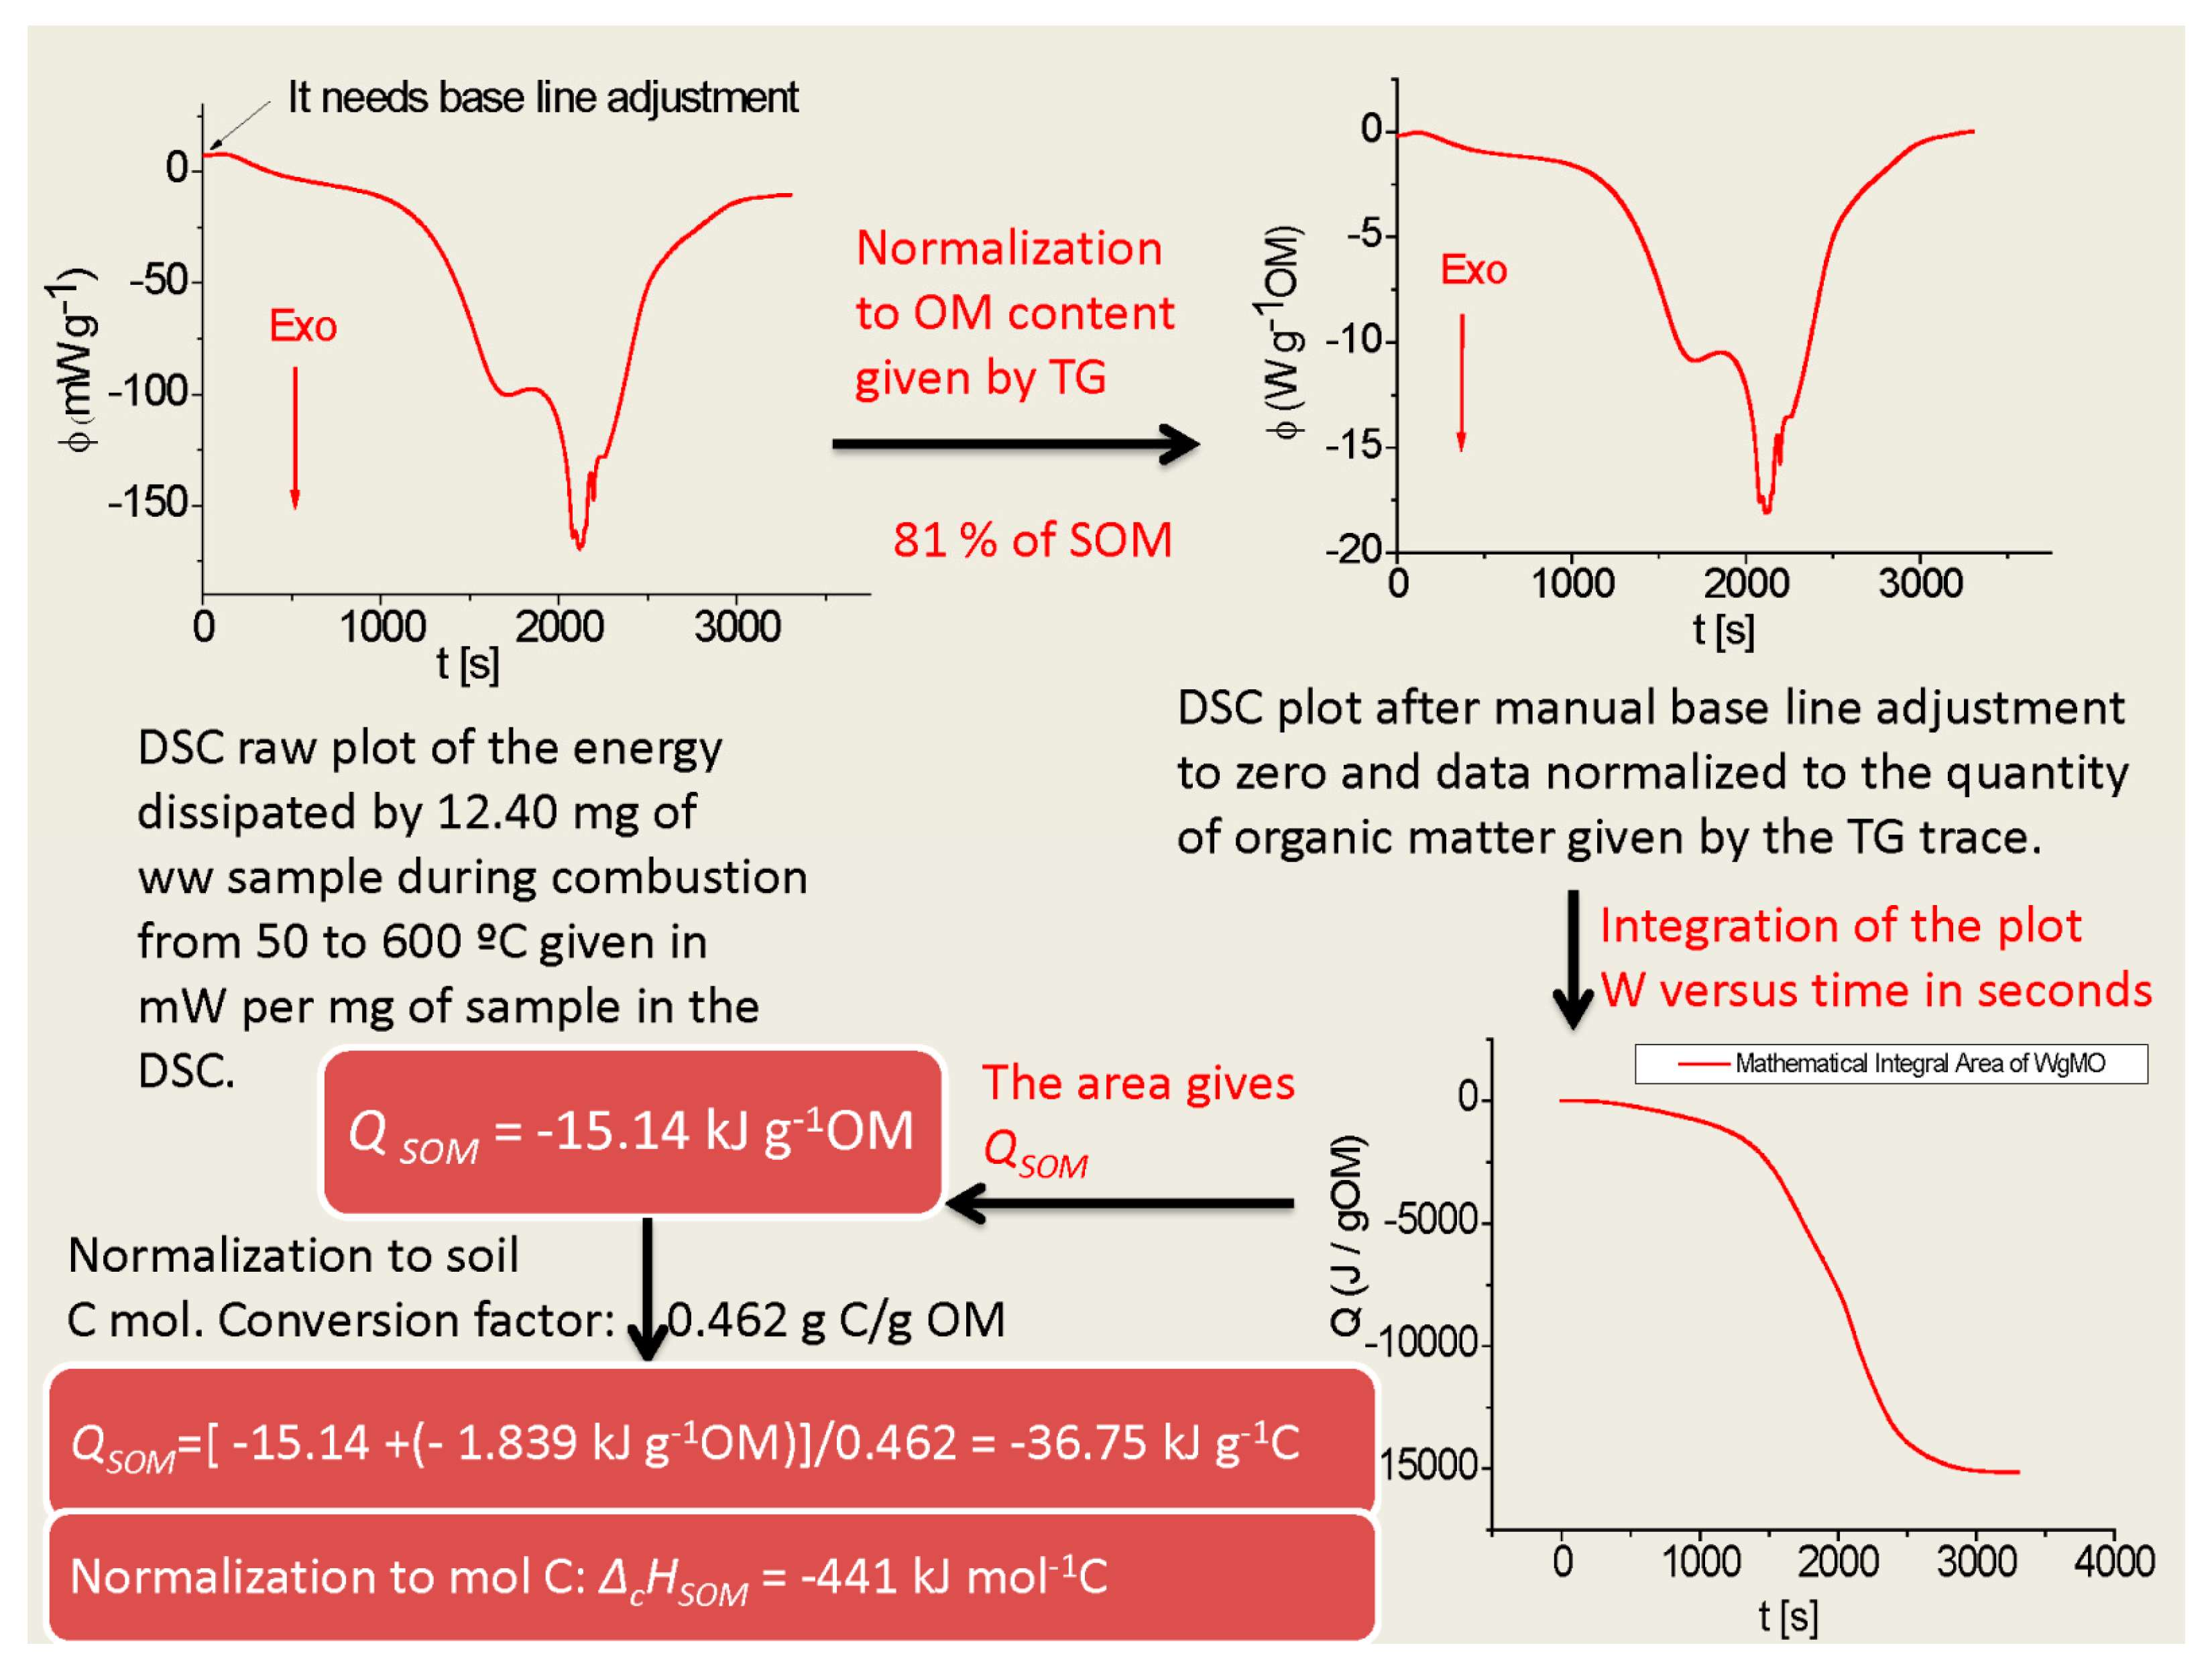
2.1. Thermodynamic Characterization of SOM

This involves determining the enthalpies of formation and combustion of SOM, ∆fHSOM and ∆cHSOM, the Gibbs energy change of formation and combustion of SOM as well, ∆fGSOM and ∆cGSOM, and their respective entropy changes, ∆S. Their calculation involves writing the reactions for SOM formation and/or SOM combustion. There are two different options for this: the stoichiometric methods and the enthalpy models linking the energy of a substrate with its degree of reduction and/or degree of oxidation.
The stoichiometric models implicate the chemical formulation of substrates and reactants. There are some attempts towards SOM chemical formulation, but it is a complex and still challenging objective [16,17], especially when it involves the characterization of all the reactions that take place in the soil. The latter is interesting and necessary from a chemical perspective but may not give answers and understanding to important questions for soil and ecology research, such as the measurement of SOM recalcitrance [18], assessment about the evolution of soil ecosystems based on how energy and exergy is managed [19], the state of soil fertility, and the connection with soil microbial diversity [1]. These goals involve studying the thermodynamic variables from a more global perspective than analyzing individual soil chemical reactions. Additional methodological alternatives providing more data and global perspectives for interpreting the thermodynamics of soil biogeochemical reactions should be welcomed [20].
Some additional options could include the direct quantification of the energy budget of SOM, and the heat released by the microbial decomposition of that SOM. There is technology to measure the energy of organic substrates and thermodynamic models connecting this energy to their chemical composition by the degree of reduction and/or oxidation. That is, both SOM chemical formulation [16] and SOM energy content lead to the redox state of SOM [20,21]. The energy can be measured by bomb calorimetry and thermal analysis. Both methods yield the heat of combustion of organic substrates. Bomb calorimetry is considered as the standard methodology to obtain the heat capacity and enthalpy of combustion of organic substrates [22], but it is not efficient when applied to mineral soil samples for different reasons, such as incomplete combustion [22,23].
The other option is the simultaneous application of thermogravimetry (TG) and differential scanning calorimetry (DSC). Both methods have been applied in different soil studies, but not for yielding enthalpies of combustion until recently. Reasons are complex and linked to the design and evolution of thermal analysis. Until recently, most DSC devices were not designed for working with samples with high energy content. DSC experiments missed most of the energy from the organic substrates. The evolution of these devices towards simultaneous TG and DSC experiments with soils and organic samples are giving heat of combustion data close to those accepted for organic substrates [24]. Nevertheless, it is still necessary to settle a procedure for accurate measurements of the heat of combustion of soils by simultaneous TG–DSC. It would be desirable to make comparisons of the heat of combustion values with proximate analysis, as reported recently [25]. These procedures are in the process of development, turning approaches to the heat of combustion of SOM into a realistic goal.
By now, TG–DSC has allowed linking of the energy from SOM combusted by airflow in the DSC to the soil mass lost during the combustion. These experimental phases are properly explained by the literature giving that heat in kJ g−1 OM. Software in the TG–DSC is not well-designed yet for this purpose, and to measure the heat of combustion of SOM is necessary to export TG–DSC data to external auxiliary software to perform integrations, derivatives, and adjustments of baselines manually.
For comparisons and applications of thermodynamic models, it is necessary to normalize the energy obtained in kJ g−1 OM to the C content of the soil in C mole. That involves performing elemental analysis of the soil samples to relate the OM content obtained by the TG to the total C and/or organic C given by the elemental analysis [26]. To settle the correlation between C and SOM is essential for accurate normalizations since the existence of clay and/or carbonates may overlap with the OM content given by the TG measurements. That single correlation may optimize the most adequate value relating C to SOM in our samples to be used as the unit conversion factor. The high variety of soil properties could make this previous step essential for every soil, and it may be difficult to provide a general conversion factor. An example with some soils is shown in the results section of this paper. The soil samples were collected from the soil surface and at 5 cm of depth, representing Eutric vertisols and Podzols under oak mature forests collected in Ireland [26] and in the UK.
Calculation of the enthalpy of combustion of SOM is possible for the reaction taking place in the DSC (and also in a bomb calorimeter), summarized as follows:
SOM(s) + xO2(g) = yCO2(g) + H2O(g) − ∆cHSOM
The TG–DSC analysis must be done under a flow of dry air, as reported [25]. ∆cHSOM is directly related to the degree of reduction of organic substrates by well-known relations [27,28] involving the oxycaloric quotient, Q0, by the following general equation:
cH0 = Q0 γC
cH0 is the enthalpy of combustion of any organic substrate at standard conditions; Q0 is the oxycaloric quotient representing the ratio between the enthalpy of combustion and the degree of reduction of C, γC, from organic substrates.
Q0 values vary in literature from −104 to −118 kJ mol−1 degree of reduction−1; all of them assigned to various authors [21]. They were determined for different organic substrates first and for microbial biomass later, yielding slopes in a similar range [21]. The reason for those differences comprises the structure of molecules which were considered in the latest corrections reported [28]. Recent works implementing these concepts [26] used the Sandler and Orbey value of −109 kJ/C mol−1 degree of reduction−1 [28], but the reality is that the different values exhibited by the literature have not been applied for soils to compare results obtained by the different Q0 values reported.
Roels, and Sandler and Orbey’s correlations [27,28] give the Gibbs energy change for Equation (1), ∆cGSOM. It would be interesting to apply both models to analyze and compare the resulting values for soil samples.
The entropy change of Equation (1) is an interesting goal too, because of its involvement in the evolution of soil ecosystems [29]. It can be determined by models such as the one proposed by Battley in 1999 [30]. It focuses on the application of the Hess law to microbial growth reactions where reactants and products are well-known. It is difficult to apply it when considering SOM as a reactant because we do not know the products for SOM biodecomposition in many cases. They can be assumed and summarized through different general concepts [31], but the reality is that we only can approach the formulation as done by the correlations between energy and the degree of reduction.
Another alternative for approaching entropy changes is the equation for the Gibbs energy for irreversible reactions, adapted to Equation (1):
cGSOM = ∆cHSOM − T∆cSSOM
In this paper it is shown, as an example, the complete thermodynamic characterization of SOM for the set of soil samples collected from different depths mentioned before.

2.2. Thermodynamics of the Soil Microbial Metabolism (SMM)

Microorganisms decompose SOM by different biochemical paths and different electron acceptors [31]. Nevertheless, most of the studies focusing on SMM bioenergetics apply to the aerobic decomposition of SOM, where O2 is the electron acceptor. The interest in characterizing SMM from a thermodynamic perspective is linked to the development of calorimeters that measure the heat released by SMM [32]. As the aerobic decomposition of SOM releases CO2 too, calorimeters have been adapted to monitor the heat and CO2 from SMM by different calorespirometric procedures [33]. These studies for soils started at the beginning of this century, involving very recent findings [34,35]. The concomitant measurements of heat and CO2 have the advantage to yield the calorespirometric ratio (CR) of SMM, a metabolic indicator providing additional information about the nature of substrates from SOM being decomposed during the calorespirometric measurement [31,36]. CR is a measure of the enthalpy of those substrates [26] and the microbial metabolic C-use efficiency, CUE [37].
For the thermodynamic characterization of SMM, it is essential to link CR values to the enthalpy of the substrates [26,31]. Assuming CR represents the enthalpy for substrates being metabolically decomposed, ∆rHSOM, it would be possible to yield the Gibbs energy change for microbial decomposition of SOM, ∆rGSOM, by the models developed for microbial metabolism [20,27,28]. Comparing ∆rGSOM values with those from SOM combustion in Equation (1), ∆cGSOM, can shed light on microbial strategies to keep soil ecosystems far from equilibrium, an unexplored field. It is also not known how the ∆cHSOM and ∆cGSOM values may influence the soil microbial functions and soil microbial diversity. It would be possible to localize soils with SOM at more, or less, degree of reduction by their ∆cHSOM and ∆cGSOM values, to relate them to the complexity of the SOM macromolecule and to the properties of the soil microbial community on those locations in terms of soil microbial diversity and soil microbial metabolic diversity. There is no previous work to this respect and there is an example of it in the results section.
The set of soil samples from different depths collected in oak mature forests were calorespirometrically characterized for aerobic decomposition of SOM by a microbial community at steady-state metabolism.
The reaction for SOM biodecomposition in this case is summarized as follows:
SOM(s) + O2(g) = Products(s) + H2O(l) + CO2(g) − ∆rHSOM
where ∆rHSOM is directly determined by calorespirometry as the CR. The experimental procedure is well-explained by the literature [38]. ∆rHSOM gives the degree of reduction, γr, of the substrates being metabolically decomposed [26]:
CR ~∆rHSOM = γr/4 (−455) kJmol−1O2
The Gibbs energy change for Equation (4), ∆rGSOM, is given by the relations reported by Roels, and Sandler and Orbey.
The entropy change is determined by adaptation of Equation (3) to Equation (4) at the temperature of the calorespirometric measurement (298 K).

3. Results

3.1. Thermodynamic Characterization of SOM

Table 1 shows the elemental composition, C, H, N, of the soil samples collected for this study. LF represents samples from the soil surface, while M corresponds to the mineral soils collected at 5 cm depth from the soil surface. SOM is the percentage determined by TG. The C content of samples, as well as SOM, depletes from the soil surface to the mineral samples. Moreover, there are some differences among sampling sites, despite all of them representing mature oaks ecosystems at similar environmental conditions.
Correlations among these components can yield information about the SOM composition, indicating the percentages of N and H attached to C and SOM to weigh the contribution of inorganic material. In this particular case, the interest relies on the correlation between C and SOM to obtain the conversion factor from grams of SOM to carbon mole to be compared to the individual C/SOM relation for each sample.
Correlation among Ctot, Corg, and SOM gives r values of 0.98 at p < 0.001 in all cases and equations Ctot = 0.530SOM + 0.646 and Corg = 0.462SOM + 0.172, respectively. It will be used the conversion factor of 0.462 g C g−1 SOM.
The soil thermal properties are shown in Table 2. The heat of combustion, QSOM, is obtained directly by DSC in kJg−1 OM, and corrected to yield the enthalpy of combustion of SOM, ∆cHSOM, in kJ mol−1 C, as shown in Figure 1.
The Gibbs energy change is determined by the Roels and Sander and Orbey correlations, and the entropy change is from Equation (3).
QSOM and ∆cHSOM values in Table 2 show higher values in mineral samples than in LF samples, indicating SOM at a higher degree of reduction as soil depth increases. This involves a change in SOM nature, and it is expected that it affects the soil microbial population, too.
The degree of reduction values yields the Gibbs energy change of SOM combustion, ∆cGSOM, and, indirectly, the entropy change, ∆cSSOM, for Equation (1). Results are shown in Table 3. The Gibbs energy becomes more negative in mineral samples than LF samples, independently of the models used. Although, apparently, these models yield similar values for Gibbs energy, incongruences between them appear when calculating the entropy changes. By comparing results using the Sandler and Orbey model alone [28], it is observed that a higher degree of reduction of SOM could yield a relative increment in the entropy change, compatible with the higher structural complexity of SOM and/or higher stable material in M samples than in LF samples. Little variability of the entropy change is also obtained among the different locations.

3.2. Thermodynamics of SOM Microbial Decomposition

Different calorimetric procedures address the bioenergetics of SOM decomposition. Some of the main goals are the thermodynamic characterization of the biochemical reactions involved in SMM [26,31], quantification of microbial metabolic efficiency [38,39,40], monitoring the biodegradation of external organic sources by different microbial metabolic paths [41], and its connection with microbial diversity [42].
Microbial diversity involves characterizing the composition of the microbial community and studies about microbial metabolic diversity. Although both are interesting for better characterization of soil biological properties, focusing on metabolic diversity could be more useful if the goal is SOM biodegradation. This is because biodecomposition is mainly ruled by enzyme diversity that has not necessarily been linked to higher microbial composition diversity. Diverse microorganisms contain the same enzymatic machinery. For this reason, higher diversity in microbial populations may not be reflected in biodecomposition rates. In most cases, these studies are still under development and there is little information about the role of microbial diversity on thermodynamics, metabolic efficiency, and biodegradability. This review addresses some of the existing results covering these topics.

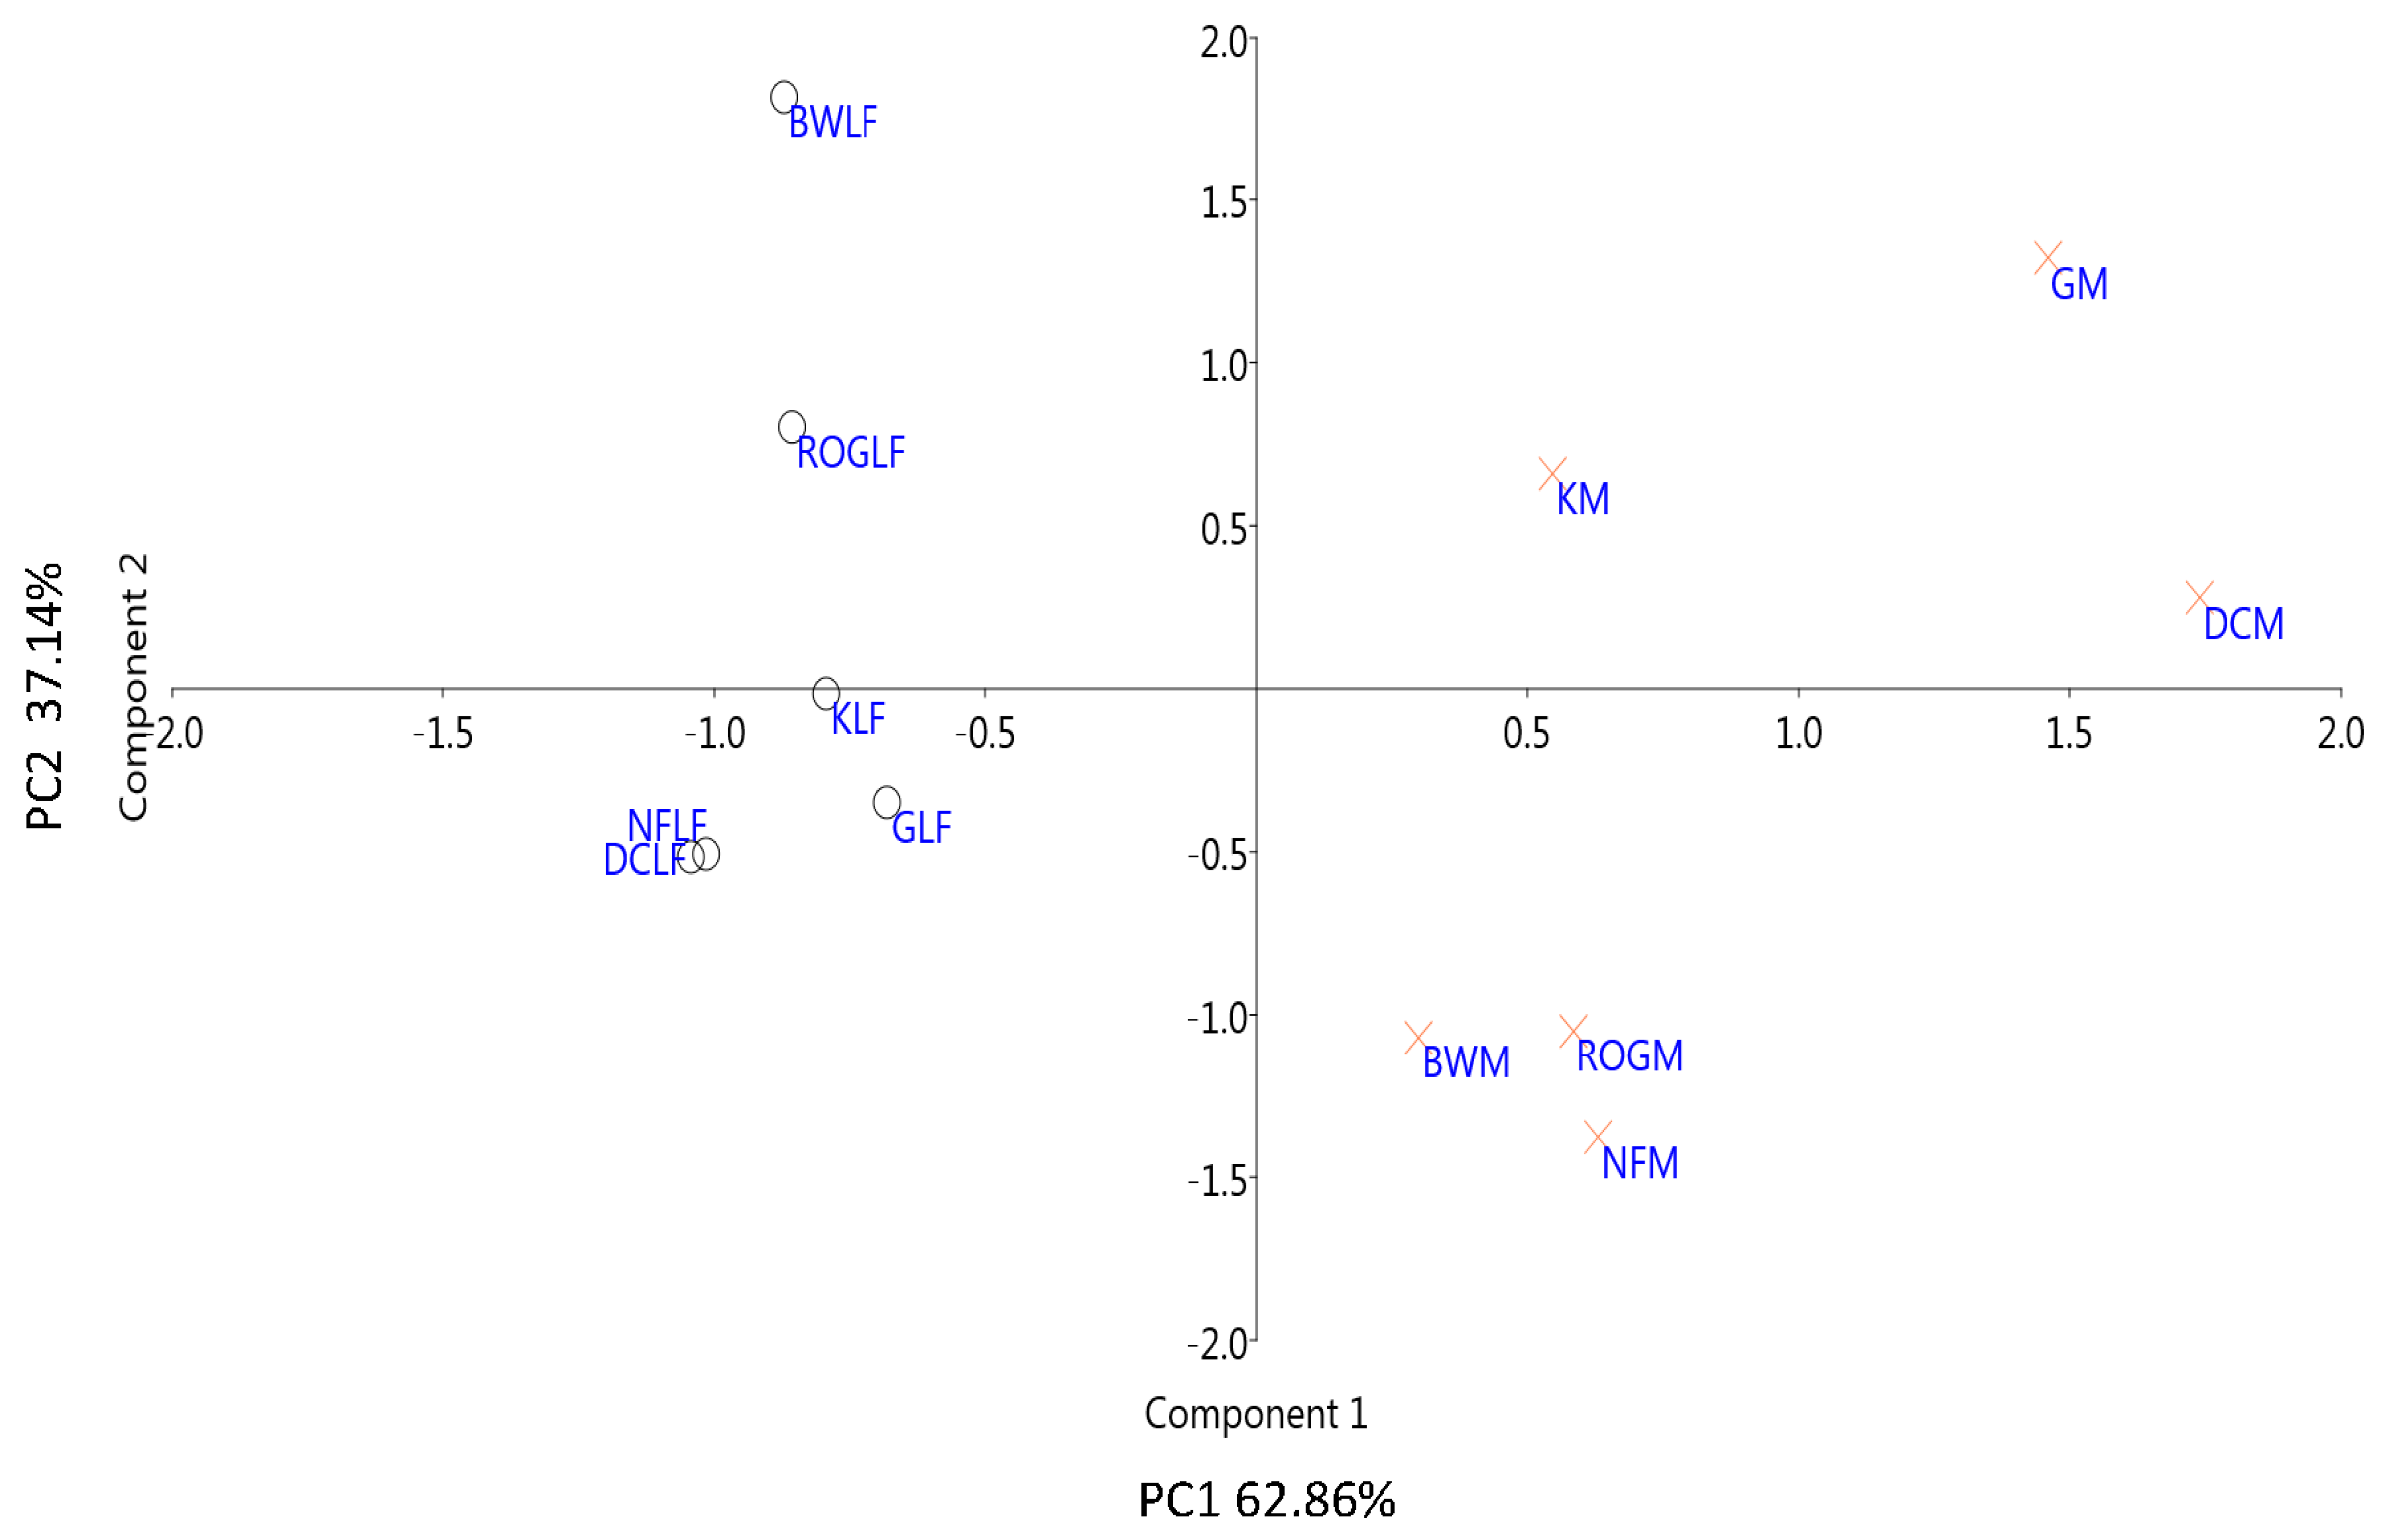
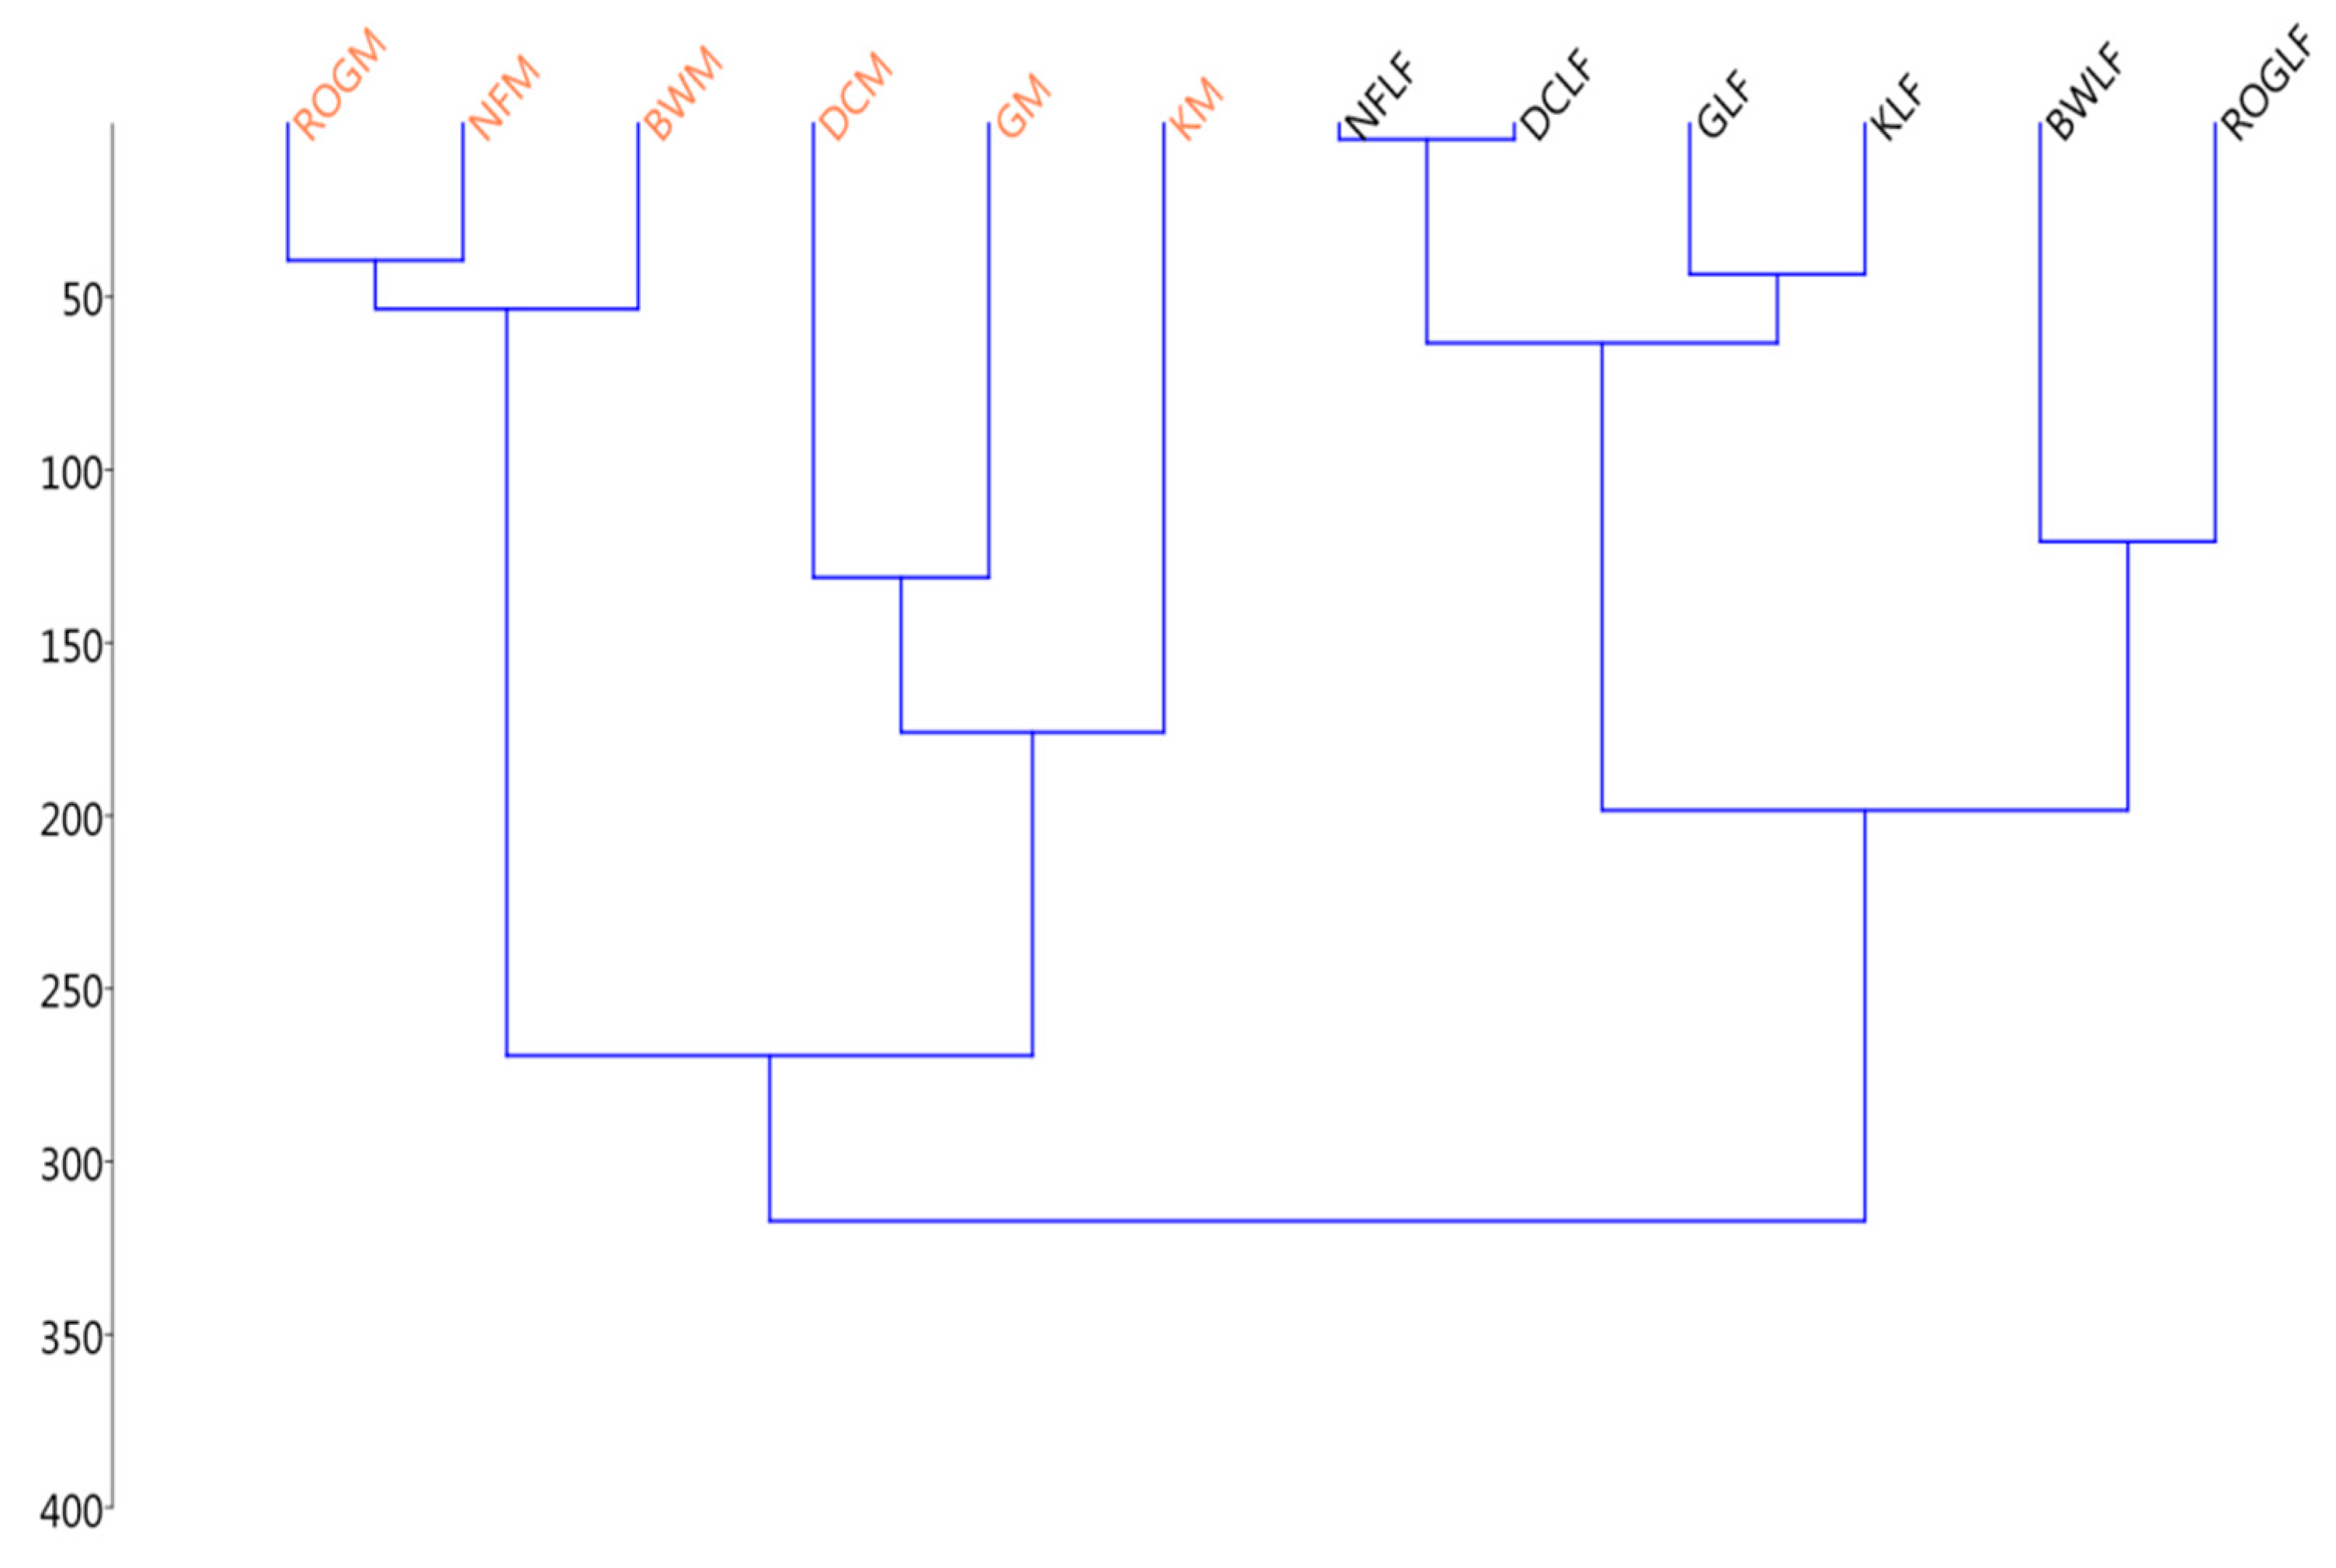
3.2.1. Thermodynamic State Variables and Soil Microbial Diversity

The study of SOM biodecomposition by thermodynamic state variables determined experimentally remains a distinct goal [26,43,44]. This subject has been discussed typically on a theoretical basis [2,45] due to difficulties in calculating the thermodynamic state variables for SMM.
Differences in soil properties and soil chemical and thermal composition yield distinct microbial structures affecting the metabolic heat rate and the kinetics of decomposition of external C sources. This is reflected in the profiles of the calorimetric plots [41,43] that can be related to the decomposition of distinct substrates, but not to the genetic microbial structure in soils. It is demonstrated by calorimetry that different microbial structures may yield different metabolic efficiencies and that the CR may be sensitive to changes in the soil microbial composition linked to a certain soil management [39]. Some results also indicate how microbial diversity is involved in the sensitivity of the soils to temperature by calorimetry [46,47], but there are difficulties in relating all of them to a certain microbial structure because heat rates largely depend more on the enzymatic microbial diversity than on the microbial composition. That is, diverse microorganisms contributing to microbial genetic diversity can synthesize the same enzymes and run the same metabolic paths by similar metabolic heat rates. In this sense, calorimetry would be more useful for studying soil microbial metabolic diversity because it detects soil microbial biodegradation and assimilation of different substrates constituting a method for quantitative assessment of soil microbial metabolic diversity [41,43].
Nevertheless, none of those applications connects soil microbial diversity with thermodynamic functions.
This subsection provides some initial results connecting the thermodynamic characterization of SMM with the SOM thermodynamic properties shown in Table 2 and Table 3. There are some additional samples to reveal the possible connection between the thermodynamic properties and the soil microbial metabolic diversity in mineral soil samples.
The enthalpy change of the microbial reaction taking place in a calorimeter can be directly determined by calorespirometry and the CR which gives the thermodynamic state variables for Equation (4). Table 4 shows the results obtained for the soil samples handled in this review. In this case, only Sandler and Orbey’s model is applied to obtain Gibbs energy. The reason is to avoid incongruences with the entropy change, as happened with the characterization of SOM.
Results in Table 4 show changes in the CR from LF to M samples and among samples from different sites. Those differences can be explained by, or assumed as, changes in microbial metabolism. LF samples from the same site in the UK (ROG, BW, and NF) show decomposition of substrates at higher, the same, and lower degree of reduction than carbohydrates. All LF samples from separate sites in Ireland have similar CR values in the range reported for carbohydrate catabolism. Mineral samples from the UK show lower and more stable CR values than LF samples, suggesting a change in the microbial metabolism, characterized now by biodecomposition of substrates more oxidized than carbohydrates or by a higher component of anaerobic metabolism as depth increases. Mineral samples from Ireland show higher CR values than the LF ones, but in the carbohydrate range in all cases.
Gibbs energy follows the same trend as that of CR since the entropy change contributes little to Gibbs energy at 25 °C (Table 4). Therefore, aerobic SOM biodecomposition is ruled mainly by the enthalpy of the reactions. Consequently, values for Gibbs energy change in M samples from the UK are less negative than those from Ireland, and the entropy change is lower, suggesting that substrates being catabolized in mineral UK samples are less structurally complex than the rest of samples. These features suggest SOM at different degree of decomposition in all samples.
How these thermodynamic state variables contribute to the variance among samples can be studied by PCA analysis, as shown in Figure 2 and by clustering in Figure 3.
PCA shows that 99% of the variance can be explained by two principal components, principal component 1 (PC1; 62.86%) and principal component 2 (PC2; 37.14%). The thermodynamic state variables for Reaction (1), representing the SOM thermodynamic properties, are the ones with higher contribution to component 1, while the thermodynamic state variables determined for Reaction (4), representing SOM microbial catabolism, are the ones with higher contribution to component 2. The distribution of samples in the PCA plot in Figure 2 suggests spatial variation in their thermodynamic properties that can be attributed to spatial changes in the composition of soil organic substrates.
Clusters by the thermodynamic state variables can be observed in Figure 3. There is a clear differentiation between the LF layers and the mineral samples. Soil thermodynamic properties vary with soil depth and denote different states of SOM transformation. Mineral samples from the UK and Ireland form two different clusters, while the LF samples are more overlapped.
All these samples come from the same forest ecosystem, oak. Although SOM decomposition originates from oak leaves in all cases, the thermodynamic properties suggest diverse products from the decomposition. This is in agreement with the ecological hypothesis for coexisting microbial species on the same substrate by yielding different end products following thermodynamic constraints. Recent literature reveals how thermodynamics asserts coexistence of various species by the Gibbs energy change available from the metabolic conversions [44]. Results suggest that microbial coexistence, essential to keep microbial diversity, is based on supporting reactions with low Gibbs energy change when using the same substrate. Environments supporting reactions with low Gibbs energy change (more negative) would allow more metabolic diversity than environments allowing reactions at high Gibbs energy change (less negative). When microorganisms start to yield products at similar Gibbs energy as reactants (higher Gibbs energy change), the system would be evolving towards thermodynamic inhibition. Microorganisms overcome this limitation by yielding different products at low concentrations in the environment. Under that theory, mineral soils from the UK would be supporting lower microbial diversity and would be closer to the thermodynamic inhibition (Gibbs energy change closer to zero) than those from Ireland.
The expected natural trend for survival would be by favoring the coexistence of a high number of different metabolic conversions in the environment. The end products of these metabolic conversions are reutilized as an energy source by the existing and/or by the new microbial population, creating a niche for future microbial diversity through adaptation. At the thermodynamic equilibrium (∆G = 0), two species could not coexist in the same niche, as stated by the competitive exclusion principle [48].
Recent additional work connecting Gibbs energy of dissolved organic matter, DOM, with the microbial diversity [43] also links lower Gibbs energy values to higher microbial diversity.
Microbial biodiversity is given by the number of OTUS of bacteria and fungi (Taxa_S) and by the Shannon index of diversity for four additional mineral soil samples. The mineral soil samples are Leonardite, a recalcitrant material without carbohydrates, a peat sample, and two Cambisols under different management (pine forest and pasture) collected in paired plots in the same location. These samples were surveyed and characterized in a previous paper [47]. Results are reported in Table 5.
Leonardite, Pahokee peat, and Cambisol under pine have SOM with ∆cHSOM higher than carbohydrates, indicating more reduced substrates. Cambisol under pasture has a lower ∆cHSOM (absolute values) than the other samples. Leonardite and Cambisol under pine have less negative ∆rGSOM values and their CR values indicate that they are decomposing substrates more oxidized than carbohydrates, representing partial decomposition of substrates or higher component of anaerobic metabolism [31,36]. Their ∆rGSOM values indicate microorganisms degrading substrates from SOM at similar free energy to the products. Leonardite contains no carbohydrates in its composition, Cambisol under pine, yes, but shows a CR value similar to the sample without them. A possible explanation could be that carbohydrates are physically protected in the Cambisol under pine, being less available to microorganisms for that reason. Pahokee peat and Cambisol pasture have CR values closer to their ∆cHSOM values suggesting degradation of carbohydrates and/or humic material [36]. Peats have a weak mineral matrix and therefore carbohydrates are more available to microorganisms than in Cambisol under pine. That yields lower ∆rGSOM (more negative) than the other samples.
Samples with the lowest ∆cGSOM are those with SOM more reduced than carbohydrates, with just one exception. Those samples remain the ones with the lowest bacteria diversity (lower Taxa_S values). The Cambisol sample under pasture with ∆cHSOM closer to that of carbohydrates is the sample with the highest bacterial diversity, in both TAXA_S and Shannon_H index. The Taxa_S of fungi is lower in the Cambisol sample under pasture than those in the samples with more reduced substrates.
Leonardite and Cambisol pine, with similar CR values and the highest ∆rGSOM, both have a similar microbiological composition characterized by higher Taxa_S of fungi than that of bacteria. Pahokee peat and Cambisol under pasture have the lowest ∆rGSOM. Pahokee peat presents a little higher microbial diversity than Leonardite (based on the Shannon_H index) and higher bacteria diversity than Cambisol pine. Although the Cambisol under pasture have the highest bacteria diversity, the low Gibbs energy change of this sample is not reflected in the fungi diversity data.
Figure 4 shows that there are two clear different groups based on the thermodynamic state variables (Figure 4a): the peat and CambisolP1 under pasture also form a different group from those of CambisolPi1 under Pine and Leonardite based on the microbial diversity (Figure 4b).
Although the set of samples is too low for showing robust results, there is evidence of the possible connection between these thermodynamic variables and the soil microbial composition.

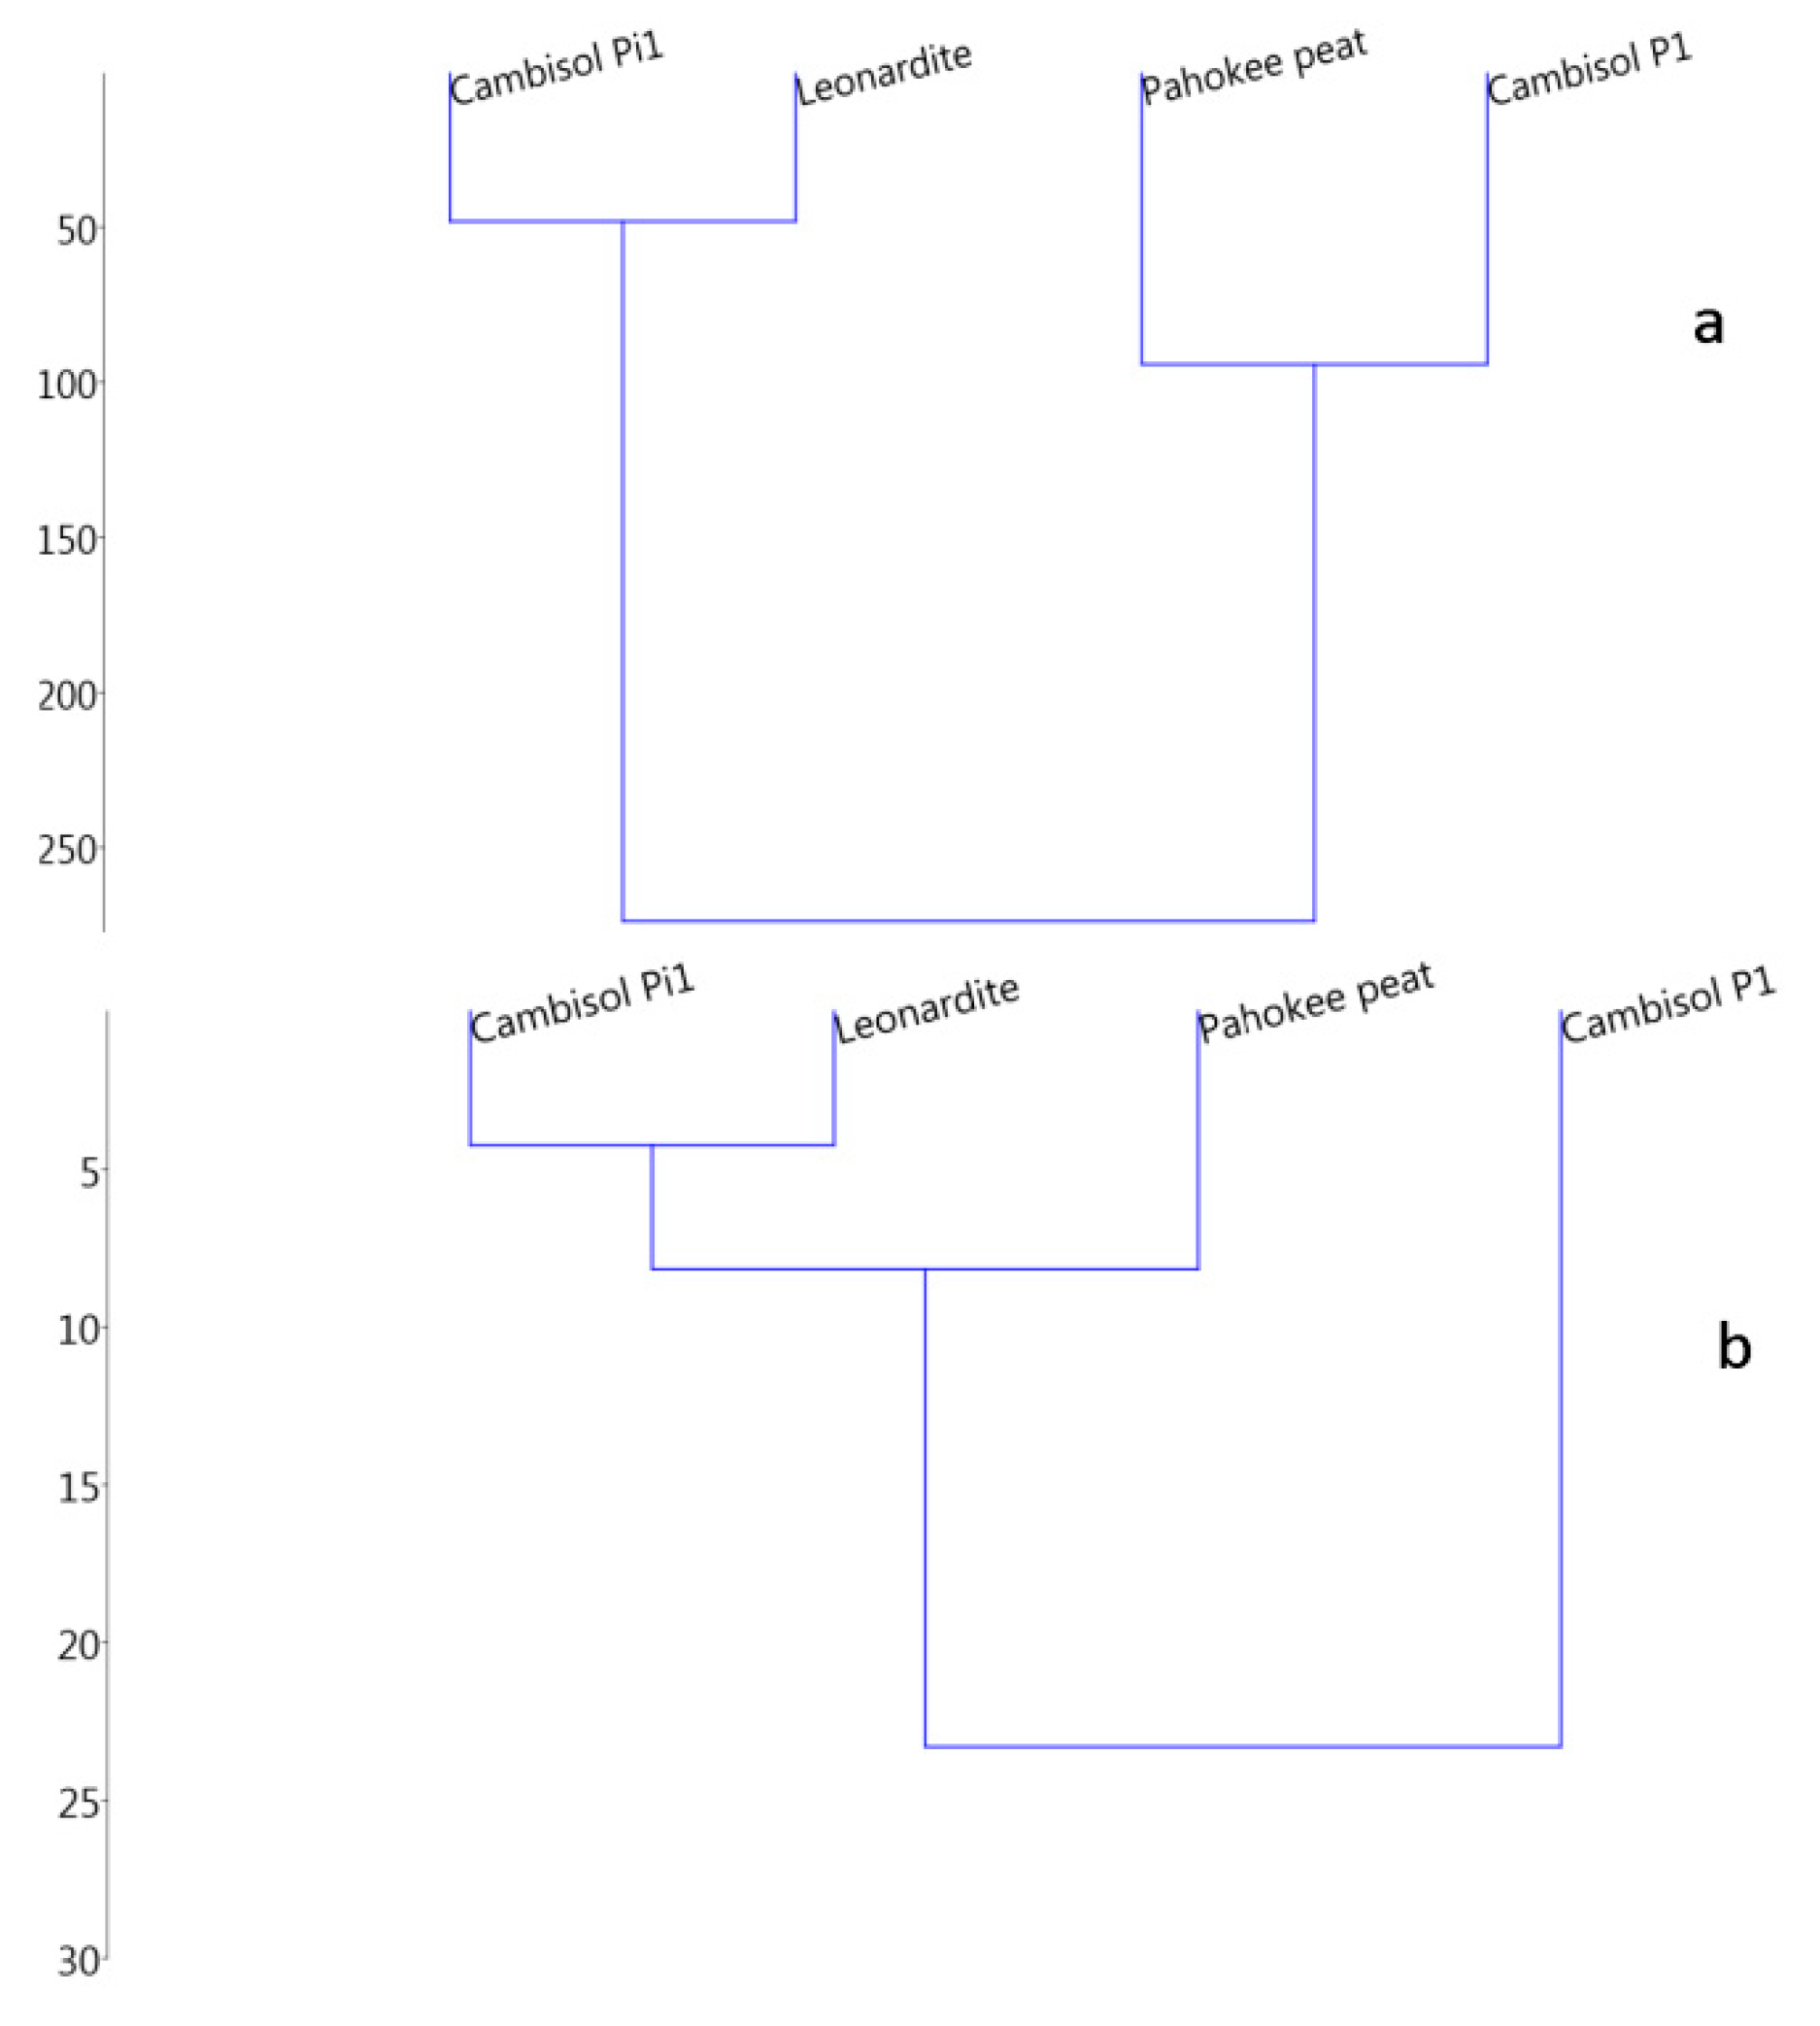
3.2.2. Microbial Diversity and Metabolic Carbon Use Efficiency

The measurement of the amount of soil C released to the atmosphere and the amount kept by the soil system represents a way to predict how soil management can contribute to global warming. The scarcity of methodologies to develop these measurements at the microbiological level is responsible for creative alternatives to assess soil microbial metabolic efficiency, defined as the capacity of the soil microbial population to keep C as microbial biomass and that to release it as CO2. Calorimetry is one of the options for that goal. It is considered currently as a method for measuring both metabolic carbon use efficiency, CUE, and metabolic energy use efficiency, EUE, based on previous research showing up applications for soils by calorimetry [39,49] and by calorespirometry [37]. Barros and Feijoo [39] developed a mass and energy balance to assess soil microbial metabolic efficiency for glucose assimilation and compared it with the calorespirometric models [50] to extend the quantification of metabolic CUE to other substrates than glucose. Both models yielded similar values for microbial metabolic efficiency when glucose was used as an external C source [50]. The problem with the calorespirometric models is the limitation to substrates at a lesser degree of reduction than carbohydrates and microbial biomass. This leads to attempts to improve the present thermodynamic models [39] as well as comparisons with other methods [20,40] with satisfactory results for calorimetry. Thermodynamic models for soil CUE and EUE assessment remain a subject that continues evolving at the moment. The existing results provide knowledge about CUE sensitivity to soil management and microbial composition [39,46], the use of inorganic fertilizers [51], or distinct metabolic paths [31]. The role of the soil microbial structure on the metabolic efficiency is explained by studies conducting comparisons between general bacteria and fungi population, demonstrating the importance of the fungi to bacteria ratio on CUE [52], but there is not much information about the metabolic efficiency of numerous substrates taking part in the soil microbial metabolic diversity [42] where calorespirometric procedures could play a valuable role.

4. Discussion

The thermodynamic characterization of the soil system will play an interesting role in assessing soil evolution and soil ecology; however, before starting these applications, there is already some tasks with optimization of best procedures to yield the thermodynamic state variables, as well as with the interpretation of them [16,20,26].
The existing methods for giving the redox state of SOM cause debate between the SOM chemical formulation and the direct measurement of the SOM energy content [20,25,53]. Although both of them have pros and cons, they are the best options that we have by now and are a good way to approach the degree of reduction of SOM or the oxidation state (one directly yields the other) to apply them to different soil ecosystems.
The degree of reduction/oxidation of SOM is an option to give a number to the concept of soil recalcitrance (an important goal for soil scientists as one of the procedures to mitigate global warming [18]) and a way to link it to all aspects of soil microbial diversity. It will directly inform us about changes in SOM chemical nature. This paper shows an example of how the degree of reduction indicates the evolution of SOM towards a more reduced state from the soil surface to 5 cm depth and how thermodynamic properties vary among samples from different locations despite sustaining the same forest ecosystem.
The enthalpy of combustion and degree of reduction of SOM give us an idea of the SOM nature through comparisons to well-known organic substrates common in soils such as cellulose, lignin, proteins, and so on. For instance, M samples in Table 2 have SOM more reduced than carbohydrates with values close to those reported for substrates such as lignin, some amino acids, and organic acids [21,53]. This could be explained by the influence on SOM from root exudates at that depth, but also by the SOM natural evolution to a more aromatic state, as reported for original organic matter from oaks [54]. Therefore, an increase in the degree of reduction of SOM with soil depth can be a consequence of a higher degree of SOM transformation or degradation compared to that on the soil surface. SOM in the LF layers has a degree of reduction/oxidation values close to those reported for cellulose, lignocellulosic material, and tree leaves [21,53], compatible with a low degree of SOM decomposition.
Measurement of SOM decomposition by calorespirometry yields the CR of the soil microbial metabolism and the degree of reduction/oxidation of the substrates from SOM being metabolized. By comparing the enthalpies of combustion of SOM to the CR, information about SOM decomposition patterns is obtained. Results show some soils degrade substrates from SOM at a similar degree of reduction as that measured for the entire SOM, while others degrade substrates that can be more, or less, reduced than those of SOM. The possible role of CR to discern metabolic patterns of SOM decomposition is still under development [31]; it could help to support some of the existing theories for SOM decomposition and evolution such as the SOM continuum model [26,55] and to assess other well-known ecological theories such as the maximum power principle [19,21].
The redox state of SOM is the key part of the Gibbs energy change (∆G) calculation. The role of this thermodynamic variable for soils is still unknown, making it an attractive option to inquire into. For future interpretations, it is essential to consider soil as an open thermodynamic system holding irreversible metabolic microbial reactions. Thus, ∆G calculations should fix with these premises since the existing equations differentiate between reversible and irreversible processes. Essential, also, is the calorimetric monitoring of the soil microbial reactions because calorimeters are the sole option to detect the exothermic or endothermic nature of those reactions. The heat measured from the soil microbial respiration, the microbial growth reactions, and microbial maintenance are exothermic. The combustion of SOM in the DSC is exothermic, too. Therefore, the enthalpy of combustion and the CR are negative values. ∆G for any reaction can be positive or negative depending on whether a reaction is, or is not, spontaneous. A negative ∆G is always expected for spontaneous reactions. The use of the nominative degree of oxidation of SOM or NOSC, to calculate ∆G involves positive and negative values, too. For this reason, the existing equation to calculate ∆G from NOSC [16,20] can yield positive ∆G data. This could be troublesome to interpret. On the contrary, thermodynamic models exerting the degree of reduction of SOM always yield negative ∆G data. Most of the present models connecting energy and degree of reduction or oxidation include limitations for the metabolism of substrates more reduced than carbohydrates that remain unsolved.
Concerning the role of soil microbial diversity, thermodynamics may play a role in determining the who, where, with whom, and why by the degree of reduction/oxidation of SOM and Gibbs energy. When exploring the microbial structure of the soil samples in this paper, differing degree of reduction of SOM involved changes in microbial diversity. The soil sample at a degree of reduction closer to carbohydrates presented the highest bacterial diversity (Shannon_H index and Tasa_S). Samples with SOM at a higher degree of reduction than carbohydrates showed higher fungi diversity than bacteria, as reported [52]. It seems that bacteria would prefer carbohydrates, while fungi would select SOM at a more substantial degree of decomposition or substrates more reduced than carbohydrates, such as lignin. The varying degree of SOM decomposition would be responsible for the spatial variation of the SOM redox state and the different Gibbs energy values. The reason for this variability is attached to microbial diversity by a type of paper connecting Gibbs energy and microbial diversity to dissolved organic matter, DOM, which solely represents the labile SOM fraction. In this work, Gibbs energy is determined for the entire SOM macromolecule. The preliminary results evidence that Gibbs energy could be sensitive to the soil microbial composition, as reported for DOM. Results in this review suggest, also, that different Gibbs energy values may not accompany greater or lower microbial diversity (structurally and metabolically), but rather changes in the bacterial diversity to fungi diversity relations [52].
This paper also evidences that the same soil type under different management (Cambisol under pine and pasture from paired plots in the same location) yields varied microbial structure and thermodynamic properties. Pasture holds SOM with an enthalpy of combustion close to carbohydrates and lignocellulosic material [31,36], while pine has more reduced SOM than carbohydrates. In this particular case, higher Gibbs energy change of SOM microbial decomposition in pine is attached to higher fungi diversity, while lower Gibbs energy change is obtained for higher bacterial diversity in the pasture. Cambisol under pasture catabolized substrates at a degree of reduction close to that of the entire SOM with metabolic ∆G values close to those from SOM combustion. Cambisol under pine degrades substrates more oxidized than SOM, yielding higher (less negative) ∆G values. This could be explained by the different microbial structure, too. Both samples are yielding diverse products from SOM biodecomposition as a consequence of their metabolism and, therefore, building SOM with different thermodynamic properties. This explains the spatial variability of SOM properties [26,44] and supports ecological theories of coexistence based on biodiversity and competitive exclusion principles [48].

5. Conclusions

Soil thermodynamic properties appear to be sensitive to soil chemical and biological nature and could be acting as the drivers of the soil properties, defining the shape of the microbial community and their functions. Those functions would evolve by adapting to thermodynamic constraints based on the SOM redox state and the available Gibbs energy. Therefore, to gain accuracy in determining and interpreting the thermodynamic state variables, will be essential to discern strategies for soil survival and soil evolution. The way towards that goal has started.

Funding

This research received no external funding.

Institutional Review Board Statement

Not applicable.

Informed Consent Statement

Not applicable.

Data Availability Statement

Thermodynamics of soil organic matter decomposition in semi-natural oak (Quercus) woodland in southwest Ireland—Dryad Digital Repository. https://doi.org/10.5061/dryad.gf1vhhmmd (accessed on 9 July 2020).

Acknowledgments

The author thanks Verónica Piñeiro and Montserrat Gómez for DSC–TG and calorespirometric measurements in the RIAIDT_USC analytical facilities of the University of Santiago de Compostela. The author also thanks Elena Vangelova for samples from the Alice Holt Research Station.

Conflicts of Interest

The authors declare no conflict of interest.

References

  1. Addiscott, T. Entropy, non-linearity and hierarchy in ecosystems. Geoderma 2010, 160, 57–63. [Google Scholar] [CrossRef]
  2. Hansen, L.D.; Popović, M.; Tolley, H.D.; Woodfield, B.F. Laws of evolution parallel the laws of thermodynamics. J. Chem. Thermodyn. 2018, 124, 141–148. [Google Scholar] [CrossRef]
  3. Schrödinger, E. What Is Life? The Physical Aspects of a Living Cell; Cambridge University Press: Cambridge, UK, 1944. [Google Scholar]
  4. Odum, E.P. The Strategy of Ecosystem Development. Science 1969, 164, 262–270. [Google Scholar] [CrossRef] [PubMed] [Green Version]
  5. Fallou, F.A. First Principles of Soil Science; G. Schönfield Buchandlung: Dresden, Germany, 1857. [Google Scholar]
  6. Conant, R.T. Challenges and Opportunities for Carbon Sequestration in Grasslands Systems: A Technical Report on Grassland Management and Climate Change Mitigation; FAO: Rome, Italy, 2010; Volume 9. [Google Scholar]
  7. Hedges, J.; Eglinton, G.; Hatcher, P.; Kirchman, D.; Arnosti, C.; Derenne, S.; Evershed, R.; Kögel-Knabner, I.; de Leeuw, J.; Littke, R.; et al. The molecularly-uncharacterized component of nonliving organic matter in natural environments. Org. Geochem. 2000, 31, 945–958. [Google Scholar] [CrossRef]
  8. Tfaily, M.M.; Chu, R.K.; Tolić, N.; Roscioli, K.M.; Anderton, C.; Paša-Tolić, L.; Robinson, E.W.; Hess, N.J. Advanced Solvent Based Methods for Molecular Characterization of Soil Organic Matter by High-Resolution Mass Spectrometry. Anal. Chem. 2015, 87, 5206–5215. [Google Scholar] [CrossRef]
  9. Šimon, T. Quantitative and qualitative characterization of soil organic matter in the long-term fallow experiment with different fertilization and tillage. Arch. Agron. Soil Sci. 2007, 53, 241–251. [Google Scholar] [CrossRef]
  10. Ljungholm, K.; Norén, B.; Sköld, R.; Wadsö, I. Use of Microcalorimetry for the Characterization of Microbial Activity in Soil. Oikos 1979, 33, 15. [Google Scholar] [CrossRef]
  11. Barros, N.; Feijoo, S.; Salgado, J. Calorimetry and soil. Thermochim. Acta 2007, 458, 11–17. [Google Scholar] [CrossRef]
  12. Suurkuusk, J.; Suurkuusk, M.; Vikegard, P. A multichannel microcalorimetric system: The third generation Thermal Activity Monitor (TAM III). J. Thermal. Anal. Calorim. 2017, 15, 1–18. [Google Scholar] [CrossRef]
  13. Battley, E.H. Energetics of Microbial Growth; John Wiley and Sons: New York, NY, USA, 1987. [Google Scholar]
  14. Heijnen, J.J.; Kleerebezem, R. Bioenergetics of Microbial Growth. In Encyclopedia of Industrial Biotechnology; Wiley: Hoboken, NJ, USA, 2010; pp. 1–24. [Google Scholar]
  15. Von Stockar, U.; Maskow, T.; Liu, J.; Marison, I.W.; Patiño, R. Thermodynamics of microbial growth and metabolism: An analysis of the current situation. J. Biotechnol. 2006, 121, 517–533. [Google Scholar] [CrossRef] [PubMed]
  16. LaRowe, D.E.; Van Cappellen, P. Degradation of natural organic matter: A thermodynamic analysis. Geochim. Cosmochim. Acta 2011, 75, 2030–2042. [Google Scholar] [CrossRef]
  17. Leifeld, J.; Klein, K.; Wüst-Galley, C. Soil organic matter stoichiometry as indicator for peatland degradation. Sci. Rep. 2020, 10, 7634–7642. [Google Scholar] [CrossRef] [PubMed]
  18. Schmidt, M.W.I.; Torn, M.; Abiven, S.; Dittmar, T.; Guggenberger, G.; Janssens, I.A.; Kleber, M.; Kögel-Knabner, I.; Lehmann, J.; Manning, D.; et al. Persistence of soil organic matter as an ecosystem property. Nat. Cell Biol. 2011, 478, 49–56. [Google Scholar] [CrossRef] [PubMed] [Green Version]
  19. Sciuba, E. What did Lotka really say? A critical reassessment of the maximum power principle. Ecol. Modell. 2011, 222, 1347–1353. [Google Scholar] [CrossRef]
  20. Song, H.-S.; Stegen, J.C.; Graham, E.B.; Lee, J.-Y.; Garayburu-Caruso, V.A.; Nelson, W.C.; Chen, X.; Moulton, J.D.; Scheibe, T.D. Representing Organic Matter Thermodynamics in Biogeochemical Reactions via Substrate-Explicit Modeling. Front. Microbiol. 2020, 11, 531756. [Google Scholar] [CrossRef] [PubMed]
  21. Gary, C.; Frossard, J.; Chenevard, D. Heat of combustion, degree of reduction and carbon content: 3 interrelated methods of estimating the construction cost of plant tissues. Agronomie 1995, 15, 59–69. [Google Scholar] [CrossRef]
  22. Jung, H.-J.G.; Varel, V.H.; Weimer, P.J.; Ralph, J. Accuracy of Klason lignin and acid detergent lignin methods as assessed by bomb calorimetry. J. Agric. Food Chem. 1999, 47, 2005–2008. [Google Scholar] [CrossRef] [PubMed]
  23. Rovira, P.; Henriques, R. Energy content of soil organic matter as studied by bomb calorimetry. Soil Biol. Biochem. 2008, 40, 172–185. [Google Scholar] [CrossRef]
  24. Baraldi, P.; Beltrami, C.; Cassai, C.; Molinari, L.; Zunarelli, R. Measurements of combustion enthalpy of solids by DSC. Mater. Chem. Phys. 1998, 53, 252–255. [Google Scholar] [CrossRef]
  25. Malucelli, L.C.; Silvestre, G.F.; Carneiro, J.; Vasconcelos, E.C.; Guiotoku, M.; Maia, C.M.B.F.; Filho, M.A.S.C. Biochar higher heating value estimative using thermogravimetric analysis. J. Therm. Anal. Calorim. 2019, 139, 2215–2220. [Google Scholar] [CrossRef]
  26. Barros, N.; Fernandez, I.; Byrne, K.A.; Jovani-Sancho, A.J.; Ros-Mangriñan, E.; Hansen, L.D. Thermodynamics of soil organic matter decomposition in semi-natural oak (Quercus) woodland in southwest Ireland. Oikos 2020, 129, 1632–1644. [Google Scholar] [CrossRef]
  27. Roels, J.A. Energetics and Kinetics in Biotechnology; Elsevier: Amsterdam, The Netherlands, 1983. [Google Scholar]
  28. Sandler, S.I.; Orbey, H. On the thermodynamics of microbial growth processes. Biotechnol. Bioeng. 1991, 38, 697–718. [Google Scholar] [CrossRef]
  29. Ludovisi, A.; Pandolfi, P.; Taticchi, M.I. The strategy of ecosystem development: Specific dissipation as an indicator of ecosystem maturity. J. Theor. Biol. 2005, 235, 33–43. [Google Scholar] [CrossRef]
  30. Battley, E.H. An empirical method for estimating the entropy of formation and the absolute entropy of dried microbial biomass for use in studies on the thermodynamics of microbial growth. Thermochim. Acta 1999, 326, 7–15. [Google Scholar] [CrossRef]
  31. Chakrawal, A.; Herrmann, A.M.; Šantrůčková, H.; Manzoni, S. Quantifying microbial metabolism in soils using calorespirometry—A bioenergetics perspective. Soil Biol. Biochem. 2020, 148, 107945. [Google Scholar] [CrossRef]
  32. Maskow, T.; Kemp, R.B.; Buchholz, F.; Schubert, T.; Kiesel, B.; Harms, H. What heat is telling us about microbial conversions in nature and technology: From chip- to megacalorimetry. Microb. Biotechnol. 2009, 3, 269–284. [Google Scholar] [CrossRef] [PubMed]
  33. Wadsö, L.; Hansen, L.D. Calorespirometry of terrestrial organisms and ecosystems. Methods 2015, 76, 11–19. [Google Scholar] [CrossRef]
  34. Barros, N.; Feijóo, S.; Hansen, L.D. Calorimetric determination of metabolic heat, CO2 rates and the calorespirometric ratio of soil basal metabolism. Geoderma 2011, 160, 542–547. [Google Scholar] [CrossRef]
  35. Herrmann, A.M.; Bölscher, T. Simultaneous screening of microbial energetics and CO2 respiration in soil samples from different ecosystems. Soil Biol. Biochem. 2015, 83, 88–92. [Google Scholar] [CrossRef]
  36. Barros, N.; Hansen, L.; Piñeiro, V.; Pérez-Cruzado, C.; Villanueva, M.; Proupín, J.; Añón, J.A.R. Factors influencing the calorespirometric ratios of soil microbial metabolism. Soil Biol. Biochem. 2016, 92, 221–229. [Google Scholar] [CrossRef]
  37. Hansen, L.D.; Macfarlane, C.; McKinnon, N.; Smith, B.N.; Criddle, R.S. Use of calorespirometric ratios, heat per CO2 and heat per O2, to quantify metabolic paths and energetics of growing cells. Thermochim. Acta 2004, 422, 55–61. [Google Scholar] [CrossRef]
  38. Barros, N. Calorimetry and soil biodegradation: Experimental procedures and thermodynamic models. In Toxicity and Biodegradation Testing; Humana Press: Totowa, NJ, USA, 2018; pp. 123–145. [Google Scholar]
  39. Harris, J.A.; Ritz, K.; Coucheney, E.; Grice, S.; Lerch, T.Z.; Pawlett, M.; Herrmann, A.M. The thermodynamic efficiency of soil microbial communities subject to long-term stress is lower than those under conventional input regimes. Soil Biol. Biochem. 2012, 47, 149–157. [Google Scholar] [CrossRef]
  40. Geyer, K.M.; Dijkstra, P.; Sinsabaugh, R.; Frey, S.D. Clarifying the interpretation of carbon use efficiency in soil through methods comparison. Soil Biol. Biochem. 2019, 128, 79–88. [Google Scholar] [CrossRef]
  41. Chakrawal, A.; Herrmann, A.M.; Manzoni, S. Leveraging energy flows to quantify microbial traits in soils. Soil Biol. Biochem. 2021, 155, 108169. [Google Scholar] [CrossRef]
  42. Xu, J.; Feng, Y.; Barros, N.; Zhong, L.; Chen, R.; Lin, X. Exploring the potential of microcalorimetry to study soil microbial metabolic diversity. J. Therm. Anal. Calorim. 2016, 127, 1457–1465. [Google Scholar] [CrossRef]
  43. Zhang, J.; Feng, Y.; Wu, M.; Chen, R.; Li, Z.; Lin, X.; Zhu, Y.; Delgado-Baquerizo, M. Evaluation of Microbe-Drive Soil Organic Matter Quantity and Quality by Thermodynamic Theory. mBIO 2021, 12, e03252-20. [Google Scholar] [CrossRef]
  44. Grosskopf, T.; Soyer, O.S. Microbial diversity arising from thermodynamic constrains. ISME J. 2016, 10, 2725–2733. [Google Scholar] [CrossRef]
  45. Hansen, L.D.; Tolley, H.D.; Woodfield, B.F. Tranformation of matter in living organisms during growth and evolution. Biophys. Chem. 2021, 106550. [Google Scholar] [CrossRef] [PubMed]
  46. Bölscher, T.; Paterson, E.; Freitag, T.; Thornton, B.; Herrmann, A.M. Temperature sensitivity of substrate-use efficiency can result from altered microbial physiology without change to community composition. Soil Biol. Biochem. 2017, 109, 59–69. [Google Scholar] [CrossRef]
  47. Hansen, L.D.; Barros, N.; Transtrum, M.K.; Rodríguez-Añón, J.A.; Proupín, J.; Piñeiro, V.; Arias-González, A.; Gartzia-Bengoetxea, N. Effect of extreme temperatures on soil: A calorimetric approach. Thermochim. Acta 2018, 670, 128–135. [Google Scholar] [CrossRef]
  48. Hardin, G. The Competitive Exclusion Principle. Science 1960, 131, 1292–1297. [Google Scholar] [CrossRef] [Green Version]
  49. Barros, N.; Feijóo, S. A combined mass and energy balance to provide bioindicators of soil microbiological quality. Biophys. Chem. 2003, 104, 561–572. [Google Scholar] [CrossRef]
  50. Barros, N.; Salgado, J.; Rodríguez-Añón, J.A.; Proupín, J.; Villanueva, M.; Hansen, L.D. Calorimetric approach to metabolic carbón conversión efficiency in soils: Comparison of experimental and theoretical models. J. Thermal. Anal. Calorim. 2010, 99, 771–777. [Google Scholar] [CrossRef]
  51. Barros, N.; Feijoo, S.; Simoni, J.A.; Airoldi, C.; Ramajo, B.; Espina, A.; García, J.R. A mass and energy balance to provide microbial growth yield efficiency in soil: Sensitivity to metal layering phospates. J. Therm. Anal. Calorim. 2008, 93, 657–665. [Google Scholar] [CrossRef]
  52. Soares, M.; Rousk, J. Microbial growth and carbon use efficiency in soil: Links to fungal-bacterial dominance, SOC-quality and stoichiometry. Soil Biol. Biochem. 2019, 131, 195–205. [Google Scholar] [CrossRef]
  53. Masiello, C.A.; Gallagher, M.E.; Randerson, J.T.; Deco, R.M.; Chadwick, O.A. Evaluating two experimental approaches for measuring ecosystem carbon oxidation state and oxidative ratio. J. Geophys. Res. Space Phys. 2008, 113, 03010. [Google Scholar] [CrossRef] [Green Version]
  54. Chavez-Vergara, B.; Merino, A.; Vázquez-Marrufo, G.; García-Oliva, F. Organic matter dynamics and microbial activity during decomposition of forest floor under two native neotropical oak species in a temperate deciduous forest in Mexico. Geoderma 2014, 235–236, 133–145. [Google Scholar] [CrossRef]
  55. Lehmann, J.; Kleber, M. The contentious nature of soil organic matter. Nat. Cell Biol. 2015, 528, 60–68. [Google Scholar] [CrossRef]
Figure 1. A summary of the procedure followed to approach the enthalpy of combustion of SOM, ∆cHSOM, by simultaneous DSC–TG.
Applsci 11 04962 g001
Figure 2. PCA plot showing the distribution of soil samples along with the two principal components. Samples ROGLF, BWLF, and NFLF are from the UK. Samples DCLF, GLF, and KLF come from Ireland. All of them represent the soil LF layer and scatter on the left side of the plot. Mineral samples from the UK (ROGM, BWM, and NFM) appear concentrated in the quadrant limited by the positive x and negative y-axis. Mineral samples from Ireland (DCM, GM, and KM) scatter along the positive x and y-axis quadrant.
Applsci 11 04962 g002
Figure 3. Clusters of the soil samples based on their thermodynamic properties. LF samples from the UK (ROGLF, BWLF, and KLF) and Ireland (DCLF, GLF, and KLF) form a cluster separated from two clusters of mineral samples from the UK (ROGM, BWM, and NFM) and Ireland (DCM, GM, and KM).
Applsci 11 04962 g003
Figure 4. The clusters of four mineral soils with differing chemical composition are shown as a function of the thermodynamics state variables (a) and as a function of the microbial diversity data in Table 5 (b).
Applsci 11 04962 g004
Table 1. Elemental composition of soil samples selected for this review. SOM percentages are determined by thermogravimetry (TG). LF indicates samples from the soil surface representing organic matter at a low degree of decomposition. M represents mineral soil samples taken in the same places as LF but at 5 cm depth from surface, where SOM is more transformed than LF layers. Samples ROG, BW, and NF come from the Alice Holt Research Station in the southeast of the UK. Samples DC, G, and K are from the southwest of Ireland and were used in previous work [26]. All of them represent mature forest oak ecosystems.
SamplesCtot (%)Corg (%)H (%)N (%)SOM (%)
ROG LF39345.01.673
BW LF46416.52.581
NF LF44426.52.080
DC LF50425.51.495
G LF51465.31.797
K LF51406.41.796
ROG M550.30.310
BWM1191.00.623
NFM1281.40.516
DCM640.70.37
G M540.50.29
KM10101.40.521
Table 2. Thermodynamic data of samples obtained directly from DSC curves, QSOM and ∆cHSOM, and the degree of reduction of samples, γSOM determined by Roels, γSOMR, and Sandler and Orbey, γSOMS&O, correlations for the LF soil layer and mineral soil samples, M. Samples ROG, BW, and NF are from the southeast of the UK. Samples DC, G, and K are from the southwest of Ireland. The reproducibility of measurements by DSC–TG is 5%. The uncertainty averaged for the degree of reduction is ±0.2 based on the standard errors reported for both models [27,28].
Samples−QSOM
kJ g−1SOM
LF
−QSOM
kJ g−1SOM
M
−∆cHSOM
kJ mol−1C
LF
−∆cHSOM
kJ mol−1C
M
ROG15.421.9449617
BW15.120.7441586
NF15.122.2440624
DC15.026.4437734
G16.425.0475697
K15.921.3461602
SamplesγSOMR
LF
γSOMS&O
LF
γSOMR
M
γSOMS&O
M
ROG3.904.115.365.66
BW3.834.055.105.39
NF3.834.045.435.72
DC3.804.016.386.73
G4.134.366.066.39
K4.014.235.235.22
Table 3. Values of the Gibbs energy change of reaction (Equation (1)) obtained by applying the Roels correlation, −∆cGSOMR, and Sandler and Orbey correlation, −∆cGSOMS&O, for LF and mineral, M, samples, together with their respective entropy changes for Reaction (1). The residual standard error for calculation of −∆cGSOMR data is that reported by Roels, 18 kJ mol−1, and that for estimation of −∆cGSOMS&O is 21.5 kJmol−1 [26,27]. Samples ROG, BW, and NF are from the southeast of the UK. Samples DC, G, and K are from the southwest of Ireland.
Samples−∆cGSOMR
kJ mol−1C
LF
−∆cGSOMS&O
kJ mol−1C
LF
−∆cGSOMR
kJ mol−1C
M
−∆cGSOMS&O
kJ mol−1C
M
ROG455454594624
BW448446568593
NF448445599631
DC445442689742
G477481659705
K465466581609
SamplescSSOMR
J K−1mol−1C
LF
cSSOMS&O
J K−1mol−1C
LF
cSSOMR
J K−1mol−1C
M
cSSOMS&O
J K−1mol−1C
M
ROG20.116.8−79.323.5
BW23.516.8−60.423.5
NF26.816.8−83.923.5
DC26.916.8−151.026.9
G6.720.1−127.526.9
K13.416.8−70.523.5
Table 4. Values for the calorespirometric ratio, CR, for the LF and M samples from the UK (ROG, BW, and NF) and Ireland (DC, G, and K); the degree of reduction of substrates being metabolized, γr, is obtained By Equation (5). Assuming CR represents the enthalpy change of Reaction (4), ∆rHSOM; Gibbs energy change for Reaction (4) is also obtained by Sandler and Orbey’s correlation, ∆rGSOM, as well as entropy change for Reaction (4), obtained by Equation (3), ∆rSSOM.. Uncertainties for the degree of reduction and Gibbs energy change estimated from Sandler and Orbey’s correlation are the same as reported in Table 2 and Table 3. Standard deviation in CR samples is determined from two replicates of each sample.
Samples−CR
kJ mol−1CO2-C
LF
−CR
kJ mol−1CO2-C
M
γ
LF
γ
M
−∆rGSOM
kJmol−1C
LF
−∆rGSOM
kJmol−1C
M
rSSOM
JK−1mol−1C
LF
rSSOM
JK−1mol−1C
M
ROG423 ± 30280 ± 73.882.5742728316.010.6
BW507 ± 19276 ± 94.652.5351327919.210.5
NF312 ± 10253 ± 122.862.3231625611.89.6
DC310 ± 44400 ± 682.853.6731540511.815.2
G327 ± 41485 ± 93.004.4533249012.418.4
K355 ± 51421 ± 173.263.8735942713.416.0
Table 5. Biological and thermodynamic properties determined for four different mineral soil samples. Microbial diversity was determined by ARISA and is given by the Taxa_S and Shannon_H diversity indices for soil bacteria and fungi. Reproducibility for −∆cHSOM is 5%. The residual standard error is 21.5 kJ mol−1. CR values are the average of duplicates with their standard deviation.
SamplesTaxa_S
Bacteria
Taxa_S
Fungi
Shannon
Bacteria
Shannon
Fungi
−∆cHSOM
kJmol−1C
−∆cGSOM
kJmol−1C
−CR
kJmol−1CO2-C
−∆rGSOM
kJmol−1C
Leonardite7211.922.07538554273 ± 14276
Pahokee peat8151.932.19545551463 ± 20468
Cambisol pasture28113.072.20489495495 ± 21500
Cambisol pine6211.672.90539544239 ± 18242
Publisher’s Note: MDPI stays neutral with regard to jurisdictional claims in published maps and institutional affiliations.

