Article

Numerical Study of the Hydrodynamic Characteristics Comparison between a Ducted Propeller and a Rim-Driven Thruster

Department of Mechanical Engineering, Group T Leuven Campus, KU Leuven, B-3000 Leuven, Belgium
*
Author to whom correspondence should be addressed.
Appl. Sci. 2021, 11(11), 4919; https://doi.org/10.3390/app11114919
Submission received: 29 April 2021 / Revised: 24 May 2021 / Accepted: 25 May 2021 / Published: 27 May 2021

Abstract

:
The Rim-Driven Thruster (RDT) is an extraordinary innovation in marine propulsion applications. The structure of an RDT resembles a Ducted Propeller (DP), as both contain several propeller blades and a duct shroud. However, unlike the DP, there is no tip clearance in the RDT as the propeller is directly connected to the rim. Instead, a gap clearance exists in the RDT between the rim and the duct. The distinctive difference in structure between the DP and the RDT causes significant discrepancy in the performance and flow features. The present work compares the hydrodynamic performance of a DP and an RDT by means of Computational Fluid Dynamics (CFD). Reynolds-Averaged Navier–Stokes (RANS) equations are solved in combination with an SST k-ω turbulence model. Validation and verification of the CFD model is conducted to ensure the numerical accuracy. Steady-state simulations are carried out for a wide range of advance coefficients with the Moving Reference Frame (MRF) approach. The results show that the gap flow in the RDT plays an important role in affecting the performance. Compared to the DP, the RDT produces less thrust on the propeller and duct, and, because of the existence of the rim, the overall efficiency of the RDT is significantly lower than the one of the ducted propeller.

1. Introduction

Propulsion systems play an indispensable role in marine vessels. There are various designs applied to present ship propulsors, such as the open propeller, the ducted propeller, podded and azimuthing propulsors, etc. Each kind of propulsor has its advantages and disadvantages. Regardless of different types of design, they share the same propulsion technology, i.e., a shaft-driven propulsion, in which the shaft is imperative because the propeller must be connected to it in order to rotate. Furthermore, the other side of the shaft is mounted on the primary engine, which lays within the ship’s hull, making the whole structure stretch through the cabin space. In addition, substantial friction power loss and high-level noise and vibrations can occur when they operate.
In order to overcome the main drawbacks in conventional shaft-driven propulsion systems as mentioned above, a novel propulsion concept has been brought forward, namely the Rim-Driven Thruster (RDT), also known as the Integrated Motor Propulsor (IMP) [1]. As the name implies, this kind of thruster is rim driven instead of being shaft driven. In an RDT device, the driver motor is integrated into the structure, with the stator embedded in the shroud and the rotor distributed on or in the rim. As the thruster works under water, both the stator and rotor are coated with protection, such as epoxy resin, to prevent water erosion. The propeller blades are directly connected to the rim and rotate with the rotor when the motor works. Figure 1 gives the inner layout of an RDT, in which some key components are shown: the driven motor, the propeller blades, the bearings, and the duct.
Several outstanding improvements are realized due to the integrated design of RDTs. The component arrangement of RDTs is much more compact compared to conventional propulsion systems and therefore installation and management are more flexible. The elimination of intermediary equipment, such as a motor cooling system, reduction gear box, and bearing lubricating system, can save a lot of cabin space and reduce ship building costs. The motor efficiency is higher when the RDT is powered by a Permanent Magnet (PM) radial field motor, and power does not have to be applied to the field and thus field power losses are eliminated. In addition, the application of water-lubricated bearings ensures a low risk of water pollution [2]. Moreover, the application of the RDT is not limited to ordinary ships, as underwater Remotely Operated Vehicles (ROVs) and Autonomous Underwater Vehicles (AUVs) can also be equipped with lightweight and highly compact RDTs to operate with a high performance [3,4].
Despite many distinguished merits of RDTs, there are still many challenges in their hydrodynamic design and performance analysis compared to traditional propellers. In order to understand the performance of RDTs, Sharkh et al. [5] designed and manufactured a demonstrator RDT with a 250 mm diameter. Experimental tests were conducted to investigate the influence of the duct and propeller profiles on the overall performance of the thruster. It was found that at bollard conditions the duct fairings could have negative effects on the thrust production due to the resistance of the fairings to the flow. However, at higher advance ratios, the existence of the fairings improved the performance. As for the propellers, symmetric and asymmetric ones were compared under the same working conditions. The asymmetric propeller produced a higher thrust in the forward direction compared to the symmetric propeller. This was expected because the asymmetric profile increased the pitch ratio, resulting in a higher thrust at the same speed. The study also concluded that the smoothness of the surface of the duct and propeller could have an influence on the performance of the thruster.
For the hydrodynamic performance evaluation of an RDT, experimental methods are widely employed because of their high reliability and accuracy. However, it is often quite costly to build an experimental setup and sometimes even impractical. Therefore, Computational Fluid Dynamics (CFD) has become a popular choice in dealing with such problems due to its extraordinary convenience and low cost. Among various numerical methods, the RANS methods stand out and can be found in extensive research studies. Cai et al. [6] investigated the performance of an RDT with a commercial RANS solver after validating the numerical model by comparing the simulated results of a Ka 4-55 propeller with existing experimental data. From their results, rim-driven thruster propellers could produce a larger thrust by absorbing a higher torque from the motor compared to conventional shaft-driven propellers, but this resulted in a lower efficiency. However, this situation can be alleviated by applying thinner propeller blades. Moreover, a long rim can slightly increase friction torque and affect the performance of the propeller blades as a circumferential velocity will be introduced to the local flow, causing a reduced tangential velocity and angle of attack for the propeller. Due to the fact that no design guidelines were available for propeller design in hub-less RDTs, Zhang et al. [7] designed a propeller based on current Ka-series propeller geometry. Three configurations of hub-less RDTs were modeled and calculated numerically, i.e., 5 blades, 7 blades, and 5-4 contra-rotating blades. They concluded that the hydrodynamic performance of RDTs is similar to that of ducted propellers, and, because there is no hub in the hub-less RDT, no hub vortex exists and therefore cavitation is diminished.
The rim gap is a characteristic structure in RDTs and, even though the dimensions of the gap are usually small, its influence on the performance of the thruster can hardly be ignored. Cao et al. [8,9] studied the effects of the gap flow with and without axial pressure difference using RANS simulations. When there was no pressure gradient in the axial direction, the angular momentum current analyzing method was introduced to analyze the gap flow. The developed method was validated by experiments in the large cavitation tunnel of CSSRC. Compared to the calculations with empirical formulas, the predicted results by the numerical method were improved significantly. However, when a pressure difference existed between the rim ends due to the rotational movement of the propeller, the flow regimes in the gap flow changed significantly, resulting in a higher torque friction. The thrusts produced by the surfaces surrounding the gap, including the duct inner surface, rim outer surface, and rim end surface, were balanced out. The propeller loading distributions and steady wake flow fields were also investigated by studying four cases of different propellers. The propeller blade radial circulation and chord-wise circulation density distributions were analyzed. It was found that the maximum radial circulation occurs at the blade tip, which is different from conventional shaft-driven propellers, and the right adjustment of the blade loading distribution could restrain root and tip region vortices.
As an innovative invention, the RDT is quite similar to a conventional DP in its structural design. However, a detailed comparison study of hydrodynamic performance between them is difficult to find. Therefore, the present work aims to find out the difference in hydrodynamic performance between the DP and the RDT with the aid of numerical simulations. A verification and validation study is carried out for the CFD model to ensure the numerical accuracy. The CFD model is then applied to the performance prediction of the DP and the RDT. Based on the results, the local and global hydrodynamic characteristics of the DP and the RDT are compared and analyzed, including the open water performance and several important flow features. The model setup and validation is given in Section 2. A detailed discussion for the DP and RDT is given in Section 3, and finally the conclusions are summarized in Section 4.

2. CFD Model Setup and Validation

A typical four-blade RDT is used for this study. The geometric details are provided in Table 1. The propeller under consideration is the Ka 4-70 [10] propeller with a uniform pitch ratio of 1.0 and area ratio of 0.7. The hub has a total length of 0.52D with 0.28D before the propeller and 0.24D after the propeller, in which D represents the diameter of the propeller, i.e., 250 mm in this case. The hub shroud is round shaped with a diameter of 0.167D. The duct is modified from the most commonly encountered duct, i.e., the No. 19A duct, with a length of 0.65D. Considering the accommodation of the driven motor, the duct length along the chord-wise direction is extended instead of using the classical length of 0.5D. A gap with a width of 2 mm and a length of 90 mm represents the air gap of the driven motor, as also found in the study of Cao [8]. The same structural and dimensional configurations are kept for the DP, except that the tip clearance between the propeller tip and the duct is designed as 1.5 mm (Wang [11]). A schematic view of the DP and the RDT is shown in Figure 2, with the MRF shown in yellow.

2.1. Numerical Model

The Reynolds-Averaged Navier–Stokes (RANS) equations are employed to resolve the flow field around the thrusters. For incompressible Newtonian fluids, the continuity and momentum equations are given as
u i x i = 0   and
ρ ( u i t + u j u i x j ) = p x i + x j [ μ ( u i x j + u j x i ) ] + x j ( ρ u i u j ¯ ) ,
where ρ is the fluid density, u i (i = 1, 2, 3, representing the component in the x, y, z direction) is the mean velocity component, t is the flow time, p is the pressure, μ is the dynamic viscosity, and ρ u i u j ¯ is the Reynolds stress term.
The direct modeling of the Reynolds stress is based on the Boussinesq hypothesis, which assumes the Reynolds stress to be a linear function of the mean velocity gradients [12]. For incompressible Newtonian flows, the Reynolds stress is calculated as
ρ u i u j ¯ = μ t ( u i x j + u j x i ) 2 3 ρ k δ i j
where μ t is the turbulent eddy viscosity and δ i j is the Kronecker symbol.
To complete the set of equations, the SST k-ω turbulence model developed by Menter [13] is adopted, as the SST k-ω model takes advantage of both the k-ω model in a robust near-wall treatment due to the simple low Reynolds number formulation and the ability to compute flows with moderate adverse pressure gradients, and the k-ε model in a better performance near the boundary layer edge and away from the walls because of its insensitivity to the free stream values. In this model, two additional transport equations are solved for the turbulent kinetic energy, k, and the specific turbulent dissipation rate, ω. These equations are solved together with Equations (1) and (2) using the commercial software ANSYS Fluent.

2.2. Grid Generation and Validation Study

In this study, a cylindrical computational domain sized 14D in length and 5D in radius is adopted, in which D represents the diameter of the propeller, as depicted in Figure 3a. The inlet is located 4D upstream of the propeller center and the outlet 10D downstream. The mesh is generated in a hybrid form in which the stationary domain is filled with a structured mesh and the rotating domain with an unstructured mesh. Prism layers are placed on the propeller, hub, and duct with smooth transition normal to the walls, as shown in Figure 4. The first layer height is so small that the maximum y+ value on the propeller is less than 15. As it is difficult to maintain a uniform grid size near the wall, a scalable wall function is employed, which resolves the boundary layer with varied near-wall treatment based on local y+ values. To resolve the high velocity gradients in the clearance and gap, 15 prism layers are placed between the propeller tip and the duct inner surface for the DP, while 20 prism layers are placed between the rim and the duct inner surface for the RDT.
The computational domain is divided into stationary and rotating fluid zones by conformal interfaces, and the propeller, hub, and duct are contained in the rotating zone. The Moving Reference Frame (MRF) approach is utilized to handle the relative motion of the propeller. In the MRF, the governing equations for the flow in the selected rotating zone are solved in a relative rotating frame. At the interfaces, appropriate transformations of the velocity vector and velocity gradients are performed to compute fluxes of mass, momentum, and other scalars. As the MRF is a steady-state approximation of the actual flow, the interactions between the stationary and rotating components are ignored. Therefore, it requires much less computational resources compared to other approaches, such as the sliding mesh model.
There are some hydrodynamic-related coefficients that are used in this study, and they are defined as follows:
J = V a n D ,
K t = T ρ n 2 D 4 ,
K q = Q ρ n 2 D 5 ,
η = J 2 π K t K q ,
C p = p p 1 2 ρ v 2 ,
where V a is the inflow velocity in m·s−1, n is the rotation rate of the propeller in s−1, ρ is the fluid density in kg·m−3, D is the diameter of the propeller in m, and J , K t , T , K q , Q , and η are the advance coefficient, total thrust coefficient, total thrust, total torque coefficient, total torque, and efficiency, respectively; C p is the pressure coefficient, p is the local pressure in Pa, p is the free stream pressure in Pa, and v is the representative velocity of the propeller, which in this study is π n D .
As related experimental data for RDTs are scarce, a validation study is carried out to verify and validate the numerical model. The physical model used for validation with experimental data was obtained from the study of Wang [11], in which open water tests were performed for a Ka47 ducted propeller under a wide range of advance coefficients.
Three sets of meshes have been generated to perform a mesh sensitivity analysis, from a coarse to a fine mesh with cell numbers increasing by a certain growth ratio in each direction. Detailed mesh parameters are given in Table 2. As the flow in the rotational zone changes much more rapidly than in the stationary zone, more grid cells are placed in the former to resolve the complex flow field around the propeller. The grid growth ratio is kept almost constant to ensure a better evaluation of the discretization error.
The Grid Convergence Index (GCI) described in Celik [14] is introduced to evaluate the discretization error for the thrust and torque of the propeller under two representative loading conditions: J = 0.1 and J = 0.5. GCI is a discretization error estimation method based on Richardson extrapolation and is calculated in the following way:
e 21 = | φ 1 φ 2 φ 1 |
GCI 21 = 1.25 e 21 r 21 p 1
where e 21 is the relative error between the result from the coarse and the medium mesh, φ 1 and φ 2 are the results from the coarse and the medium mesh, respectively, 1.25 is the safety factor that is adopted when three or more meshes are used, r 21 is the refinement ratio between the coarse and the fine mesh, and p is the order of numerical accuracy, which is 2 in this study. For the GCI between the medium and the fine mesh, the same procedures can be followed.
The results show that for both thrust and torque the GCI values of the fine mesh are lower than that of the medium mesh, which demonstrates that the numerical uncertainty becomes smaller when the mesh is refined. The highest numerical uncertainty is reported within 5.23% and 1.95% for the medium mesh and fine mesh, respectively. Based on the mesh sensitivity study, the fine mesh is used as the final mesh for the present study.
After the grid independence study, the numerical results of the ducted propeller are also compared with experimental data by Wang [11] to validate the CFD model. Figure 5 provides an overview of the comparison between the numerical results from the fine mesh and experimental measurements under different advance coefficients. The former is presented in lines and the latter in dots. The curves show that the thrusts on the propeller and duct are predicted well by the simulations. However, the propeller torque is over predicted, causing a discrepancy with the experimental data. The difference in efficiency is within 5% for all the advance coefficients and a similar discrepancy is found in the research of Pawar [15]. The discrepancy can be attributed to experimental errors during measurements, physical modeling errors as the geometry is generated from the coordinates provided in Wang [11], and the errors caused by the turbulence model. Since the SST k-ω model assumes a fully turbulent boundary layer, which may not be the case on certain parts of the propeller surface as the rotational speed is rather small, this may be the reason for the exaggerated torque prediction.

3. Results and Discussion

In this section, the local and global hydrodynamic characteristics are presented and compared for the DP and the RDT. For all the calculations, the rotational speed of the propeller is kept constant at 10 s−1 and the change of advance coefficient J is achieved by varying the inflow velocity. The Reynolds number, ranging from 6.15 × 10⁵ to 6.42 × 10⁵, is determined based on the chord length of the propeller at 0.75R.

3.1. Open Water Performance

The open water performance comparison between the ducted propeller and the RDT is given in Figure 6, in which the propeller thrust coefficient, Ktp, duct thrust coefficient, Ktn, propeller torque coefficient, Kqp, and overall coefficients, Kt, Kq and efficiency are shown based on the hydrodynamic coefficient definitions as mentioned before. The green curves represent the hydrodynamic coefficients for the ducted propeller and the blue curves for the RDT. For the DP, the total thrust coefficient includes the propeller thrust coefficient and duct thrust coefficient, and the torque coefficient includes the propeller torque coefficient, while, for the RDT, the total thrust and torque coefficient also include an additional term, i.e., the rim coefficient.
From Figure 6a–c, in which the thrust and torque contribution from the rim is excluded for the RDT to make a clear comparison, it can be observed that the propeller thrust coefficient, duct thrust coefficient, and propeller torque coefficient for the RDT are smaller than those for the DP under all advance coefficients. In Figure 6d, it can be seen that with the thrust contribution from the rim, the total thrust coefficient for the RDT is still below the DP. On the other hand, the additional torque of the rim in the RDT makes the torque coefficient of the RDT larger than the one of the DP. The overall effect is that the efficiency of the RDT is significantly lower compared to the DP and the discrepancy increases with an increase in the advance coefficient. The maximum discrepancy is up to almost 0.18 at J = 0.7, and, at the design point, i.e., at J = 0.5, the discrepancy is about 0.15. The efficiency curve is always below 0.4 for the RDT, and in the study of Dubas et al. [16] similar results can be observed, in which a smaller RDT with a diameter of 150 mm was studied and the maximum experimental efficiency was around 0.15, which may suggest that RDTs with small dimensions tend to have a poor performance.
The thrust and torque generated on the propeller are caused by pressure differences across the blades and viscous shear stresses. Table 3 gives an overview of the contribution of pressure and viscosity to the thrust and torque production on the propeller for two extreme off-design points. It can be seen that pressure is the dominant factor in generating both thrust and torque and that the viscous shear is similar for both the ducted propeller and the RDT. The pressure distributions on the propeller’s pressure and suction side are provided in Figure 7. The pressure distribution on the suction side displays a similar pattern except for a small low-pressure region found near the leading edge at the propeller’s tip for the RDT (the propeller is rotating in the anti-clockwise direction in this view). On the pressure side, the main difference can also be found near the leading edge where the location and area of the high-pressure region are slightly different (the propeller is rotating in the clockwise direction in this view).
To quantitatively understand the pressure difference on the propeller surface of the DP and the RDT, the pressure distribution on the blade at various radial cross-sections is presented in Figure 8, in which the pressure coefficient is given as a function of the normalized chord-wise direction z. Coordinate 0 represents the center position of the propeller. It can be observed that the pressure coefficient of the RDT is generally smaller than the one of the ducted propeller at different sections. In addition, the overall pressure difference on the propeller’s pressure and suction sides for the RDT is also smaller compared to the ducted propeller, which explains the lower thrust production. It is noted that for r/R = 0.2 and 0.4, namely the areas near the propeller blade root, the discrepancy for the pressure difference between the pressure and the suction sides is mainly situated near the propeller’s leading edge, where the highest pressure can be found. However, for r/R = 0.6 and 0.8, namely near the propeller’s blade tip, the discrepancy for the pressure difference extends almost along the entire chord length.
To examine the thrust difference on the duct for the DP and the RDT, the pressure distributions at three representative sections along the longitudinal direction of the duct are studied, in which the rim is not included for the RDT. The locations of these sections are situated at the propeller’s leading edge, middle plane, and trailing edge, as indicated in Figure 9a. The figures exhibit the pressure coefficient as a function of position along the duct’s normalized chord-wise direction, where position 0 corresponds to the location of the propeller. It can be seen that the pressure distribution on the duct’s exterior side is nearly the same for both the DP and the RDT and that the pressure discrepancy is mainly situated on the interior side of the duct. Near the leading edge, the pressure difference between the DP and the RDT is not so obvious; however, at the middle plane and the trailing edge, the pressure difference for the ducted propeller is significantly larger than that of the RDT, resulting in a larger thrust. It can also be noted that at the interior side of the duct there are two sudden changes in pressure, which are caused by the rim gap. There is always a steep change in pressure near the blade location (Coordinate 0) for the DP because of the huge pressure gradient between the propeller’s pressure and suction sides. However, for the RDT, the pressure gradient in the rim gap along the axial direction remains almost constant, which is expected for Couette flow.

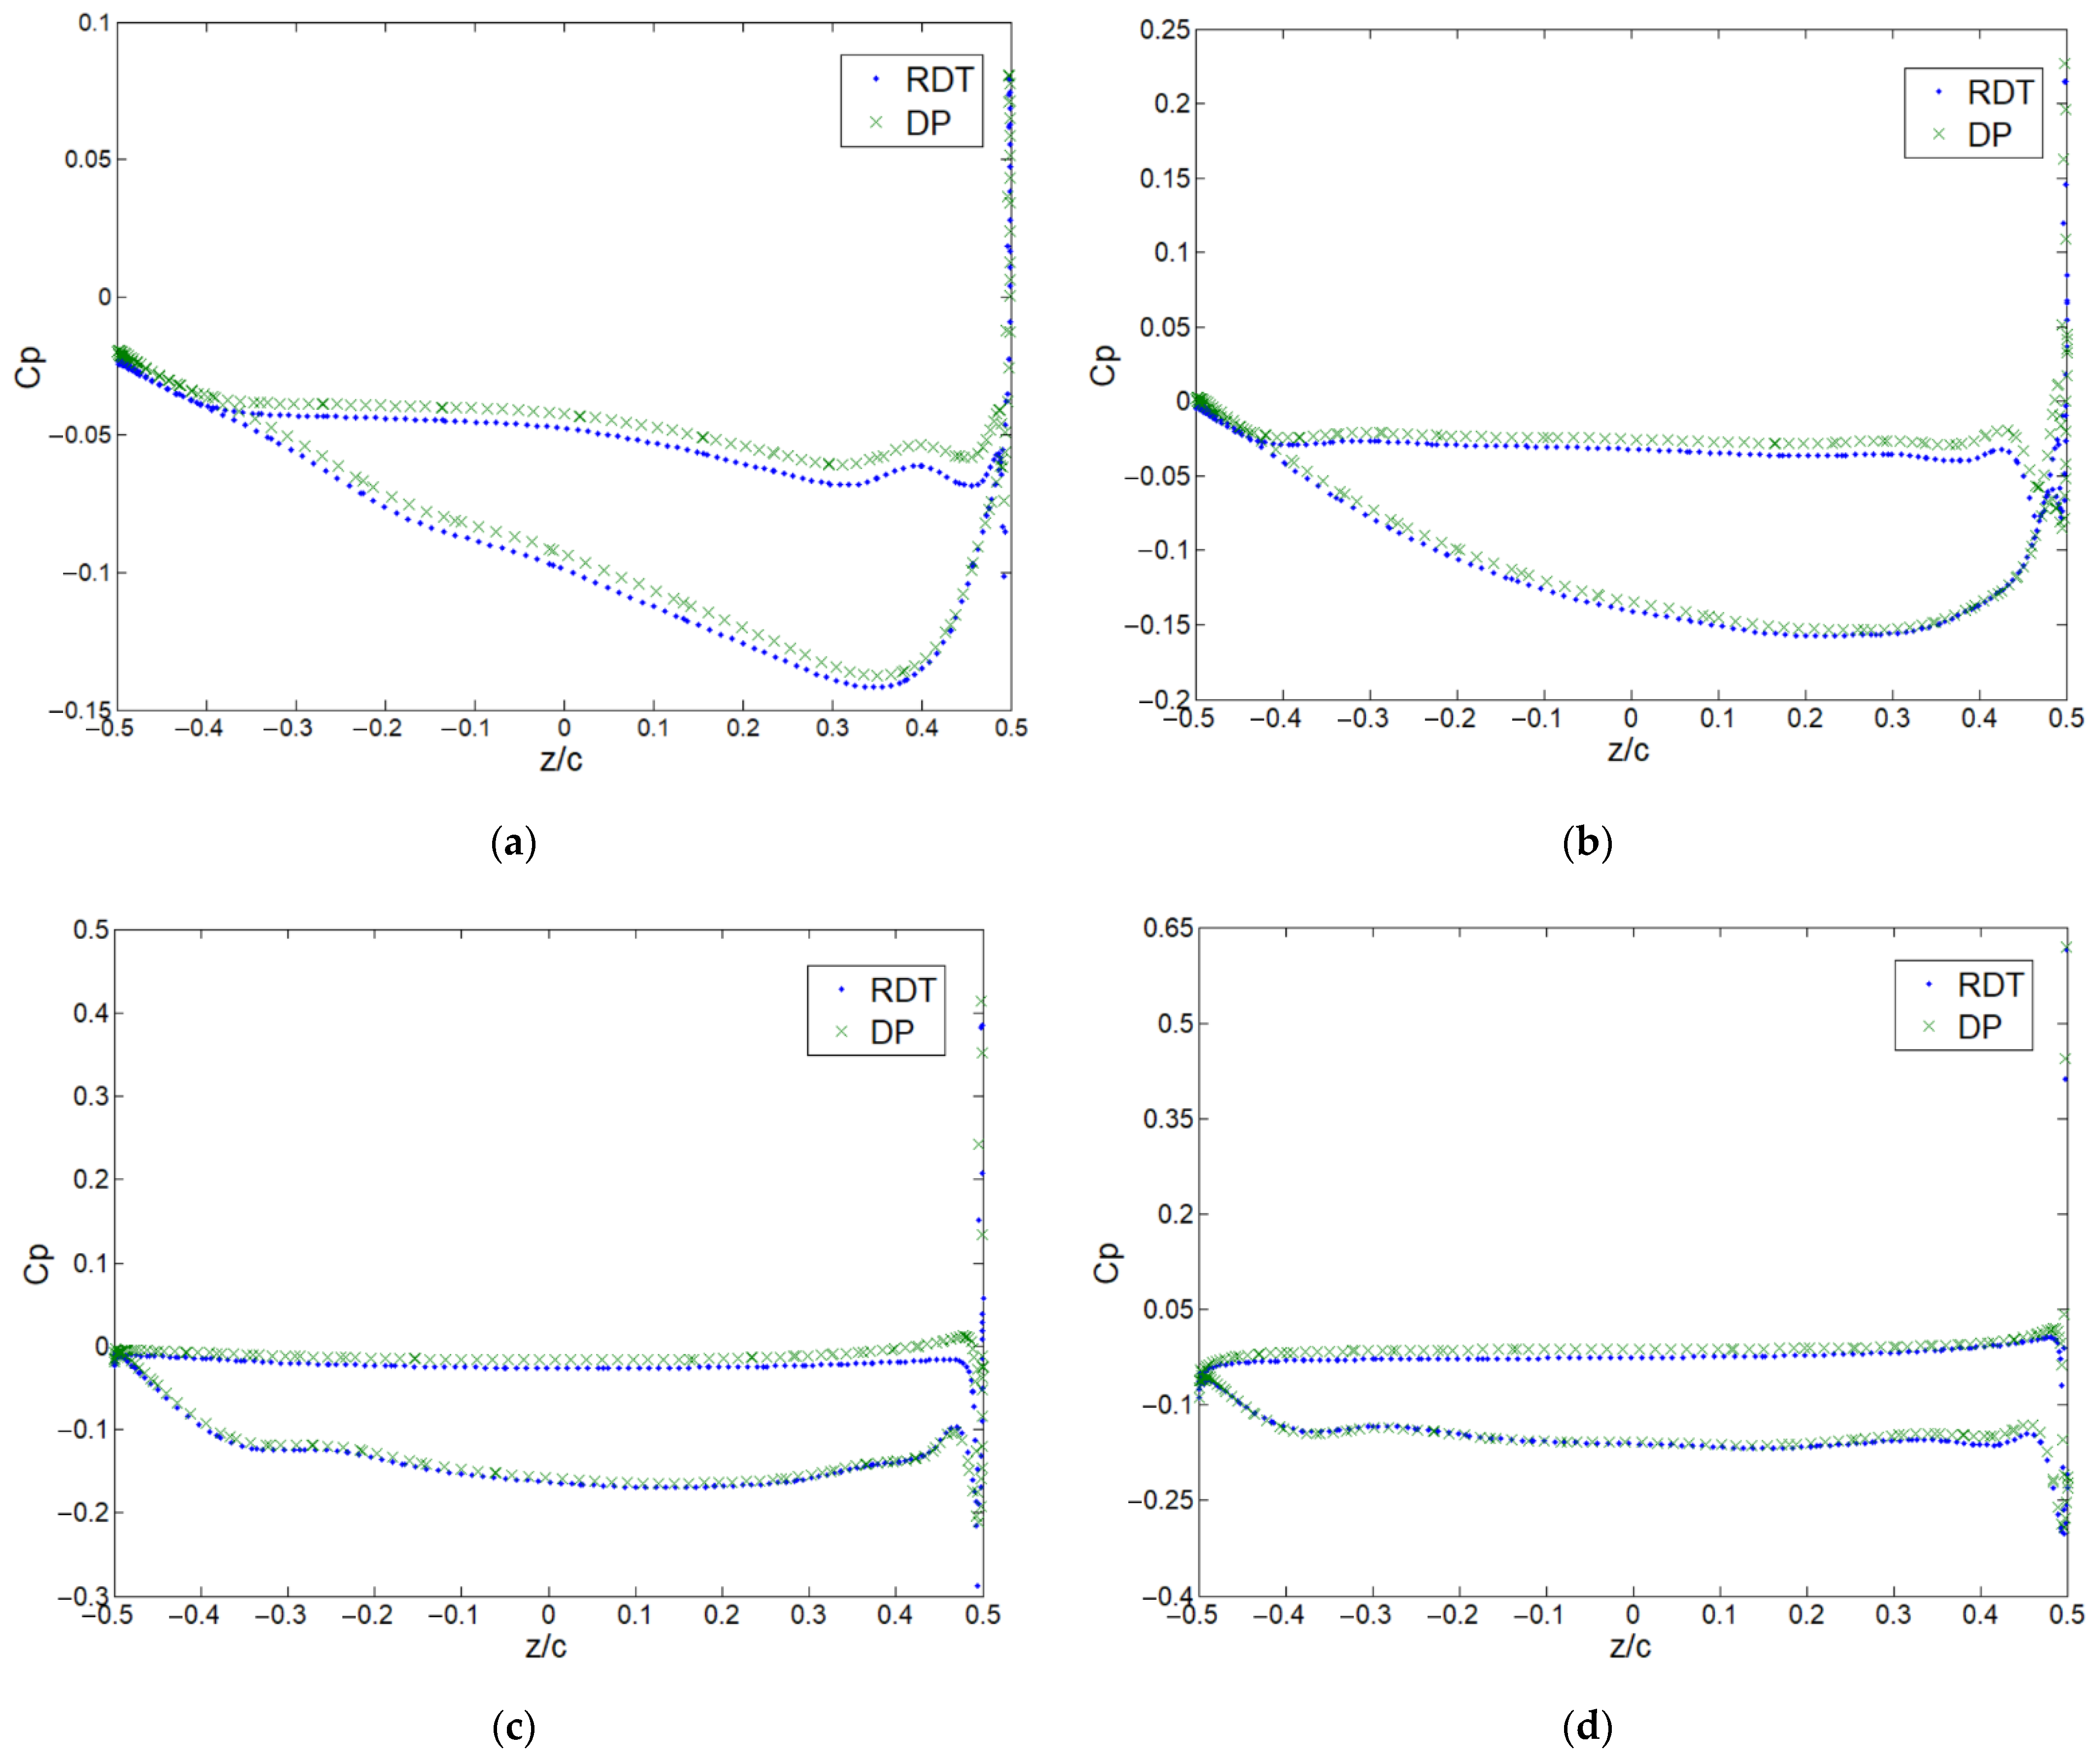
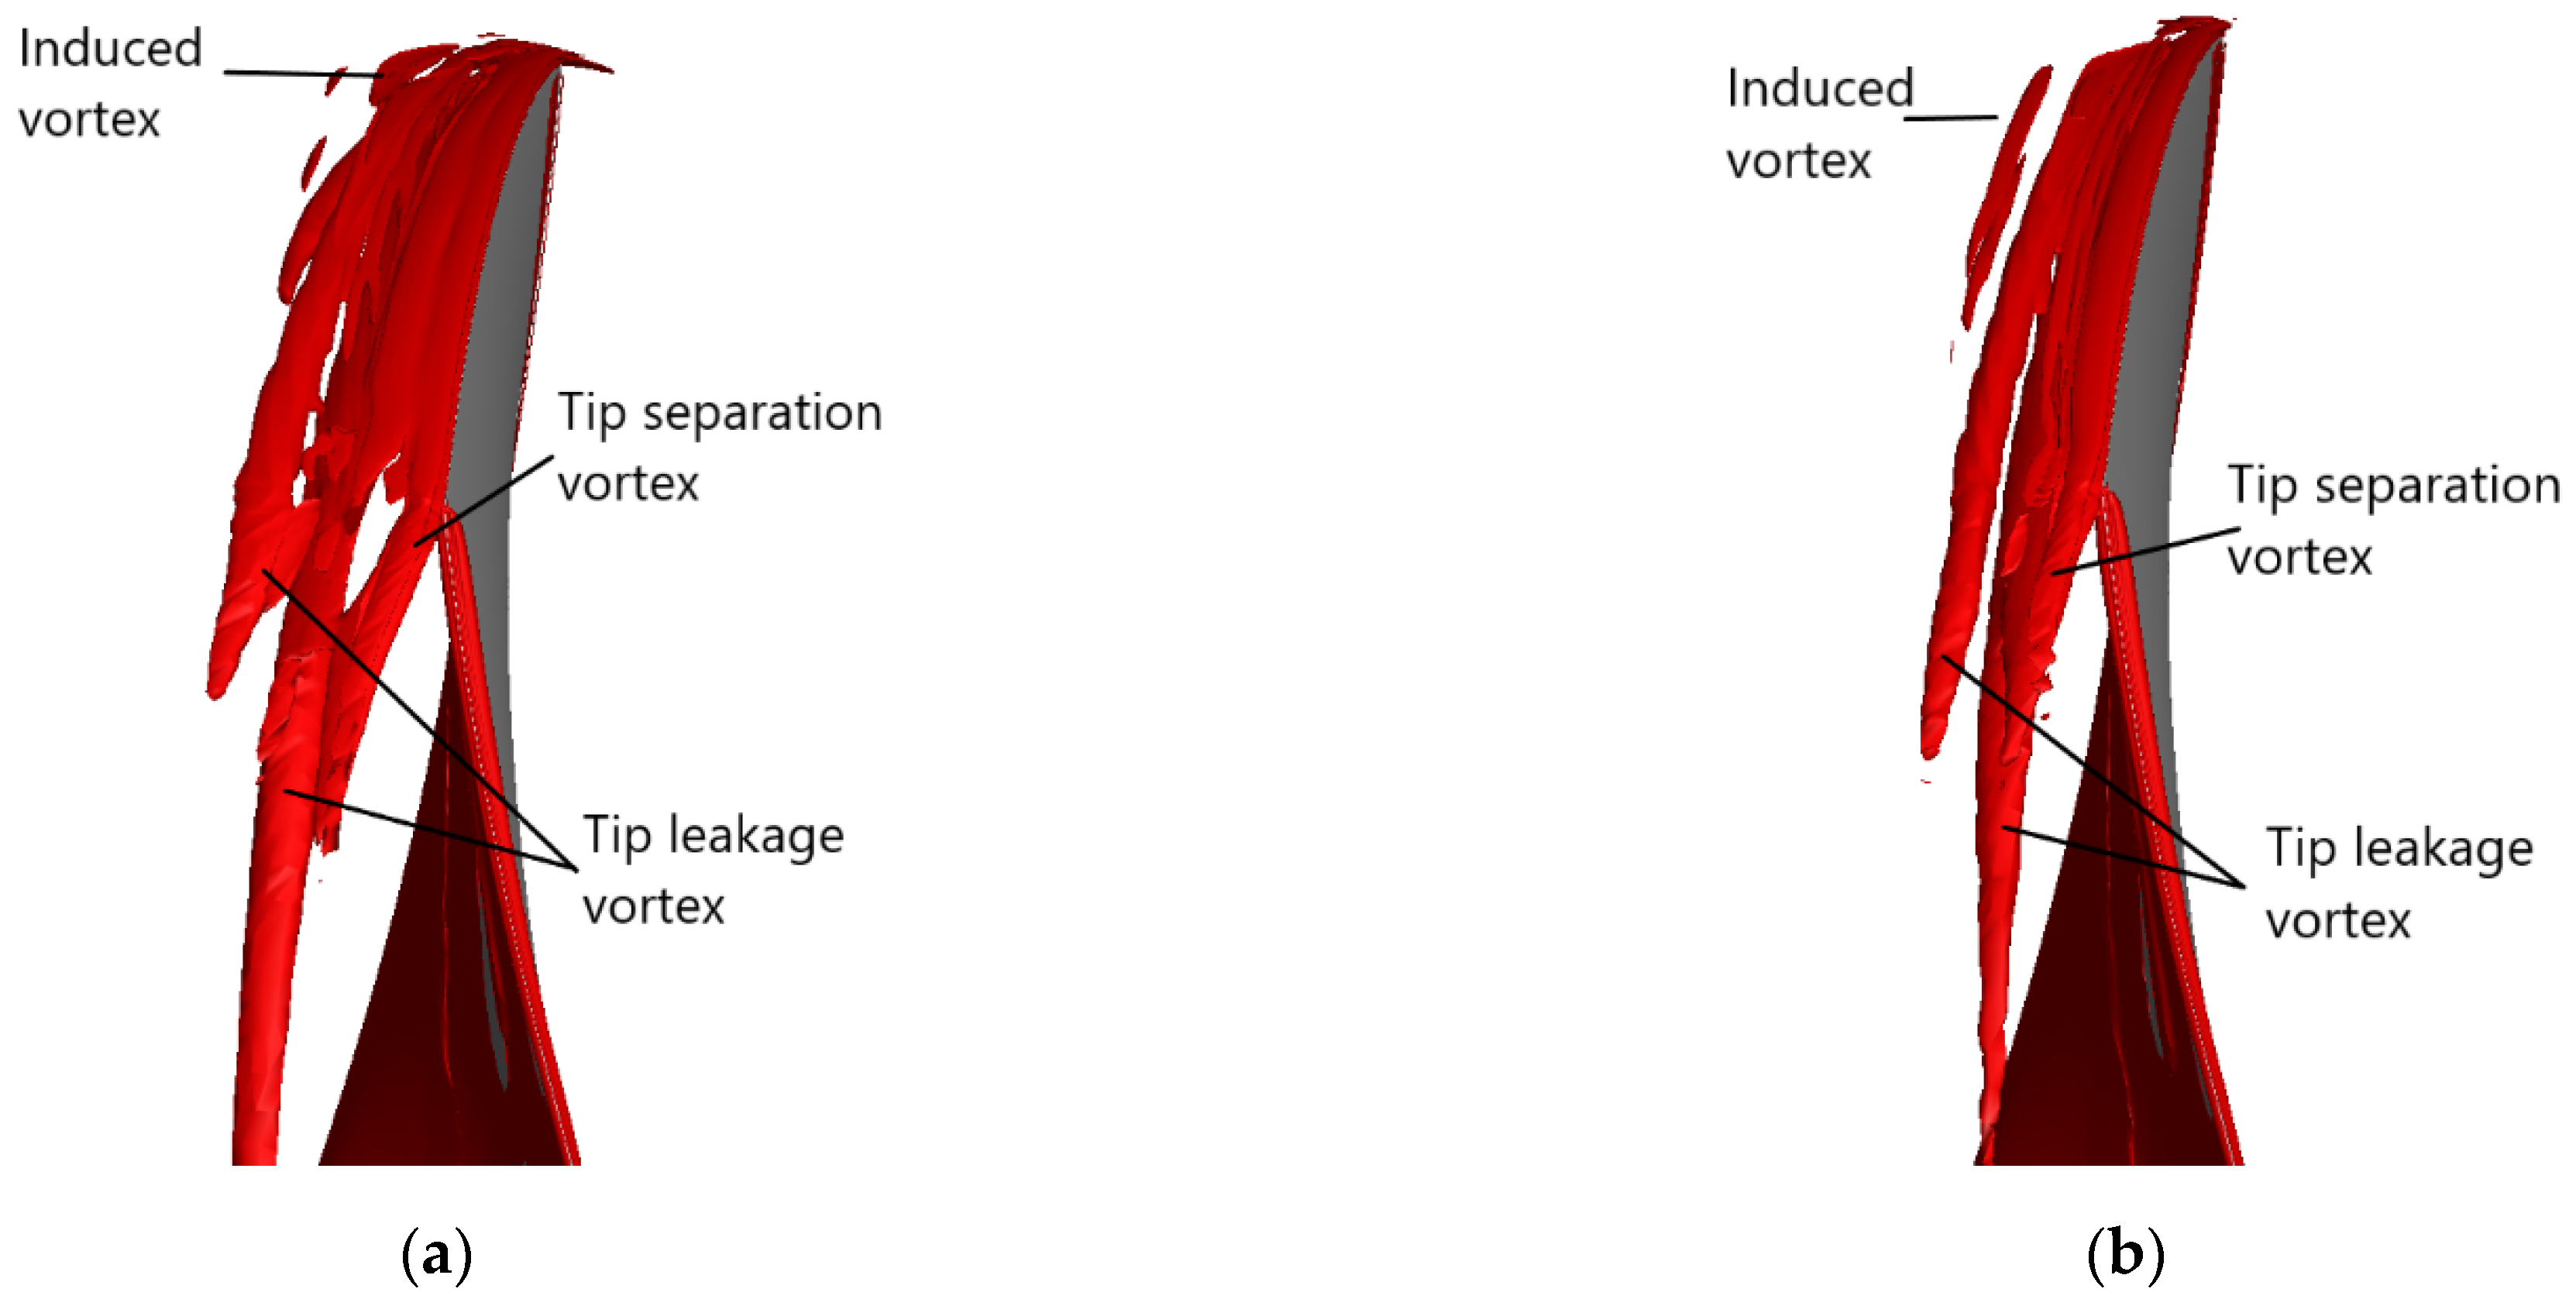
3.2. Tip Leakage Flow in the Ducted Propeller

The tip clearance between the propeller tip and the duct inner wall is necessary for the regular operation of the DP. However, it can pose some flow features, such as complicated vortical structures, which are usually undesirable. These vortical structures are often generated by the tip leakage flow and its interaction with surrounding boundaries and can cause rotational instabilities and blockage in the flow passage, which affects the overall performance [17].
Figure 10 displays the velocity vector field at the blade tip region with the pressure contours as background for the DP and the RDT at J = 0.1 and J = 0.5 at Sec-M, as defined in Figure 9a. It is shown in Figure 10a,b that when approaching the tip clearance region, the boundary layer on the duct’s inner surface starts to separate due to an adverse pressure gradient, and the separation occurs earlier at J = 0.1 than at J = 0.5, as a heavier loading condition means a larger pressure gradient. On the other hand, the flow on the propeller tip separates at the pressure side of the propeller and interacts with the separated boundary layer on the duct’s interior side. It can be clearly observed that vortical structures are formed in this region and, with increasing fluid momentum, these vortices are forced to move to the propeller suction side and become smaller. In contrast, as shown in Figure 10c,d, the flow field near the blade tip for the RDT is less complex.
According to their features, You [17] roughly classified vortical structures into three categories, namely the tip leakage vortex, the tip separation vortex, and the induced vortex. The tip leakage vortex is strongly influenced by the pressure difference between the propeller’s pressure and suction sides, and the induced vortex is generated alongside the predominant tip leakage vortex. The tip separation vortex is formed by the separated flow from the propeller tip. As a result, these vortical structures interact with each other and cause viscous loss in development, which influences the performance of the propeller.
The Q-criterion for vortex identification [18] is introduced to help visualize the vortical structures in the tip gap flow. Figure 11 displays the three characteristic vortical structures at J = 0.1 and J = 0.5. As expected, the vortex scale at J = 0.5 is smaller than the one at J = 0.1, and it can also be observed that in the downstream direction from the trailing edge the tip separation vortex starts to interact with the tip leakage vortex.

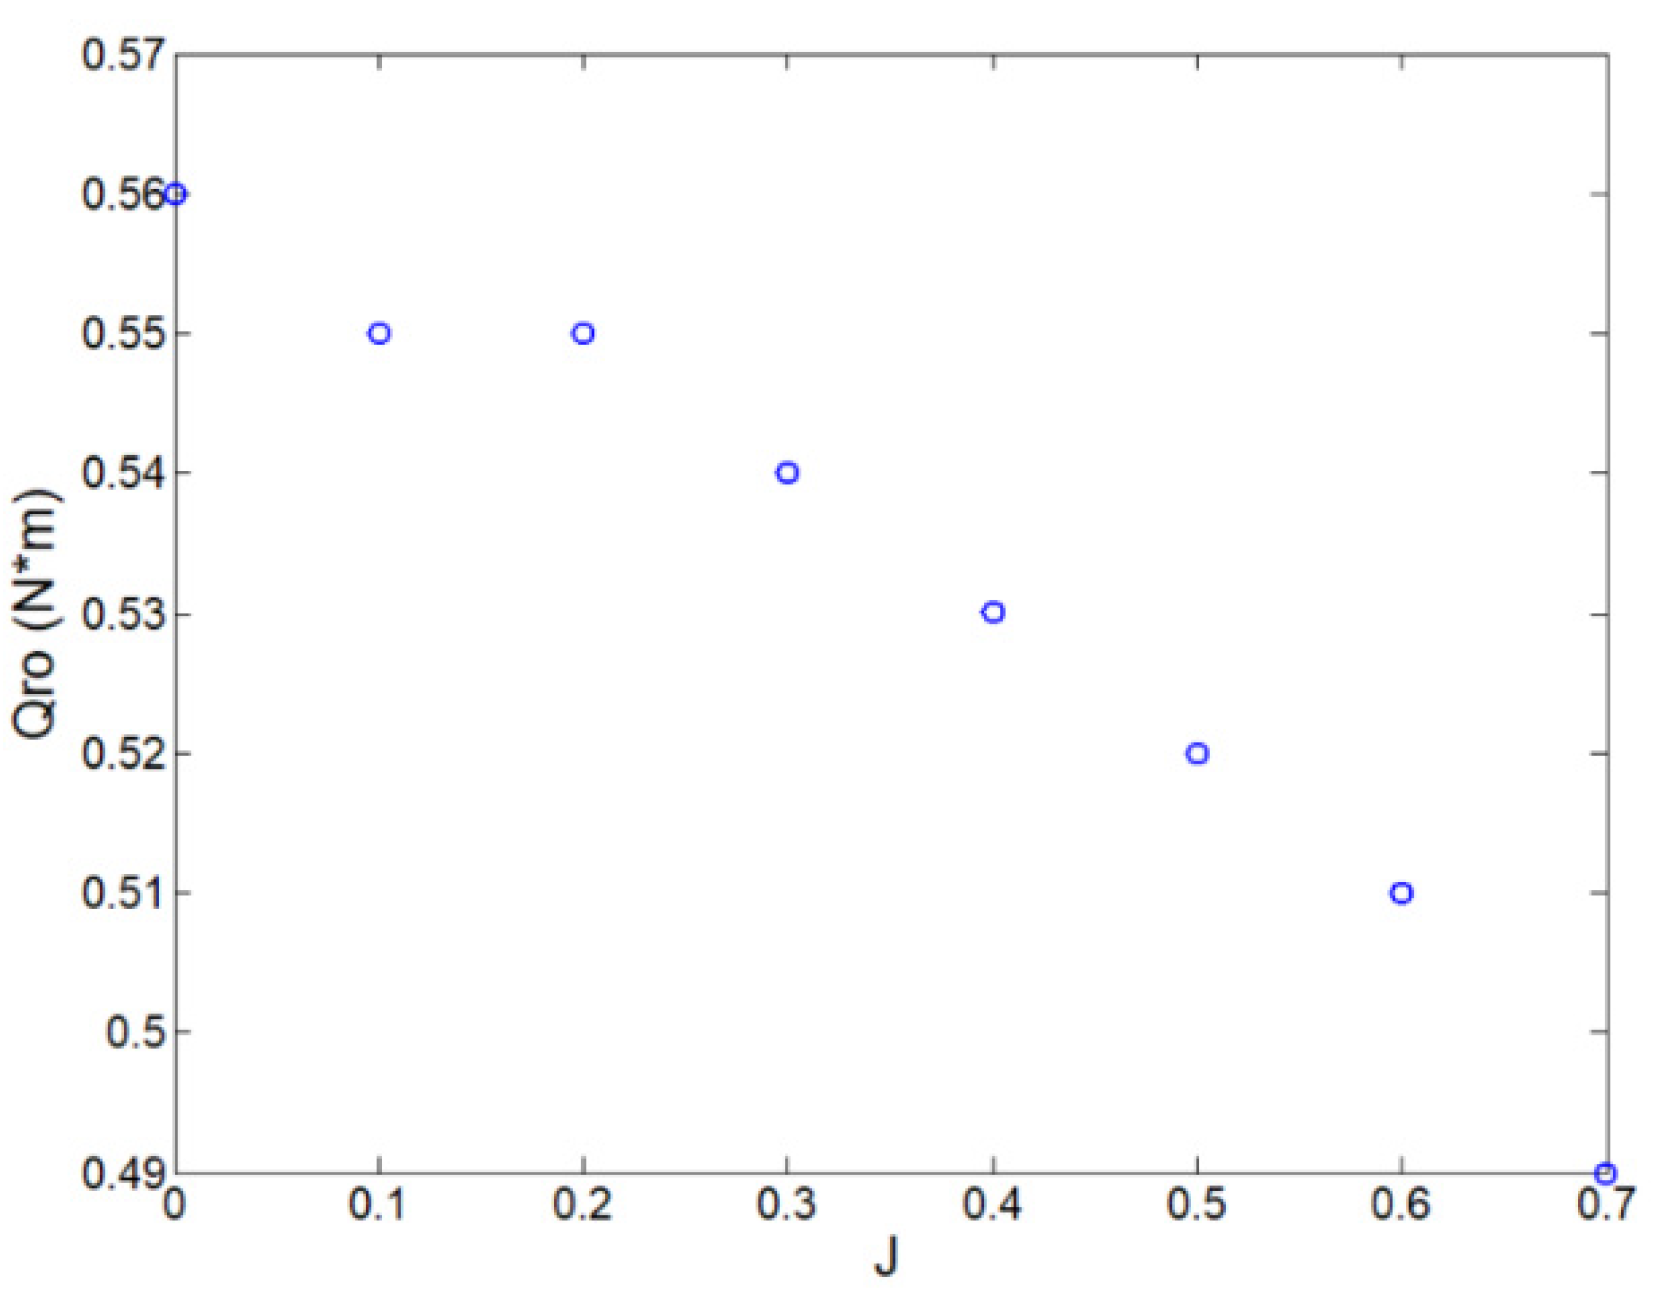
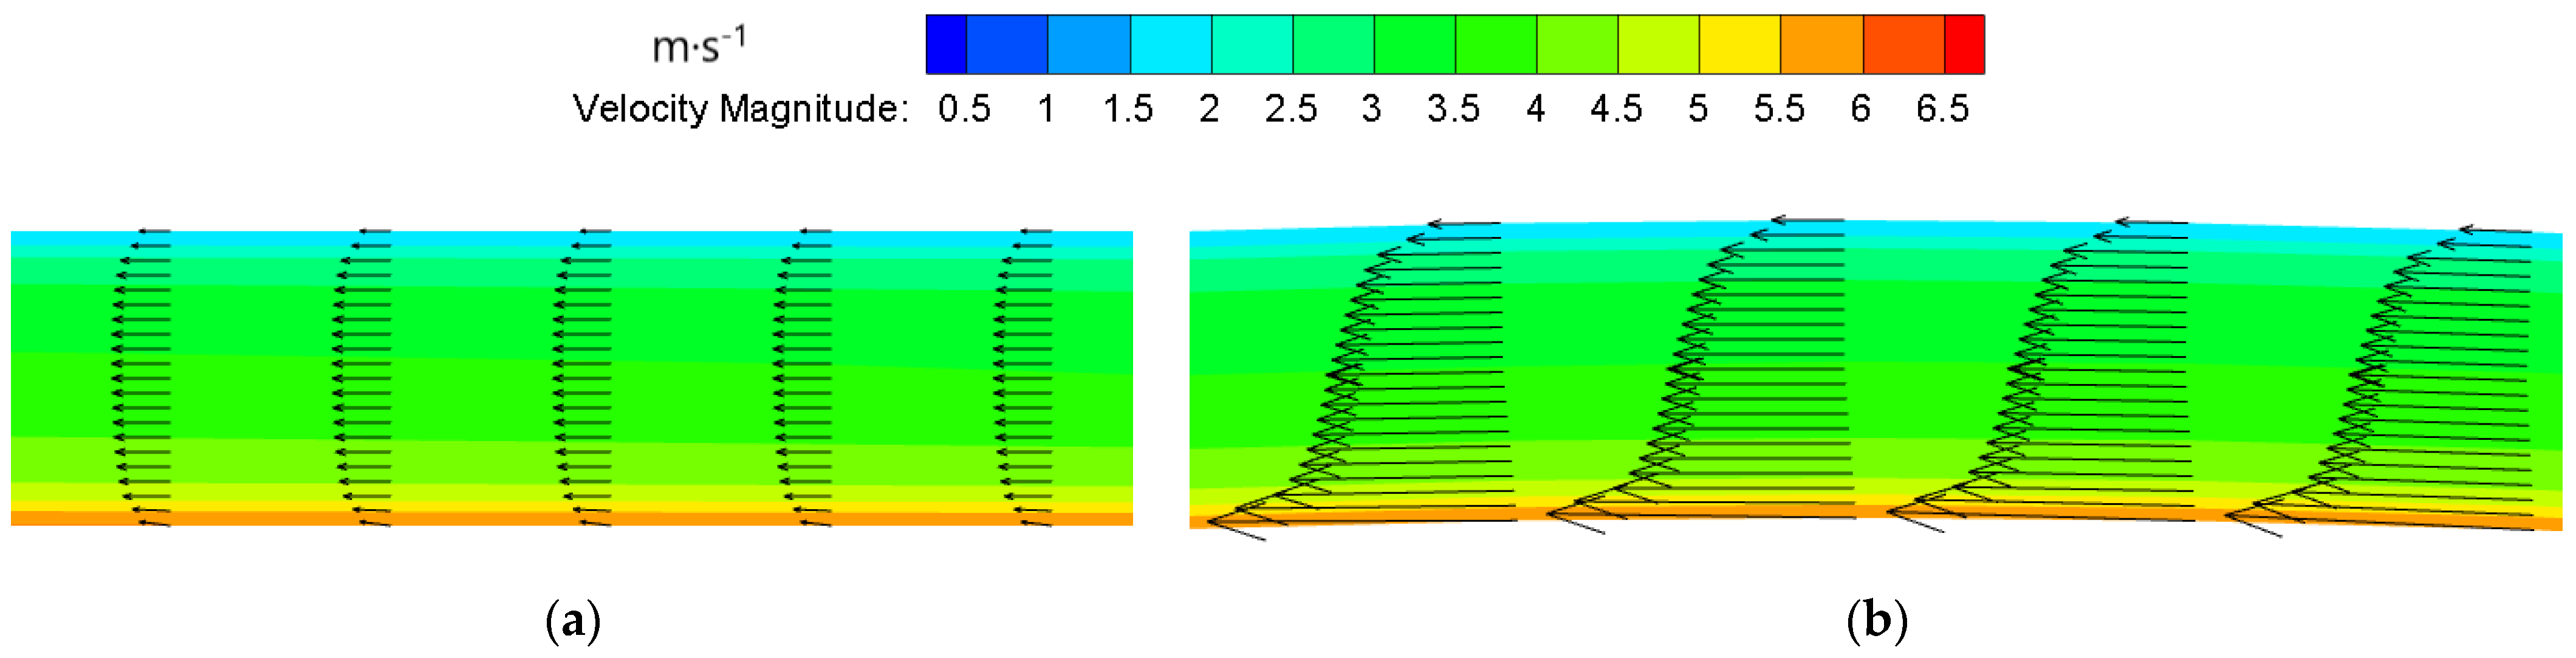
3.3. Gap Flow in the RDT

There is no tip leakage flow in the RDT as no tip clearance exists between the propeller tip and duct. However, the gap formed by the rim surface and duct interior surface in the RDT can cause interesting flow phenomena as well. The gap flow in the RDT resembles the flow of a viscous fluid between two concentric cylinders, with one rotating and the other one static. The major influence of the gap on the flow field is the creation of a significant friction torque, which is mainly related to the width of the gap, the dimensions of the inner cylinder, and the Reynolds number of the gap flow. In the work of Bilgen and Boulos [19], empirical formulations for the torque coefficient for a flow without an axial pressure gradient were developed based on experimental results. As the flow regime changes from laminar to turbulent flow at different working conditions, the functional relation for the torque coefficient has to be adjusted. Therefore, only the formulas applied to the present work are considered and are listed as follows:
Re r = ρ ω R i ( R o R i ) μ
C M r = 0.065 ( R o R i R i ) 0.3 Re r 0.2   ( Re r > 10 4 )
M r = 0.5 π ρ ω 2 R i 4 L C M r
where Re r is the Reynolds number for the radial gap, ρ is the fluid density,   ω is the angular velocity, R i is the radial gap inner radius, R o is the radial gap outer radius, R o R i is the gap width, μ is the dynamic viscosity, C M r is the torque coefficient, M r is the torque of the radial gap, and L is the length of the rim. A comparison of the torque coefficient between the simulations in this paper and the empirical method in Equations (9)–(11) is provided in Table 4. It can be seen that the torque calculated by the empirical formulas is smaller than the one of the numerical simulations. This may be attributed to the existence of an axial pressure gradient, as it was also observed in the study of Cao [20] that the rim torque with a pressure gradient was larger than without. It is assumed that the interaction between the radial gap flow and axial gap flow is enhanced by the pressure gradient, which makes the flow regime more complex, resulting in the production of a larger torque.
In the study of Yamada [21], the effects of the axial pressure gradient on the torque coefficient were examined under different working conditions. It was found that when the characteristic Reynolds number for the axial pressure gradient is above 5 × 10³ the torque coefficient increases steadily with the increase in the pressure gradient. In the present study, the Reynolds number is much higher than the critical value, and the corresponding results are observed, as shown in Figure 12. When the propeller loading is heavy, as mentioned above, the pressure difference is more significant and the rim torque, due to gap flow, is larger.
The velocity profile in the gap along the axial and tangential direction is shown in Figure 13. A small velocity gradient with respect to the wall is observed near the rim outer surface, which is caused by the centrifugal force as the rim rotates. In the axial direction, the flow is pressure driven and due to the location of the rim ends the flow runs in the opposite direction to the main flow. However, the velocity profile in the tangential direction is quite different from the one in the axial direction; the flow is viscosity based, as the influence of the pressure difference along this direction is insignificant compared to the shear stress.
From Table 5, the contribution of pressure and viscosity to the torque production on the propeller and rim are quite distinct. For the propeller, the pressure is dominant and contributes nearly 90% to the total torque, while the viscous stress is almost fully responsible for the torque generation on the rim, which coincides with the observation in Figure 12b.

4. Conclusions

The present work compares the hydrodynamic performance of a DP and an RDT with the same flow configuration, i.e., a Ka-47 propeller inside a 19A duct by CFD. Three sets of meshes are generated to perform a mesh sensitivity analysis and, based on the results, the fine mesh is used for the study as more detailed flow features can be resolved. Steady-state simulations are carried out for the DP and the RDT with the MRF approach handling the rotational movement of the propeller. The open water performance and the main flow features of the DP and the RDT are presented. From the results, the DP has an overall better performance than the RDT. The propeller’s thrust and duct thrust coefficients of the ducted propeller are larger than those of the RDT under all considered advance coefficients. However, in the RDT, the existence of the rim and induced gap flow has much more detrimental than beneficial effects on the hydrodynamic performance of the RDT, resulting in a significant decrease in efficiency compared to the DP. Therefore, it is important to carefully choose appropriate parameters for the gap for the consideration of performance improvement. The loss caused by the rim can be roughly evaluated with existing empirical formulas; however, due to over-simplification of the actual flow, the calculated results are underestimated.
The tip leakage flow is an important phenomenon in the DP. Complicated flow features can be caused by mixing of the main flow and the pressure-induced flow. In the tip clearance region, the interaction between the boundary layer of the duct’s interior side and the propeller tip greatly promotes the formation of vortical structures. Three characteristic vortices are identified with the Q-criterion, namely the tip leakage vortex, tip separation vortex, and the induced vortex. On the other hand, the gap flow in the RDT is also representative. By investigating the velocity profile in the gap, the flow in the gap is dominated by pressure differences in the axial direction and is shear stress based in the tangential direction.

Author Contributions

Conceptualization, B.L. and M.V.; methodology, B.L.; software, M.V.; validation, B.L. and M.V.; formal analysis, B.L.; investigation, B.L.; resources, B.L. and M.V.; data curation, B.L.; writing—original draft preparation, B.L.; writing—review and editing, M.V.; visualization, B.L.; supervision, M.V.; project administration, M.V.; funding acquisition, M.V. All authors have read and agreed to the published version of the manuscript.

Funding

The authors thank the China Scholarship Council (CSC) for their financial support for the first author (Grant No. 201806950010).

Data Availability Statement

Data will be available upon request.

Acknowledgments

The computational resources and services used in this work were provided by the VSC (Flemish Supercomputer Center), funded by the Research Foundation—Flanders (FWO) and the Flemish Government—Department EWI.

Conflicts of Interest

The authors declare no conflict of interest.

References

  1. Tan, W.Z.; Yan, X.P.; Liu, Z.L. Technology development and prospect of shaftless rim-driven propulsion system. J. Wuhan Univ. Technol. Transp. Sci. Eng. 2015, 39, 601–605. [Google Scholar]
  2. Yan, X.P.; Liang, X.X.; Ouyang, W.; Liu, Z.L.; Liu, B.; Lan, J.F. A review of progress and applications of ship shaft-less rim-driven thrusters. Ocean Eng. 2017, 144, 142–156. [Google Scholar] [CrossRef]
  3. Sharkh, S.M.; Lai, S.H. Slotless PM brushless motor with helical edge-wound laminations. IEEE Trans. Energy Convers. 2009, 24, 594–598. [Google Scholar] [CrossRef]
  4. Shen, Y.; Hu, P.F.; Jin, S.B.; Wei, Y.S.; Lan, R.S.; Zhuang, S.J.; Zhu, H.; Cheng, S.W.; Chen, J.Q.; Wang, D.; et al. Design of novel shaftless pump-jet propulsor for multi-purpose long-range and high-speed autonomous underwater vehicle. IEEE Trans. Magn. 2016, 52, 7. [Google Scholar] [CrossRef]
  5. Abu Sharkh, S.M.; Turnock, S.R.; Draper, G. Performance of a tip-driven electric thruster for unmanned underwater vehicles. In Proceedings of the Eleventh International Offshore and Polar Engineering Conference, Stavanger, Norway, 17–22 June 2001. [Google Scholar]
  6. Cai, M.J.; Yang, C.J.; Wu, S.J.; Zhu, Y.S.; Xie, Y. Hydrodynamic Analysis of a Rim-Driven Thruster Based on RANS Method. In Proceedings of the OCEANS 2015—MTS/IEEE Washington, Washington, DC, USA, 19–22 October 2015; pp. 1–5. [Google Scholar]
  7. Zhang, S.; Zhu, X.; Zhou, Z.L. Hydrodynamic performance analysis of hubless rim-driven propulsors. Appl. Mech. Mater. 2013, 256, 2565–2568. [Google Scholar] [CrossRef]
  8. Cao, Q.M.; Zhao, W.F.; Tang, D.H.; Hong, F.W. Effect of gap flow on the torque for blades in a rim driven thruster without axial pressure gradient. ICFM7. Procedia Eng. 2015, 126, 680–685. [Google Scholar] [CrossRef] [Green Version]
  9. Cao, Q.M.; Hong, F.W.; Tang, D.H.; Hu, F.L.; Lu, L.Z. Prediction of loading distribution and hydrodynamic measurements for propeller blades in a rim driven thruster. J. Hydrodynam. 2012, 24, 50–57. [Google Scholar] [CrossRef]
  10. Oosterveld, M.W.C. Wake Adapted Ducted Propellers; H. Veenman & Zonen: Wagensingen, Holland, 1970. [Google Scholar]
  11. Wang, K.C.; Liu, H.Y.; Tsao, M.L.; Chu, H.H. Ducted Propellers with Simplified Duct Profile. J. Shipbuild. China 1978, 9, 63. [Google Scholar]
  12. Moukalled, F.; Mangani, L.; Darwish, M. The Finite Volume Method in Computational Fluid Dynamics; Springer: Berlin/Heidelberg, Germany, 2016; Volume 113. [Google Scholar]
  13. Menter, F.R. Two-equation eddy-viscosity turbulence models for engineering applications. AIAA J. 1994, 32, 1598–1605. [Google Scholar] [CrossRef] [Green Version]
  14. Celik, I.B.; Ghia, U.; Roache, P.J.; Freitas, C.J. Procedure for estimation and reporting of uncertainty due to discretization in CFD applications. J. Fluids Eng. 2008, 130, 078001. [Google Scholar]
  15. Pawar, S.; Brizzolara, S. Relevance of transition turbulent model for hydrodynamic characteristics of low Reynolds number propeller. Appl. Ocean Res. 2019, 87, 165–178. [Google Scholar] [CrossRef] [Green Version]
  16. Dubas, A.J.; Bressloff, N.W.; Sharkh, S.M. Numerical modelling of rotor–stator interaction in rim driven thrusters. Ocean Eng. 2015, 106, 281–288. [Google Scholar] [CrossRef] [Green Version]
  17. You, D.; Wang, M.; Moin, P.; Mittal, R. Large-eddy simulation analysis of mechanisms for viscous losses in a turbomachinery tip-clearance flow. J. Fluid Mech. 2007, 586, 177–204. [Google Scholar] [CrossRef] [Green Version]
  18. Jeong, J.; Hussain, F. On the identification of a vortex. J. Fluid Mech. 1995, 285, 69–94. [Google Scholar] [CrossRef]
  19. Bilgen, E.; Boulos, R. Functional dependence of torque coefficient of coaxial cylinders on gap width and Reynolds numbers. J. Fluids Eng. 1973, 95, 122–126. [Google Scholar] [CrossRef]
  20. Cao, Q.M.; Wei, X.Z.; Tang, D.H.; Hong, F.W. Study of gap flow effects on hydrodynamic performance of rim driver thrusters with/without pressure difference. Chin. J. Hydrodynam. 2015, 30, 485–494. [Google Scholar]
  21. Yamada, Y. Torque resistance of a flow between rotating co-axial cylinders having axial flow. Bull. JSME 1962, 5, 634–642. [Google Scholar] [CrossRef] [Green Version]
Figure 1. Schematic layout of an RDT.
Applsci 11 04919 g001
Figure 2. Geometrical models of (a) the ducted propeller and (b) the RDT.
Applsci 11 04919 g002
Figure 3. Computational domain: (a) overall mesh; (b) boundary conditions.
Applsci 11 04919 g003
Figure 4. Mesh distribution: (a) surface mesh on duct, propeller, and hub; (b) volume mesh.
Applsci 11 04919 g004
Figure 5. Validation of the numerical model in this study by the experimental results of Wang et al. [11] for the ducted propeller.
Applsci 11 04919 g005
Figure 6. Open water performance comparison between the ducted propeller (DP) and the RDT: (a) propeller thrust coefficient; (b) duct thrust coefficient; (c) propeller torque coefficient; (d) overall coefficient.
Applsci 11 04919 g006
Figure 7. Comparison of the pressure distribution on the propeller’s (a) suction side for the DP, (b) suction side for the RDT, (c) pressure side for the DP, and (d) pressure side for the RDT at J = 0.1.
Applsci 11 04919 g007
Figure 8. Comparison of the pressure distribution on the blade’s radial cross-sections at: (a) r/R = 0.2; (b) r/R = 0.4; (c) r/R = 0.6; and (d) r/R = 0.8 at J = 0.1.
Applsci 11 04919 g008
Figure 9. The locations of the different sections on the duct (a) and comparisons of pressure distributions in the section at the propeller’s (b) leading edge (Sec-L), (c) middle plane (Sec-M), and (d) trailing edge (Sec-T) between the RDT and the ducted propeller (DP) at J = 0.1.
Applsci 11 04919 g009
Figure 10. Velocity fields near the blade tip for: (a) DP at J = 0.1; (b) DP at J = 0.5; (c) RDT at J = 0.1; and (d) RDT at J = 0.5.
Applsci 11 04919 g010
Figure 11. Vortical structures along the propeller tip region at (a) J = 0.1 and (b) J = 0.5.
Applsci 11 04919 g011
Figure 12. Torque of the rim under different loading conditions.
Applsci 11 04919 g012
Figure 13. Velocity distribution in the gap along the (a) axial direction and (b) tangential direction.
Applsci 11 04919 g013
Table 1. Geometric details for the ducted propeller and the RDT used in this study.
ParameterUnitValue
Number of blades-4
Blade diameterm0.25
Blade area ratio-0.7
Blade pitch ratio-1.0
Duct type-19A
Propeller type-Ka
Table 2. Discretization error estimation using the GCI.
Mesh DensityTotal Cells
(Million)
Refinement Ratio rJ = 0.1J = 0.5
Ktp/KqGCI (%)
Ktp/Kq
Ktp/KqGCI (%)
Ktp/Kq
Coarse5.02-0.257/0.0456-0.170/0.0334-
Medium9.791.250.262/0.04654.32/4.390.174/0.03405.23/3.19
Fine19.61.260.263/0.04610.86/1.950.175/0.03371.22/1.88
Table 3. Contribution of pressure and viscosity to the thrust and torque on the propeller.
Advance CoefficientContributorDPRDT
Thrust (N)Torque (N·m)Thrust (N)Torque (N∙m)
J = 0.1Pressure97.413.8790.53.56
Viscous−2.050.43−1.990.4
J = 0.7Pressure46.572.0141.451.83
Viscous−2.160.44−2.110.41
Table 4. Comparison of the rim torque coefficient between empirical correlations and simulations.
MethodsKtr × 102
Numerical0.57
Empirical0.37
Table 5. Contribution of pressure- and viscosity-based torque on the propeller and rim.
J = 0Propeller (N∙m)Rim (N∙m)
Pressure3.6≈0
Viscosity0.41.2
Publisher’s Note: MDPI stays neutral with regard to jurisdictional claims in published maps and institutional affiliations.

