Article

Hydrodynamical and Hydrochemical Assessment of Pumped-Storage Hydropower (PSH) Using an Open Pit: The Case of Obourg Chalk Quarry in Belgium

by
Angélique Poulain
1,*,
Estanislao Pujades
2,* and
Pascal Goderniaux
3
1
UMR EMMAH Environnement Méditerranéen et Modélisation des Agro-Hydrosystèmes, University of Avignon, 84000 Avignon, France
2
Institute of Environmental Assessment and Water Research (IDAEA), Severo Ochoa Excellence Center of the Spanish Council for Scientific Research (CSIC), Jordi Girona 18–26, 08034 Barcelona, Spain
3
Geology and Applied Geology, Polytech Mons, University of Mons, 7000 Mons, Belgium
*
Authors to whom correspondence should be addressed.
Appl. Sci. 2021, 11(11), 4913; https://doi.org/10.3390/app11114913
Submission received: 9 April 2021 / Revised: 12 May 2021 / Accepted: 21 May 2021 / Published: 27 May 2021
(This article belongs to the Special Issue Advances in Underground Energy Storage for Renewable Energy Sources)

Abstract

:
Pumped storage hydropower (PSH) enables the temporary storage of energy, including from intermittent renewable sources, and provides answers to the difficulties related to the mismatch between supply and demand of electrical energy over time. Implementing a PSH station requires two reservoirs at different elevations and with large volumes of water. The idea of using old, flooded open-pit quarries as a lower reservoir has recently emerged. However, quarries cannot be considered as impervious reservoirs, and they are connected to the surrounding aquifers. As a result, PSH activities may entail environmental impacts. The alternation of the pumping–discharge cycles generates rapid and periodic hydraulic head fluctuations in the quarry, which propagate into the surrounding rock media forcing the exchange of water and inducing the aeration of groundwater. This aeration can destabilize the chemical balances between groundwater and minerals in the underground rock media. In this study, two numerical groundwater models based on the chalk quarry of Obourg (Belgium) were developed considering realistic pumping–discharge scenarios. The aim of these models was to investigate the hydrodynamic and hydrochemical impact of PSH activities on water inside the quarry and in the surrounding rock media. Results showed that (1) water exchanges between the quarry and the adjacent rock media have a significant influence on the hydraulic head, (2) the frequency of the pump–discharge scenarios influence the potential environmental impacts, and (3), in the case of chalk formations, the expected impact of PSH on the water chemical composition is relatively limited around the quarry. Results highlight that those hydrogeological and hydrochemical concerns should be assessed when developing a project of a PSH installation using a quarry as a lower reservoir, considering all particularities of the proposed sites.

1. Introduction

The development and use of renewable energies involve the necessity to temporarily store the energy because of their intermittence [1]. In this context, pumped storage hydropower (PSH) appears an efficient way to store and produce large amounts of electricity that can be used in combination with intermittent renewable energies [1,2]. PSH consists of two large water reservoirs, with a difference in elevation between them. The general principle is to pump water from the lower reservoir to the upper one when the demand of electricity is low. Later, during peak demand, water stored in the upper reservoir is discharged into the lower reservoir through turbines to produce electricity. The flexibility of this system allows the regulation of the supply and demand of electricity at the daily scale. Usually, the reservoirs are artificial, which has the advantage of offering a certain freedom in terms of plant sizing, volumes, and/or location. However, these constructions are also extremely expensive. In addition, in countries with a gentle relief, such as Belgium, potential locations allowing a significant difference in level between the two reservoirs are sometimes difficult to find. Therefore, the possibility of using old flooded mines and quarries for constructing PSH plants [3] and regulating local power grids [4,5,6] has been considered. The implementation of these systems would allow a better management of intermittent local renewable energy production by coupling them with wind and/or photovoltaic systems [2]. The flooded mines and quarries are in continuous interaction with the water contained in the surrounding aquifer systems, both quantitatively and qualitatively. Therefore, pumping and discharging large volumes of water into the lower reservoir can (1) modify the hydraulic head in the quarry and the adjacent aquifer systems impacting on the environment [7] and on the system efficiency [8] and (2) alter the hydrogeochemical balances, and thus, the water quality [9]. The induced hydrodynamic and hydrochemical changes must be compatible with the natural functions observed and established on and around the PSH site. Similarly, these changes should not negatively affect other activities undertaken near to the quarry, such as drinking water pumping stations. Thus, preliminary hydrodynamic and hydrochemical studies must be developed to avoid unexpected and undesired impacts.
To date, few studies have been carried out about water hydrochemistry issues in former quarries that are now flooded. Most of them are mainly focused on the presence of heavy metals in the extraction zone [10]. The issue of groundwater pollution, in the context of rock or mineral extraction sites, is better studied in the context of underground mines [11] since many studies have been focused on problems related with mine water acidification [12] as well as other more specific problems. However, investigations focused on hydrogeochemical issues in the specific context of PSH using quarries have not been conducted. Only [8] and [9] developed a numerical study focused on hydrochemical issues related with PSH. However, these previous investigations are limited since they were based on deep, underground coal mines. The results show that the presence of pyrite and calcite significantly influences the evolution of the hydrochemical properties of the water contained in the mine during the pumping–discharge operations. These previous works are exclusively numerical and based on hypothetical cases. To date, very few case studies of PSH using underground works have been investigated. One of them is [13], which investigated the possibility of recycling some USA underground iron mines for PSH.
In this context, the main objective of this study was to quantify and assess the hydrodynamic and hydrochemical impacts induced by PSH using a quarry as the lower reservoir. This objective was reached by developing two numerical models. One of the numerical models aimed at investigating the hydrodynamic behavior induced by PSH, whereas the other one aimed at studying hydrogeochemical issues produced by PSH. Both models were based on the former quarry of Obourg, located in the chalk aquifer of the Haine Valley (Mons city area, Belgium).

2. Materials and Methods
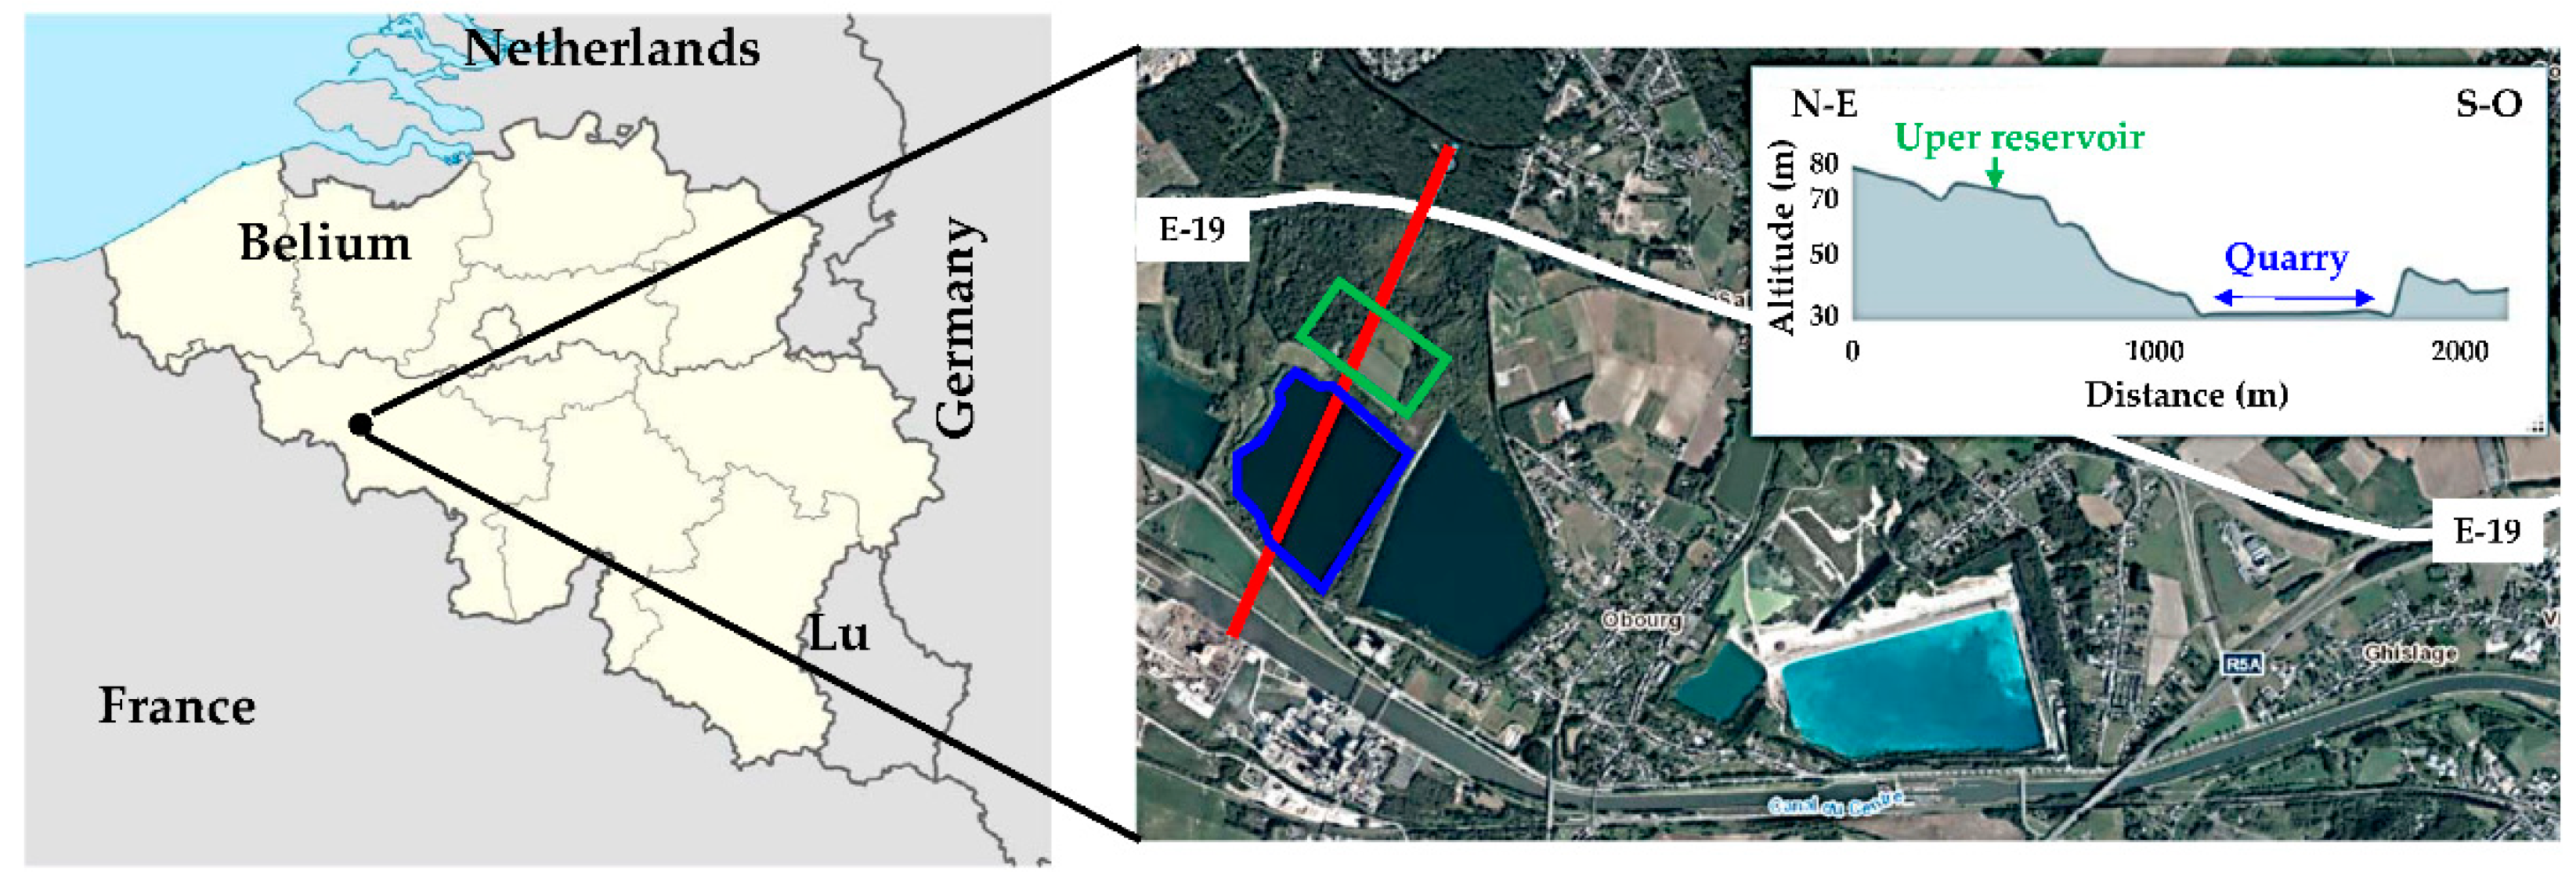
2.1. Study Site

Several chalk quarries are present in the Walloon region (Belgium), including active and abandoned ones. The chalk open pit, which was studied in this article, is representative of those quarries. It is located close to the Obourg locality, about 4.5 km north-east of Mons city (South-West Belgium). The study site is composed of five quarries located in chalk geological formations. The two most easterly quarries are still in operation, whereas the three located to the west are no longer used. One of those abandoned quarries is studied to be used for PSH (Figure 1). The considered quarry has a surface area of 0.34 km². The upper reservoir, with a volume of 1 million m³ (100 × 1000 × 10 m), would be built north of the quarry, close to the E19 motorway. The difference in altitude between the upper reservoir and the quarry would be 40 m as shown in Figure 1.

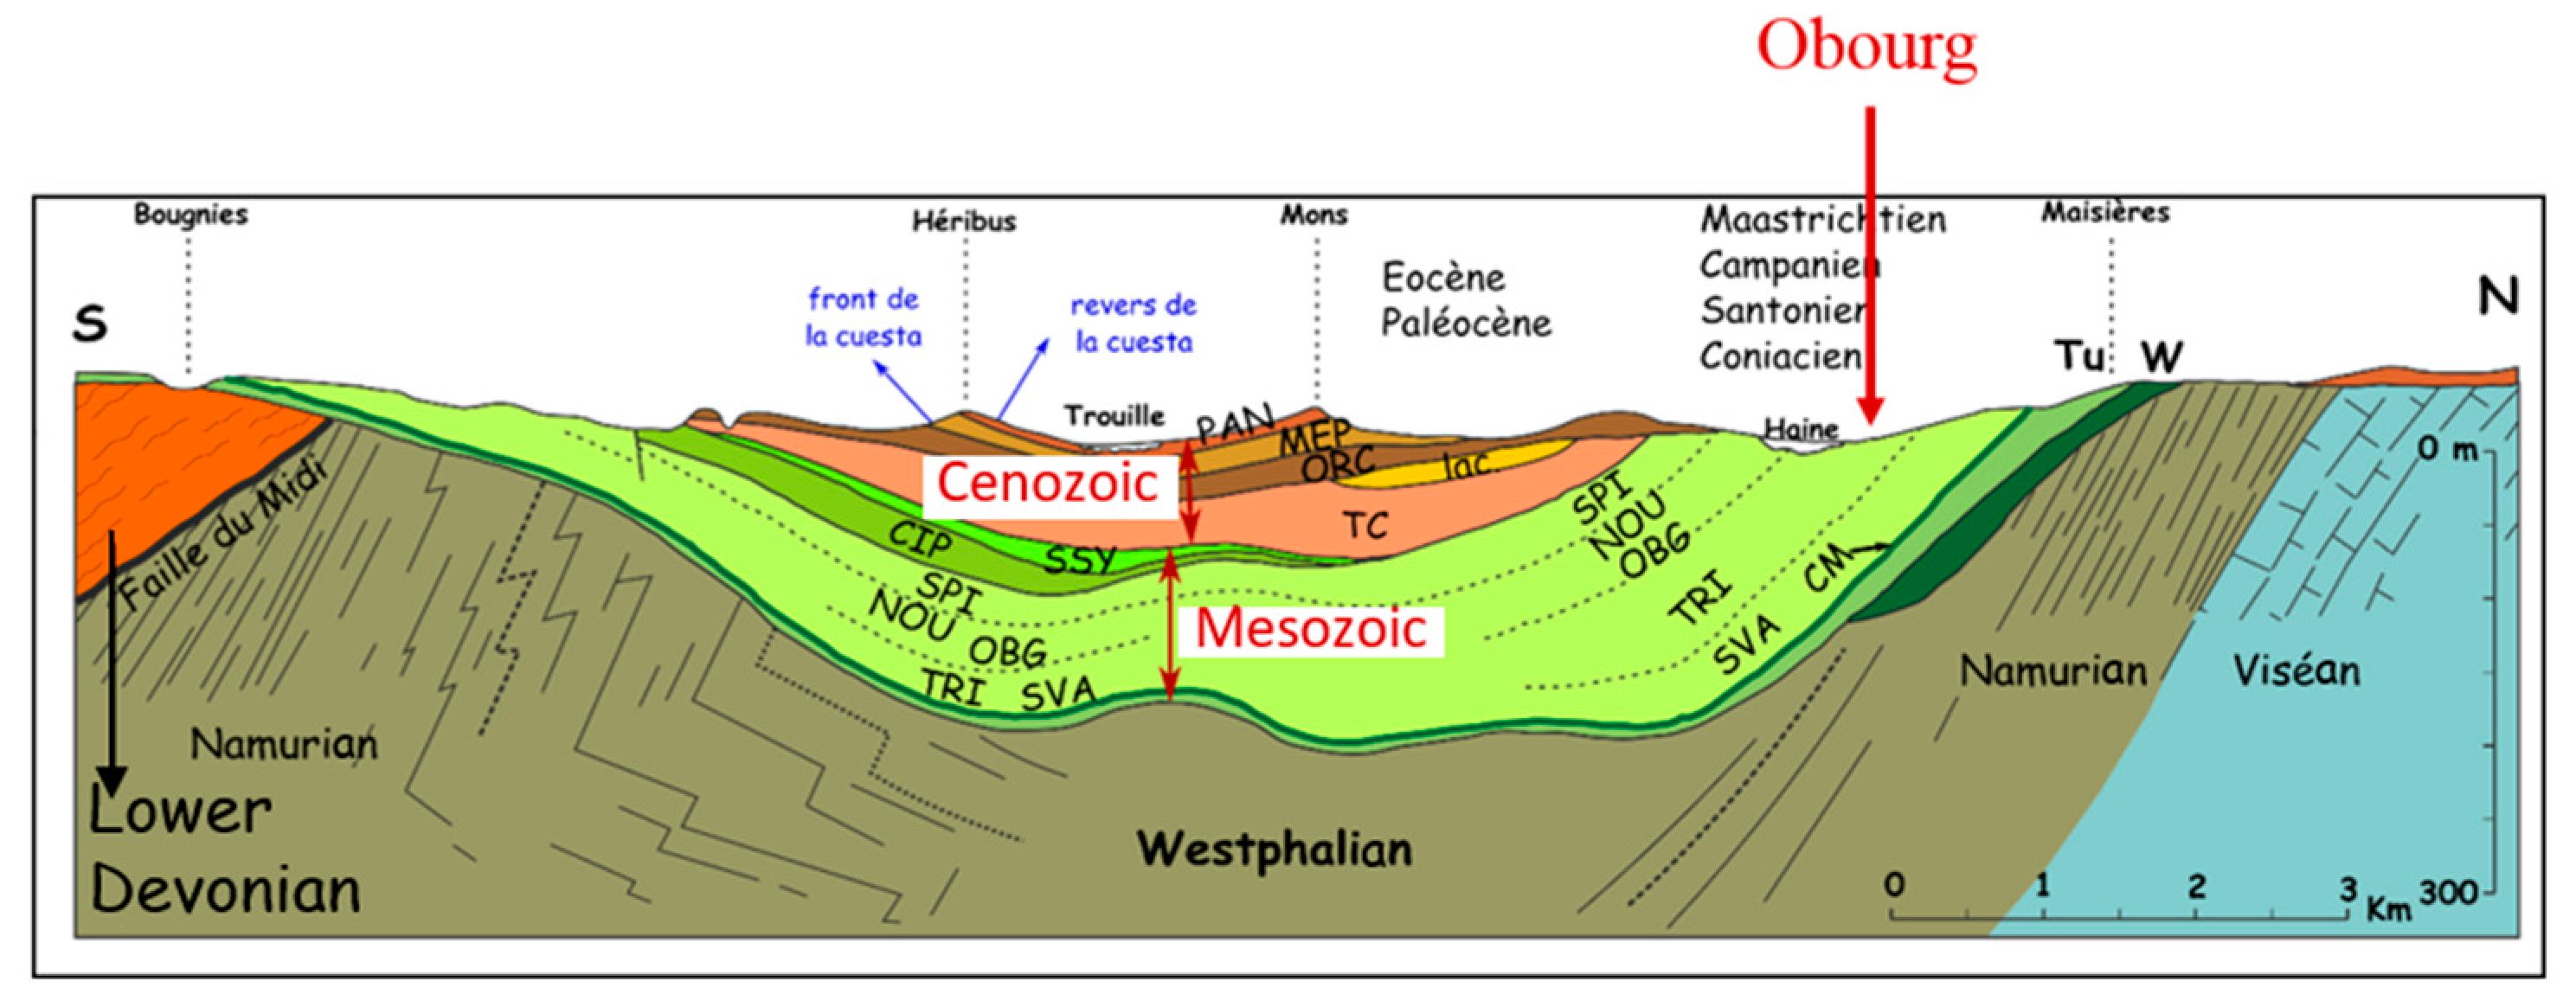
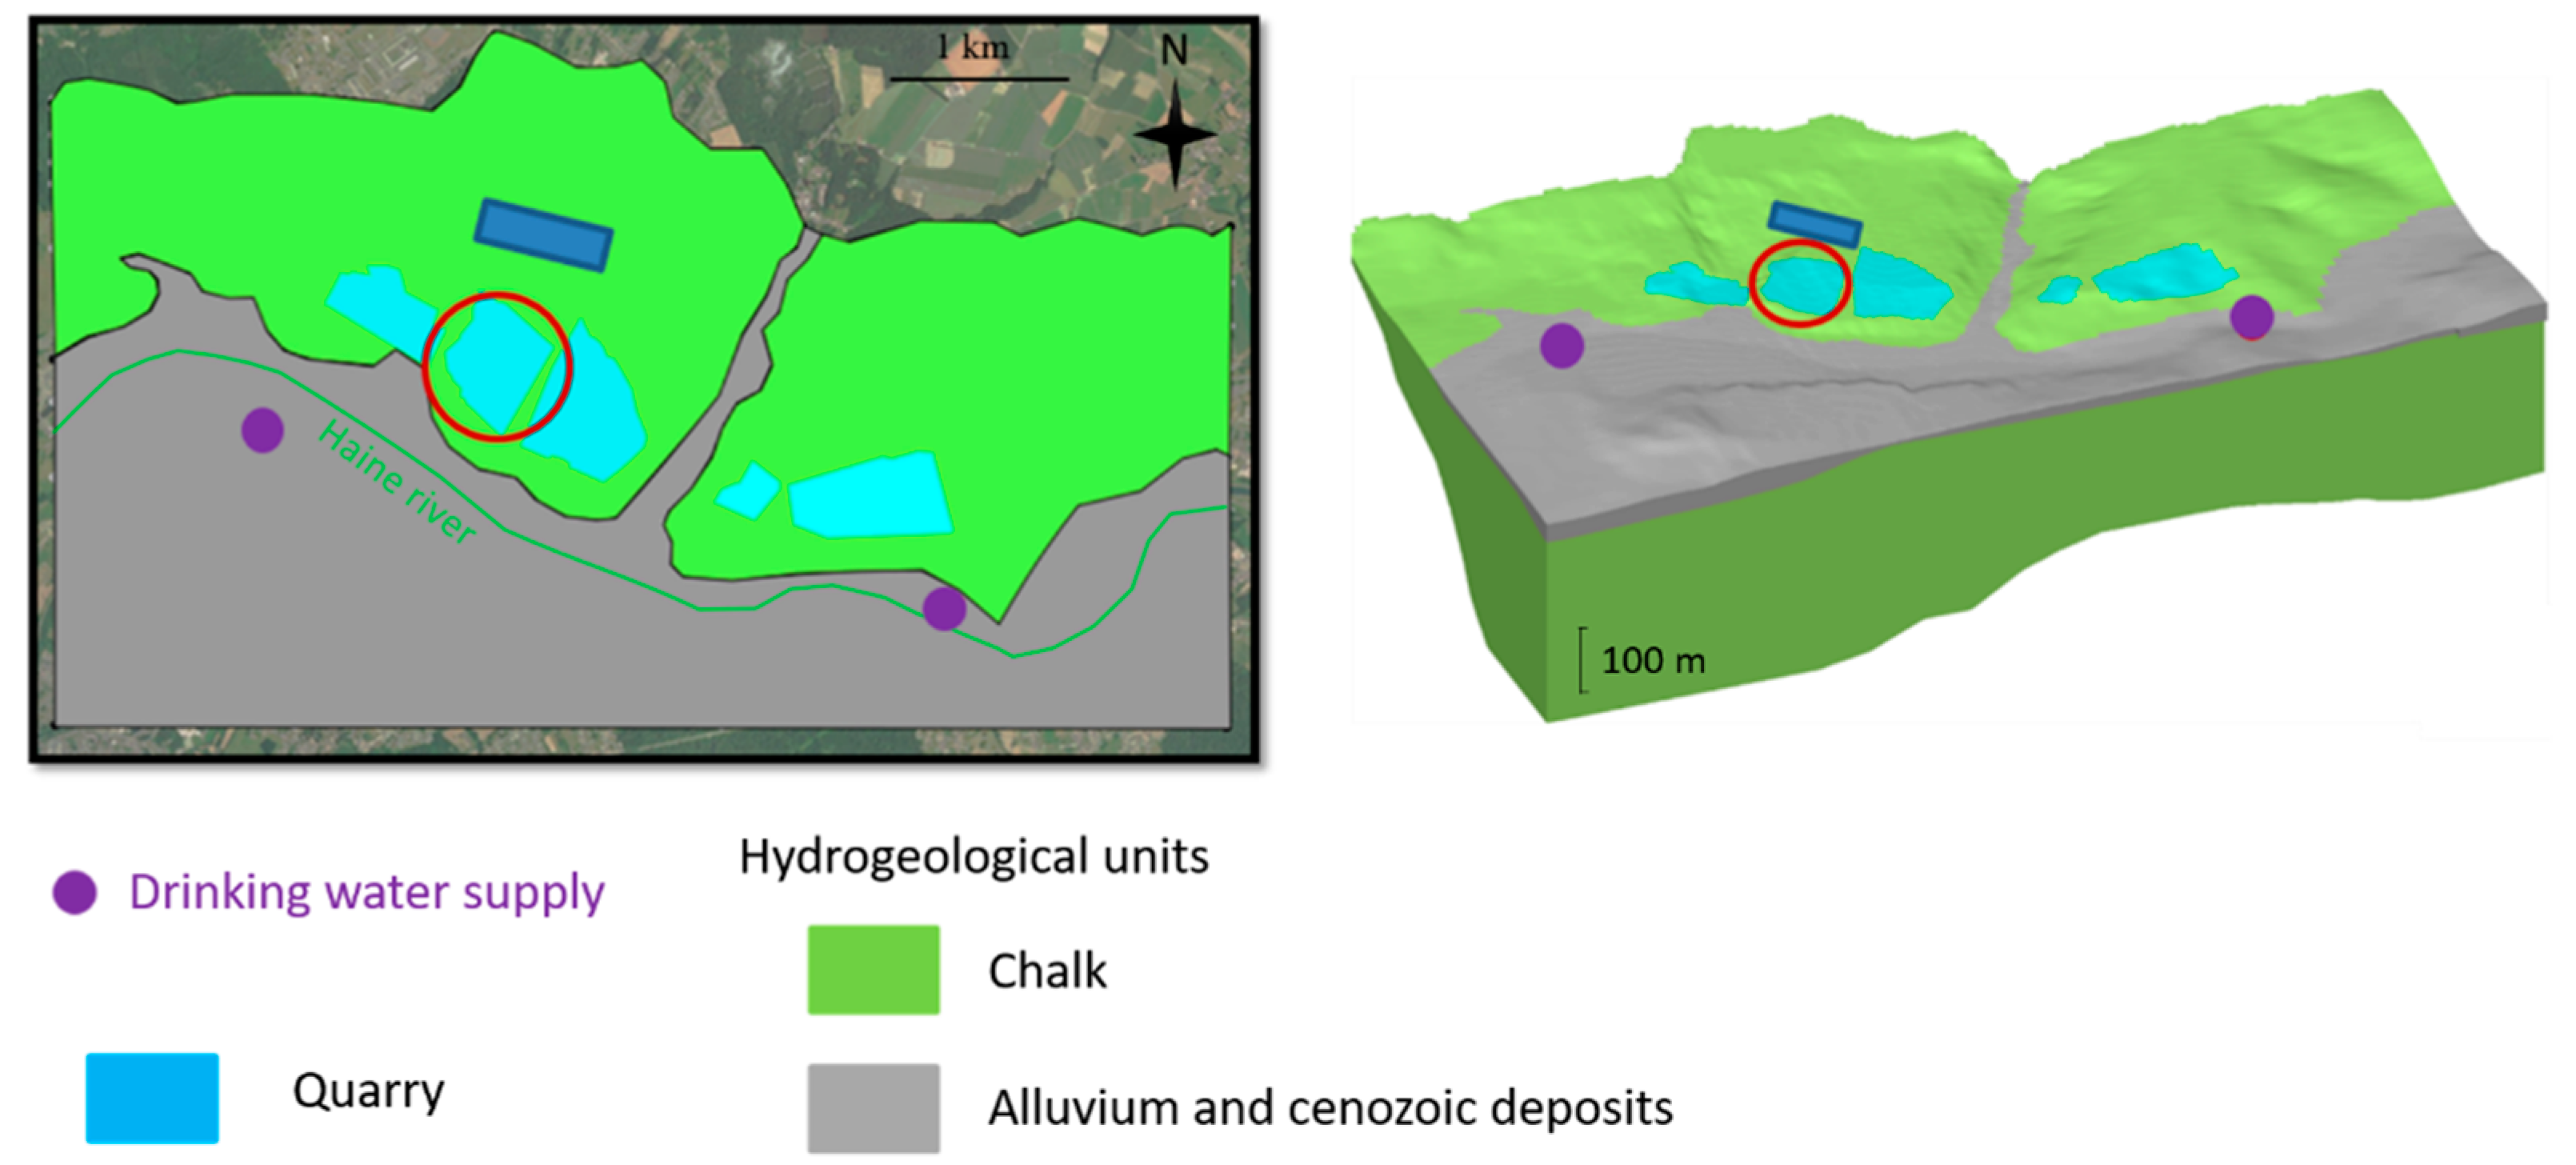
2.2. Geological and Hydrogeological Context

The Mons sedimentary basin has a syncline-shaped (Figure 2) structure and is composed of Mesozoic and Cenozoic deposits. This basin has been affected by subsidence events since the end of the Paleozoic. The Obourg chalk quarries are in the northern part of the Mons Basin where the Cretaceous chalk formations are exploited. These geological formations are included in the “Chalk Group” and represent a major aquifer system called the “Haine Valley Chalk Aquifer” or the “Mons Basin Chalk Aquifer.” The thickness of this aquifer is variable and can reach up to 250 to 300 m. The chalk aquifer is bounded at the north, east, and south-west by schisto-sandstone formations from the Upper Carboniferous [14]. In the South, the aquifer is limited by the Lower Devonian deposits, which include several aquifer systems. The chalk aquifer overlies low-permeability marly geological formations [14]. The chalk aquifer is characterized by a relatively high hydraulic conductivity on a macroscopic scale. This high hydraulic conductivity is the result of the fracture network, consisting of diaclases, stratification joints, and faults. The chalk has a high value of total porosity that can be divided in a matrix porosity, which allows the storage of large quantities of water and a fracture porosity, which allows preferential flows [15,16,17,18,19,20]. The Obourg quarries are located in the vicinity of drinking water abstraction stations, pumping in the same aquifer, and located about 1.5 km in the south-west direction. This groundwater abstraction complex, using pumping wells, is one of the most important in the Walloon region.

2.3. Hydrochemical Context

Chalk is generally composed of high percentage values (60–95%) of calcite (CaCO3) [22]. Specifically, the chalk of the Trivières formation is composed of more than 92% CaCO3. These chalk geological formations also contain some slightly ferruginous beds, as well as some phosphate nodules [14]. The hydrochemical composition of the groundwater is mainly explained by the water–rock interactions and, in particular, by the different alteration processes inducing dissolution/precipitation reactions. In the chalk aquifer, the chemistry of the groundwater is related to the dissolution of CaCO3 in the presence of dissolved CO2. The dissolution of CaCO3 is governed by a series of acid–base equilibria as follows:
C O 2 + H 2 O     H 2 C O 3
H 2 C O 3   H + + H C O 3
H C O 3   H + + C O 3 2
H 2 O   H + + O H
C a C O 3 + 2 H +     C a 2 + + H 2 O + C O 2
In accordance with these equilibrium reactions (1–5), most of the dissolved elements in the chalk aquifers’ groundwater are Ca2+ and HCO 3 . The HCO 3 ion is the predominant form. Other major ions in chalk aquifers’ groundwater are Mg 2+, Na+, Cl, SO42−, and Fe2+ [23,24,25].
Table 1 summarizes the average concentration of ions in the groundwater of the chalk aquifer of the Mons Basin. Note that a great disparity in concentrations can be observed depending on the location. Groundwater in the study site has high concentrations of iron and manganese, which under reducing conditions are present in the forms Mn2+ and Fe2+.
These two ions (Mn2+ and Fe2+) are involved in redox reactions, shown below (Equations (6) and (7)), involving the O2 dissolved in the water. The aeration of the water during the pumping-turbine cycles in the upper reservoir induces the increase in the equivalent partial pressure of O2. The presence of dissolved O2 leads to oxidation of Fe2+ and Mn2+ to FeOOH (goethite, iron hydroxide) and MnO2 (pyrolusite, manganese oxide), respectively.
4 F e 2 + + O 2 + 8 O H + 2 H 2 O     4 F e ( O H ) 3 ( s )
M n 2 + + 1 2 O 2 + H 2 O     M n O 2 ( s ) + 2 H +
Concerning the major ions observed in the study site, the presence of magnesium may indicate the existence of dolomite (CaMg(CO3)2) [22]. The presence of sulphates and iron may be explained by the result of pyrite and marcasite oxidation, although these minerals were not observed extensively in the aquifer. Iron oxidation benches are however regularly visible within the chalk layers. Groundwater near the Obourg quarry was characterized by an alkalinity of 26.5 meq/L, which means that it is relatively difficult to change the pH of the solution. The pH value was equal to 7.24. The presence of dissolved O2 was considered to be zero, and the partial pressure corresponding to the concentration of dissolved CO2 was 10–2 bar.

3. Model Development

3.1. Groundwater Flow Model

3.1.1. Model and Spatial Discretization

The numerical models were developed using the finite difference code Modflow [27]. The modelled area was equal to 32.8 km². Two hydrogeological units were represented in the numerical flow model (Figure 3): (1) the chalk aquifer that covered the whole modelled area, reaching a thickness of 300 m in the southern part of the model, and (2) a shallower aquifer located in the southern area and overlying the chalk aquifer. This shallower aquifer is made up of marine and fluvial–alluvial sediments from the Cenozoic age. They consist of sand, silt, and clay, structured in alternating permeable and low-permeable formations.
The modelled area was discretized using irregular rectangular cells. The dimensions of the cells were 10 × 10 m in the quarry and increased by a factor of 1.05 in the direction of the boundaries. The mesh was divided vertically in three layers of cells representing the hydrogeological units. The first layer represented the shallower aquifer, made of marine and fluvial–alluvial sediments, whilst the two lower layers represented the chalk aquifer. The central layer was characterized by a constant thickness of 40 m, corresponding to the thickness of the quarry. The Obourg quarry, which was used for PSH, as well as the other quarries, were therefore contained in this layer. This configuration allowed the expected variations of the water table in the quarry and in the aquifer to be contained in the central layer. This enabled us to avoid numerical problems related with the saturation and desaturation of the cells. The lower layer was characterized by a variable thickness, ranging from 10 m in the north to 300 m in the south, forming a beveled layer.

3.1.2. Boundary Conditions

The northern limit of the model corresponds to the interface between the chalk aquifer and low-permeability deposits in contact with the base of the chalk aquifer (Figure 3). This limit is represented by a zero flow Neumann boundary condition (BC). The southern, western, and eastern boundaries were implemented in the model using Dirichlet BCs whose values correspond to the mean values of the piezometric head of the chalk aquifer at these locations [14] (Figure 3). Those boundaries were chosen sufficiently far around the quarry not to interfere with the influence of the PSH operations. The distance and location of these boundaries were determined from the results of a generic study about the impact of PSH using quarries as lower reservoirs [7]. The base of the model corresponds to the lower limit of the chalk aquifer. The “Haine River” is a draining stream along the considered section. It is represented by a potential-dependent flow BC (i.e., Fourrier BC), which only allows groundwater flowing out the model. The value of the conductance factor, which governs the Fourrier BC, was high enough to keep the piezometric head in equilibrium with the river. Two major groundwater pumping stations in the chalk aquifer were included in the modelled area. They were implemented in the chalk layer of the model using Neuman BCs, with prescribed flow rates equal to 5,234,976 and 883,008 m³/year. A recharge of 300 mm/year was applied to the top of the model.

3.1.3. Parametrization

The hydraulic properties were distributed according to the hydrogeological units. They were determined by calibrating the model by fitting the measured piezometric head in different piezometers in the modelled area. In some locations however, few measured piezometric values were available. Calibrated parameter values were in accordance with the commonly accepted intervals for the different hydrogeological units considered in the model [14]. The quarry was represented by adopting a high hydraulic conductivity and porosity of 1. This hydraulic conductivity was high enough to simulate a homogeneous hydraulic head inside the quarry. The hydraulic properties finally used in the model simulations are summarized in Table 2.

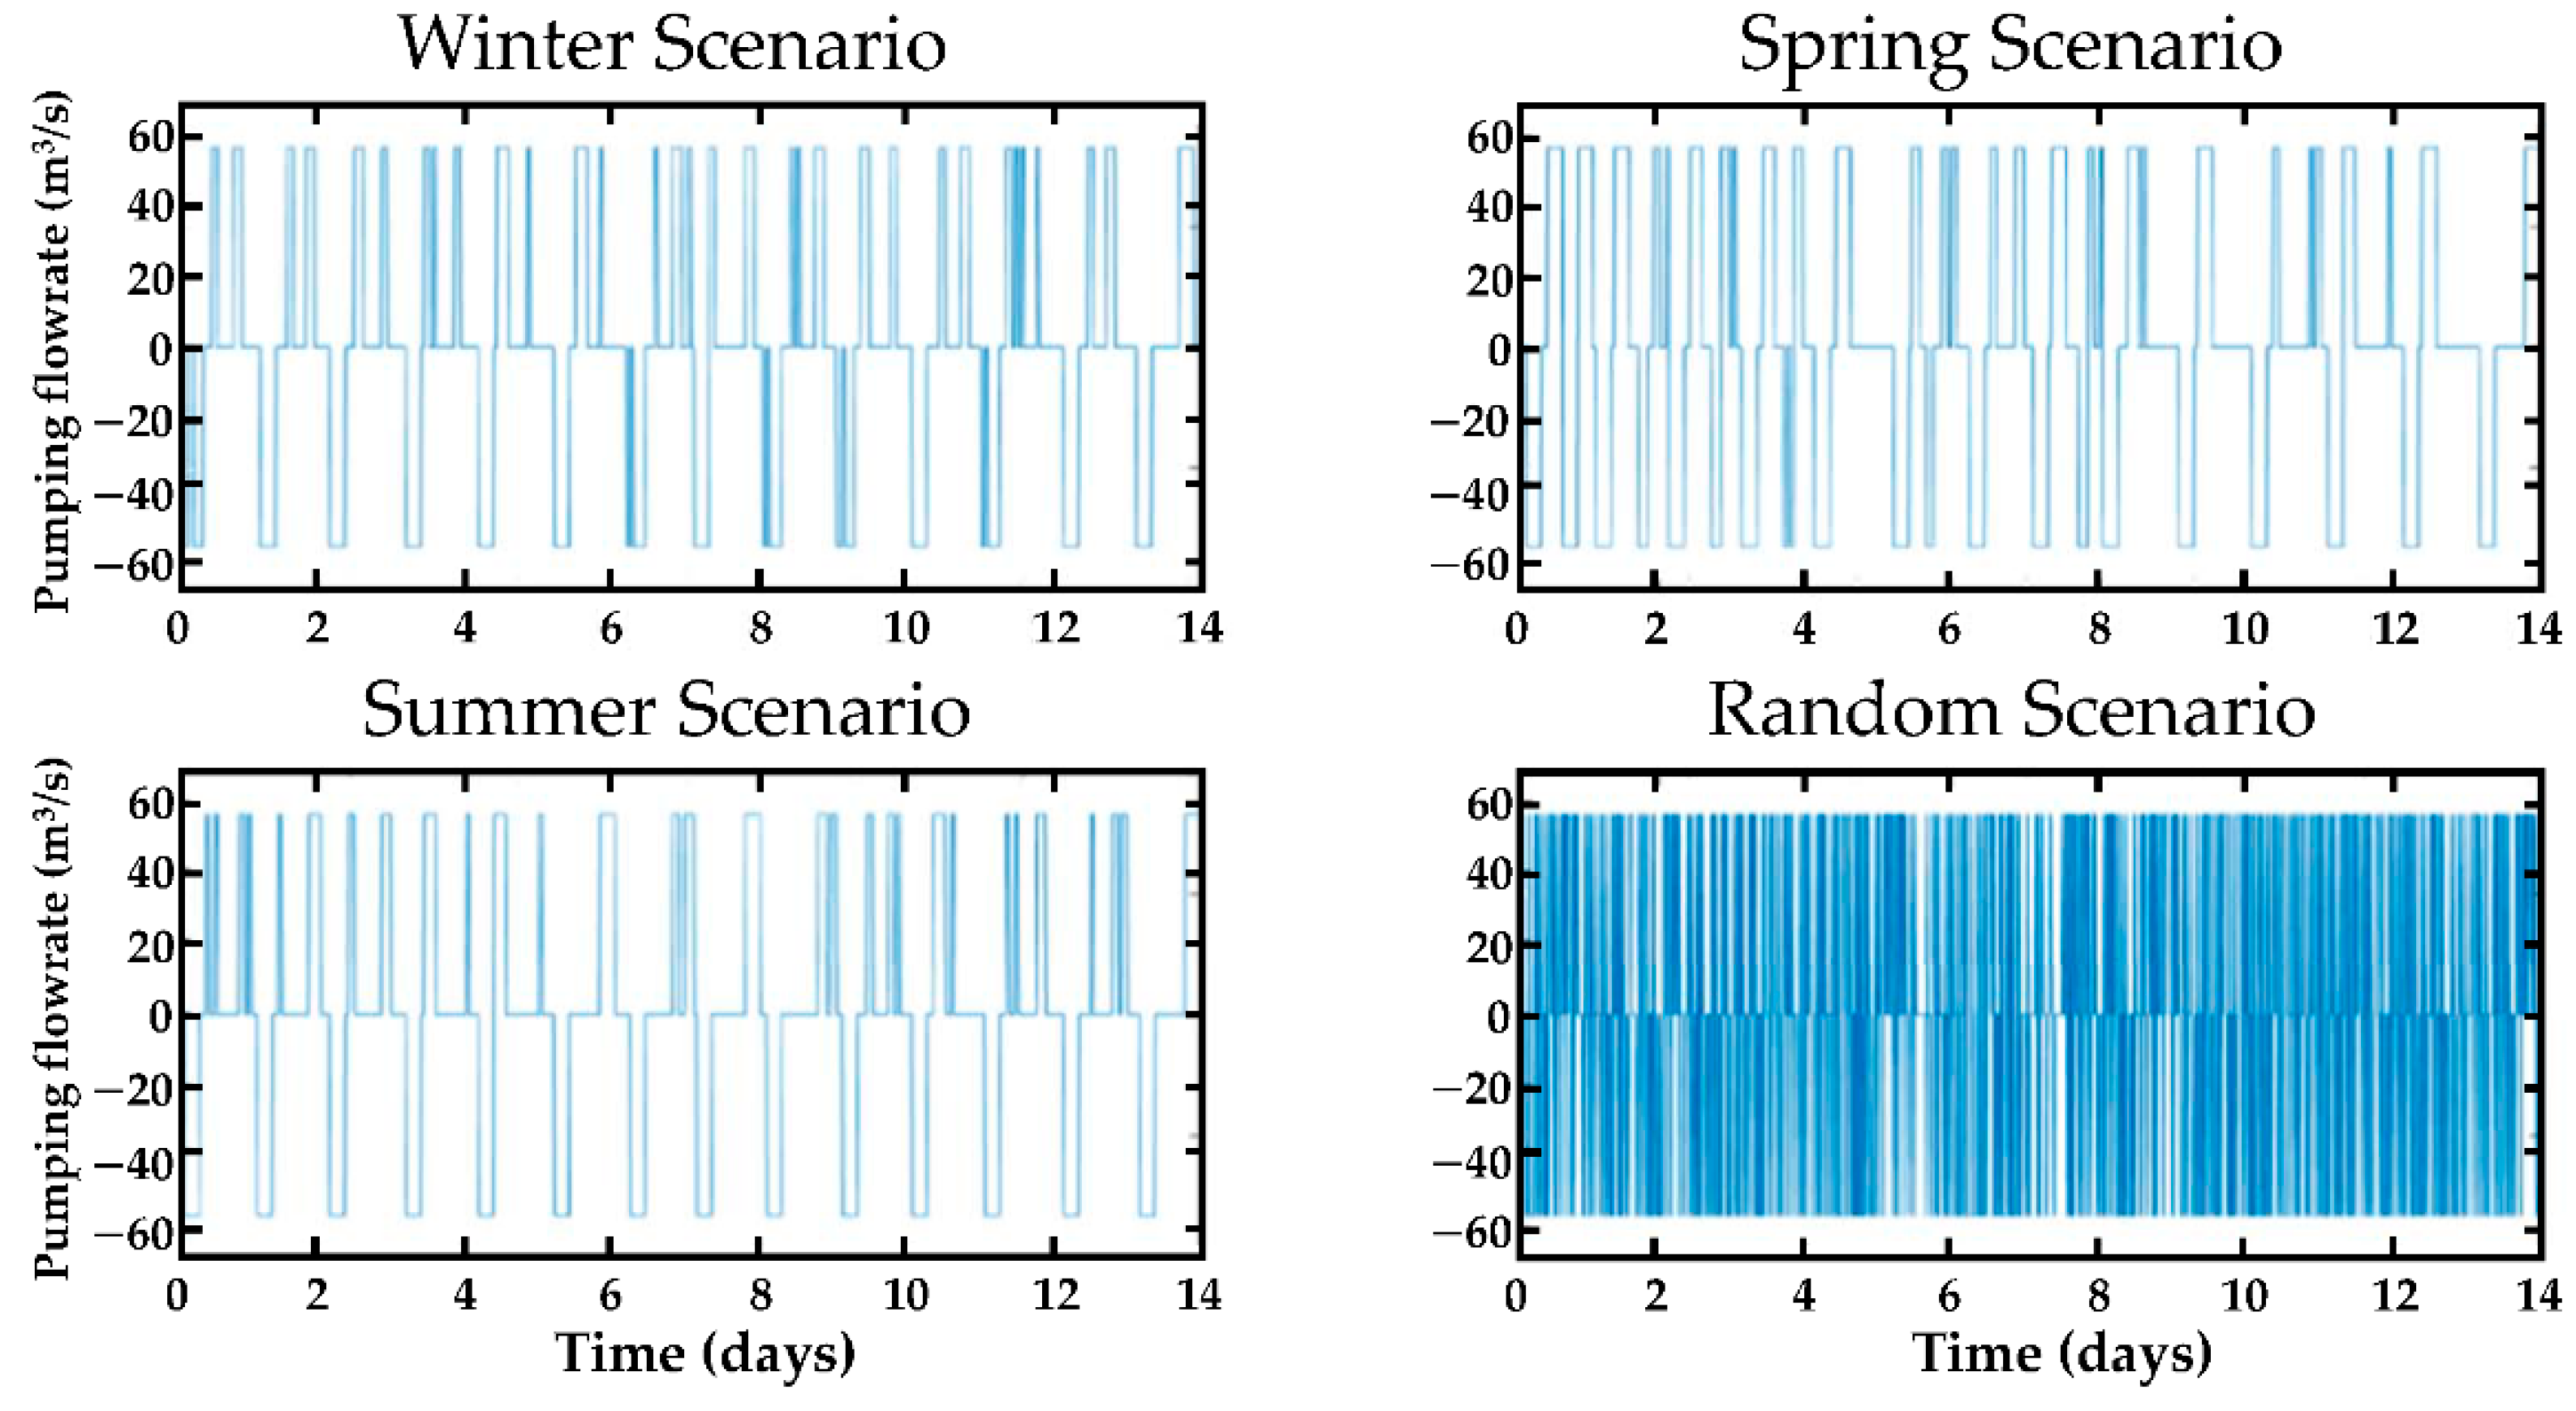
3.1.4. Simulated Pump–Storage Operations Scenarios

Four pumping–discharge scenarios (Figure 4) have been considered (Smartwater project, 2018; [4,7]). The pumping–discharge scenarios, which were implemented as boundary conditions in the models, are based on real electricity data. These scenarios describe the emptying and filling of the upper reservoir and the alternating phases of pumping, discharge, and no-activity over a period of fourteen days. In Figure 3, negative flow rate values correspond to pumping operations in the quarry and filling of the upper reservoir. Positive flow rate values correspond to discharge steps of the upper reservoir through the turbines and injection in the quarry. Three of the pumping–discharge scenarios are based on the electricity market daily data at different seasons of the year (spring, summer, and winter). The pumping and discharge periods take approximately five hours. The succession of the different phases (pumping/discharge/no-activity) is faster in winter, intermediate in spring, and slower in summer. The last scenario was generated randomly, with a change of phase (i.e., pumping/discharge/no-activity) every 15 min, following a uniform law. This scenario has been developed in line with PSH stations potentially connected to renewable and intermittent energy sources, whose production management would probably require higher frequencies, with periods shorter than an hour. The pumping–discharge scenarios were used as input data for the numerical model and were implemented by prescribing the flow rates (i.e., Neuman boundary conditions) in the cells corresponding to the quarry. The pumping and discharge flow rates were chosen according to the volume of the upper reservoir (≈1 million m³) to satisfy that it can be filled or emptied during one pumping/discharge cycle. Thus, for an example cycle of 4.8 h, the pumping/discharge rate was 55.56 m³/s.

3.2. Groundwater Hydrochemical Model

3.2.1. Conceptual Model

To simulate the hydrochemical evolution of the water contained in the upper reservoir, in the quarry, and in the chalk aquifer (Figure 5), several hypotheses were established concerning the aquifer and the hydrochemical characteristics of the groundwater and the pump–storage operations. The porous medium was considered as homogeneous. The hydraulic conductivity and the drainage porosity were identical at each point of the rock media. Values were identical to those used for the flow groundwater model described in Section 3.1. The rock was considered to be composed of 92% calcite, reflecting the composition of the chalk of the Trivières geological formation. The pumping and discharge flowrates were derived from the pumping–storage scenarios described in the groundwater flow model and consisting of regular successive pumping and discharge slots, the period of which was 4.8 h for 14.6 days. The volume of pumped and then discharged water during each cycle was 125,000 m³. It is considered that chemical equilibrium with the atmosphere was reached in the upper reservoir before each discharge phase assuming partial pressures for O2 and CO2 of 10−0.7 bar and 10−3.5 bar, respectively. In the initial state, the water present in the quarry was considered to be in equilibrium with the groundwater in the aquifer. In the quarry, the equilibrium of the first few meters of water with the atmosphere was neglected. The temperature and density of the water were considered to be constant and equal to 12 °C and 1000 Kg/m3, respectively. Despite variations in water temperature and density, which were expected to be negligible within the quarry, further investigations by using numerical codes with more capabilities should be developed to establish their role in the system’s behavior. The used numerical code does not allow temperature variation within the same simulation.

3.2.2. Numerical Model and Boundary Conditions

The model was three-dimensional and was developed using the finite difference code PHAST [28]. PHAST aims to simulate groundwater flow, solute transport, and the hydrogeochemical reactions. PHAST couples HST3D [29], which computes flow and solute transport processes, with PHREEQC [30], which simulates the hydrogeochemical reactions.
Taking advantage of the symmetry of the problem, only one quarter of the system was modeled, allowing a significant reduction in computation time. As for the groundwater flow model, the 2-km long domain was discretized with irregular rectangular cells. The size of the cells was 10 m × 10 m in the quarry and increased progressively by a factor of 1.05 towards the boundaries. The piezometric head was prescribed (Dirichlet BCs) at the outer boundaries of the model. The size of the modelled zone was chosen so that these limits were sufficiently far from the quarry to not influence the effects of pumping–discharge operations. This choice was based on the results of the groundwater flow model developed (Section 3.1). Note that the prescribed head at the outer boundaries was uniform, and thus, the regional piezometric gradient was not represented. The pumping and discharge flows were simulated by implementing a Neumann BC in the center of the quarry. The hydrochemical characteristics of the water released into the quarry during the discharge phases depended on the results of the routine relating to the upper reservoir and were readapted to each new pump–discharge cycle.

3.2.3. Parameterization

The quarry was assimilated as a linear reservoir with a high hydraulic conductivity and a porosity of 100%. Hydraulic conductivity and drainage porosity values assigned to the elements representing the chalk aquifer were the same as those implemented in the groundwater flow model (Section 3.1) and were equal to 10−5 m·s−1 and 0.16, respectively. In this case, we considered the total porosity because the groundwater exchanges and the potential environmental impacts increased with high porosities [7,31]. Concerning the solute transport parameters, the longitudinal and transverse dispersivities were 10 m and 1 m, respectively, and the tortuosity was equal to 1. The longitudinal and transverse dispersivities adopted to simulate the water behavior in the quarry were equal to 100 m in order to assimilate it to an environment with high degrees of mixing.

4. Results

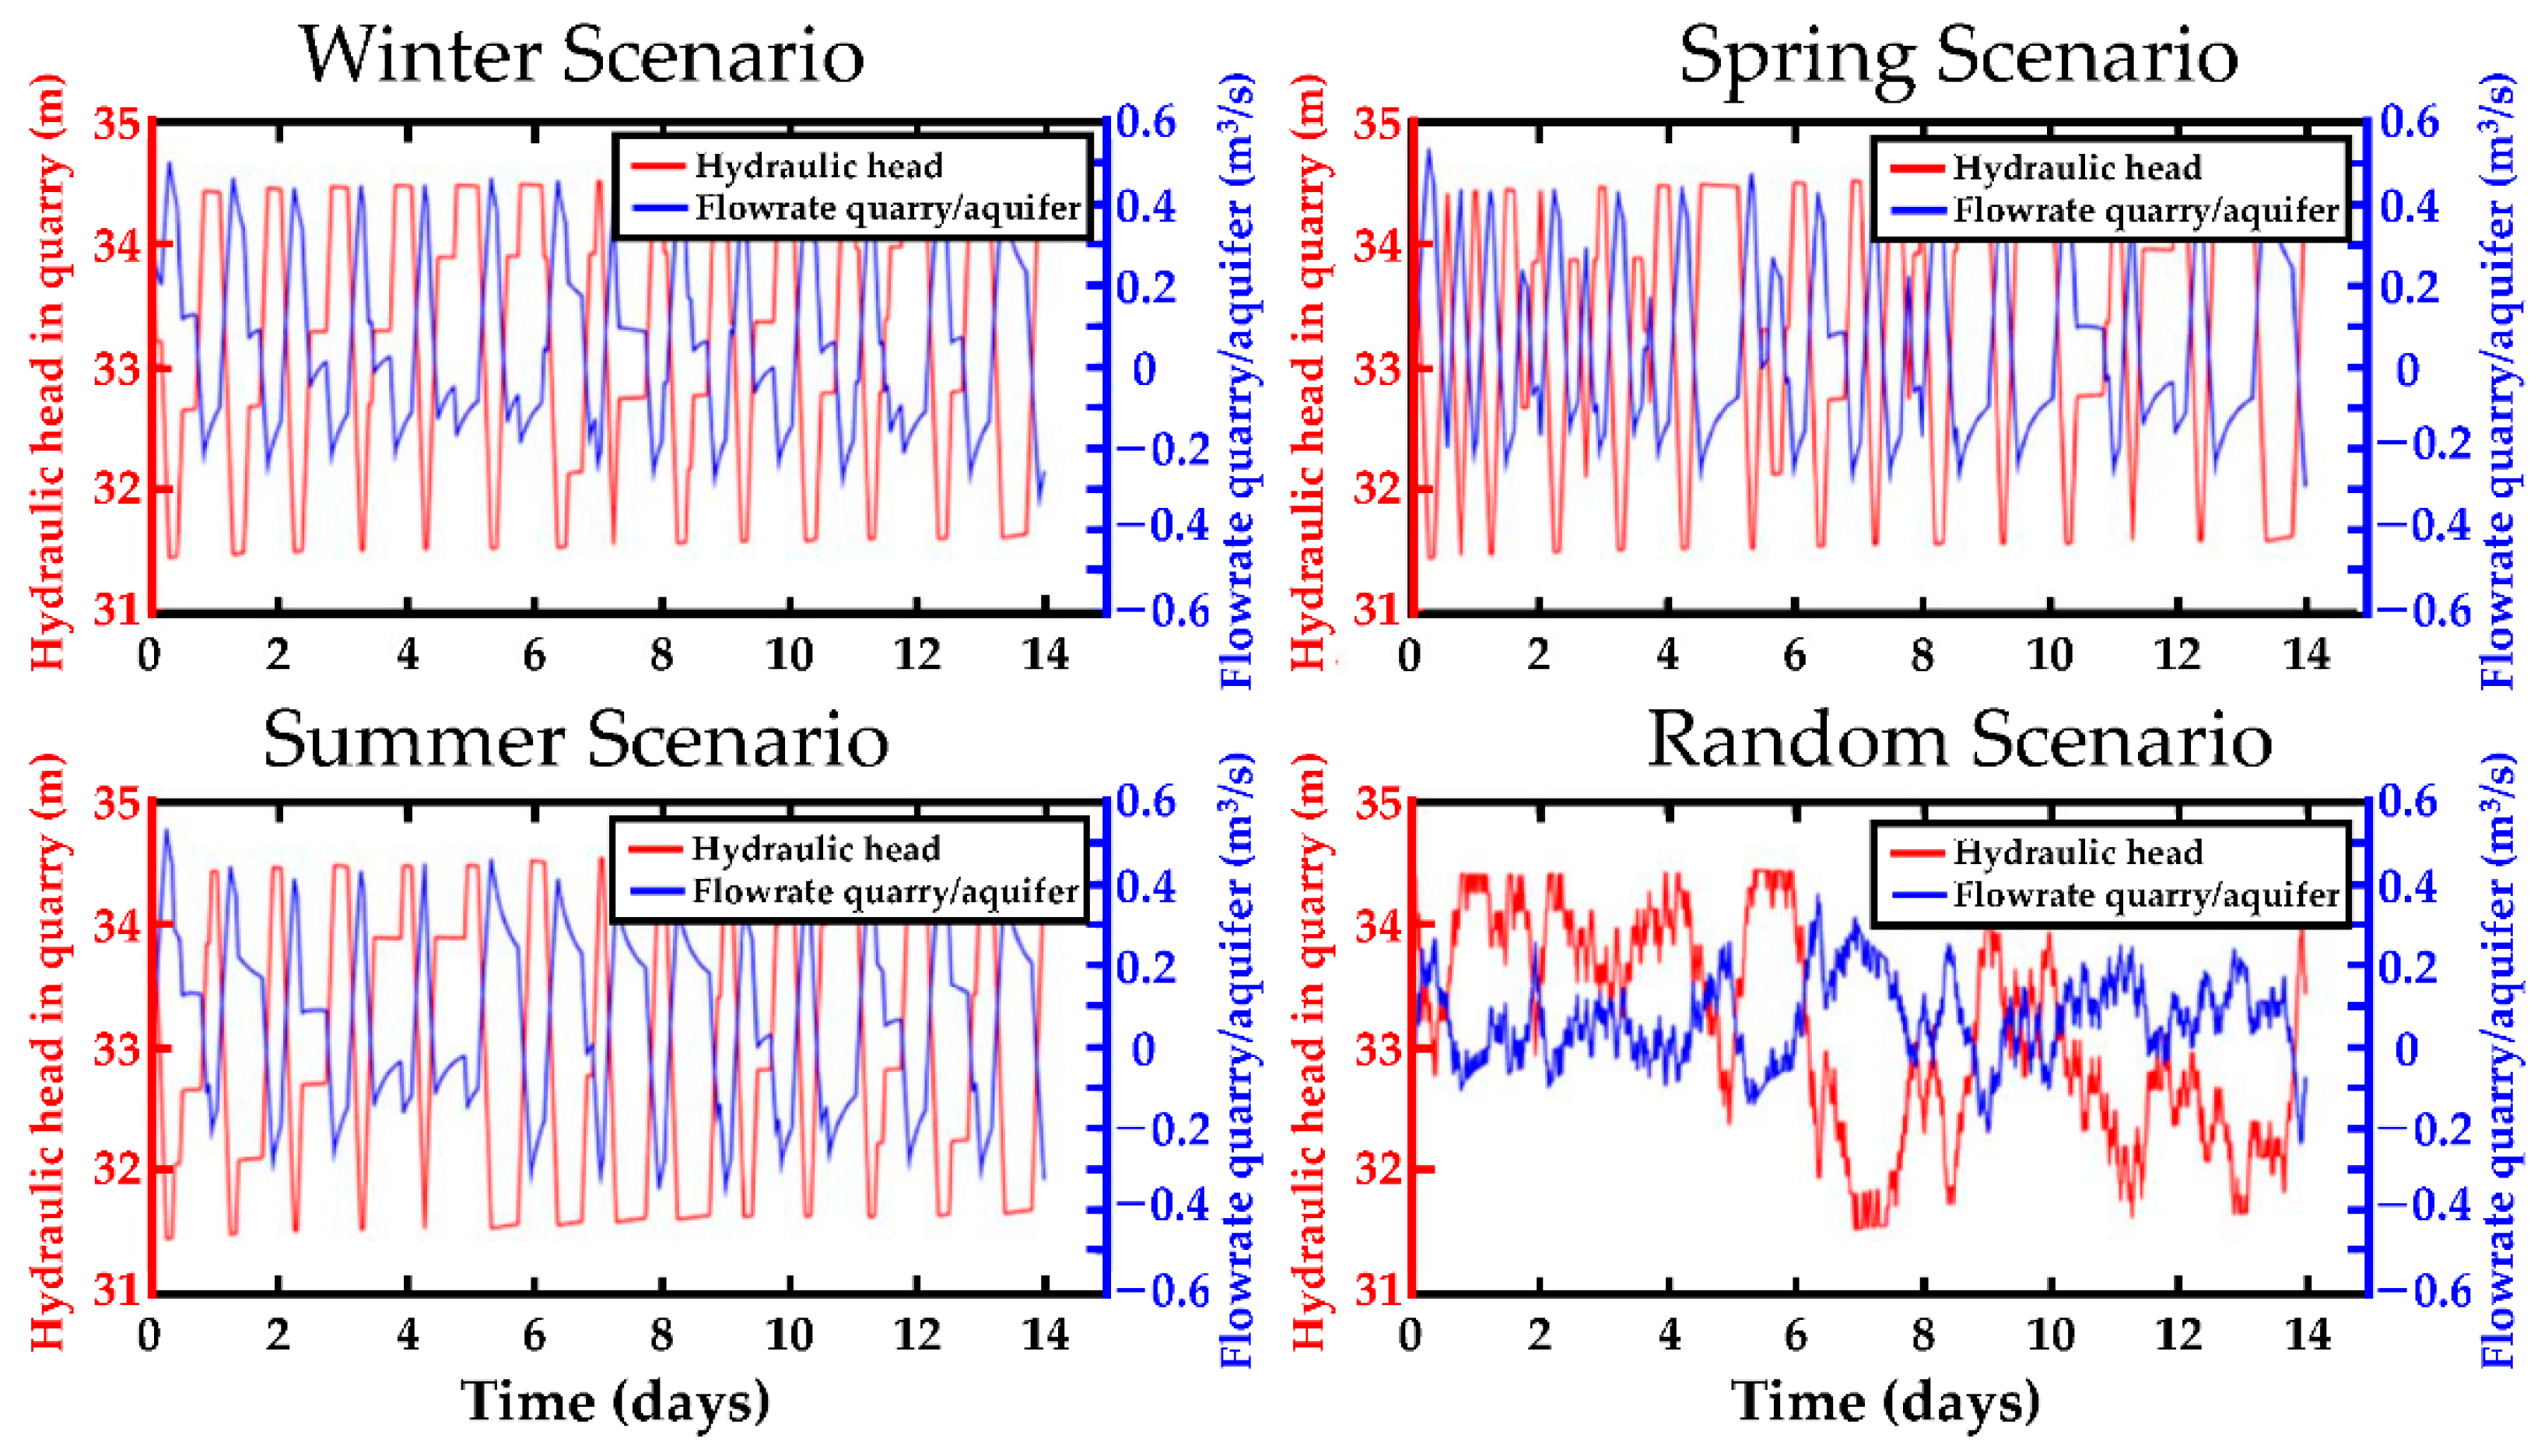
4.1. Hydraulic Head Fluctuations in the Quarry and Water Exchanges with the Aquifer

Figure 6 shows the simulated hydraulic head variations in the quarry and water exchanges between the quarry and the aquifer as a function of time and pumping–discharge operations. Positive and negative values for the exchange flowrate relate to groundwater that flowed towards the quarry and water that flowed from the quarry to the chalk aquifer, respectively. These exchange flow rates were globally inversely correlated to the hydraulic head in the quarry. When the hydraulic head in the quarry increased as a result of a water discharge from the upper reservoir, the exchange rates decreased to negative values, reflecting that water flows from the quarry to the aquifer. The opposite behavior was observed during the pumping phases when the hydraulic head decreased in the quarry.
During no-activity phases, exchange rates were positive when the hydraulic head in the quarry was located at a lower elevation than the surrounding piezometric level in the aquifer, and vice-versa. During no-activity phases, the hydraulic head in the quarry continued to vary slightly since water continued to be exchanged between the quarry and the chalk aquifer until an equilibrium was reached. For example, at the end of a pumping period, the hydraulic head in the quarry was lower than the surrounding piezometric level in the aquifer. Consequently, the chalk aquifer was drained by the quarry. The exchange rates were positive but decreased slowly, and the hydraulic head in the quarry increased slowly.
In the long term, the average elevation around which the hydraulic head fluctuates tended to be equal to the elevation of the hydraulic head in natural conditions. This fact was better observed in the regular scenarios than in the random one because of its more chaotic behavior (Figure 3). This phenomenon of gradual increase in the hydraulic head occurred because the simulated scenarios started with a pumping phase. During this initial phase, the hydraulic head in the quarry fell below the elevation of the hydraulic head in natural conditions. As a result, groundwater inflows from the chalk aquifer to the quarry contributed to increase the hydraulic head. This behavior differed to that expected in the case of an isolated lower reservoir where the hydraulic head remained constant and was not influenced by the groundwater exchanges. During discharge phases, when the volume of water previously pumped is discharged into the quarry, the hydraulic head in the quarry increased above its natural elevation, and thus, water was forced to flow from the quarry to the chalk aquifer. However, total water inflows from the aquifer to the quarry were generally greater than losses, as long as the average hydraulic head was below the natural level. Water inflows and outflows were not equilibrated until the hydraulic head oscillated around its natural elevation. This behavior must be considered, especially if there are constraints concerning the maximum hydraulic head to be reached in the quarry such as stability problems related with the elevation of the hydraulic head. Moreover, the gradual increase in the average hydraulic head was also critical because it may affect the balance between energy stored and produced by the system since the efficiency of the pumps and turbines depends on the difference in the hydraulic head between the quarry and the upper reservoir [8].
Table 3 summarizes the results from the simulations regarding the quarry–aquifer exchanges and the hydraulic head fluctuations in the quarry. The amplitude of the hydraulic head fluctuations was about 3 m, despite the large upper reservoir considered. Natural piezometric head fluctuations in the aquifer were 1 to 4 m depending on where you were in the aquifer. Concerning the maximum water exchange rates between the quarry and the chalk aquifer, they reached up to 0.53 m³/s. Slight differences in results were observed for the different pumping–discharge scenarios considered. The maximum variations in the hydraulic head in the requested quarry were less important for the random scenario than for the seasonal scenarios. The difference between them was about 20 cm. This was related with the higher frequency of pumping–discharge cycles of the random scenario since pumped and discharged volumes of water per phase are less important. As a result, fluctuations of the hydraulic head in the quarry as well as the exchange rates with the aquifer were smaller than in the seasonal scenarios. The maximum water exchange rates, which were similar for the three seasonal scenarios, were about 0.5 m³/s, whilst they were about 27% lower for the random scenario.

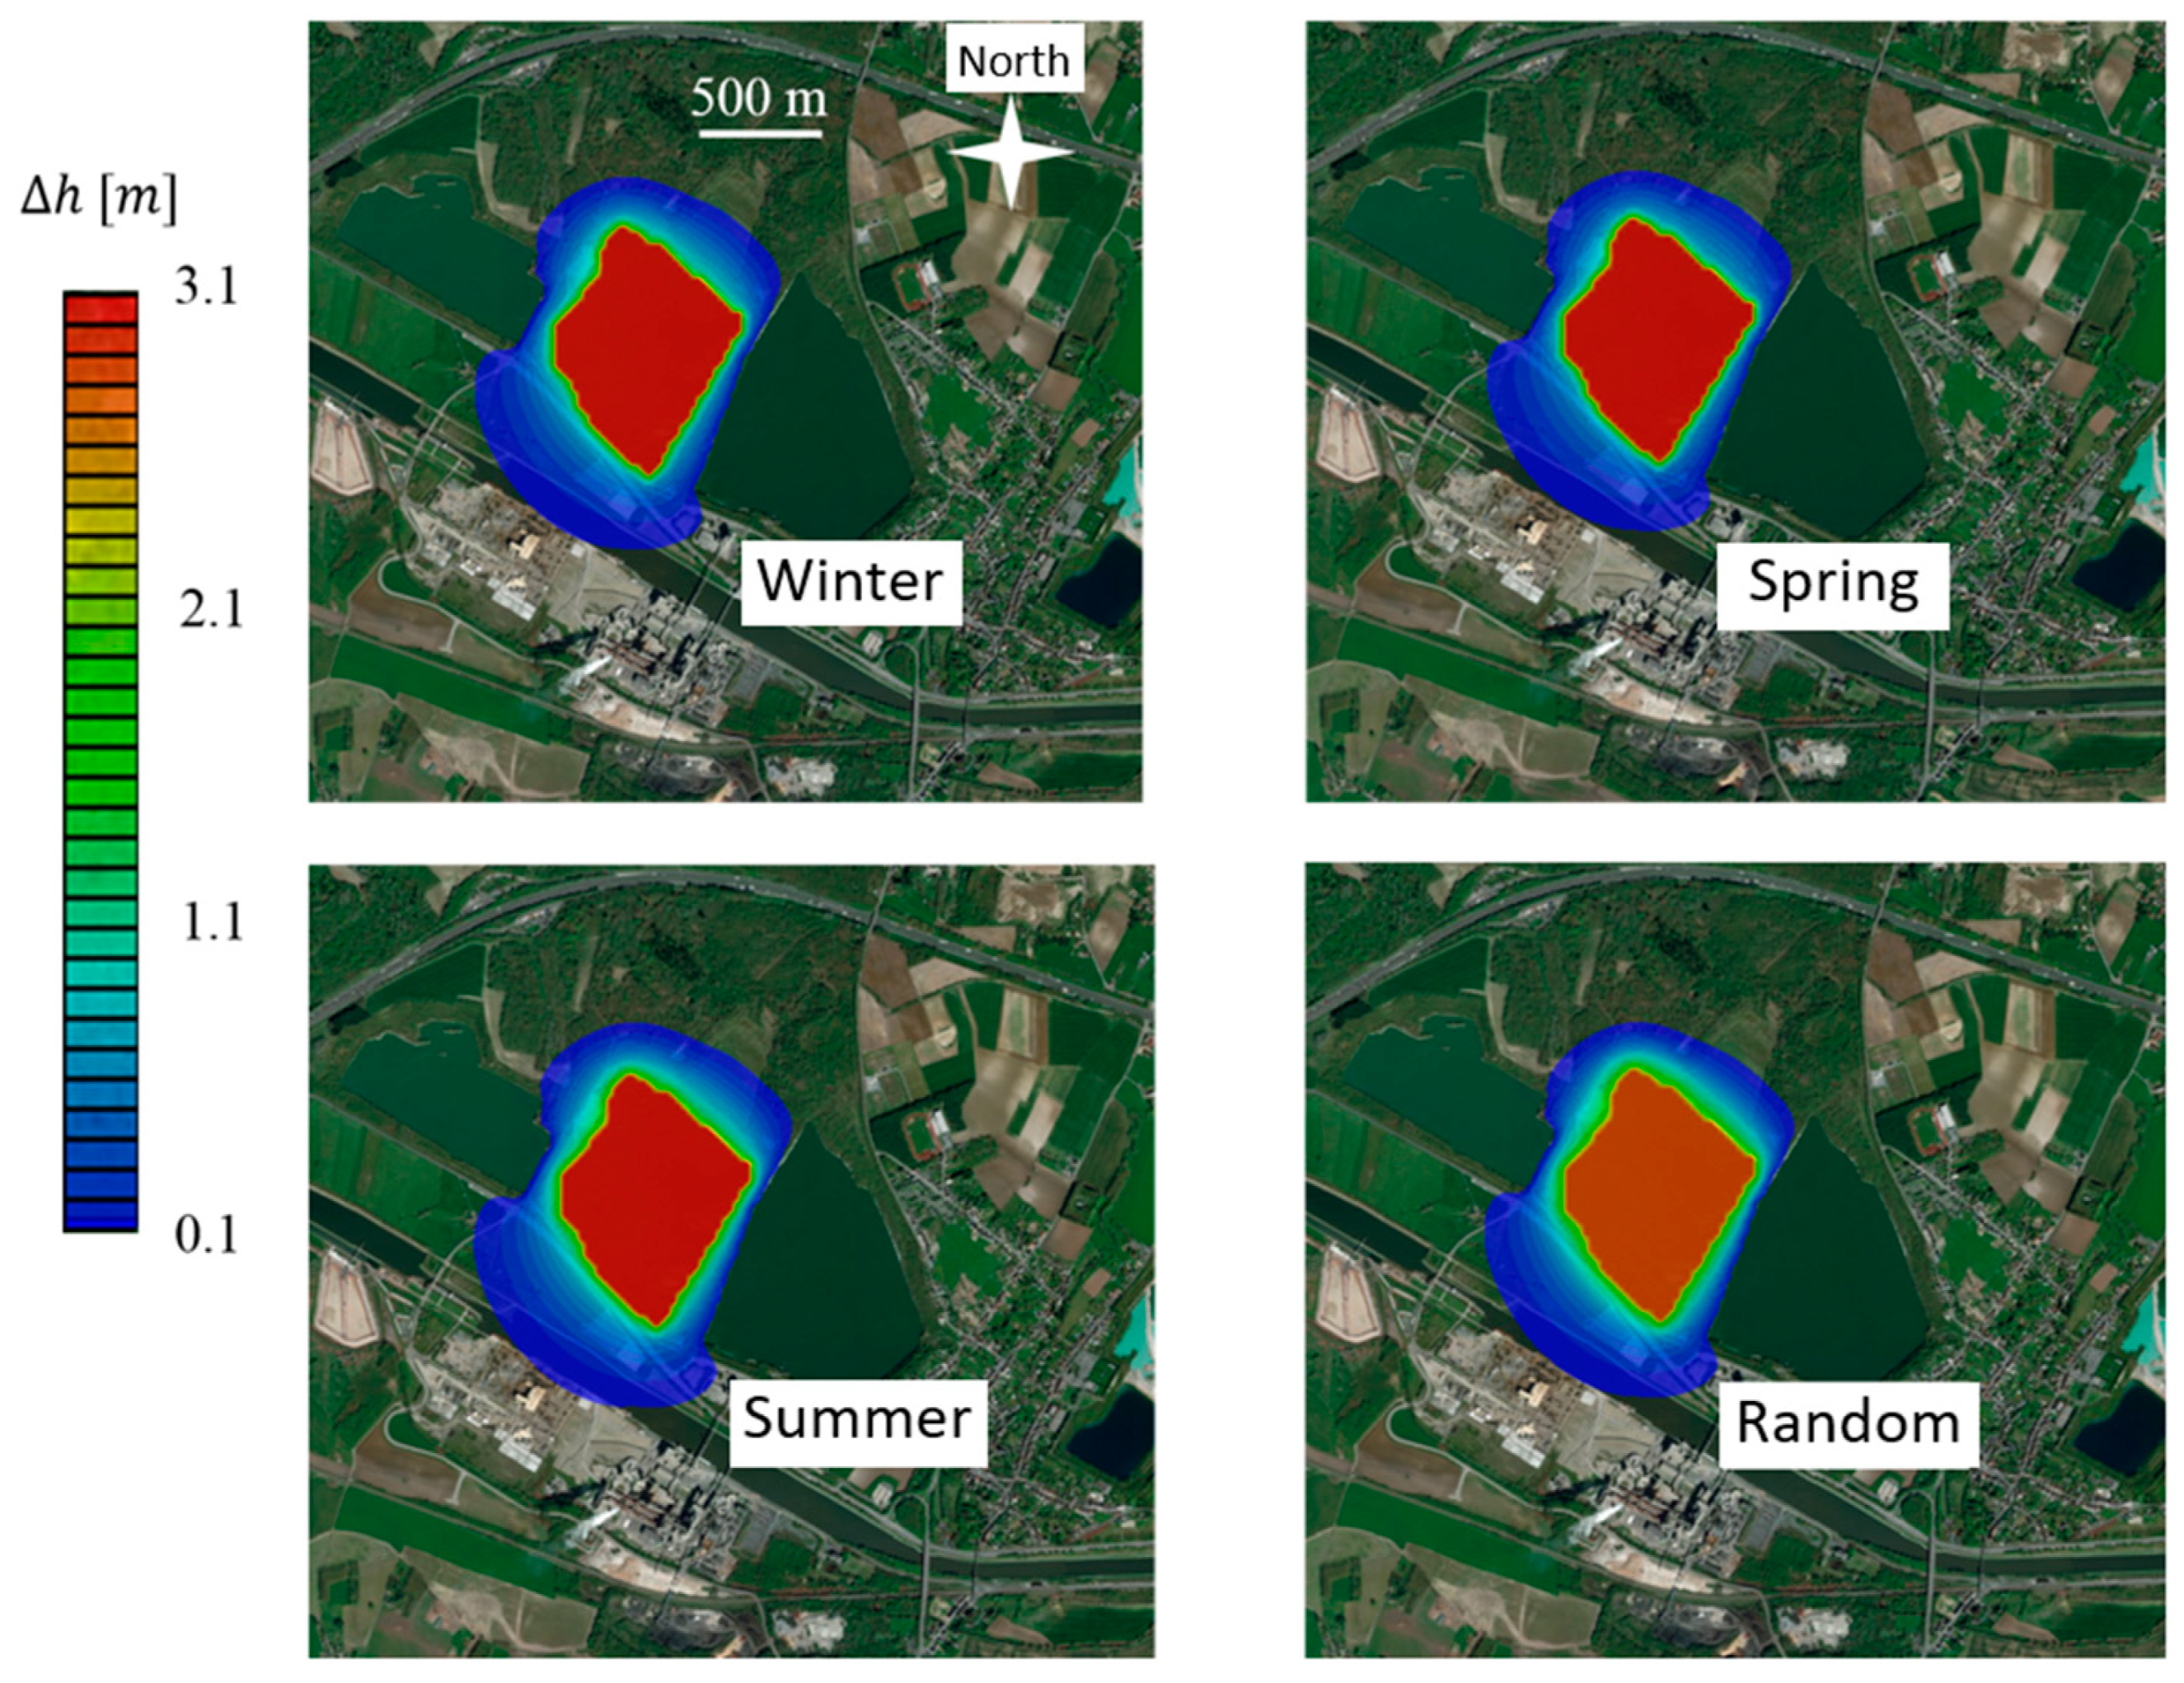
4.2. Piezometric Head Fluctuations in the Aquifer

Figure 7 shows the zone of influence of pumping–discharge operations at the end of the simulations (after 14 days) for all simulated scenarios.
This zone of influence corresponds to an area in which the fluctuations of the piezometric head were larger than 0.1 m. The typical summer, winter, and spring scenarios were a priori considered as low frequency scenarios in comparison with the random scenario, and thus, greater distances of influence were expected. However, the maximum distance of influence was similar in all scenarios. For all of them, the induced variations of the piezometric head (Δh) were less than 0.1 m within a maximum distance of 380 m around the quarry walls. This similarity between scenarios is probably explained by the fact that the pumping–discharge scenarios were not sinusoidal and mono-frequent but contained several frequencies. This effect is particularly visible on the hydraulic head fluctuations in the quarry simulated for the random scenario (Figure 4). The lower frequencies control the distance of influence [7]. In addition, the presence of large water bodies around the quarry limited the extension of the zone of influence. In other words, the quarries located at both sides of the central Obourg quarry act as a kind of buffer.
The results reflect the importance of considering these interactions to maximize the efficiency and to minimize the potential environmental impacts. Results obtained with the groundwater flow model show the preponderant influence of the lower frequency of the pumping–discharge cycles. The lower the frequency, and thus the longer the pumping–discharge cycles, the greater the quarry–aquifer interactions. Realistic pumping–discharge scenarios (winter, spring, and summer) used as input to the models had a minimum period of 5 h. If PSH stations are connected to renewable and intermittent energy sources, the management of this production would probably require higher frequencies, with periods shorter than an hour. The random scenario was developed accordingly. Concerning the distances of influence, however, studying low frequencies allows consideration of the safety side and the potentially largest zones of influence [7].

4.3. Evolution of Water Chemistry in the Upper Reservoir

The following results are related to the hydrochemical context described at 2.3. Figure 8 shows the main results simulated with the hydrochemical groundwater model concerning the hydrochemical evolution of the water in the upper reservoir. Figure 7 displays the evolution of pH and the precipitated quantities of calcite, pyrolusite, and goethite.
In the upper reservoir, the chemical equilibrium of the water with the atmosphere induced an increase in the concentration of dissolved O2 and a decrease in the concentration of dissolved CO2. In general, the increase in the dissolved O2 caused the precipitation of pyrolusite and goethite (Equations (6) and (7)), whereas the decrease in dissolved CO2 caused the precipitation of calcite (Equations (1) to (5)). The precipitation of these elements occurred from the first pumping–discharge cycle, during which the amount of precipitated minerals reached a maximum (1.46 × 10⁻⁶, 4.55 × 10⁻⁶, and 1.4×10⁻³ moles of precipitate/L of pyrolusite, goethite, and calcite, respectively) as shown in [9] in the scenario with only calcite. Precipitation continued during the following cycles, but the amount of precipitated minerals decreased gradually as the water pumped into the upper reservoir became depleted in calcium, manganese, and iron. The precipitated quantities were significant, especially at the beginning of the PSH activities. The quantity of precipitated calcite was three orders of magnitude higher than those of goethite and pyrolusite. Precipitated amounts of goethite and pyrolusite were similar, although slightly higher for goethite. Indeed, the iron concentration (4.7 × 10⁻⁶ mol/L) in groundwater was initially higher than that of manganese (1.5 × 10⁻⁶ mol/L). In addition, iron oxidation is preferential and has faster kinetics. Theoretically, calcite, pyrolusite, and goethite should form deposits in the upper reservoir, which would require periodic cleaning tasks. In practice, however, given the flows involved, turbulence in the upper reservoir could reduce these deposits. Overall, the volume of precipitated minerals can be relatively important and periodical cleaning tasks could be needed, which would affect the global efficiency of the PSH plant [9,32]
pH values in the upper reservoir increased drastically during the first pumping–discharge cycle as a result of CO2 degassing and calcite precipitation. After the first cycle, pH remained relatively constant throughout the following cycles, oscillating between 8.16 and 8.18. Note that incrustations were promoted under these values of pH, in accordance with calcite precipitation, and potentially needed cleaning operations.

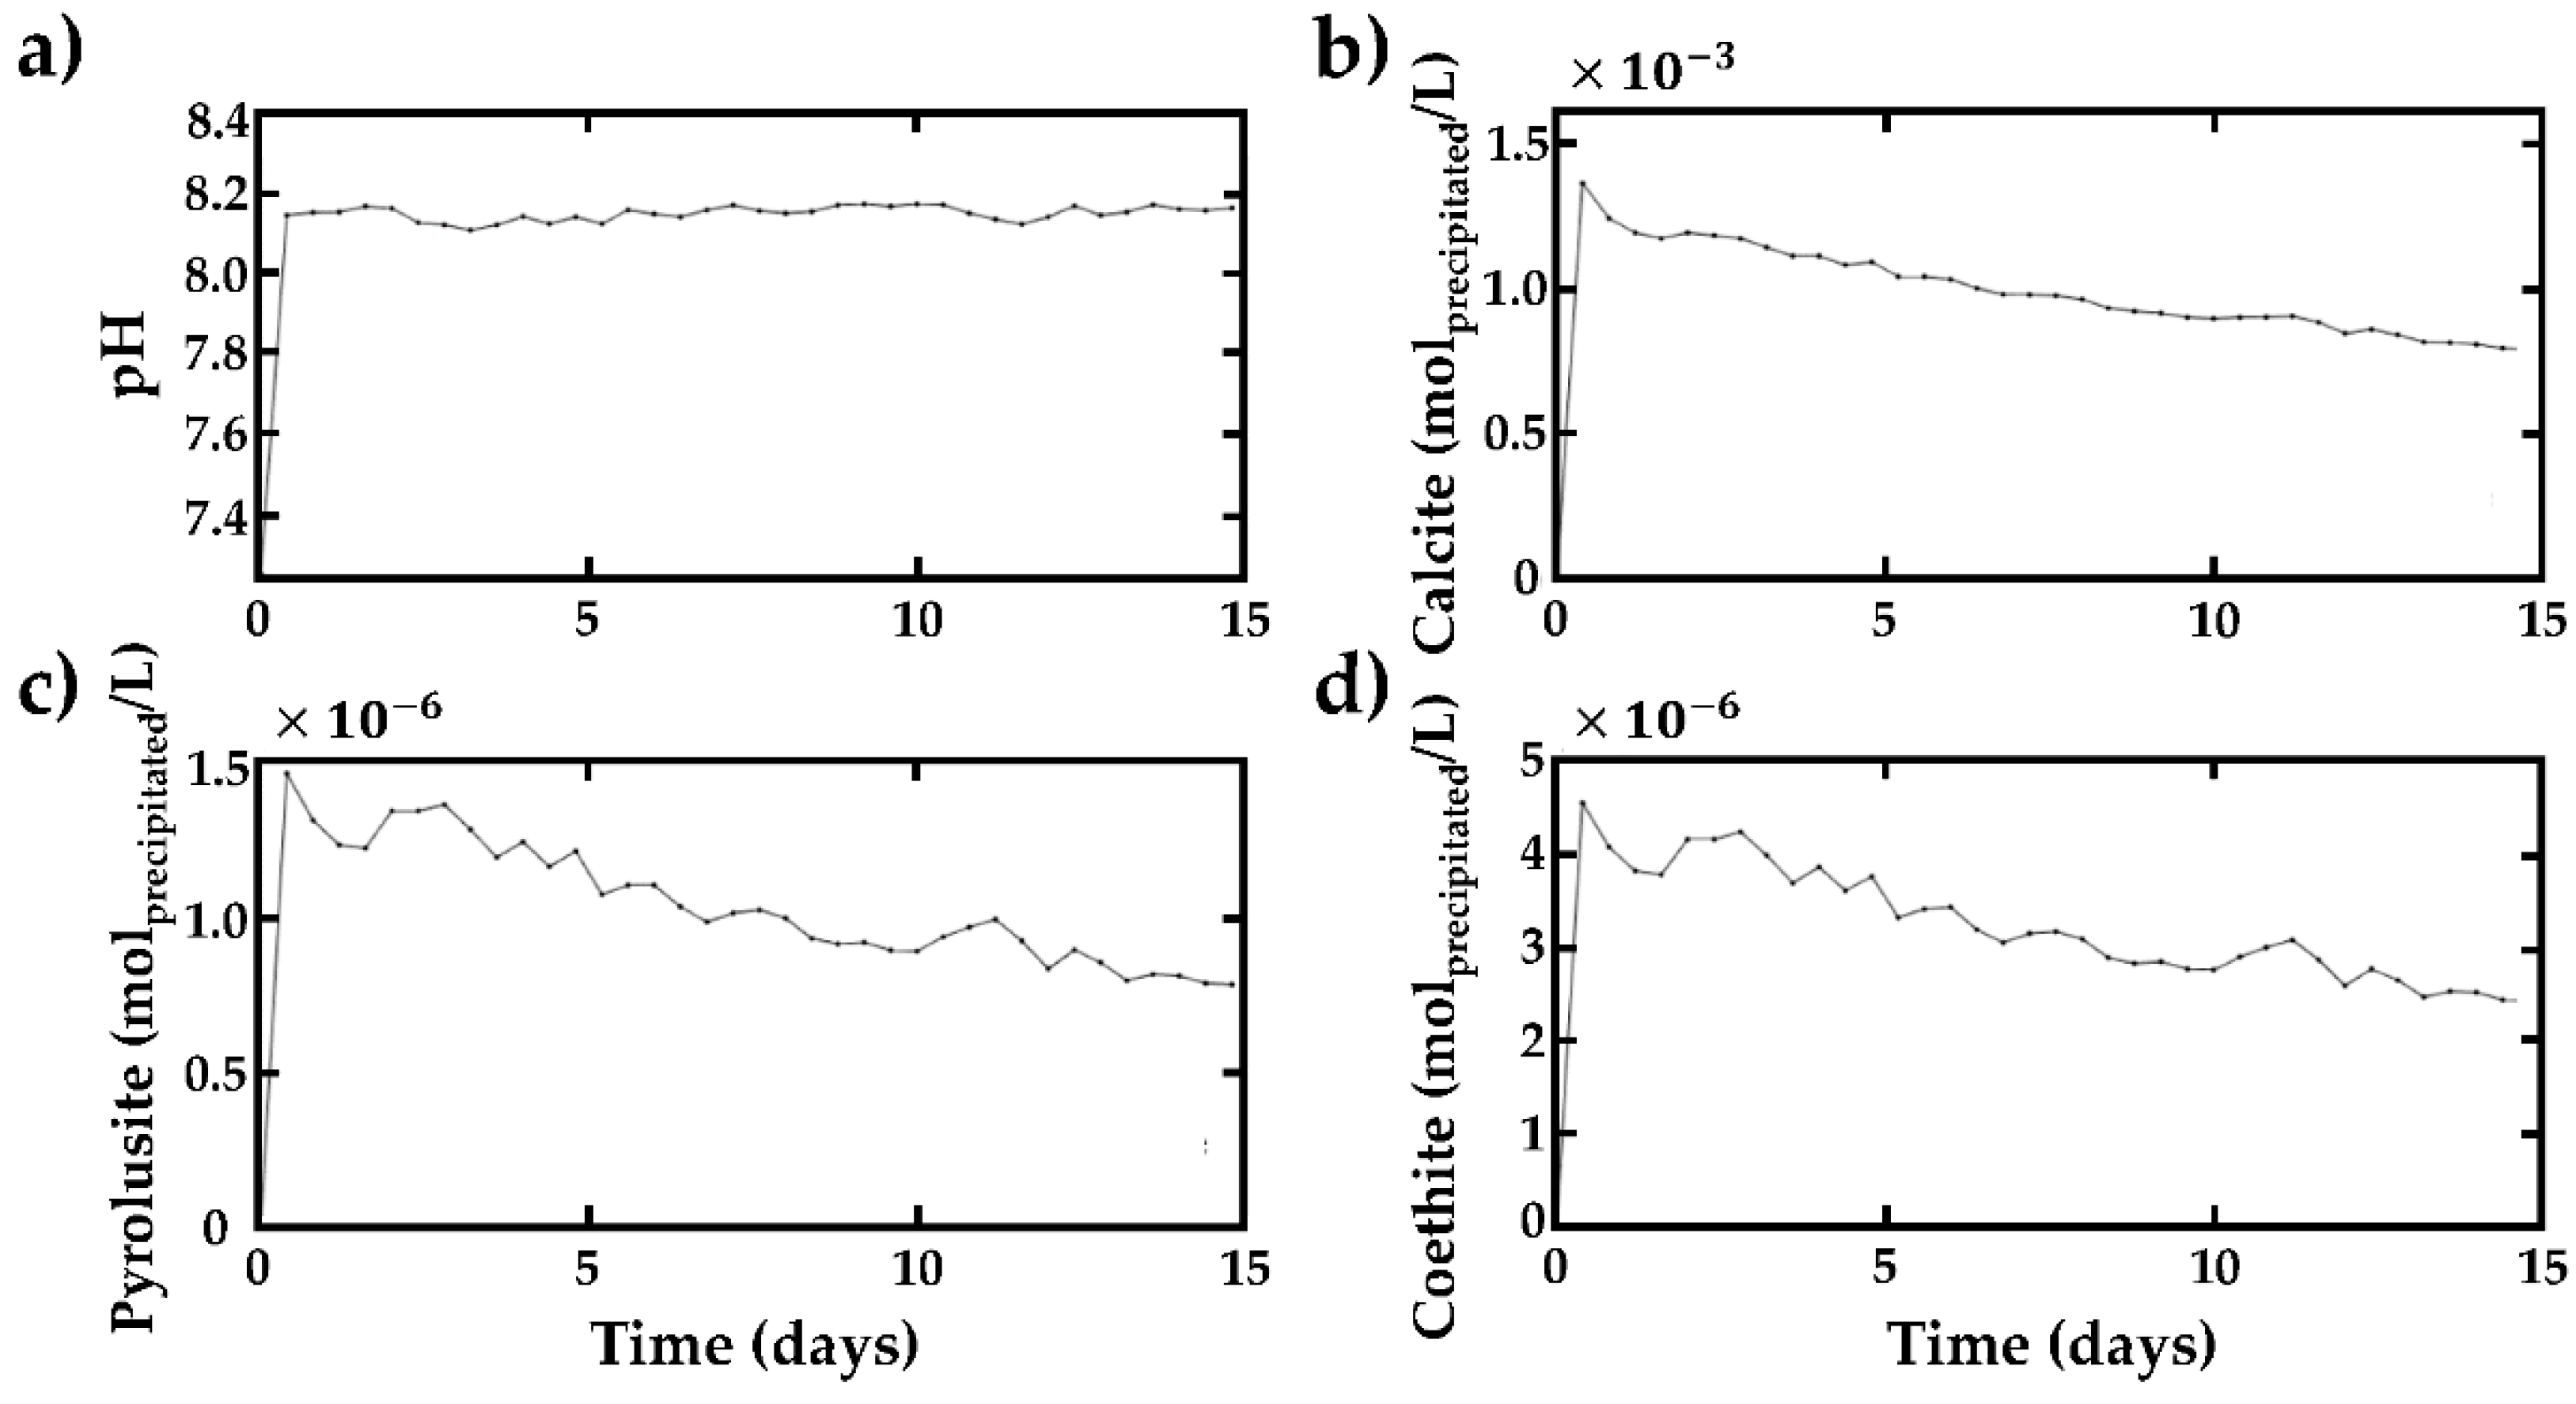
4.4. Hydrochemical Evolution of the Water in the Quarry

Concentrations of Ca2+, Fe2+, and Mg2+ tend to decrease during the pumping–discharge cycles, whereas the average pH increases (Figure 9). The evolution of pH in the quarry was related to that in the upper reservoir where the pH increased abruptly during the first cycle. During discharge phases, the pH of the released water was higher than that of the water in the quarry, and thus, the pH in the quarry tended to increase during each discharge phase. Conversely, during the pumping periods, water from the chalk aquifer, which had lower values of pH than that in the quarry and upper reservoir, inflowed to the quarry causing its pH to decrease. Overall, the pH of the water in the quarry gradually increased towards an average value between the pH of the aquifer and the pH of the upper reservoir through cumulative effects [33]. The volumes of groundwater and chalk rock present in the surrounding aquifer stabilized the chemical equilibrium of the groundwater. This also explains the pH evolution in the quarry towards intermediate values compared to the upper reservoir.
The opposite behavior was observed for Ca2+, Fe2+, and Mg2+. In this case, as a result of calcite, pyrolusite, and goethite precipitation, their concentrations were lower in the upper reservoir than in the chalk aquifer. Thus, concentrations of Ca2+, Fe2+, and Mg2+ increase during pumping phases (water flows from the aquifer towards the lower reservoir) and decrease during discharge phases (the quarry is filled with water from the upper reservoir).

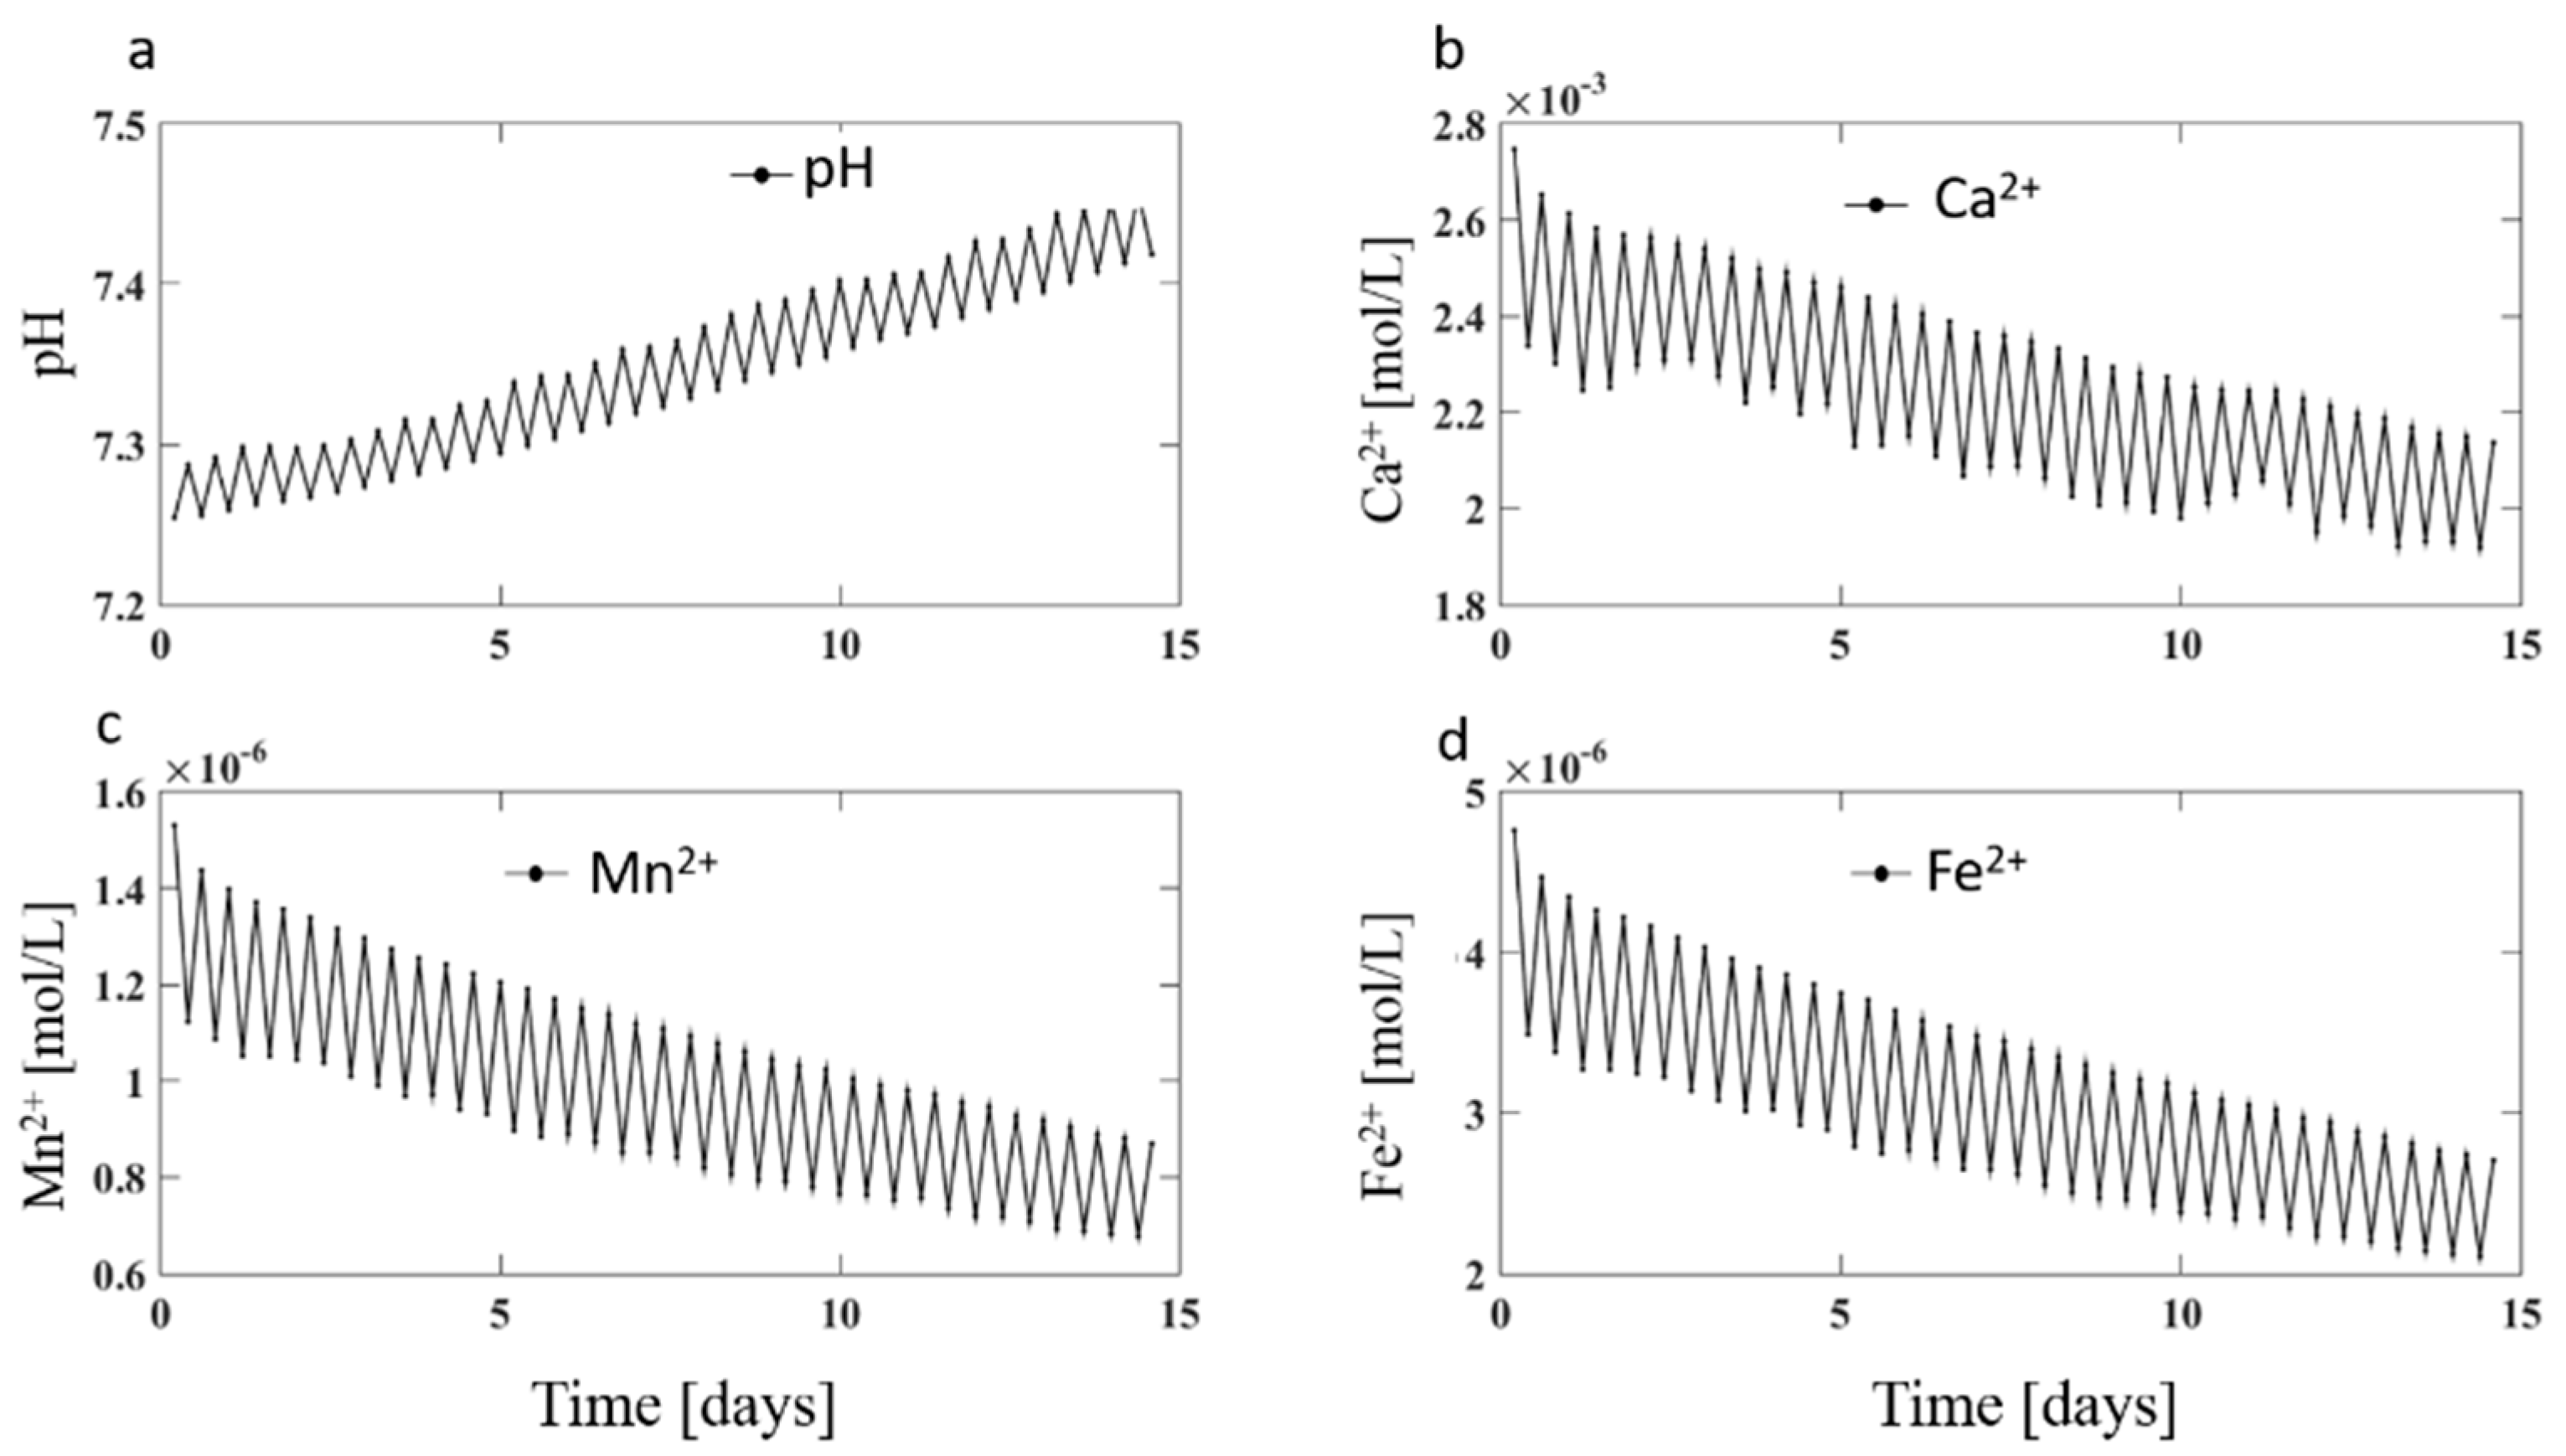
4.5. Hydrochemical Evolution of the Groundwater in the Chalk Aquifer

Regarding the hydrochemical evolution in the aquifer, pH values tended to increase, as in the quarry, but only within a zone limited to the first 20 meters around the quarry (Figure 10).
The increase was lower than in the quarry because of the quantity of water present in the aquifer and the buffering effect of the chalk rock. In addition, the propagation of hydrochemical stresses induced by the pumping–discharge cycles did not lead to the dissolution of calcite within the chalk aquifer since the acidification phenomenon was not intensive enough.

5. Conclusions

The numerical models developed in this study were realistic and representative since they were based on a real quarry that was considered for PSH. The developed numerical models aimed to assess the interactions between the Obourg quarry and the surrounding aquifer systems. From a feasibility point of view, an important problem related to the case of the Obourg quarry is the possible interference of the PSH activities with nearby drinking water catchments.
Results showed that the fluctuation zone of the piezometric head did not reach these catchments after 14 days of pumping–discharge cycles. Concerning the impacts on the water quality, PSH activities tended to soften the water. The precipitation of minerals containing major chemical elements (MnO2, FeO(OH), CaCO3) in the upper reservoir reduced its hardness, causing a slight increase in pH. These hydrochemical changes were strongly attenuated in the aquifer and were only visible in the first few meters around the quarry. Concerning the specific case of the Obourg quarry and its local context, simulated results showed that the hydrochemical changes in the groundwater around the quarry should not influence the hydrochemical characteristics of the groundwater abstracted in the nearby drinking water pumping wells.
PSH activities thus imply an environmental impact around the quarry through the propagation of the piezometric head fluctuations within the chalk aquifer and the modification of the hydrochemical characteristics of the groundwater, which can reduce its quality. Overall, the system behavior and its consequences are strongly dependent on the hydraulic properties of the surrounding medium, and therefore, on the geological and hydrogeological contexts in which a quarry is located. The concentrations of chemical elements and the related equilibria were here considered with relatively constraining assumptions to evaluate the evolution of the hydrochemical conditions in the most problematic case. Achieved results thus correspond to some strong hypotheses. The impact assessment on hydrochemistry was thus performed by considering a certain degree of safety in relation, which is relevant considering the presence of drinking water catchments located near the quarry. The quarry, however, is located in the capture zone of the abstraction stations. In this context, it is important to make sure that the PSH equipment does not emit contaminants, especially regarding any lubricants that may be used.
An equivalent porous media approach was here considered to develop the models. This hypothesis did not consider possible heterogeneities within hydrogeological units. At the scale of the modelled area, this heterogeneity was limited, but it could have an impact on groundwater flow, hydrochemical impact distribution, and related influence zones. For sites with strong heterogeneity, as for example in the case of the karstified limestones, the hypothesis of a homogeneous medium becomes unrealistic. In those cases, the consideration of more complex models would be needed. In the framework of the Obourg quarry model, the regional gradient was neglected. The results of Poulain et al. (2018) nevertheless show that the presence of a regional gradient only has a very slight influence on piezometric head fluctuations and the distance of influence around the quarry. The area around the quarry, where hydrochemical conditions are influenced, is probably not strongly influenced by a realistic hydraulic gradient, although this should be formally evaluated. Finally, the presence of bacteria in the reservoir could also promote chemical reactions during the precipitation of minerals [34]. It would be interesting to assess the impact of organic matter and the bacterial ecosystem present in the groundwater on the hydrogeochemical behavior of the groundwater during the pumping–discharge cycles.
In conclusion, this study highlighted the importance of considering both the hydrodynamic and the hydrochemical aspects of PHS plants. The following points must be considered:
  • Quarries cannot be considered as simple impervious reservoirs. They are in strong interaction with the surrounding aquifers. During PSH operations, water exchanges between the quarry and adjacent aquifers occur. The magnitude of the water exchanges depends on the hydrogeological context. This interaction has an impact on the fluctuation of the hydraulic head in the reservoir, on the difference in level between the upper and lower reservoirs, and on the efficiency of the system [8].
  • The pump–discharge cycles in the reservoirs generate rapid and periodic fluctuations in the water level, which are propagated into the surrounding rock media. This can have an impact on other possible activities (e.g., groundwater abstraction station) in the vicinity. These load/discharge cycles in the rock media can also create potentially significant stability problems. These stability problems may, for example, occur at quarry walls, or in areas of altered rock in the form of localized collapses. These kinds of collapses are, for example, regularly observed around some limestone quarries where the groundwater table is lowered [35].
  • Finally, it is also necessary to evaluate the hydrogeochemical behavior of the system during the PSH activities. From a hydrochemical perspective, carrying out pumping–discharge induces the aeration of the water. This aeration phenomenon can destabilize chemical balances between groundwater and minerals present in the rock. These cycles can therefore influence the chemical composition of the quarry water as well as that of the adjacent aquifer. It is important to study these possible hydrochemical modifications, both from the point of view of the exploited drinking water reservoir and of the water–rock interactions themselves.
This kind of numerical modelling can be developed for any PSH project, considering in each situation the characteristics of the quarry, the geology, hydrogeology and lithology, and the existing mineral species. For a PSH project using a quarry as a lower reservoir, a piezometric network system around the quarry would allow the control of the chemical evolution of the groundwater and would ensure a rapid reaction in case of contamination or unexpected hydrochemical changes.

Author Contributions

Conceptualization, A.P. and P.G.; methodology, A.P., E.P., and P.G.; software, A.P., P.G., and E.P.; validation, AP., E.P., and P.G.; formal analysis, A.P.; investigation, A.P., E.P. and P.G.; resources, A.P., E.P., and P.G.; data curation, A.P., E.P., and P.G.; writing—original draft preparation, A.P.; writing—review and editing, A.P., E.P., and P.G.; visualization, A.P., E.P., and P.G.; supervision, E.P. and P.G.; project administration, P.G.; funding acquisition, P.G. All authors have read and agreed to the published version of the manuscript.

Funding

This research was supported by the Public Service of Wallonia, Department of Energy and Sustainable Building in the framework of the SMARTWATER project. IDAEA-CSIC is a Centre of Excellence Severo Ochoa (Spanish Ministry of Science and Innovation, Project CEX2018-000794-S). E.P. was also funded by the Barcelona City Council through the Award for Scientific Research into Urban Challenges in the City of Barcelona 2020 (20S08708).

Institutional Review Board Statement

Not applicable.

Informed Consent Statement

Not applicable.

Data Availability Statement

All analyzed data in this study has been included in the manuscript.

Conflicts of Interest

The authors declare no conflict of interest. The funders had no role in the design of the study; in the collection, analyses, or interpretation of data; in the writing of the manuscript; or in the decision to publish the results.

References

  1. Menendez, J.; Ordónez, A.; Fernández-Oro, J.M.; Loredo, J.; Díaz-Aguado, M.B. Feasibility analysis of using mine water from abandoned coal mines in Spain for heating and cooling of buildings. Renew. Energy 2020, 146, 1166–1176. [Google Scholar] [CrossRef]
  2. Rehman, S.; Al-Hadhrami, L.M.; Alam, M. Pumped hydro energy storage system: A technological review. Renew. Sustain. Energy Rev. 2015, 44, 586–598. [Google Scholar] [CrossRef]
  3. Uddin, P.N.; Asce, M. Preliminary design of an underground reservoir for pumped storage. Geotech. Geol. Eng. 2003, 21, 331–355. [Google Scholar] [CrossRef]
  4. Erpicum, S.; Archambeau, P.; Dewals, B.; Pirotton, M.; Pujades, E.; Orban, P.; Dassargues, A.; Cerfontaine, B.; Charlier, R.; Poulain, A.; et al. Underground Pumped Hydro-Energy Storage in Wallonia (Belgium) Using Old Mines—Potential and Challenges. In Proceedings of the HYDRO2017 Conference, Sevilla, Spain, 9 October 2017. [Google Scholar]
  5. Madlener, R.; Specht, J. An Exploratory Economic Analysis of Underground Pumped-Storage Hydro Power Plants in Abandoned Coal Mines; Social Science Research Network: Rochester, NY, USA, 2013. [Google Scholar]
  6. Toubeau, J.-F.; Bottieau, J.; De Greve, Z.; Vallee, F.; Bruninx, K. Data-Driven Scheduling of Energy Storage in Day-Ahead Energy and Reserve Markets with Probabilistic Guarantees on Real-Time Delivery. IEEE Trans. Power Syst. 2020, 1. [Google Scholar] [CrossRef]
  7. Poulain, A.; de Dreuzy, J.-R.; Goderniaux, P. Pump Hydro Energy Storage systems (PHES) in groundwater flooded quarries. J. Hydrol. 2018, 559, 1002–1012. [Google Scholar] [CrossRef] [Green Version]
  8. Pujades, E.; Orban, P.; Bodeux, S.; Archambeau, P.; Erpicum, S.; Dassargues, A. Underground pumped storage hydropower plants using open pit mines: How do groundwater exchanges influence the efficiency? Appl. Energy 2017, 190, 135–146. [Google Scholar] [CrossRef]
  9. Pujades, E.; Jurado, A.; Orban, P.; Ayora, C.; Poulain, A.; Goderniaux, P.; Brouyère, S.; Dassargues, A. Hydrochemical changes induced by underground pumped storage hydropower and their associated impacts. J. Hydrol. 2018, 563, 927–941. [Google Scholar] [CrossRef] [Green Version]
  10. Xuan, P.T.; Van Pho, N.; Gas’Kova, O.L.; Bortnikova, S.B. Geochemistry of surface waters in the vicinity of open pit mines at the Cay Cham deposit, Thai Nguyen province, northern Vietnam. Geochem. Int. 2013, 51, 931–938. [Google Scholar] [CrossRef]
  11. Younger, P.L.; Banwart, S.A.; Hedin, R.S. Mine Water: Hydrology, Pollution, Remediation; Environmental Pollution; Springer: Dordrecht, The Netherlands, 2002; ISBN 978-1-4020-0137-6. [Google Scholar]
  12. España, J.S.; Pamo, E.L.; Pastor, E.S.; Andrés, J.R.; Rubí, J.A.M. The Removal of Dissolved Metals by Hydroxysulphate Precipitates during Oxidation and Neutralization of Acid Mine Waters, Iberian Pyrite Belt. Aquat. Geochem. 2006, 12, 269–298. [Google Scholar] [CrossRef]
  13. Severson, M.J. Preliminary Evaluation of Establishing an Underground Taconite Mine, to Be Used Later as a Lower Reservoir in a Pumped Hydro Energy Storage Facility, on the Mesabi Iron Range, Minnesota; University of Minnesota Duluth: Duluth, MI, USA, 2011. [Google Scholar]
  14. Habils, F.; Roland, S.; Rorive, A. Carte Hydrogéologique de Wallonie Au 1/25 000ème (Avec Notice Explicative); Planche Jurbise—Obourg N° 45/3-4; Service Public de Wallonie: Namur, Belgium, 2017. [Google Scholar]
  15. Hallet, V. Étude de la Contamination de la Nappe Aquifère de Hesbaye par les Nitrates: Hydrogéologie, Hydrochimie et Modélisation Mathématique des Écoulements et du Transport en Milieu Saturé (Contamination of the Hesbaye Aquifer by Nitrates: Hydrogeology, Hydrochemistry and Mathematical Modeling); University of Liège: Liège, Belgium, 1998. [Google Scholar]
  16. Brouyère, S. Etude et Modélisation du Transport et du Piégeage des Solutés en Milieu Souterrain Variablement Saturé. Evaluation des Paramètres Hydrodispersifs par la Réalisation et L’interprétation D’essais de Traçage In Situ; Université de Liège: Sart Tilman, Belgique, 2001. [Google Scholar]
  17. Dargne Carte Hydrogéologique de Wallonie [WWW Document]. Carte Hydrogéologique Wallonie. 2017. Available online: http://Environnement.Wallonie.Be/Cartosig/Cartehydrogeo/Application.Htm# (accessed on 29 January 2018).
  18. Gaviglio, P.; Bekri, S.; Vandycke, S.; Adler, P.; Schroeder, C.; Bergerat, F.; Darquennes, A.; Coulon, M. Faulting and deformation in chalk. J. Struct. Geol. 2009, 31, 194–207. [Google Scholar] [CrossRef]
  19. Goderniaux, P.; Beyek, A.; Tchotchom, A.; Poulian, A.; Wattier, M.-L.; Vandycke, S. Study of the heterogeneity of hydraulic properties in a chalk aquifer unit, using sequential pumping and tracing experiments with packer systems. In Engineering in Chalk: Proceedings of the Chalk 2018 Conference, London, UK, 17–18 September 2018; ICE Publishing: London, UK, 2018; pp. 675–680. ISBN 978-0-7277-6407-2. [Google Scholar]
  20. Hoffmann, R.; Goderniaux, P.; Jamin, P.; Chatton, E.; De La Bernardie, J.; Labasque, T.; Le Borgne, T.; Dassargues, A. Continuous dissolved gas tracing of fracture-matrix exchanges. Geophys. Res. Lett. 2020, 47, e2020GL088944. [Google Scholar] [CrossRef]
  21. Marlière, R. Carte Géologique et Texte Explicatif de La Feuille Jurbise—Obourg; Service Géologique de Belgique: Mons, Belgium, 1964. [Google Scholar]
  22. Mercado, A. The kinetics of mineral dissolution in carbonate aquifers as a tool for hydrological investigations, II. Hydrogeochemical models. J. Hydrol. 1977, 35, 365–384. [Google Scholar] [CrossRef]
  23. Edmunds, W.; Cook, J.; Darling, W.; Kinniburgh, D.; Miles, D.; Bath, A.; Morgan-Jones, M.; Andrews, J. Baseline geochemical conditions in the Chalk aquifer, Berkshire, U.K.: A basis for groundwater quality management. Appl. Geochem. 1987, 2, 251–274. [Google Scholar] [CrossRef]
  24. Edmunds, W.; Shand, P.; Hart, P.; Ward, R. The natural (baseline) quality of groundwater: A UK pilot study. Sci. Total. Environ. 2003, 310, 25–35. [Google Scholar] [CrossRef] [Green Version]
  25. Gillon, M.; Crançon, P.; Aupiais, J. Modelling the baseline geochemistry of groundwater in a Chalk aquifer considering solid solutions for carbonate phases. Appl. Geochem. 2010, 25, 1564–1574. [Google Scholar] [CrossRef]
  26. Rorive, A. Determination Des Ressources Souterraines de La Nappe Du Crétacé de La Vallée de La Haine—Convention RW-IDEA, Rapport Final. 1983. [Google Scholar]
  27. Harbaugh, A.W. MODFLOW-2005: The U.S. Geological Survey modular ground-water model—The ground-water flow process. In Techniques and Methods; US Geological Survey: Reston, VI, USA, 2005; Volume 6. [Google Scholar]
  28. Parkhurst, D.L.; Kipp, K.L.; Engesgaard, P.; Charlton, S.R. PHAST—A program for simulating ground-water flow, solute transport, and multicomponent geochemical reactions. U.S. Geol. Surv. Tech. Methods 2005, 6, A8. [Google Scholar]
  29. Kipp, K.L. HST3D: A Computer Code for Simulation of Heat and Solute Transport in Three-Dimensional Ground-Water Flow Systems; Water-Resources Investigations Report; U.S. Geological Survey: Reston, VA, USA, 1987; Volume 86-4095.
  30. Parkhurst, D.; Appelo, T.; Parkhurst, D.L.; Appelo, C.A.J. Description of Input and Examples for PHREEQC Version 3—A Computer Program for Speciation, Batch-Reaction, One-Dimensional Transport, and Inverse Geochemical Calculations. US Geological Survey Techniques and Methods; US Geological Survey: Denver, CO, USA, 2013; Book 6, Chapter A43; 497p.
  31. Pujades, E.; Willems, T.; Bodeux, S.; Orban, P.; Dassargues, A. Underground pumped storage hydroelectricity using abandoned works (deep mines or open pits) and the impact on groundwater flow. Hydrogeol. J. 2016, 24, 1531–1546. [Google Scholar] [CrossRef] [Green Version]
  32. Pujades, E.; Jurado, A.; Orban, P.; Dassargues, A. Parametric assessment of hydrochemical changes associated to underground pumped hydropower storage. Sci. Total. Environ. 2019, 659, 599–611. [Google Scholar] [CrossRef] [PubMed] [Green Version]
  33. Chimie et Pollutions des Eaux Souterraines ATTEIA Olivier. Available online: https://www.lavoisier.fr/livre/environnement/chimie-et-pollution-des-eaux-souterraines/atteia/descriptif-9782743020095 (accessed on 9 April 2021).
  34. Papier, S. Géomicrobiologie des Dépôts Bactériens Ferrugineux: Influence des Facteurs Biologiques et Environnementaux sur L’oxydation du fer en Milieu Continental; Université de Mons: Mons, Belgium, 2014. [Google Scholar]
  35. Kaufmann, O.; Quinif, Y. Geohazard map of cover-collapse sinkholes in the ‘Tournaisis’ area, southern Belgium. Eng. Geol. 2002, 65, 117–124. [Google Scholar] [CrossRef]
Figure 1. View of the Obourg chalk quarries. The red line, intersecting the studied open pit, gives the location of the altimetric profile.
Applsci 11 04913 g001
Figure 2. Modified south–north geological section of the Mons Basin and projection of the Obourg quarry location [21].
Applsci 11 04913 g002
Figure 3. Plan view and 3D view of the hydrogeological model. The red circle highlights the open pit chalk quarry where PSH operations were studied.
Applsci 11 04913 g003
Figure 4. Pumping-discharge scenarios developed and used as inputs to the numerical flow model. Negative flow rate values correspond to pumping operations in the quarry and filling of the upper reservoir. Positive flow rate values correspond to discharge steps of the upper reservoir through the turbines and injection in the quarry.
Applsci 11 04913 g004
Figure 5. Schematization of the hydrogeochemical model.
Applsci 11 04913 g005
Figure 6. Hydraulic head variations in the quarry (red line) and flowrate exchange between the quarry and the chalk aquifer (blue line). Positive and negative values for the exchange flowrate relate to groundwater that flowed towards the quarry and water that flowed from the quarry to the chalk aquifer, respectively.
Applsci 11 04913 g006
Figure 7. Zone of influence of pumping–discharge operations around the Obourg quarry at the end of the simulation time (14 days). A threshold of 0.1 m for piezometric head variations was assumed to delimitate the area of influence. If piezometric head fluctuations were lower than this threshold, it was considered as outside the zone of influence of PSH operations in the aquifer.
Applsci 11 04913 g007
Figure 8. Evolution of hydrogeochemical variables during pumping–injection cycles in the quarry. (a) Evolution of pH. (b) Evolution of the quantity of Ca2+ in moles per liter. (c) Evolution of the quantity of Mn2+ in moles per liter. (d) Evolution of the quantity of Fe2+ in moles per liter.
Applsci 11 04913 g008
Figure 9. Evolution of hydrogeochemical variables during pumping–injection cycles in the quarry. (a) Evolution of pH. (b) Evolution of the quantity of Ca2+ in moles per liter. (c) Evolution of the quantity of Mn2+ in moles per liter. (d) Evolution of the quantity of Fe2+ in moles per liter.
Applsci 11 04913 g009
Figure 10. pH evolution in the quarry and at 10, 20, and 50 m around the quarry.
Applsci 11 04913 g010
Table 1. Average concentration of ions in the chalk aquifer of the Mons Basin [26].
IonConcentration (mg/L)
Ca2+142.2
HCO 3 350.1
Mg2+11.3
Na+26.2
Cl-41.4
SO42111.5
Mn2+0.82
Fe2+2.62
Table 2. Calibrated hydraulic parameters values used in the groundwater flow model of the Obourg quarries.
AlluviumChalkQuarry
Hydraulic conductivity [m/s]10−410−510−1
Specific yield [%]3016100
Table 3. Summary of the results concerning the quarry–groundwater interactions and hydraulic head fluctuations in the quarry during the simulations. These data concern the minimum and maximum hydraulic head in the quarry, the maximum variation in the hydraulic head in the quarry, and the maximum exchange flowrate between the quarry and the aquifer for each scenario.
Min. Hydraulic Head [m]Max. Hydraulic Head [m]Max. Hydraulic Head Variations [m]Max. Exchange Flowrate [m³. s−1]
Winter31.4434.593.140.53
Spring31.4334.553.120.50
Summer31.4334.613.180.53
Random31.5034.442.930.37
Publisher’s Note: MDPI stays neutral with regard to jurisdictional claims in published maps and institutional affiliations.

