Article

Geometric and Volumetric Measurements of Orbital Structures in CT Scans in Thyroid Eye Disease Classification

State Key Laboratory of Ophthalmology, Zhongshan Ophthalmic Center, Sun Yat-Sen University, Guangzhou 510060, China
*
Author to whom correspondence should be addressed.
Authors contributed equally to this work.
Appl. Sci. 2021, 11(11), 4873; https://doi.org/10.3390/app11114873
Submission received: 14 April 2021 / Revised: 13 May 2021 / Accepted: 21 May 2021 / Published: 26 May 2021
(This article belongs to the Special Issue Applications of Geometric Morphometrics and Computational Imaging)

Abstract

:
This study examines the usefulness of both geometric and volumetric measurements of orbital soft tissues on CT scans to provide quantitative diagnostic guidance in image reading of thyroid eye disease (TED). Computed tomography (CT) images were obtained from 92 orbits and were classified as impaired motility (TED-IM) and normal motility (TED-NM). The TED-IM group was further divided into dysthyroid optic neuropathy (DON) and non-DON groups. There were 5 volumetric, 2 angular, and 3 ratio parameter measurements acquired from CT images to examine their feasibility in TED classification. We found that the mean volumes of extraocular muscle and retroorbital fat and their ratio to the orbital volume were significantly different between the two motility groups. The mean ratio of extraocular muscle volume in orbital apex and orbital apex volume (EMV-OA/OAV) was significantly larger in DON than non-DON patients (p < 0.05). The population distribution among TED-NM, non-DON, and DON groups significantly varied for different angles between the optic nerve and medial rectus and lateral rectus. In conclusion, geometric and volumetric measurements using CT scans help to quantitatively classify TED.

Graphical Abstract

1. Introduction

Thyroid eye disease (TED), also known as Graves ophthalmopathy, is an autoimmune disease affecting the orbital tissue. About 25–50% of patients with Graves’ disease will have TED [1,2]. Histologically, TED presents as infiltration of various cytokines and inflammatory mediators in the orbit, with soft tissue swelling in the active stage and tissue atrophic fibrosis in the late phase. Clinical manifestations of TED include periorbital edema, eyelid recession, incomplete closure of the eyelid, and restrictive strabismus [3]. About 5.0% of TED patients develop dysthyroid optic neuropathy (DON), a vision-threatening ocular change [4]. Early diagnosis of DON can therefore help prevent the reduced quality of life resulting from low vision.
The diagnosis of the disease is currently based on a combination of clinical signs and symptoms, laboratory tests, and imaging examinations. Computed tomography (CT) is a routine imaging modality for the diagnosis, treatment evaluation, and postoperative follow-up of TED, and has been widely used in clinical practice. The advantage of CT lies in its high resolution and can clearly display the bony structure, soft tissue, and apical structure of the orbit. Currently, imaging diagnosis lacks a standard quantitative indicator and is quite subjective, being essentially based on the ophthalmologist’s personal experience. A combination of CT and three-dimensional (3D) reconstruction techniques assists in the spatial localization and parameter measurements. Therefore, CT enables quantitative methods to be used for clinical diagnosis. The quantitative relationship between the volumes of orbital tissues based on CT analysis and clinical features of TED has been explored in several studies [5,6]. However, the assessment of eyeball movement and compressive optic neuropathy caused by TED using geometric and volumetric analysis of orbital soft tissue has not been widely studied, especially in Asians.
Therefore, this study aimed to examine the usefulness of both geometric and volumetric measurements of orbital soft tissues on CT scans to provide quantitative diagnostic guidance in TED image reading.

2. Materials and Methods

2.1. Ethical Approval

This study was conducted under the principles outlined in the Declaration of Helsinki and was approved by the Ethics Committee of the Zhongshan Ophthalmic Center (Guangzhou, China 2020KYPJ199). Before the study, written informed consent was collected from all participating individuals.

2.2. Subjects

2.2.1. Inclusion Criteria

In this observational and cross-sectional study, CT scans were obtained from each subject, which was approved by the Zhongshan Ophthalmic Center from October 2019 to January 2021. The TED patients were diagnosed based on Bartley’s criteria [7]. Patients with the following conditions were excluded: (1) younger than 20 years; (2) pregnant; (3) history of eye trauma or operation; (4) history of other ocular diseases or ocular surgery; and (5) history of TED surgery.

2.2.2. Classification of Thyroid Eye Disease (TED) Patients

TED patients were first divided into two groups of patients with impaired motility (TED-IM) and normal motility (TED-NM). The diagnostic criteria for TED-IM were as follows: (1) diplopia; (2) ocular motility disturbance in physical examination; and (3) restrictive strabismus in synoptophore examination.
Then, to evaluate the effect of enlargement of the extraocular muscle on the optic nerve, all cases in the TED-IM group were categorized into DON and non-DON groups. The diagnostic criteria for DON were as follows: (1) delayed visual evoked potential; (2) decreased best-corrected visual acuity not associated with other underlying diseases; and (3) the presence of a visual field defect lower than 5.0 decibels. The representative CT images of TED-NM, TED-IM-Non-DON, and TED-IM-DON are shown in Figure 1.

2.3. Orbital Computed Tomography (CT) Scan

All TED patients, without injecting sedatives or contrast media, were scanned using a high-resolution CT scanner (Somatom Force, Siemens Healthineers, Forchheim, Germany). The CT scans were obtained with contiguous axial slices. Patients were in the supine position and asked to look at a fixed point. The scanning parameters were as follows: 120 kV, 80–100 mAs, 1-mm slice thickness, and 1-mm slice increment.

2.4. Volume and Angle Measurements of Orbital Tissue

A total of 7 parameter measurements, including orbital volume (OV), extraocular muscle volume (EMV), retroorbital fat volume (RFV), orbital apex volume (OAV), extraocular muscle volume in orbital apex (EMV-OA), the angles between medial rectus and optic nerve (AMR-ON), and the angle between the lateral rectus and optic nerve (ALR-ON) were measured, and 3 ratios were further derived. The extraocular muscles include four muscles as follows: medial rectus, lateral rectus, superior rectus, and inferior rectus. We gathered original CT data in DICOM (Digital Imaging and Communications in Medicine) through the imaging department. Digital data were manipulated using the medical imaging software Mimics Research (19.0 version; Leuven, Belgium).
The whole orbital content with soft tissue, including retroorbital fat and extraocular muscles, was discriminated by setting specific windows. The specific window thresholds were set at −200 to −30 Hounsfield Units (HU) for fat, −30 to +100 HU for the EM, and −200 to +100 HU for orbital volume, as Regensburg et al. introduced in 2008 [8]. The orbital boundary reached from anterior to the frontal bone, zygomatic bone, inferior orbital rim, and anterior lacrimal crest and posterior to the entrances of the optic nerve in the optic canal, the pterygopalatine fossa, and superior and inferior fissures. Reconstructed 3D models were generated and OVs were calculated automatically. Retroorbital fat was separated from extraorbital fat by manually drawing a line parallel to the anterior orbital margin. The EM tissue was separated from the lacrimal gland by manually drawing along the EM margin in consecutive slices. Subsequently, RFV and EMV were calculated (Figure 2A–C).
To further investigate the optic nerve compression by the EM within the orbital apex, we defined the spatial range of the orbital apex and measured the orbital volume and the volume of the extraocular muscles in the orbital apex (Figure 2D,E). At the horizontal level, the anterior boundaries were parallel to the line of the anterior lacrimal crest to the fronto-zygomatic bone starting from the midpoint of the lower trigonometric surface of the temporal side of the sphenoid bone. The posterior boundaries were the same as those of the OV. The OAV and EMV-OA were calculated similarly.
In the axial plane, the AMR-ON was defined as the angle between medial rectus (MR) and optic nerve (ON), and the ALR-ON as the angle between lateral rectus (LR) and ON. The AMR-ON and ALR-ON were measured in degrees at the intersection automatically by Mimics software (Figure 2F).

2.5. Statistical Analysis

SPSS (SPSS 26.0 for Windows; SPSS Inc., Chicago, IL, USA) was used for the statistical analyses. A t-test for equality of means was used to differentiate among groups. Where appropriate, analysis of covariance (ANCOVA) and Kruskal–Wallis H test were used. The significance level was set at p < 0.05. Receiver operating characteristics (ROC) curves were applied to describe the ability of the ratios to distinguish groups.

3. Results

3.1. Demographics

A total of 92 orbits were enrolled in our study. There were 39 orbits from males and 53 from females. The average age of subjects was 45.05 ± 13.86 years (mean ± standard deviation), ranging from 24 and 73 years; 62 orbits from TED-IM patients and 30 orbits from TED-NM patients were used for the first categories in discriminating motility impairment. Among the TED-IM patients, DON and non-DON patients were further classified according to the diagnostic criteria mentioned above. Thirty orbits were in the DON group and 32 in the non-DON group. There was no significant difference in gender between the categories. Table 1 and Table 2 list the characteristics of the patients included. It is worth noting that the average age of the TED-IM patients was 47.83 ± 11.49 years, which was much higher than that of the TED-NM patients (p < 0.05).

3.2. Comparison of TED-IM Group and TED-NM Group

These results showed that RFV was greater in TED-NM than in TED-IM subjects (p < 0.05) (Figure 3C). RFV/OV was higher in the TED-NM group than in the TED-IM group (Figure 3D). There was a significant increase in EMV in TED-IM subjects compared to the TED-NM group (p < 0.05) (Figure 3A). EMV/OV and EMV-OA/OAV in the TED-IM group were significantly higher than that in TED-NM subjects (p < 0.05 and p < 0.01) (Figure 3B,E). The difference in orbital volume, orbital apex volume, and EMV-OA between the orbits of TED-NM and TED-IM subjects was not significant (Table 1). To explain the ability of the EMV/OV to differentiate between cases with and without DON, ROC curves were used. The highest performance in identifying TED patients with motility impairment was achieved at EMV/OV = 15.24% with 81.6 percent sensitivity and 93.3 percent specificity (Figure 4A).

3.3. Comparison of DON Group and Non-DON Group in TED-IM Patients

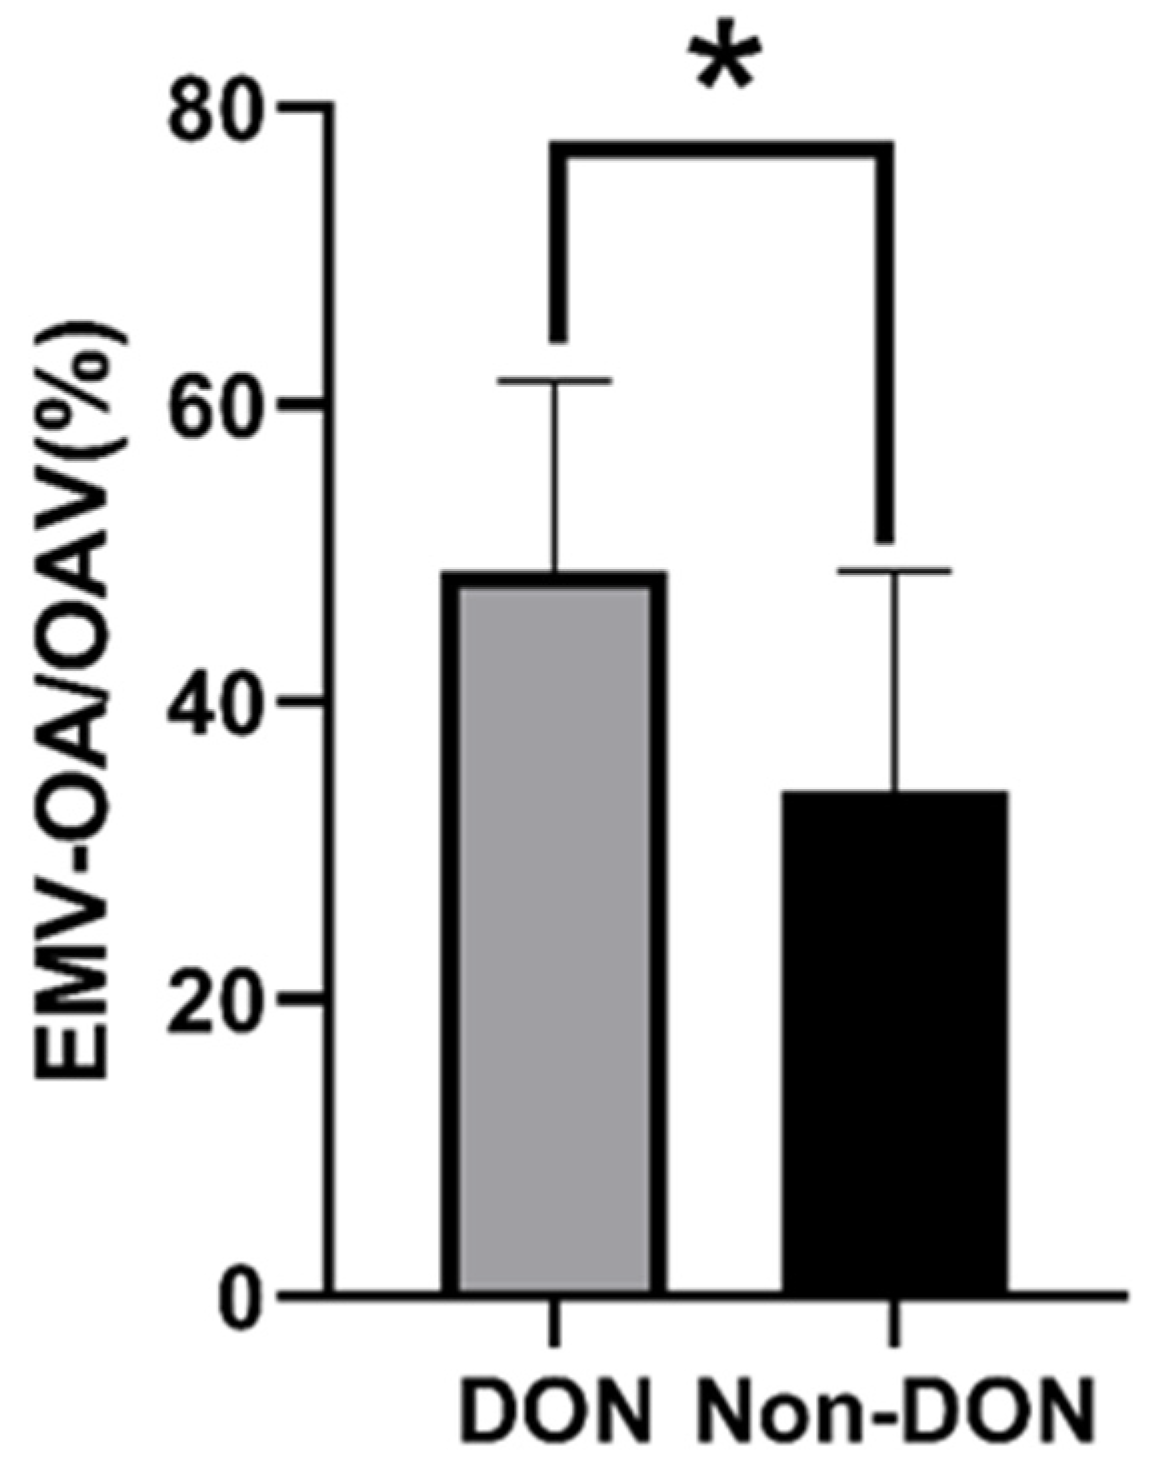
To further investigate the compression of ON in patients with pathologic extraocular muscles, we subdivided this group of patients into the DON group and the non-DON group. EMV-OA/OAV was significantly higher in the DON group than in the non-DON group (p < 0.05), even though differences in OV, EMV, RFV, OAV, and EMV-OA were not significant (Table 2 and Figure 5). The best sensitivity/specificity ratio was achieved with an EMV-OA/OAV cut-off value of 28.75% (Figure 4B).

3.4. Distribution by Population about the AMR-ON and ALR-ON

The value of AMR-ON and ALR-ON were assigned into five intervals, which are 0°, <5°, 5–10°, 10–15°, and >15°. The results showed that the distributions by population of AMR-ON and ALR-ON among TED-NM, non-DON, and DON subjects were significantly different (p < 0.05, Table 3 and Table 4). In the TED-NM group, AMR-ON was mainly distributed in the 10–15° interval (50%), and ALR-ON mostly in the >15° interval (73%). AMR-ON was mostly zero in DON patients (80%), whereas ALR-ON was larger in non-DON patients (Figure 6 and Figure 7).

4. Discussion

TED accounts for 20% of orbital diseases in adults, clinically manifesting in exophthalmos, diplopia, restrictive myopathy, and optic neuropathy. The health-related quality of life of affected people is deeply compromised by these symptoms. The choice of treatment protocols varies according to the severity of the disease and whether it is accompanied by eye movement disorders and visual impairments [9]. Hence, evaluation measures are important to analyze functional changes in all stages of the disease. This study provides objective indicators using CT images of TED patients to reduce the subjectivity of clinical diagnosis of TED from images.
Previous studies have mainly emphasized the relationship between the volume of soft tissue and compressive optic neuropathy [10,11,12]. Nevertheless, little research has been done to explore the feasibility of analyzing soft tissue volume to assess TED classification. TED can be clinically categorized into two subtypes: (1) muscle-dominant TED with diplopia and visual defects and (2) non-muscle-dominant TED, which is often accompanied by proptosis owing to orbital fat hyperplasia [13]. Furthermore, there have not been any clinical attempts to analyze retroorbital fat and extraocular muscle in patients with impaired ocular motility. Thus, we set out to evaluate changes in the orbital tissues, including extraocular muscle (EM) and retroorbital fat (RF) to determine whether CT parameters of orbital soft tissue could be used to detect muscle-dominant and non-muscle dominant TED.
An increase in the volume of RF and EM is one of the obvious signs of TED, based on previous reports [14,15]. These results may have value in discriminating between these two classifications. In this study, we found that EMV and EMV/OV in the orbits of the TED-IM group were larger than those in the TED-NM group. These results are consistent with prior studies and generally accepted, since the impairment is caused by enlarged EM tissue infiltrated with various inflammatory cytokines [16,17]. Moreover, RFV and RFV/OV were found to be smaller in TED-IM patients. Byun et al. found an increased total fat volume in orbits in all patients compared to normal, which suggests that it is universal for TED patients [18]. Our research indicated differences in RF tissue between different subgroups of TED patients, which verified a clinical sub-classification of predominant fat and muscle type in TED patients. EMV/OV ≥15.24% can be considered as a reference parameter in detecting TED-IM patients. In combination with clinical features of diplopia and exophthalmos, this parameter can also be a reference factor when evaluating whether orbital decompression surgery should be performed.
Dysthyroid optic neuropathy (DON) is a serious TED complication that can cause varying degrees of visual impairment [19,20]. Due to clinical features of congestive orbitopathy, it is sometimes difficult to diagnose in its initial stage [4]. CT images can directly demonstrate the extrusion of the optic nerve by EM tissue, which facilitates a precise clinical diagnosis of DON.
EMV-OA/OAV can demonstrate the condition of apical crowding in a quantitative and visual way. Volumetric measurement of EM tissue has been used as an indicator of DON in many studies [21,22]. In our study, we found that EMV and EMV/OV tended to be larger in DON than in non-DON, although the differences were not significant. Chan et al. stressed the importance of using both EM enlargement and bony orbital structures to evaluate DON [23]. Therefore, we attempted a novel measurement by volumetric analysis to quantify the exact crowding condition of the orbital apex. EMV-OA/OAV was significantly larger in DON than non-DON patients. In addition, EMV-OA/OAV can represent the relative degree of compression in the orbital apex, which can effectively compensate for variations in sex and age.
EMV-OA/OAV ≥28.75% can be used as a reference parameter in detecting DON. It explains the deep orbital decompression in orbital reconstructive surgery [24]. It may be worthwhile in the future to conduct a longitudinal study to explore changes in the orbital apex before and after surgical orbital decompression.
Some authors found spontaneous orbital decompression by increased orbital volume to offset the enlarged intraorbital EM and fat tissue [23,25]. Although our study showed no statistical difference in OV, it was found to be larger in patients with DON than in non-DON patients. This probably shows that spontaneous expansion of the orbits does not effectively relieve the increased intraorbital pressure in the late stage. Therefore, damage to the optic nerve happens.
To further investigate the compression that causes DON in TED patients, we measured the AMR-ON and ALR-ON parameters. In TED-NM patients, the angles always exist both in the medial and lateral rectus, which is consistent with clinical findings, since there was no enlarged extraocular muscle. On the other hand, when comparing DON and non-DON patients, a significantly different distribution of the AMR-ON and ALR-ON was found. Overall, AMR-ON was mostly zero in DON patients, while ALR-ON tended to be larger in non-DON than in DON patients. This is consistent with Weis et al.’s finding that MR size is the only variable significantly associated with DON [26]. It is also the reason why we chose to measure angles of MR and LR to ON. It is best to explain the greater impact of MR on DON development in terms of its close interconnectedness to the optic nerve at the orbital apex [27]. It can also explain why medial wall decompression in orbital reconstructive surgeries seems to be a very effective procedure in DON patients [28,29]. The smaller and disappearing angle between recti and ON may also have implications for operative techniques in surgical decompression. A longitudinal study using this geometric analysis is expected, in order to visualize the changes after the surgical expansion of the orbits.
Our research is limited to a relatively small sample size localized in a particular hospital system. When performing CT examination, we should be careful that the time of examination is limited per year due to its radiation. Moreover, imaging features are not a stand-alone indicator for the diagnosis and treatment of TED. The indication for surgery should be based mainly on the clinical features. Furthermore, for a better imaging evaluation of TED patients, magnetic resonance imaging (MRI) examination should be included.
In conclusion, geometric and volumetric measurements using CT scans are supplemental quantitative methods in the image-based diagnosis of TED combined with clinical ophthalmological diagnosis.

Author Contributions

Conceptualization, R.L.; data curation, Y.B. and H.M.; formal analysis, Z.Z.; methodology, Z.Z.; project administration, Y.B. and Y.W.; software, Y.B. and Z.Z.; supervision, R.L. and G.L.; validation, P.Y.; writing—original draft, Y.B. and Z.Z.; writing—review & editing, R.L. and C.L. All authors have read and agreed to the published version of the manuscript.

Funding

This work was financially supported by the Natural Science Foundation of Guangdong Province, China (General Program, No. 2019A1515010361) and High-level Hospital Construction Project (303010406). The funding organizations had no role in the design or conduct of this research.

Institutional Review Board Statement

Ethical approval and patient consent were obtained before surgery and the procedures adhered to the tenets of the 1964 Declaration of Helsinki. Protocols were approved by the Institutional Ethics Committee (2020KYPJ199, Medical Ethics Committee, Zhongshan Ophthalmic Center, Guangzhou, Guangdong, China).

Informed Consent Statement

For images that reveal personal identity, informed consent to publish was obtained from legal guardians of participants aged under 18 years.

Data Availability Statement

The dataset supporting the conclusions of this article is included within the article.

Conflicts of Interest

The authors report no conflict of interest.

References

  1. Lazarus, J.H. Epidemiology of Graves’ orbitopathy (GO) and relationship with thyroid disease. Best Pract. Res. Clin. Endocrinol. Metab. 2012, 26, 273–279. [Google Scholar] [CrossRef]
  2. Gharib, S.; Moazezi, Z.; Bayani, M.A. Prevalence and severity of ocular involvement in Graves’ disease according to sex and age: A clinical study from Babol, Iran. Casp. J. Intern. Med. 2018, 9, 178–183. [Google Scholar] [CrossRef]
  3. Bahn, R.S. Graves’ ophthalmopathy. N. Engl. J. Med. 2010, 362, 726–738. [Google Scholar] [CrossRef] [Green Version]
  4. Saeed, P.; Tavakoli Rad, S.; Bisschop, P. Dysthyroid Optic Neuropathy. Ophthalmic Plast. Reconstr. Surg. 2018, 34, S60–S67. [Google Scholar] [CrossRef]
  5. Bingham, C.M.; Harris, M.A.; Realini, T.; Nguyen, J.; Hogg, J.P.; Sivak-Callcott, J.A. Calculated computed tomography volumes of lacrimal glands and comparison to clinical findings in patients with thyroid eye disease. Ophthalmic Plast. Reconstr. Surg. 2014, 30, 116–118. [Google Scholar] [CrossRef] [PubMed]
  6. Chaganti, S.; Mundy, K.; DeLisi, M.P.; Nelson, K.M.; Harrigan, R.L.; Galloway, R.L.; Landman, B.A.; Mawn, L.A. Assessment of Orbital Computed Tomography (CT) Imaging Biomarkers in Patients with Thyroid Eye Disease. J. Digit. Imaging 2019, 32, 987–994. [Google Scholar] [CrossRef] [PubMed]
  7. Bartley, G.B.; Gorman, C.A. Diagnostic criteria for Graves’ ophthalmopathy. Am. J. Ophthalmol. 1995, 119, 792–795. [Google Scholar] [CrossRef]
  8. Regensburg, N.I.; Kok, P.H.; Zonneveld, F.W.; Baldeschi, L.; Saeed, P.; Wiersinga, W.M.; Mourits, M.P. A new and validated CT-based method for the calculation of orbital soft tissue volumes. Investig. Ophthalmol. Vis. Sci. 2008, 49, 1758–1762. [Google Scholar] [CrossRef] [PubMed] [Green Version]
  9. Johnson, B.T.; Jameyfield, E.; Aakalu, V.K. Optic neuropathy and diplopia from thyroid eye disease: Update on pathophysiology and treatment. Curr. Opin. Neurol. 2021, 34, 116–121. [Google Scholar] [CrossRef] [PubMed]
  10. Gonçalves, A.C.; Silva, L.N.; Gebrim, E.M.; Monteiro, M.L. Quantification of orbital apex crowding for screening of dysthyroid optic neuropathy using multidetector CT. AJNR Am. J. Neuroradiol. 2012, 33, 1602–1607. [Google Scholar] [CrossRef] [Green Version]
  11. Monteiro, M.L.; Gonçalves, A.C.; Silva, C.T.; Moura, J.P.; Ribeiro, C.S.; Gebrim, E.M. Diagnostic ability of Barrett’s index to detect dysthyroid optic neuropathy using multidetector computed tomography. Clinics 2008, 63, 301–306. [Google Scholar] [CrossRef] [PubMed] [Green Version]
  12. Weis, E.; Heran, M.K.; Jhamb, A.; Chan, A.K.; Chiu, J.P.; Hurley, M.C.; Rootman, J. Clinical and soft-tissue computed tomographic predictors of dysthyroid optic neuropathy: Refinement of the constellation of findings at presentation. Arch. Ophthalmol. 2011, 129, 1332–1336. [Google Scholar] [CrossRef] [PubMed] [Green Version]
  13. Linquist, R.A.; Symons, R.C.; O’Bryhim, B.; Whittaker, T.J.; Sokol, J.A. Cytokine profiles in clinical subtypes of ophthalmic Graves’ disease. Orbit 2014, 33, 363–368. [Google Scholar] [CrossRef] [PubMed]
  14. Khong, J.J.; McNab, A.A.; Ebeling, P.R.; Craig, J.E.; Selva, D. Pathogenesis of thyroid eye disease: Review and update on molecular mechanisms. Br. J. Ophthalmol. 2016, 100, 142–150. [Google Scholar] [CrossRef] [Green Version]
  15. Taylor, P.N.; Zhang, L.; Lee, R.W.J.; Muller, I.; Ezra, D.G.; Dayan, C.M.; Kahaly, G.J.; Ludgate, M. New insights into the pathogenesis and nonsurgical management of Graves orbitopathy. Nat. Rev. Endocrinol. 2020, 16, 104–116. [Google Scholar] [CrossRef] [PubMed]
  16. Łacheta, D.; Poślednik, K.B.; Czerwaty, K.; Ludwig, N.; Molińska-Glura, M.; Kantor, I.; Jabłońska-Pawlak, A.; Miśkiewicz, P.; Głuszko, A.; Stopa, Z.; et al. RAGE and HMGB1 Expression in Orbital Tissue Microenvironment in Graves’ Ophthalmopathy. Mediat. Inflamm. 2021, 2021, 8891324. [Google Scholar] [CrossRef]
  17. Wang, Y.; Chen, Z.; Wang, T.; Guo, H.; Liu, Y.; Dang, N.; Hu, S.; Wu, L.; Zhang, C.; Ye, K.; et al. A novel CD4+ CTL subtype characterized by chemotaxis and inflammation is involved in the pathogenesis of Graves’ orbitopathy. Cell. Mol. Immunol. 2021, 18, 735–745. [Google Scholar] [CrossRef]
  18. Byun, J.S.; Moon, N.J.; Lee, J.K. Quantitative analysis of orbital soft tissues on computed tomography to assess the activity of thyroid-associated orbitopathy. Graefe’s Arch. Clin. Exp. Ophthalmol. 2017, 255, 413–420. [Google Scholar] [CrossRef]
  19. Smith, T.J.; Hegedüs, L. Graves’ Disease. N. Engl. J. Med. 2016, 375, 1552–1565. [Google Scholar] [CrossRef] [Green Version]
  20. Dolman, P.J. Dysthyroid optic neuropathy: Evaluation and management. J. Endocrinol. Investig. 2021, 44, 421–429. [Google Scholar] [CrossRef]
  21. Yu, B.; Gong, C.; Ji, Y.F.; Xia, Y.; Tu, Y.H.; Wu, W.C. Predictive parameters on CT scan for dysthyroid optic neuropathy. Int. J. Ophthalmol. 2020, 13, 1266–1271. [Google Scholar] [CrossRef] [PubMed]
  22. Regensburg, N.I.; Wiersinga, W.M.; Berendschot, T.T.; Potgieser, P.; Mourits, M.P. Do subtypes of graves’ orbitopathy exist? Ophthalmology 2011, 118, 191–196. [Google Scholar] [CrossRef] [PubMed]
  23. Chan, L.L.; Tan, H.E.; Fook-Chong, S.; Teo, T.H.; Lim, L.H.; Seah, L.L. Graves ophthalmopathy: The bony orbit in optic neuropathy, its apical angular capacity, and impact on prediction of risk. Ajnr. Am. J. Neuroradiol. 2009, 30, 597–602. [Google Scholar] [CrossRef] [PubMed] [Green Version]
  24. Boboridis, K.G.; Uddin, J.; Mikropoulos, D.G.; Bunce, C.; Mangouritsas, G.; Voudouragkaki, I.C.; Konstas, A.G. Critical Appraisal on Orbital Decompression for Thyroid Eye Disease: A Systematic Review and Literature Search. Adv. Ther. 2015, 32, 595–611. [Google Scholar] [CrossRef] [PubMed] [Green Version]
  25. Tan, N.Y.Q.; Leong, Y.Y.; Lang, S.S.; Htoon, Z.M.; Young, S.M.; Sundar, G. Radiologic Parameters of Orbital Bone Remodeling in Thyroid Eye Disease. Investig. Ophthalmol. Vis. Sci. 2017, 58, 2527–2533. [Google Scholar] [CrossRef] [Green Version]
  26. Weis, E.; Heran, M.K.; Jhamb, A.; Chan, A.K.; Chiu, J.P.; Hurley, M.C.; Rootman, J. Quantitative computed tomographic predictors of compressive optic neuropathy in patients with thyroid orbitopathy: A volumetric analysis. Ophthalmology 2012, 119, 2174–2178. [Google Scholar] [CrossRef]
  27. Engin, Ö.; Adriaensen, G.; Hoefnagels, F.W.A.; Saeed, P. A systematic review of the surgical anatomy of the orbital apex. Surg. Radiol. Anat. 2021, 43, 169–178. [Google Scholar] [CrossRef]
  28. Choe, C.H.; Cho, R.I.; Elner, V.M. Comparison of lateral and medial orbital decompression for the treatment of compressive optic neuropathy in thyroid eye disease. Ophthalmic Plast. Reconstr. Surg. 2011, 27, 4–11. [Google Scholar] [CrossRef]
  29. McCann, J.D.; Goldberg, R.A.; Anderson, R.L.; Burroughs, J.R.; Ben Simon, G.J. Medial wall decompression for optic neuropathy but lateral wall decompression with fat removal for non vision-threatening indications. Am. J. Ophthalmol. 2006, 141, 916–917. [Google Scholar] [CrossRef]
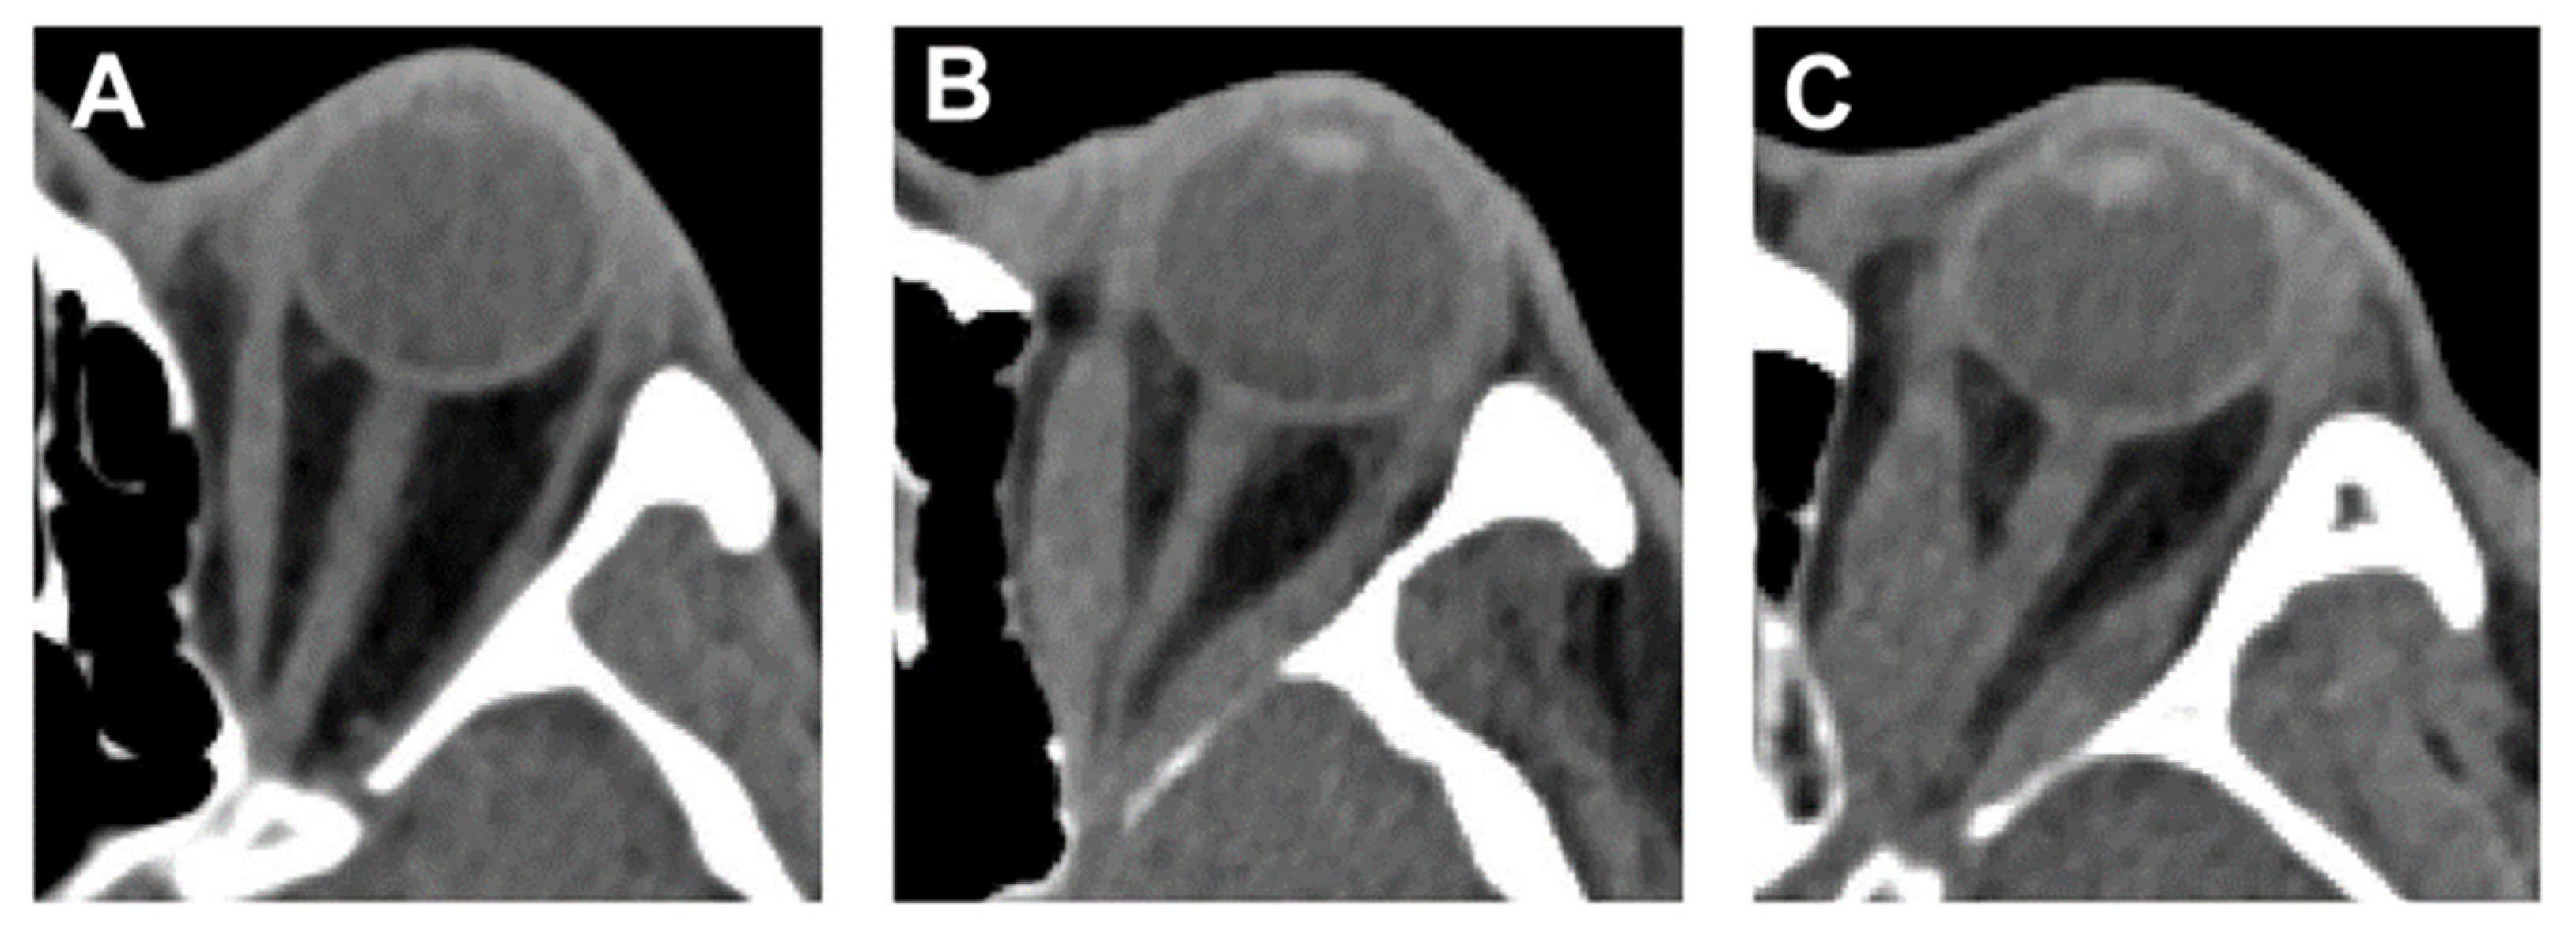
Figure 1. The computed tomography (CT) images of patients with thyroid eye disease (TED) with normal motility (TED-NM) (A), non-dysthyroid optic neuropathy (DON) in impaired motility (IM) group (TED-IM-Non-DON) (B), and TED-IM-DON (C).
Applsci 11 04873 g001
Figure 2. Axial CT slices with the highlighted segmented tissues. (A) orbital volume (OV), (B) extraocular muscle volume (EMV), (C) retroorbital fat volume (RFV), (D) orbital apex volume (OAV), (E) extraocular muscle volume in orbital apex (EMV-OA), (F) the angle between the medial rectus and optic nerve (AMR-ON), and the angle between the lateral rectus and optic nerve (ALR-ON).
Applsci 11 04873 g002
Figure 3. The comparison of the soft tissue volumes between TED-IM and TED-NM groups. (A) EMV, (B) EMV/OV, (C) RFV, (D) RFV/OV, and (E) EMV-OA/OAV (* p < 0.05, ** p < 0.01).
Applsci 11 04873 g003
Figure 4. (A) Ability of the EMV/OV to discriminate between cases with and without motility impairment in the ROC curve. (B) Ability of the EMV-OA/OAV to discriminate between cases with and without DON in the ROC curve.
Applsci 11 04873 g004
Figure 5. The comparison of the EMV-OA/OAV between DON and non-DON groups (* p < 0.05).
Applsci 11 04873 g005
Figure 6. Population distribution of the angle between the medial rectus and optic nerve.
Applsci 11 04873 g006
Figure 7. Population distribution of the angle between the lateral rectus and optic nerve.
Applsci 11 04873 g007
Table 1. Clinical characteristics of TED patients with impaired motility (TED-IM) and normal motility (TED-NM).
CharacteristicsTED-IMTED-NMp Value
Number of orbits6230
Age (years)47.83 ± 11.4939.11 ± 12.86<0.05(0.012)
Sex (male: female)
Parameters of orbits
31:318:220.309
OV (cm3)22.31 ± 0.3823.06 ± 0.650.357
EMV (cm3)4.59 ± 0.253.23 ± 0.43<0.05(0.014)
RFV (cm3)7.60 ± 0.469.86 ± 0.64<0.05(0.012)
EMV/OV (%)20.44 ± 1.0613.68 ± 1.82<0.05(0.004)
RFV/OV (%)33.89 ± 20.3642.95 ± 2.84<0.05(0.023)
OAV (cm3)1.79 ± 0.911.70 ± 0.150.813
EMV-OA (cm3)0.80 ± 0.580.34 ± 0.080.064
EMV-OA/OAV (%)42.43 ± 15.3720.46 ± 5.41<0.05(0.001)
OV: orbital volume, EMV: extraocular muscle volume, RFV: retroorbital fat volume, OAV: orbital apex volume, EMV-OA: extraocular muscle volume in orbital apex.
Table 2. Clinical characteristics of DON and non-DON groups.
CharacteristicsDONNon-DONp Value
Number of orbits3032
Age (years)48.65 ± 11.7947.09 ± 11.430.666
Sex (male: female)
Parameters of orbits
16:1415:170.775
OV (cm3)23.02 ± 2.5121.97 ± 2.040.172
EMV (cm3)4.93 ± 1.154.44 ± 2.050.386
RFV (cm3)8.38 ± 2.077.57 ± 3.000.466
EMV/OV (%)21.45 ± 4.6519.93 ± 8.260.504
RFV/OV (%)36.22 ± 9.8034.47 ± 14.100.711
OAV (cm3)1.68 ± 0.791.94 ± 1.060.391
EMV-OA (cm3)0.83 ± 0.490.77 ± 0.700.759
EMV-OA/OAV (%)48.81 ± 12.7934.07 ± 14.30<0.05(0.003)
Table 3. Population distribution of the angle between the medial rectus and optic nerve (AMR-ON).
AMR-ON<5°5–10°10–15°>15°Amount
TED-NM (orbits, %)0(0)0(0)10(33)15(50)5(17)30(100)
TED-IM (orbit number, %)non-DON3(9)12(38)15(47)2(6)0(0)32(100)
DON24(80)4(13)2(7)0(0)0(0)30(100)
AMR-ON: the angle between medial rectus and optic nerve.
Table 4. Population distribution of the angle between the lateral rectus and optic nerve (ALR-ON).
ALR-ON<5°5–10°10–15°>15°Amount
TED-NM (orbit number, %)0(0)0(0)1(3)7(23)22(73)30(100)
TED-IM (orbit number, %)non-DON1(3)2(6)7(22)18(56)4(13)32(100)
DON9(30)4(13)7(23)8(27)2(7)30(100)
ALR-ON: the angle between lateral rectus and optic nerve.
Publisher’s Note: MDPI stays neutral with regard to jurisdictional claims in published maps and institutional affiliations.