Article

Fabricating TiNiCu Ternary Shape Memory Alloy by Directed Energy Deposition via Elemental Metal Powders

1
Department of Mechanical and Aerospace Engineering, Missouri University of Science and Technology, Rolla, MO 65409, USA
2
Energy and Environment Science and Technology, Idaho National Laboratory, Idaho Falls, ID 83415, USA
3
Department of Materials Science and Engineering, Missouri University of Science and Technology, Rolla, MO 65409, USA
*
Author to whom correspondence should be addressed.
Appl. Sci. 2021, 11(11), 4863; https://doi.org/10.3390/app11114863
Submission received: 28 April 2021 / Revised: 12 May 2021 / Accepted: 20 May 2021 / Published: 25 May 2021

Abstract

:
In this paper, a TiNiCu shape memory alloy single-wall structure was fabricated by the directed energy deposition technique with a mixture of elemental Ti, Ni, and Cu powders following the atomic percentage of Ti50Ni45Cu5 to fully utilize the material flexibility of the additive manufacturing process to develop ternary shape memory alloys. The chemical composition, phase, and material properties at multiple locations along the build direction were studied, using scanning electron microscopy, energy-dispersive X-ray spectroscopy, X-ray diffraction, Vickers hardness testing, tensile testing, and differential scanning calorimetry. The location-dependent compositions of martensitic TiNi and austenitic TiNi phases, mechanical properties, and functional properties were investigated in detail. Variations were found in atomic compositions of Ti, Ni, and Cu elements along the build direction due to the complex interaction between elemental powders and laser processing. Good correlations were present among the chemical composition, phase constituent, hardness, and feature of phase transformation temperatures at various locations. The ultimate tensile strength of the as-deposited TiNiCu alloy is comparable with the previously reported additively manufactured TiNi binary alloys. By adding Cu, a much lower thermal hysteresis was achieved, which shows good feasibility of fabricating ternary TiNiCu shape memory alloys, using elemental powders in the directed energy deposition to adjust the thermal hysteresis.

1. Introduction

Additive manufacturing (AM) has become a novel and essential fabrication method. The layer-based additive feature makes AM more flexible in both geometry and materials [1]. Directed energy deposition (DED) is an AM process that applies an energy source to melt raw materials, such as metal powder or wire, and join them into solid parts [2]. Among various DED-related techniques, laser and powders are commonly used energy sources and raw materials, respectively [2]. Nowadays, as the manufacturing techniques of metal powder is improving, various types of metallic materials and industrial alloys have been made into pre-alloyed powders and thus used in DED, including steels [3,4,5], Inconel [6,7,8], titanium alloys such as Ti-6Al-4V [9,10,11] and aluminum alloys [12,13]. Apart from using a single type of pre-alloyed powder in DED, blending multiple types of powders creates much more possibilities to generate new metallic materials and composites with more advantages and, at the same time, the cost can be reduced [14]. Examples include mixing metallic alloy powders with hard ceramic powders, such as TiC, SiC, and WC [15,16,17,18], to gain high hardness and wear resistance, and blending various types of elemental metal powders to synthesize industrial alloys and novel alloys, such as functionally graded alloys and high entropy alloys [19,20,21,22,23,24]. A schematic diagram for the mechanism of DED using laser and pre-mixed powders is demonstrated in Figure 1.
TiNi alloy has attracted much more attention in applications in various engineering areas due to its unique shape memory effect and superelastic behavior [25,26]. Researchers have found AM to be a good choice to fabricate TiNi since conventional machining is challenging [27]. Several previous works attempted to fabricate TiNi alloys via pre-alloyed TiNi powders [28,29]. Due to the high cost of producing pre-alloyed TiNi powders, blending Ti and Ni elemental powders has become a novel approach to fabricate TiNi alloys with more flexibility and low cost [27]. It was reported that a small amount of a third metal element could be added to design new ternary shape memory alloys [30]. A good example of metal elements that can act as the third element is Cu. Adding Cu in TiNi alloy to replace a small portion of Ni attracts interest due to its capability to shorten thermal hysteresis, which can be more welcomed in the field of actuator fabrication [30].
According to the high material flexibility of the DED process, adjusting material properties by adding a third element in the Ti–Ni system can be carried out in a more flexible way [31]. However, manufacturing ternary shape memory alloys by DED has not been extensively reported. Shiva et al. [32] attempted to fabricate TiNiCu ternary alloys via the DED process with elemental powders, and they compared material properties among TiNiCu parts with different Cu compositions. However, some special aspects were not reported in detail in [32]. For DED using elemental powders as feedstocks, it is also worth mentioning the inhomogeneity of composition, microstructure, phase formation, and material properties reported in the works of elemental powder-based DED [31]. The DED process can cause anisotropic material behaviors due to its layer-wise fashion [33], and for parts fabricated by DED with an elemental powder mixture, the interaction between the powder mixture and energy is more complex than using pre-alloyed powders [31]. Thus, the composition of the final as-fabricated part can be location dependent with compositional deviations [31]. In [32], the location information and the correlation among chemical compositions, phase, and material behaviors at various locations within an as-fabricated TiNiCu alloy part were not fully described. Therefore, in this work, we use a Ti, Ni, and Cu elemental powder mixture to fabricate a TiNiCu ternary shape memory alloy to find out more about the correlation among the composition, phase, mechanical properties, and functional properties, which could provide a more comprehensive understanding of the structure–property relationship in the TiNiCu ternary shape memory alloy, especially when fabricated by the elemental powder-based DED process.

2. Materials and Methods

2.1. Materials

The feedstock for this DED experimental study is a mixture of near-spherical elemental Ti, Ni, and Cu powders. The Ti, Ni, and Cu powders were supplied by AP&C, Atlantic Equipment Engineers, and Royal Metal Powders Inc., respectively. A Hitachi S4700 scanning electron microscope (SEM) was applied to obtain images of powders. SEM images of Ti, Ni, and Cu powders are shown in Figure 2. Those powders were weighted according to the atomic percentage of 50 at.% Ti, 45 at.% Ni, and 5 at.% Cu. The weighted Ti, Ni, and Cu powders were mixed and homogenized using a Turbula T2F powder mixer for 20 min. Grade-2 Ti bar with a dimension of 2 × ½ × ¼ inch was selected as the substrate material. The deposition was performed on the 2 × ½ inch horizontal surface. Before the deposition experiment, the 2 × ½ inch flat surface was ground by sandpapers to remove the surface oxidation layer and wiped with acetone to remove dust particles.

2.2. DED Fabrication

The DED fabrication process in this work was carried out by an in-house developed laser powder DED system, which consists of a continuous wave fiber laser manufactured by IPG Photonics with a wavelength of 1064 nm and a maximum power of 1 kW, a deposition platform controlled by computer numerical control (CNC) with x, y, and z movements, and a powder feeder designed by Powder Motion Labs. The diameter of the laser beam was set at 2 mm. During the deposition process, the laser power generated a melt pool on the solid materials. At the same time, the powder mixture was carried by Ar gas and delivered through a vertical powder nozzle. A TiNiCu single wall was deposited by applying the laser beam to travel back and forth with a distance of 30 mm. The laser power was set at 600 W for the first layer and 400 W for the rest of the layers; the laser travel speed was 250 mm/min. In the meantime, the powder blend was fed into the melt pool steadily and continuously. The deposition was performed in an Ar atmosphere. The average height of the entire single wall is approximately 16 mm.

2.3. Microstructure, Element Composition, and Phase

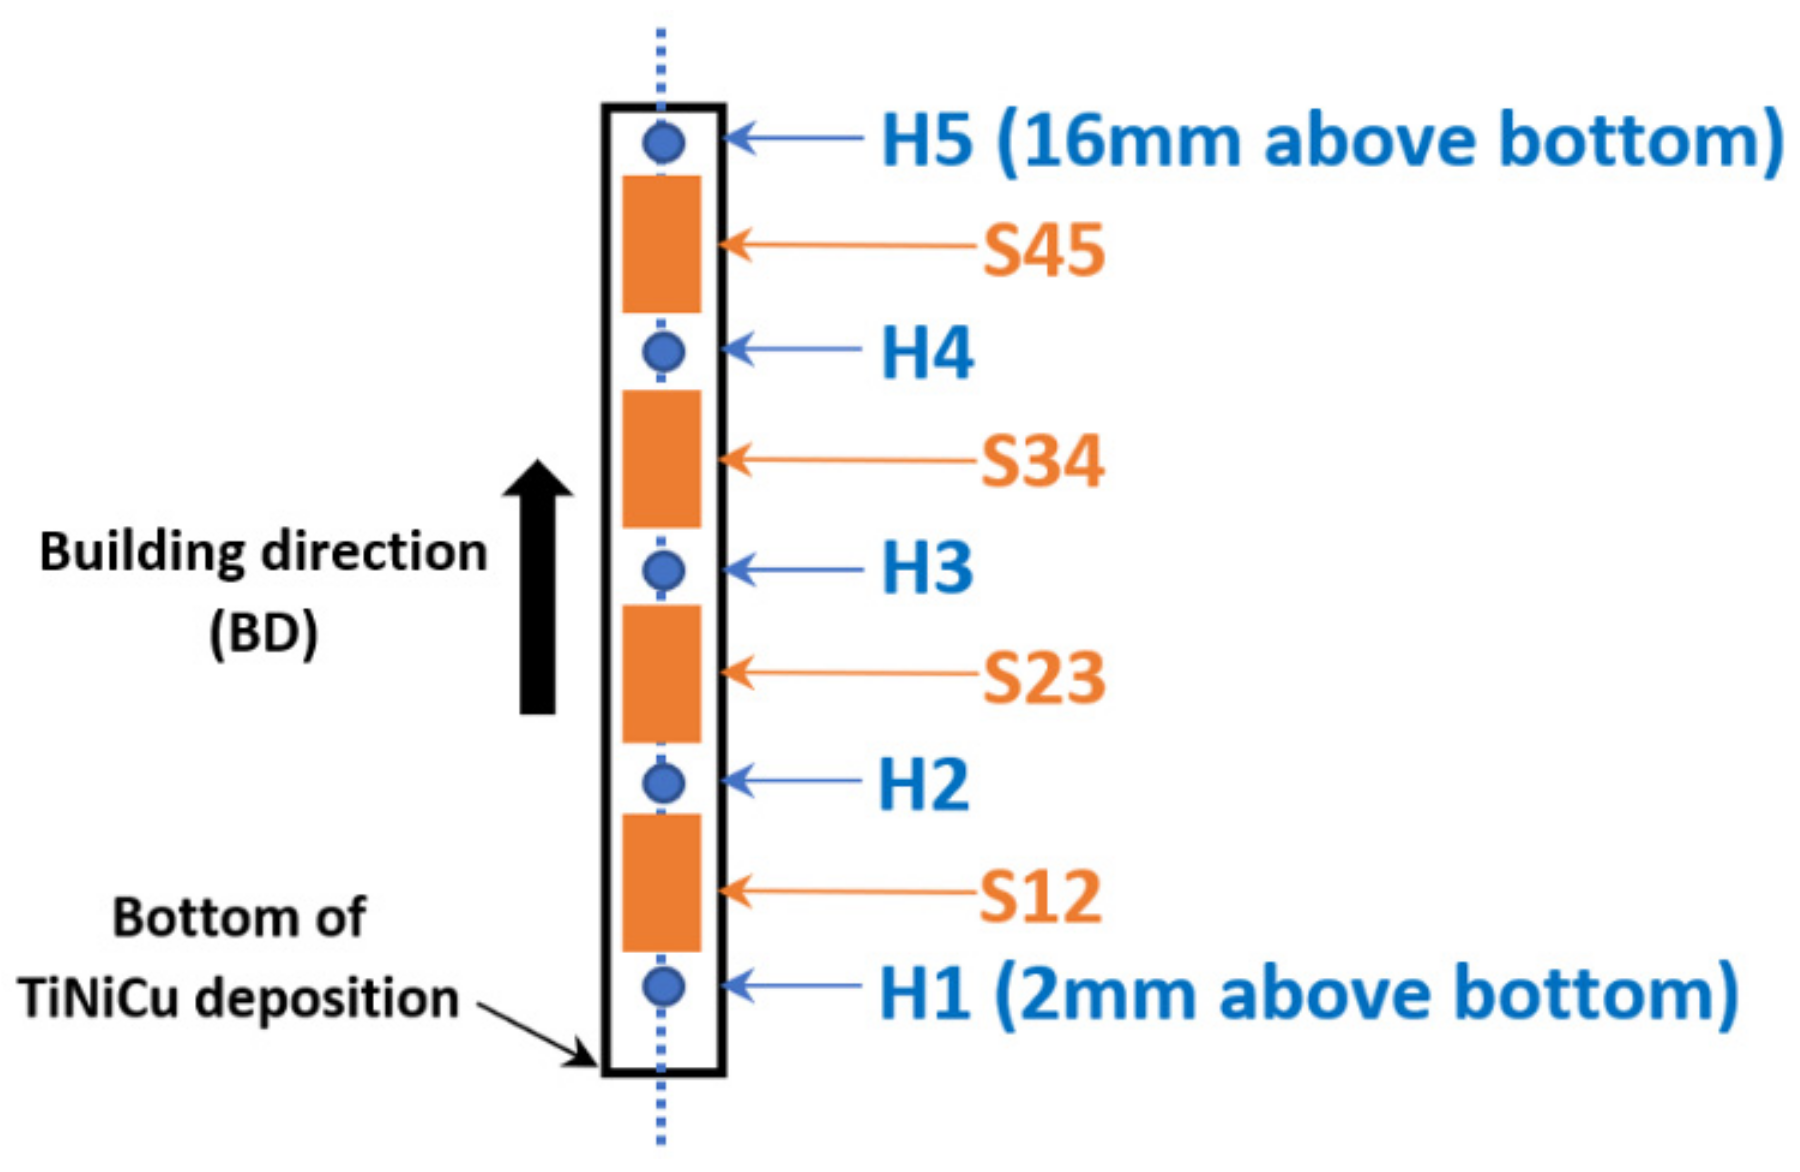
After the deposition, a thin piece of the cross-section area of the single wall was sectioned by wire electric discharge machining (EDM). The build direction (BD) is from the bottom to the top. In order to analyze the material properties at certain locations, five specific heights were marked as H1, H2, H3, H4, and H5 along the BD. The detailed information of the specific locations of the single wall cross-section is illustrated in Figure 3. H1 is a near-bottom location that is 2 mm above the bottom of the TiNiCu single wall, while H5 is a near-top location with a distance of 16 mm from the bottom. H2, H3, and H4 equally divide the cross-section from H1 to H5 into four sections. At the region of each specific height, the chemical composition and phase were studied to reveal the differences at various locations.
The cross-section was mounted, ground, and polished using a Buehler EcoMet 250 grinder/polisher. The well-polished cross-section of the single wall was analyzed using an FEI Helios NanoLab 600 Dual-Beam SEM equipped with Oxford Energy Dispersive Spectrometer. Both large area and small area energy dispersive spectroscopy (EDS) analyses were carried out within the cross-section area of the single wall. The large area EDS analysis was conducted at all five height locations with a rough area of 1 mm2. Specific small areas were selected within various phases for the EDS spectrum analysis to determine the composition of Ti, Ni, and Cu. The X-ray diffraction (XRD) technique was used to characterize the crystal structure. All five locations were analyzed by an X’Pert X-ray diffractometer with a step size of 0.03°.

2.4. Hardness Test

Vickers hardness tests were performed using a Struers Duramin 5 Vickers hardness tester equipped with a pyramidal diamond indenter. A thin slice of the TiNiCu single wall was sectioned and polished for the hardness testing. The hardness measurement was taken from 1 to 16 mm above the bottom, with an interval of 1 mm. For each measurement, the indentation load was 1.96 N, and the dwell time was set at 10 s.

2.5. Tensile Test

Tensile tests were applied by an Instron 5969 universal testing machine to evaluate the tensile strength of the as-deposited TiNiCu structure. The type of mini tensile sample was designed, and more details about this design can be found in the previous work [34]. The sketch is shown in Figure 4. The gauge length of this mini tensile sample design is 3 mm. Samples with the horizontal direction and vertical direction were both prepared by EDM and tested. Details of the location of sample extraction can be found in the section of results and discussions. The testing speed (strain rate) was 0.003 mm/mm/s from the start to fracture. The fracture surface was imaged by the Helios SEM, and discussion was provided based on the fractographical feature.

2.6. Phase Transformation Characterization

Differential scanning calorimetry (DSC) was used to identify the phase transformation temperature of the as-deposited TiNiCu at various locations. In this work, a slice of the cross-section was divided into four sections according to the five location points. As seen in Figure 3, the four sections marked by the orange color between location points H1–H2, H2–H3, H3–H4, and H4–H5 are named S12, S23, S34, and S45, respectively. A TA Instruments Q2000 differential scanning calorimeter was utilized to run a heating and cooling cycle on each section. The range of the heating and cooling cycle was from 0 °C to 120 °C, with a constant rate of 10 °C/min.

3. Results and Discussion

3.1. Element Composition and Microstructure
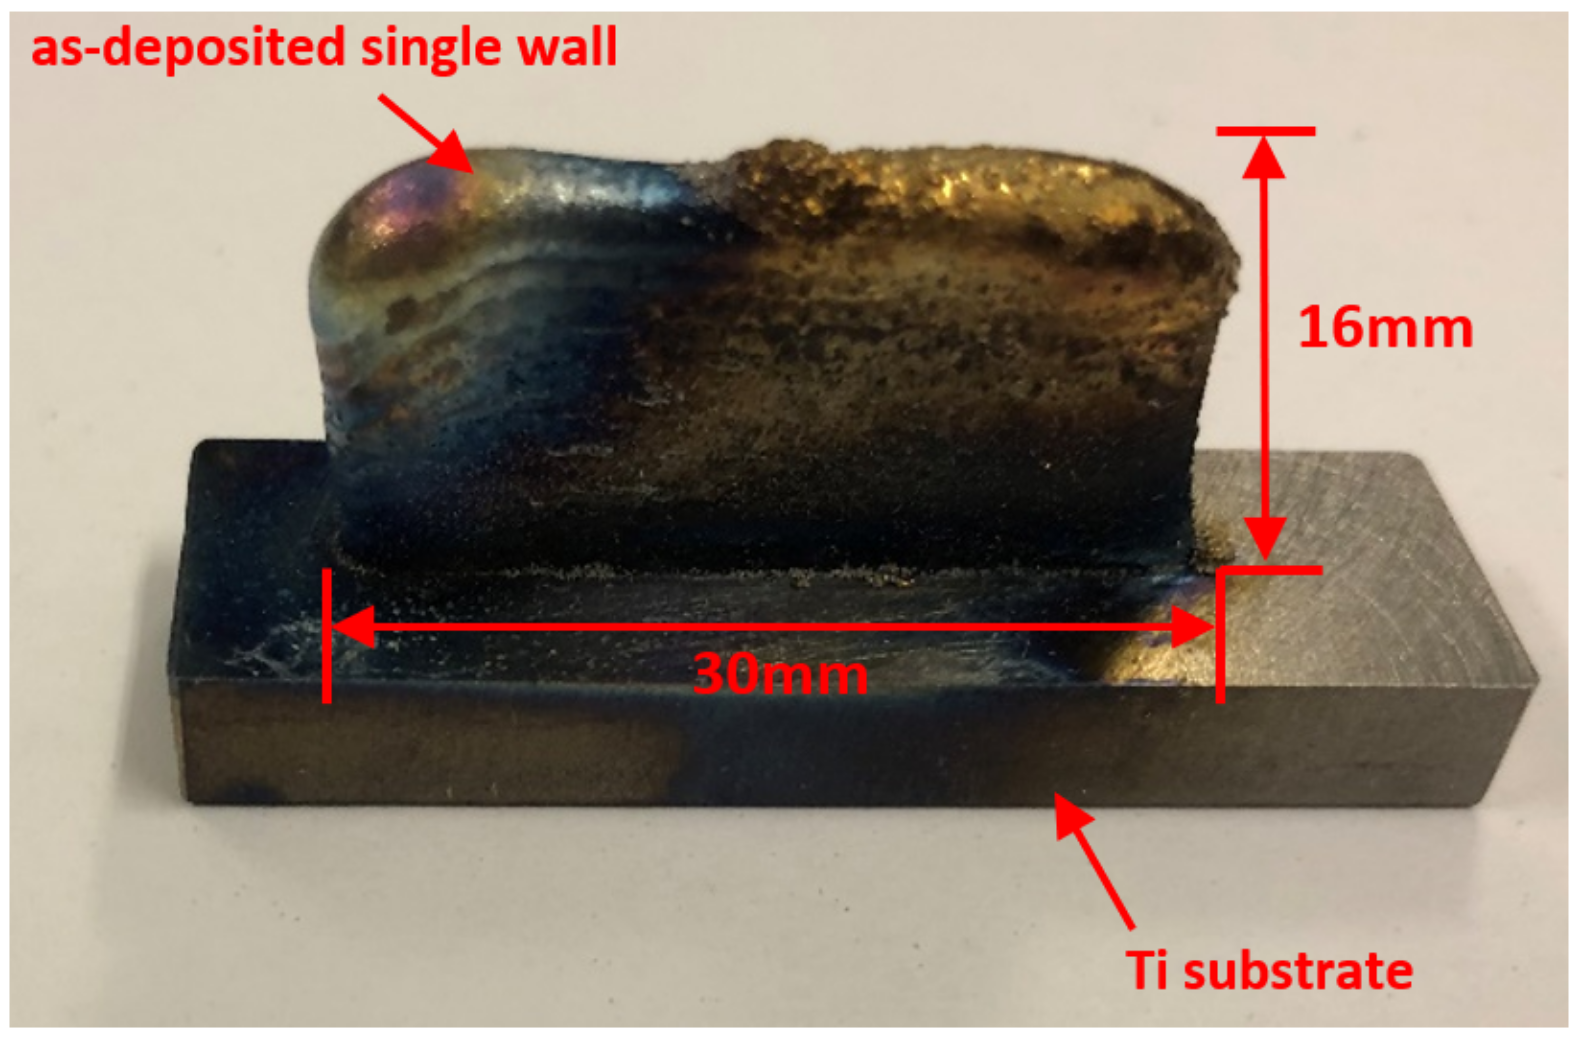
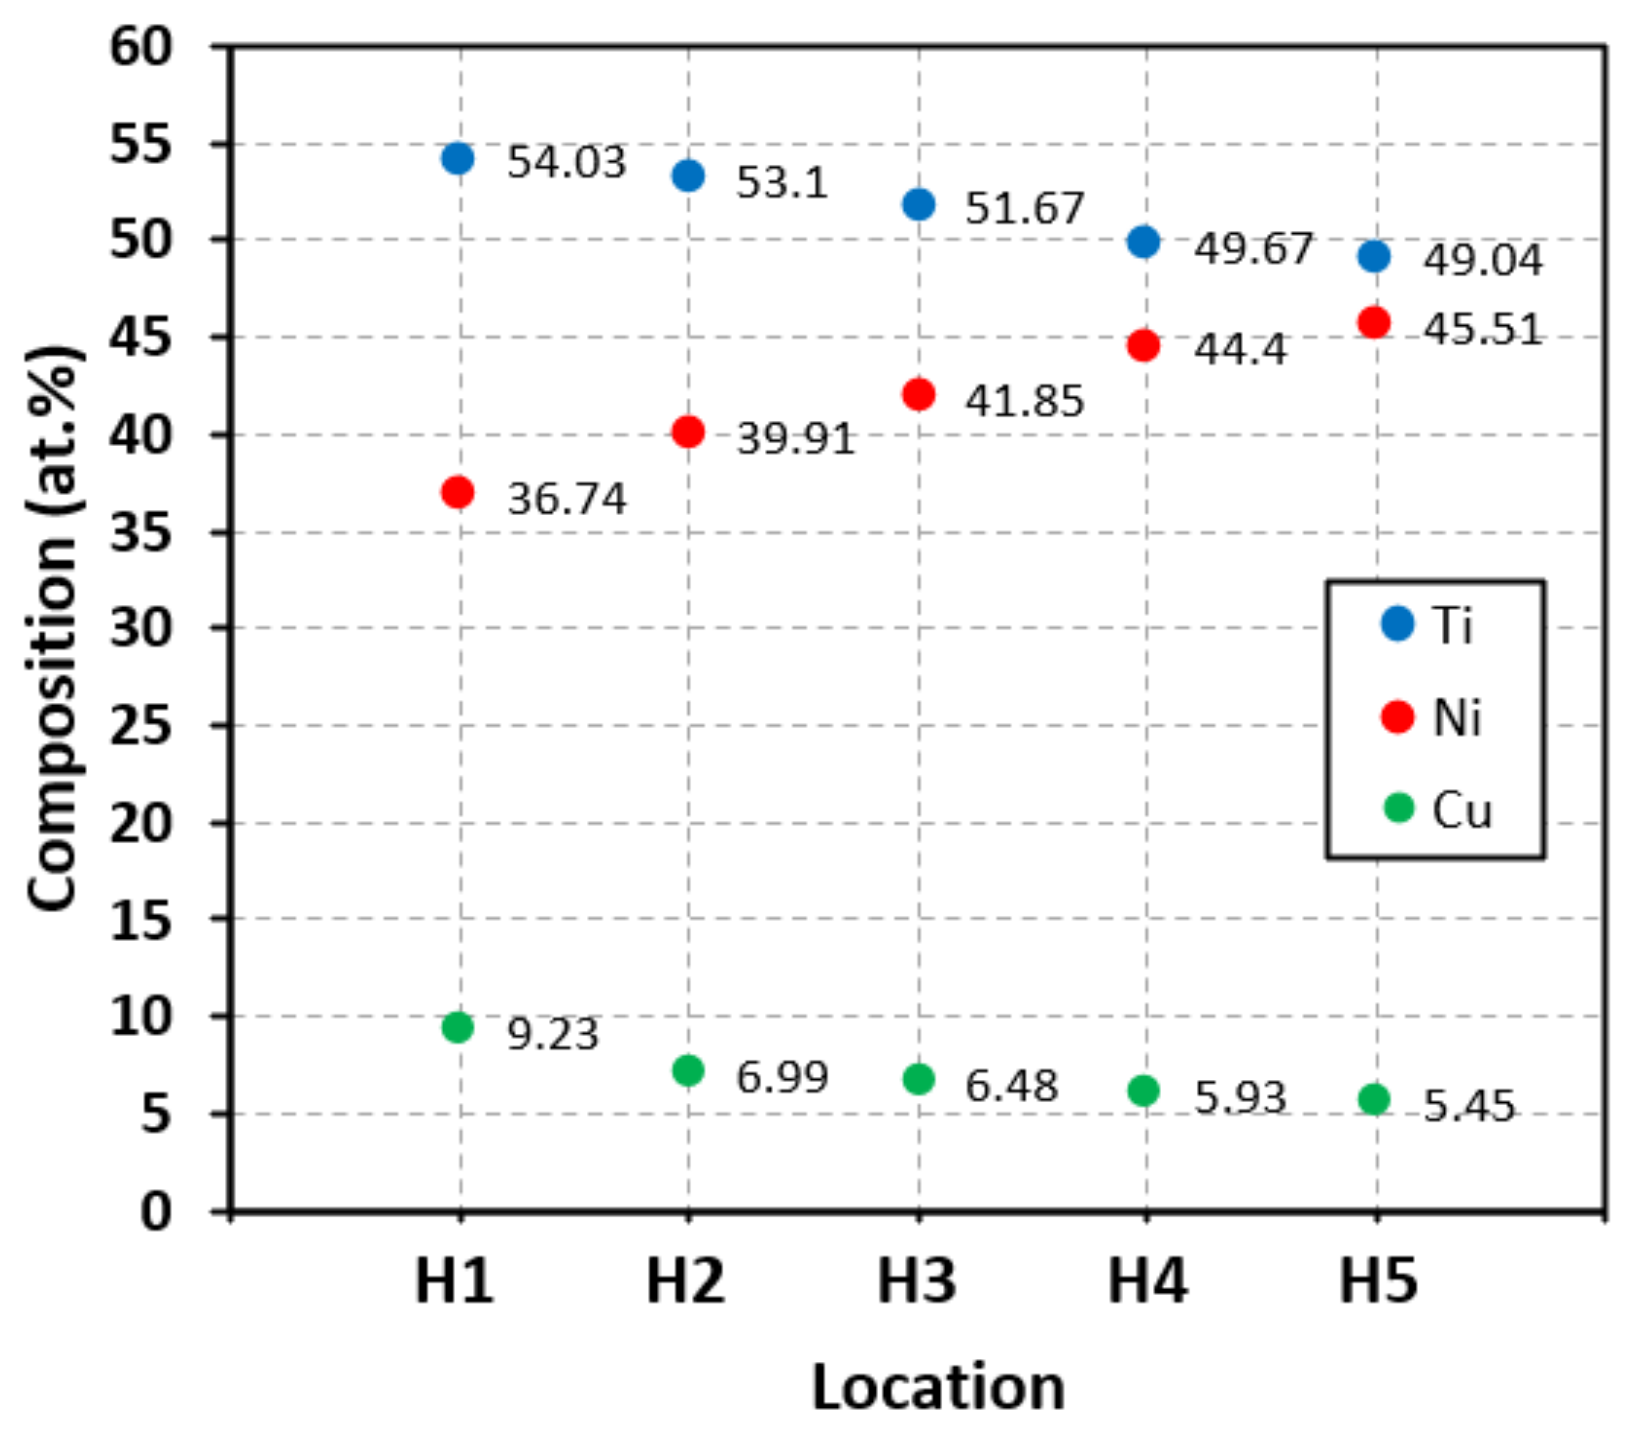
A picture of the as-deposited TiNiCu single wall structure is displayed in Figure 5. The as-prepared cross-section of the TiNiCu deposition was analyzed by Helios SEM in both the element composition and phase distribution. At each location, large area EDS was applied for element composition study. The atomic compositions of Ti, Ni, and Cu regarding the location from H1 up to H5 are plotted in Figure 6. From Figure 6, all three elements have some variations along with BD. Ti and Cu start with a composition higher than the as-mixed composition in the powder state and decrease gradually when the location rises. In contrast, Ni begins with a lower composition and gradually increases. At higher locations, the composition of the three elements becomes much closer to the initial as-mixed composition Ti50Ni45Cu5. The element deviation at the lower height might be due to a combined effect of dilution from the Ti substrate and powder flow rate difference among different types of metal powders [35].
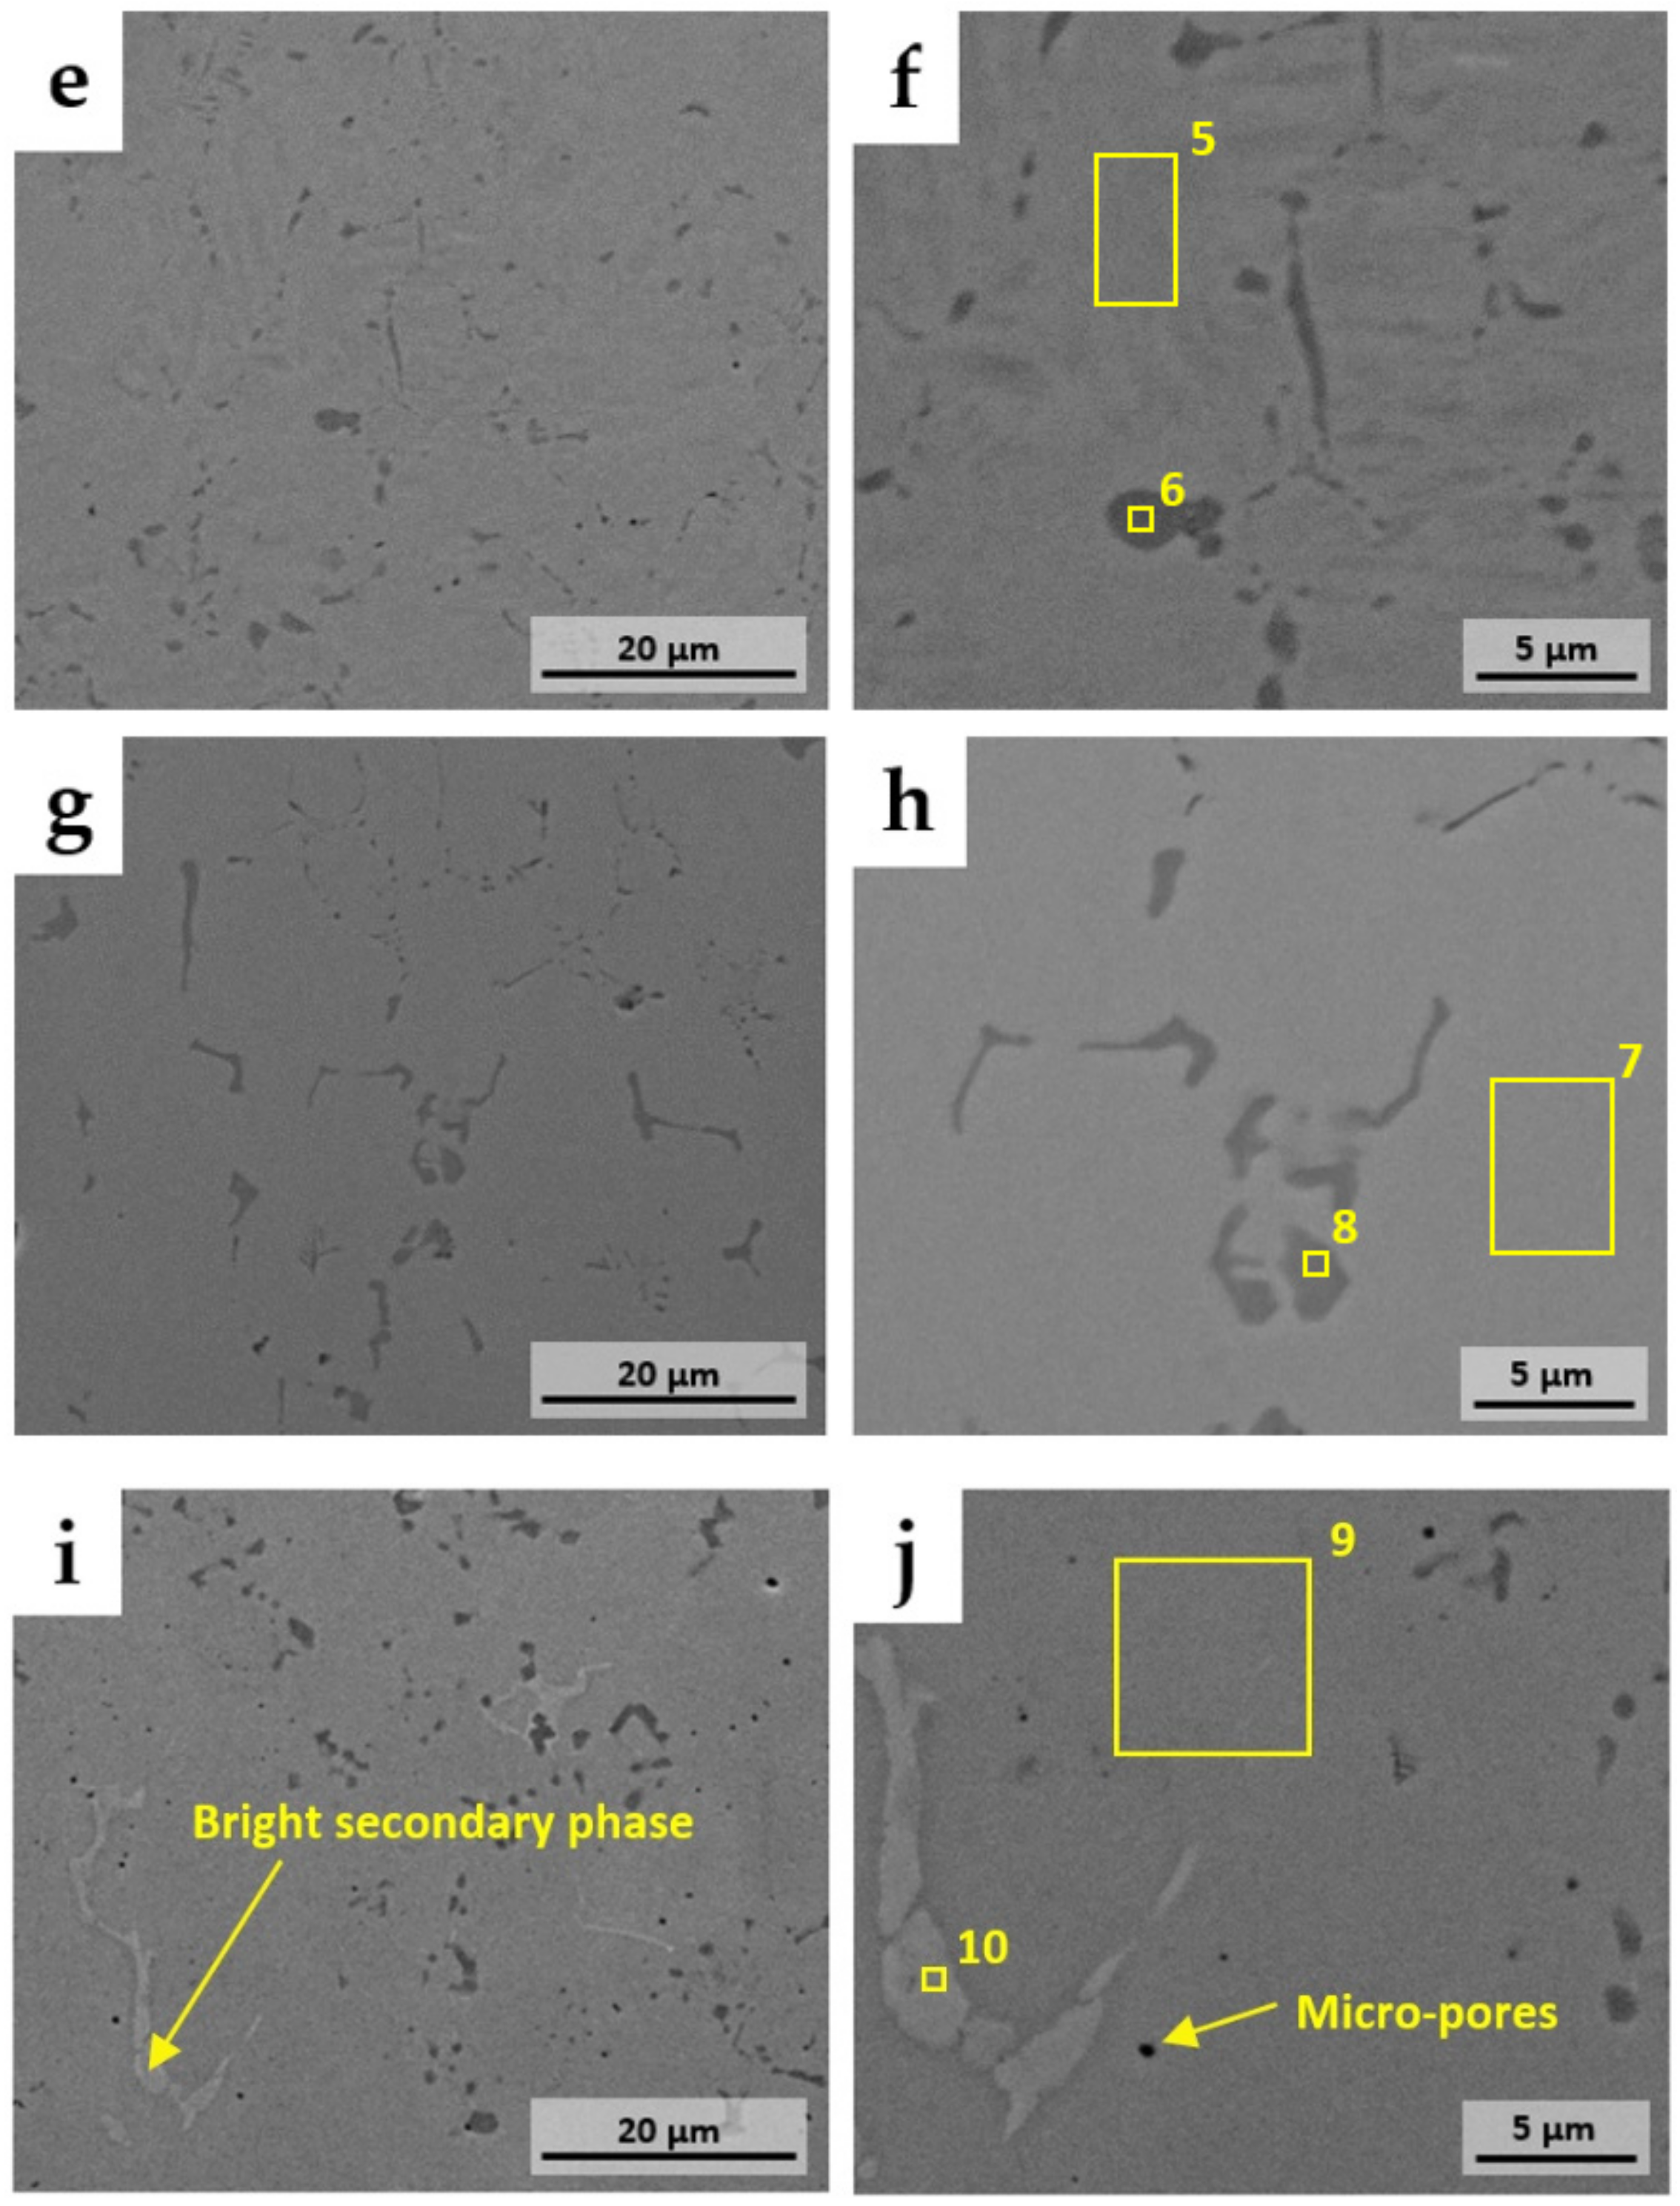
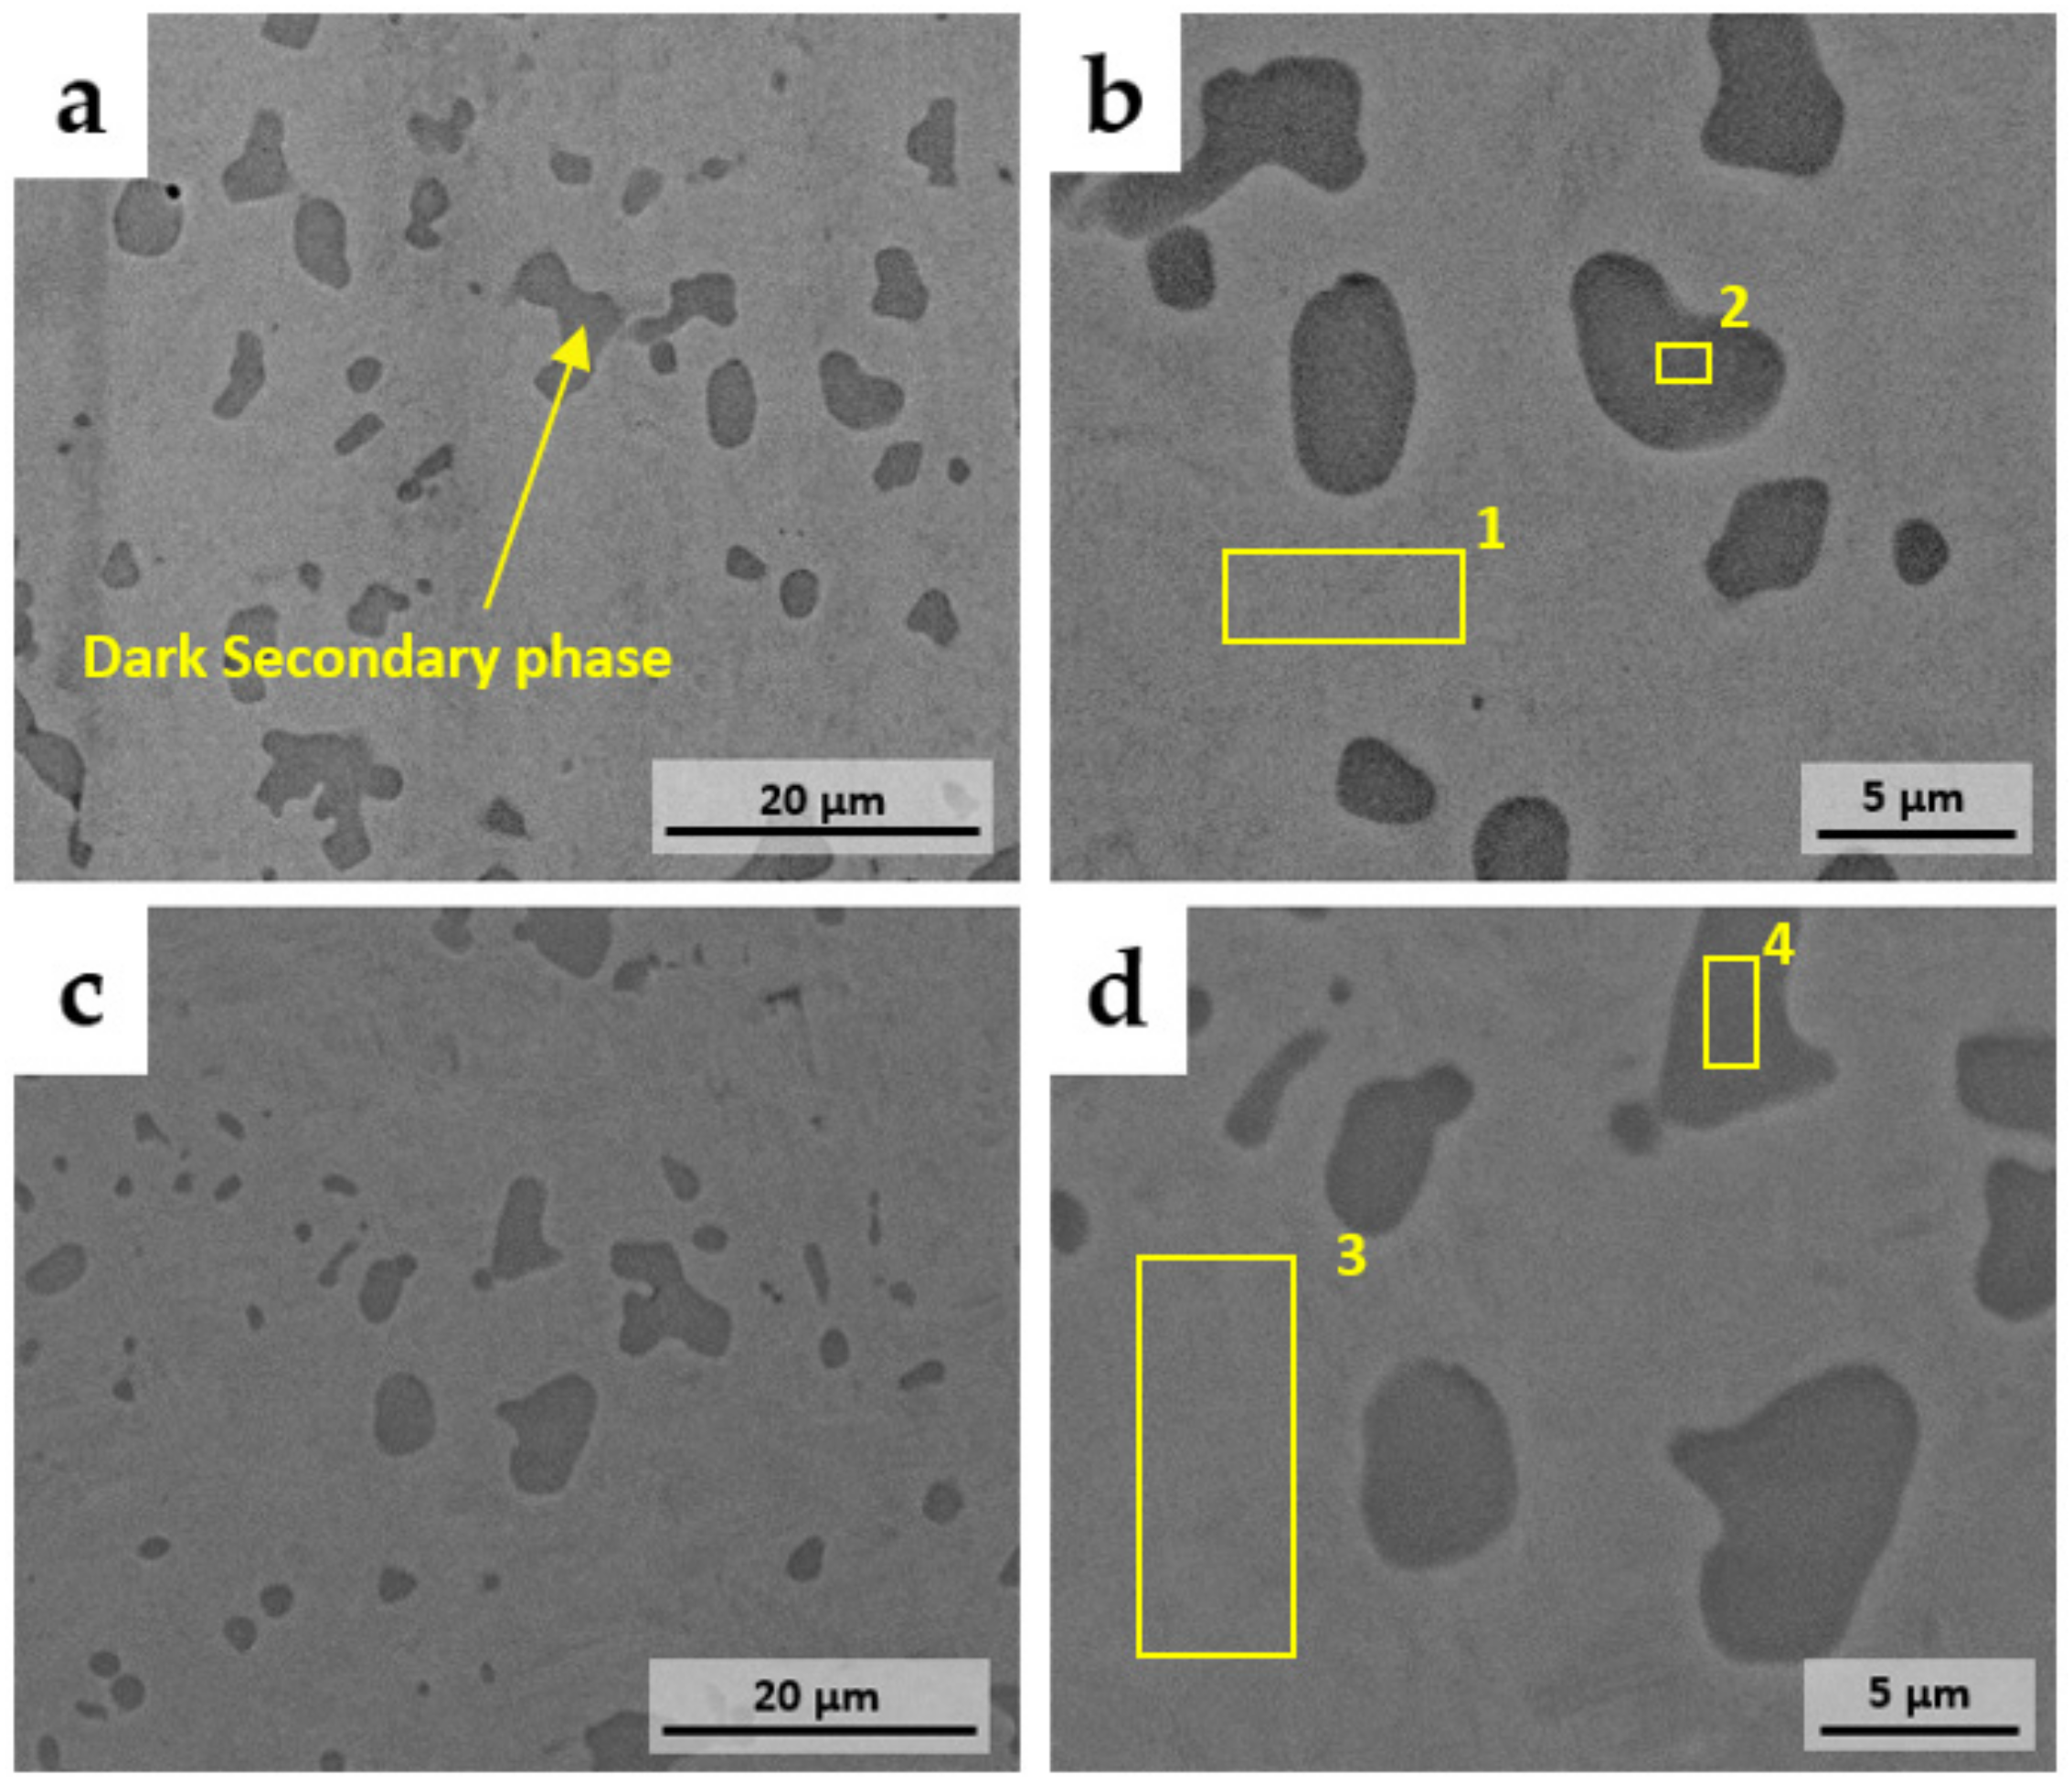
SEM images were obtained for detailed analysis in microstructure and phase composition. Figure 7 is a combination of images of all five locations. Among the ten sub-images, Figure 7a,c,e,g,i are SEM images of locations H1, H2, H3, H4, and H5, respectively. Figure 7a,c,e,g,i shows the overall phase distribution, and Figure 7b,d,f,h,j shows higher magnified SEM images of a specific region within Figure 7a,c,e,g,i for small area EDS analysis on phases, respectively.
As shown in Figure 7a,c,e,g, locations H1, H2, H3, and H4 are all dominated by the light gray phase as the matrix phase and the dark gray phase as the secondary phase, which disperses within the matrix. In general, it can also be seen that the area covered by the dark gray phase decreases as the height increases. In Figure 7i, another light phase that is brighter than the matrix is also detected. In Figure 7b,d,f,h,j, ten areas within these three types of phases were picked for the EDS analysis. Areas 1, 3, 5, 7, and 9 were selected within the matrix of five height locations, while Areas 2, 4, 6, and 8 were located inside of darker secondary phases at the locations H1, H2, H3, and H4, respectively. At the height of H5, Area 10 was drawn within the brighter secondary phase. All EDS analysis results of the ten areas are listed in Table 1. In those EDS results, the relation between the atomic percentage ratio of Ti and the sum of Ni and Cu is noticed. The ratio of atomic composition Ti/(Ni + Cu) values is close to 1 in all matrices, which reveals that all five matrices are recognized as the TiNi phase with a small amount of Cu substitution. In Areas 1, 3, and 5, the matrix Ti composition exceeds 50 at.%, which is considered the Ti-rich TiNi phase, while matrix phases in Areas 7 and 9 are Ti-poor. Areas 2, 4, 6, and 8 are inside the darker secondary phase, and their Ti/(Ni + Cu) ratios are all close to 2. Then, the suggested phase will be the Ti2Ni type intermetallic phase, which includes the Cu that replaces a low percentage of the Ni as well.
Figure 7. SEM images of the as-deposited TiNiCu single wall at various locations along the BD: (a,c,e,g,i)—Locations H1, H2, H3, H4, and H5, respectively; (b,d,f,h,j)—Locations H1, H2, H3, H4, and H5, respectively with higher magnification for EDS analysis.
Applsci 11 04863 g007aApplsci 11 04863 g007b
Area 10 is selected from the inner part of the brighter phase generated at the near-top location H5 of the single wall. The EDS result in Table 1 gives that Ti at.% = 35.3%, Ni at.% = 42.7%, and Cu at.% = 21.9%. According to the literature [36], the suggested phase might be (Cu, Ni)2Ti, which is a type of Ti-poor secondary phase. Figure 7j also shows micro-pores that are less than 1 mm in size. The micro-pores at the upper layer could be due to the heat accumulation resulting in overheating at the upper layer.

3.2. Phase

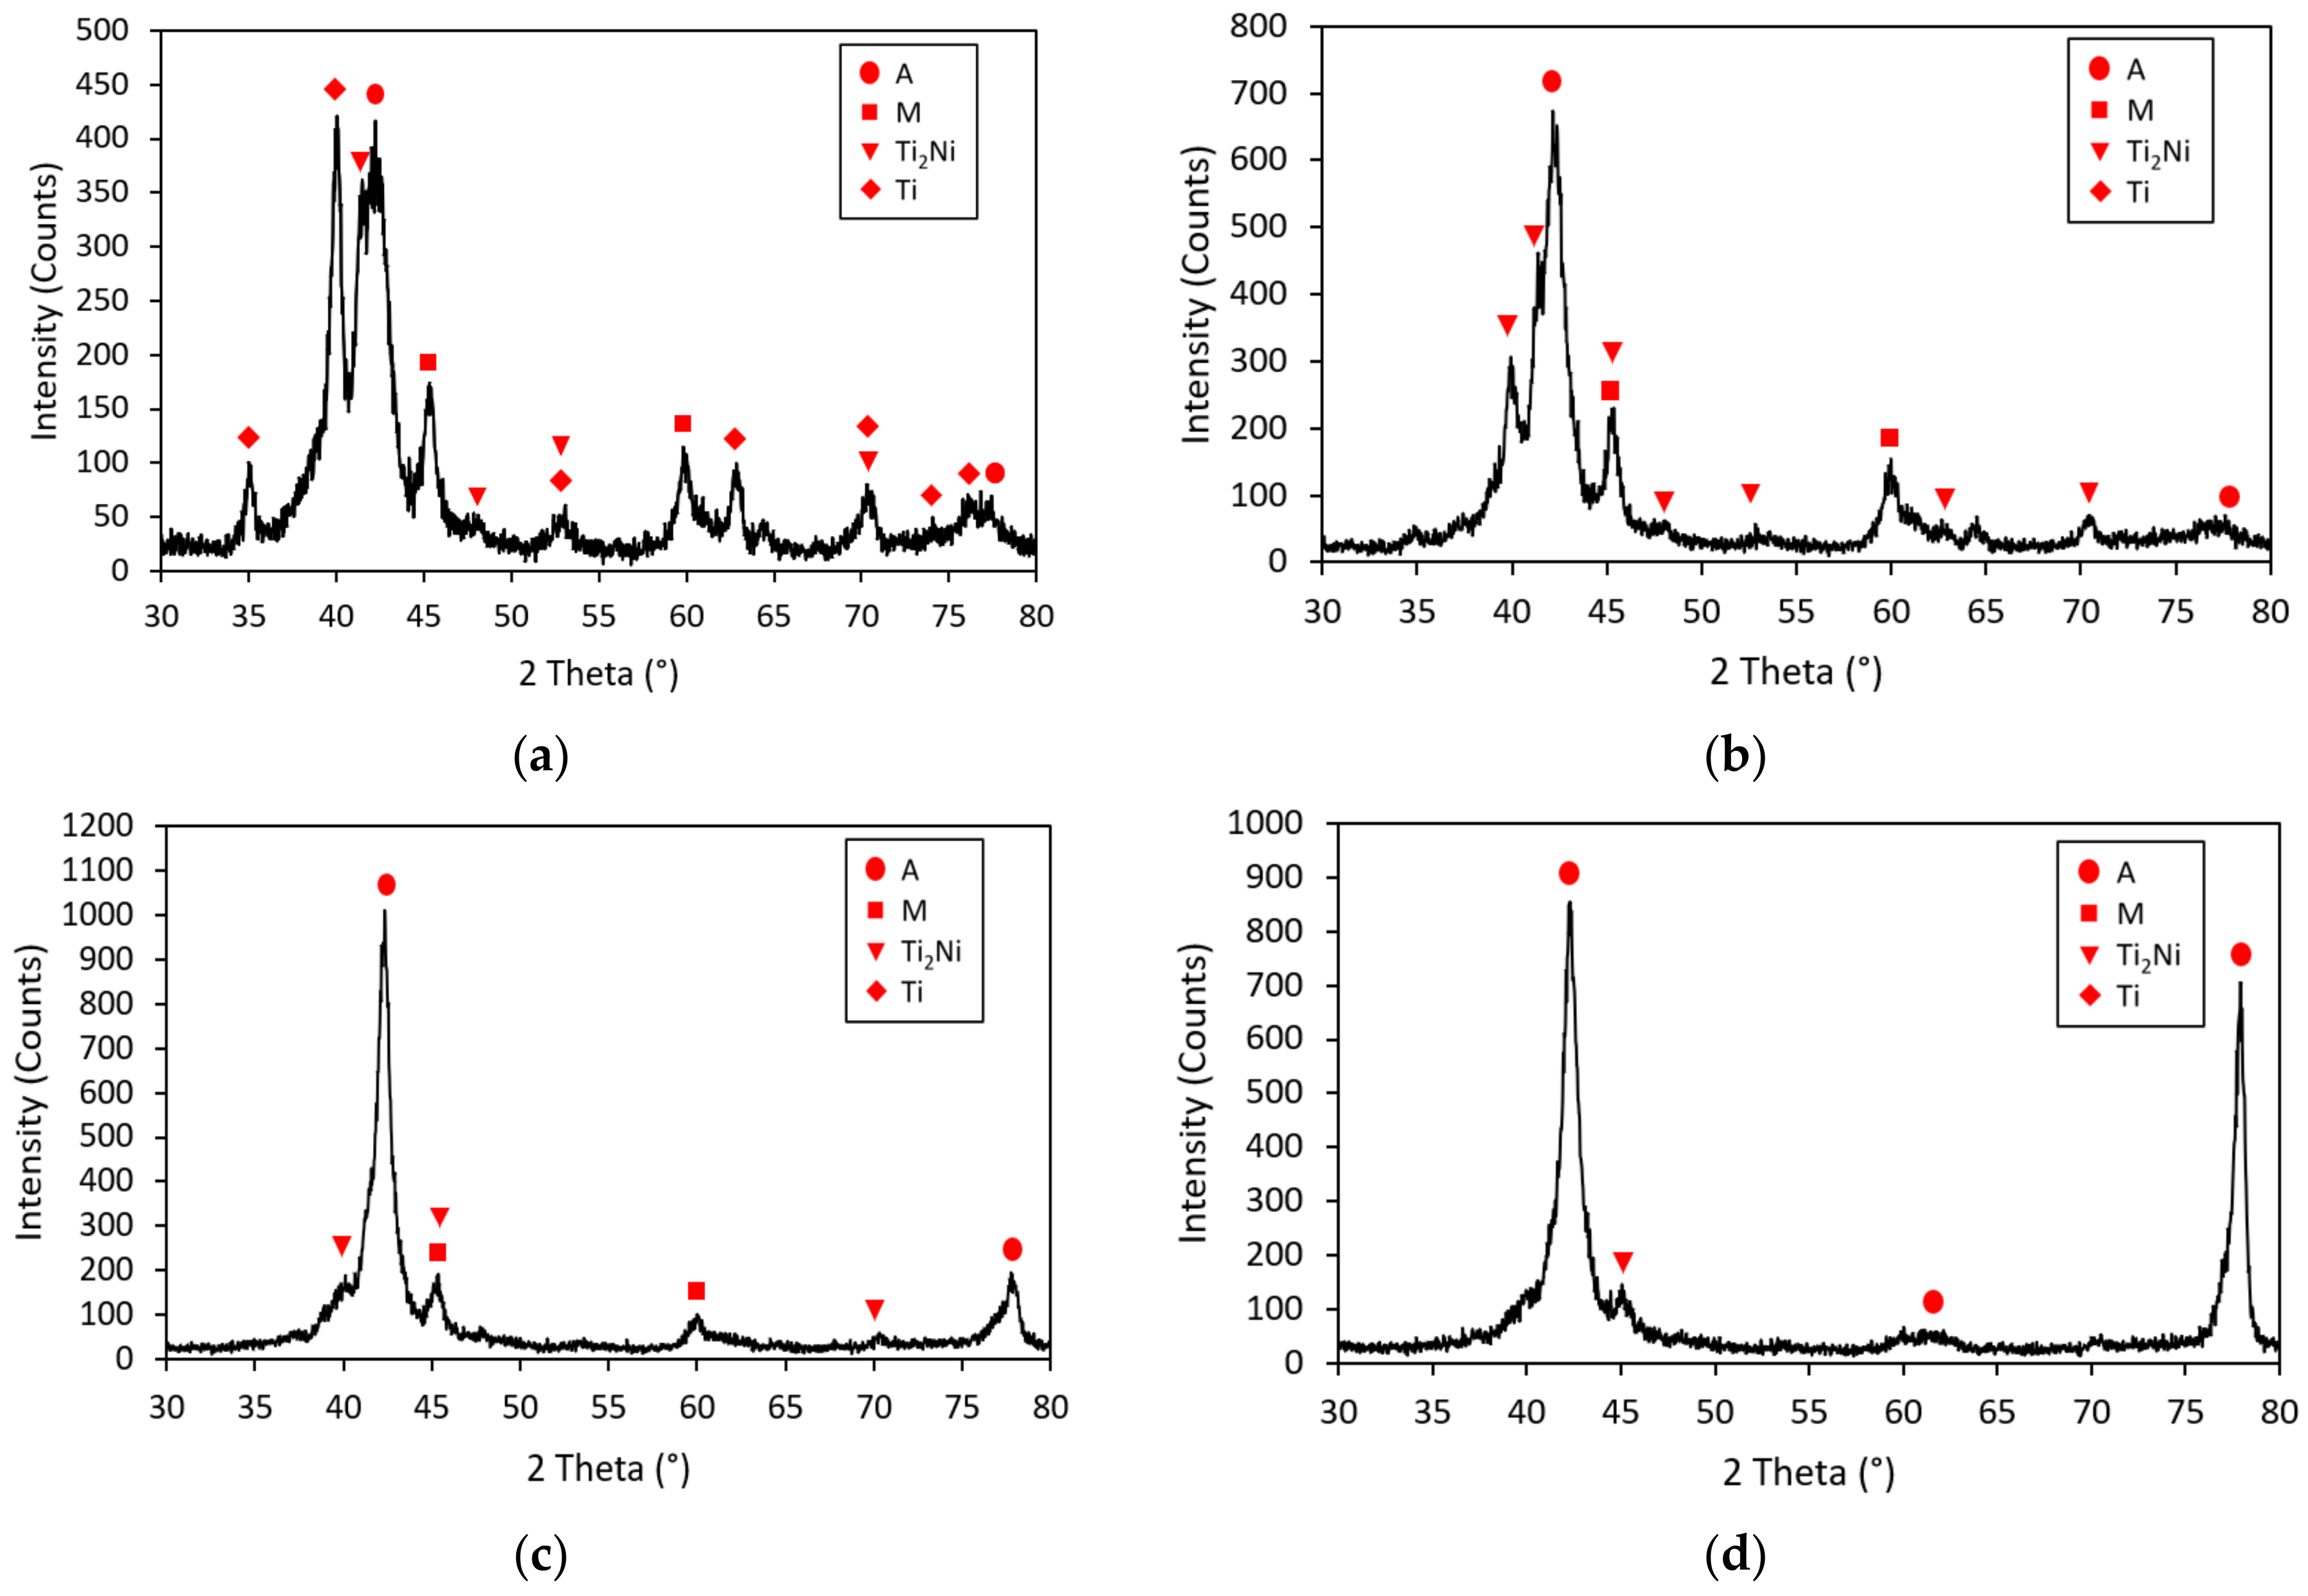
XRD patterns of five locations are shown in Figure 8. From the bottom to the top, four phases can be found, including the austenitic TiNi (labeled as A-phase in Figure 8), martensitic TiNi (labeled as M-phase in Figure 8), intermetallic Ti2Ni, and Ti. The diffraction peaks of those four phases are labeled using different red markers. At the H1 location, austenitic TiNi, martensitic TiNi, and Ti give a strong signal, which is shown in Figure 8a. The existence of Ti2Ni can also be found. The presence of the Ti crystal structure is mainly due to the dilution effect near the bottom of the single wall. In Figure 8b, the Ti peaks cannot be observed since the impact of dilution is largely reduced. The major existing phases are austenitic TiNi, martensitic TiNi, and Ti2Ni. Figure 8c demonstrates that austenite dominates, while the signals of the martensitic TiNi and Ti2Ni become less obvious. When they go up to locations H4 and H5, as shown in Figure 8d,e, the martensitic TiNi and Ti2Ni can hardly be observed, and the entirety of the XRD patterns is almost dominated only by the austenite phase. For TiNi phases, the signal of the austenite phase starts from weak to strong from the bottom to the top, while the martensitic phase follows an opposite tendency. At the lower location, the as-deposited structure consists of a combination of martensite and austenite, while at the higher location, austenite becomes much more prevalent.
According to the finding in the EDS results, from the bottom to the top, the atomic composition of Ti within the matrix area varies from Ti-rich (Ti at.% > 50 at.%) to Ti-poor (Ti at.% < 50 at.%). It was mentioned in a previous research study that Ti-rich TiNi-based shape memory alloy tends to exhibit a martensitic structure at room temperature since the temperatures for phase transformation are higher [37]. The transformation temperatures will also be discussed in Section 3.5. The decrease in the martensite signal correlates with the gradual decrease in the Ti atomic composition and the constituent of Ti-rich intermetallic Ti2Ni along with the BD, which is displayed in Figure 7. Thus, the XRD results show good consistency with the composition study found in the EDS analysis.

3.3. Hardness

The Vickers hardness values were tested along the BD across the entire deposition. The polished surface of the single wall cross-section was indented from 1 to 16 mm above the TiNiCu/Ti interfacial line (bottom line of the single wall). Hardness measurements are plotted in Figure 9. In Figure 9, the zero height is set at the TiNiCu/Ti interfacial line. It can be seen from Figure 9 that, from 1 to 10 mm, hardness values mostly fall into the range of 200~250 HV0.2, which reflects the hardness of the martensite in the lower region. There is a tendency of decline in the hardness from 1 to 10 mm within the martensite-rich region. The decline is due to the decrease in Ti2Ni intermetallics from 1 to 10 mm. The measured hardness value becomes higher starting from 11 mm, and it increases to > 300 HV0.2, which corresponds to the hard austenite-dominated regions [29]. The increase in hardness at higher levels reflects the formation of the Ni-rich austenite phase since the matrix becomes Ti-poor at the location H4, which is 12.5 mm above the interface.

3.4. Tensile Test

Mini tensile samples were extracted along the horizontal (parallel to the substrate surface) and vertical direction (parallel to the BD). For the horizontal one, the entire sample is mainly included in the region of 8~12 mm above the interface. The vertical one spans from 13.5 to 3.5 mm above the bottom. Then, the gauge length of the vertical sample locates in the range of 7~10 mm. To avoid sample misalignment, mini tensile samples need a preload at the beginning of the test, which can also be found in previous works [38]. All tensile tests were carried out at a constant strain rate of 0.003 mm/mm/s until the sample fracture finally occurred. The stress and strain data points were collected and plotted as stress–strain curves, shown in Figure 10.
The stress–strain curves of both horizontal and vertical samples are recorded and plotted in Figure 10, where the horizontal and vertical samples correspond to Figure 10a,b, respectively. The ultimate tensile strength (UTS) values of the horizontal sample and the vertical sample are 622 MPa and 447 MPa, respectively. The two curves are different in feature mainly due to their different compositions of martensite and austenite. The concave part of the vertical sample at the tensile strain range between 0.01 and 0.05 indicates the martensite reorienting stage [39], while the horizontal sample includes less martensite; this plateau region is not found obviously.
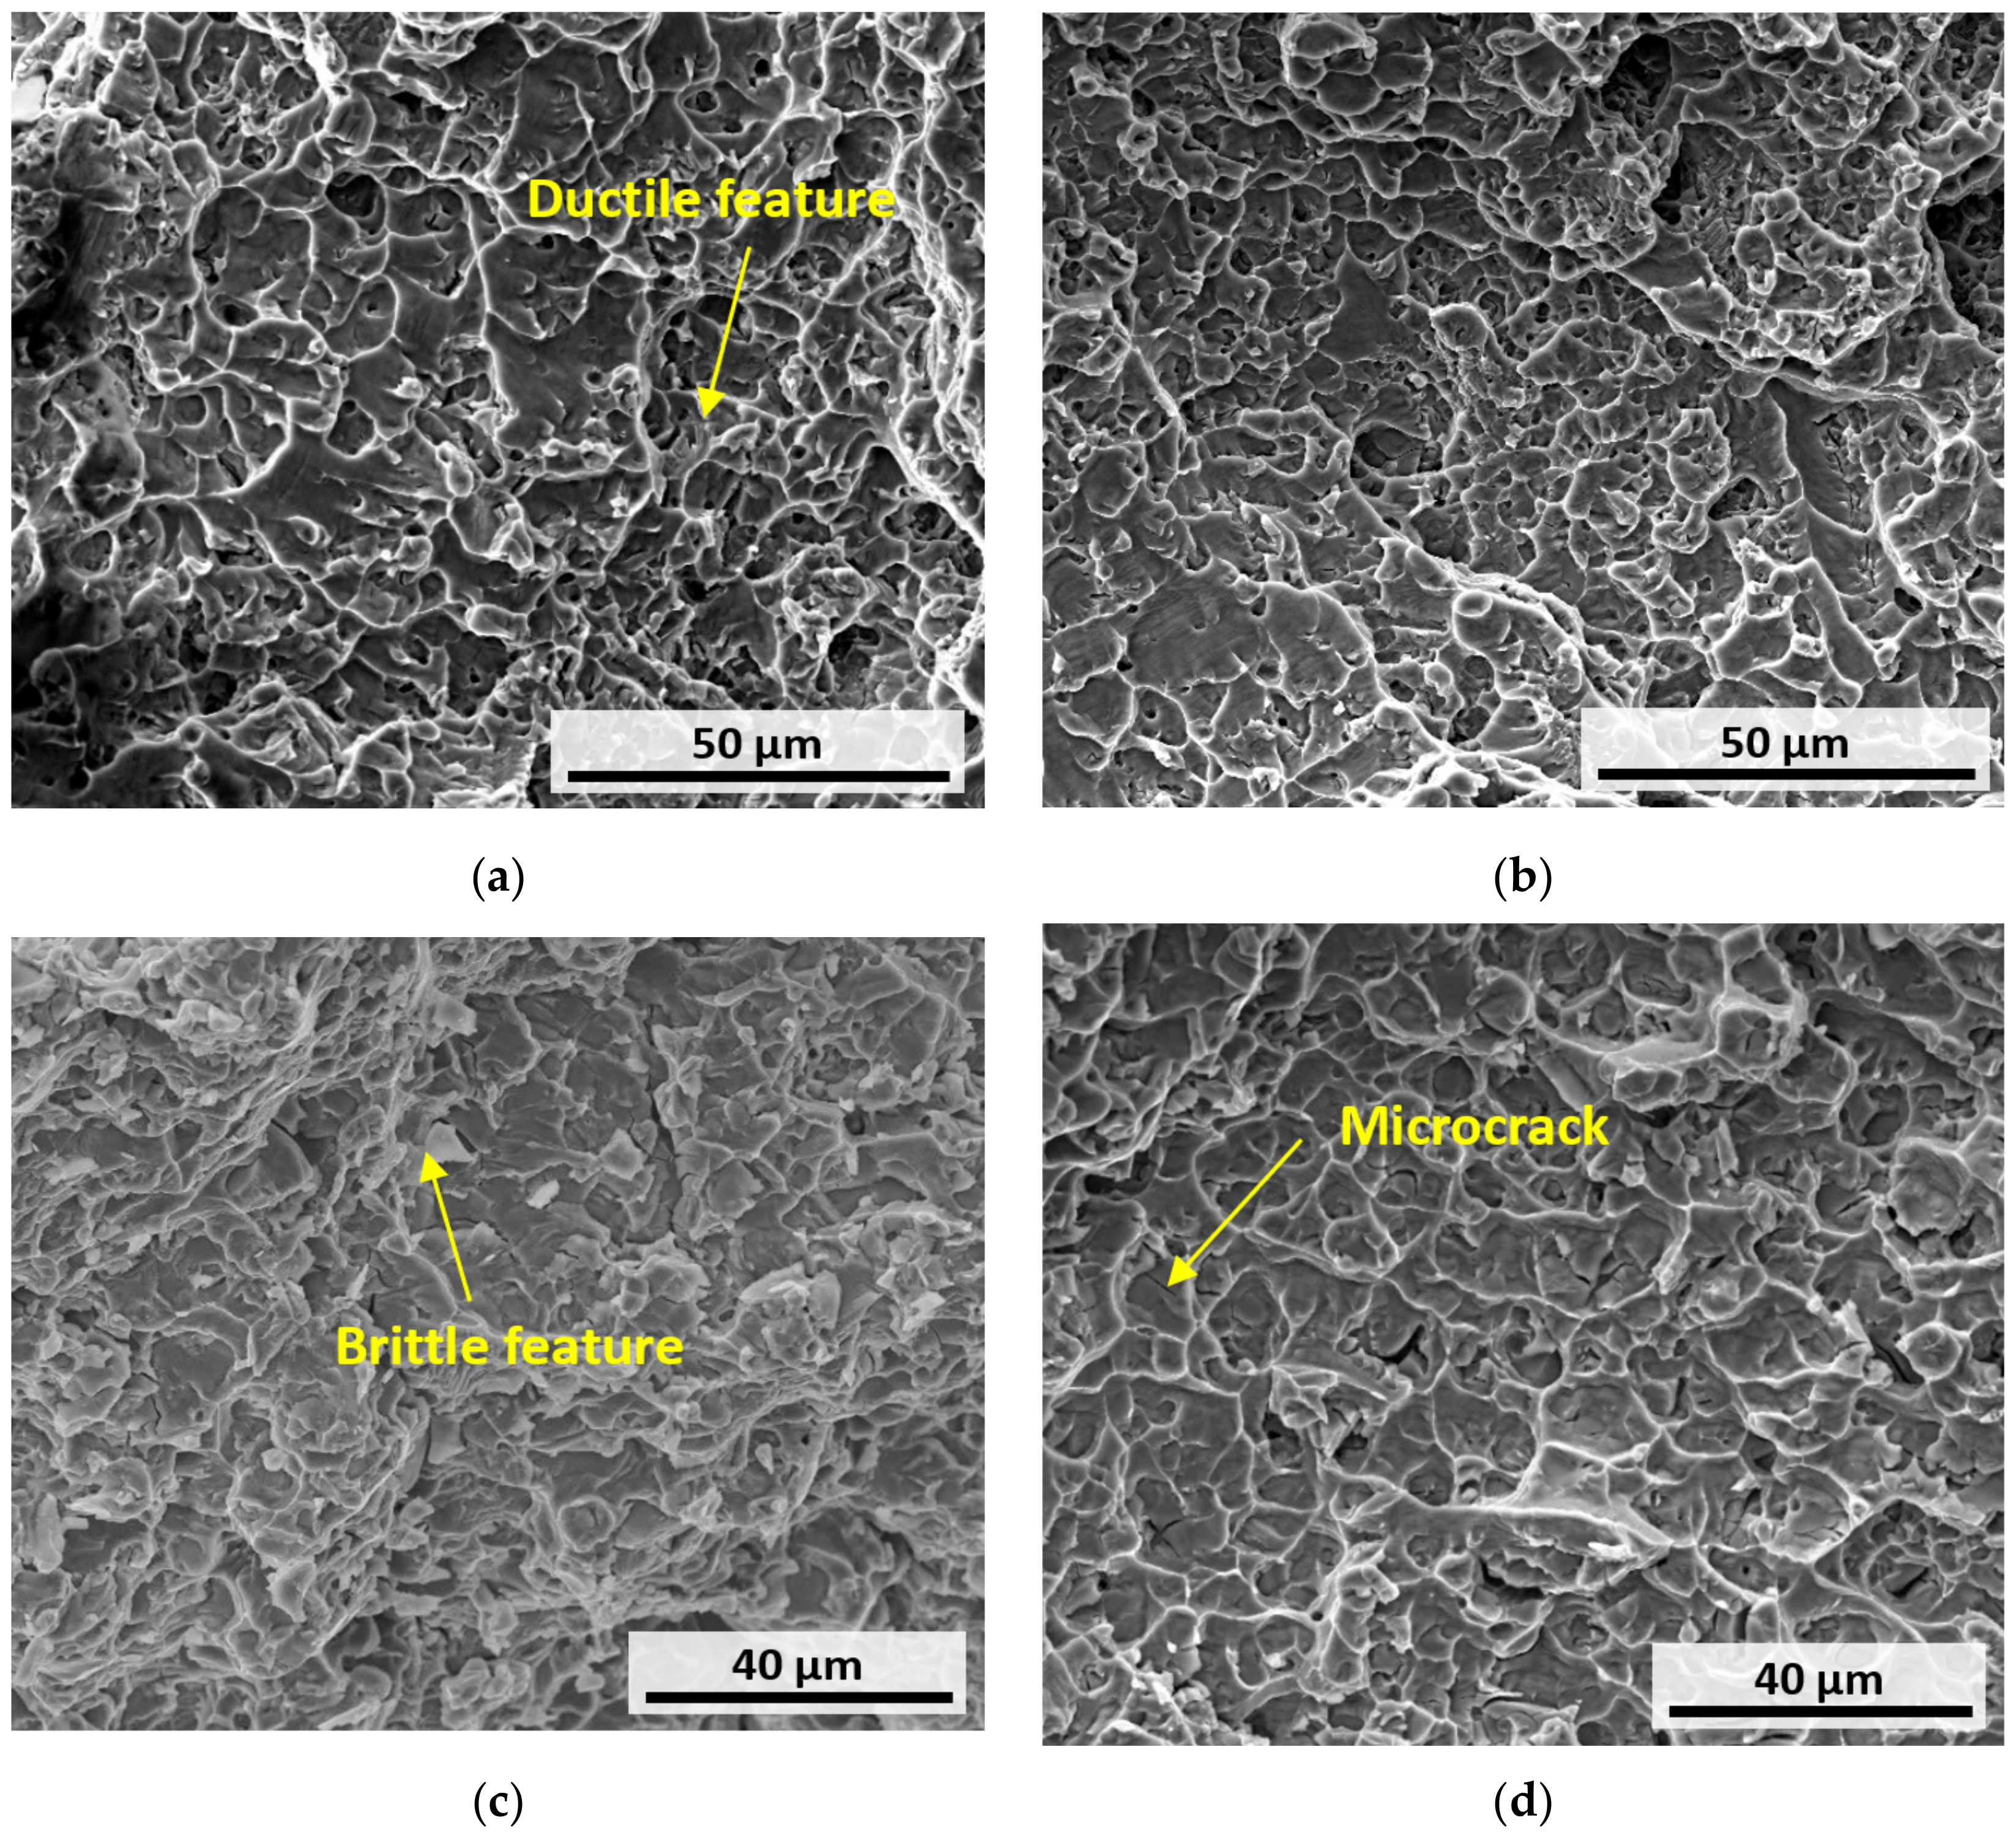
The SEM images of the fracture surface of the fractured samples are listed in Figure 11, where Figure 11a,b indicates the horizontal sample and Figure 11c,d represents the vertical sample. The fracture surface in Figure 11a,b,d shows the mix mode of the fracture with both dimple-like features and microcracks within the fracture surface image. The ductile feature is due to the ductile matrix, while the defects and secondary phases can cause microcracks under tensile loading and finally result in brittle fracture. Figure 11c shows brittle features. The martensite-rich vertical sample shows a lower UTS and mostly brittle fracture at the fracture surface. The strain value at the fracture point of the vertical sample is also lower than the horizontal sample. On the fracture surface of the vertical sample, more pure brittle fracture regions can be found, such as that shown in Figure 11c. The vertical sample displays more brittle features and a lower UTS result, as it includes more Ti2Ni secondary phases along the direction of BD.
Researchers in [40,41] fabricated DEDed TiNi binary alloy parts through elemental powder blend, and the UTS values of 250 MPa and 320 MPa were obtained, respectively. The fracture shows brittle features in [40]. While in [42], TiNi was built by DED with pre-alloyed TiNi powder, and the UTS exceeds 700 MPa. Some other available reported UTS values of TiNi using selective laser melting (SLM) and wire arc additive manufacturing (WAAM) include 601 MPa (SLM [43]), 690 ± 15 MPa (SLM [44]), and 571.4 ± 18.6 (WAAM [45]). These reported data are tabulated in Table 2 for comparison. Therefore, this work obtains a much higher UTS value among DED works using an elemental powder blend, and it is comparable with the TiNi binary alloys fabricated with AM processes other than DED. In addition, it can still be improved when comparing with DED works with pre-alloyed powders.

3.5. DSC Phase Transformation Analysis
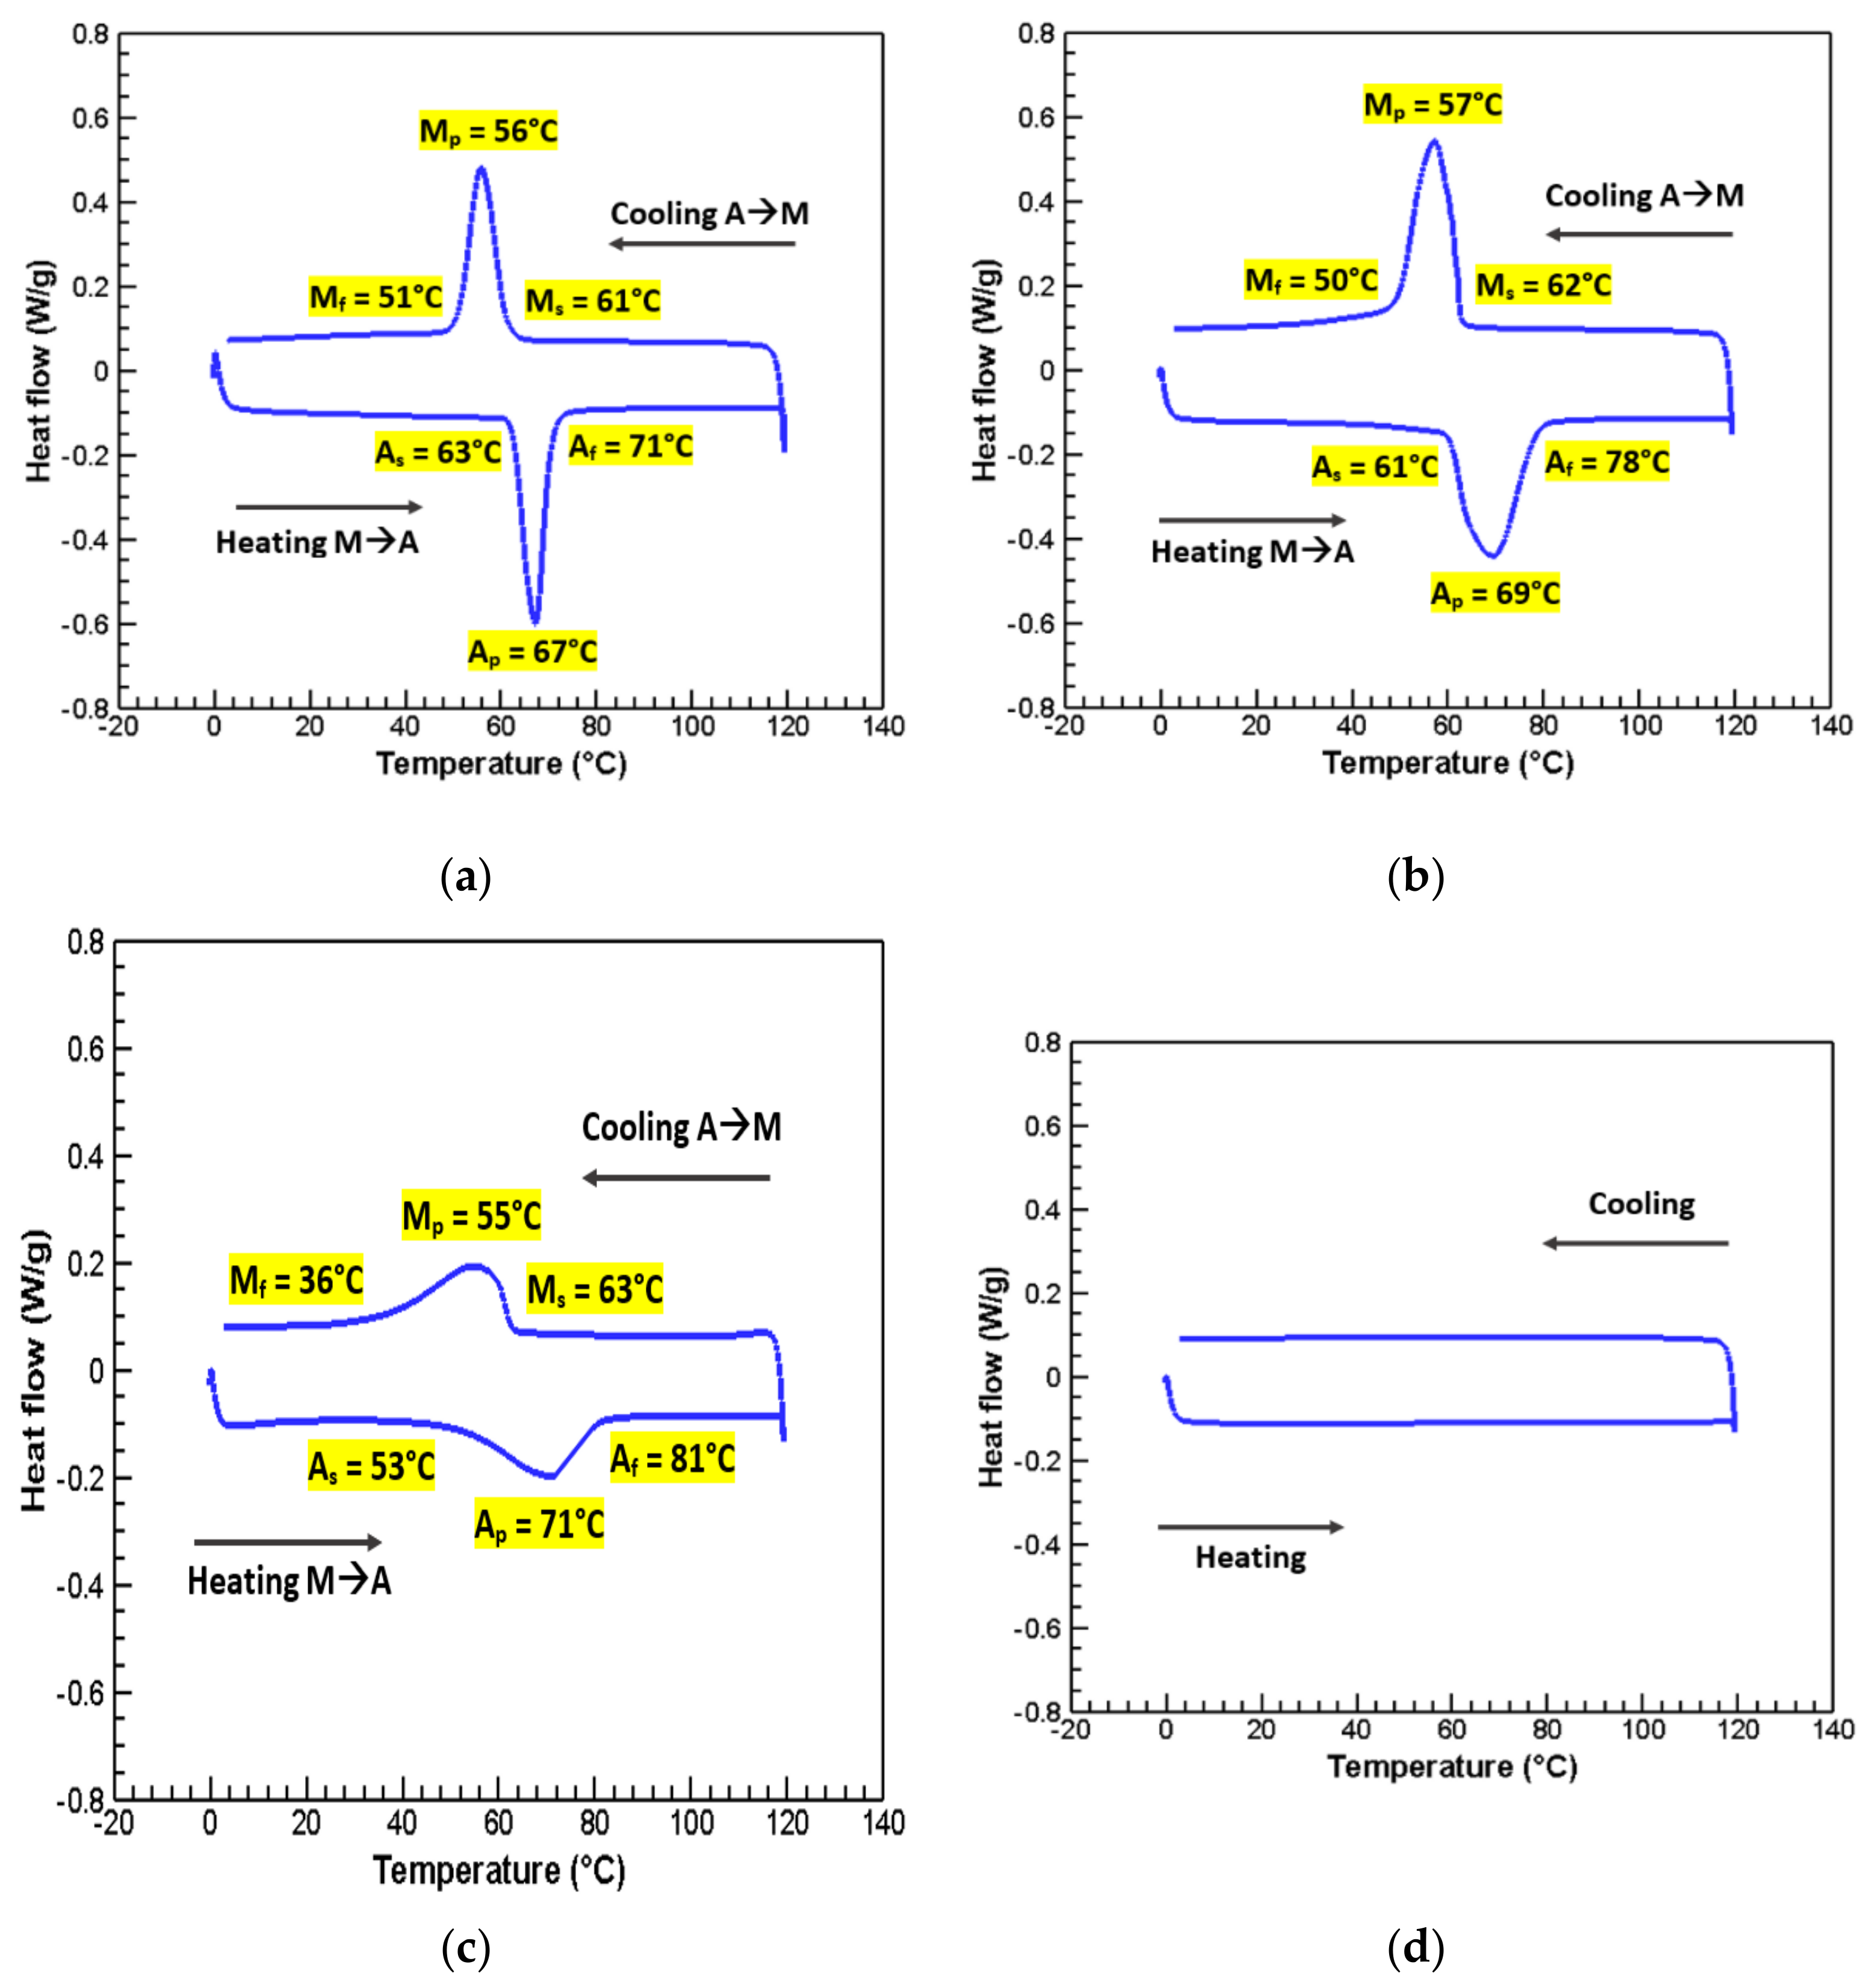
The DSC exothermic/endothermic graphs of four different sections are shown in Figure 12a–d. For each section, the procedure was set as a heating and cooling cycle: heating to 120 °C from 0 °C with a constant heating rate of 10 °C/min (the lower part of each graph), and then cooling back to 0 °C with a constant cooling rate of 10 °C/min (the upper part of each graph). Peaks appear during the heating and cooling process, which reflects the heat absorption or release between martensite and austenite phase transformation. From Figure 12a–c, it can be observed that sections S12, S23, and S34 have one martensite-to-austenite (M→A) peak during heating and one austenite-to-martensite (A→M) peak during cooling, while no peak can be observed between the given temperature range in S45.
The characteristic temperatures of S12, S23, and S34, including the austenite starting temperature (As), austenite finishing temperature (Af), austenite peak temperature (Ap), martensite starting temperature (Ms), martensite finishing temperature (Mf), and martensite peak temperature (Mp) are determined from DSC graphs in Figure 12a–c. All of the phase starting and finishing temperature points were determined by the tangent method. These characteristic temperatures are all labeled in each DSC graph.
Figure 12. DSC heat flow–temperature curves of TiNiCu at four sections: (a) Section S12; (b) Section S23; (c) Section S34; (d) Section S45.
Applsci 11 04863 g012
From Figure 12a–c, it can be found that S12, S23, and S34 experience transformation during the heating and cooling temperature. In contrast, no transformation can be found in S45 in the given temperature range. This indicates that S12, S23, and S34 include the martensite TiNi phase before heating, while almost no martensite exists in S45. S12, S23, and S34 exhibit some portion of the martensite phase at room temperature (~25 °C) since their values of Mf and As are all higher than room temperature. For S45, it can be inferred that the martensite transformation may occur at a low temperature that is lower than 0 °C. Therefore, at room temperature, S45 consists of almost all austenite. This agrees well with what is found in the aforementioned XRD results. In XRD results, no strong diffraction pattern of the martensite phase can be detected in locations H4 and H5. From Figure 12a–c, peak widths of M→A: |Af−As|, and A→M: |Ms−Mf| can also be determined. The relation of peak widths among S12, S23, and S34 is S12 < S23 < S34. The temperature range for the phase transformation becomes longer when the location gets higher, which shows that the homogeneity of martensite is the highest at location H1, and it follows a descending trend when going up along the BD direction [42].
Adding Cu to replace a certain atomic number of Ni was reported to be able to reduce the thermal hysteresis, which is usually defined by the difference between Ap and Mp [46], or the difference between Af and Ms [47]. In this work, the thermal hysteresis calculated by |Ap−Mp| of these three sections can be found for S12 (11 °C), S23 (12 °C), and S34 (16 °C). Peak widths and hysteresis of S12, S23, and S34 in this work are summarized in Table 3. Several previously reported thermal hysteresis values of TiNiCu alloys and additively manufactured TiNi alloys have been collected and listed together with S12, S23, and S34 in Table 4 for comparison.
The thermal hysteresis of TiNi is mostly within the range of 25~40 °C [48], as seen from the TiNi binary alloys listed in Table 4 by both AM and non-AM methods. Table 4 indicates that most reported hysteresis values of TiNiCu ternary shape memory alloys by various non-AM techniques are below 25 °C. There is very little reported hysteresis of TiNiCu by AM so far, and in this work, the TiNiCu fabricated by elemental powder-based DED reaches a much more narrow range of 11~16 °C.

4. Conclusions

In this work, a TiNiCu ternary shape memory alloy single-wall structure was fabricated by the DED process through an elemental powder mixture. As AM is a layer-based manufacturing technique and the elemental powder mixture is a novel concept in AM, the single-wall structure was equally separated into five location points along the BD to perform comprehensive material characterization on the chemical composition, phase, mechanical properties, and functional properties with regard to various locations of interest. The main conclusions are summarized below:
For the overall element composition along the BD, at the upper locations, the compositions of the three elements are much closer to the as-mixed composition. The small area EDS analysis results show that all matrix phases are TiNi phases, where a small portion of Ni atoms are replaced by Cu. At the lower locations, the main secondary phase is Ti2Ni. The Ti2Ni composition decreases when the location goes up due to the decrease in the Ti element composition. At the top of the as-deposited single-wall structure, a small amount of the Ni-rich secondary phase exists where the Ti composition decreases to slightly below 50 at.%.
The XRD patterns indicate the increase in austenite TiNi and the decrease in martensite TiNi from the bottom to the top, which is related to the changing of the compositions of Ti and (Ni + Cu). The variations in the martensitic TiNi and austenitic TiNi compositions agree well with the atomic compositions of Ti and (Ni + Cu). The average Vickers hardness at the martensite-rich area (200~250 HV0.2) is lower than the austenite-rich area (300~450 HV0.2), which also matches the XRD results well.
The UTS of the as-deposited TiNiCu tensile sample reaches 622 MPa along the horizontal direction in the area with less of the martensite phase. The vertical sample that includes martensite-rich areas within the gauge length gets a UTS of 447 MPa, and the strain at the fracture is also lower than the horizontal sample. The UTS values of both are comparable with other AM-based TiNi binary alloys.
Strong martensite–austenite transformation signals are witnessed from the DSC results in sections S12, S23, and S34 within the 0~120 °C temperature range, which reflects a good phase transformation response at room temperature. The three sections’ thermal hysteresis values are much smaller than AM-based TiNi binary alloys. These results agree well with reducing thermal hysteresis by adding Cu in the Ti–Ni binary system.

Author Contributions

Conceptualization, Y.C.; methodology, Y.C., X.Z.; formal analysis, Y.C., X.Z., J.W.N.; investigation, Y.C., M.M.P.; writing—original draft preparation, Y.C., X.Z., M.M.P.; writing—review and editing, Y.C., X.Z., M.M.P., J.W.N., F.L.; supervision, J.W.N., F.L.; project administration, F.L.; funding acquisition, F.L. All authors have read and agreed to the published version of the manuscript.

Funding

This research was funded by NSF, grant number CMMI 1625736.

Institutional Review Board Statement

Not applicable.

Informed Consent Statement

Not applicable.

Data Availability Statement

Not applicable.

Acknowledgments

The authors greatly acknowledge the research supports from the Intelligent Systems Center (ISC), Material Research Center (MRC), and Department of Chemistry Shared Instrument Lab at Missouri S&T for the help in sample preparation and material characterization.

Conflicts of Interest

The authors declare no conflict of interest.

References

  1. Taheri, H.; Koester, L.W.; Bigelow, T.A.; Faierson, E.J.; Bond, L.J. In situ additive manufacturing process monitoring with an acoustic technique: clustering performance evaluation using K-means algorithm. J. Manuf. Sci. Eng. 2019, 141, 041011. [Google Scholar] [CrossRef]
  2. F42 Committee. Standard Guide for Directed Energy Deposition of Metals; ASTM International: West Conshohocken, PA, USA, 2016. [Google Scholar]
  3. Wang, Z.; Palmer, T.A.; Beese, A.M. Effect of processing parameters on microstructure and tensile properties of austenitic stainless steel 304L made by directed energy deposition additive manufacturing. Acta Mater. 2016, 110, 226–235. [Google Scholar] [CrossRef] [Green Version]
  4. Tan, Z.E.; Pang, J.H.L.; Kaminski, J.; Pepin, H. Characterisation of porosity, density, and microstructure of directed energy deposited stainless steel AISI 316L. Addit. Manuf. 2019, 25, 286–296. [Google Scholar] [CrossRef]
  5. Bai, Y.; Chaudhari, A.; Wang, H. Investigation on the microstructure and machinability of ASTM A131 steel manufactured by directed energy deposition. J. Mater. Process. Technol. 2020, 276, 116410. [Google Scholar] [CrossRef]
  6. Sui, S.; Chen, J.; Li, Z.; Li, H.; Zhao, X.; Tan, H. Investigation of dissolution behavior of laves phase in inconel 718 fabricated by laser directed energy deposition. Addit. Manuf. 2020, 32, 101055. [Google Scholar] [CrossRef]
  7. Hu, Y.; Lin, X.; Li, Y.; Zhang, S.; Gao, X.; Liu, F.; Huang, W. Plastic deformation behavior and dynamic recrystallization of Inconel 625 superalloy fabricated by directed energy deposition. Mater. Des. 2020, 186, 108359. [Google Scholar] [CrossRef]
  8. Kistler, N.A.; Nassar, A.R.; Reutzel, E.W.; Corbin, D.J.; Beese, A.M. Effect of directed energy deposition processing parameters on laser deposited Inconel®718: Microstructure, fusion zone morphology, and hardness. J. Laser Appl. 2017, 29, 022005. [Google Scholar] [CrossRef]
  9. Wolff, S.; Lee, T.; Faierson, E.; Ehmann, K.; Cao, J. Anisotropic properties of directed energy deposition (DED)-processed Ti–6Al–4V. J. Manuf. Process. 2016, 24, 397–405. [Google Scholar] [CrossRef] [Green Version]
  10. Keist, J.S.; Palmer, T.A. Role of geometry on properties of additively manufactured Ti-6Al-4V structures fabricated using laser based directed energy deposition. Mater. Des. 2016, 106, 482–494. [Google Scholar] [CrossRef]
  11. Kistler, N.A.; Corbin, D.J.; Nassar, A.R.; Reutzel, E.W.; Beese, A.M. Effect of processing conditions on the microstructure, porosity, and mechanical properties of Ti-6Al-4V repair fabricated by directed energy deposition. J. Mater. Process. Technol. 2019, 264, 172–181. [Google Scholar] [CrossRef]
  12. Javidani, M.; Arreguin-Zavala, J.; Danovitch, J.; Tian, Y.; Brochu, M. Additive Manufacturing of AlSi10Mg Alloy Using Direct Energy Deposition: Microstructure and Hardness Characterization. J. Therm. Spray Technol. 2017, 26, 587–597. [Google Scholar] [CrossRef] [Green Version]
  13. Svetlizky, D.; Zheng, B.; Buta, T.; Zhou, Y.; Golan, O.; Breiman, U.; Haj-Ali, R.; Schoenung, J.M.; Lavernia, E.J.; Eliaz, N. Directed energy deposition of Al 5xxx alloy using Laser Engineered Net Shaping (LENS®). Mater. Des. 2020, 192, 108763. [Google Scholar] [CrossRef]
  14. Clayton, R.M. The Use of Elemental Powder Mixes in Laser-Based Additive Manufacturing. Master’s Thesis, Missouri University of Science and Technology, Missouri, MO, USA, 2013. [Google Scholar]
  15. Mahamood, R.M.; Akinlabi, E.T.; Shukla, M.; Pityana, S.L. Characterization of laser deposited Ti6Al4V/TiC composite powders on a Ti6Al4V substrate. Lasers Eng. 2014, 29, 197–213. [Google Scholar]
  16. Shen, M.-Y.; Tian, X.-J.; Liu, D.; Tang, H.-B.; Cheng, X. Microstructure and fracture behavior of TiC particles reinforced Inconel 625 composites prepared by laser additive manufacturing. J. Alloys Compd. 2018, 734, 188–195. [Google Scholar] [CrossRef]
  17. Farayibi, P.K.; Folkes, J.; Clare, A.; Oyelola, O. Cladding of pre-blended Ti–6Al–4V and WC powder for wear resistant applications. Surf. Coat. Technol. 2011, 206, 372–377. [Google Scholar] [CrossRef]
  18. Li, N.; Xiong, Y.; Xiong, H.; Shi, G.; Blackburn, J.; Liu, W.; Qin, R. Microstructure, formation mechanism and property characterization of Ti + SiC laser cladded coatings on Ti6Al4V alloy. Mater. Charact. 2019, 148, 43–51. [Google Scholar] [CrossRef]
  19. Chaudhary, V.; Yadav, N.M.S.K.K.; Mantri, S.A.; Dasari, S.; Jagetia, A.; Ramanujan, R.V.; Banerjee, R. Additive manufacturing of functionally graded Co–Fe and Ni–Fe magnetic materials. J. Alloys Compd. 2020, 823, 153817. [Google Scholar] [CrossRef]
  20. Karnati, S.; Zhang, Y.; Liou, F.F.; Newkirk, J.W. On the Feasibility of Tailoring Copper–Nickel Functionally Graded Materials Fabricated through Laser Metal Deposition. Metals 2019, 9, 287. [Google Scholar] [CrossRef] [Green Version]
  21. Collins, P.C.; Banerjee, R.; Banerjee, S.; Fraser, H.L. Laser deposition of compositionally graded titanium–vanadium and titanium–molybdenum alloys. Mater. Sci. Eng. 2003, 352, 118–128. [Google Scholar] [CrossRef]
  22. Chao, Q.; Guo, T.; Jarvis, T.; Wu, X.; Hodgson, P.; Fabijanic, D. Direct laser deposition cladding of AlxCoCrFeNi high entropy alloys on a high-temperature stainless steel. Surf. Coat. Technol. 2017, 332, 440–451. [Google Scholar] [CrossRef]
  23. Dobbelstein, H.; Gurevich, E.L.; George, E.P.; Ostendorf, A.; Laplanche, G. Laser metal deposition of a refractory TiZrNbHfTa high-entropy alloy. Addit. Manuf. 2018, 24, 386–390. [Google Scholar] [CrossRef]
  24. Gwalani, B.; Soni, V.; Waseem, O.A.; Mantri, S.A.; Banerjee, R. Laser additive manufacturing of compositionally graded AlCrFeMoVx (x = 0 to 1) high-entropy alloy system. Opt. Laser Technol. 2019, 113, 330–337. [Google Scholar] [CrossRef]
  25. Jani, J.M.; Leary, M.; Subic, A.; Gibson, M.A. A review of shape memory alloy research, applications and opportunities. Mater. Des. 2014, 56, 1078–1113. [Google Scholar] [CrossRef]
  26. Wen, C.; Yu, X.; Zeng, W.; Zhao, S.; Wang, L.; Wan, G.; Huang, S.; Grover, H.; Chen, Z. Mechanical behaviors and biomedical applications of shape memory materials: A review. AIMS Mater. Sci. 2018, 5, 559–590. [Google Scholar] [CrossRef]
  27. Halani, P.R.; Shin, Y.C. In Situ Synthesis and Characterization of Shape Memory Alloy Nitinol by Laser Direct Deposition. Met. Mater. Trans. A 2012, 43, 650–657. [Google Scholar] [CrossRef]
  28. Baran, A.; Polanski, M. Microstructure and properties of LENS (laser engineered net shaping) manufactured Ni-Ti shape memory alloy. J. Alloys Compd. 2018, 750, 863–870. [Google Scholar] [CrossRef]
  29. Marattukalam, J.J.; Singh, A.K.; Datta, S.; Das, M.; Balla, V.K.; Bontha, S.; Kalpathy, S.K. Microstructure and corrosion behavior of laser processed NiTi alloy. Mater. Sci. Eng. C 2015, 57, 309–313. [Google Scholar] [CrossRef]
  30. De Araújo, C.J.; Da Silva, N.J.; Da Silva, M.M.; Gonzalez, C.H. A comparative study of Ni–Ti and Ni–Ti–Cu shape memory alloy processed by plasma melting and injection molding. Mater. Des. 2011, 32, 4925–4930. [Google Scholar] [CrossRef]
  31. Chen, Y.; Zhang, X.; Parvez, M.M.; Liou, F. A Review on Metallic Alloys Fabrication Using Elemental Powder Blends by Laser Powder Directed Energy Deposition Process. Materials 2020, 13, 3562. [Google Scholar] [CrossRef]
  32. Shiva, S.; Palani, I.; Paul, C.; Mishra, S.; Singh, B. Investigations on phase transformation and mechanical characteristics of laser additive manufactured TiNiCu shape memory alloy structures. J. Mater. Process. Technol. 2016, 238, 142–151. [Google Scholar] [CrossRef]
  33. Carroll, B.E.; Palmer, T.A.; Beese, A.M. Anisotropic tensile behavior of Ti–6Al–4V components fabricated with directed energy deposition additive manufacturing. Acta Mater. 2015, 87, 309–320. [Google Scholar] [CrossRef]
  34. Karnati, S.; Hoerchler, J.L.; Liou, F.; Newkirk, J.W. Influence of gage length on miniature tensile characterization of powder bed fabricated 304L stainless steel. In Proceedings of the 28th Solid Freeform Fabrication Symposium, Austin, TX, USA, 7–9 August 2017; pp. 7–9. [Google Scholar]
  35. Chen, X. Fabrication and Characterization of Advanced Materials Using Laser Metal Deposition from Elemental Powder Mixture. Ph.D. Thesis, Missouri University of Science and Technology, Missouri, MO, USA, 2018. [Google Scholar]
  36. Zhu, W.J.; Duarte, L.I.; Leinenbach, C. Experimental study and thermodynamic assessment of the Cu–Ni–Ti system. Calphad 2014, 47, 9–22. [Google Scholar] [CrossRef]
  37. Tadayyon, G.; Mazinani, M.; Guo, Y.; Zebarjad, S.M.; Tofail, S.A.; Biggs, M.J. Study of the microstructure evolution of heat treated Ti-rich NiTi shape memory alloy. Mater. Charact. 2016, 112, 11–19. [Google Scholar] [CrossRef]
  38. Zhang, X.; Chen, Y.; Liou, F. Fabrication of SS316L-IN625 functionally graded materials by powder-fed directed energy deposition. Sci. Technol. Weld. Join. 2019, 24, 504–516. [Google Scholar] [CrossRef]
  39. Zupanc, J.; Vahdat-Pajouh, N.; Schäfer, E. New thermomechanically treated NiTi alloys–a review. Int. Endod. J. 2018, 51, 1088–1103. [Google Scholar] [CrossRef] [PubMed] [Green Version]
  40. Wang, C.; Tan, X.; Du, Z.; Chandra, S.; Sun, Z.; Lim, C.; Tor, S.B.; Wong, C. Additive manufacturing of NiTi shape memory alloys using pre-mixed powders. J. Mater. Process. Technol. 2019, 271, 152–161. [Google Scholar] [CrossRef]
  41. Shiva, S.; Palani, I.; Mishra, S.; Paul, C.; Kukreja, L. Investigations on the influence of composition in the development of Ni–Ti shape memory alloy using laser based additive manufacturing. Opt. Laser Technol. 2015, 69, 44–51. [Google Scholar] [CrossRef]
  42. Kumar, S.; Marandi, L.; Balla, V.K.; Bysakh, S.; Piorunek, D.; Eggeler, G.; Das, M.; Sen, I. Microstructure–Property correlations for additively manufactured NiTi based shape memory alloys. Materialia 2019, 8, 100456. [Google Scholar] [CrossRef]
  43. Moghaddam, N.S.; Saghaian, S.E.; Amerinatanzi, A.; Ibrahim, H.; Li, P.; Toker, G.P.; Karaca, H.E.; Elahinia, M. Anisotropic tensile and actuation properties of NiTi fabricated with selective laser melting. Mater. Sci. Eng. A 2018, 724, 220–230. [Google Scholar] [CrossRef]
  44. Zhang, Q.; Hao, S.; Liu, Y.; Xiong, Z.; Guo, W.; Yang, Y.; Ren, Y.; Cui, L.; Ren, L.; Zhang, Z. The microstructure of a selective laser melting (SLM)-fabricated NiTi shape memory alloy with superior tensile property and shape memory recoverability. Appl. Mater. Today 2020, 19, 100547. [Google Scholar] [CrossRef]
  45. Zeng, Z.; Cong, B.; Oliveira, J.; Ke, W.; Schell, N.; Peng, B.; Qi, Z.; Ge, F.; Zhang, W.; Ao, S. Wire and arc additive manufacturing of a Ni-rich NiTi shape memory alloy: Microstructure and mechanical properties. Addit. Manuf. 2020, 32, 101051. [Google Scholar] [CrossRef]
  46. Phukaoluan, A.; Khantachawana, A.; Kaewtathip, P.; Dechkunakorn, S.; Anuwongnukroh, N.; Santiwong, P.; Kajornchaiyakul, J. Property Improvement of TiNi by Cu Addition for Orthodontics Applications. Appl. Mech. Mater. 2011, 87, 95–100. [Google Scholar] [CrossRef]
  47. Sampath, V.; Srinithi, R.; Santosh, S.; Sarangi, P.P.; Fathima, J.S. The Effect of Quenching Methods on Transformation Characteristics and Microstructure of an NiTiCu Shape Memory Alloy. Trans. Indian Inst. Met. 2020, 73, 1481–1488. [Google Scholar] [CrossRef]
  48. Elahinia, M.H.; Hashemi, M.; Tabesh, M.; Bhaduri, S.B. Manufacturing and processing of NiTi implants: A review. Prog. Mater. Sci. 2012, 57, 911–946. [Google Scholar] [CrossRef]
  49. Zhang, H.J.; Qiu, C.J. A TiNiCu Thin Film Micropump Made by Magnetron Co-Sputtered Method. Mater. Trans. 2006, 47, 532–535. [Google Scholar] [CrossRef] [Green Version]
  50. Krishna, B.V.; Bose, S.; Bandyopadhyay, A. Laser Processing of Net-Shape NiTi Shape Memory Alloy. Met. Mater. Trans. A 2007, 38, 1096–1103. [Google Scholar] [CrossRef]
  51. Zhang, B.; Chen, J.; Coddet, C. Microstructure and Transformation Behavior of in-situ Shape Memory Alloys by Selective Laser Melting Ti–Ni Mixed Powder. J. Mater. Sci. Technol. 2013, 29, 863–867. [Google Scholar] [CrossRef]
  52. Elsayed, A.; Umeda, J.; Kondoh, K. Effect of quenching media on the properties of TiNi shape memory alloys fabricated by powder metallurgy. J. Alloys Compd. 2020, 842, 155931. [Google Scholar] [CrossRef]
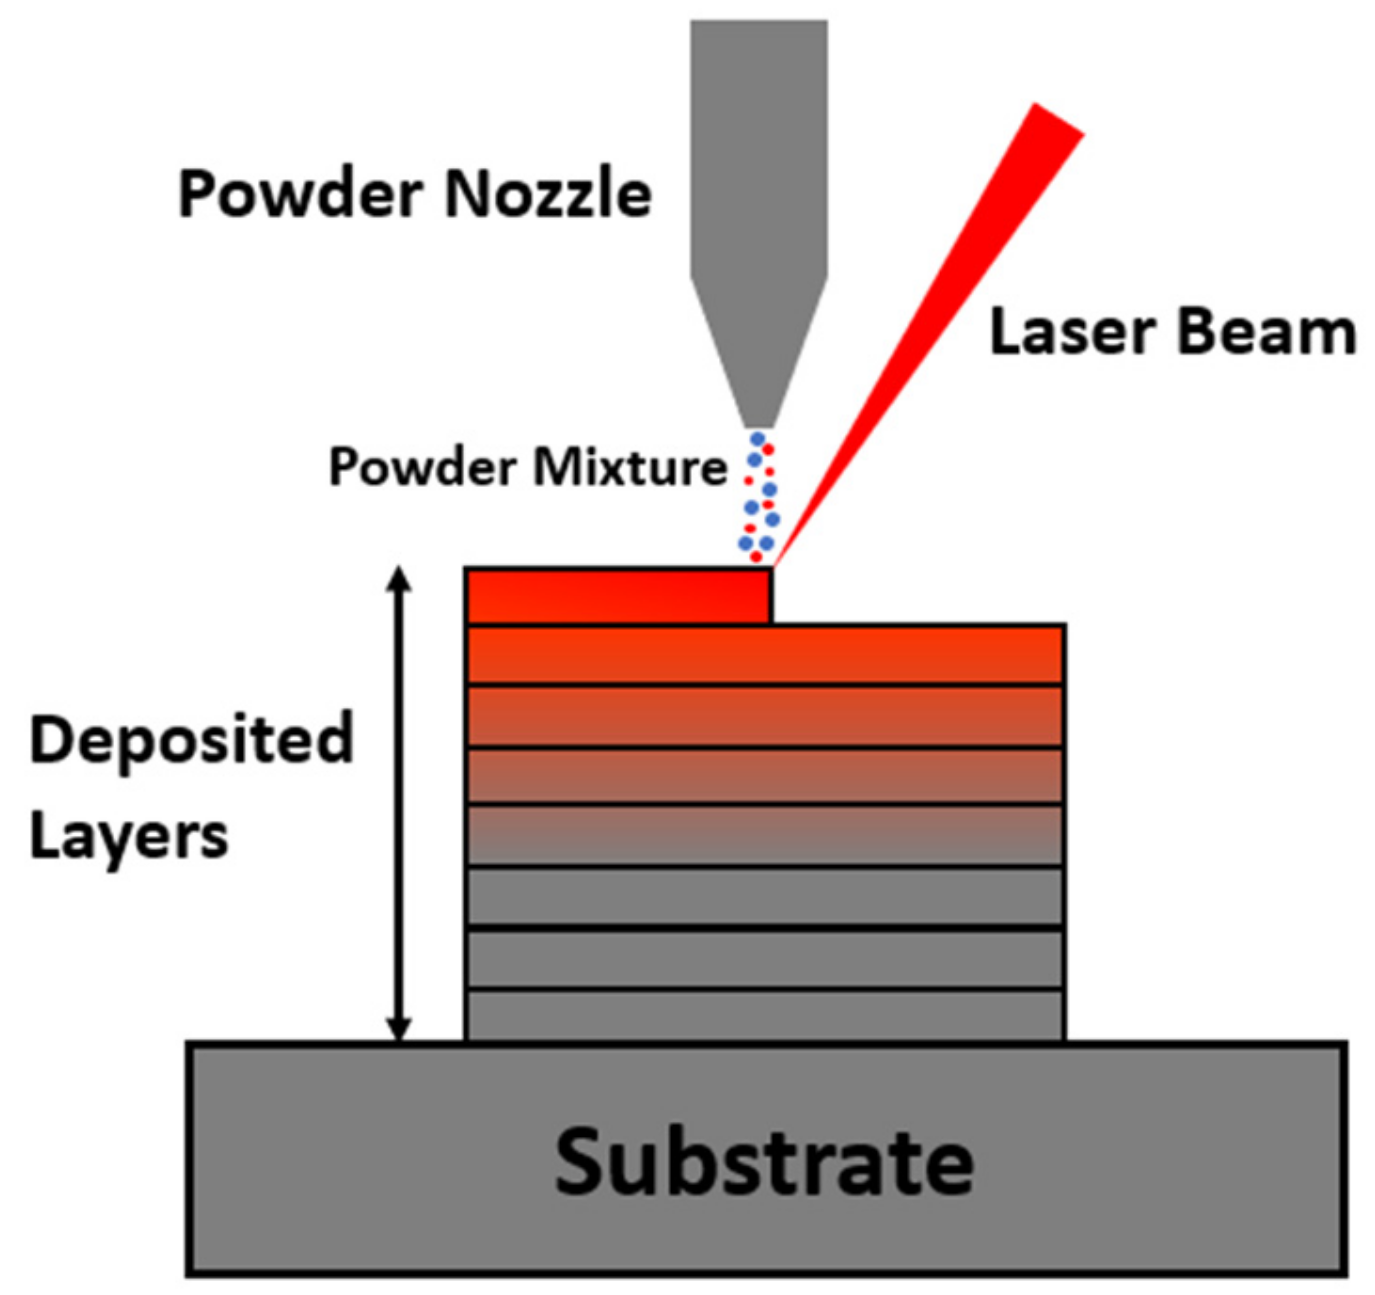
Figure 1. The schematic of laser-based DED with pre-mixed powders as feedstock materials.
Applsci 11 04863 g001
Figure 2. SEM images of elemental powders used in this work: (a) Ti; (b) Ni; (c) Cu.
Applsci 11 04863 g002
Figure 3. Schematic of the location H1, H2, H3, H4 and H5 along the BD.
Applsci 11 04863 g003
Figure 4. The mini tensile sample design.
Applsci 11 04863 g004
Figure 5. Image of the as-deposited TiNiCu single wall on Ti substrate.
Applsci 11 04863 g005
Figure 6. Ti, Ni, and Cu element composition distribution along with the height locations.
Applsci 11 04863 g006
Figure 8. XRD patterns of five locations: (a) H1; (b) H2; (c) H3; (d) H4; (e) H5.
Applsci 11 04863 g008aApplsci 11 04863 g008b
Figure 9. Vickers hardness distribution along the BD.
Applsci 11 04863 g009
Figure 10. Stress–strain curves: (a) Horizontal tensile sample; (b) vertical tensile sample.
Applsci 11 04863 g010
Figure 11. Fracture surface of the fractured tensile sample under SEM: (a,b) Horizontal sample; (c,d) vertical sample.
Applsci 11 04863 g011
Table 1. The EDS results of ten selected areas in Figure 7.
Area No.
for EDS
Ti at.%Ni at.%Cu at.%
151.238.410.4
266.329.64.1
351.440.97.7
467.330.22.5
551.042.86.2
664.631.53.9
749.445.84.9
863.933.13.0
948.246.25.6
1035.342.721.9
Table 2. Comparison of UTS of current work and other published AM TiNi alloys.
UTS (MPa)AM Processing MethodsRef.
622 for the horizontal sample
447 for the vertical sample
DED (elemental powder)This work
250DED (elemental powder)[40]
320DED (elemental powder)[41]
780DED (pre-alloyed)[42]
601SLM [43]
690 ± 15 SLM[44]
571.4 ± 18.6 WAAM[45]
Table 3. Peak width and hysteresis of Sections S12, S23, and S34.
Section|Ms−Mf| (°C)|Af−As| (°C)|Ap−Mp| (Hysteresis) (°C)
S1210811
S23121712
S34272816
Table 4. Comparison of thermal hysteresis of TiNiCu and TiNi.
Material TypeProcessingHysteresis (°C)Ref.
TiNiCuDED11~16This work
Plasma skull push–pull21.1[30]
Vacuum arc melting23.8~30.6[46]
Ingot metallurgy5~19[47]
Magnetron sputtering9[49]
TiNiDED35.3~45.9[50]
SLM30[51]
SLM28[44]
Powder metallurgy30~36[52]
Publisher’s Note: MDPI stays neutral with regard to jurisdictional claims in published maps and institutional affiliations.