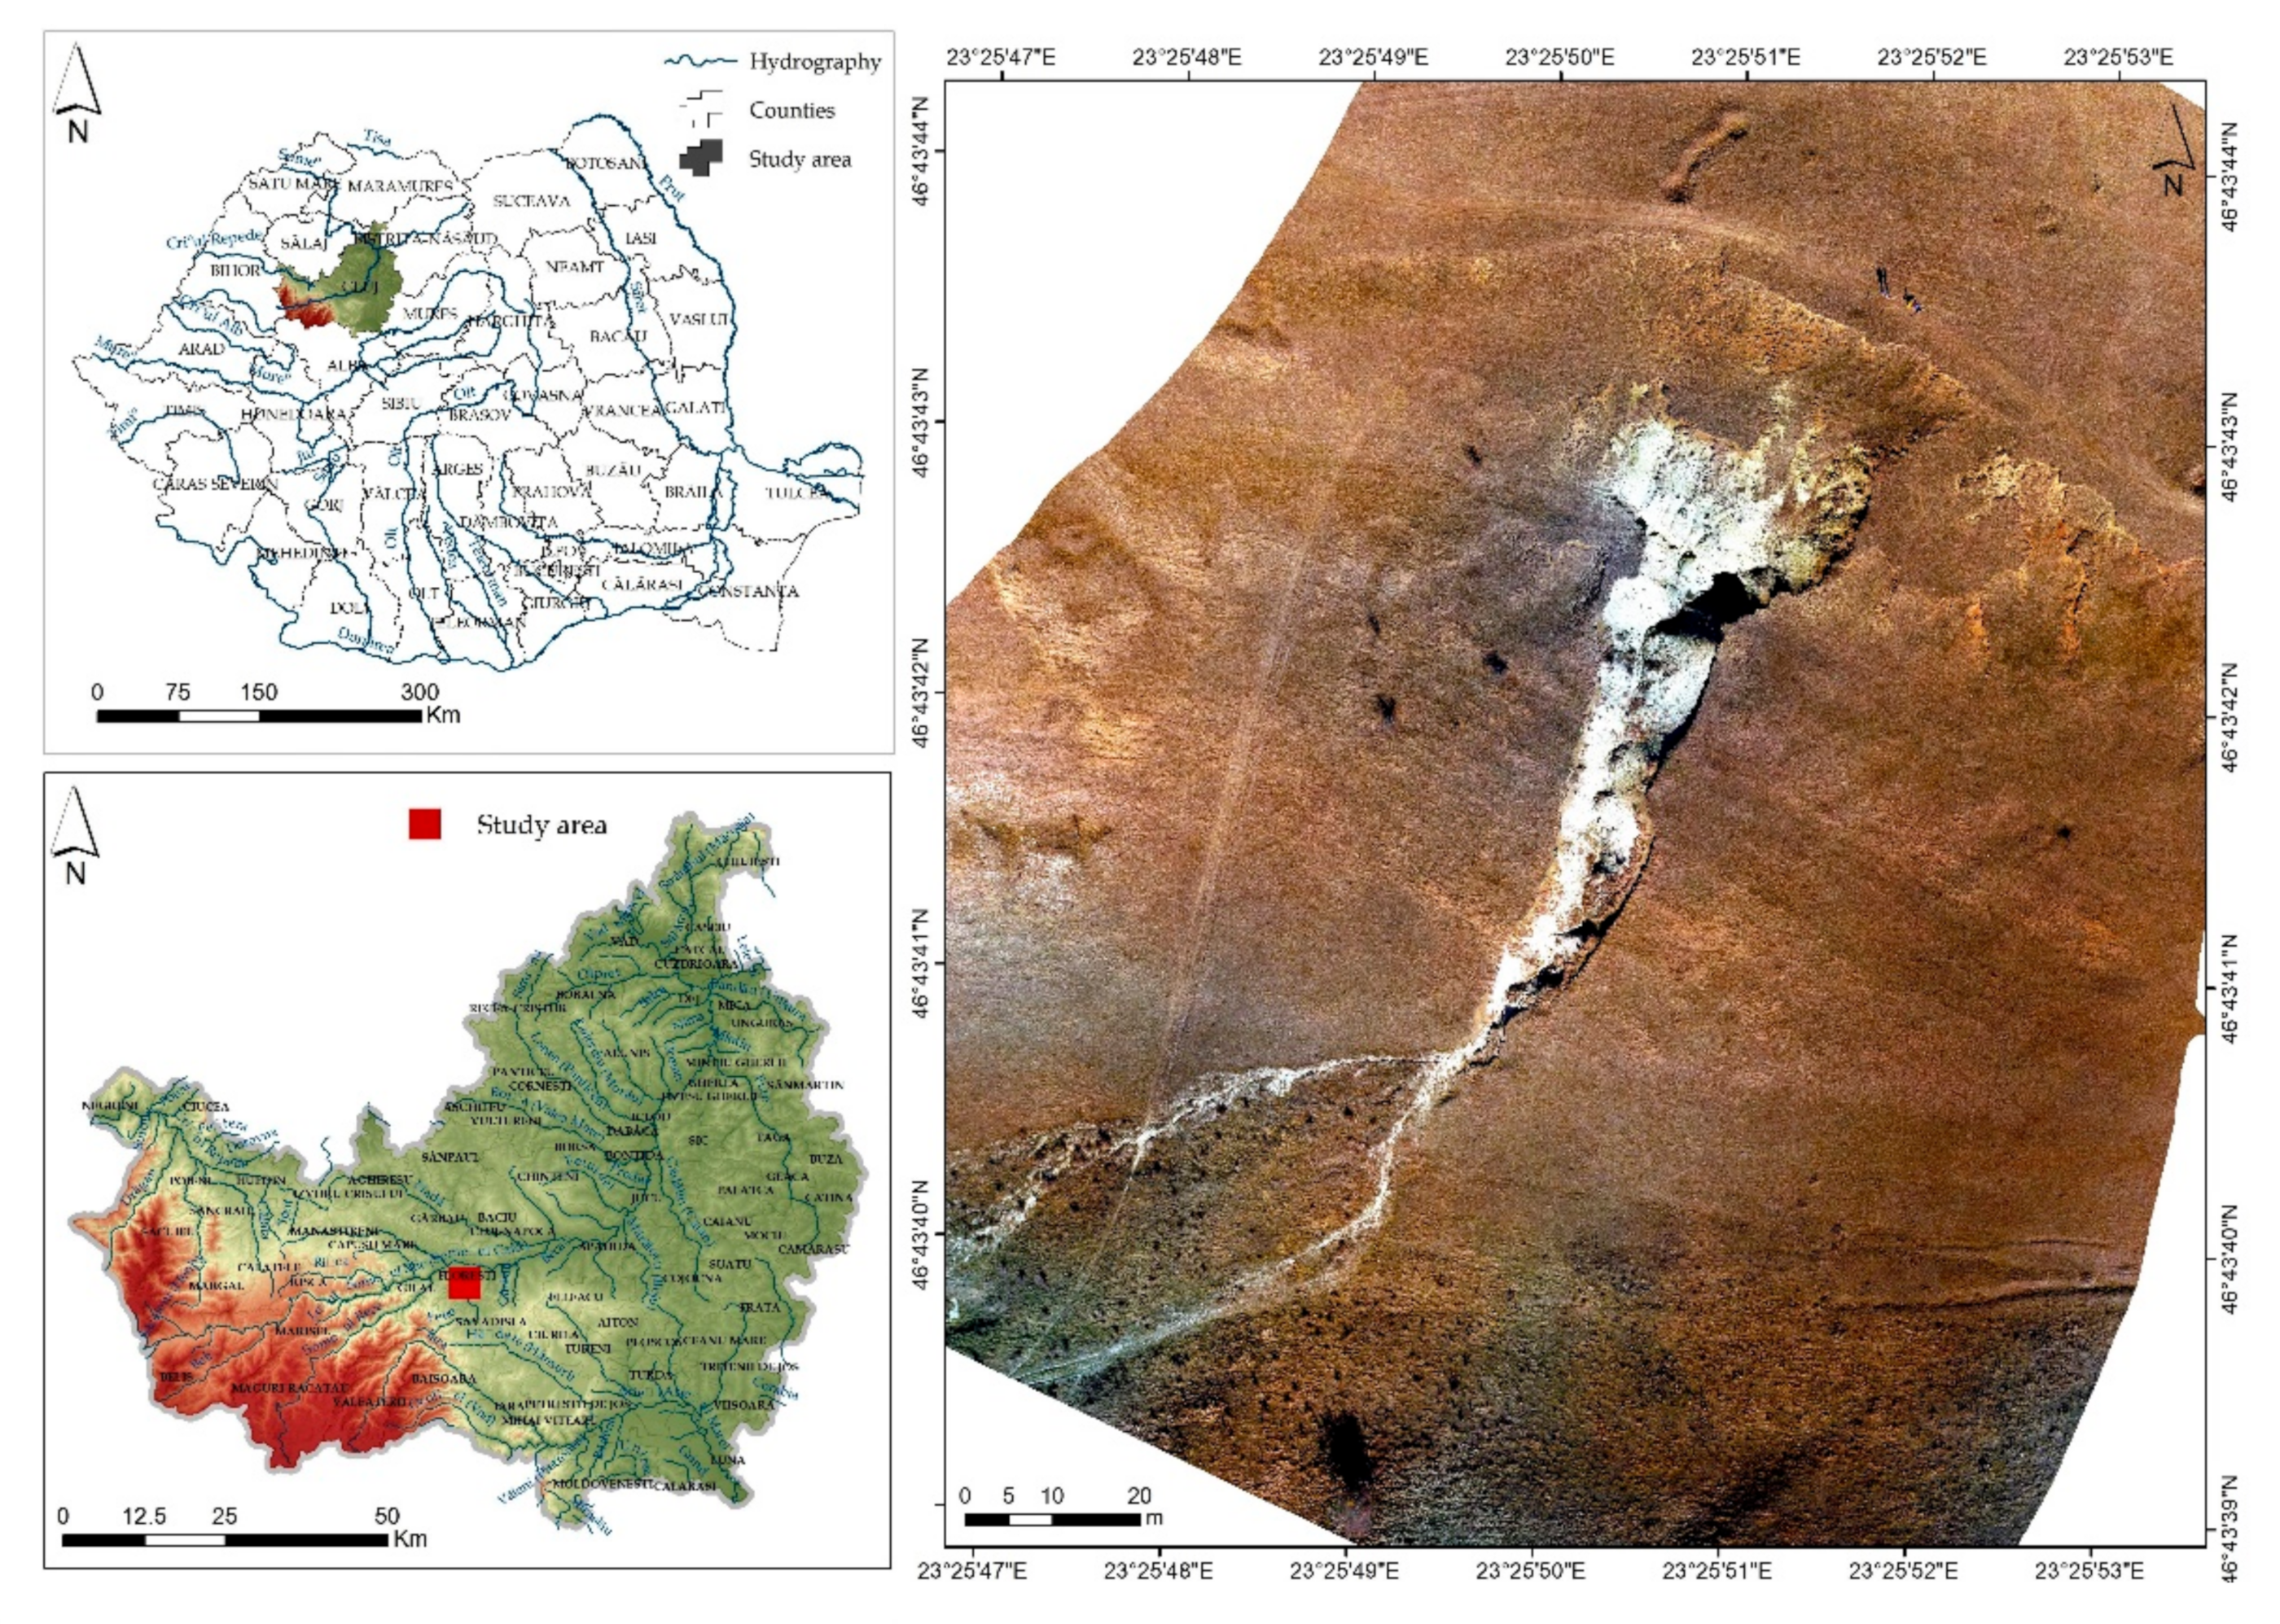
1. Introduction
The issue raised by the assessment and management of degraded lands caused by deep erosion processes is of current importance considering the impact on the field due to changes in the precipitation regime influenced by global climate change [
1,
2,
3] and the lack of hydro-ameliorative works after the transfer of ownership from state property (specific to the pre-1989 communist regime in Romania) to private ownership (population or economic agents) [
4]. The erosion processes that induce vulnerability and territorial risk, having the greatest effects on degraded land, are represented by surface erosion and develop deep processes, gullies, ravines and torrents, as a result of precarious intervention [
5] or total disinterest in mitigating or diminishing the development of the mentioned processes due to the small profit that can be obtained as a result of the exploitation of these lands [
6,
7,
8,
9,
10].
Among the erosion processes that severely affect agricultural areas, ravine formation is the main issue when trying to ameliorate lands for reintroduction into the agricultural circuit for productive purposes [
11,
12]. The development of technical projects to reduce erosion and stabilize ravines affecting degraded lands in order to reduce vulnerability and risk induced in the territory are the subject of several studies developed over the years that are regarded as classical methodologies of analysis and evaluation. The development of modern calculus, design and GIS spatial analysis are assisting such studies by implementing existing methodologies in spatial analysis models, which are increasingly used in specialized practice in order to obtain results with high accuracy and efficiency [
13,
14,
15,
16,
17,
18,
19].
The majority of spatial analysis GIS software (ArcGIS, QGIS, SagaGIS, Grass, etc.) allows for the creation of models by implementing existing methodologies involving a large volume of spatial databases and substantial IT resources to identify the parameters needed to be analysed in the decision-making process (flow modelling from torrential rainfall, water flow rate, lateral erosion power, deep erosion power, shear stress, water surface elevation) in terms of hydro-amelioration arrangement and erosion reduction effects induced by the development of ravines on degraded land [
20,
21,
22].
The advantages of using GIS technology in this type of study derive from the possibility of using various sources of input data (images obtained from drones, LiDAR, satellite images, etc.) from the possibility of working with large databases, making their own models based on expert knowledge, obtaining results with high accuracy [
23] but also the possibility to visualize the results in 2D and 3D format depending on the quality of the implemented spatial analysis [
24]. In addition, very helpful in practice is the realization of scenarios in the GIS spatial analysis to provide the best solutions to reduce economic losses [
25] due to the damage to agricultural land and transport infrastructure, while allowing the best technical decisions to a range of torrential areas with high-risk potential in the context of land use change and climate change [
26].
The high intensity of precipitations combined with the lack of vegetation in the ravines developed in large areas are causing the erosion generated by the runoff to be the main triggering factor, both in depth and regressive of the mentioned processes [
27,
28]. For the modelling of the flow generated by long-term or high-intensity rainfalls, a series of extensions have been developed and implemented in geo-informational software, but also independent software that allows us to obtain important numerical and visual results for technical studies performed at different space levels. The most used software for modelling the necessary parameters for analysing ravine management studies is HEC-RAS. The HEC-RAS software offers a high performance in flood extend simulation [
29,
30] being able to accurately reproduce flow events in case of post-event modelling, in order to test the accuracy of the results, being dependent on the quality of necessary input data regarding the use of topographic data of the drainage basin at the highest possible detail and a database of land use as accurate as possible [
31,
32,
33].
HEC-RAS technology is also used successfully in flood forecasting and warning models for both urban areas [
34] and torrential events where it is possible to predict the cause of precipitation and a detailed model of the drainage network. Considering the results of the Intergovernmental Group of Climate Change [
35], which show that extreme rainfall events will increase both in intensity and frequency in the future, many studies aim to identify the spatial and temporal variability of precipitation and their estimation of the flow and associated flood risk induced from local and regional to continental levels [
36,
37,
38,
39].
The purpose of this study is to spatially analyse the parameters needed to make decisions regarding understanding the development and evolution of a ravine (stream power, max depth, velocity, shear stress, water surface elevation (WSE)) and to identify the best solutions for the improvement of the ravines with the main purpose of reducing their negative territorial impact. In order to successfully complete the proposed goal in this research, a spatial analysis model was created that focuses on UAV technology of data acquisition, for obtaining primary input databases within the model and HEC-RAS software v.5.0.7 for simulating and performing hydraulic calculations and spatialization of the parameters included in the analysis. The use of UAV technology as an integrated stage of the proposed spatial analysis model implies obtaining results with a high accuracy and precision. This is a technology used in natural and anthropogenic risk prognosis studies involving an efficient acquisition time, which is also easy to implement for large-scale topographic studies.
The present research contains three scenarios of hydrotechnical arrangement of the chosen case study ravine that were implemented in order to highlight the best hydro-amelioration arrangement solution, which also serves as a model of implementation on other surfaces with similar characteristics.
3. Methodology and Database
The implementation of empirical methodologies based on multiple studies for the arrangement of ravines in GIS spatial analysis models is achieved by managing spatial databases through geoinformation software with spatial analysis equations, which integrate spatial databases to obtain quantifiable results used in decision making regarding the control methods and land management.
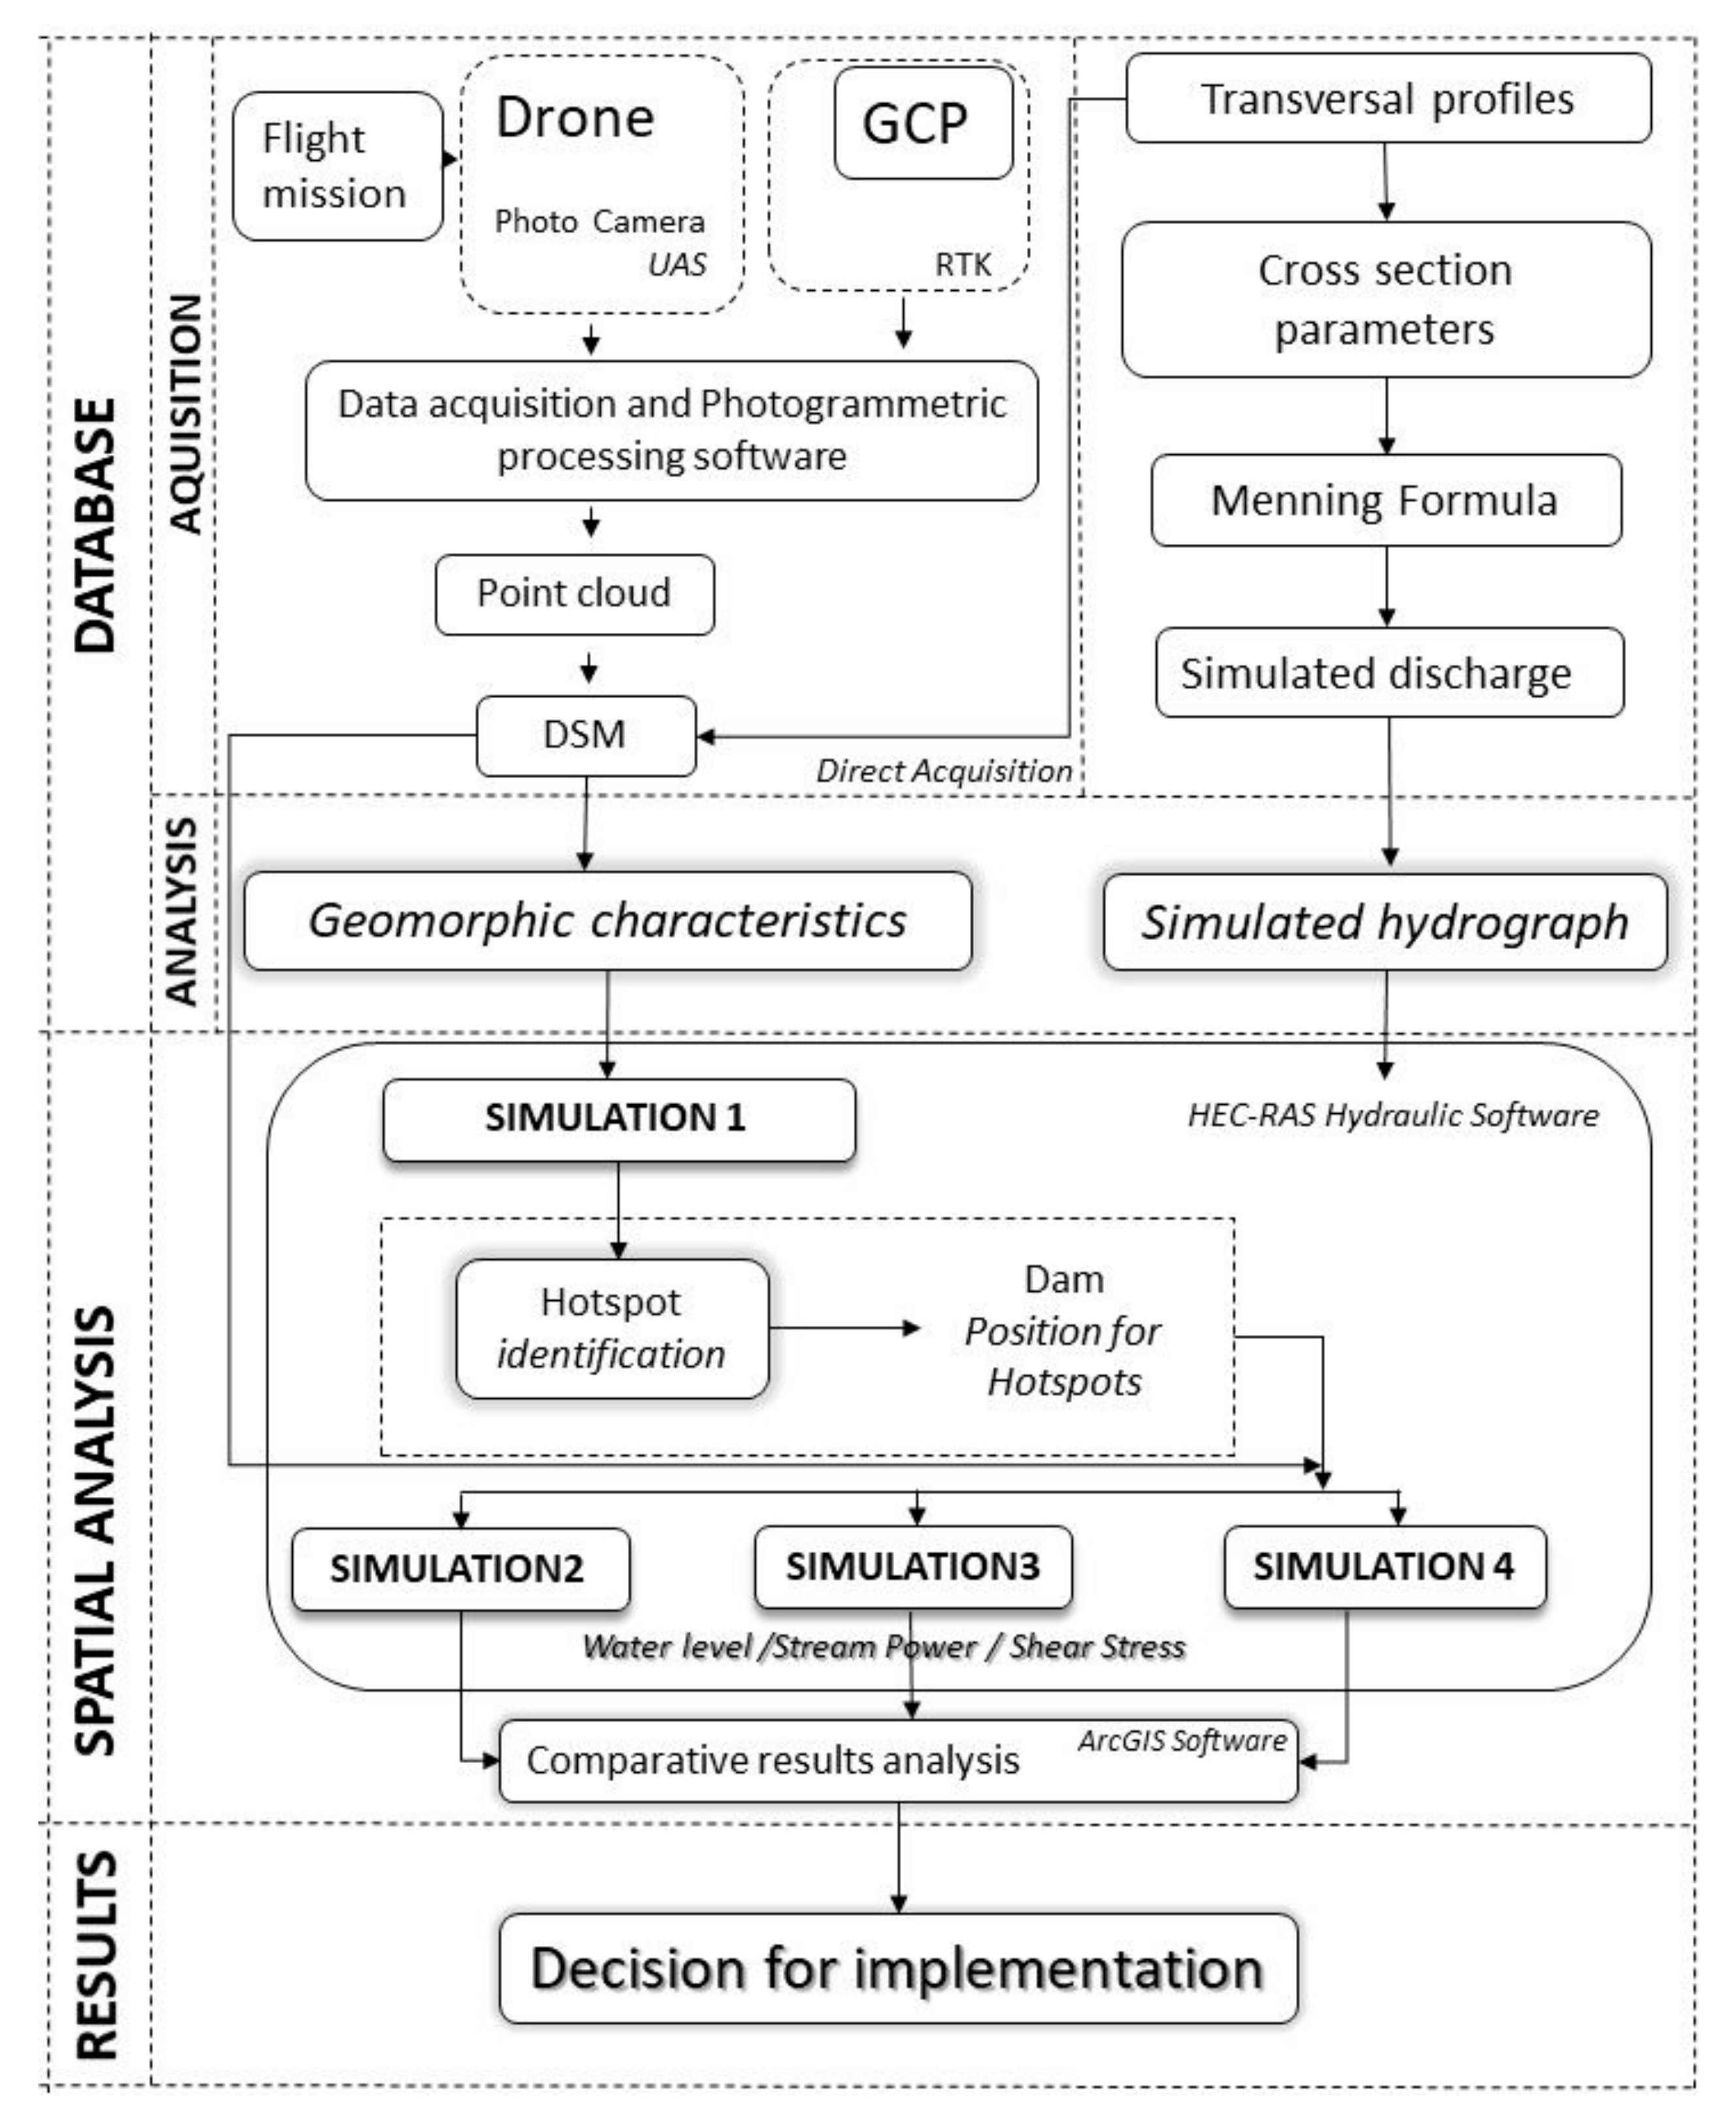
In the present case study, an independent research approach was developed based on techniques and methodology of functional integration of modern procedures of spatial database acquisition (UAV and drainage hydrography) with hydraulic analysis software and simulation and parameters modelling (HEC-RAS v.5.0.7 and ArcGIS v.10.8), necessary for the evaluation of the current state of ravine degradation and the creation of solutions for stabilization and improvement. Within the spatial analysis process, three main stages are clearly highlighted: the acquisition stage of spatial and non-spatial databases, the stage of spatial analysis and simulation and the stage of disseminating the results with decision making. Each stage is conditioned by the phase it precedes and in turn conditions the next phase.
Regarding the acquisition stage of spatial and non-spatial databases, its structure is present in the form of a submodel of spatial analysis, integrated into the general model resulting from the three main stages. This stage centres around obtaining the digital surface model, respectively, of the digital ravine elevation model, developed based on UAV and geomatics techniques, as well as the identification by calculation of the maximum theoretical simulation flow, which causes the accentuated development of the ravine by lateral and depth erosion.
The spatial analysis and simulation stage is conditioned by the quality and accuracy of the input databases within the spatial analysis and hydraulic calculation software for simulating the degree of evolution of the ravine. To complete this second stage, the HEC-RAS 5.07 software developed by the US Army Corps of Engineers was used to spatialize the necessary parameters (stream power, max depth, velocity, shear stress, WSE water surface elevation), to analyse stable and critical areas within the analysed ravine as well as for the simulation of the scenarios for different arrangement modes that aim at reducing the erosion within the ravine and, implicitly, its correct arrangement [
40,
41].
The visualization and digital mapping of the analysed parameters, as well as of the potential effects resulting from the arrangement proposal, were analysed and presented using the ArcGIS geoinformation software. As a result of implementing three scenarios for the arrangement and improvement of the analysed ravine, viable solution results with different impact in the territory were obtained. In the third stage, the results were analysed, and the best technical arrangement solution was chosen in terms of cost and efficiency. The presented methodology (
Figure 2) highlights the practical side of implementing spatial analysis models based on the use of several software for analysis and management of high-precision and accurate input databases, with the main goal of obtaining the results applicable in specialized practice and issuing viable solutions for spatial planning.
3.1. Database Acquisition
The model proposed and implemented in this study is based on two essential databases in terms of the assessment of erosion and territorial development of ravines, as follows: the digital elevation model (DEM) that highlights the shape and morphometric characteristics of the ravine, and the simulated hydrograph drainage that has the peak equal to the maximum flow that contributes to the erosion, namely the flow to full banks [
42].
The importance of a high-precision and accurate morphometric representation is essential in spatial analysis GIS models for identifying critical areas and issuing technical solutions to recover them. In this presented model, it was decided to obtain the DEM as the main spatial database input within the complex model using the UAV technique [
43]. This technique for obtaining spatial databases was chosen because it fits perfectly in terms of costs and time allocated to this stage, in order to reduce the time used and maintain the relatively low costs. Another important reason for the implementing of the UAV technique is that torrential area in the form of ravines has a relatively small spatial extent both in terms of longitudinal development and in terms of the total area developed. Thereby, with the help of drones, which have an average flight range, photos can be purchased at a high resolution so that the obtained output will consist of an accurate digital elevation model.
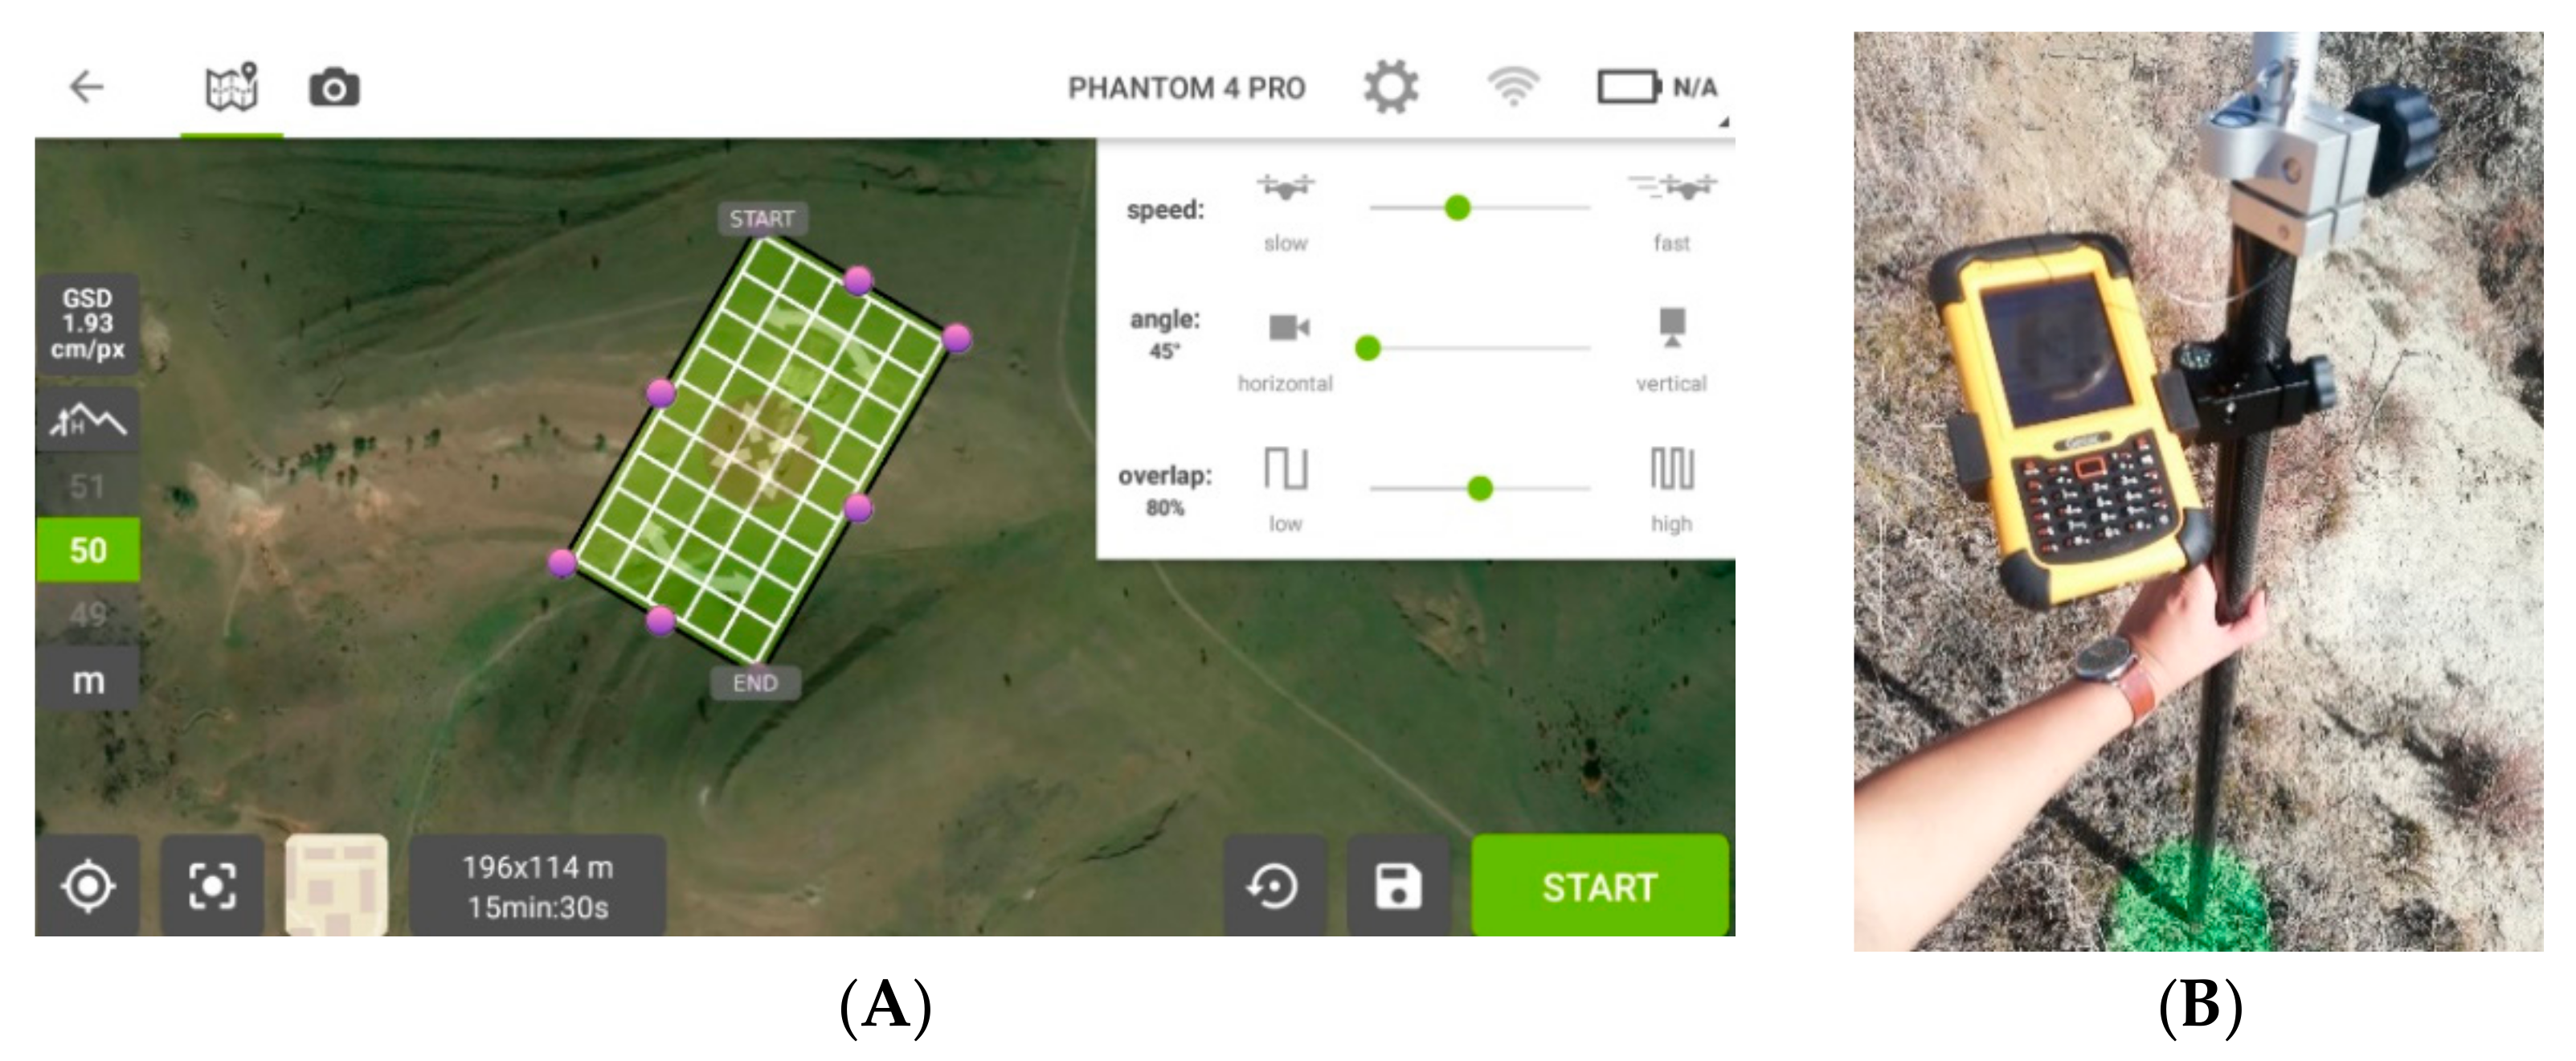
The equipment used for the acquisition of the spatial database representing the topography of the analysed ravine is the DJI Phantom 4 Pro UAV system (DJI, Nanshan, Shenzhen, China) equipped with a battery that ensures a flight autonomy of approximately 25 min and a camera that allows the acquisition of photos with a resolution of 20 megapixels as well as the GNSS system Geomax Zenith 35 (GeoMax, Widnau, Switzerland). The correct acquisition of the databases taken with the help of UAV technology firstly requires a very good analysis of the targeted area for making decisions regarding the realization of the flight plan of the drone, the choice of the overlap coefficient of consecutive and adjacent images, the territorial placement of ground control points (GCP) used in the georeferencing process and the placement of control points used in the process of calculating the errors.
Regarding the flight mission, a double flight plan oriented in the direction of NNV–SSE and NNE–SSV was opted for, with a camera orientation angle of 45 degrees, which helps to capture all the details of the analysed ravine, including the general configuration in terms of its longitudinal spatial extension, as well as the banks slope, with a flight height of 50 m (
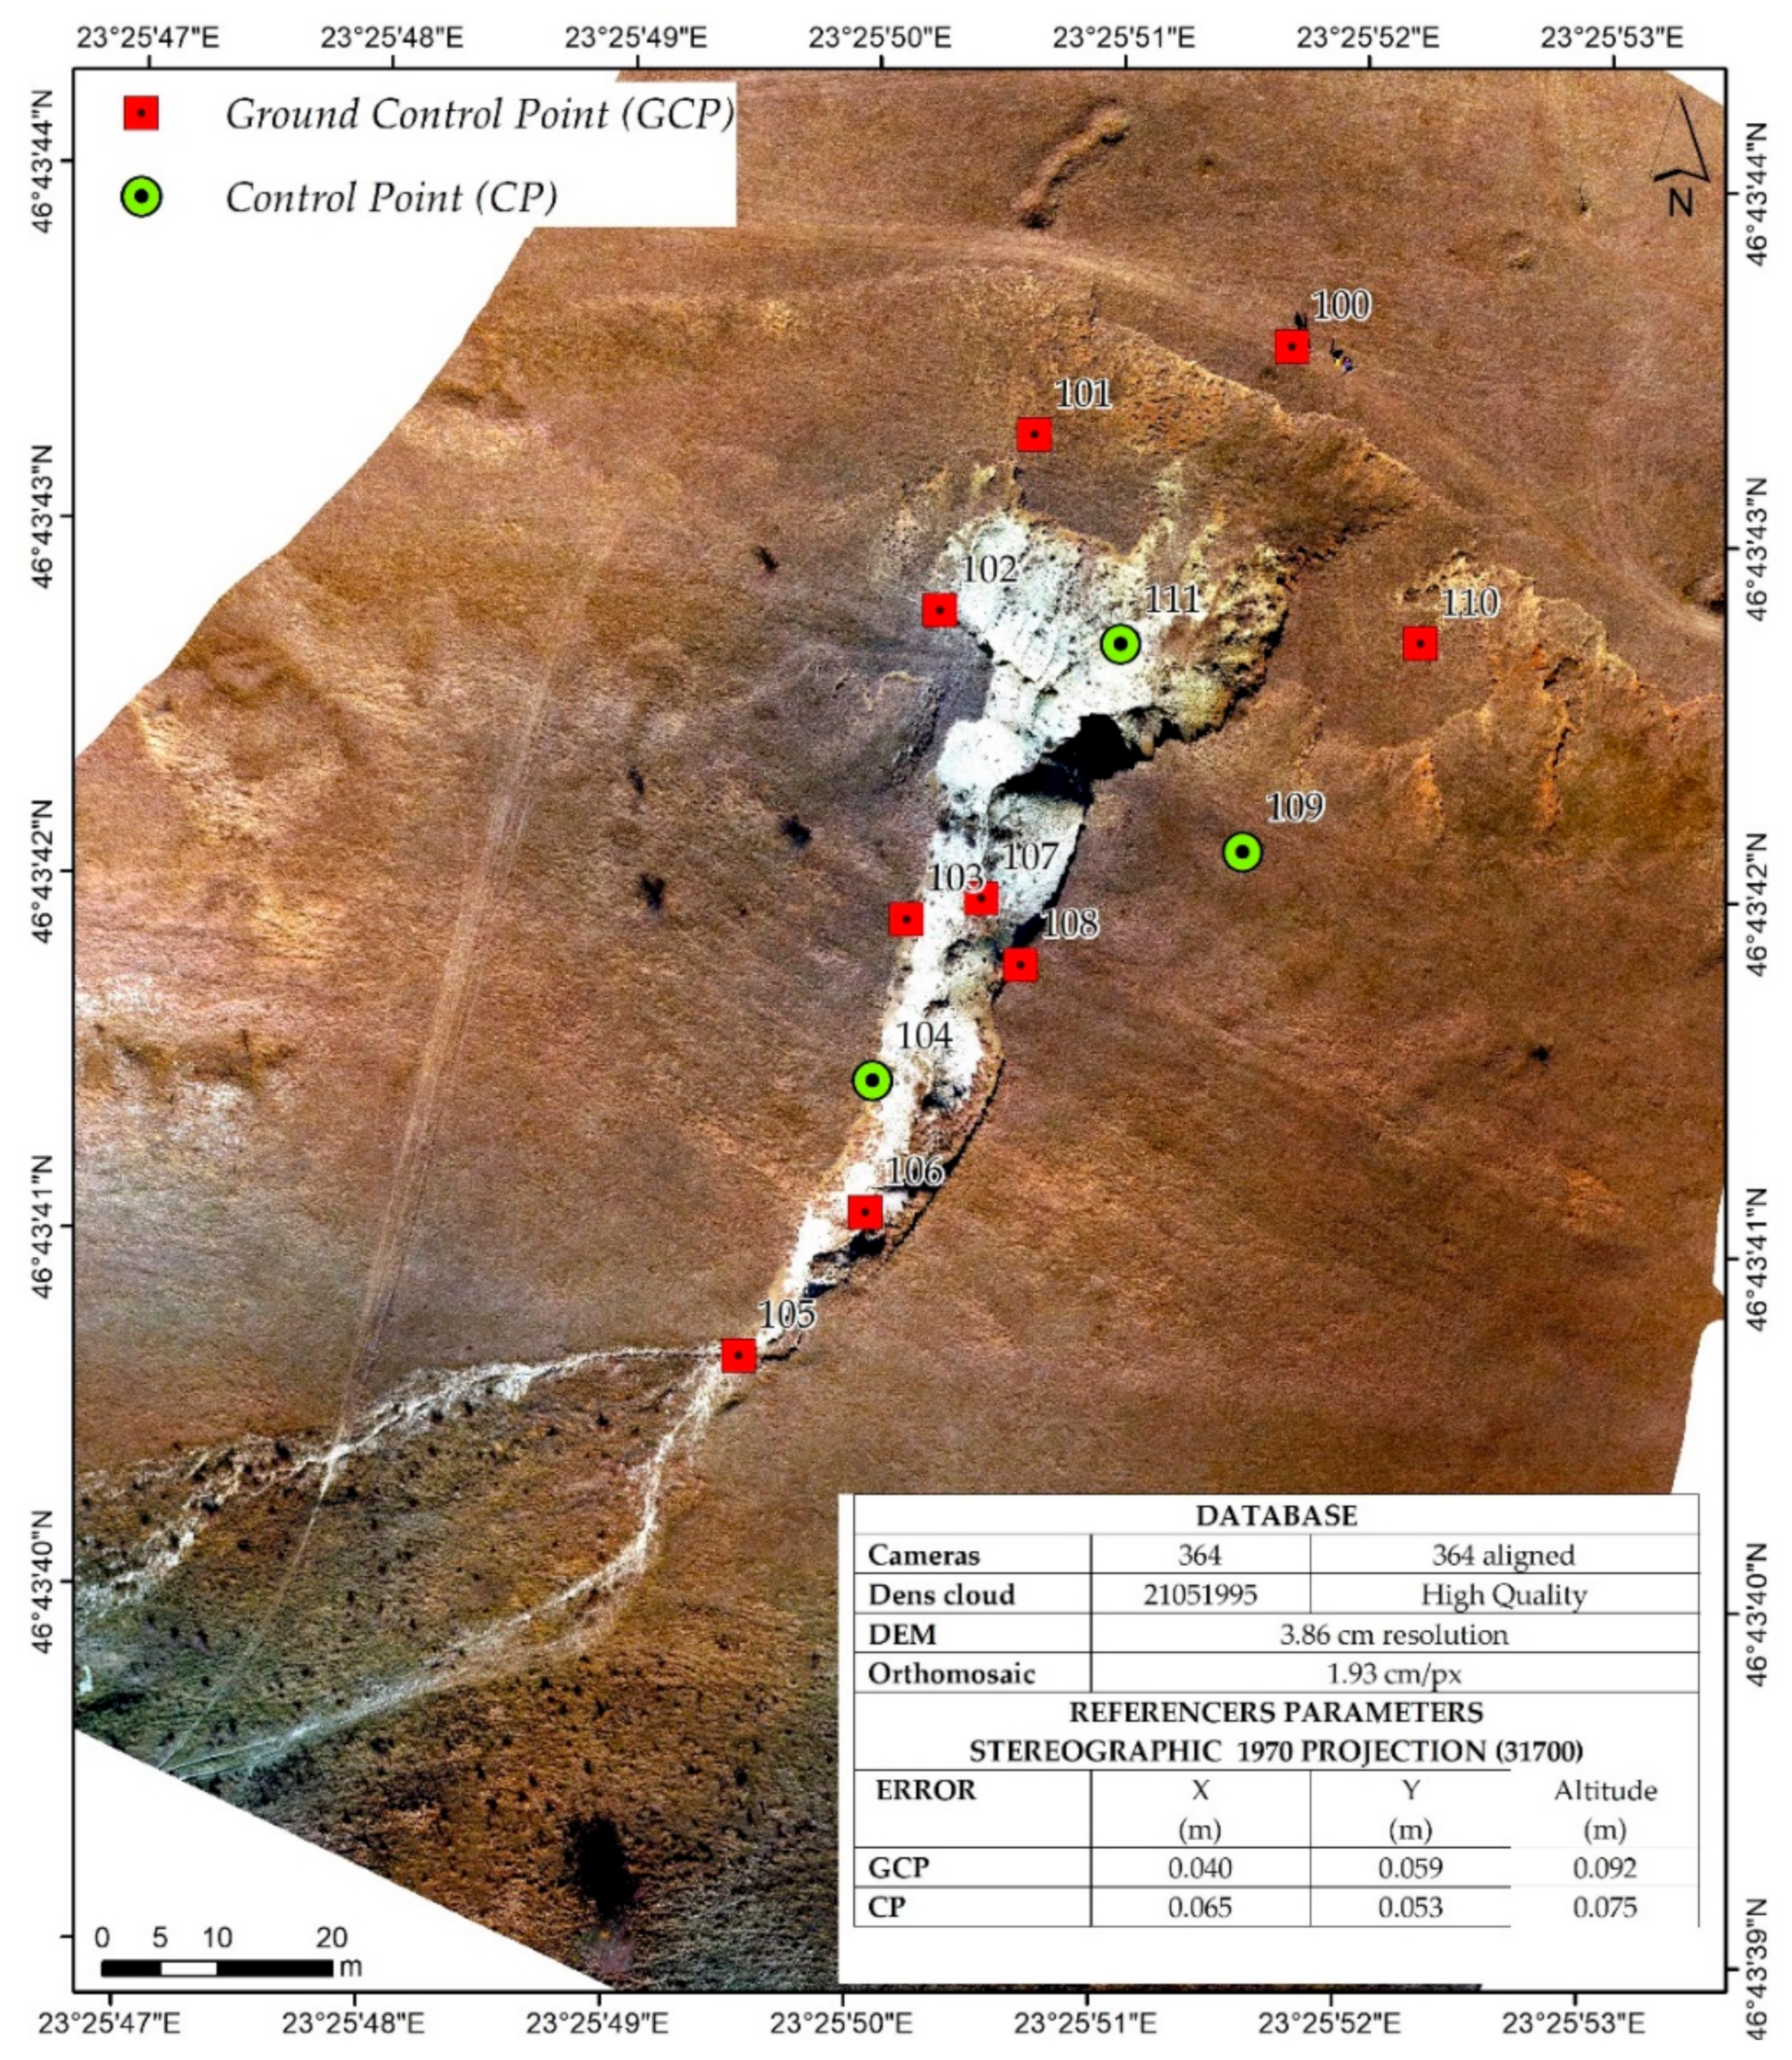
Figure 3A). To increase the accuracy of the digital elevation model, a number of nine GCPs and three control points were placed and chosen to identify georeferencing errors, points measured in RTK mode (in the metric coordinate system Stereographic 1970; Romania national projection system) with real-time corrections receiving from the fixed station Cluj-Napoca. The GNSS system used was the GeoMax Zenith35 Pro (GeoMax, Widnau, Switzerland), and the targets were marked on the ground with green fluorescent spray in order to be more easily identified in the processing/reference stage (
Figure 3B). In recent decades, GNSS systems became the perfect choice for topographical surveys and precise measurements of points on the surface of the earth used to geo-reference. GNSS systems are conditioned to optimal field conditions such as sufficient satellite availability, network RTK services and open field [
43].
The high precision of the required representation is obtained as a result of georeferencing the obtained images after performing the flights based on GCP. Therefore, we measured the following points in the field: 100, 101, 102, 103, 105, 106, 107, 108 and 110. The choice of ground control points in the territory was made in such a manner as to be evenly distributed in the territory and to cover the entire analysed area (
Figure 4). The control points 104, 109, 111 are necessary for the evaluation of the degree of accuracy and were chosen randomly both inside and outside the ravine to correctly highlight both planimetric X and Y errors, as well as altimetric errors Z (
Figure 4).
Following the processing of pre-calibrated images [
13] obtained as a result of performing the flight, based on AGISoft software v.1.7.0, and using GCPs as georeferencing points, the main input database within the digital model of spatial analysis and elevation was obtained, represented by a raster grid with a resolution of 3.86 cm, which has very few positioning errors (0.065 m/X axis, 0.053 m/Y axis and 0.075 m/altitude). The digital elevation model obtained at such a precision and with a very high resolution denotes high quality in terms of spatial–territorial location and high fidelity of the 3D representation, reflected in the high accuracy of the result. The recommended database is used in studies conducted on a large topographic scale and in hydro-ameliorative projects.
Another particularly important database in terms of assessing the current stage of erosion and modelling by simulation of the main hydro-amelioration interventions to reduce the negative effects is represented by the maximum flow through the respective ravine. This debit generates the maximum flow rate and the maximum erosion power. The maximum erosion power generated by the drainage flow has a direct influence on the depth erosion of the ravine banks, and the flow rate has an influence on the mode of transport and deposit of eroded material.
In order to establish the GIS model of spatial analysis in the present study, as well as in most spatially identified ravines with direct impact on the adjacent lands, there are no maximum precipitation intensity data available in order to calculate the maximum probable flow. Since the analysed ravine is not controlled from a hydrometric point of view, it was decided to introduce the maximum simulated flow in the section that is most vulnerable and exposed to erosion in the spatial analysis process. In order to identify the maximum simulated flow that would have erosive effects to the upper part of the banks (bankfull discharge), the calculation was based on Manning’s formula:
where
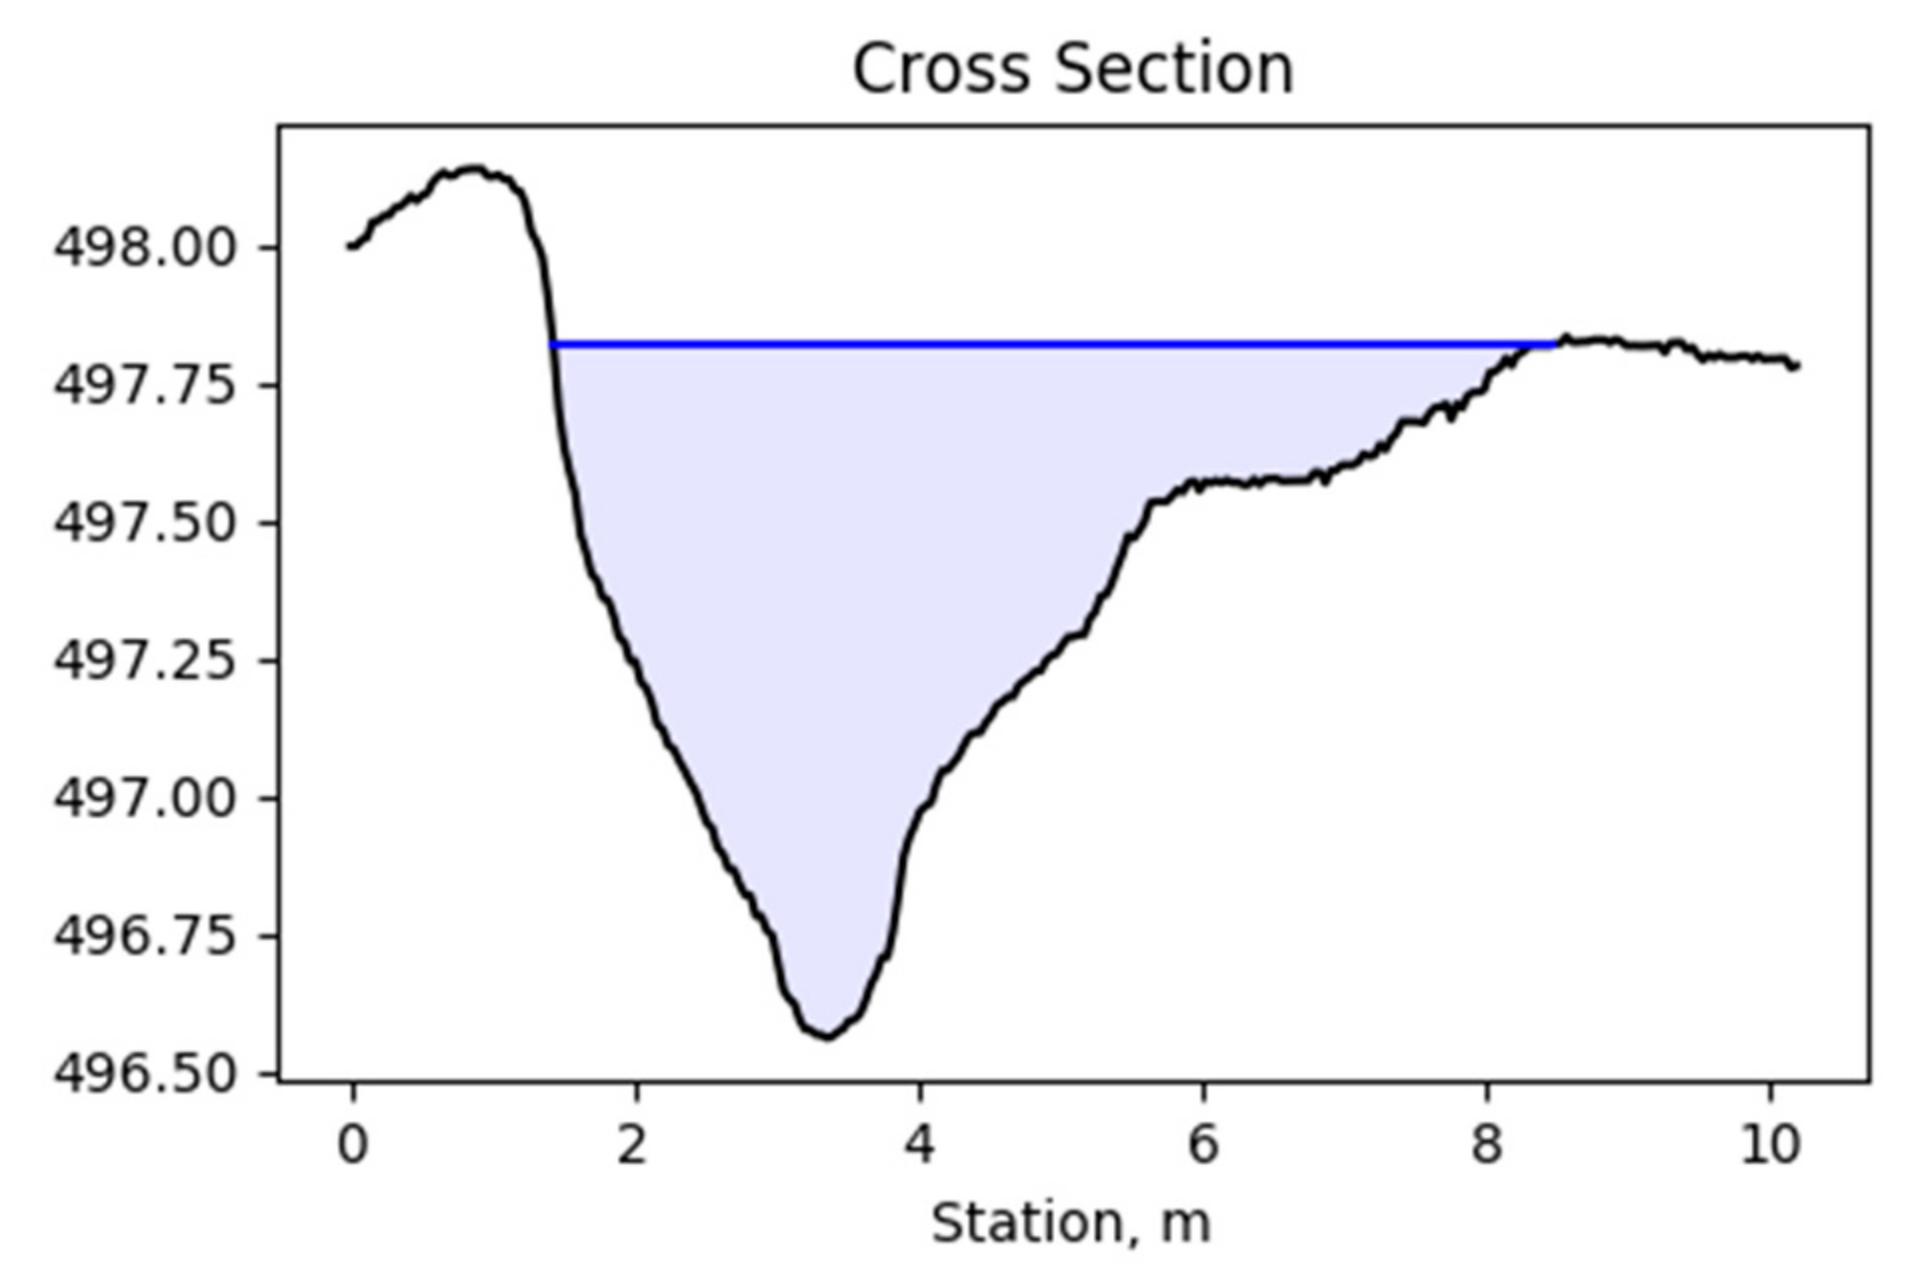
Thus, in the section chosen as the most vulnerable, the transversal profile was drawn based on the digital elevation model obtained with UAV techniques, extracting all the necessary parameters for the implementation of the formula and then obtaining the maximum flow in that calculation section (
Figure 5).
Based on the informational resources obtained after marking the transversal profile on the digital elevation model, as well as a result of the direct field measurements, the following parameters were obtained for calculating the maximum flow: bottom flow 1.5 m, right side slope 0.448, left side slope 0.172, flow depth 1.26 m, channel slope 0.001, channel rugosity (Manning’s roughness coefficient) 0.045. The integration of the parameters in the formula for calculating the maximum flow based on the Manning equation allowed the calculation of the maximum simulated flow with the value of 1.55 m3/s. This simulated flow will be used for the calculation and spatialization of the analysed parameters within the initial evaluation process of the ravine as well as within the three simulations performed in order to identify the best hydrotechnical works for arranging the analysed ravine.
The presented data were used to calculate the flow in the cross section, with the Manning coefficient and the value of the simulated flow further used as input databases in the hydraulic analysis based on HEC-RAS software v.5.0.7 presented in
Section 3.3.
3.2. Database Analysis
The initial exploratory analysis, necessary to identify the morphometric and topographic characteristics of the ravine as well as the maximum flow characteristics used in the spatial analysis and simulation process, is based on the database obtained (DEM) with UAV technique implementation [
44,
45] as well as on the maximum value of the flow at simulated solid banks as a result of the implementing the Manning formula in the calculation section. From the topographic point of view of the analysed ravine (
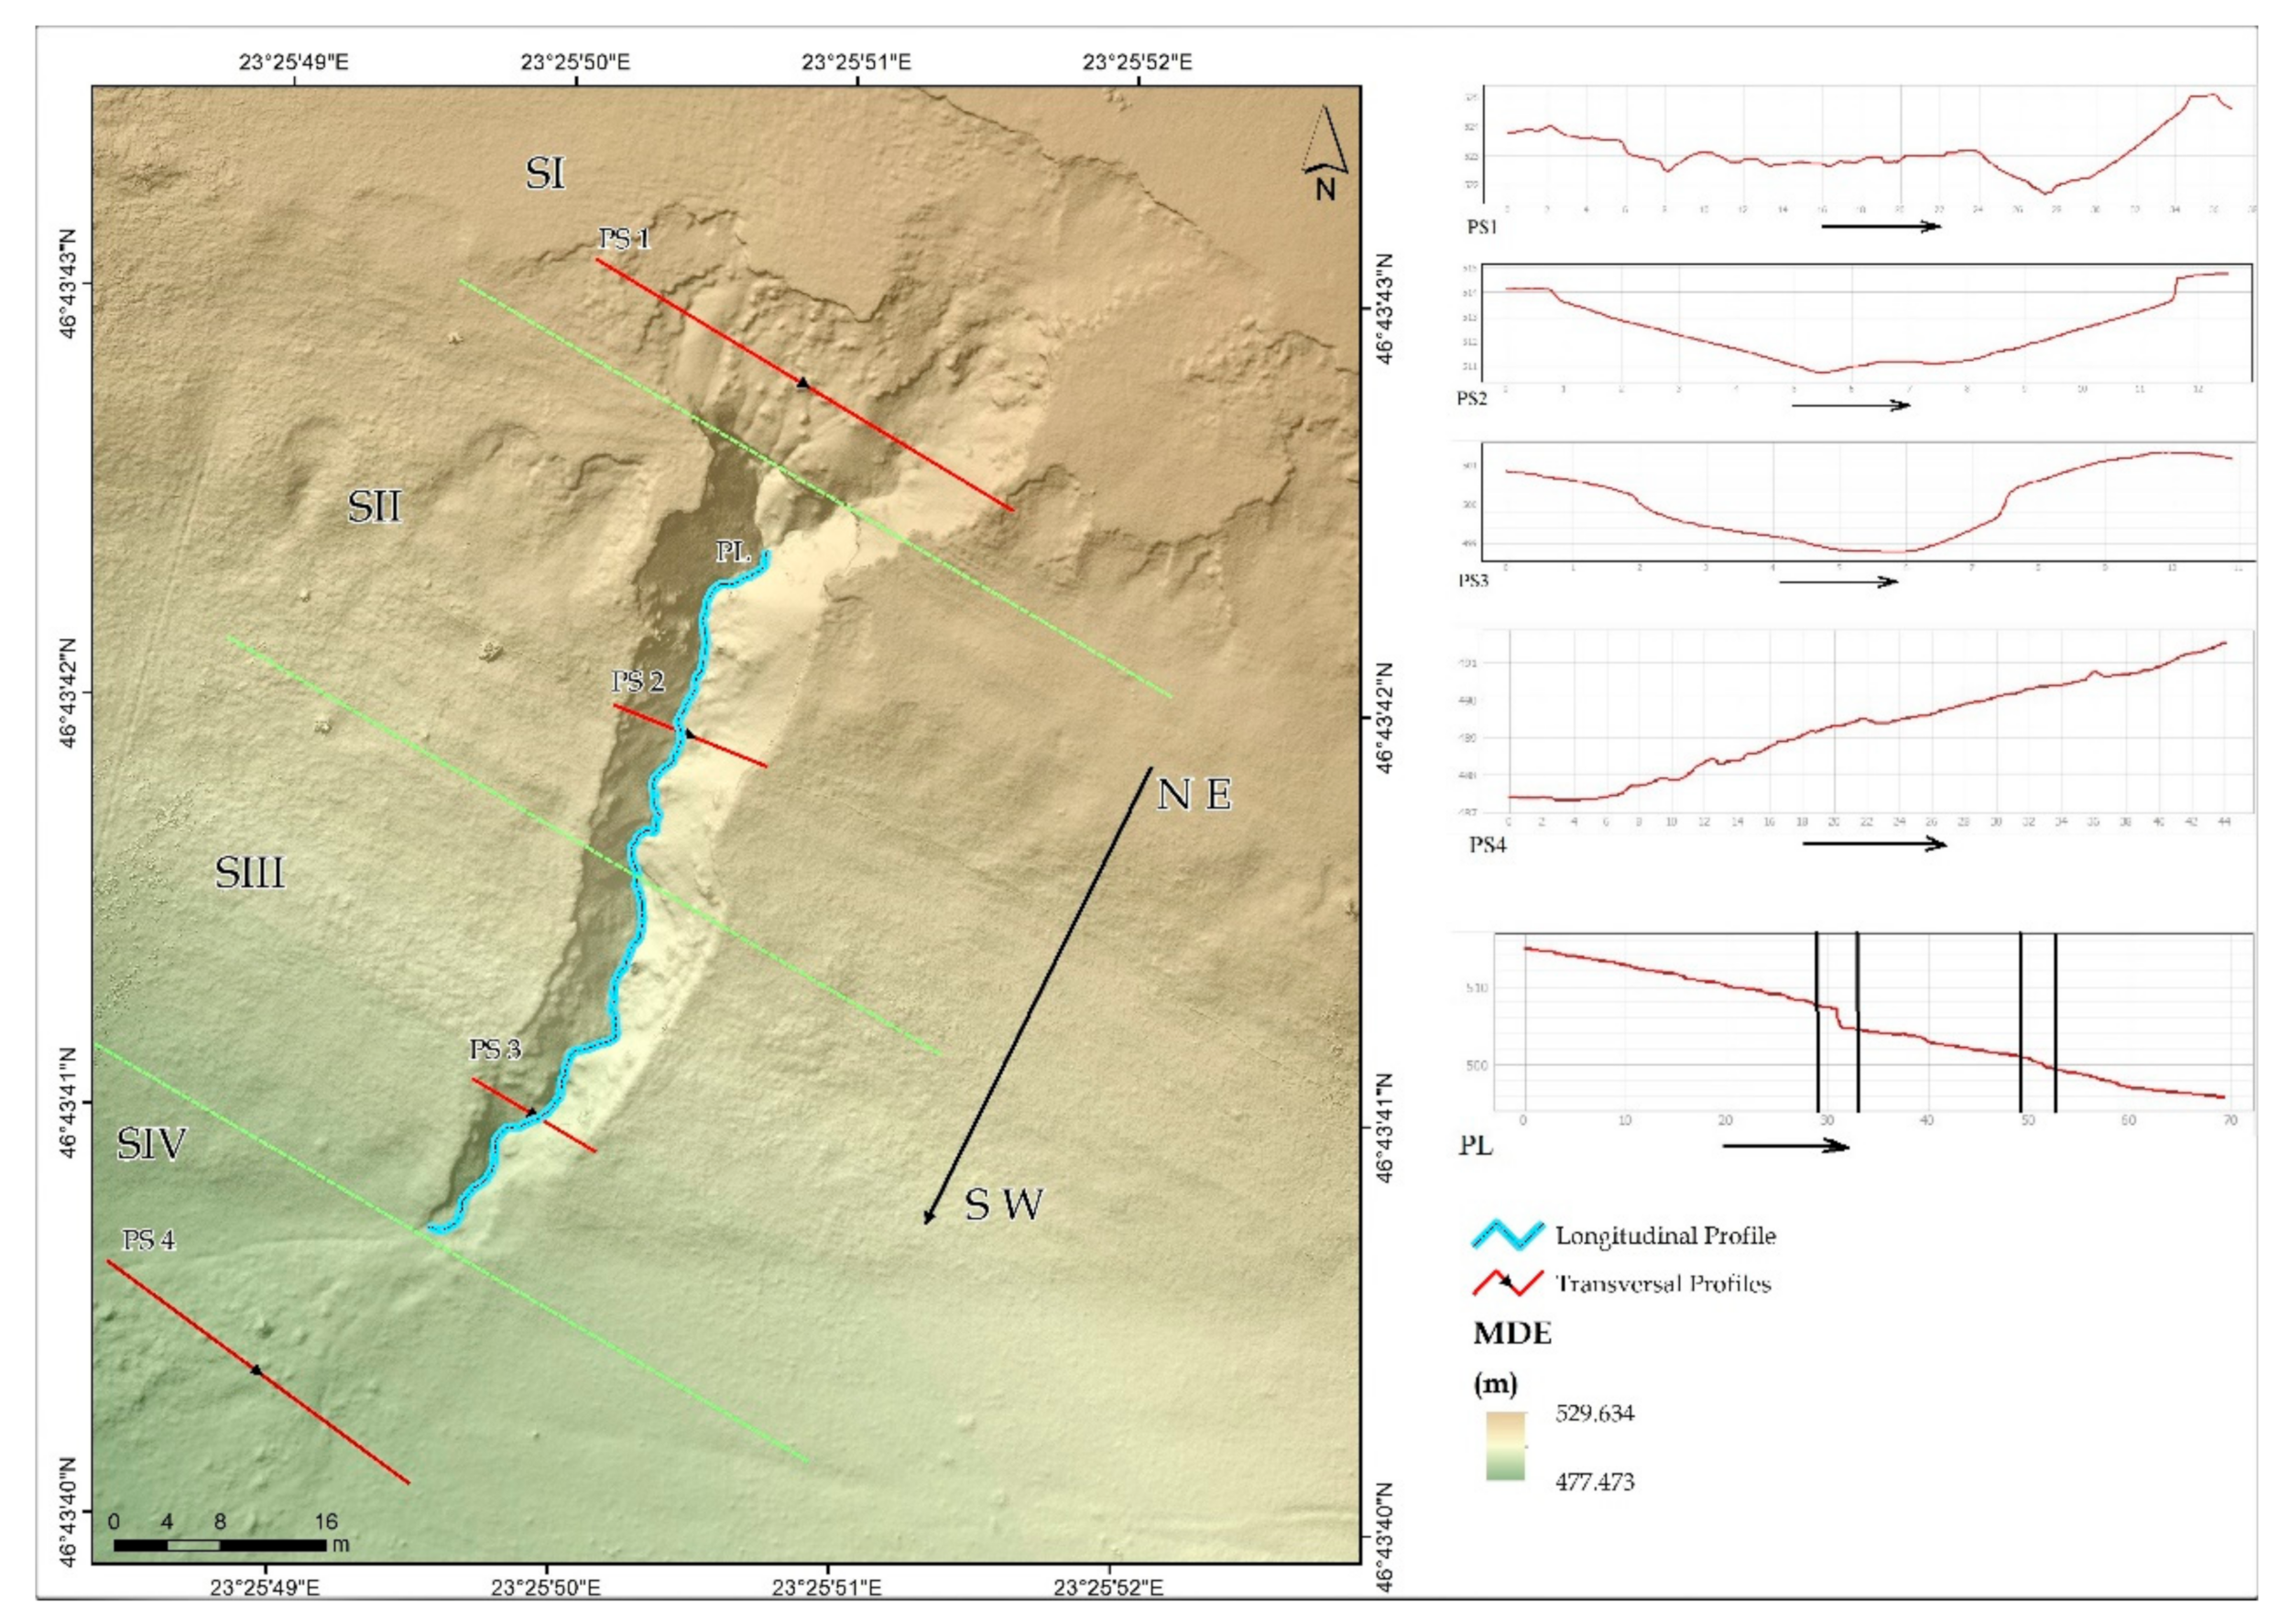
Figure 6), a series of morphometric characteristics stand out that define the shape and the current stage of its evolution.
Based on the morphology of the analysed ravine, four sections (SI, SII, SIII, SIV) are clearly identified with specific characteristics in terms of morphometric parameters as well as in terms of banks asymmetry. The first section corresponds to the upper part of the ravine and is highlighted in the form of an incipient receiving basin with large slopes with flows directed into the collecting channel, which is completely overlapping with the analysed ravine, highlighting its development to a higher level in terms of morphology of the torrent in formation. Regarding the SII section, the high slope of the collector channel is highlighted, and the asymmetry of the ravine banks, banks with steep slopes on the right and banks with less accentuated slopes on the left, is also highlighted on the transverse profile PS2 (
Figure 6).
Sector SIII is characterized by the lower depth of the ravine compared with the depth of Sector II, with an accentuated asymmetry of the two banks: the right bank with a less accentuated slope and the left bank with an accentuated slope. This highlights the migration of erosion to the right on the general NE–SW direction of the ravine’s orientation (PS3,
Figure 6). Sector SIV is represented by the front of the ravine and is highlighted by the dejection cone resulting from deep and lateral erosion and the deposit of material in successive layers with NV–SE orientation in accordance with the general orientation of the land topography. Once analysed, this highlights the temporal stages of erosion (PS4
Figure 6).
The analysis of the longitudinal profile (PL
Figure 6) clearly highlights the two sections that overlap the torrential area analysed, therefore identifying two sections: the first identifying itself with the boundary of Sector II being very accentuated with a level difference of approximately 3.20 m, making the transition between the upstream section with a very accentuated deep erosion, and the second one represented by the downstream section with a less accentuated erosion and lower relief energy being a transit section towards the accumulation area.
A second threshold, one of smaller dimensions (approximately 0.80 m), is outlined to develop within the SIII sector, highlighting the higher torrentiality in the upper part of this sector. This part is between the threshold of the sector and approximately its middle part. These two sectors highlight very clearly the torrential characteristics of the ravine as well as its future development in terms of deep erosion through the appearance of new thresholds on the subsectors where erosion is more pronounced.
The process analysed in the present study falls into the category of medium-sized ravines heading towards another stage of their evolution, that of incipient torrent, which has much more destructive territorial effects due to the development of dejection cones over large areas and the development of the receiving basin, which has both lateral and regressive erosive effects. In this case, the erosion can lead to the change in water balance between the two adjacent hydrographic basins (the hydrographic basin of the Săvădisla valley and the hydrographic basin of the Someș Mic).
The defining database in terms of lateral and deep erosion is represented by the volume of water drained and the time in which it exerts its effects within the ravine. The simulated flow according to the calculations based on the Manning equation is 1.55 m3/s, a flow that produces effects when the maximum is reached. Modelling and simulating the erosional effects require the introduction of the constant “time of action” of the flow from its formation to its dispersion, represented in the form of the hydrograph flow with the maximum peak equal to the maximum flow analysed.
In order to run the spatial and simulation analysis model based on the calculated maximum flow, a one-hour runoff hydrograph and a 1-min time sequence were simulated with asymmetric branches in terms of increase and decrease time (
Figure 7). The simulation of the asymmetrical branches’ hydrograph was chosen, to model an accentuated erosion on the growth branch and also an accentuated erosion corelated with a transport of the eroded material raised and deposited in the front part of the ravine where the incipient dejection cone is formed.
The main input databases of the spatial analysis model have been acquired and designed in such a manner that the results of the spatial analysis model will provide the best useful quantitative information in the decision-making process regarding not just the proposal of hydro-amelioration solutions for erosion, but also for the results regarding a higher spatial accuracy. This accuracy can be validated by events of the same intensity.
3.3. Spatial Analysis
Spatial analysis is based on the integration of spatial databases, representing the digital and alphanumeric elevation model, represented by the values that outline the unitary drainage hydrograph through HEC-RAS software v. 5.0.7, this being one of the best hydraulic analysis software. The software allows the realization of 2D computation simulation models based on the 2D fully dynamic equations and the 2D diffusion wave equations [
46,
47].
The hydraulic modelling based on the 2D component of the HEC-RAS software v. 5.0.7 is based on spatial and alphanumeric databases that highlight the morphometric and hydraulic characteristics of the analysed spatial system. The database used can be divided into two general categories: the spatial database and the numerical database. The spatial database is represented by the DEM with a resolution of 3.86 cm, a value used to create simulation cells (mesh cells) in obtaining 2D flow area. Additionally, in the category of spatial databases is the upstream runoff profile, which represents the input database in terms of runoff represented by the simulated hydrograph. The numerical database is represented primarily by the Manning’s coefficient, which is considered unitary over the entire runoff surface, in this case, the coefficient of 0.045. One of the important parameters in terms of the drainage modelling is the slope of the drain, which is introduced in the simulation model as a numerical database with a value of 0.32 and is obtained based on the operation of the digital elevation model. The flow hydrograph has a total duration of 60 min with an observed flow period of 1 min being identical to the shape with the flood simulated during the analysis stage of the model input databases.
The spatial analysis models used in the simulations were performed in four simulations, in order to obtain spatial databases that highlight stream power and shear stress, which analysed correlatively highlight the specifics of each simulations based on the 2D component of the HEC-RAS program. The related spatial databases resulting from running the simulation models of velocity, arrival time and maximum depth are used for the general state analysis of the ravine as a result of each simulation.
3.3.1. Simulation 1
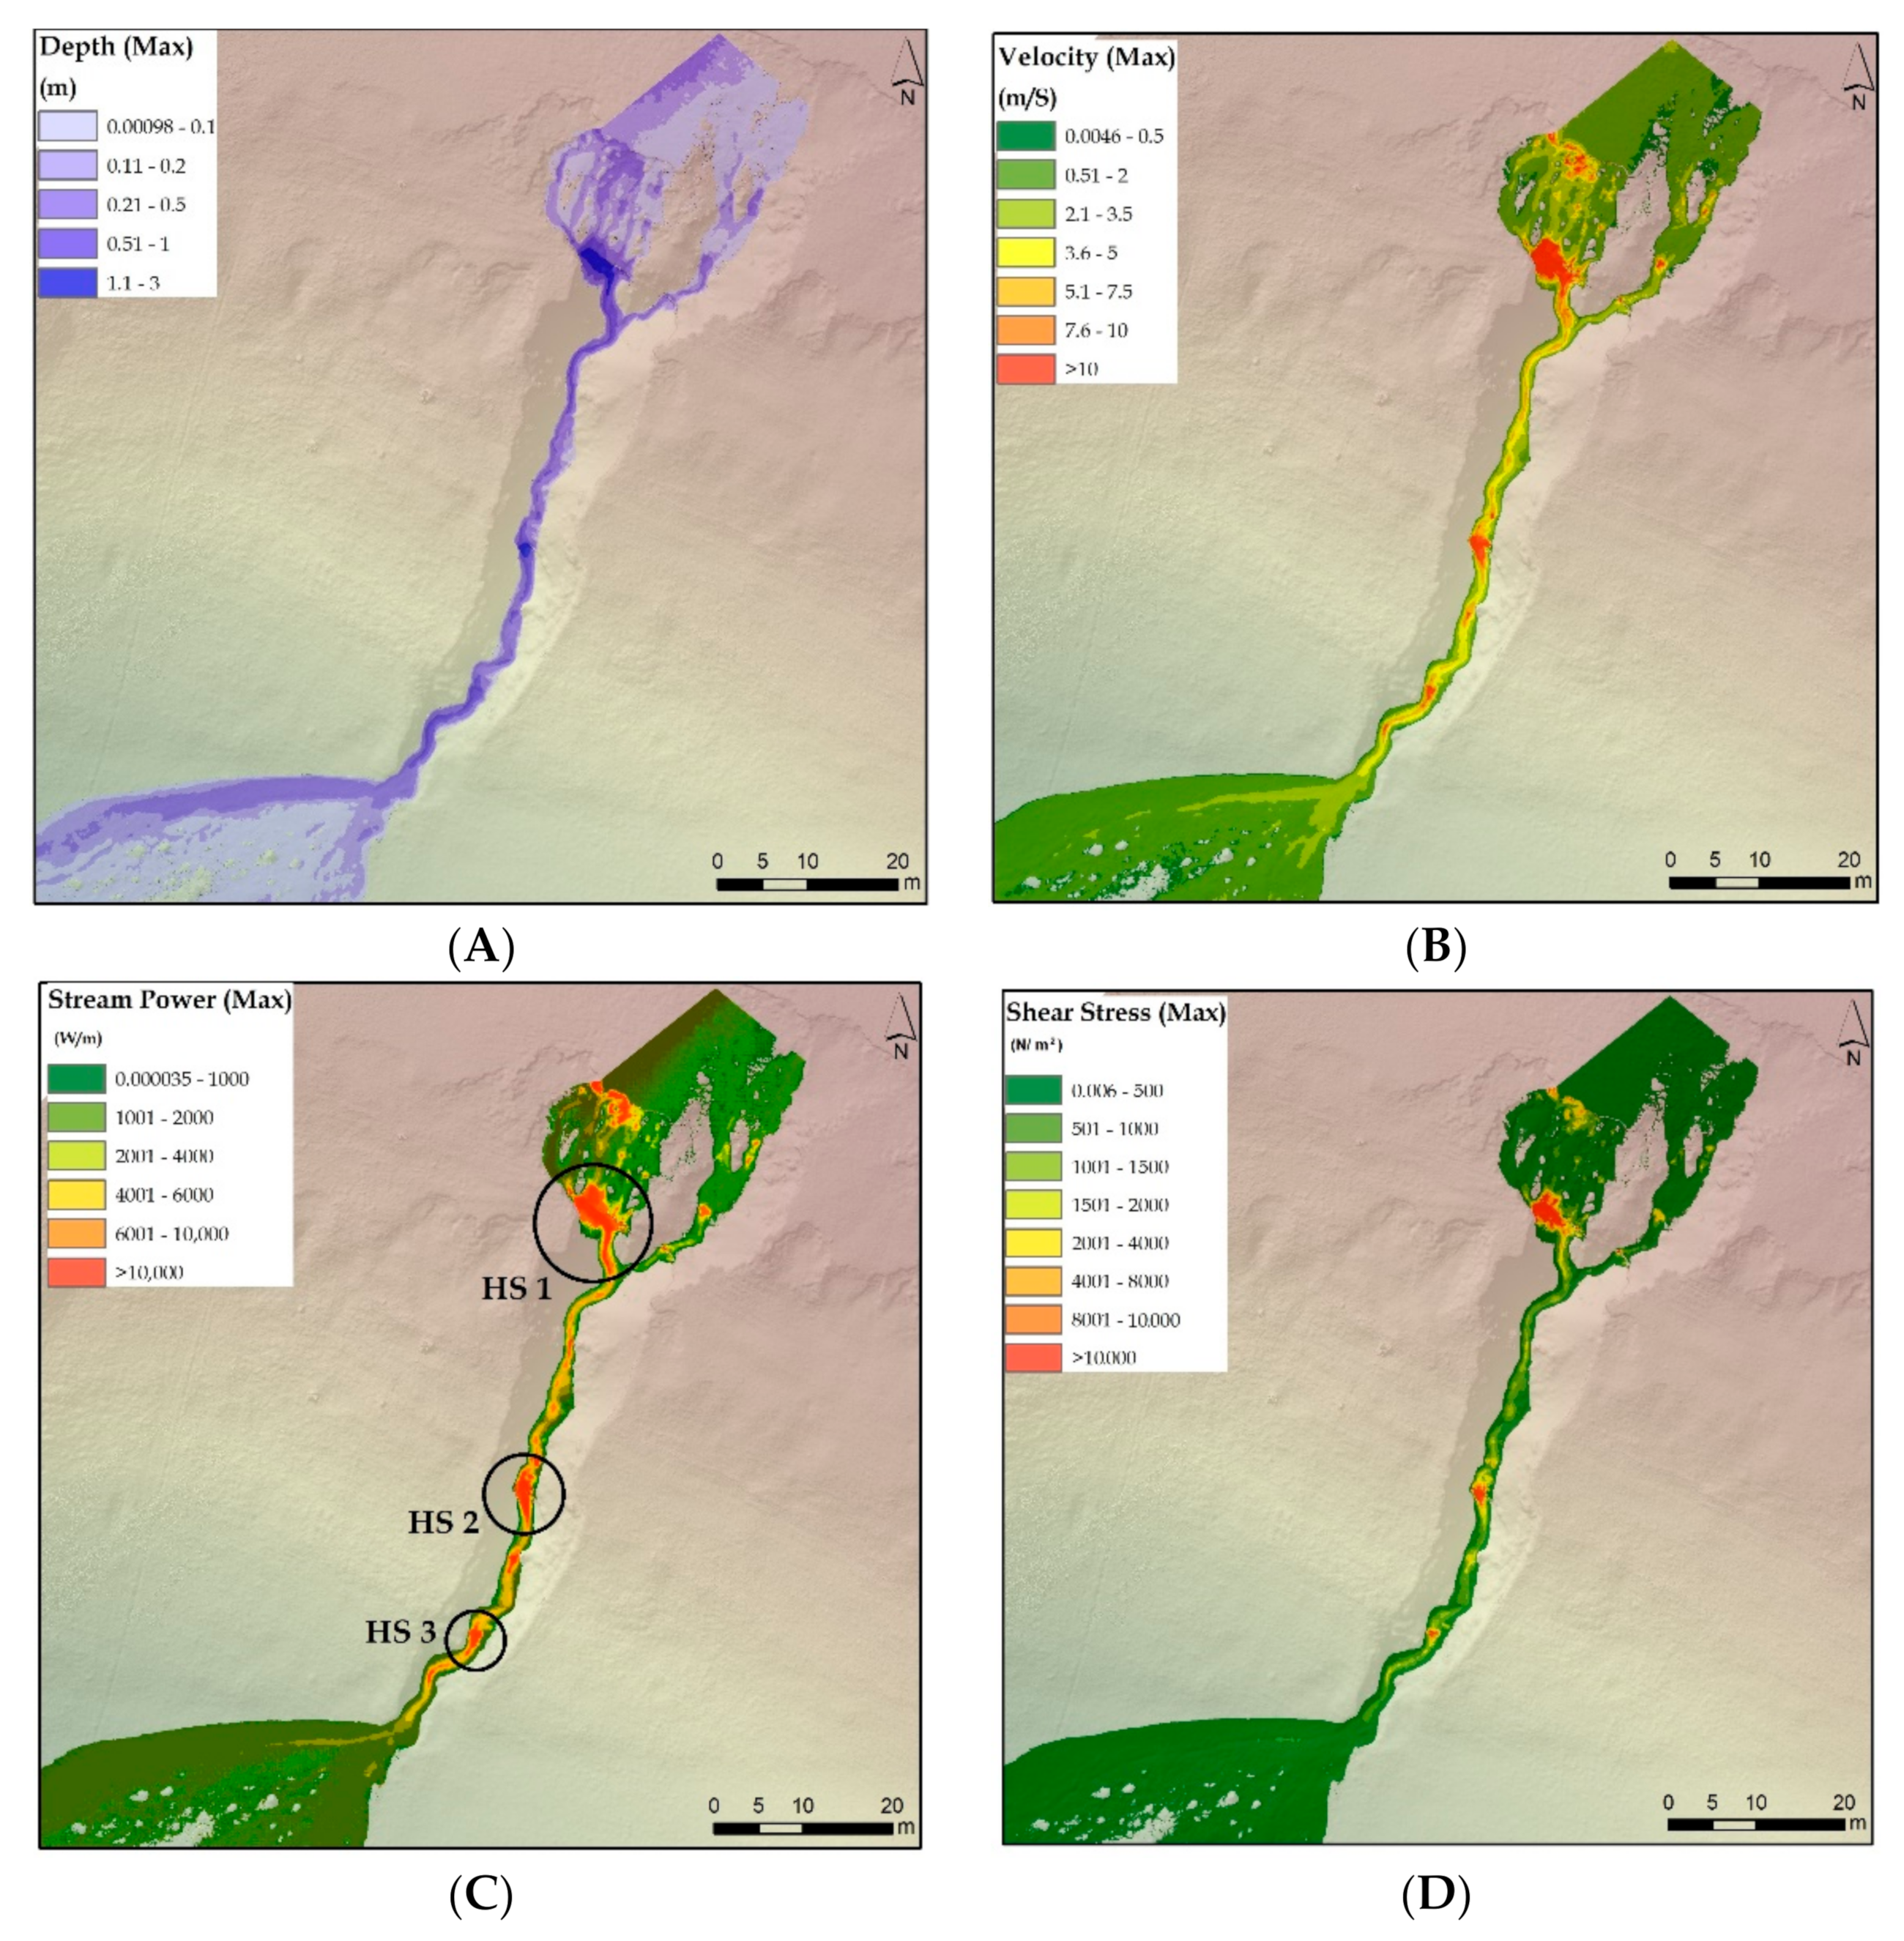
The first simulation model was performed with the main purpose of assessing the general state of response of the ravine to the extreme event. The maximum flow simulation was performed in order to identify the main hotspots regarding the erosion power and in order to make decisions regarding the spatial identification of the locations for the implementation of hydro-amelioration works. Therefore, based on the spatial geometry databases and the unitary flow hydrograph implemented in the HEC-RAS program and through the unsteady flow data module, a simulation model was established, which generates spatial databases (flow velocity, stream power, shear stress), based on which decisions can be made to identify hydro-ameliorative sites (
Figure 8A–D).
The overall analysis of the three simulated parameters highlights the impact of the average flow on the analysed ravine. Therefore, we can observe the erosion of the drainage channel along its entire length (
Figure 8C), as well as the high flow rate of the water in the main channel (
Figure 8B). Regarding the shear stress (
Figure 8D), it can be correlated with the maximum water depth at maximum flow (
Figure 8A), obtaining high values of this indicator where large water depths are spatially identified.
The general analysis of the ravine highlights three hotspots that concern the subsequent evolution of the analysed torrential process. The first hotspot is identified in Sector II and manifests itself over a larger area than in the depth of the erosion. The second hotspot is identified between Sector II and Sector III and is spatially identified with the first threshold, with highlights both in terms of deep erosion and in terms of banks lateral erosion. The third hotspot is spatially identified in Sector III, which is the lower sector of the analysed ravine and is also spatially identified with the second erosion threshold having a stronger effect on the deep erosion than on banks erosion.
Regarding the general analysis of the ravine, here, the influence of the identified hotspots on the entire torrential area but also on the upstream and downstream sectors is highlighted. Thus, the upstream part of the ravine is characterized by a high erosion power and a high flow rate of water, both controlled by the first hotspot, which is (from the point of view of drainage) the transition between the ravine itself and the torrent’s receiving basin. The surface is characterized by high slopes and incipient erosion processes (streams, gullies). The erosion power intensifies in the immediate vicinity of hotspot II so that it can be observed in the downstream, both a high erosion power and a high shear stress. This is mainly due to the water fall from approx. 3.2 m, correlated with a steep slope of the sector between hotspot 1 and 2, which also contributes to high runoff speeds in this area. Hotspot 3 is primarily influenced by the high slope of the upstream channel correlated with a small slope of the downstream sector. This favours the incipient spatial development through deep erosion of the threshold that overlaps spatially with this hotspot.
The general analysis of the ravine highlights its accentuated dynamics in need of specific hydro-ameliorative and related works for the stabilization of the erosion processes. In order to identify the optimal spatial locations for the hydro-amelioration works, the longitudinal profile of the ravines riverbed was analysed, considering the water erosion power at maximum flow (
Figure 9) correlated with the general condition of the analysed riverbed sectors.
The analysis of the three hotspots has as its main purpose to identify the location of the hydro-amelioration works based on the analysis of stream power and the general condition of the ravine. This highlights the fact that from the erosion power point of view, hotspot 2 raises the biggest problems, thus identifying the greatest erosion in depth (
Figure 9). As it emerged from the general analysis, hotspot 3 is a threshold highlighted by the longitudinal profile analysis of shear stress, thus identifying an erosion power higher than the general average (
Figure 9). Hotspot 1 was excluded from the longitudinal profile analysis of shear stress because its impact is more areal and has as its area of action the upper part without directly influencing the ravine itself.
As a result of the above, but also since the second hotspot extends its influence over a large area on the banks of the ravine both from the point of view of stream power and from the point of view of shear stress, and given that it has the highest values of deep erosion, it was chosen as a case study for the location of hydro-amelioration works in the simulations aimed at identifying the best works for the stabilization of the studied ravine. In this case, a standard hydro-amelioration work was chosen for such interventions, namely the construction of a dam to primarily reduce the flow rate in the respective section, as well as to reduce the erosive force in the intervention section and downstream of it. The simulations are based on three such amelioration works with different complexity depending on the shape and the elements that compose it, with the main goal of decision making the best proposed arrangement.
3.3.2. Simulation 2
In simulation 2, the behaviour of the ravine is highlighted in terms of erosional development both in depth and in the riverbed, as a result of the implementation of a transverse dam in the area of hotspot 2 (
Figure 10).
Depending on the topography of the terrain, the technical characteristics of the dam are the following: height 2.9 m, dam length 3.53 m. The simulation is based on the simplest structure of this type, namely dam without spillway. Given the large level difference within the spatially overlapping threshold with hotspot 2, it was decided to build a dam with a lower height. This dam does not reach the maximum extremity of the two banks of the ravine, not requiring interventions in terms of other technical construction elements (overflows, bottom drains, etc.).
3.3.3. Simulation 3
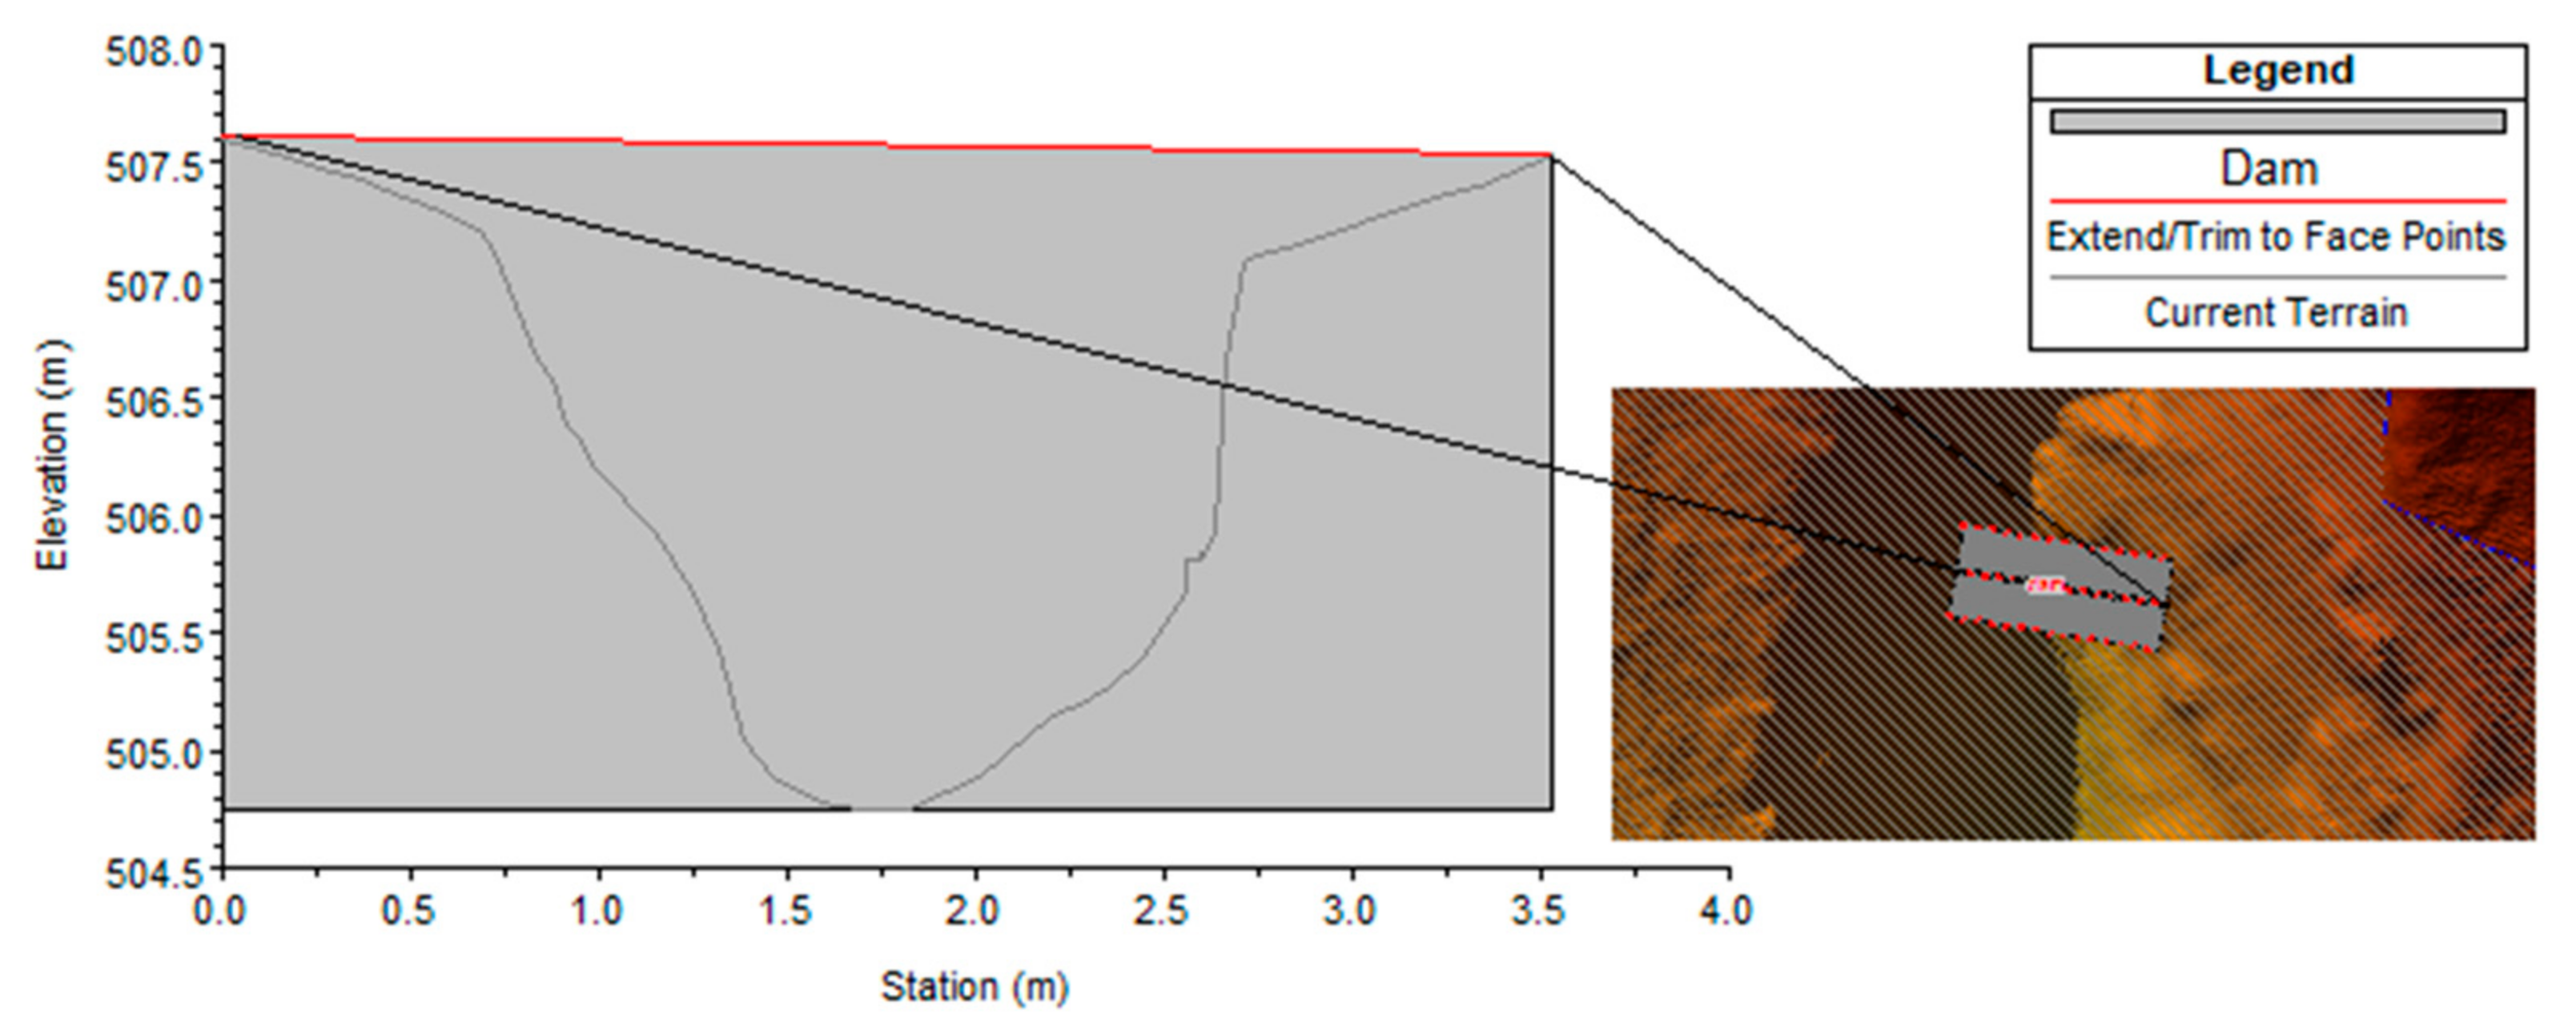
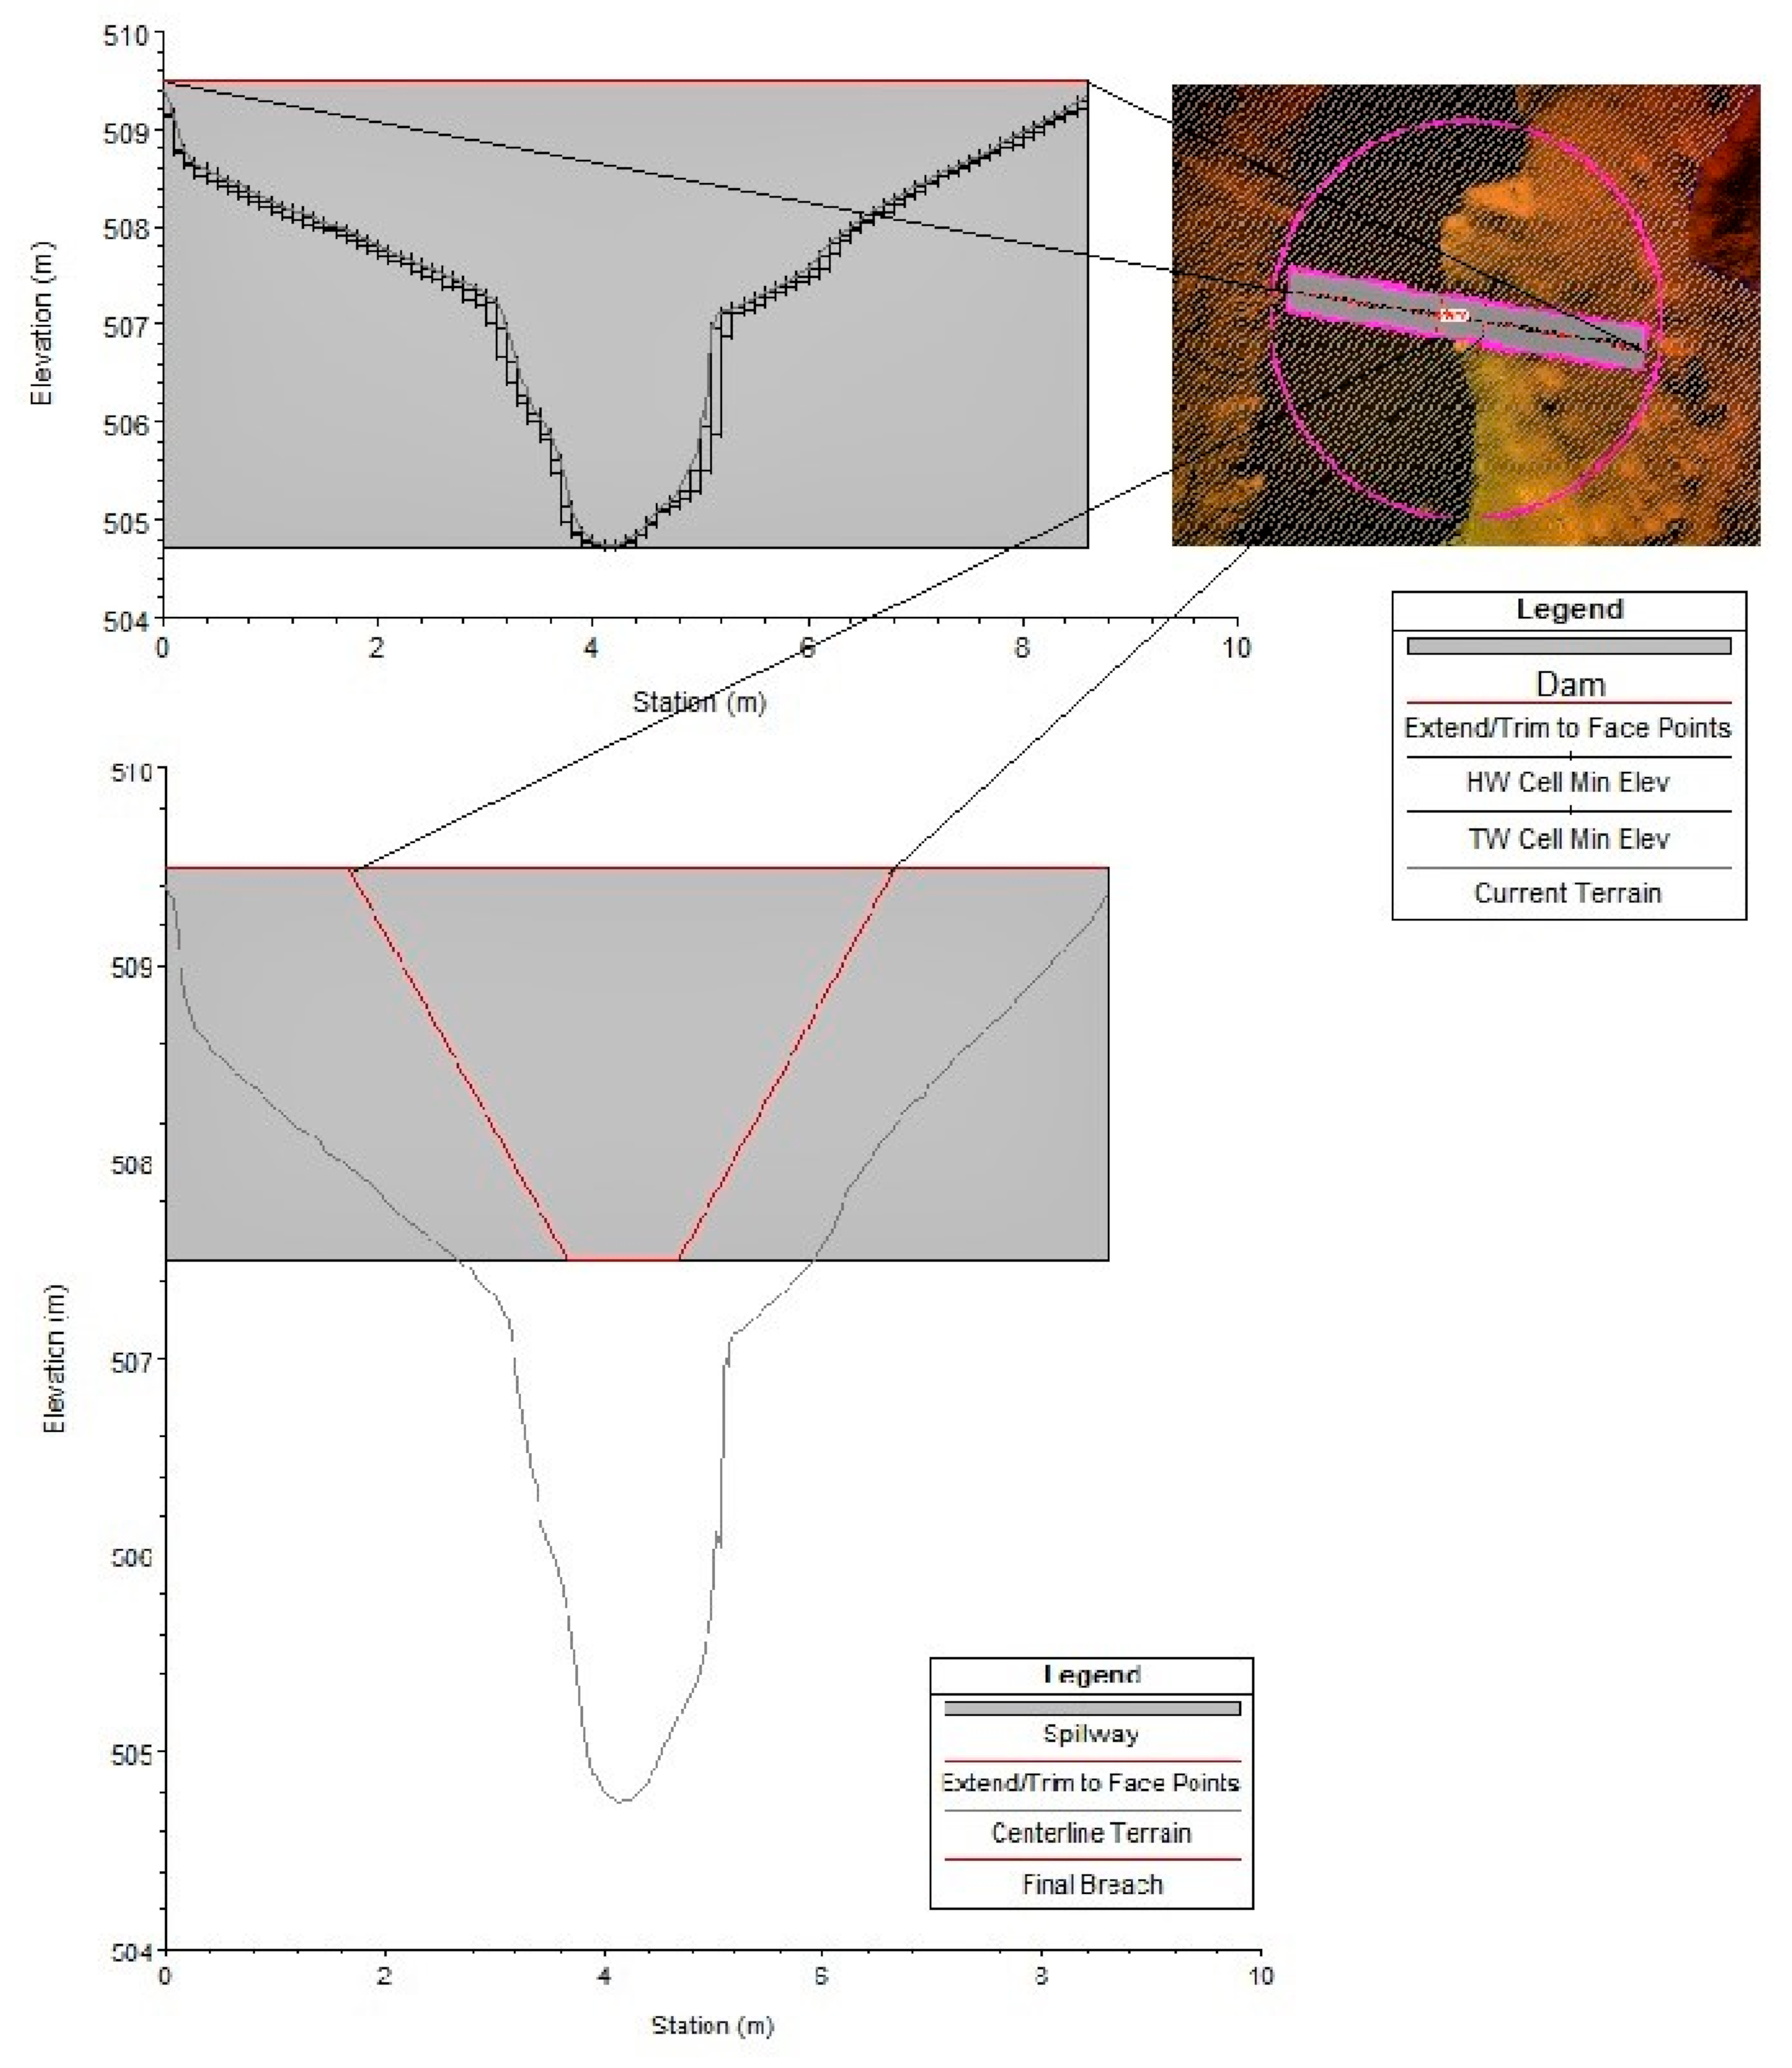
The spatial analysis model based on the third simulation has in its centre the inclusion of a spillway in the main body of the dam. In order to achieve the proposed objective, it is necessary for the dam to have a higher height, so it will extend even more on the two banks of the section in which it is located (
Figure 11).
The topography of the land and the fact that the hydro-amelioration arrangement increases in complexity by adding the surface spillway influence the technical characteristics of the dam included in the simulation model. Therefore, the maximum height of the dam is 4.47 m, starting from the altitude at the base of 504.71 m and reaching up to 509.47 m at the top. Its length is 8.60 m, dictated by the opening of the banks at its maximum height (
Figure 11).
As for the technical characteristics of the spillway, they are consistent with the height and maximum opening of the dam at the top. The centre of the opening coincides with the ravine bed and is located at 4.17 m compared to the maximum extremity of the right bank. The base of the spillway has a width of 1 m with a maximum opening of 4.98 m. The maximum opening results from the inclination of the two sides of the spillway, each having the value 1. This value is chosen in such a way that the sides of the spillway, both left and right, should be approximately parallel to the two banks of the ravine (
Figure 11).
3.3.4. Simulation 4
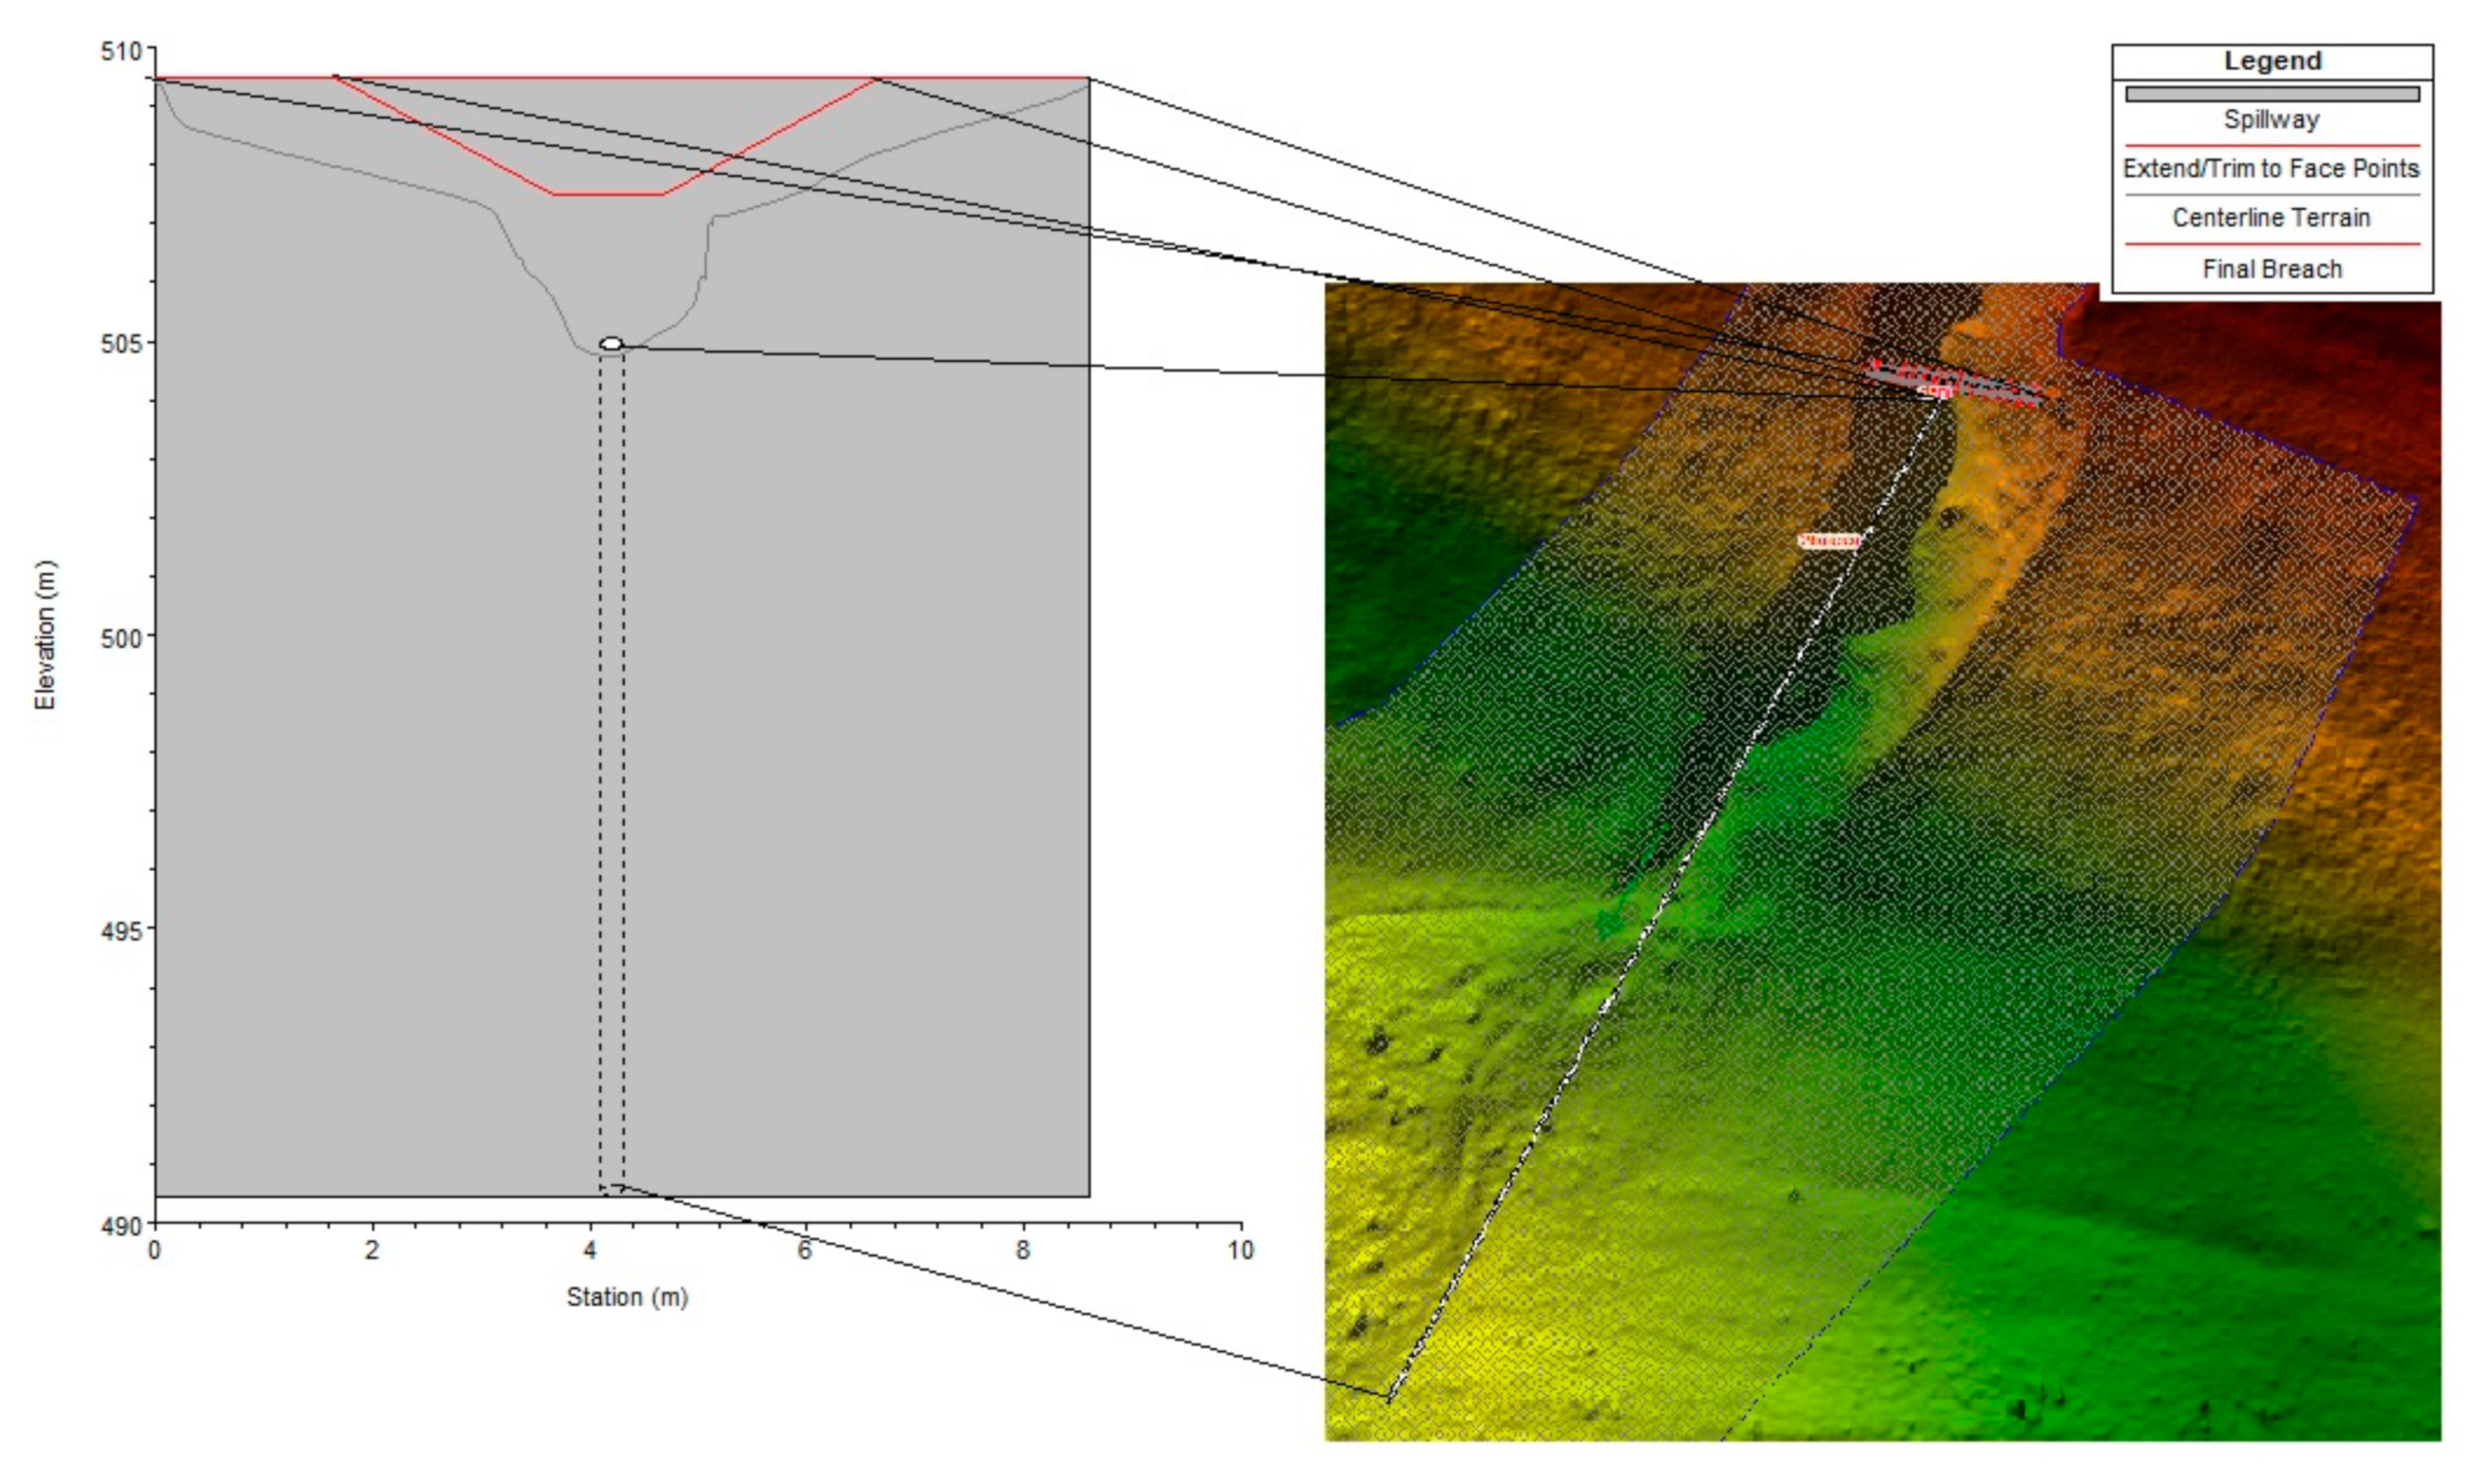
In the last spatial analysis model for simulating changes regarding the behaviour of the ravine, besides the technical structures of simulation 2, a water evacuation pipe was introduced at the base of the dam. Its main purpose is to reduce the force of pushing water on the dam (
Figure 12).
Under these conditions, the technical characteristics of the hydro-ameliorative structure will be compared to those mentioned in simulation 3 with the specific of the water drainage pipe. In the simulation, the pipe has the role of continuous drainage of water from the concentration of water in the riverbed at minimum flows to the total withdrawal of the water volume, which generates the runoff and the erosion. The proposed evacuation pipeline within the simulation model has a length of 60.21 m. It extends between the dam and the area of frontal deposits of alluvium (dejection cone), with a diameter of 20 cm. In terms of location, the pipe is located perpendicular to the drainage channel of the ravine at a height of 15 cm from it.
Each simulation generates digital spatial databases for the parameters considered in the evaluation and proposal of the most useful hydro-amelioration arrangement for the stabilization of the analysed ravine. The comparative and correlative analysis of the parameters (Stream Power Index and shear stress) concretely highlights the most useful measures to be adopted and implemented within the study area.
4. Results and Discussions
The exploratory analysis based on studied cases implemented in the simulations is necessary to perform in a comparative and correlative manner and discussed in order to make the best decisions and to adopt the best model implementable within the analysed ravine. The parameters that best highlight the probable changes in the general system of the ravine in terms of its evolution are represented by the Stream Power Index. This parameter highlights the erosion power and vulnerabilities of the ravine, and shear stress highlights the pressure exerted by the maximum volume of water on the banks, on the drainage channel as well as on the hydro-amelioration infrastructures included in all three simulation models presented.
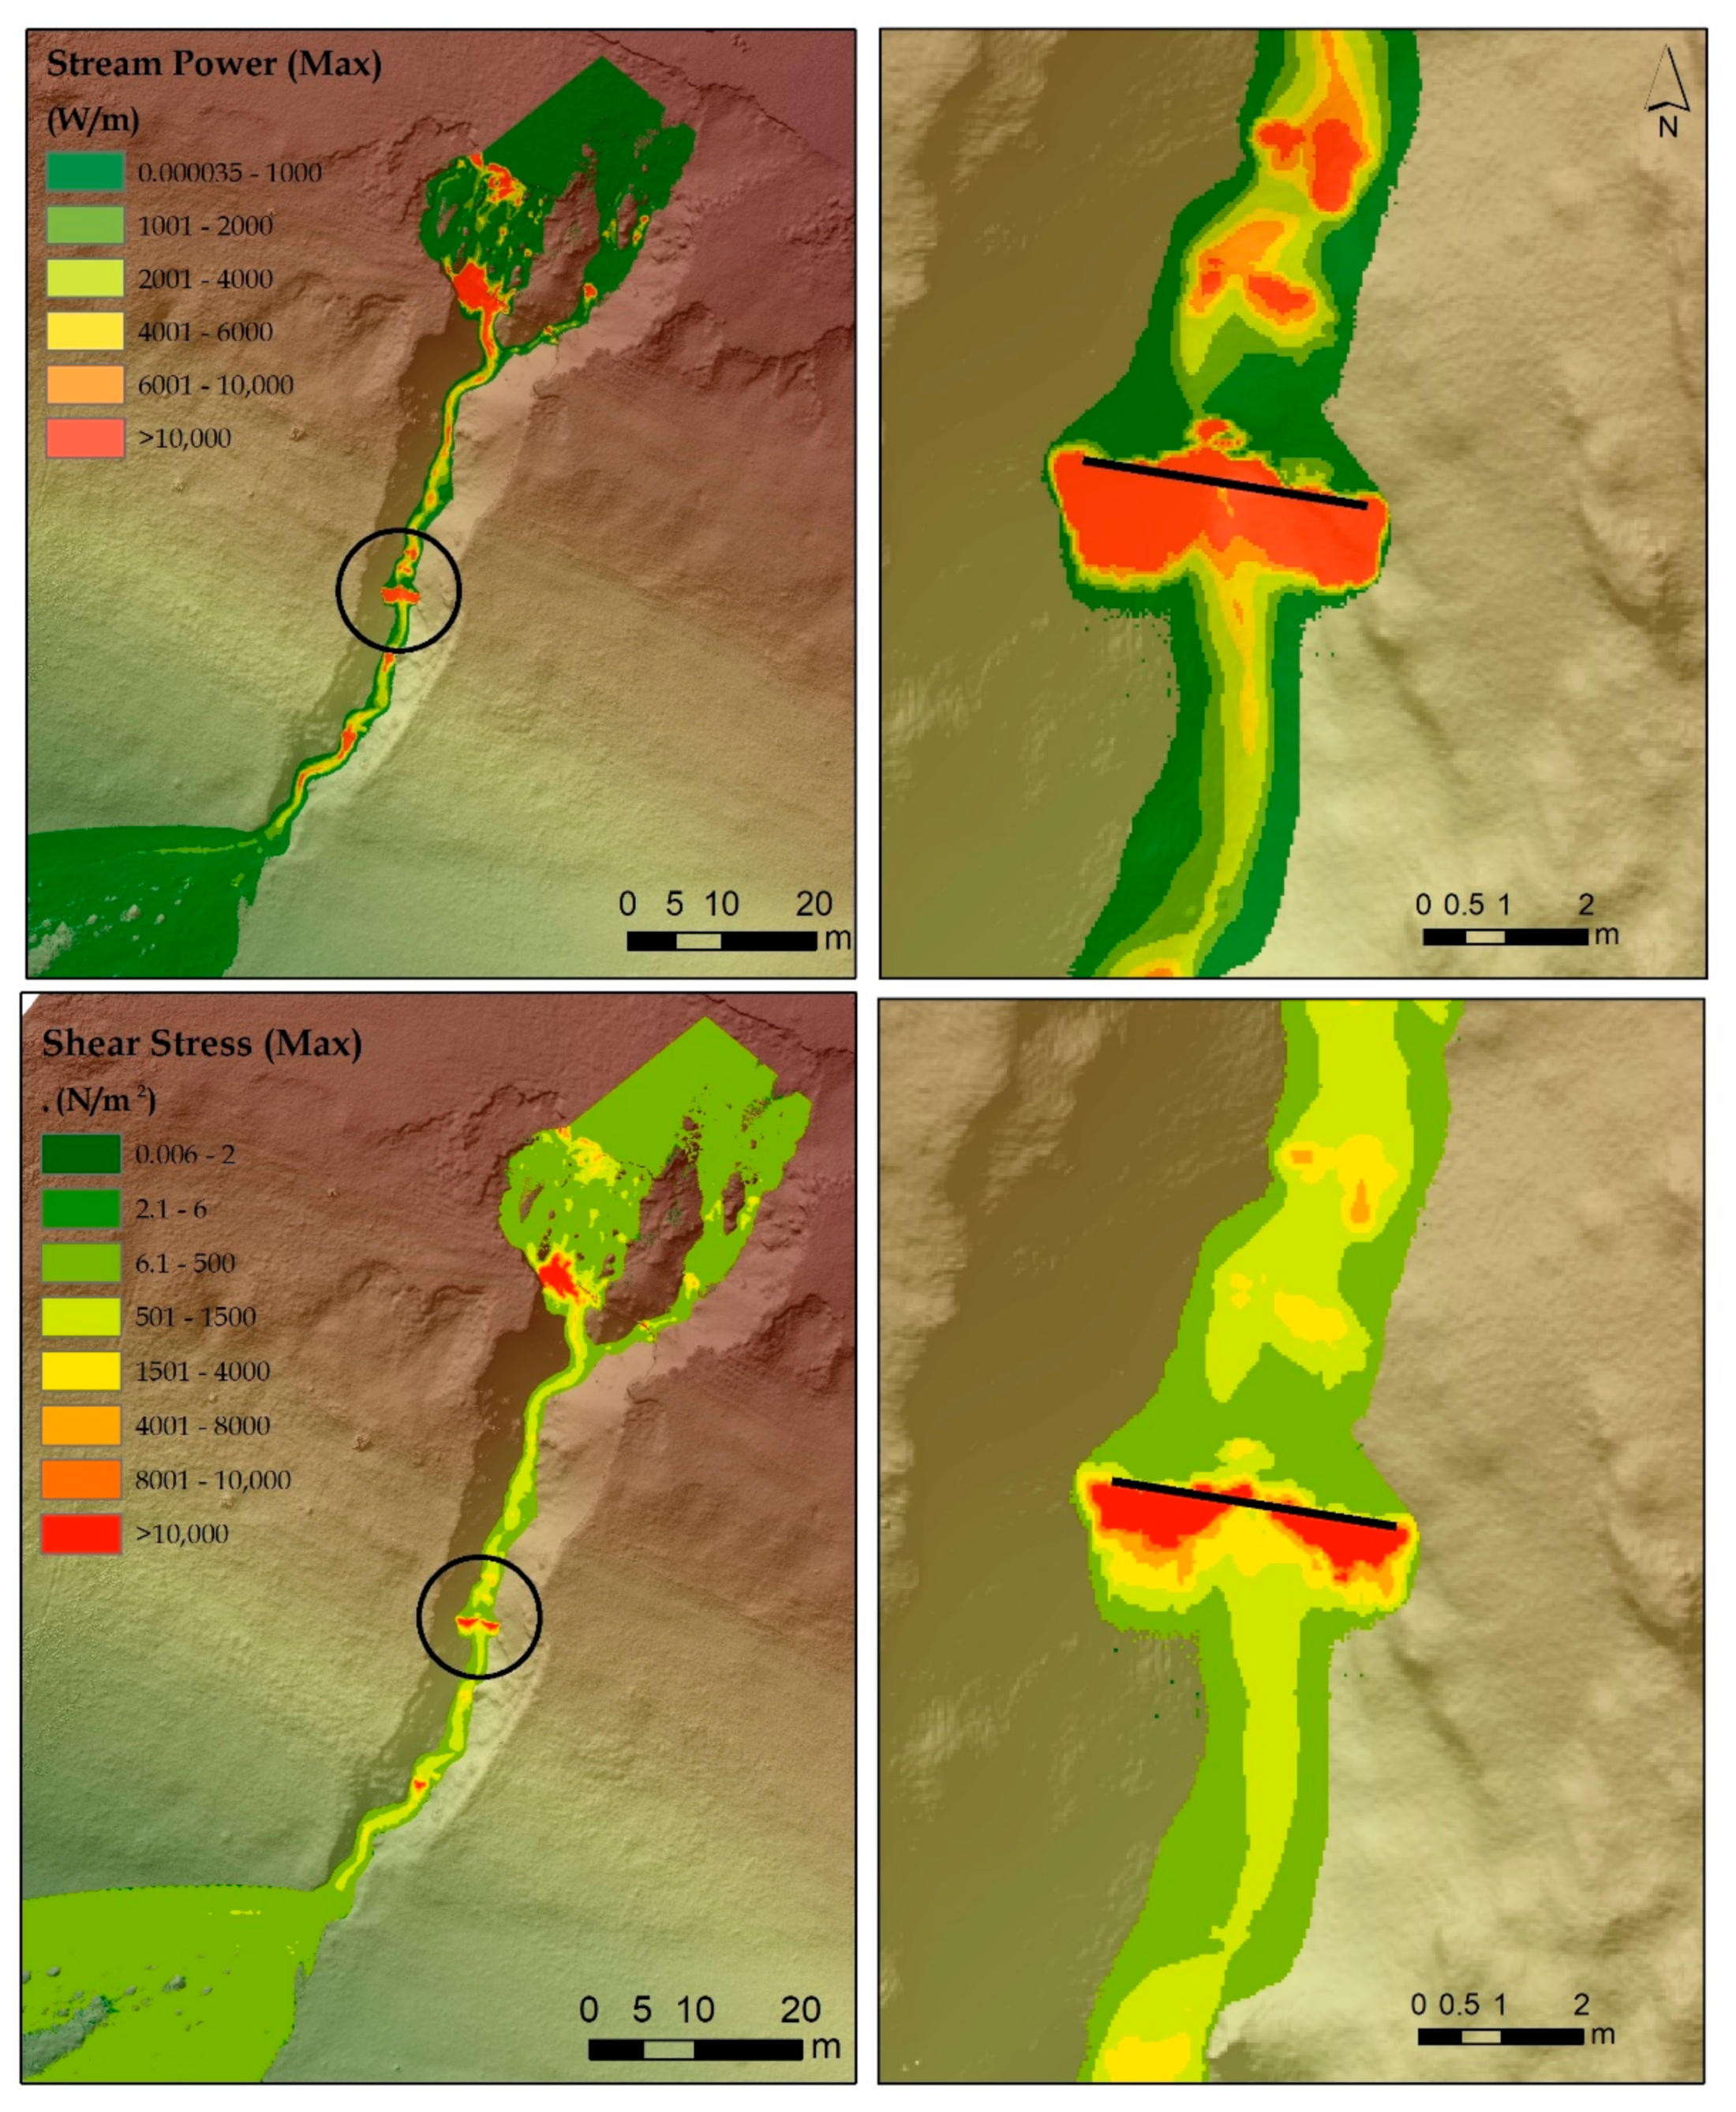
The simplest simulation model, namely simulation number 2, highlights the usefulness of such a hydro-amelioration dam-type structure, acting on the direction of ravine development by significantly reducing the erosion power both at the location of the hotspot where it was proposed as well as over the entire ravine, upstream and downstream of the infrastructure (
Figure 13).
It is observed that the erosion power changes substantially both from the point of view of the area and from the point of view of the action on the banks and the drainage channel. This change is mainly identified in Sector II, a sector controlled by the dam integrated in the spatial analysis model. Regarding Sectors III and IV, the erosion power diminishes its effects but acts on the same areas. It should be noted that the positive action of the dam implementation is evident both in terms of reducing erosion values in the immediate vicinity of the dam and in terms of the area extension of the maximum erosion power. A particularly important fact is that within the simulated maximum flow, the drained water level exceeds the height of the dam, making the erosion power act more on the banks where the dam is anchored but also in its downstream part. Due to the lower erosion power values in the immediate vicinity upstream of the dam, significant accumulations of alluvial material can be achieved, which in time, will lead to the flattening of the riverbed, to the identification of a small slope and to the decrease in the water flow speed, leading to a relative stabilization of the upstream sector.
Important changes are also identified in terms of shear stress, so that the thrust identified in the case of simulation 1 changes its shape. In the case of simulation 2, because the maximum simulated flow exceeds the implemented dam, the water volume will act with a higher pushing power in the immediate vicinity of the downstream area of the dam due to the fall of water over the dam.
Analysed correlatively, the two parameters highlight the usefulness of hydro-ameliorative construction. Analysed based on the values and areas of action in the immediate vicinity of the dam, the parameters highlight the fact that they raise problems in terms of temporal viability of construction due to the cumulated action of destructive impact (
Figure 13). The large erosion identified in the area of the banks where the dam is anchored and the erosion removal of the eroded material will in time weaken its setting, making the partial or destruction of the construction inevitable. At the same time, the combined effect of erosion at the base of the dam with the high value of shear stress leads to the development of the regressive erosion process at the base of the dam, leading in this case to its destabilization and inevitable destruction.
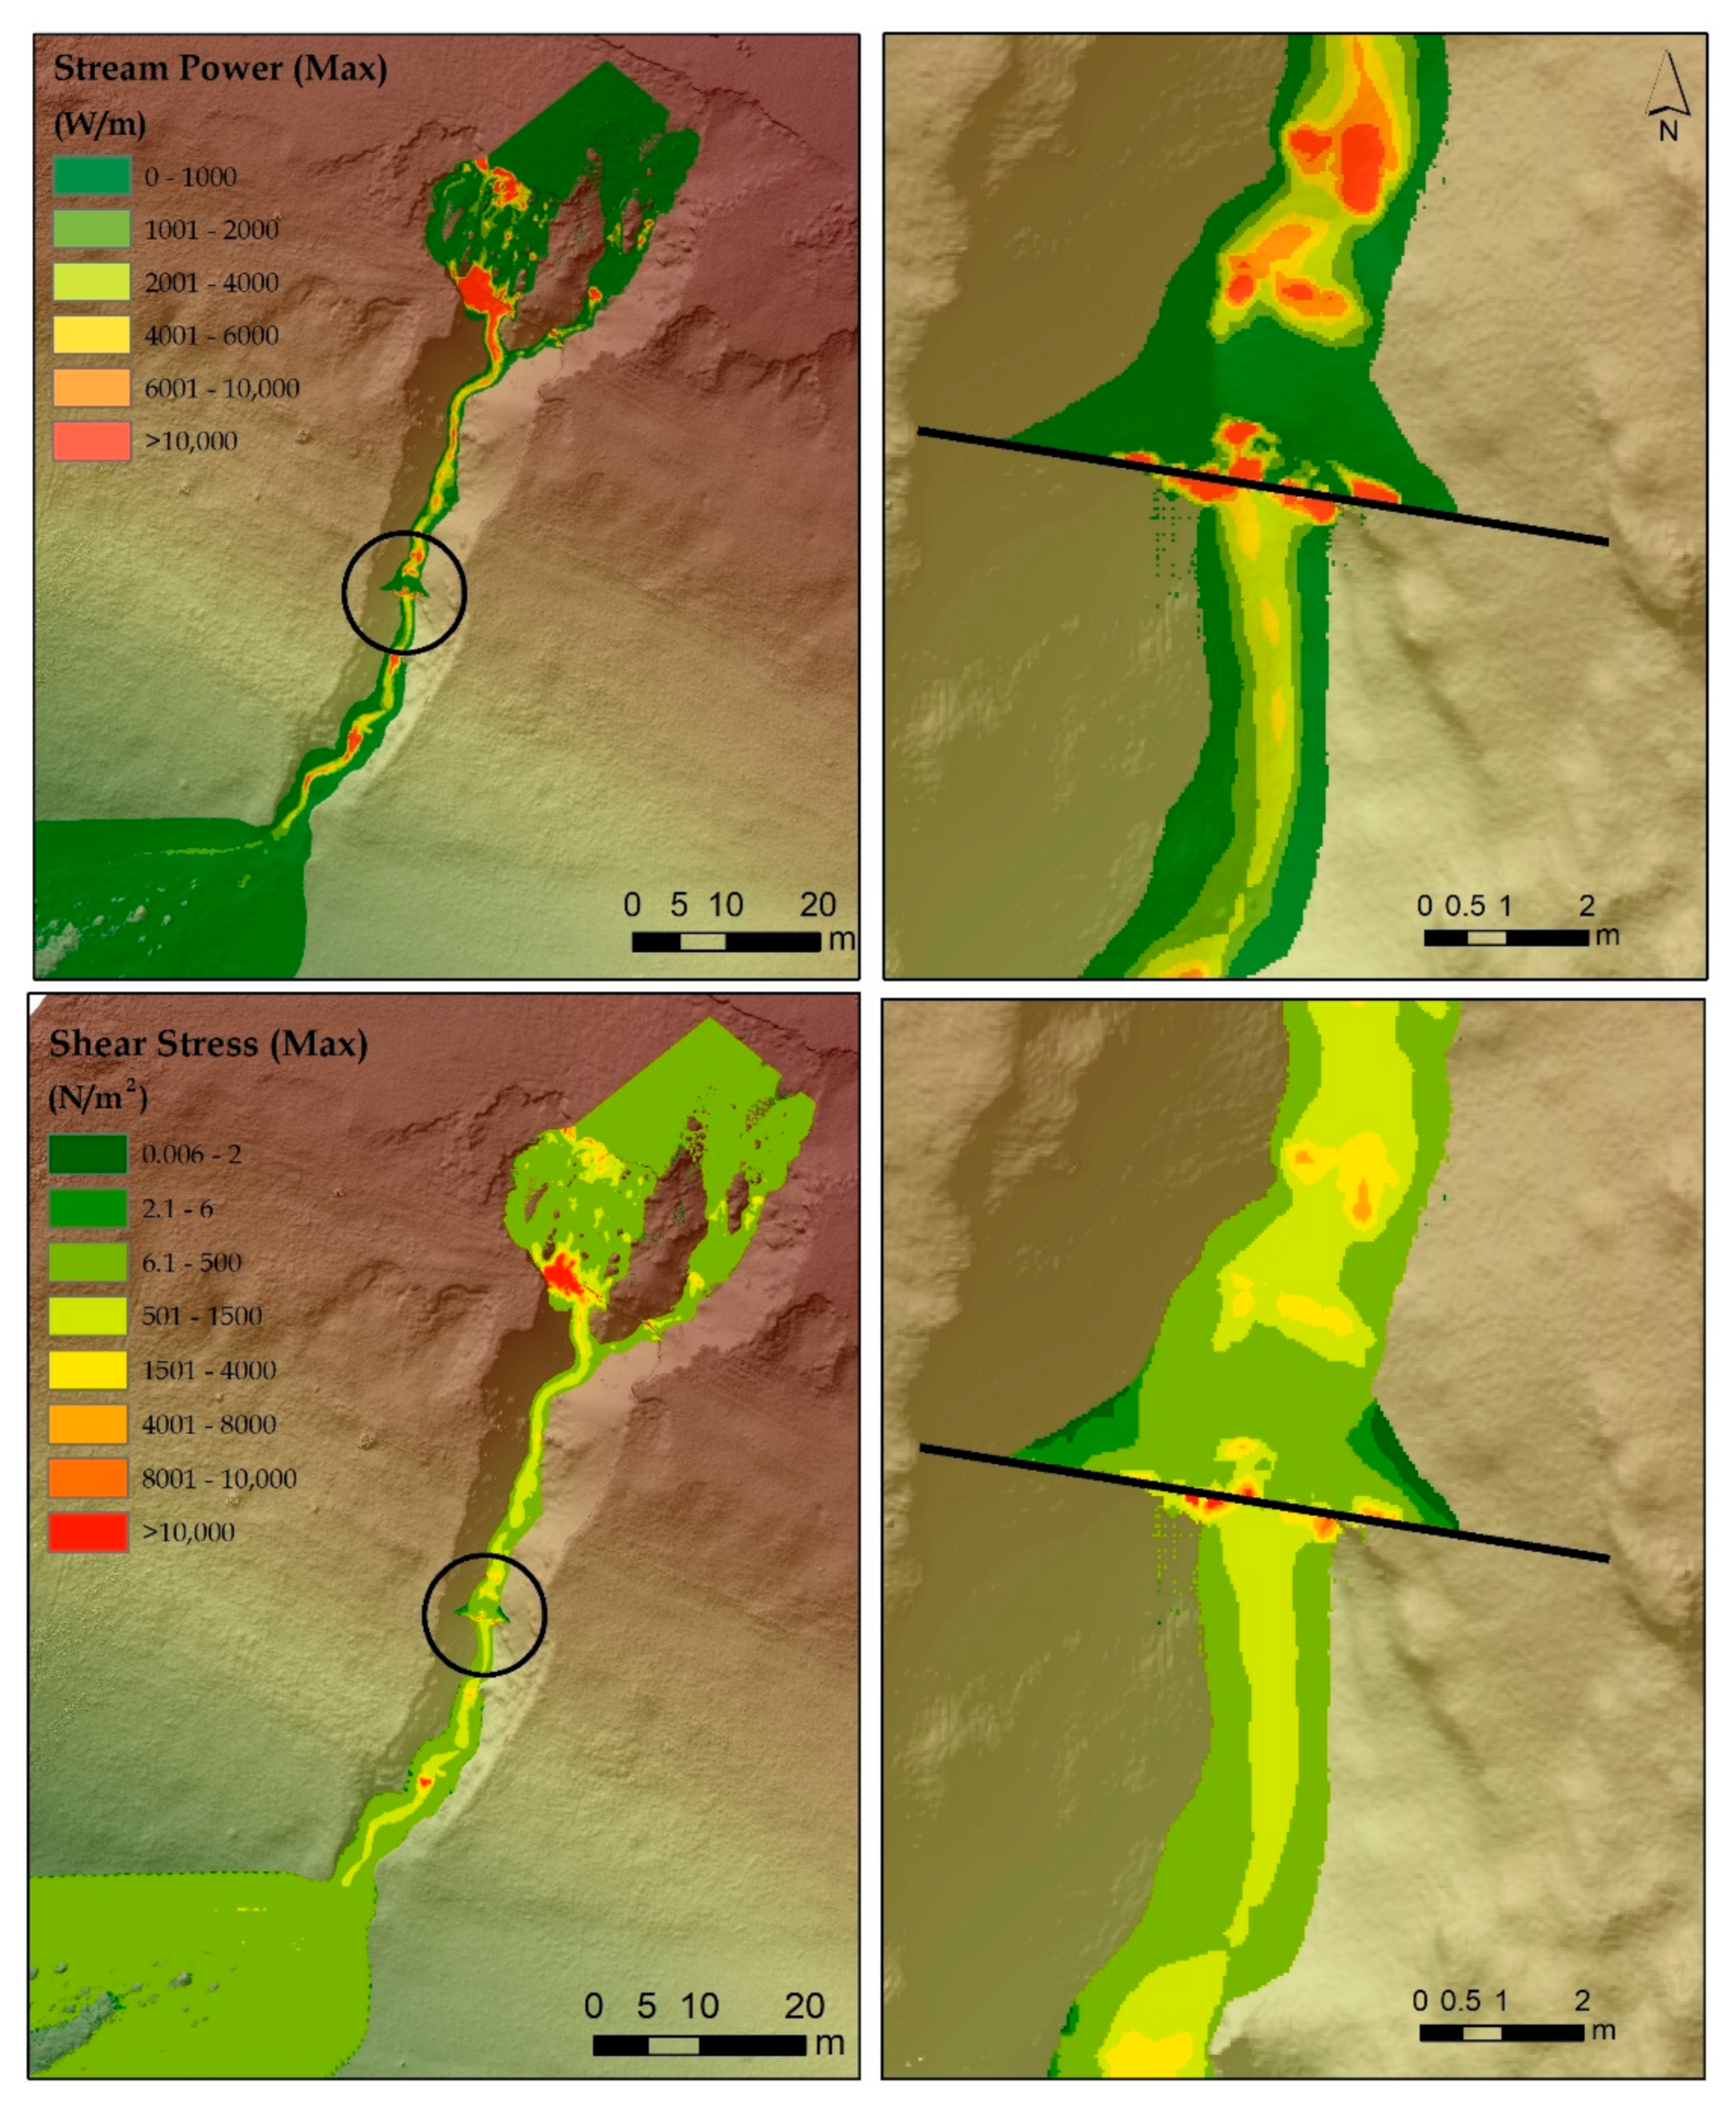
The higher technical complexity of the hydro-amelioration arrangement included in simulation model 3 highlights even more the important changes regarding the analysed ravine both in terms of the likely impact of erosion power and in terms of shear stress. The comparative area analysis between simulations 2 and 3 reveals changes within the two parameters on both sectors that control the ravine (Sectors II and III). Here, one can observe a reorganization of the large erosion powers in the mainstream. The areas with high values of erosion power have diminished, and their effect can be visible mostly on deep erosion and not on the banks (
Figure 14).
Important changes regarding the singular or combined action of the two parameters on the analysed ravine are identifiable in the immediate vicinity of the hydro-amelioration infrastructure implemented in simulation number 3. Due to the higher height of the dam and, implicitly, its length, the main erosion areas are clearly differentiated from the force areas. Due to the overflow implemented as a structure of the dam, the volume of water generated by the maximum flow does not exceed the maximum elevation of the dam, which is discharged through the overflow. This highlights very little erosion on the banks, and the same can be seen in the case of shear stress. High values of erosion are highlighted on the two openings of the spillway, while high values of shear stress have a potential impact at the base of the spillway. A very important fact to note is that both the erosion power and shear stress register small values both upstream and downstream of the dam, which highlights the probable resistance in time of the proposed infrastructure.
The proposed dam primarily stabilizes the identified hotspot (HS), because with the reduction in erosion both on the banks and in the depths, good conditions are created for the storage of eroded materials in Sectors I and II. The dam function also has an impact on downstream dredges, reducing the time of water runoff and reducing the erosion power downstream of the dam due to the lower flow and short action time in the lower sectors.
In the fourth simulation, it was decided to increase the complexity of the hydro-amelioration work by introducing in its structure and integrated territorial system of the ravine, a water drainage pipe throughout the action of the volume of water that contributes to the modification of the analysed ravine. The introduction of this new element in the simulation is an integral part of the technique of arrangement and construction of such arrangements with the main purpose of reducing the force of water pushing on the dam, but also for the evacuation of a continuous water flow with the main purpose of reducing the propagation time of the water, downstream of the hydro-ameliorative work both during the increase in the flow and on the decrease in the simulated drainage hydrograph. Another reason is to reduce the volume of water recorded at maximum flow, based on the continuous discharge of a constant volume through the proposed pipeline and at the same time to reduce erosion both at the base of the hydro-amelioration work and in the downstream sector due to the action of a maximum volume, less than the maximum volume reached at the tip of the hydrograph.
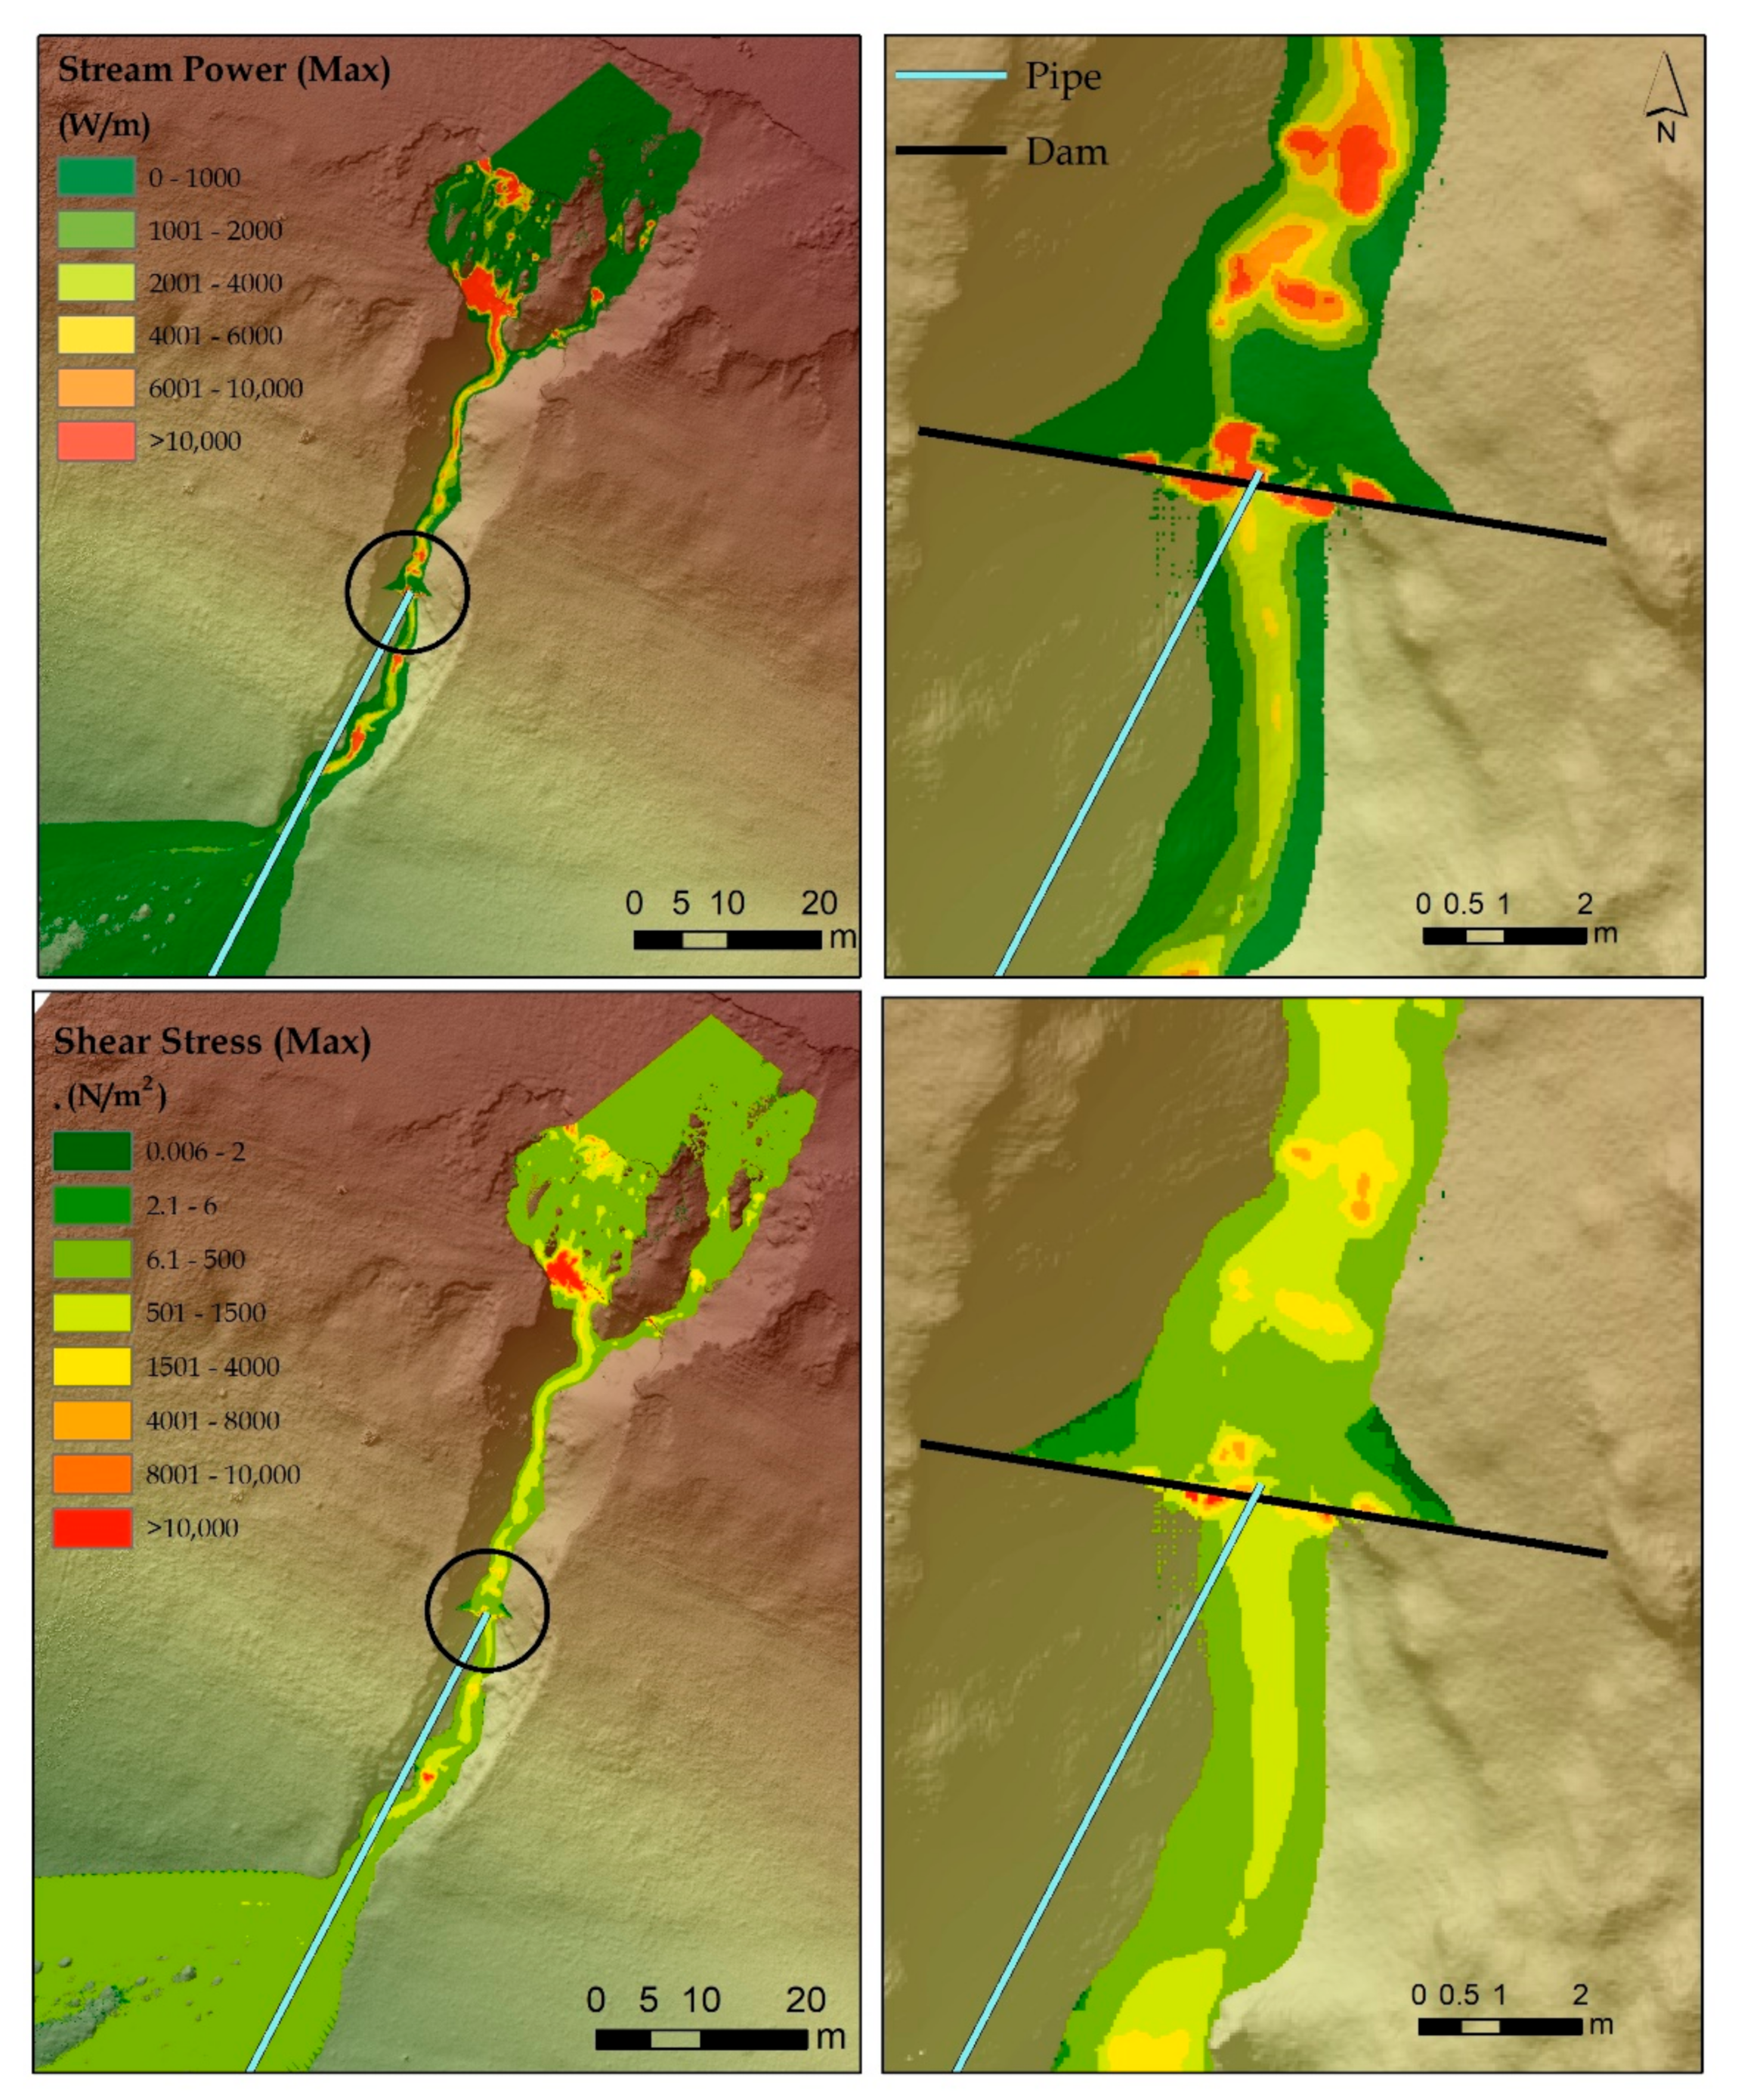
In simulation 4, the introduction of this new element has both advantages and disadvantages in terms of the impact on erosion and shear stress. The analysis of the simulation results highlights the fact that the erosion areas in the immediate upstream proximity of the dam increase, since part of the water volume is channelled to the lower part of the dam to be discharged through the pipeline. In this way, vortex force is created, which favours surface erosion with a direct impact on the two banks (
Figure 15). Another important change in terms of the erosional impact on the drainage channel in the ravine is also observed in the area in the immediate vicinity upstream of the dam. This change is highlighted by the increase in linear erosion by creating a spatially superimposed erosion channel with the direction of convergence of the volume of water towards the place where it is captured by the pipe. This channel favours, in addition to the rapid transport of alluvium and the regressive evolution of the ravine in that sector due to the development of a steep slope through deep erosion, the generation of eddy currents that increase the flow rate and at the same time increase the erosion power in depth.
Additionally, due to the inclusion in the hydro-amelioration structure of the water intake pipe, the shear stress value is greatly diminished, which acts on the dam both upstream and at its downstream base, thus reducing the effects of erosion and at the same time contributing to its stability by creating favourable conditions for the deposits of sedimented alluvium with the action of the smaller volume of water discharged through the main spillway. It should be noted that the force vectors are oriented towards the upstream base of the dam, both in terms of lateral erosion and in terms of deep erosion, thus creating a favourable environment for the deposit of alluvial transported upstream, but also for production of eroded material by erosion of the banks in depth.
Regarding the behaviour of the upstream and downstream dam sectors, they remain stable in terms of erosion and shear stress, compared to the values obtained in simulation 3. The major impact of the discharge pipe is highlighted only in the immediate vicinity of the dam, the rest of the torrential system not being majorly influenced by this new element included in the simulation.
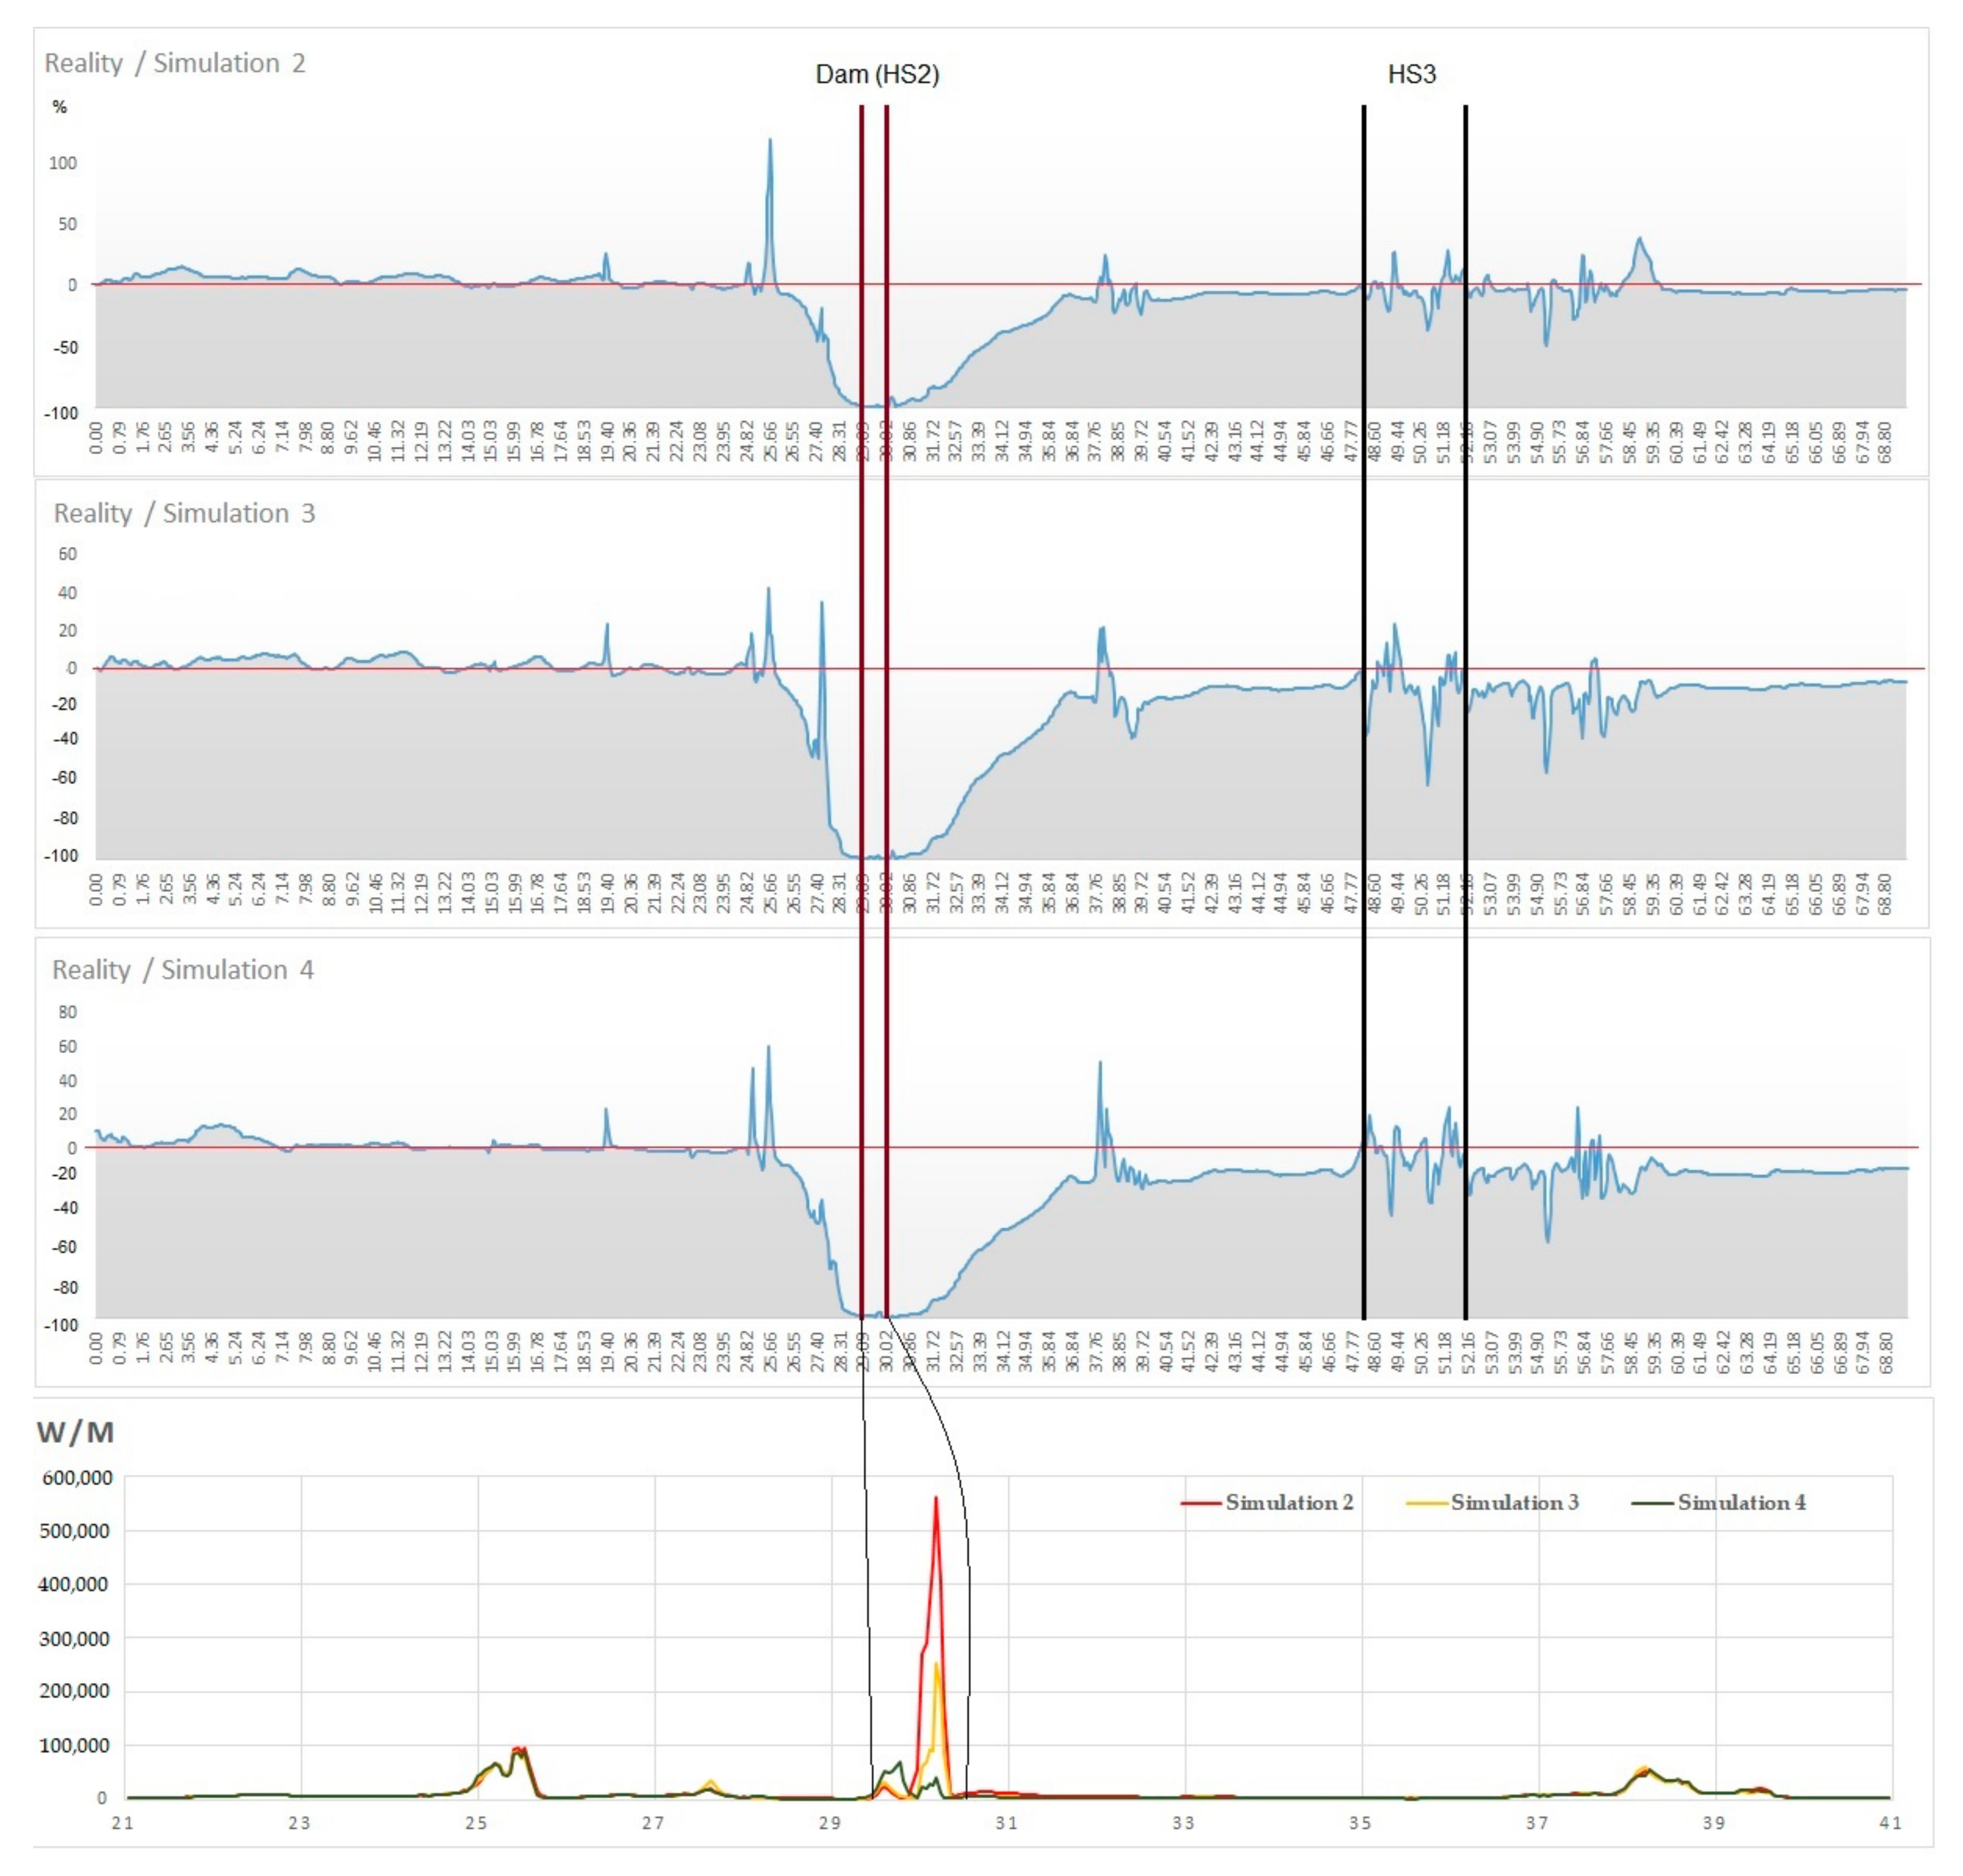
The behaviour of the entire torrential system analysed as a result of the implementation of hydro-improvement works can be analysed and highlighted best through the presentation and interpretation of the results obtained in terms of stream power in longitudinal profile (
Figure 16). For the analysis and interpretation of erosion values, it was decided to choose only Sectors II and III, because on the surface of these sectors the ravine has the highest potential from an erosional point of view due to the classic shape of the ravine and the large slope of the drainage channel. This leads to the likely potential for deep erosion and the identification of increased dynamics.
The analysis of behaviour in the longitudinal profile of the erosion process highlights the very large decrease in erosion in hotspot 2 (HS2) by almost 100% compared to simulation 1, which had an exploratory purpose. There is a decrease in erosion power along the entire length of the longitudinal profile with an average of about 20%, being evident especially in simulation 3 and 4. In simulation 2, there is a decrease in erosion power downstream of the proposed hydro-amelioration work. The values are relatively small, approx. 10% (
Figure 16).
The effects of the implementation of the overflow dam as a solution to reduce lateral and deep erosion stand out with simulation 3, producing its effects in the downstream section where the erosion power is greatly reduced both along the entire longitudinal profile and in the hotspot area 2. This aspect highlights the beneficial influence of the proposed development measure on the whole downstream system.
The same aspect can be observed in simulation 4, namely the accentuated reduction in the erosion power on the downstream sectors, with a small impact on hotspot 3. In that place, an average erosion power closer to the initial one was simulated, which is due to the low speed of movement of the volume of water, caused by the decrease in simulated volume at the tip of the hydrograph used in the modelling process.
The results obtained in the implemented case study highlight the fact that such anti-erosion work is beneficial for the relative stabilization of the analysed ravine if the best decisions are made regarding the type and structure of the proposed arrangement. The erosion power decreases visibly within the analysed hotspot, changing its area effects from one simulation to another. Thus, between simulations 2 and 3, there is a sharp decrease in erosion power of about 50%. The decrease in the erosive power with approximately the same value is also observed between simulations 3 and 4, at the same time noticing an increase in the erosive power within simulation 4 in the immediate upstream vicinity of the dam. This fact introduces instability in the proposed hydro-ameliorative assembly (
Figure 16).
Regarding the changes that occurred at the level of the analysed indicator (stream power) in the sector upstream of the dam, they have similar trends of variation. Significant changes are identified only in the immediate vicinity of the dam proposed into the simulation. The general trend is to decrease erosion due to the accumulation of water volumes behind the dam and at the same time the decrease in forces acting on the ravine.
The models for simulating the behaviour to external destabilizing factors of territorial systems are necessary in order to make the best decision based on the analysis of the results obtained from the simulation [
48,
49]. In the present study, based on the results analysis of the three simulations, it was decided that the implementation of hydro-amelioration work in simulation 3 is the best implementable technical solution for introducing a relative stability in the analysed system. The choice is based on the main advantage over the first simulation, respectively, that the erosion of the banks of the perimeter of the proposed work is 0 and the volume of water at maximum flow does not exceed the maximum elevation of the dam. The fact that the maximum volume exceeds the maximum elevation of the dam introduces instability in terms of the structure proposed in simulation 2 by lateral erosion and exposure of the embankments of the dam, as well as by exposure to regressive erosion at its base. Due to the introduction of the overflow as an additional element and at the same time raising the elevation of the dam in simulation 3, the volume of water recorded at maximum flow will be discharged through the overflow, thus reducing lateral erosion and shear stress, both at the base of the dam and at the lateral extremities.
In the case of simulation 4, an additional element is introduced, namely the evacuation pipe, which, theoretically, should add value to the proposed hydro-amelioration work by reducing the volume of water recorded at maximum flow and reducing the shear stress value. The shear stress is diminished because in the immediate vicinity of the dam, in the upstream sector an erosion channel is formed, which is directed towards the exhaust pipe favouring bottom erosion and directing the transport vectors of suspended alluvium to the proposed evacuation. This will lead in time to the clogging of the pipe with eroded material, requiring frequent and complex maintenance works, due to the long length of the pipe, which leads to additional costs that should be avoided in these categories of works. Another weakness regarding the implementation of the hydro-amelioration work proposed in simulation 4 is the fact that additional technical excavation works are needed to bury the pipeline works that require intervention in the ravine system, leading to changes in its morphometry and morphology. These additional earthworks could lead to the destabilization of the whole system and the emergence of related erosion processes in the downstream sectors.
The decision to implement the hydro-amelioration work included in simulation 3 is supported by the comparative analysis of all implemented simulations, being the most viable in terms of implementation–operation costs, as well as in terms of ameliorating impact on the studied ravine [
50,
51,
52].
The complex arrangement of the analysed ravines involves the establishment of two more hydro-improvement dams: one downstream of the receiving basin of the torrent to control in terms of erosional power Sector II of the ravine, and one in hotspot 3 to significantly reduce its development from a spatial point of view. At the same time, for a better integrated management of the ravine, related works can be carried out to reduce erosion (especially bank erosion) that involve grassing and the use of hygrophilous species adapted to local pedological and climatic conditions. These types of arrangements will be the subject of future studies with the main purpose of proposing complete and integrated solutions to stabilize the affected area and reduce the territorial risk. These studies will materialize in methodologies that can be implemented on territorial surfaces with similar characteristics.
Given that this article presents a methodology for simulating the reduction in ravine erosion based on hydraulic analysis in territories that are not monitored from a hydrological or pluviometric point of view, the model can be validated only as a result of implementing the proposed practical solutions. The model is validated from a spatial point of view by the fact that the results of each simulation highlight a decrease in erosion both on the hotspot taken as a case study and on the entire surface of the drainage channel. The implementation of the proposed methodology in the form of a spatial analysis model of surface waters that have concrete databases could be the basis for quantitative analysis regarding the inclusive issuance of technical solutions regarding the resistance and durability of hydro-ameliorative works implementable on the respective surface.
