1. Introduction
The importance of Artificial Intelligence (AI) grows significantly, predominantly for the analysis of large amounts of data, as industries recognize and prepare to take advantage of the data they collect every day [
1]. Industries have the desire to maximize the efficiency of their production lines, controlling variables that manufacturing has, for example, waste management or quality control [
2]. However, it is still recent the perception that the functional performance depends inherently on the processing and visualization of information in real-time in a clear way. Only in this way can companies reduce the risks to which they are exposed [
3]. Business Intelligence (BI) processes, thus, become a key technology for any industry that wants to manage and serve its customers in the best possible way [
4]. BI is a learning process that must provide intuitive information analysis, the ability to perform assertive analysis of what is happening, and where the company should go towards [
5]. Real-time processing and visualization involve principles that allow companies to take advantage of the information that is stored on their computer systems as it arrives [
6].
The Complex Event Processing (CEP) paradigm allows the information contained in events that flows through all layers of the (Information Technology) IT infrastructure to be discovered, understood, and made available in real-time [
7]. Complex Event Processing is defined as the use of technologies capable of consulting data even before it is stored [
6]. This process is essential for the processing of information in real-time, as it performs the analysis of incoming events in a continuous way, providing an updated view of what is happening in the business domain [
8]. Therefore, CEP is a helpful ally, since it tracks data flows from several sources simultaneously, analyzing trends, patterns, and even events in real-time [
9]. CEP allows users to access events that happened in the past and use them in any order. These events may come from various sources and may occur for a long period of time. CEP approaches require sophisticated event interpreters, event pattern definitions, and matching of event patterns, together with correlation techniques [
9,
10,
11]. With CEP, the received data are being continuously monitored and acted upon based on the use of declarative conditions, with almost zero latency [
9].
Complex events are commonly related to important business events (such as opportunities or threats), with the implication that they will be responded to in real-time or at least in something approaching real-time or zero-latency [
8,
9,
12]. From databases and dashboard visualizations, to the presentation platforms, everything must support the processing of complex events in real-time. In the following chapters, a discussion about the pros and cons found when adopting these tools is presented.
2. Contextualization
Currently, there are multiple applications for extracting and analyzing data in real-time, each of which having their specific features and purpose. However, these applications have a common feature, namely the processing of data in real-time to facilitate the extraction of useful knowledge for companies and consequent decision making. As companies keep producing large amounts of data over time, they have started to express the desire for real-time processing applications to process complex events in real-time, improving their decision-making process.
This article intends to analyze a set of applications that have the ability to process events in real-time, and to make a comparative analysis of each application. Furthermore, CEP in real-time is not easy to implement and adhere to, largely due to its complexity and variety of data. Due to these challenges, new applications began to appear, making this adoption simpler and easier to implement. This article will analyze various technologies for CEP in real-time, their different characteristics, and in the end, propose an architecture for CEP in real-time that will combine some of the technologies that were analyzed in this article.
3. Research Methodology
A critical review of the available tools and technologies for real time information processing and their application in manufacturing was conducted. Henceforth, searches using keywords on abstract and citation databases were consulted, in particular Scopus and Web of Science. Primary sources, namely reports, articles, and dissertations, were consulted, as well as secondary sources, such as books and magazines. In addition, internet searches were performed to confirm and clarify concepts [
13]. Some selection criteria were applied. For example, documents that are more than 5 years old have been discarded. This research was carried out from September 2020 to January 2021.
Of the publications analyzed, about 200 publications were selected, of which the tools that had the most occurrences were selected and, consequently, we searched the bibliographic references to support our choices. Then, we compare the solace, the tool with which we work, with the other tools that we had selected from the literature.
It should be noted that Solace is a very recent tool and does not have much literature to support our research, which is why we use other similar tools for comparison. It should be noted that the choice of Solace was based on the fact that it is a tool used by several renowned companies. These companies are shown in the
Table 1, where it can be seen that companies using Solace range from banking institutions to the aerospace and automotive industry. This reinforces our decision to include Solace as a tool analyzed in this study.
Furthermore, several selection criteria have been established, basing upon the industry’s needs and requirements. They can be either inclusive or exclusive, ensuring the technologies discussed are viable for the conception of solutions [
15,
16]. While inclusion criteria describe elements that should be included in the tool and that would prove useful for users, the exclusion criteria are elements that can make a recommendation in this review unfeasible [
17]. This inclusion criteria includes the possibility to work in real-time, the capacity to handle CEP, and integration with popular data sources, for example, Microsoft Excel, SQL Server, Oracle Database, and MySQL. The adopted exclusion criteria is the tool’s availability and support, as well as cost, licensing, and scalability.
4. Software
This section presents a list of software to be analyzed in this paper. These tools were selected using the methods described in the previous section. For each tool, a general description of the software and its main components is presented, and the advantages and disadvantages of the tool are identified. These tools were divided into two main categories: the first one is related to event brokers, while the second category is related to Business Intelligence (BI) and the data analytics process.
4.1. Event Broker
4.1.1. Apache Flume
Apache Flume is a streaming data-based framework that allows the collection and aggregation of data, and to move large amounts of data in a distributed environment [
18]. This tool was originally developed by Cloudera, with its ownership moving in 2012 to the Apache Software Foundation [
19].
The main purpose of Flume is to ingest event data into the HDFS (Hadoop Distributed File System) in a simple and automated way. However, it can be used for various tasks, including data transport [
20].
Flume supports several data reading mechanisms, including Avro, Thrift, and Syslog [
21].
Components
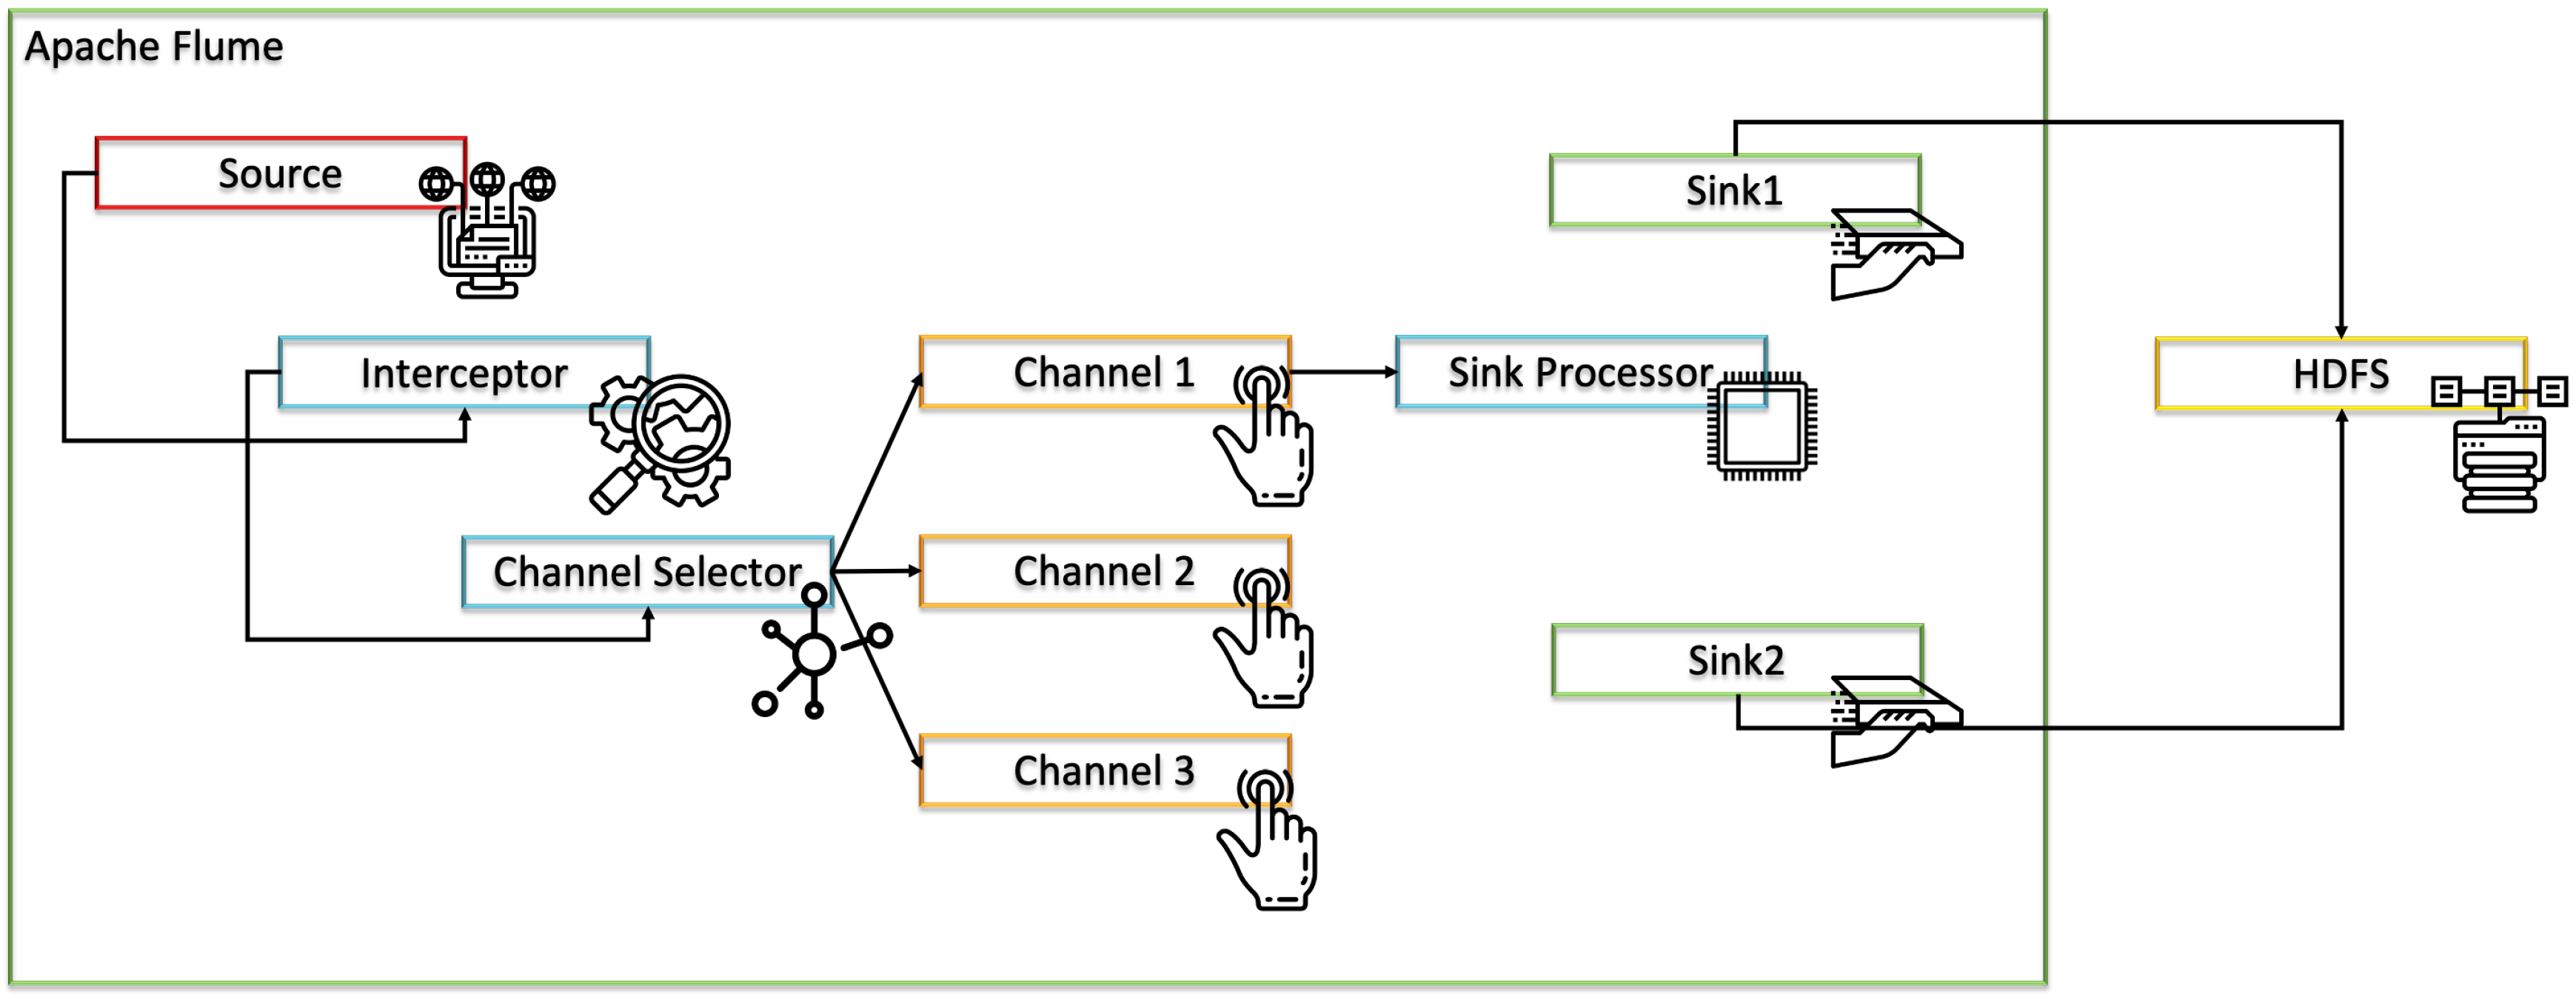
Apache Flume offers multiple components: Source, Channel, Sink, Interceptors, Channel Selectors, and Sink Processors [
21].
The first of the three base components to be defined is Source, responsible for data input. It is necessary to expose that it has a major limitation, only extracting and supporting unstructured data (events) [
19,
21].
The Channel component is the intermediate component that handles data storage in the transition from the Source to the Sink. The operation performed resembles a queue [
19,
21].
To conclude the base components, the Sink component is the component responsible for sending data to the destination. Usually, the destination is the HDFS, but other options, like HBase, Hive, and Elastic Search, are supported, as well [
19,
21].
Regarding additional components, the Interceptors are used to modify or review the events transmitted between the source and the channel [
22].
The Channel Selectors are useful for identifying which channel to select for data transmission when there are multiple channels. This component is typified according to the type of channel. The Default Channel Selectors, often known as Replicating Channel Selectors, are responsible for replicating all events on each of Flume’s channels. Multiplexing Channel Selectors use the address provided in the event header to decide the channel to which the event should be sent [
21].
Finally, the Sink Processors are responsible for calling a specific selector from a selected group of sinks. To do this, fail-over paths are created for the sinks. These components are commonly used for load balancing events on multiple collectors [
21,
22].
Figure 1 illustrates the architecture that is obtained when all of these components are in use.
4.1.2. Apache Sqoop
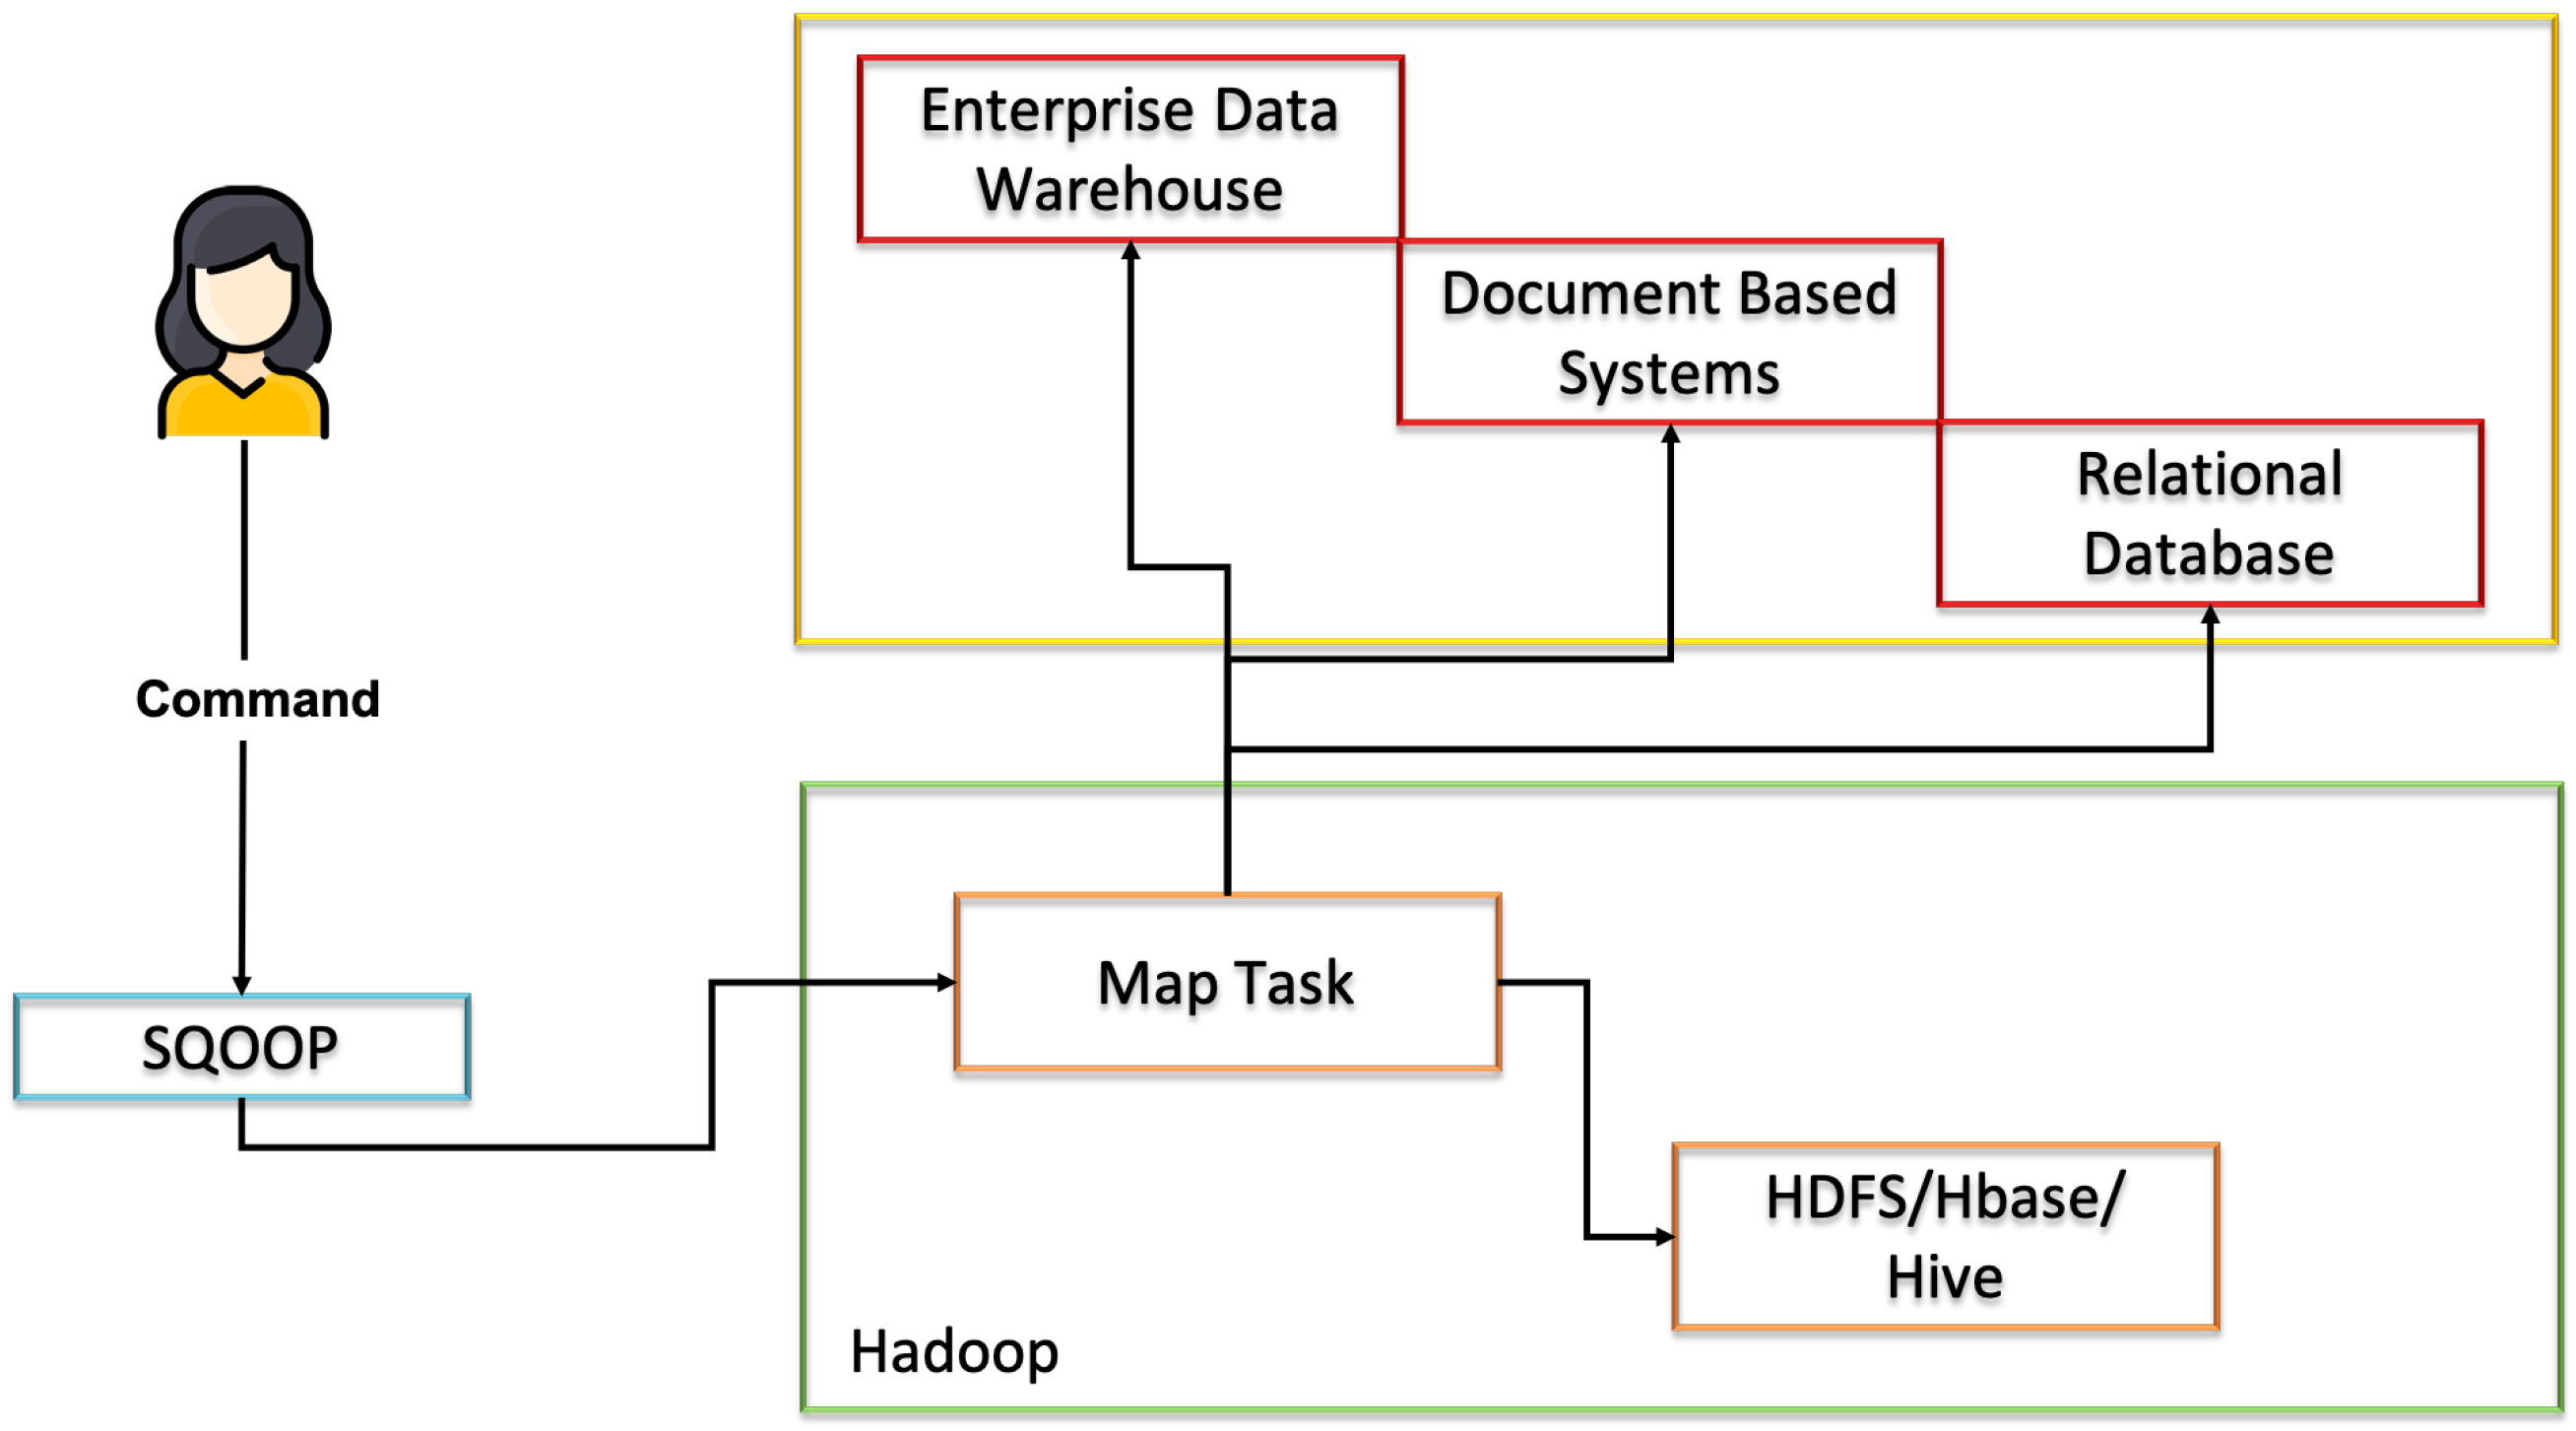
Sqoop is a framework that allows data to be moved and removed from any relational database management system in Hadoop. It is a data management tool built by Apache Software Foundation on Hadoop [
23]. In short, the main purpose is to import data from relational databases into Hadoop (HDFS) and export data from the Hadoop file system to relational databases [
24].
Components
Sqoop is a tool that is designed for the data transfers between (Relational Database Management Systems) RDBMSs and the Hadoop ecosystem. Therefore, it is based on two major components: the connectors that allow Sqoop to overcome the differences in the SQL dialects supported by the different relational databases along with providing the optimized data transfer; plus, the Drivers meaning the JDBC Drive that is the standard Java API for accessing RDBMS and some data warehouses [
25].
Thus, the basic architecture for Apache Sqoop is presented in
Figure 2.
As can be observed, this tool only makes sense to be used when framed in Hadoop ecosystems.
4.1.3. Solace PubSub+
Solace, initially called Solace Systems, is a middleware company based in Canada. This company is dedicated to the manufacture and sale of message-oriented devices and software for routing information. In 2001, Craig Betts founded Solace with the purpose of incorporating the messaging system into hardware [
26].
Their flagship product, PubSub+, is an unified message broker that supports publishing/subscribing, queuing, requesting/responding, and streaming using open APIs and protocols through hybrid cloud and Internet of Things (IoT) environments [
27].
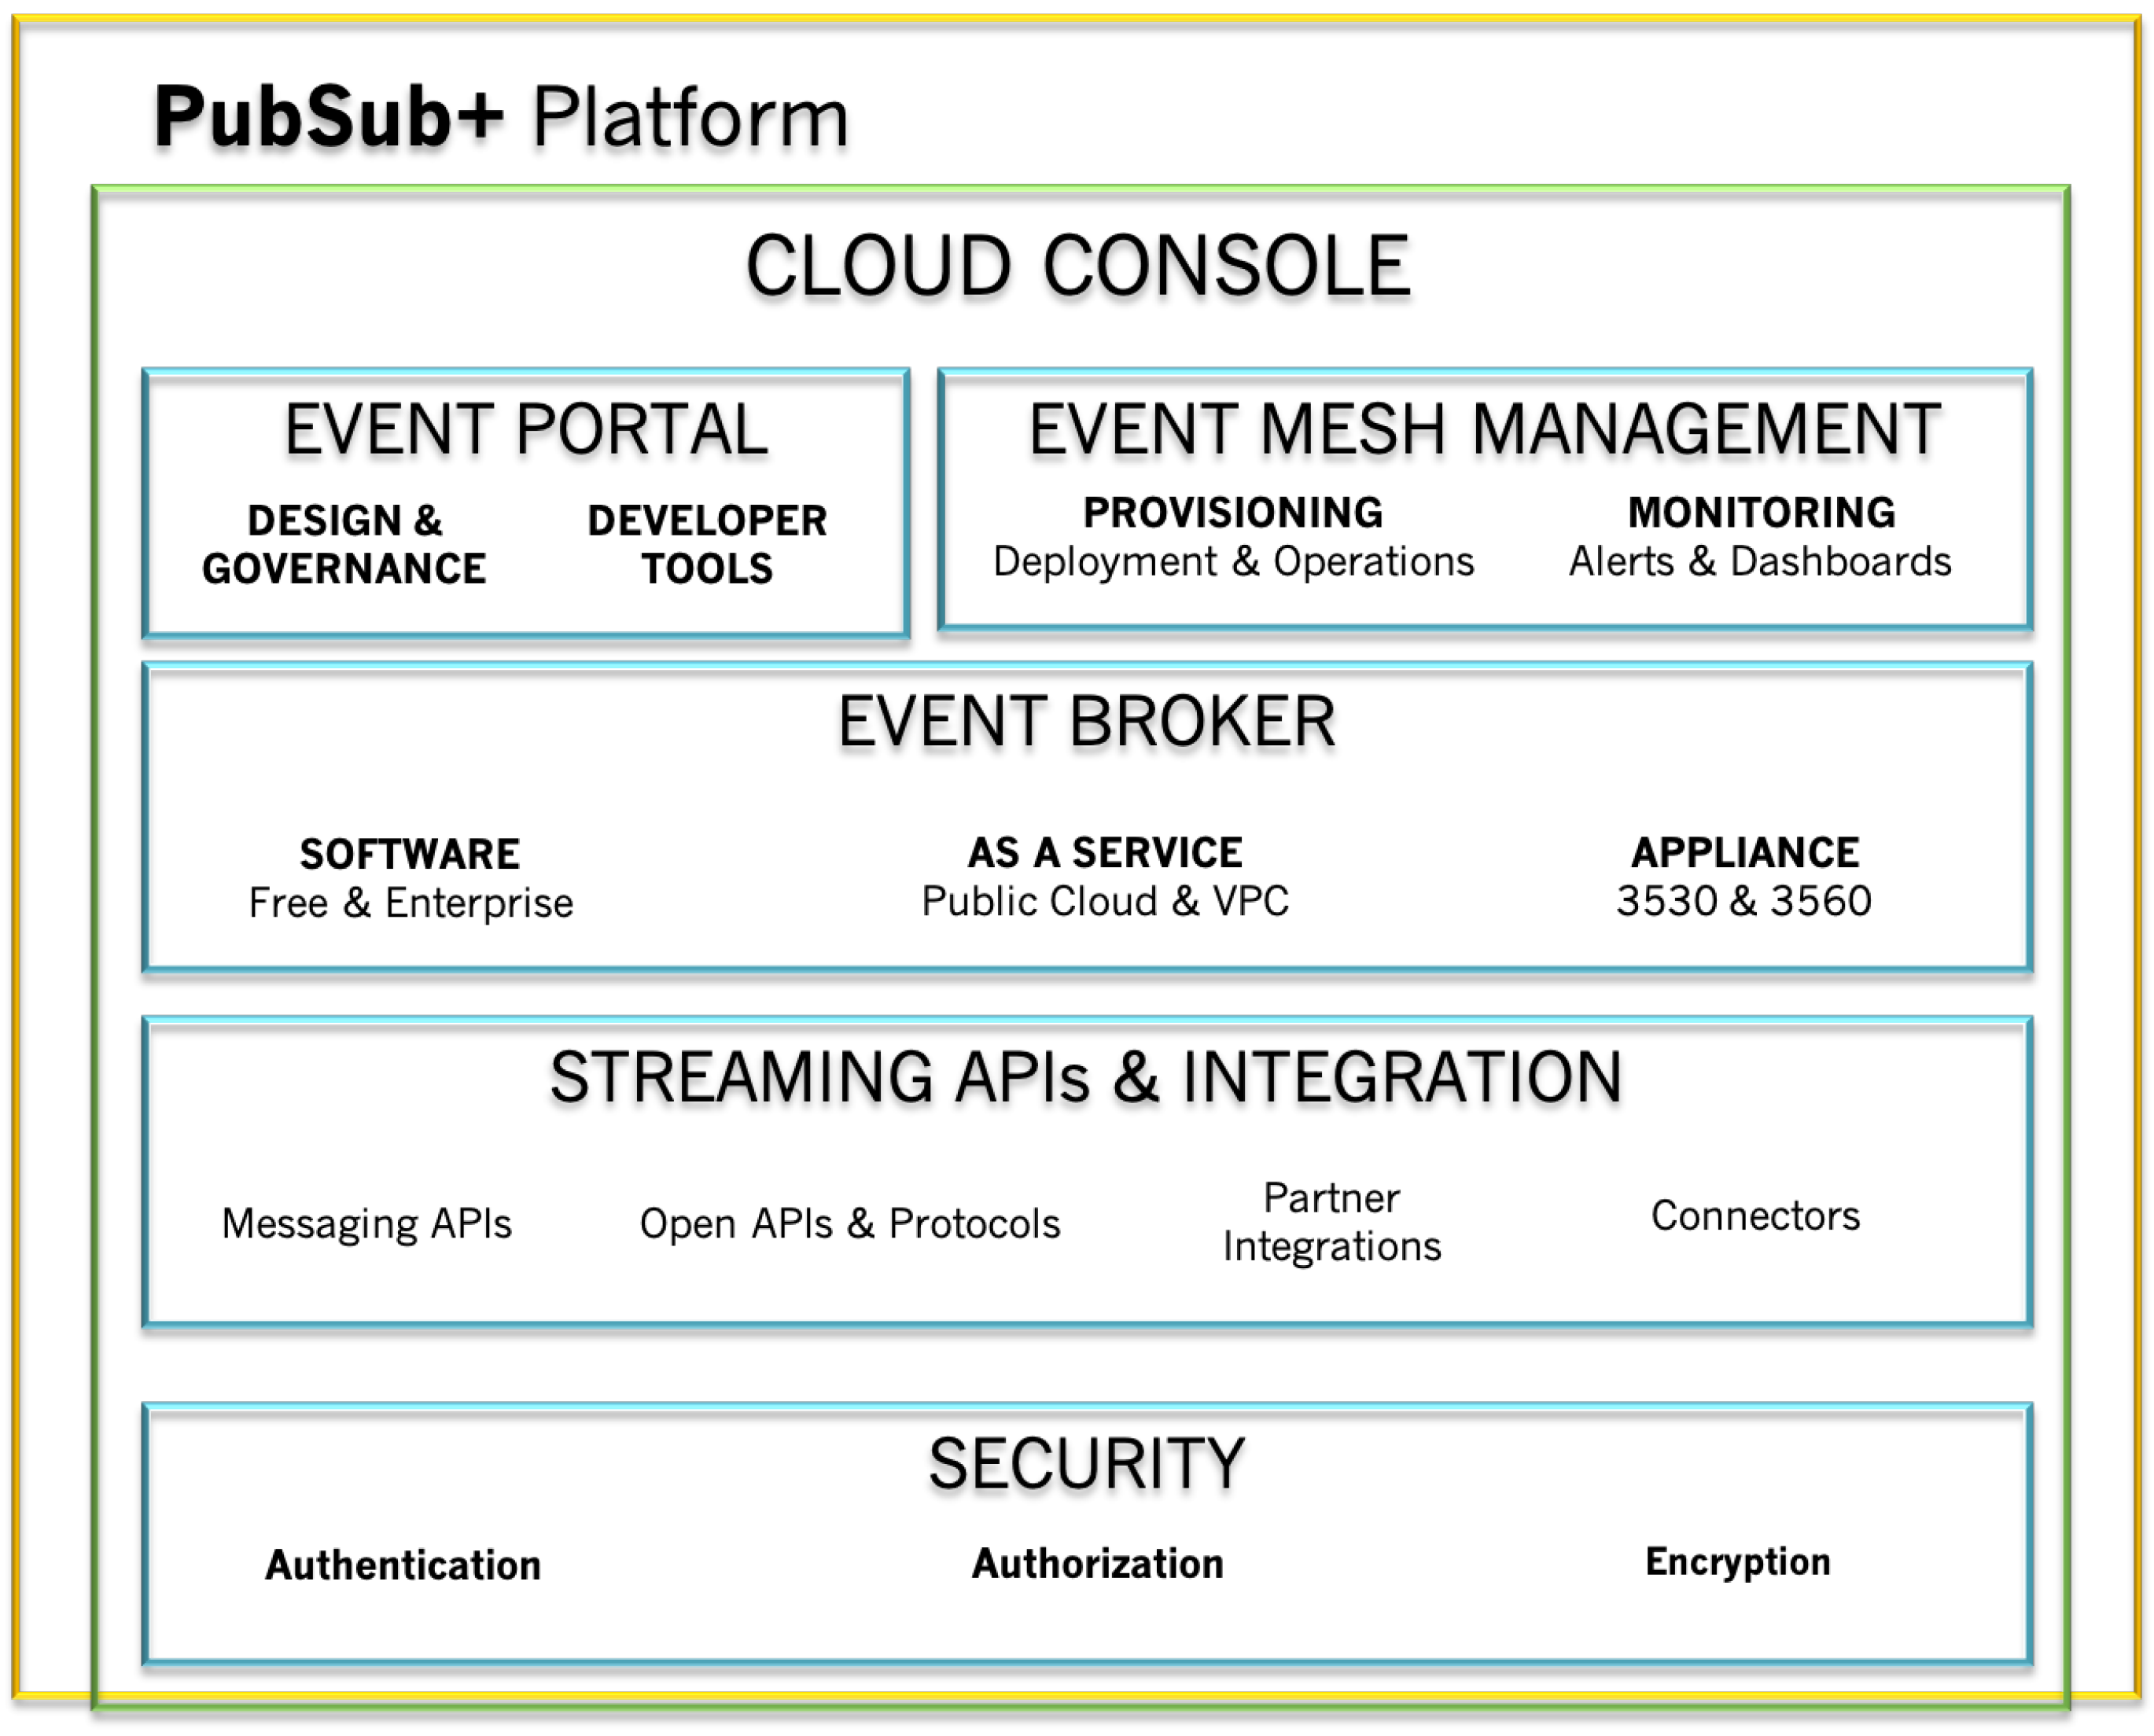
This software is divided into 5 layers that will be described below:
PubSub+ Event Broker: This layer incorporates three other sub-layers that are described below. Even so, the PubSub+ event brokers have the ability of loading an event mesh.
PubSub+ Event Broker- Software: The main function of the Solace software sub-layer is to efficiently transport information in the form of events. This transport can be between applications, IoT devices, and user interfaces, all of which can be hosted locally or in a cloud. This software allows the use of various communication protocols, such as open protocols, like Advanced Message Queuing Protocol (AMQP), Java Message Service (JMS), Message Queuing Telemetry Transport (MQTT), Representational State Transfer (REST), and WebSocket. There are two versions of this software, one free (Standard) with support of up to 1000 client connections, and another that offers high performance (Enterprise), with a scale of up to 200,000 client connections.
PubSub+ Event Broker- Appliance: PubSub+ Appliances have three characteristics that define them exclusively. They are specially designed with high-speed FPGAs and network processors that support extremely low and predictable latency. They offer built-in redundancy and can even continuously replicate all messages to waiting locations.
PubSub+ Event Broker- Cloud: Solace’s cloud service makes software event brokers available as a service. Only in this way can the needs of the software be met in a short period of time, and scale on-demand to any level.
PubSub+ Event Mesh: An event mesh is a layer that dynamically routes events from one application to any other.
PubSub+ Streaming APIs and Integrations: They provide a variety of on and off-ramps, such as the protocols already listed and proprietary APIs for messaging, in order to link old and modern applications and connectors to technologies, like Kafka.
PubSub+ Event Portal: The PubSub+ Event Portal is an event managing tool-presented through the User Interface (UI) available on the Web—which allows for the discovery, constructing, visualizing, sharing, and managing of several aspects of the Event-Driven Architecture (EDA). Here, major elements of the Event portal are described, as well as a general view of its tools. Furthermore, some of the characteristics are discussed, such as the possibility of execution-time EDA, support for Kafka-native objects, event sharing, version control, REST API, AsyncAPI, and other essential characteristics. In addition, tools are provided for building, describing, and discovering events within the system, but also the establishing of connections between applications and events, making it easier to develop event-oriented applications and microservices [
28].
PubSub+ Platform Security: The security platform allows for message architectures that obtain a consistent multi-protocol authentication of a client, plus security clearance management in a company environment, all of it integrated with company authentication services while using a minimum amount of components.
These layers are organized as illustrated in
Figure 3.
Components
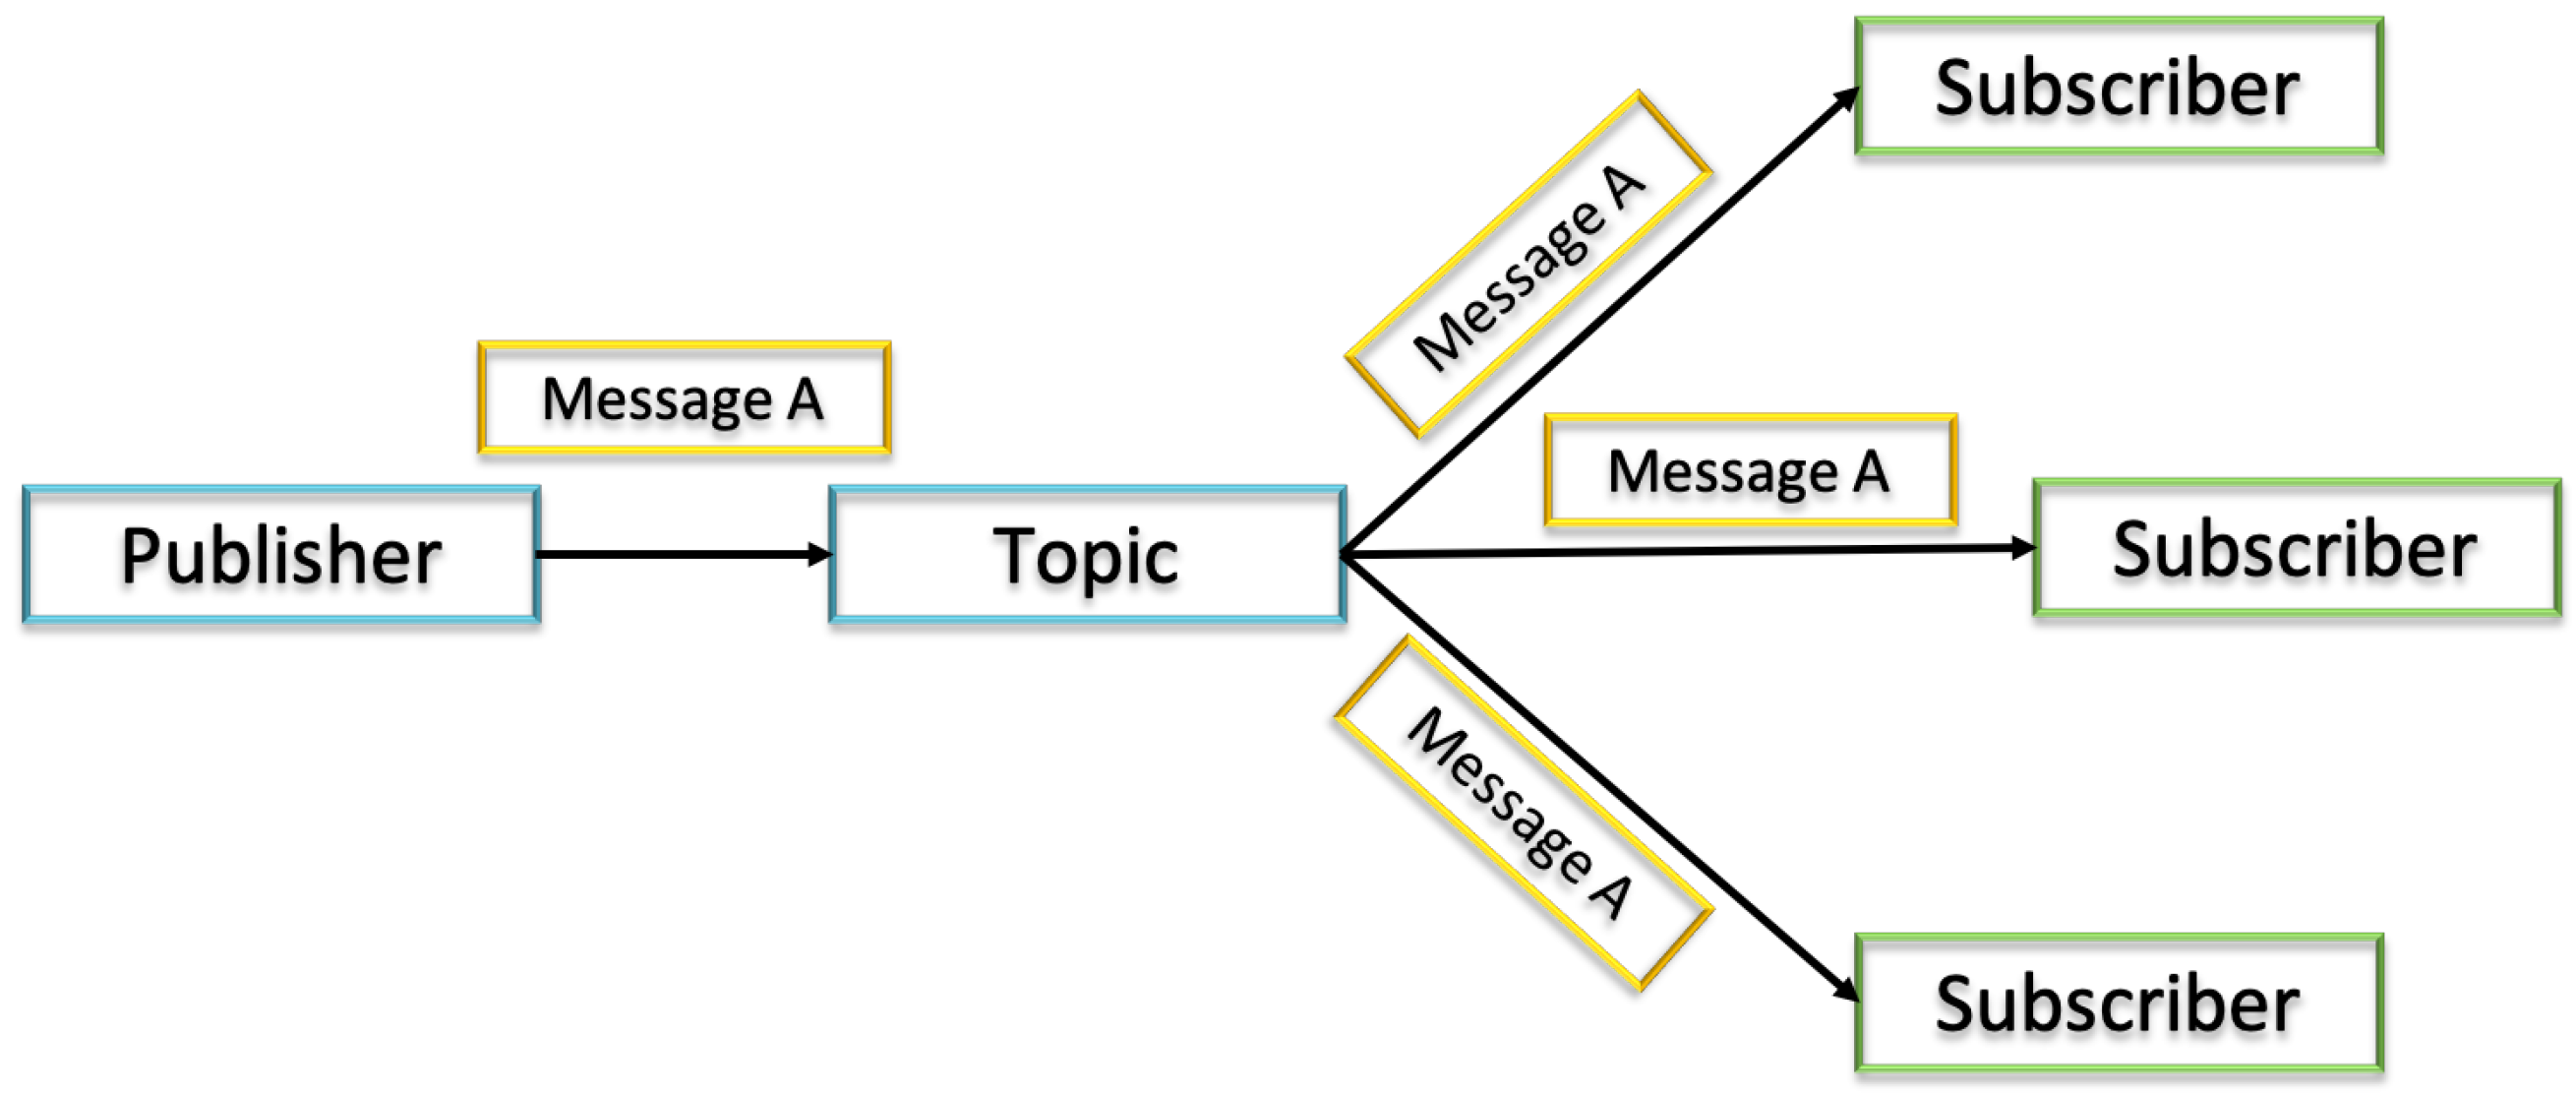
Sending messages is analogous to worldwide known postal services. The term message, in the technological context, refers to the technology that allows computer systems to share information without the need for direct links or knowledge of each other’s location. In the most basic operations, the sending of messages requires 5 components:
Publisher: the entity that sends or publishes the message (also called a producer);
Message: what the publisher wants to say to the subscriber. Messages often contain events, but can also carry queries, commands, and other information;
Subscriber: the ultimate receiver of the message (also called a consumer);
Topic: used when the message is intended to be consumed by more than one subscriber;
Queue: used when the message is intended to be consumed by at most one subscriber.
These components are architecturally organized as illustrated in
Figure 4.
4.1.4. Apache Kafka
Apache Kafka is an open-source platform, developed in Java and Scala, for distributed streaming processing. It was originally developed by LinkedIn in order to solve the processing of large amounts of data with low latency, as well as deal with the processing of data in real-time [
29]. It was later donated to Apache Software Foundation, its current owner [
30].
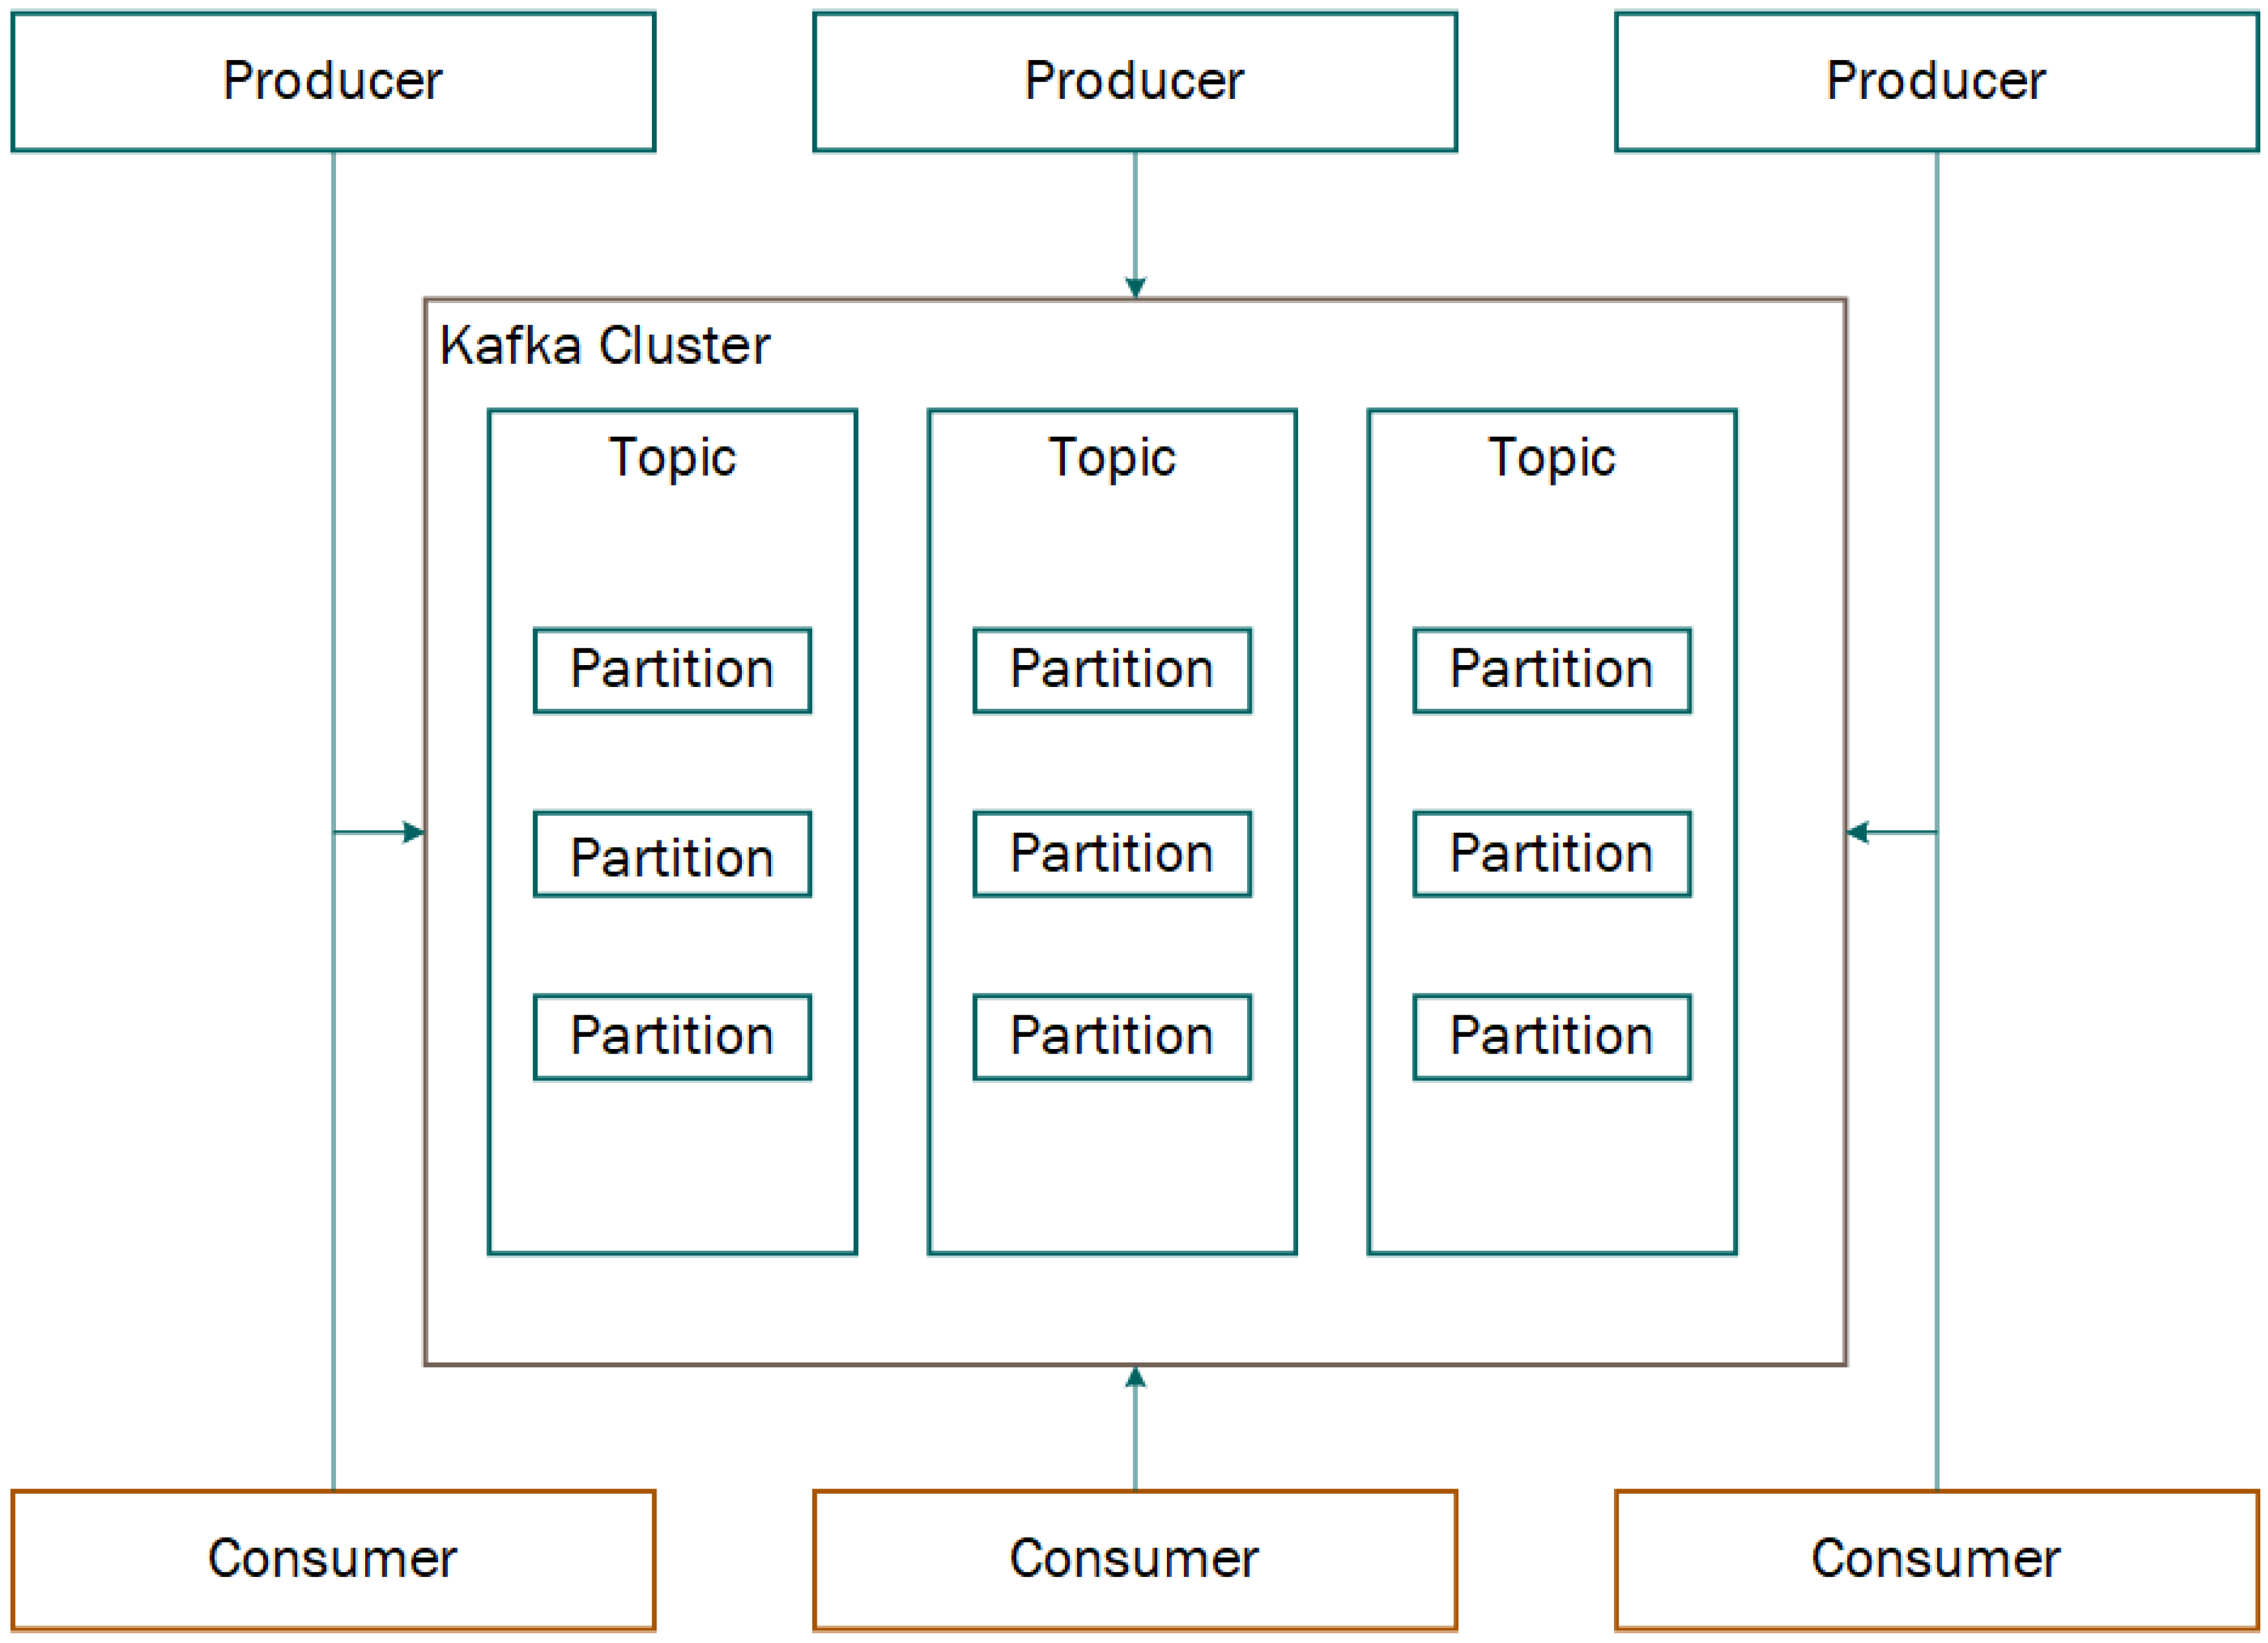
Apache Kafka is an event streaming platform, aiming to tackle the challenges in implementing publish/subscribing approaches. With its durable and distributed file system, it is able to support millions of events per second, handling data producers and consumers. Kafka’s flexibility and performance enables multiple use cases, from distributing streaming and metrics logging, to the development of event-driven applications, thus being a key component for a data-driven ecosystem [
12,
31].
This platform runs as a cluster and can contain multiple data centers, allowing efficient communication between data producers and consumers using message-based topics. Each message is made up of its key and value, and a date/time stamp [
29,
32].
Kafka constitute of four main APIs, the Producer API, the Consumer API, the Streams API, and the Connector API. While the Producer API enables applications to publish messages to Kafka topics, the Consumer API enables the subscription to one or more topics. The Streams API allows the processing of data in Kafka using stream processing paradigms. These two APIs make subscribers able to process the received messages with stream procedures, then sending to other topics. Finally, the Connector API connects applications or data systems to Kafka topics, providing flexibility in building and managing producers and consumers, as well as providing reusable connections between them [
33,
34].
In
Figure 5, the basic architecture of Kafka can be observed.
Components
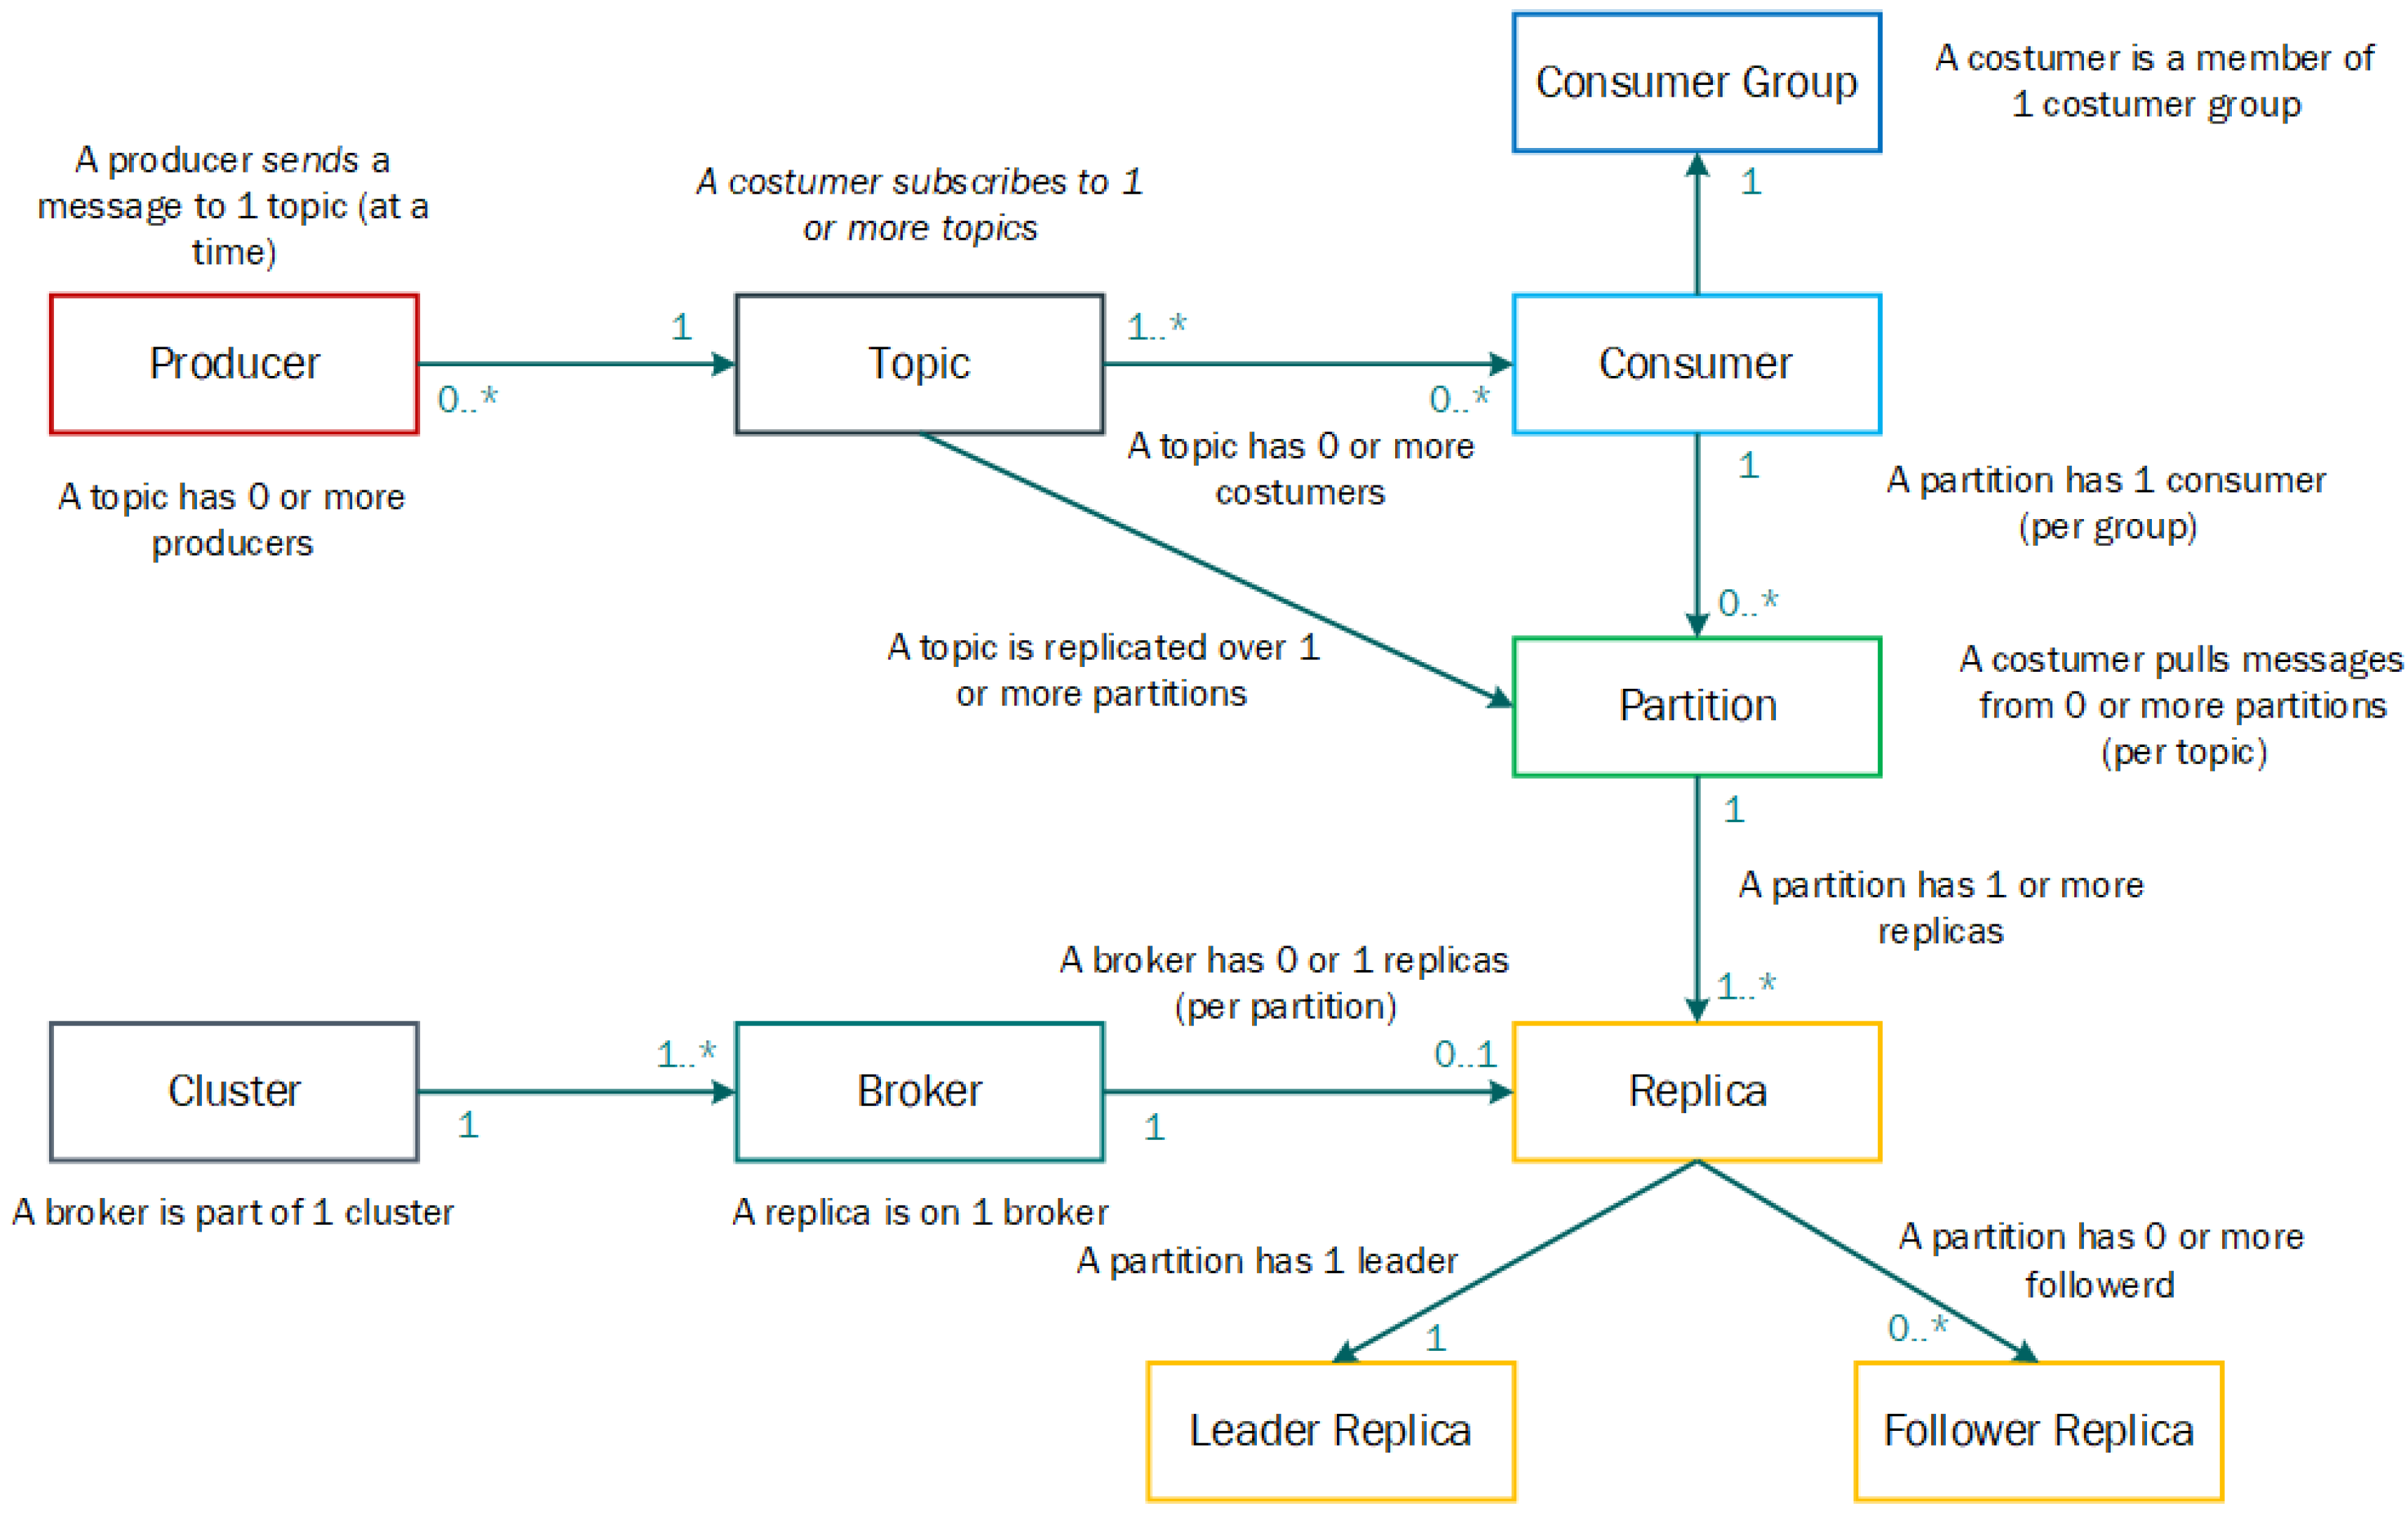
Apache Kafka offers eight different components: Topics, Producers, Consumers, Brokers, Partitions, Replicas, Leaders, and Followers. Hence, the concepts of each of them are presented [
31,
32]:
Topics: A topic is a category where records are published. Topics can be compared to database tables, where multiple subscribers can subscribe to the same topic [
31,
32].
Producers: Producers create new messages, and publish them to a specific topic. They are able to assign which partition within the topic the message will go to, by using a message key [
31,
32].
Consumers: Consumers label themselves with a consumer group name, and each record published to a topic is delivered to one consumer instance within each subscribing consumer group [
31,
32].
Brokers: A Kafka server is called a Kafka broker, receiving messages from producers, assigning offsets to them, and committing the messages to storage. Kafka can work as a cluster, employing multiple brokers to distribute and replicate the messages [
31,
32].
Partitions: A partition can be described as an “ordered, immutable sequence of records that is continually appended to a structured commit log” [
12]. The Kafka cluster will divide topics into partitions and replicate them to brokers [
31,
32].
Replicas: Topic replication is essential to design resilient and highly available Kafka deployments [
31,
32].
Leaders: Each partition is owned by a single broker, making sure that the follower partitions keep their records synchronized [
31,
32].
Followers: Followers serve as replicas for a partition, for, in the event that the leader disconnects, a follower is then promoted to leader [
31,
32].
Figure 6 showcases a perspective of the relationships between these components [
33].
4.1.5. Spark
Apache Spark is a Big Data tool that aims to process large datasets in a parallel and distributed way. It extends the MapReduce programming model popularized by Apache Hadoop, enabling the development of large data processing applications. In addition to the extended programming model, Spark also performs much better than Hadoop, reaching in some cases almost 100x higher performance [
32].
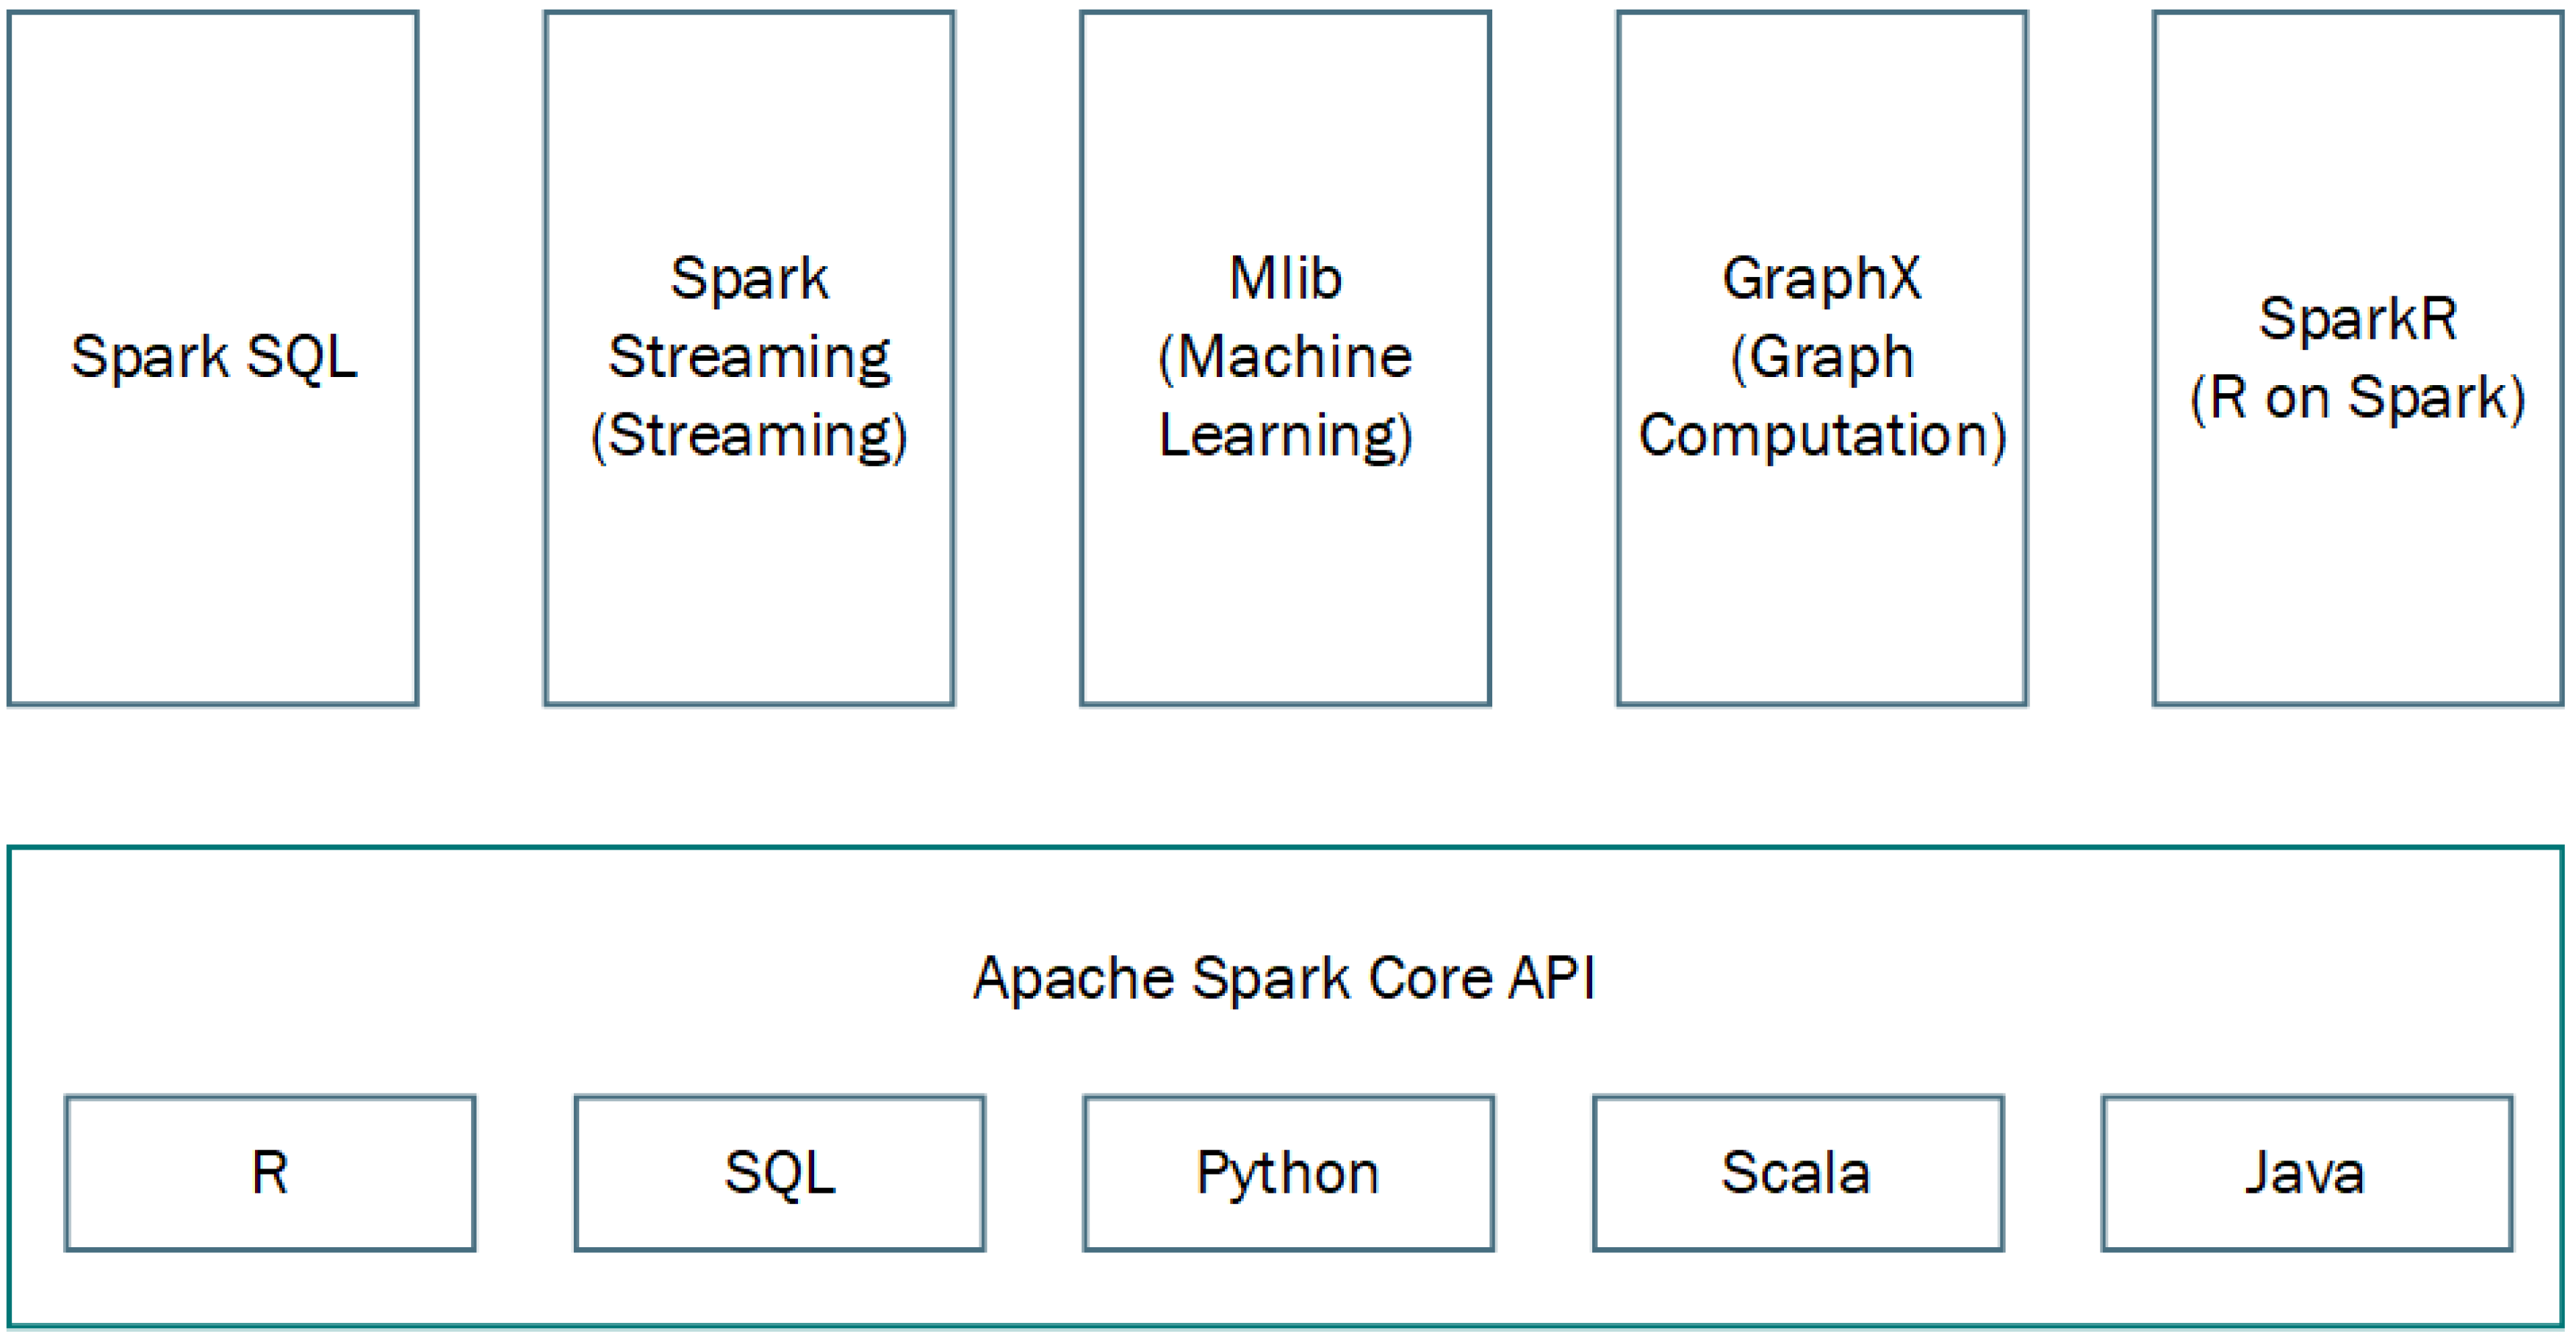
Another great advantage of Spark is that all components work integrated into the tool itself, such as Spark Streaming, Spark SQL, and GraphX, unlike Hadoop, where it is necessary to use tools that integrate with it but are distributed separately, like Apache Hive. Besides, another important aspect is that it allows programming in three languages: Java, Scala, and Python [
35].
Components
Spark has several components for different types of processing, all built on Spark Core, which is the component that provides basic processing functions, such as a map, reduce, filter, and collect. Among these, we highlight those present in
Figure 7:
4.2. Event Broker Tools Comparison
The following table presents the comparison of each Event Broker tool analyzed previously by presenting the main advantages and disadvantages of each selected tool.
4.2.1. Apache Flume
The tool presented above has several advantages, including low latency and the ability to support a wide variety of sources and sinks. In addition, they have low maintenance costs, support for large amounts of data (and, therefore, are adapted for Big Data). Although it is open source, it is well documented and contains many useful examples. Finally, and as a safety point for the user, it is based on streaming data streams and, therefore, allows backup paths for failed hops [
21,
41].
On the other side, it presents some disadvantages, as well. The most notable disadvantage, apart from the fact that it only supports unstructured data, is that Apache Flume gives no guarantee that incoming messages are unique. That is, there is a considerable chance of duplicate messages. Furthermore, this tool has vast problems with scalability, as well as the defined topology, which turned out to be much more complex than desired. Not least, although Apache Flume claims to be able to handle large amounts of data, the throughput decreases considerably as the data increases [
42].
4.2.2. Apache Sqoop
Of all the advantages found in the literature, for Apache Sqoop, there are a few that deserve to be highlighted. One of the most relevant is its ability to perform, in parallel, import and export actions. This feature will save the user a lot of time, as well as the computer processor. In addition, it has connectors for most database systems. In particular, with the Hadoop environment, this tool allows you to upload compressed data to Apache Hive [
41].
The disadvantages of this tool are very much related to the type of connection that the connectors make to the databases. The fact that it uses JDBC connections makes the process inefficient and lacks performance. In addition to this, some drawbacks were also found in the literature, such as the fact that it is a continuous process (it cannot be paused), and the export performance depends on the hardware configuration (memory, hard disk) of the database server. In addition, it can be slow because MapReduce is still used in backend processing, there is no graphical user interface (GUI) for ease of use, and it is only optimized for use within the Hadoop ecosystem [
43].
4.2.3. Solace PubSub+
Solace Pubsub+ has various advantages, such as the easy JavaScript code development, which uses existing Solace JavaScript API to cover all web interfacing. Moreover, all microservices and web clients use only one IP address for all requests, data delivery, and special functions (IP from the platform service). In addition, no specific developments are necessary for messaging, web connectivity, authentication, entitlement, or message recording (covered by platform). Therefore, the development efforts concentrate on main tasks (calculations and result presentation to web clients), so that 70% of the solution is immediately ready-to-go, proven, and tested. Using the “ONE Solution” results can be done in short and easy projects, which implies a short time to market, with low risk, low cost, and high transparency, with no need for the specific development of web services. In addition, microservices do not have to deal with the web; thus, there is High Fanout when it comes to messaging, which allows applications to receive exactly the information they want at a rate they can manage, all without being affected by the misbehavior of other applications. In short, the advantages are the Guaranteed Messaging, Low Latency, High Fanout, WAN Optimization, High-Speed Caching, Content Routing, Content Transformation, Legacy Integration, Legacy Migration, the use of one API, and the use of one Management Environment. Some Solace PubSub+ disadvantages identified are [
44,
45]: poor technical customers support and the tool limitation to only 5 message VPNs per customer [
44,
45].
4.2.4. Apache Kafka
There are various advantages of Apache Kafka [
46]. For instance, Apache Kafka allows senders and receivers to operate independently at separate times; supports with multiple programming languages, such as Java, C, Python, and front-end languages, such as HTML, CSS, and JavaScript; moreover, it employs data encryption both at rest and in transit, allows the processing of data from a variety of sources in real-time, and has minimal delay between input and feedback. In addition, Apache Kafka allows messages and data to integrate directly into applications using APIs, provides additional features and functionalities in the form of prepackaged integrations and plug-ins, and it actively monitors the status of work stations.
Apache Kafka is capable of handling high-velocity and high-volume data, it has replication features that enable the persistence of messages on a cluster [
46], and it has Low latency even when handling a large amount of messages [
47]. Moreover, Apache Kafka is resistant to failures or crashes within a cluster, the messages become easily accessible to anyone with access [
46], and it has capabilities, like replication and distributed partitioning, that allow Kafka’s distributed architecture [
47]. Finally, Apache Kafka is a scalable software product as it can handle an extremely large amount of messages [
46].
With the main strengths of Kafka presented, the disadvantages of Kafka vary, from the lack of management and monitoring tools, its high performance dependence on whether the message requires additional processing, that it can only match an exact topic name, and that it does not support wildcard topic selection, which can make many use cases unreliable. With the message size increase, the brokers and consumers will compress the messages, which leads to an increase of used memory. The tool performance may also be affected as the number of queues in a cluster increase. Finally, Kafka still lacks some message paradigms, such as request/reply or point-to-point queues [
47,
48].
4.2.5. Spark
The main advantages of Spark, besides ease of use [
49] and the support for advanced analytics, are: great capabilities of in-memory computing by allowing the data storage on RAM, enabling fast access to the data, and, consequently, accelerating the speed of analytics. Furthermore, it also features compatibility with Hadoop, working independently or combined, as well. These tools enable real-time stream processing, while being flexible to scale to a high degree. Its cost efficiency is better when compared with competitors, specially in large data centers [
35,
49,
50,
51,
52].
Some disadvantages of Spark were identified. These disadvantages include no automatic optimization process, a weak file management system, fewer algorithms, and lack of support of a multi-user environment [
35,
49].
4.3. Data Visualization
4.3.1. Microsoft Power BI
In July 2015, Microsoft launched the Power BI tool. This tool has a set combination of services, such as applications, connectors, and services to transform the raw data gathered into understandable, consistent, and visually interactive information. With this combination in mind, Microsoft main goal with Power BI is to serve the individuals users or an organization’s necessity [
53,
54,
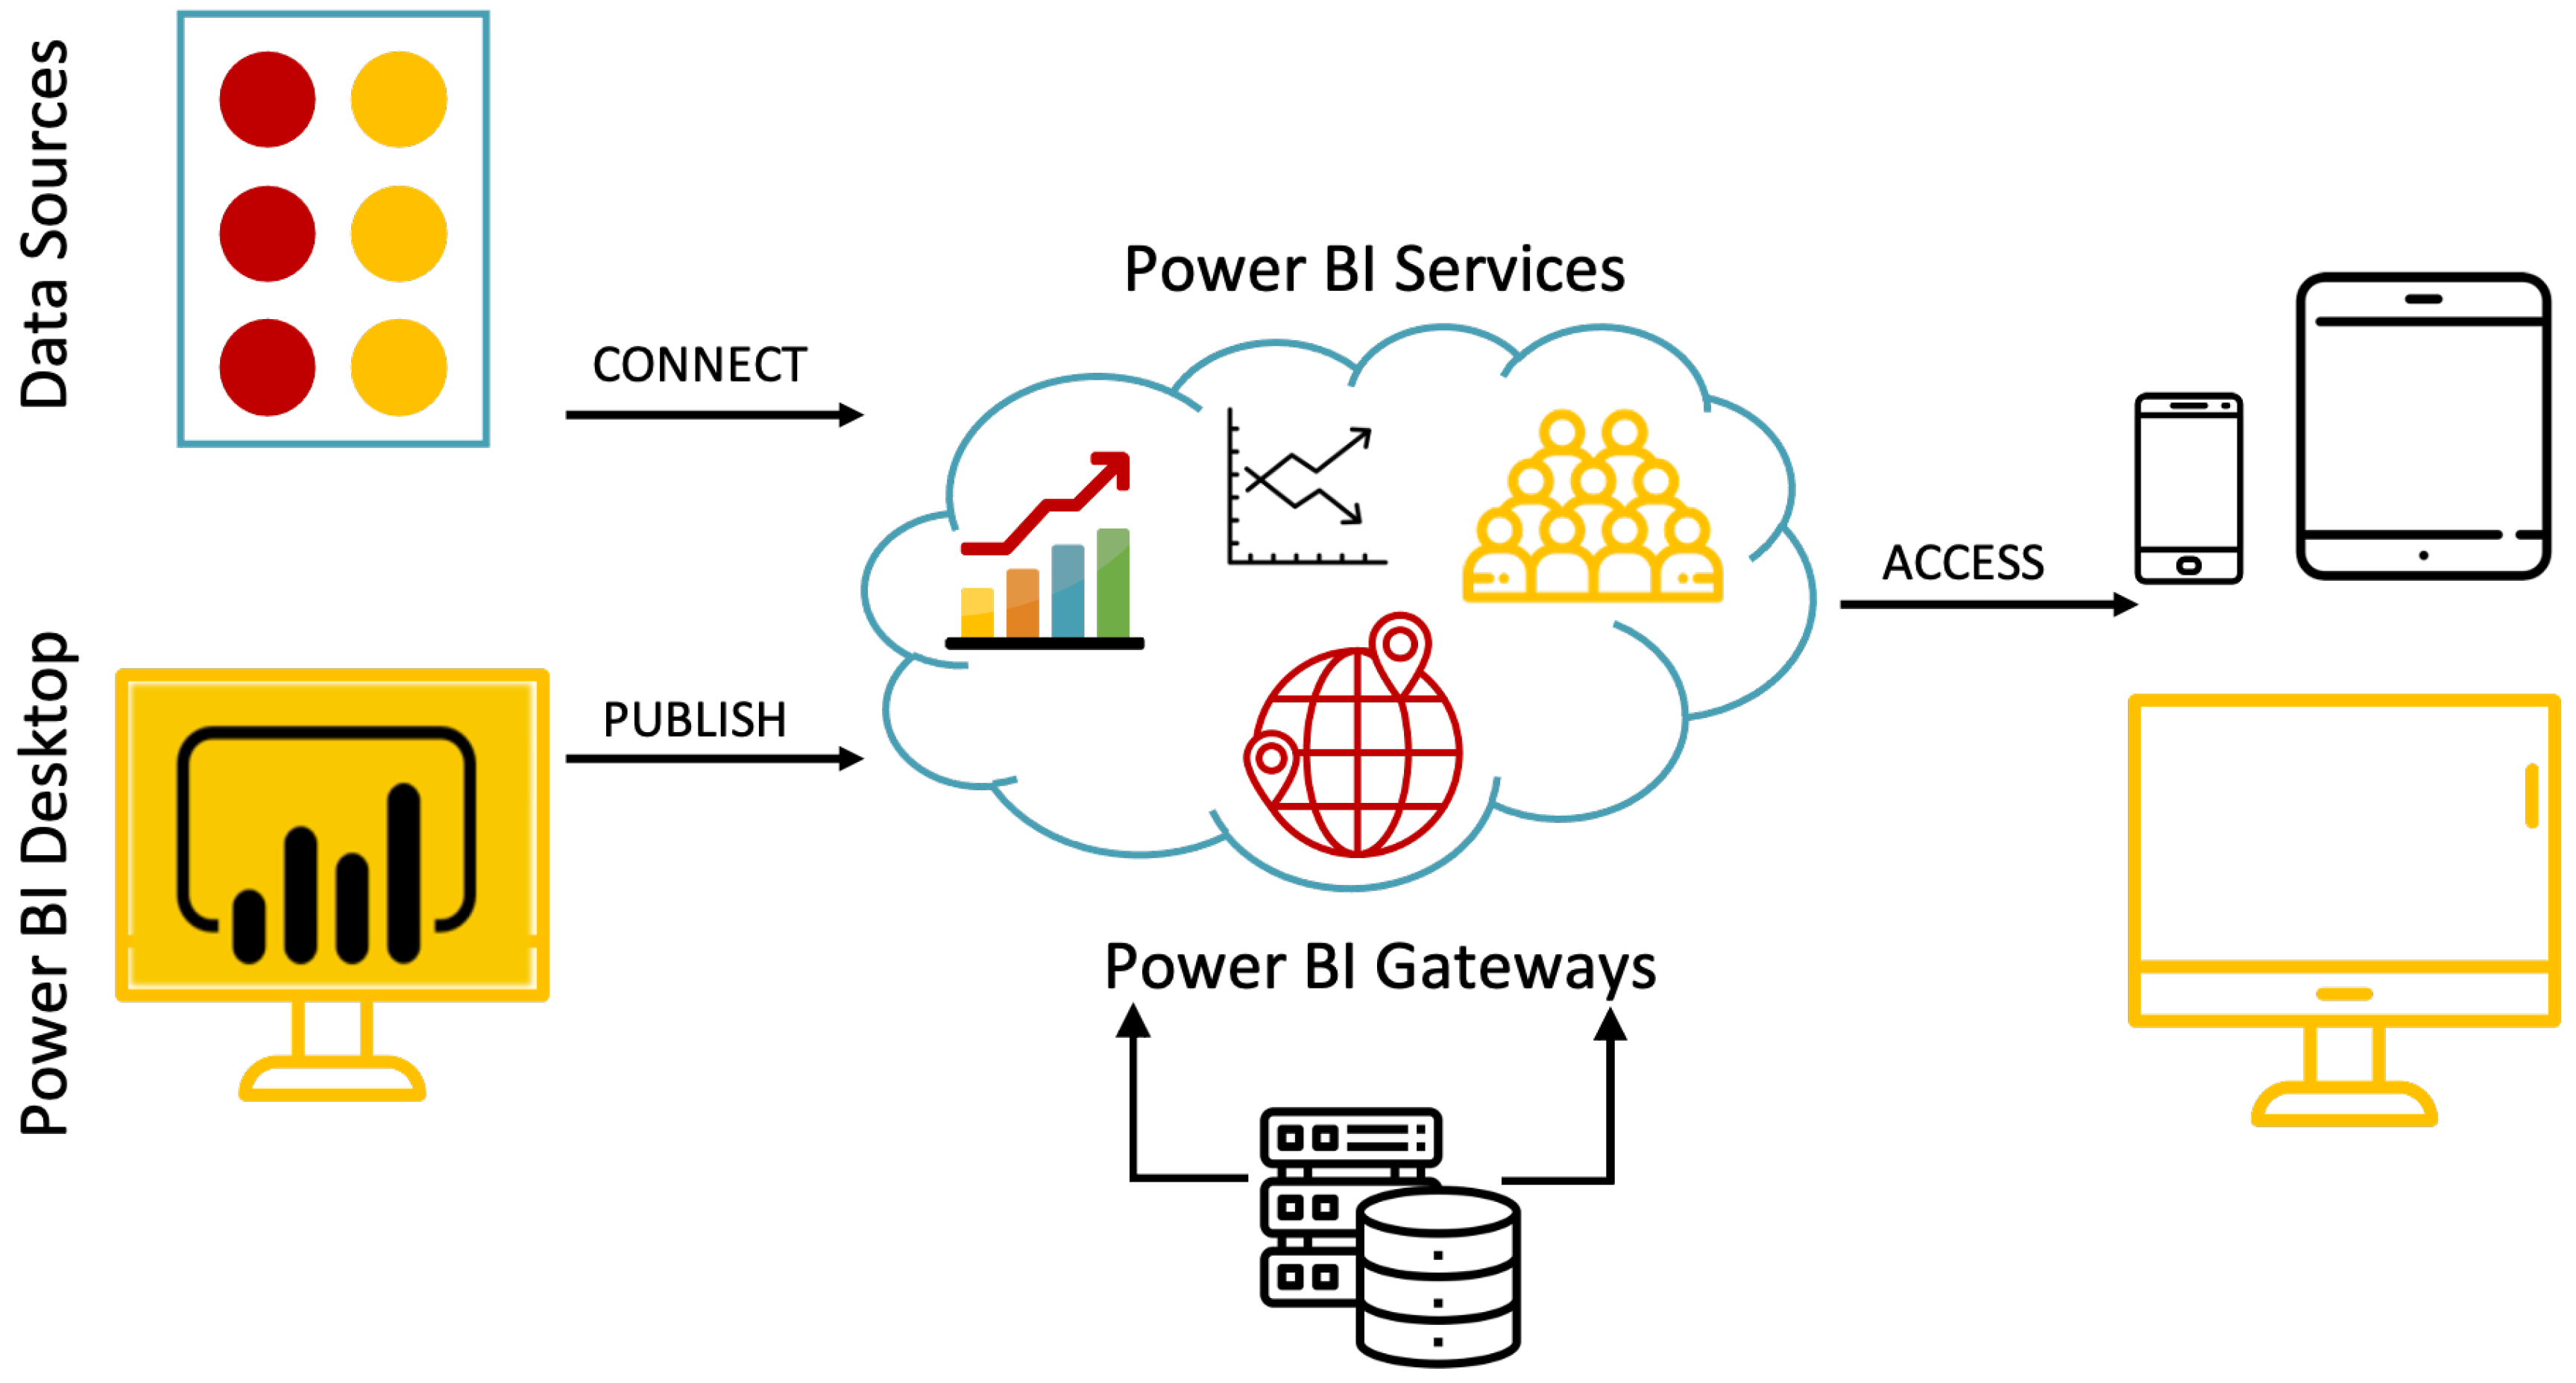
55]. Power BI can handle the connection of vast data sources, in a variety of formats that can be locally hosted or in a cloud.
The Microsoft tools have a huge variety of data source currently available to users to connect to Power BI. Those data sources vary from Excel, CSV/Text, JSON, XML file, or relational and non-relational databases. In terms of database, Power BI can handle data from Oracle, IBM DB2, MySQL, PostgresSQL, Sybase, Teradata, SAP HANA, and Azure SQL. In addition, it connects to SAP Business Warehouse Server, Facebook, and Github. Besides all these varieties of data sources, Microsoft is still working to add more data source connection to Power BI [
54].
One of the main advantages of Power BI is its capability in handling a customized interface, in which users can provide several parameters based on their role and access in the organization, or even the capabilities of data sharing between employees. Another great advantage of Power BI is the ability to create a dashboard and report all connected data sources, hence aggregating all the important data in one place for all users.
Figure 8 shows the basic architecture of Power BI functions.
Components
The Microsoft tool Power BI includes many components which have an important role on the platform. These components can be used in combination or individually. Thus, to better understand the platform itself it is fundamental to know all the Power BI components and how they work. The main Power BI components are:
Power Query: this component is responsible for the process of Extract, Transform, and Load (ETL) of data.
Power Pivot: this component handles the in-memory data modeling, to allow for quick aggregation, calculation, and efficient data storage.
Power View: this component provides the users with a highly interactive visualization tool, with a drag-and-drop interface to create and simplify the visualizations of data in Excel workbooks.
Power Map: this component is applied to Excel, and it is a three-dimensional (3D) model to visualize the data that helps users to understand the information in new and different ways.
Power Q&A: this component aims to identify the words entered and search where to find the answer.
Power BI Desktop: this component is responsible for making analysis effortlessly with the principal objective to create reports. With its drag-and-drop feature, it is easy to place content exactly in the place wanted on a flexible and fluid canvas.
Power BI Website: this component enables users to publish their reports from the Power BI desktop into the Power BI website. In addition, it allows users to create a wide variety of dashboard for their reports and share it with other users.
Power BI Mobile Apps: this component is a mobile solution both for Android and iOS, which is the main objective so as to provide the users with an interactive overview of their reports on mobile devices.
By organizing all of these components, one can realize that the benefits obtained from Power BI are as great as the number of components used together.
4.3.2. Tableau
Tableau is a software dedicated to providing information, as well as creating indicators to help in the decision-making process. Created in 2003, this tool aims for exploring and analyzing relational database and data-cubes. Thus, although it presents information, it is also considered a business intelligence tool [
57,
58,
59,
60].
Tableau has already won some distinction, such as awards, including “Best Overall in Data Visualization” by DM Review, “Best of 2005 for Data Analysis” by PC Magazine, and “2008 Best Business Intelligence Solution (CODiEaward)” by the Software & Information Industry Association [
61].
Components
Tableau Desktop: this component is a business intelligence application that supplies analysis based on a browser that anyone can use. In addition, it has a simple workflow: drag and drop. This makes it very user-friendly [
59].
Tableau Server: this component is an online and mobile business intelligence solution. Users use this component to publish the dashboard through Tableau Desktop and share these reports with their organization [
58].
Tableau Online: this component is a hosted account of Tableau Server. In addition, it can be used to publish dashboards through Tableau Desktop and share them with organizations and/or customers. It affords up to 100 GB of storage for the commercial license [
57].
Tableau Public: this is a highly interactive component for anyone who wants to report interactive data stories on the web. It is particularly helpful for someone who shares many of the data online [
59].
Tableau Reader: this is a free desktop version of the application that can be used to open and view visualizations built in Tableau Desktop [
57].
4.4. Data Visualization Tools Comparison
Next, is the comparison of each Data Visualization tool analyzed previously by presenting the main advantages and disadvantages of each selected tool.
4.4.1. Power BI
As mentioned, Power BI has many advantages, but here will be covered some of the tool’s main advantages. Firstly, it offers great affordability, i.e., for individual users, it has a free Desktop version. From the organizational perspective, it has the Power BI Cloud service which has much more services, including the capability for creating and publishing reports in the cloud service [
54]. The tools have a wide range of attractive data visualizations through its navigation panel, including flexible tiles. It has the capacity for retrieving data from multiple data sources at the same time, and enables dataset filtration, with great customization of dashboards and very detailed reports. DAX data analysis is another great advantage of Power BI, with a library that enables users to use operators and functions to create formulas and expressions in Power BI. It has ad-hoc reporting and analysis, trend indicators, and a good support center for help and feedback tools. Microsoft Power BI has a wide range of unpersonalized data visualization tools on the Microsoft Marketplace. These tools have an excellent capability of integration with other Microsoft tools, such as Excel, where users can easily filter, select, and/or slice data in Power BI report or dashboard and place it in Excel. Finally, Power BI has intelligent extraction and transformation of the data with smart visualization and accurate reports without memory and/or velocity constraints in analyzing data [
54].
On the other side, Power BI has some limiting disadvantages, such as for table relationship, which, in the case of simple table relationship in data models, the tool handles very well, whereas, when it finds a complex table relationship, the tools have strong difficulties in dealing with such complex relationships in the data model. Despite the tools’ amazing capabilities in data customization, it has weak configuration visuals, which often cannot optimize the visuals of the User Interface (UI), and the UI is cumbersome, making some times the scrolling dashboard not very intuitive. It has a lot of formulas that the user can use, but it is limited to using these formulas, i.e., it allows the creation of new data with formulas but only through DAX. Despite the DAX language efforts, it is not a very flexible language, although it allows users to have a multitude of personalized calculations. Other constraints faced by Power BI are the limitations in handling a very large quantity of data. The free version can deal with up to 10 GB of data. However, the premium version of the Power BI can handle up to 100 GB of data. Despite the tool’s little capability in cleaning data, it is not the best solution available in the market, as it sometimes requires that users use other tools to clean the data before using it in Power BI. Generally, it assumes the ingested data is already cleaned and is of high quality. Finally, Power BI has a huge amount of components, where it can be difficult to understand which ones are needed, and this may lead to more efforts to use the tools and the cost of ownership [
62].
4.4.2. Tableau
Tableau has numerous advantages. Some of its advantages are: ease of use, high performance, wide multitude of data source connections, remarkable visualization capabilities, easy access to different data sources, fast and very responsive dashboard, and it does not require any kind of technical or programming skills [
63,
64].
Some of the limitations faced by Tableau are its high cost, weak BI capabilities, weak after-sales support through their customer support center, and, sometimes, the requirement of costly intensive staff training.
5. Our Proposal: Hybrid Architecture
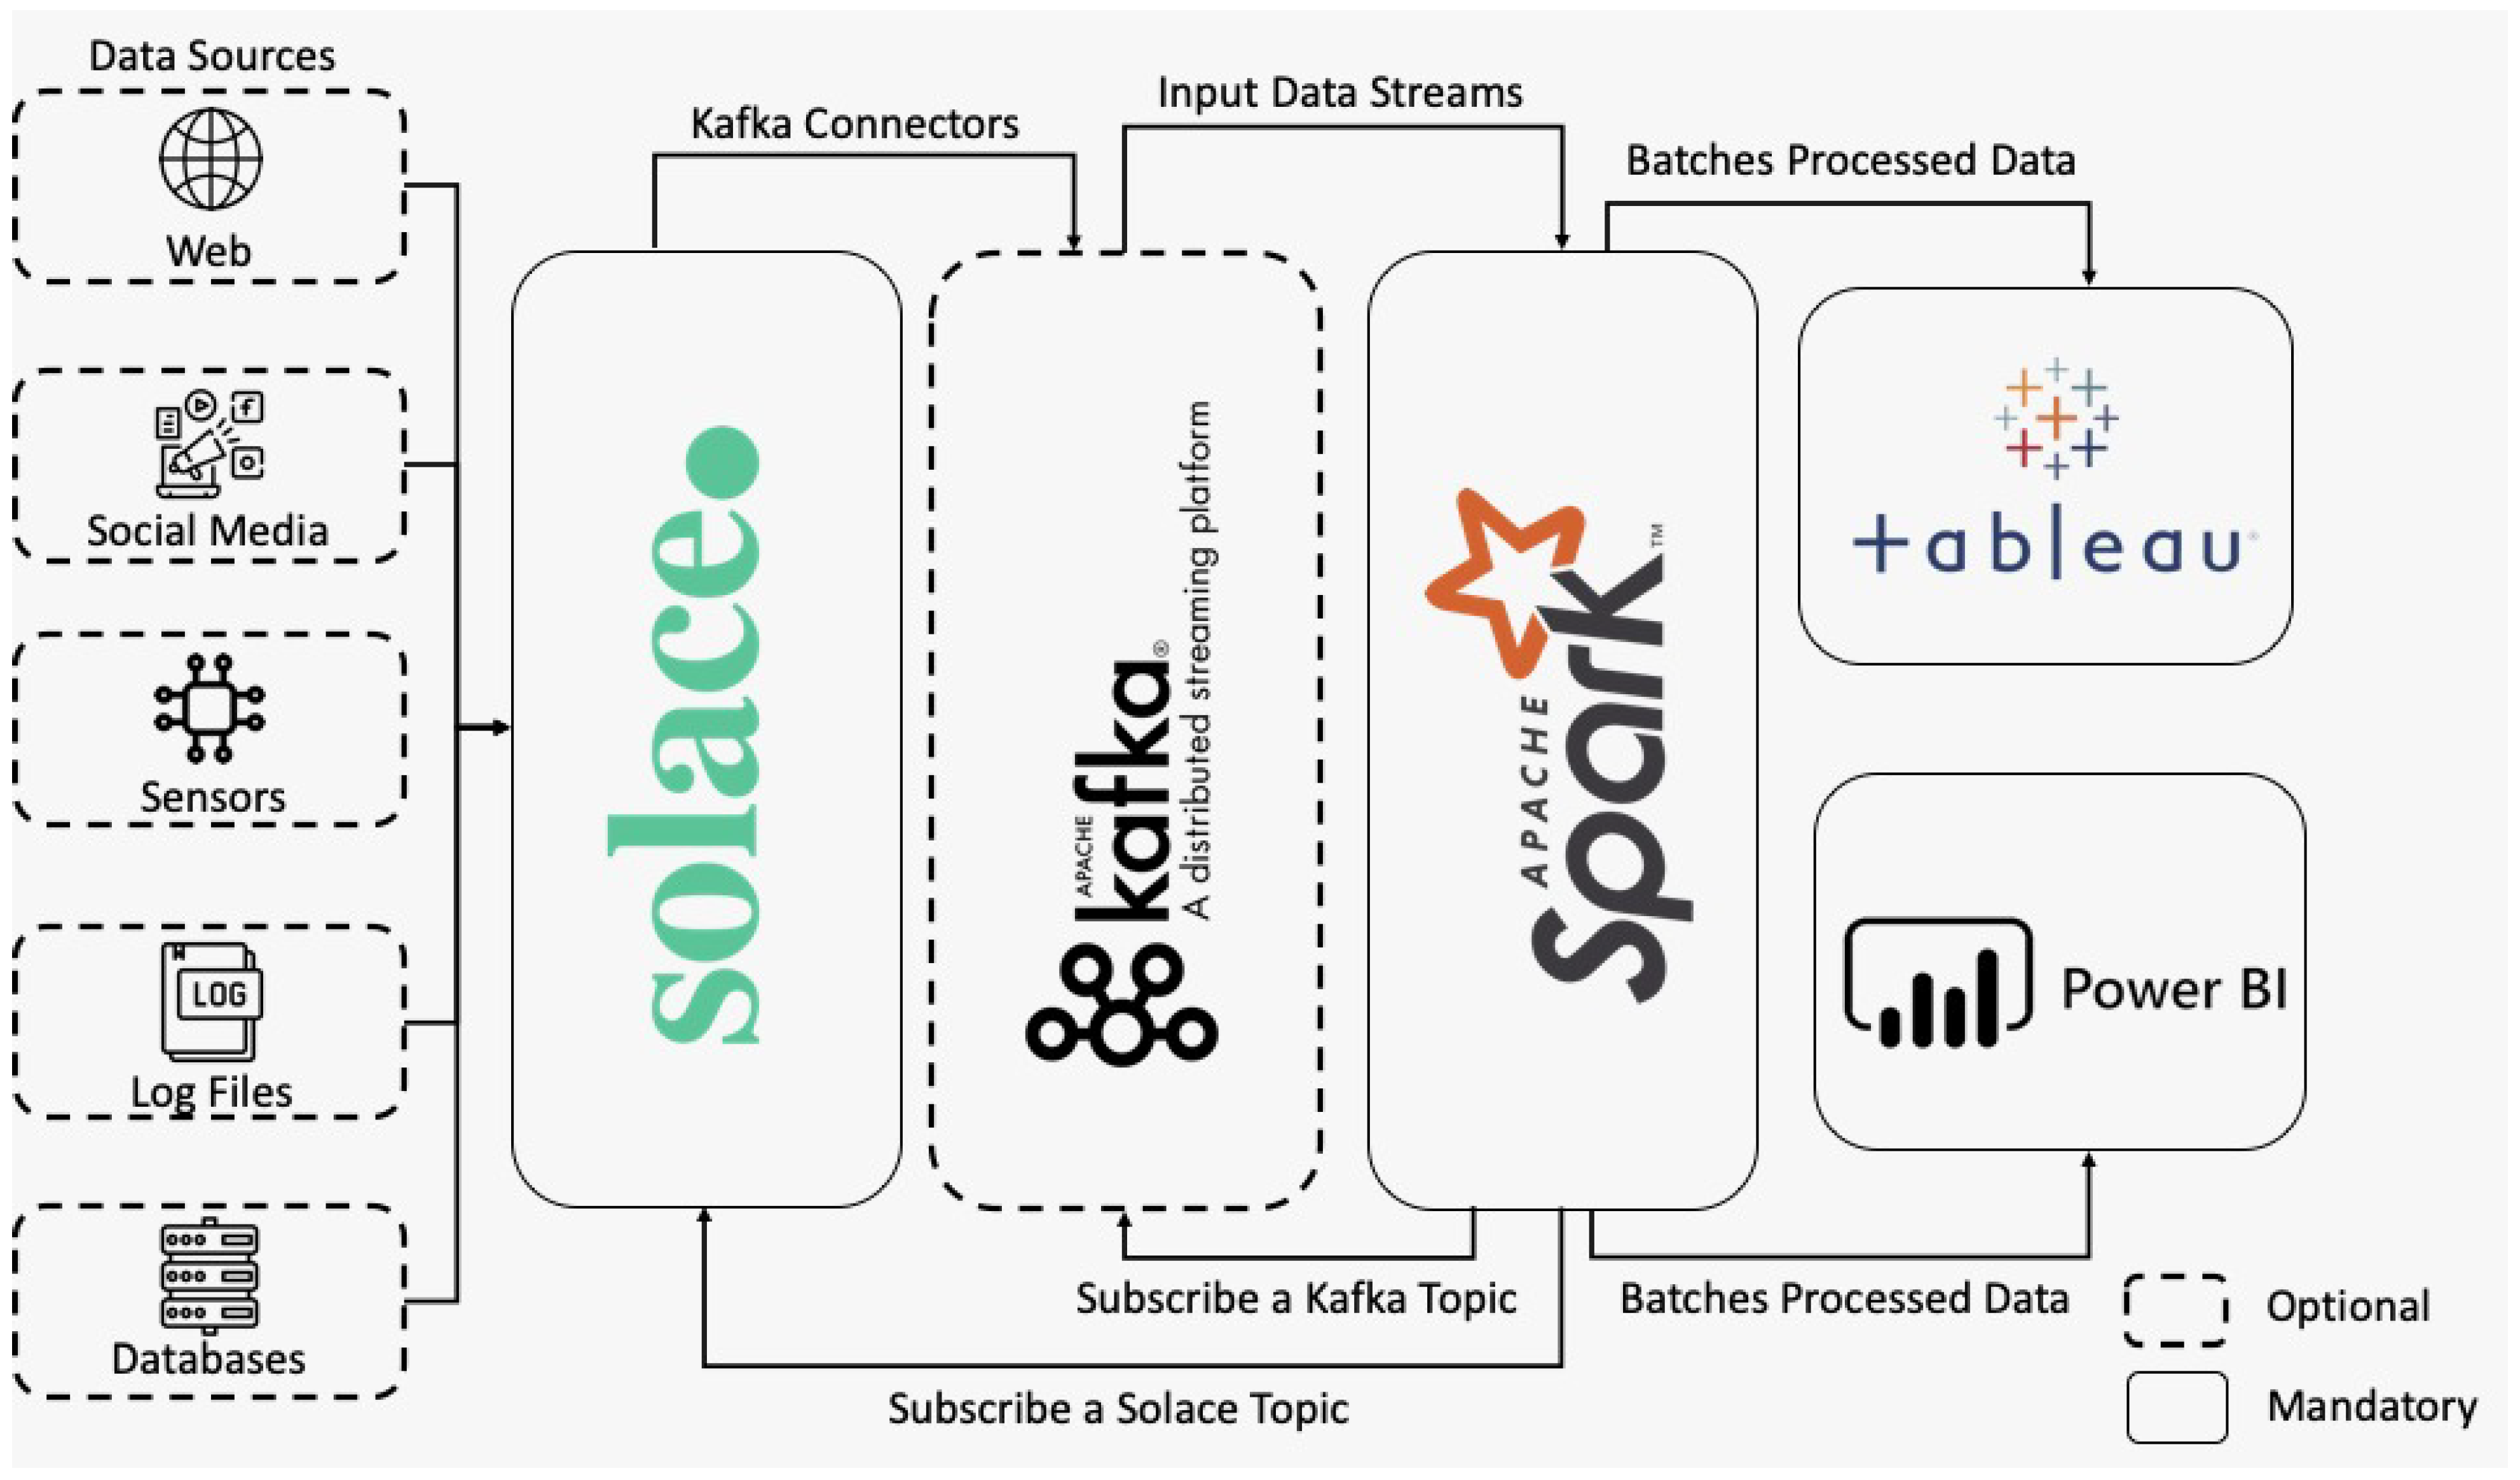
Taking into account all the characteristics, advantages, and disadvantages of each of the tools presented in the previous section, we propose a hybrid architecture in
Figure 9 that aims to get the best out of each of the tools and, thus, build an ecosystem capable of supporting the processing and visualization of information in real-time.
The first part of this architecture presents the data sources that can be of varied formats. Following our proposal, these data sources connect directly with Solace. The recommendation is to use the APIs developed by the company itself, as well as open protocols. This way, the architecture is not being restricted to using any technology.
In 2020, Solace launched a communication that discourages the use of Kafka. Since Solace PubSub+ distinguishes itself both in event broadcasting and event management, other technologies became dispensable in Solace’s perspective. However, this is only true for cases of transactional and operational use. Kafka still stands out in the event flow for storage and management of analytic use cases.
As the goal is to have an architecture as robust as possible, encompassing as many use cases as possible, the inclusion of Kafka makes sense. However, this new version of Solace PubSub+ is still in beta and is not as stable as desired. Moreover, Kafka is used by several organizations that have made investments to employ these technologies in production. With the architecture proposed here, this technology can not only be reused, but it also creates synergy between all components. Furthermore, for those who prefer simpler architectures and are starting their investment in these areas, the usage of Kafka according to this proposal is optional.
Moreover, the proposal is, in this case of including Kafka, to use connectors designed by Solace allowing the data connection between Solace and Kafka. Solace allows a wide variety of standard protocols to connect directly to Kafka (MQTT, AMQP, REST, WebSocket, and JMS).
The next step to data being in Solace and/or Kafka is to pass it to Apache Spark. That way, we are giving users the choice of which technologies they want to subscribe to the data. With the data available in Apache Spark, data analysis will then be executed in parallel and distributed.
Finally, there will be two data access zones on Tableau (Data Analysts) and Power BI (Common User—Employees). This way, costs can be reduced because Tableau is the most expensive software of the proposed architecture, as well as helping employees, since Power BI is very customizable and easy to understand and consult.
The presented architecture is innovative, as it not only represents a well-researched pipeline option for information processing, but adds hybridization on Kafka. Since Solace no longer supports the connection between Kafka, with the proposed architecture, users have the option of not divesting from their investment. Furthermore, as shown in
Figure 9, the usage of Kafka is optional, with all tasks intended for Kafka being also supported by Solace.
6. Discussion and Conclusions
CEP, also known as event or stream processing, is the usage of technology for querying data before storing it within a database or, in some cases, without ever being stored [
8].
A CEP system is aimed at solving the velocity problem of big data, while data comes as a stream of predefined events. The sliding window approach used by CEP systems ensures that only a portion of actual data simultaneously passes into the main memory, whereas the old events may be discarded or archived [
65]. This way, all the data does not have to fit into system memory, and the most recent events can still be efficiently analyzed [
9].
Multiple applications for CEP approaches include business activity monitoring, aiming at identifying problems and opportunities in their early stages; network sensors that monitor industrial facilities; and market data, such as stock and commodity prices, that need to be derived from several events and their relationships [
66].
CEP is mainly used to address latency requirements, where latency must be low, the volume of input events is high, and event patterns to be detected are complex, such as patterns based on temporal or spatial relationships [
8].
In this paper, multiple tools used for CEP are introduced and showcased, presenting their advantages and shortfalls. While Apache Spark and Apache Kafka are designed to implement streaming processing applications and processing large datasets, Microsoft Power BI and the Tableau Suite help transform data into appealing and intuitive information. This is just a small selection of tools available for CEP, with alternatives and complements available from major companies [
66]. Additional solutions for discussion include Amazon Kinesis Analytics, Apache Flink, Apache Samza, Apache Storm, Hadoop, Microsoft Azure Stream Analytics, and Oracle Stream Analytics [
8].
As for future work, it is expected to identify and showcase bleeding-edge technology in CEP, as well as how CEP may impact manufacturing and everyone’s daily life.
Author Contributions
Conceptualization, R.S. and N.L.; Methodology, R.S., R.M., A.M., C.A., N.L., and J.M.; software, R.M. and A.M.; investigation, R.S., R.M., A.M.; writing—original draft preparation, R.S. and N.L.; writing—review and editing, R.S., C.A., and N.L.; visualization, R.S., R.M., and A.M.; supervision, N.L. and J.M.; project administration, J.M.; funding acquisition, J.M. All authors have read and agreed to the published version of the manuscript.
Funding
This work is funded by “FCT—Fundação para a Ciência e Tecnologia” within the R&D Units Project Scope: UIDB/00319/2020. The grants of R.S., R.M., A.M., and N.L. are supported by the European Structural and Investment Funds in the FEDER component, through the Operational Competitiveness and Internalization Programme (COMPETE 2020). [Project n. 039479. Funding Reference: POCI-01-0247-FEDER-039479].
Institutional Review Board Statement
Not applicable.
Informed Consent Statement
Not applicable.
Data Availability Statement
Not applicable.
Acknowledgments
We thank the admninistrative staff of the University of Minho for their availability.
Conflicts of Interest
The authors declare no conflict of interest.
Abbreviations
The following abbreviations are used in this manuscript:
| AMQP | Advanced Message Queuing Protocol |
| API | Application Programming Interface |
| BI | Business Intelligence |
| CEP | Complex Event Processing |
| CSV | Comma Separated Values |
| DAX | Data Analysis Expressions |
| EDA | Event Driven architecture |
| ETL | Extract, Transform, and Load |
| FPGA | Field Programmable Gate Array |
| GUI | Graphical User Interface |
| HDFS | Hadoop Distributed File System |
| IoT | Internet of Things |
| IP | Internet Protocol |
| IT | Information Technology |
| JDBC | Java Database Connectivity |
| JMS | Java Message Service |
| JSON | JavaScript Object Notation |
| MQTT | Message Queuing Telemetry Transport |
| RAM | Random Access Memory |
| RDBMS | Relational Database Management System |
| RDD | Resilient Distributed Dataset |
| REST | Representational State Transfer |
| SAP | System Applications and Products |
| SQL | Structured Query Language |
| UI | User Interface |
| VPN | Virtual Private Network |
| XML | Extensible Markup Language |
References
- Lee, J.; Davari, H.; Singh, J.; Pandhare, V. Industrial Artificial Intelligence for industry 4.0-based manufacturing systems. Manuf. Lett. 2018, 18, 20–23. [Google Scholar] [CrossRef]
- Lu, Y. Industry 4.0: A survey on technologies, applications and open research issues. J. Ind. Inf. Integr. 2017, 6, 1–10. [Google Scholar] [CrossRef]
- Hou, C.K. Examining the effect of user satisfaction on system usage and individual performance with business intelligence systems: An empirical study of Taiwan’s electronics industry. Int. J. Inf. Manag. 2012, 32, 560–573. [Google Scholar] [CrossRef]
- Özdemir, V.; Hekim, N. Birth of Industry 5.0: Making Sense of Big Data with Artificial Intelligence, “The Internet of Things” and Next-Generation Technology Policy. OMICS J. Integr. Biol. 2018, 22, 65–76. [Google Scholar] [CrossRef] [PubMed]
- Chen, H.; Chiang, R.H.; Storey, V.C. Business intelligence and analytics: From big data to big impact. MIS Q. 2012, 36, 1165–1188. [Google Scholar] [CrossRef]
- Wu, E.; Diao, Y.; Rizvi, S. High-performance complex event processing over streams. In Proceedings of the ACM SIGMOD International Conference on Management of Data, Chicago, IL, USA, 27–29 June 2006; pp. 407–418. [Google Scholar] [CrossRef]
- Yasumoto, K.; Yamaguchi, H.; Shigeno, H. Survey of real-time processing technologies of iot data streams. J. Inf. Process. 2016, 24, 195–202. [Google Scholar] [CrossRef]
- DataBricks. What is Complex Event Processing? Available online: https://databricks.com/glossary/complex-event-processing/ (accessed on 20 October 2020).
- Liu, G.; Zhu, W.; Saunders, C.; Gao, F.; Yu, Y. Real-time Complex Event Processing and Analytics for Smart Grid. Procedia Comput. Sci. 2015, 61, 113–119. [Google Scholar] [CrossRef]
- Tawsif, K.; Hossen, J.; Raja, J.E.; Jesmeen, M.Z.H.; Arif, E.M.H. A Review on Complex Event Processing Systems for Big Data. In Proceedings of the 2018 Fourth International Conference on Information Retrieval and Knowledge Management (CAMP), Kota Kinabalu, Malaysia, 26–28 March 2018; Institute of Electrical and Electronics Engineers Inc.: New York, NY, USA, 2018; pp. 2–7. [Google Scholar]
- Babiceanu, R.F.; Seker, R. Big Data and virtualization for manufacturing cyber-physical systems: A survey of the current status and future outlook. Comput. Ind. 2016, 81, 128–137. [Google Scholar] [CrossRef]
- Confluent. What is Complex Event Processing? Guide to CEP. Available online: https://www.confluent.io/learn/complex-event-processing/ (accessed on 20 October 2020).
- Martinez, G. Research Methods for Business Students, 7th ed.; Pearson Education Limited: Essex, UK, 2016; p. 768. [Google Scholar]
- Solace. Solace Customers. Available online: https://solace.com/company/ (accessed on 20 October 2020).
- Haddaway, N.R.; Macura, B. The role of reporting standards in producing robust literature reviews. Nat. Clim. Chang. 2018, 8, 444–447. [Google Scholar] [CrossRef]
- Brandão, A.; Pereira, E.; Esteves, M.; Portela, F.; Santos, M.F.; Abelha, A.; Machado, J. A benchmarking analysis of open-source business intelligence tools in healthcare environments. Information 2016, 7, 57. [Google Scholar] [CrossRef]
- Wilson, E.J. The Relative Importance of Supplier Selection Criteria: A Review and Update. Int. J. Purch. Mater. Manag. 1994, 30, 34–41. [Google Scholar] [CrossRef]
- The Apache Software Foundation. Welcome to Apache Flume. 2020. Available online: https://flume.apache.org/ (accessed on 20 October 2020).
- Hoffman, S. Apache Flume: Distributed Log Collection for Hadoop; Packt Publishing Ltd.: Birmingham, UK, 2013. [Google Scholar]
- Vohra, D. Apache flume. In Practical Hadoop Ecosystem; Springer: Berlin/Heidelberg, Germany, 2016; pp. 287–300. [Google Scholar]
- The Apache Software Foundation. Flume 1.9.0 User Guide. Available online: https://flume.apache.org/FlumeUserGuide.html (accessed on 20 October 2020).
- Srinivasa, K.; Siddesh, G.; Srinidhi, H. Apache Flume. In Network Data Analytics; Springer: Berlin/Heidelberg, Germany, 2018; pp. 95–107. [Google Scholar]
- The Apache Software Foundation. Sqoop. 2019. Available online: https://sqoop.apache.org/ (accessed on 20 October 2020).
- Vohra, D. Using apache sqoop. In Pro Docker; Springer: Berlin/Heidelberg, Germany, 2016; pp. 151–183. [Google Scholar]
- Arvind. Apache Sqoop Graduates from Incubator. 2012. Available online: https://blogs.apache.org/sqoop/entry/apache_sqoop_graduates_from_incubator (accessed on 20 October 2020).
- What is Solace PubSub+ Platform? Available online: https://docs.solace.com/Solace-PubSub-Platform.html (accessed on 20 October 2020).
- PubSub+ Platform. Available online: https://solace.com/pt/products/platform/ (accessed on 20 October 2020).
- PubSub+ Event Portal. Available online: https://solace.com/pt/products/portal/ (accessed on 20 October 2020).
- Apache Kafka-Introduction. Available online: https://kafka.apache.org/intro (accessed on 20 October 2020).
- Garg, N. Apache Kafka; Packt Publishing: Birmingham, UK, 2013. [Google Scholar]
- Shapira, G.; Palino, T.; Sivaram, R.; Narkhede, N. Kafka: The Definitive Guide; O’Reilly Media, Incorporated: Sebastopol, CA, USA, 2017. [Google Scholar]
- Confluent Inc. Introduction to Kafka. Available online: https://docs.confluent.io/platform/current/kafka/introduction.html (accessed on 20 October 2020).
- Carter, M. Apache Kafka Architecture: A Complete Guide. Available online: https://www.instaclustr.com/apache-kafka-architecture/ (accessed on 20 October 2020).
- Chellappan, S.; Ganesan, D. Practical Apache Spark: Using the Scala API; Apress: Berkeley, CA, USA, 2018. [Google Scholar]
- Frampton, M. Mastering Apache Spark; Packt Publishing: Birmingham, UK, 2015. [Google Scholar]
- Gour, R. Apache Spark Ecosystem—Complete Spark Components Guide. 2018. Available online: https://data-flair.training/blogs/apache-spark-ecosystem-components/ (accessed on 20 October 2020).
- Penchikala, P. Big Data Processing with Apache Spark—Part 1: Introduction. 2015. Available online: https://www.infoq.com/articles/apache-spark-introduction/ (accessed on 20 October 2020).
- The Apache Software Foundation. MLlib|Apache Spark. Available online: https://spark.apache.org/mllib/ (accessed on 20 October 2020).
- The Apache Software Foundation. GraphX—Spark 3.0.2 Documentation. Available online: https://spark.apache.org/docs/latest/graphx-programming-guide.html (accessed on 20 October 2020).
- The Apache Software Foundation. SparkR (R on Spark). Available online: https://spark.apache.org/docs/latest/sparkr.html (accessed on 26 February 2021).
- John, T.; Misram, P. Data Lake for Enterprises; Packt Publishing Ltd.: Birmingham, UK, 2017; p. 596. [Google Scholar]
- EDUCBA. Introduction to Apache Flume. 2020. Available online: https://www.educba.com/apache-flume/ (accessed on 6 January 2021).
- Beyond Corner. Features and Limitations of Sqoop. Available online: https://beyondcorner.com/learn-apache-sqoop/features-and-limitations-of-sqoop-and-whats-new-in-sqoop2/ (accessed on 7 January 2021).
- Gartner Peer Insights. Solace HIP-Enabling Technologies. Available online: https://www.gartner.com/reviews/market/hip-enabling-technologies/vendor/solace/reviews?reviewRating=3&sort=-helpfulness (accessed on 9 February 2021).
- AWS Marketplace. Solace PubSub+ Software Message Broker Standard Edition Reviews. Available online: https://aws.amazon.com/marketplace/reviews/reviews-list/B077GRGL8Q (accessed on 9 February 2021).
- JavaTpoint. Apache Kafka Advantages and Disadvantages. Available online: https://www.javatpoint.com/apache-kafka-advantages-and-disadvantages (accessed on 7 February 2021).
- DataFlair. Advantages and Disadvantages of Kafka. Available online: https://data-flair.training/blogs/advantages-and-disadvantages-of-kafka/ (accessed on 25 February 2021).
- Koutanov, E. Apache Kafka in a Nutshell. Available online: https://medium.com/swlh/apache-kafka-in-a-nutshell-5782b01d9ffb (accessed on 7 January 2021).
- KnowledgeHut. What are the Advantages & Disadvantages of Apache Spark? Available online: https://www.knowledgehut.com/blog/big-data/apache-spark-advantages-disadvantages (accessed on 26 February 2021).
- Harg, A. Spark Features-Apache Spark Tutorial. Available online: https://intellipaat.com/blog/tutorial/spark-tutorial/spark-features/ (accessed on 26 February 2021).
- DataFlair. Features of Apache Spark. Available online: https://data-flair.training/blogs/apache-spark-features/ (accessed on 26 February 2021).
- Joseph, R. What is Spark?|Tutorial by Chartio. Available online: https://chartio.com/learn/data-analytics/what-is-spark/ (accessed on 26 February 2021).
- Ferrari, A.; Russo, M. Introducing Microsoft Power BI; Microsoft Press: Redmond, WA, USA, 2016. [Google Scholar]
- Microsoft. Microsoft Power BI. Available online: https://powerbi.microsoft.com/pt-pt/ (accessed on 16 September 2020).
- Rad, R. Pro Power BI Architecture; Springer: Berlin/Heidelberg, Germany, 2018. [Google Scholar]
- Technologies, M. What Is Power BI Architecture? A Complete Tutorial. 2018. Available online: https://mindmajix.com/power-bi-architecture (accessed on 20 October 2020).
- Tableau. Business Intelligence and Analytics Software. Available online: https://www.tableau.com/ (accessed on 16 September 2020).
- DataFlair Team. 10 Features of Tableau to Smoothen Your Data Visualization Tasks. Available online: https://data-flair.training/blogs/tableau-features/ (accessed on 16 September 2020).
- Murray, D.G. Tableau Your Data!: Fast and Easy Visual Analysis with Tableau Software; John Wiley & Sons: Hoboken, NJ, USA, 2013. [Google Scholar]
- Murphy, S.A. Data visualization and rapid analytics: Applying tableau desktop to support library decision-making. J. Web Librariansh. 2013, 7, 465–476. [Google Scholar] [CrossRef]
- Chabot, C.; Stolte, C.; Hanrahan, P. Tableau Software. 2003, Volume 6. Available online: https://www.tableau.com/resource/business-intelligence (accessed on 20 October 2020).
- Price, E.; Lachev, T. Applied Microsoft Power BI: Bring Your Data to Life! 5th ed.; Prologika: Atlanta GA, USA, 2020. [Google Scholar]
- SaM Solutions. Pros and Cons of Tableau Software for Data Visualization. Available online: https://www.sam-solutions.com/blog/tableau-software-review-pros-and-cons-of-a-bi-solution-for-data-visualization/ (accessed on 7 January 2021).
- AbsentData. Advantages and Disadvantages of Tableau. Available online: https://www.absentdata.com/advantages-and-disadvantages-of-tableau/ (accessed on 7 January 2021).
- JBoss Community Documentation. Complex Event Processing. Available online: https://docs.jboss.org/drools/release/6.2.0.CR3/drools-docs/html/DroolsComplexEventProcessingChapter.html (accessed on 19 November 2020).
- AIMultiple. Complex Event Processing: How It Works, Use Cases & Tools. Available online: https://research.aimultiple.com/cep/ (accessed on 19 November 2020).
| Publisher’s Note: MDPI stays neutral with regard to jurisdictional claims in published maps and institutional affiliations. |
© 2021 by the authors. Licensee MDPI, Basel, Switzerland. This article is an open access article distributed under the terms and conditions of the Creative Commons Attribution (CC BY) license (https://creativecommons.org/licenses/by/4.0/).


 ,
, 


