Article

Assessment of Imaging Protocol and Patients Radiation Exposure in Computed Tomography Colonography

1
Radiology Department, King Fahad Medical City, P.O. Box 59042, Riyadh 11525, Saudi Arabia
2
Radiology and Medical Imaging Department, College of Applied Medical Sciences, Prince Sattam bin Abdulaziz University, P.O. Box 425, Alkharj 11942, Saudi Arabia
3
Medical Imaging Department, King Saud Medical City, Riyadh 12746, Saudi Arabia
4
Radiology Department, King Khalid Hospital, Ministry of Health, P.O. Box 1825, Hail 66262, Saudi Arabia
5
Centre for Nuclear and Radiation Physics, Department of Physics, University of Surrey, Guildford GU2 7XH, UK
6
Centre for Biomedical Physics, Sunway University, Subang Jaya 47500, Malaysia
*
Author to whom correspondence should be addressed.
Appl. Sci. 2021, 11(11), 4761; https://doi.org/10.3390/app11114761
Submission received: 14 April 2021 / Revised: 15 May 2021 / Accepted: 19 May 2021 / Published: 22 May 2021
(This article belongs to the Special Issue Nuclear and Radiation Physics in Medicine)

Abstract

:
In the screening and identifying of colon and rectum malignancy, computed tomography colonography (CTC) is a highly effective imaging technique, albeit patients receiving a significant effective dose. Accordingly, patient dose evaluation is an important need, seeking to ensure benefits outweigh the projected cancer risk. Objective: For CTC procedures carried out in the Radiology Department, Medical Imaging Operation Services, King Fahad Medical City (KFMC), evaluation is done using the current American College of Radiology (ACR) imaging protocol and concomitant patient-effective doses. Study is carried out on a sample size of 55 CTC procedures, involving 25 males (45%) and 30 females (55%). The patients were classified as follows: two groups based on CT machine; four groups based on the applied protocol; and three groups based on the procedure results. All procedures were carried out using two machines, the products of two different vendors (a GE Healthcare DISCOVERY CT 750 HD 64 slices dual-energy scanner and a Philips Brilliance CT 64 slices scanner). The overall mean, standard deviation (SD), median, and range of the effective dose (in mSv) were 11.57 ± 7.75, 9.25 (2.17–31.93). Automatic tube current modulation (ATCM) shows a significant increase in CTDIvol up to 69% and effective dose (mSv) up to 95% than the manual tube current (mA) compared to the standard protocol. The CT protocol variation results in a three-fold variation in patient-effective dose. The technologist role is crucial in selecting a noise reference based on patient weight and adjusting tube current per slice to avoid overexposure during ATCM protocol.

1. Introduction

Colorectal cancer (CRC) is the second most common cancer among Saudi adults (12.2%), being the most prevalent cancer among males, ranking third for females (10.4%) [1]. CRC is responsible for a relatively high fraction of the worldwide cancer incidence, increasing in developed countries where it ranks as the third most common cancer (1.8 million new cases annually), and the second greatest cause of death (0.9 million annually) [2], in good part due to late diagnosis [3]. On the whole, CRC is a lifestyle disease with greater prevalence in men than women, increasing with age, obesity, alcohol consumption, low quality diet involving unhealthy food, and smoking [4]. It has been estimated that up to 40% of CRC cases are due to heritable factors [5]. In the USA and Western Europe, as a result of preventive measures and effective treatment, the incidence and mortality from CRC has decreased by 3% annually [6,7]. In Saudi Arabia, Alsanea et al. [8] have reported the prevailing percentages for the different CRC stages: localized disease 22.2%, regional disease 47.4%, distant disease 25.9%, and unknown 4.6%, the five-year survival rate being 63.3% for localized disease, 50.2% for the regional stage, and 14.7% for the distant stage. Thus, in Saudi Arabia as found elsewhere, it is both evident and unsurprising that early CRC detection increases the opportunity for improved outcome from treatment [8]. The Saudi Arabian Ministry of Health (MOH) actively encourages those of over 50 years of age to participate in CRC screening tests, to be repeated every 5 to 10 years. One of the options available for average-risk cancer individuals is the low radiation dose computed tomography colonography (CTC) technique [9]. CRC screening methods consist of invasive techniques such as colonoscopy and flexible sigmoidoscopy (FS). In contrast, the non-invasive procedures consist mainly of imaging procedures such as barium enema, CTC, and capsule endoscopy. CTC, also called CT enema, virtual colonoscopy, or CT pneumocolon, can identify colon and rectum malignancy (colorectal polyps) and other diagnostic findings in symptomatic and asymptomatic individuals [9,10]. de Haan et al. [11] have provided estimated sensitivity and specificity values for CTC versus colonoscopy procedures, specifically for the detection of polyps or adenomas: (≥6 mm lesion) sensitivity of 75.9% versus 82.9%, specificity 94.6% versus 91.4%; (≥10 mm lesion) sensitivity of 83.3% versus 87.9%, specificity 98.7% versus 97.6%. An extensive study of 1233 individuals shows CTC and colonoscopy sensitivities for detecting polyps of 10 mm or more of 94% and 88% respectively [12], while another study, using an ultra-low dose protocol (10 mAs) for CTC, shows sensitivity and specificity for detection of ≥5 mm polyps of 94% and 84% respectively [13]. Radiation dose to patients during radiographic procedures is one of the public concerns. Therefore, there is a need for providing accurate information regarding patient dose and associated risk. Moreover, cancer risk is overwhelmingly estimated based on study of population survival in the aftermath of the August 1945 atomic bombings of Hiroshima and Nagasaki [14]. The Saudi Arabia government is seeking to provide diagnostic reference levels (DRL) for radiation doses arising from medical imaging [15]. CTC radiation dose can be one-half of that from the conventional abdomen-pelvis CT, with high natural contrast deference between the colonic soft tissue, gas, tagged feces, and fluids. The American College of Radiology (ACR) has recommended that the adult relative radiation level (RRL) for CTC should not exceed 10 mSv per procedure while for an average weight patient of 70 to 90 kg. The American Association of Physicists in Medicine (AAPM) note that the volume computed tomography dose index (CTDIvol) range should be 3 to 6 mGy [12,16]. The CTC procedure is considered a frequent screening program, for asymptomatic diagnostic purpose, follow-up, or surveillance tool after surgical resection of CRC [17]. Therefore, as a low radiation dose protocol (screening protocol) the exposure factors needs to be optimized and justified according to the patient situation [18,19]. A study shows that an optimized screening protocol can reduce the effective dose significantly compared to a general daily practice protocol, with a life-time cancer risk of 0.14% being estimated for a 50-year-old individual exposed to CTC radiation dose [20]. Today, manufacturers provided many options to reduce the radiation dose to the patient, automatic tube current modulation (ATCM) being one such example, justifying the number of photons (mA) according to patient size [18]. Iterative reconstruction technique (IRT) is yet another technique to reduce the tube current, providing less image noise and a more extended threshold without degrading the image quality [21]. Good professional practice is also a leading factor in reducing radiation dose without constraining optimum coverage of the CTC procedure [22]. Previous studies of patient-effective dose during CTC have shown patient doses ranging from 2.3 to 9.8 mSv per procedure [18,19,23], the wide variation pointing to the likelihood that patients might be subject to unnecessary radiation risk. Thus it is crucial that investigation be made of patient exposure to ensure the procedure is optimized. This study evaluates the current imaging protocol at King Fahad Medical City (KFMC) and radiation dose, following guidance of the American College of Radiology (ACR).

2. Materials and Methods

2.1. Population

In this study, conducted over the period January 2017 to June 2019, all CTC procedures were reviewed retrospectively (via the hospital information system, HIS, the radiological information system, RIS, and the picture archiving and communication system, PACS). The study sample size is 55 procedures, 25 males (45%), and 30 females (55%). The mean, standard deviation, and range of the patient age (years) were 57.96 ± 13.6 (24–83), 16.3% of the cohort being below 50 years of age. The mean ± sd and range of patient weight (kg) is 76 ± 22 (50–120). The patients in this study were classified in several ways: (i) into two groups based on the CT machine; (ii) four groups based on the applied protocol, and; (iii) three groups based on the procedure results. The researchers obtained Institutional Review Board (IRB) approval from the ethics and research committee at KFMC (No: FWA00018774). The patients in this study, all adults, were referred to the radiology department as a result of the usual clinical criteria. The CTC procedure clinical indications are screening, limited colonoscopy, colonoscopy contraindication, or known cancer/follow up.

2.2. CT Equipment

The CTC procedures were carried out at KFMC, in carrying out each procedure using one of two machines, each the product of a different vendor (specifically, a GE Healthcare DISCOVERY CT 750 HD 64 slices dual-energy scanner and a Philips Brilliance CT 64 slices scanner). KFMC is a significant medical entity in Saudi Arabia, the estimated annual number of in- and out-patients being 30,000 and 500,000 respectively (KFMC statistics, 2019). ACR criteria were followed in evaluating the protocol and patient safety measures. The CT machine features are presented in Table 1.

2.3. CTC Protocol

Patients with a justified request form for CTC procedures were included in this study, being instructed to follow the preparation procedure, including: avoiding all high-fiber food for at least 72 h before the procedure and taking 100 mL of Gastrografin with water on the day before the CTC procedure. On the CT scan day, the specialist will check the patient precaution points and provide a clear explanation about the procedure. The patient should then remove any metallic object. At the CT table, the patient colon will be adequately inflated through the rectum by room air or carbon dioxide (CO2). The CTC scan is carried out in the supine and prone position during which time the patient is requested to hold their breath. The CTC imaging acquisition parameters are provided in Table 1, with the GE manufacturer recommendations according to the guidance of the AAPM [16].

2.4. Radiation Dosimetry

Medical physics tests of the radiation dose report system in the CT console have been made, ensuring the accuracy of the reported radiation dose values. In this study, the radiation dose is evaluated per procedure, obtaining the dose-length product (DLP) (in mGy.cm), and per slice by the volume computed tomography dose index, CTDIvol (in mGy). The total effective dose was calculated according to the International Commission on Radiological Protection (ICRP) by multiplying the DLP by the abdominal and pelvis conversion factor f to obtain a value in mSv.mGy−1.cm−1 [24], as follows:
E   ( mSv ) = D L P ( m G y . c m ) × f
The cancer risk for the entire CTC procedure is calculated by multiplying the effective dose by the cancer risk factor (5.5 × 10⁻² Sv−1) [24].

3. Results and Discussion

CTC dose was assessed for 55 patients presenting with a range of clinical indications, using two helical scanners and varying imaging protocols, as in Table 1. Similar exposure parameters were used for the CT machines, with slight change in the tube current-time product (mAs) and use of the adaptive statistical iterative reconstruction technique (ISRT). Both parameters (mAs and ISRT) impact the dose reduction during CT imaging while maintaining diagnosable images. The dose reduction is considered to be important, with radiogenic risk from the imaging procedure conservatively assumed to be linearly related with the dose received, other influencing factors being held constant (age, dose per procedure, organ sensitivity). CTC was performed for different clinical indications using four imaging protocols: supine and one decubitus, supine, two decubiti, auto tube current, and routine (manual), as illustrated in Table 2. The mean ± SD, median, and range of (tube current (in mA) and (CTDIvol (in mGy) radiation dose has been calculated for two decubiti according to the imaging protocol. This variation in CT protocol results in an up to three-fold variation in patient-effective dose (Table 2).
The effective dose from supine and two decubitus protocol CRC give the greatest value (31.6 mSv), exceeding that of the routine protocol (9.6 mSv). The effective dose in supine and two decubitus protocols are attributed to the high tube current used in this protocol, ranging from 300 to 450 mA per CTC procedure compared to the other three imaging protocols. The median and mean values for all patients groups are closely similar, suggesting asymmetrical distribution of the dose values for supine and two decubitus and routine CTC protocols. Conversely, for supine and one decubitus and auto tube current (mA) protocols, the dose values are skewed, with many CTDIvol (mGy) values at the higher end. Table 3 shows the image acquisition parameter and radiation dose values according to the manufacturer and the tube current mode. Automatic tube current modulation (ATCM) shows a significant increase in CTDIvol (mGy) (69%) and effective dose (mSv) (95%) than the manual tube current (Table 3). ATCM is established on the basis of attenuation of the radiation during image acquisition in order to adjust for disparities in patient anatomy while maintaining the image quality, reducing unnecessary exposure. In contrast, patient dose resulting from the application of ATCM are two times that of the standard protocol (Table 3). Söderberg and Gunnarsson [25] have reported that ATCM may reduce the dose during CT procedures by up to 60% while maintaining image quality. However, the potential dose reduction depends on the proper choice of imaging factors and images’ standard quality [26]. In the Philips CT machine, the noise level can be adjusted to obtain image contrast based on patient size. ATCM is activated using Dose Right, automatic current selection (ACS), to get acceptable image quality by variation in tube current around the patient, and the z-direction. For this, technologist intervention is necessary.
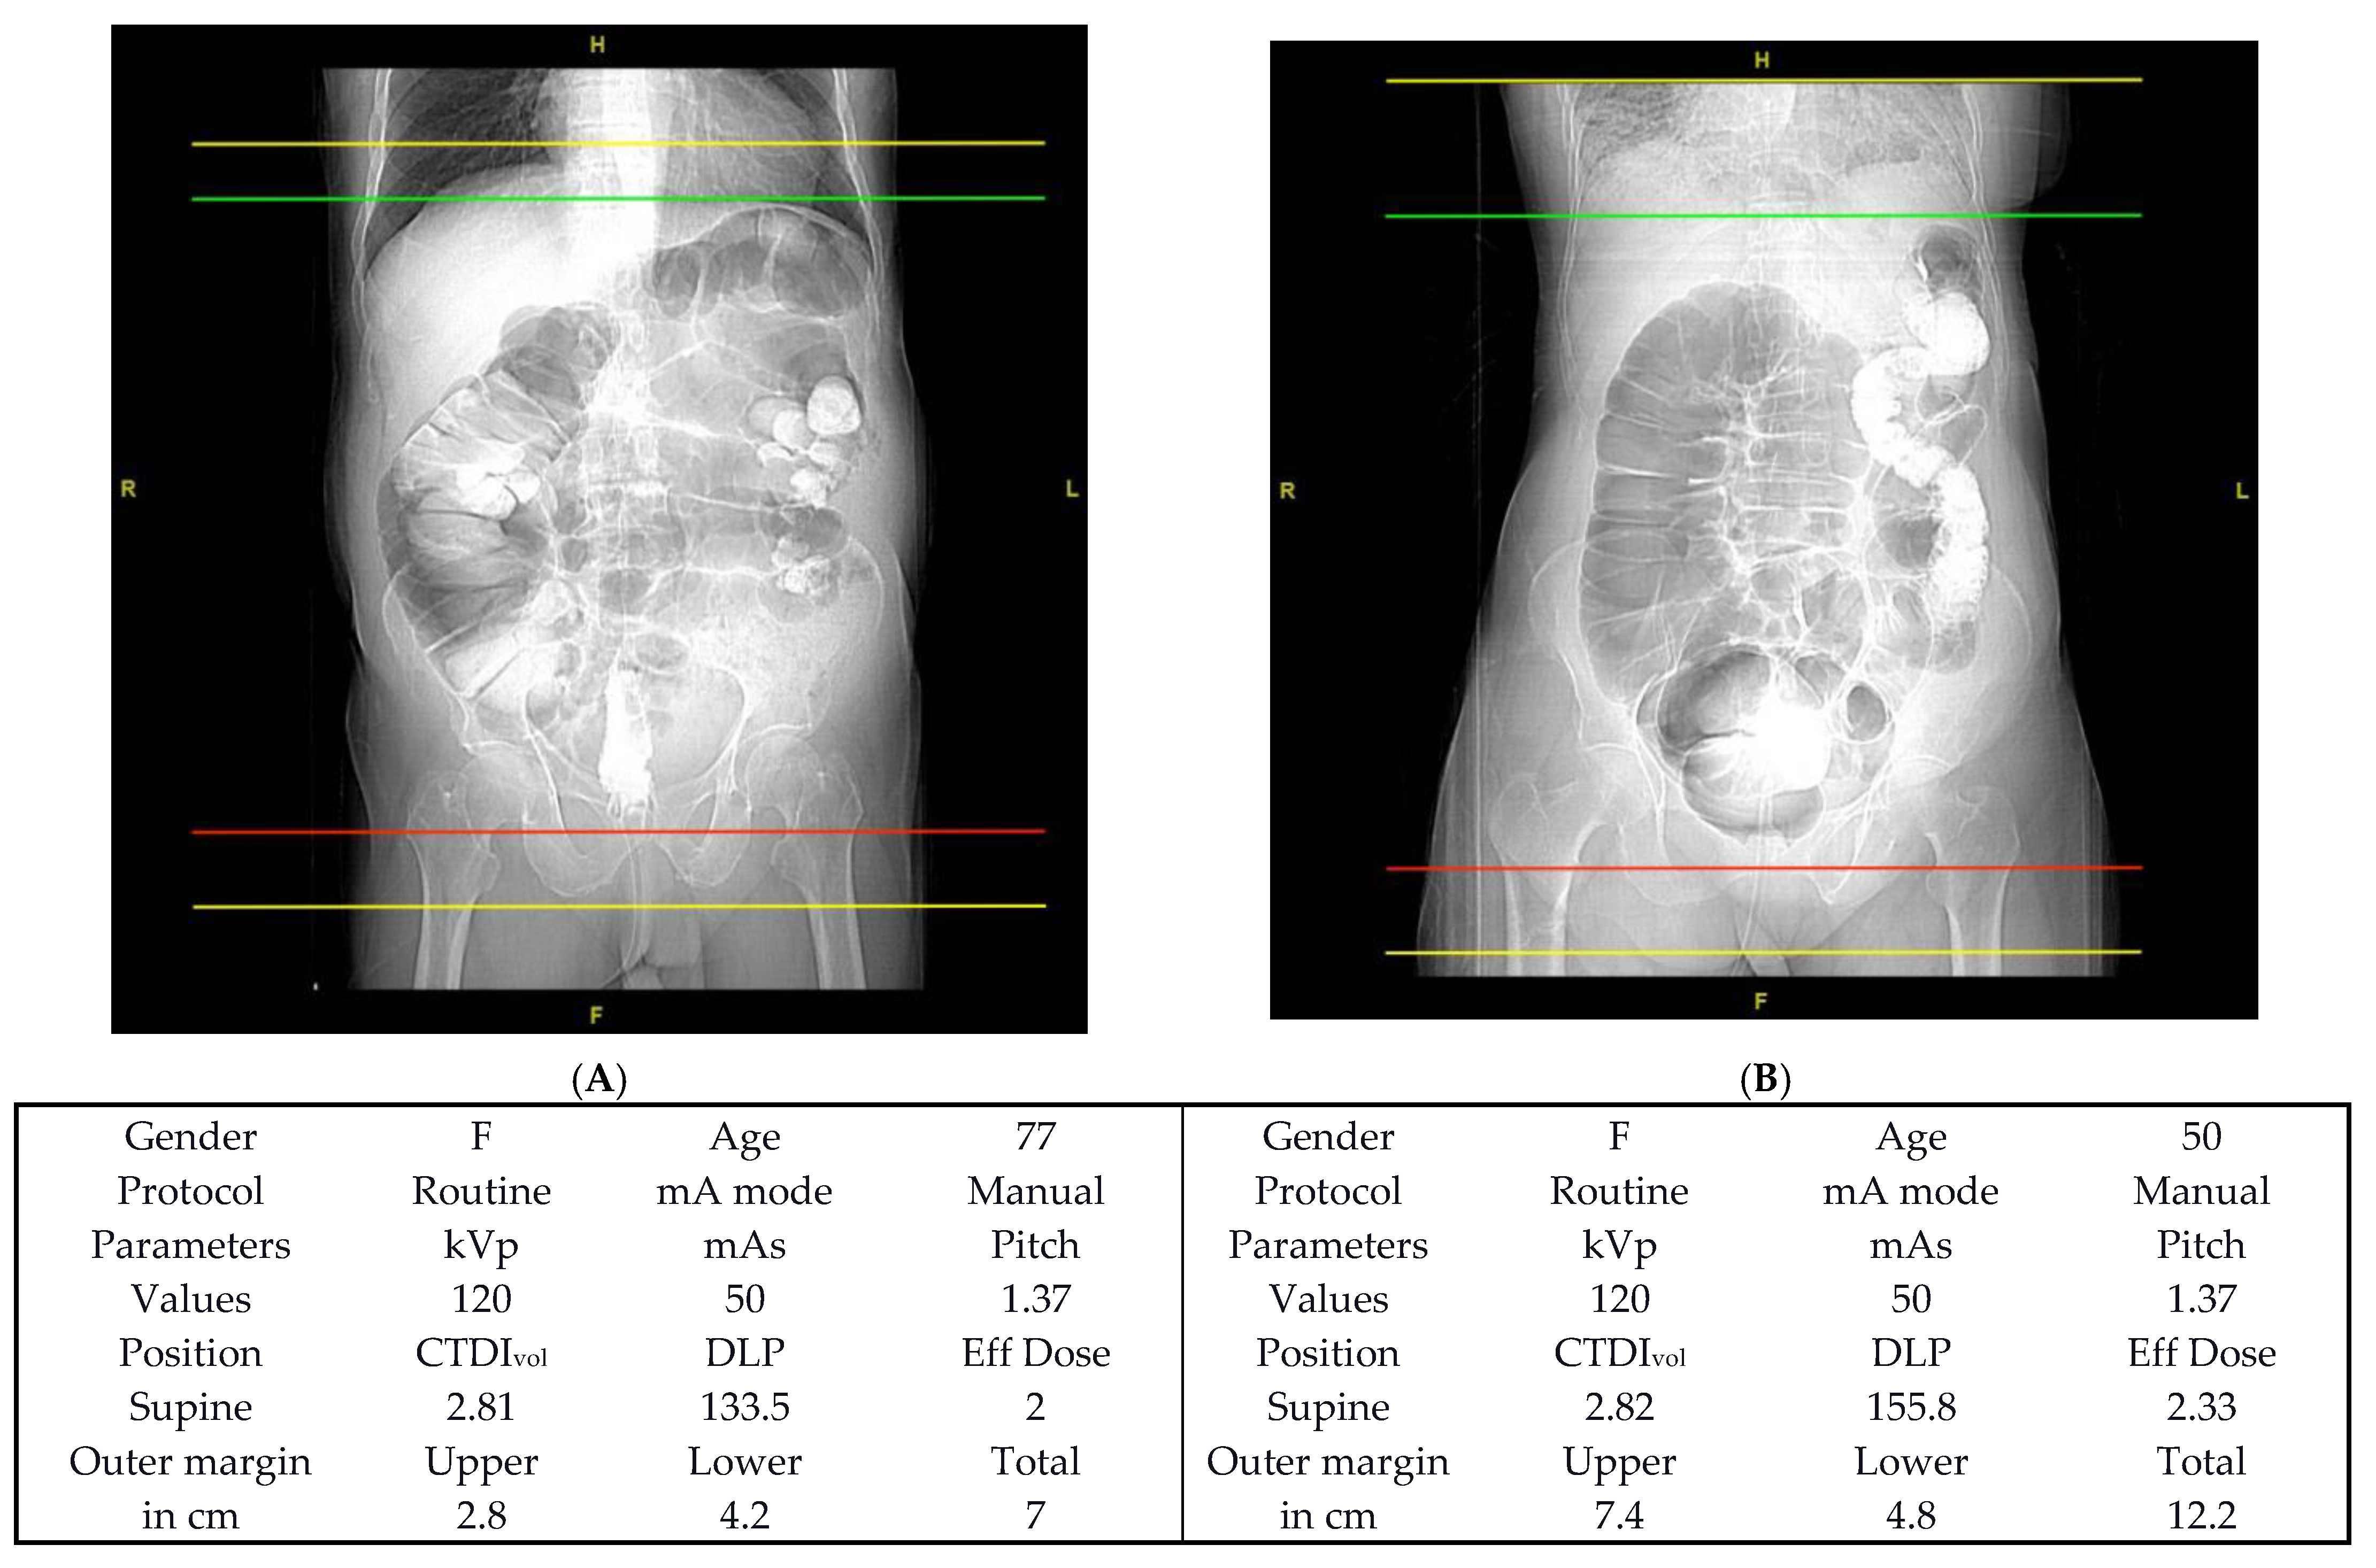
The mAs per CT slice need proper adjustment since drift from the initial setting overtime is expected [26,27]. In comparison with the GE CT machine, the ATCM sustains a similar noise level during image acquisition. A reference image from a standard phantom is needed, using GE AutomA 3D has z-axis (AutomA) and angular modulation (SmartmA), with the mA being changed for each quadrant during every rotation [28]. To avoid overexposure the technologist role is crucial in selecting a noise reference based on patient weight [29]. From the results presented in Table 3A,B, the ATCM may not be adjusted by the technologist, which leads to a higher radiation dose. Figure 1A shows direct relationship between tube current (mA) and the CTDIvol (mGy) and effective dose (mSv). CTDIvol and effective dose increase with tube current value. According to the ACR recommendation, the standard effective dose per procedure is 10 mSv. The American Association of Physicist in Medicine (AAPM) recommends a 3.0 to 6.0 mGy range of CTDIvol for an average sized patient (70–90 kg) (AAPM, 2011). The AAPM recommended the CTDIvol value of 2–4 mGy and 5–9 mGy according to patient weight ranges, 50–70 kg and 90–120 kg, respectively. Figure 1B shows the relation between the CTIDvol (mGy) and the DLP (mGy.cm) per CTC procedure. Wide variation is observed in DLP (mGy.cm) value as CTDIvol increases (mGy). Both dose descriptors are patient dose indices that calculate patient dose per slice volume and per procedure, respectively. Although patient doses differ according to patient size, in agreement with current study, previous studies have shown that patient dose can fluctuate by as much as a factor of two through patient size for a similar type of CT procedure to obtain radiographic images of comparable quality. Smith-Bindman and Miglioretti [30] reported a variation in patients’ doses ranging from 10 to 100 fold variances in DLP (mGy.cm) for CT procedures acquired for the typical clinical indication. In fact, after accounting for patient weight and body mass index, a profound—and unacceptable—variation in these measures remained. Most of the dose variation is due to variation in the adoption of multiphase protocols, larger scanning regions, or higher dose settings without awareness of the resulting dose burden these choices create. Thus, without considering patient weight, we can greatly improve the way of conducting CT simply by assessing CTDIvol and DLP. Figure 1B: The relation between the CTDIvol (mGy) and the DLP (mGy.cm), wide variation in DLP value as CTDIvol increases. (According to AAPM the CTDIvol (mGy) value according to the patient weight is 2–4 mGy for (50–70 kg), 3–6 mGy for (70–90 kg) and 5–9 mGy for (90–120 kg) [31]. In seeking to optimize patient dose consistent with sufficient image quality and with DLP depending proportionally on scan length, precise selection of scan length is important. Figure 2 illustrates the patient-effective dose (mSv) and CTDIvol (mGy) using the same parameter factors for patients in the supine position. The steps for the first three patients were found to provide optimum anatomical coverage while conversely the anatomical range situation for the last patients four and five was less favorable, the latter registering greater effective doses due to an associated need for wider variation in exposure parameters. As expected, compared to those of average body mass index (BMI, kg/m2) of 18–24.9, patient doses are greater for obese patients [32]. Figure 3A,B, show for two patients with the same scan parameters a 16.5% difference in effective doses, a matter arising from anatomical coverage, the yellow line indicating scan coverage, the green line delineating the upper part of the colon, and the red line the lower level. Figure 3A shows optimum anatomical coverage while Figure 3B indicates poor choice of anatomical coverage. An increase of scan length due to the extension of the anatomical coverage beyond necessary increases the dose per procedure (DLP, mGy.cm), also the CTDIvol (mGy).
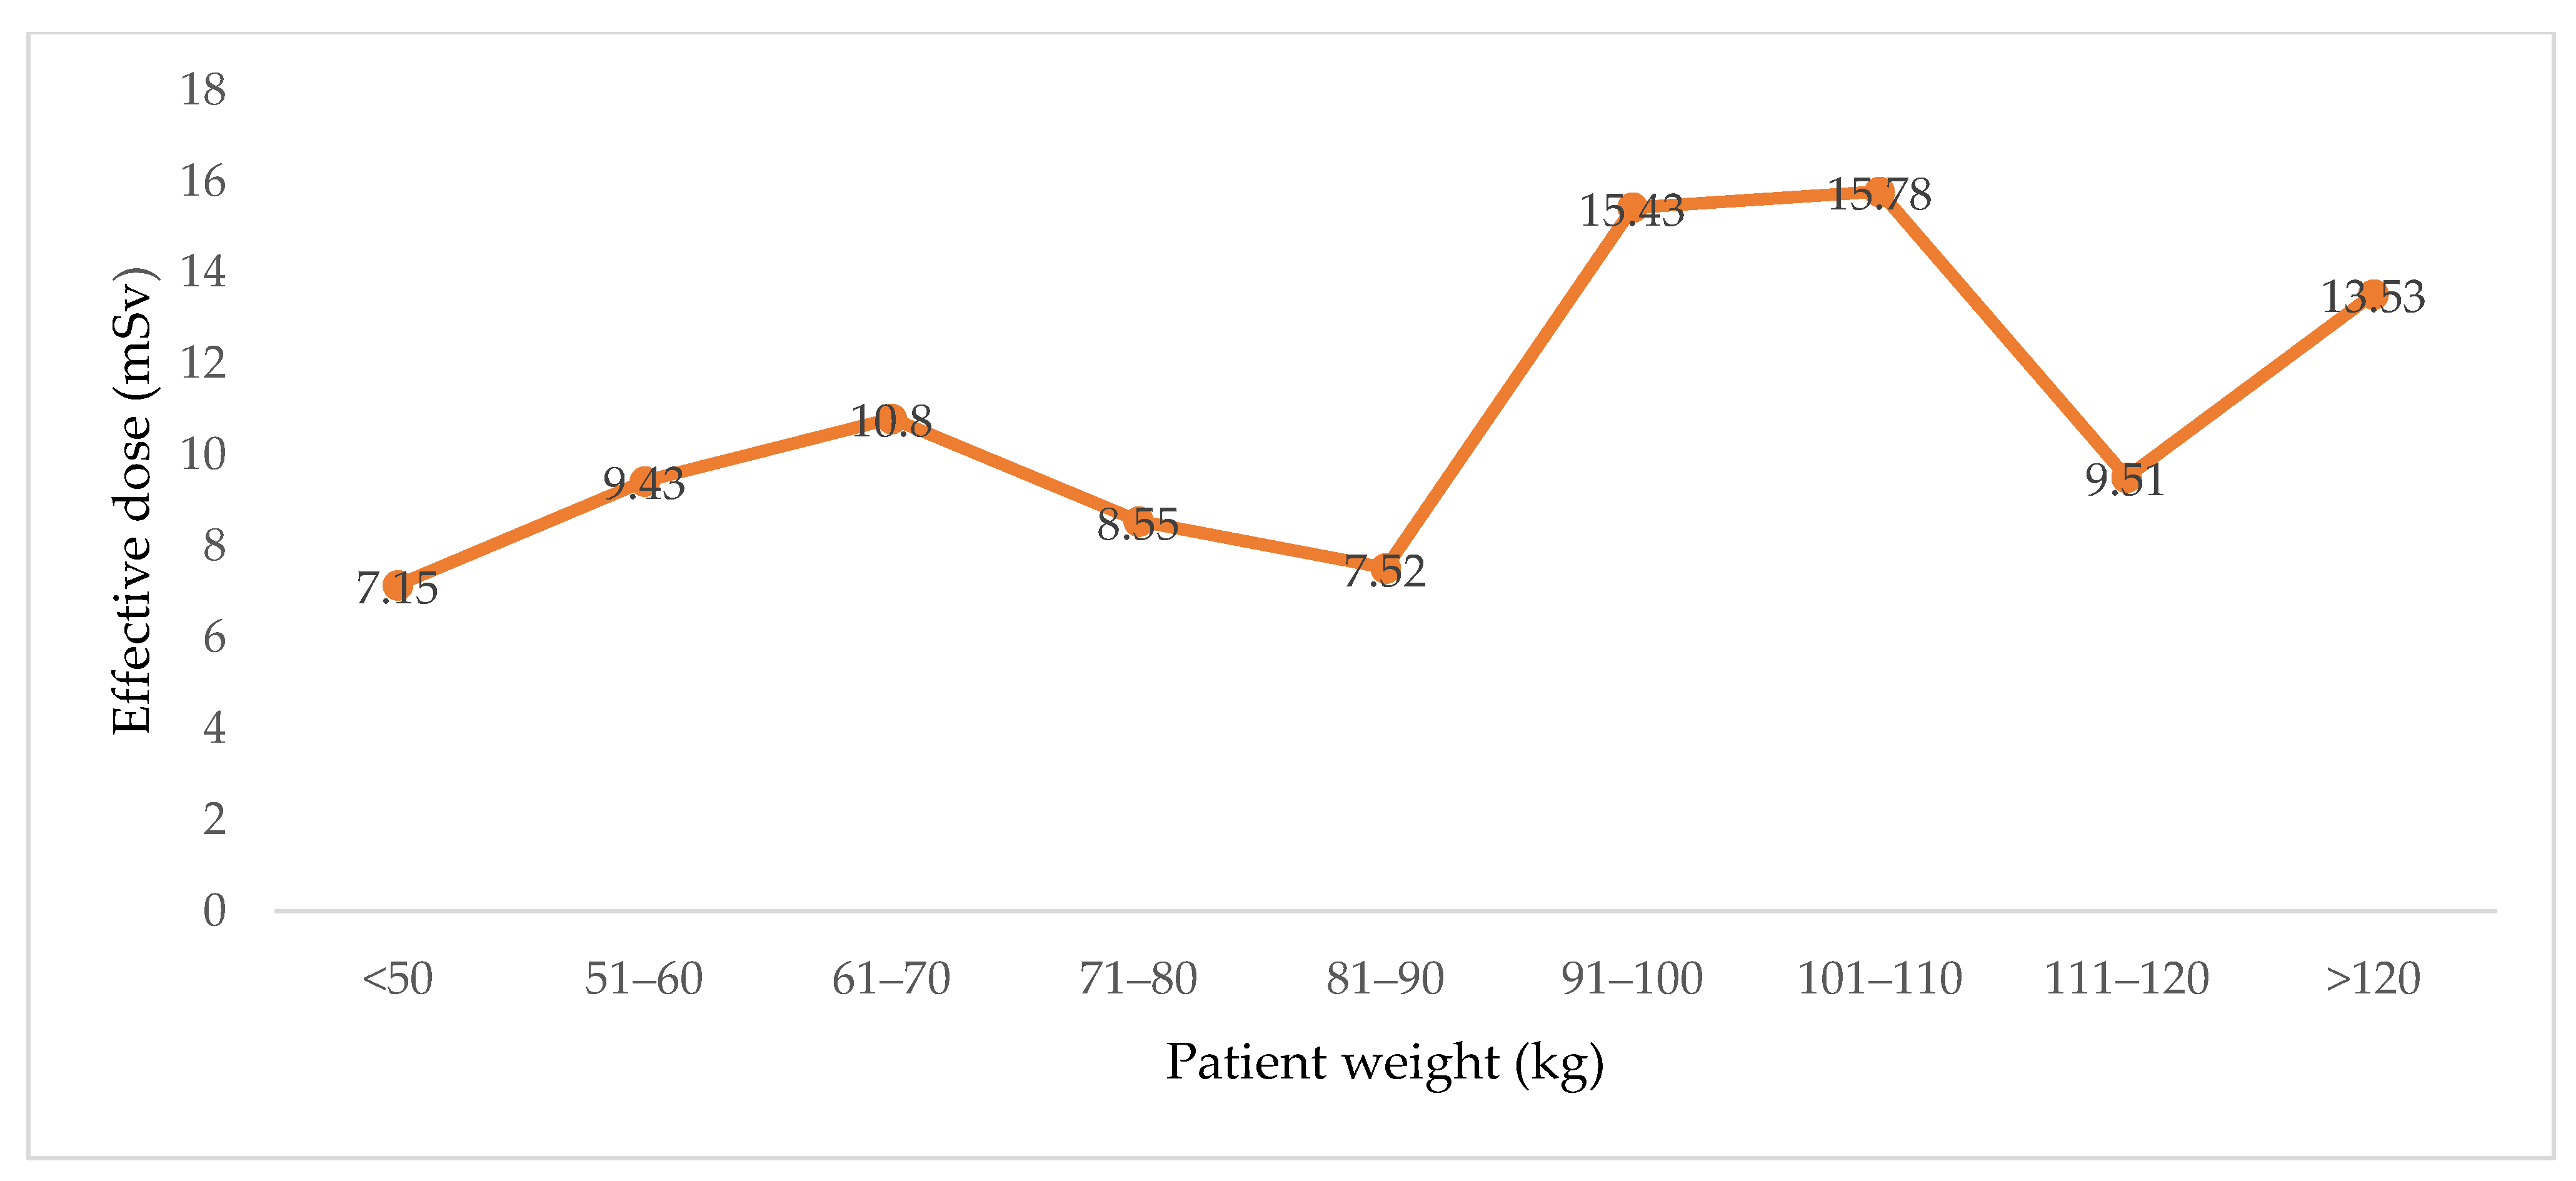
Figure 4 and Figure 5, show the relation between patient weight (kg) and CTDIvol (mGy) and effective dose (mSv) per procedure. The CTDIvol (mGy) is less dependent of patient weight. Other factors including tube output and scan length affect the patients’ dose values.
Fujii et al. [32] have reported a strong correlation between patient size and CTDIvol (mGy); the use of tube current modulation (TCM) caused an immediate increase in the value of the CTDIvol (mGy) for obese patients (i.e., of large BMI (kg/m2). Table 4 shows the mean, standard deviation (SD), median, and range of the effective dose (mGy.cm) according to patient gender. Comparable mean effective doses were obtained for males (10.30 mSv) and females (10.99 mSv) per procedure with a mean percentage difference (PD) ≤ 6.5%. The overall mean, standard deviation (SD), median, and range of the effective dose (mSv) was 11.57 ± 7.75, 9.25 (2.17–31.93), the overall mean exceeding the maximum ACR recommendation (10.0 mSv) by 16%, the CTDIvol (mGy) exceeding the AAPM recommendation for average patients, of weight (70–90 kg), by 22% [31]. The entire CTC procedure results were: 20% positive, 27% negative, and 53% limited diagnostic value. The patient dose per procedure in terms of CTDIvol (mGy), DLP (mGy.cm), and effective dose is greater than the previous studies (Table 5). CTC has a superior advantage on CRC diagnosis, including asymptomatic patients. The main drawback is the use of ionizing radiation, which may increase the probability of cancer risk. Recently, the use of ultra-low-dose CTC (ULD-CTC) with ATCM up to 63% and a 66% for effective dose (mSv) and CTDIvol (mGy), respectively, in comparison with the low-dose CTC (LD-CTC) without significant deterioration in image quality and polyp detection was seen. In addition to that, the use of sinogram-affirmed iterative reconstruction (SAFIRE) and ATCM can reduce the patient doses below 1.0 mSv, while maintaining the diagnostic quality of CT image [18,19,23,33,34] (Table 5). Furthermore, Chang et al. [35] reported a reduction of CTDIvol (mGy) up to 20% by reducing the tube potential (kVP) from 120 to 100 irrespective of the patient size with a slight decrease in image quality. The available dose reduction techniques can significantly reduce the risk of CRC procedure. However, it requires awareness and a skillful technologist.
With CTC performed for screening purposes, patients or individuals may be subject to repeat radiation exposures, contributing to additional cancer induction probability. With the current effective dose value (11.57 mSv), the additional expected cancer risk is six health detriments per 10,000 CTC procedures. Thus careful justification and optimization of CTC procedure are recommended, in particular to avoid unnecessary radiogenic risk, while maintaining the benefit of the CTC procedure. Artificial intelligence (AI) can considerably assist in the automation of image acquisition and reduce the human factors regarding experience in selecting optimal exposure parameters and scan range based on visual sensors and the imaging protocol [36]. Thus, the optimal scanning parameters can significantly improve the scanning efficiency and reduce the unnecessary radiation exposure. In addition to that, currently, computed aided diagnosis (CAD) is used widely to obtain an accurate diagnosis, prognosis, and tracking of CRC [37]. Patient dose reduction can be achieved by selecting optimum exposure parameters and the use of ATCM by well-trained technologists. The current study provided a rigorous assessment of patient dose during CTC at KFMC, Riyadh, Saudi Arabia. However, there is still a limitation regarding the sample size due to a multi-center study’s access issues at a national level to derive the national diagnostic reference level (DRL) for patient dose optimization.

4. Conclusions

Patient dose during CTC has been assessed using two helical scanners, various imaging protocols, and CT machine settings. The variation in CT protocol results in an up to three-fold variation in patient-effective dose. The variation in the effective dose during CTC protocols is attributed to the high tube currents used in this protocol, ranging from 100 to 450 mA per CTC procedure. ATCM shows a significant increase in CTDIvol (mGy) (69%) and effective dose (mSv) (95%) compared to the manual tube current (mA) selection. This suggests the technologist’s role to be invaluable and crucial in selecting a noise reference based on the patient weight and adjusting the tube current per slice to avoid the overexposure as seen in the use of ATCM protocol. The current patient-effective dose during CTC is greater compared to previously published studies. Individuals undergoing screening CTC have a greater risk of radiogenic cancer probability, arising from long-term repetitive exposures. Patient dose optimization is seen to be necessary in assuring patients receive the greatest benefit of the CTC procedure.

Author Contributions

Conceptualization, M.A., A.S., B.A.; methodology, M.A., R.M., A.A. (Abdullah Asiri), and A.S.; software, M.A., R.M., A.A. (Abdullah Alomary), B.A., D.A.B.; validation, M.A., A.S., H.A., A.A. (Abdullah Asiri), and D.A.B.; formal analysis, M.A., A.S., R.M., A.A. (Abdullah Alomary), B.A.; investigation, M.A., A.A. (Abdullah Alomary), R.M., A.A. (Abdullah Asiri), and A.S.; resources, B.A., A.A. (Abdullah Alomary), H.A.; data curation, A.A. (Abdullah Alomary), H.A.; writing—original draft preparation, M.A., R.M., A.A. (Abdullah Asiri), B.M.A., D.A.B.; writing—review and editing, B.M.A., H.A., A.S., D.A.B.; visualization, M.A., A.S., D.A.B.; supervision, A.S., B.A., D.A.B.; project administration, M.A., A.S., B.M.A., D.A.B.; funding acquisition, M.A., A.S., B.A. All authors have read and agreed to the published version of the manuscript.

Funding

Please add: This research was funded by The Deanship of Scientific Research, Prince Sattam bin Abdulaziz University, Grant number 2018/01/9398.

Institutional Review Board Statement

The study was conducted according to the guidelines of the Declaration of Helsinki, and approved by the Institutional Review Board (or Ethics Committee) of King Fahad Medical City (protocol code FWA00018774/2019.

Informed Consent Statement

Informed consent was obtained from all subjects involved in the study.

Data Availability Statement

Data available on request.

Acknowledgments

The authors appreciated the support provided by the radiology department personnel at King Fahad Medical City, Riyadh, Saudi Arabia.

Conflicts of Interest

The authors declare no conflict of interest.

References

  1. Saudi Cancer Registry, Cancer Incidence Report Saudi Arabia. Available online: https://nhic.gov.sa/eServices/Documents/ESCRfinal6NOV.pdf (accessed on 2 January 2021).
  2. Sung, H.; Ferlay, J.; Siegel, R.L.; Laversanne, M.; Soerjomataram, I.; Jemal, A.; Bray, F. Global cancer statistics 2020: GLOBOCAN estimates of incidence and mortality worldwide for 36 cancers in 185 countries. CA Cancer J. Clin. 2021, 71, 209–249. [Google Scholar] [CrossRef]
  3. Keum, N.; Giovannucci, E. Global burden of colorectal cancer: Emerging trends, risk factors and prevention strategies. Nat. Rev. Gastroenterol. Hepatol. 2019, 16, 713–732. [Google Scholar] [CrossRef]
  4. Song, M.; Chan, A.T.; Sun, J. Influence of the Gut Microbiome, Diet, and Environment on Risk of Colorectal Cancer. Gastroenterology 2020, 158, 322–340. [Google Scholar] [CrossRef] [PubMed]
  5. Graff, R.E.; Möller, S.; Passarelli, M.N.; Witte, J.S.; Skytthe, A.; Christensen, K.; Tan, Q.; Adami, H.-O.; Czene, K.; Harris, J.R.; et al. Familial Risk and Heritability of Colorectal Cancer in the Nordic Twin Study of Cancer. Clin. Gastroenterol. Hepatol. 2017, 15, 1256–1264. [Google Scholar] [CrossRef] [PubMed] [Green Version]
  6. Favoriti, P.; Carbone, G.; Greco, M.; Pirozzi, F.; Pirozzi, R.E.M.; Corcione, F. Worldwide burden of colorectal cancer: A review. Updat. Surg. 2016, 68, 7–11. [Google Scholar] [CrossRef]
  7. Murphy, C.C.; Harlan, L.C.; Lund, J.L.; Lynch, C.F.; Geiger, A.M. Patterns of colorectal cancer care in the United States: 1990–2010. J. Natl. Cancer Inst. 2015, 107, djv198. [Google Scholar] [CrossRef] [Green Version]
  8. Alsanea, N.; Abduljabbar, A.S.; Alhomoud, S.; Ashari, L.H.; Hibbert, D.; Bazarbashi, S. Colorectal cancer in Saudi Arabia: Incidence, survival, demographics and implications for national policies. Ann. Saudi Med. 2015, 35, 196–202. [Google Scholar] [CrossRef] [PubMed]
  9. Sha, J.; Chen, J.; Lv, X.; Liu, S.; Chen, R.; Zhang, Z. Computed tomography colonography versus colonoscopy for detection of col-orectal cancer: A diagnostic performance study. BMC Med. Imaging 2020, 20. [Google Scholar] [CrossRef]
  10. A Issa, I.; Noureddine, M. Colorectal cancer screening: An updated review of the available options. World J. Gastroenterol. 2017, 23, 5086–5096. [Google Scholar] [CrossRef] [PubMed]
  11. de Haan, M.C.; van Gelder, R.E.; Graser, A.; Bipat, S.; Stoker, J. Diagnostic value of CT-colonography as compared to colon-oscopy in an asymptomatic screening population: A meta-analysis. Eur. Radiol. 2011, 21, 1747–1763. [Google Scholar] [CrossRef] [Green Version]
  12. Moreno, C.; Kim, D.H.; Bartel, T.B.; Cash, B.D.; Chang, K.J.; Feig, B.W.; Fowler, K.J.; Garcia, E.M.; Kambadakone, A.R.; Lambert, D.L.; et al. ACR Appropriateness Criteria® Colorectal Cancer Screening. J. Am. Coll. Radiol. 2018, 15, S56–S68. [Google Scholar] [CrossRef]
  13. Yee, J.; McFarland, E. Extracolonic findings and radiation at CT colonography: What the referring provider needs to know. Abdom. Radiol. 2018, 43, 554–565. [Google Scholar] [CrossRef]
  14. Flicek, K.T.; Hara, A.K.; Silva, A.C.; Wu, Q.; Peter, M.B.; Johnson, C.D. Reducing the Radiation Dose for CT Colonography Using Adaptive Statistical Iterative Reconstruction: A Pilot Study. Am. J. Roentgenol. 2010, 195, 126–131. [Google Scholar] [CrossRef]
  15. Sulieman, A.; Mahmoud, M.; Serhan, O.; Alonazi, B.; Alkhorayef, M.; Alzimami, K.; Bradley, D. CT examination effective doses in Saudi Arabia. Appl. Radiat. Isot. 2018, 141, 261–265. [Google Scholar] [CrossRef] [PubMed]
  16. AAPM. Adult CT Colonography Protocols Version 10. 2017, pp. 1–16. Available online: https://www.aapm.org/pubs/CTProtocols/documents/AdultCTColonography.pdf (accessed on 14 January 2021).
  17. Lieberman, D. Colorectal Cancer Screening: Practice Guidelines. Dig. Dis. 2012, 30, 34–38. [Google Scholar] [CrossRef] [PubMed]
  18. Cianci, R.; Pizzi, A.D.; Esposito, G.; Timpani, M.; Tavoletta, A.; Pulsone, P.; Basilico, R.; Cotroneo, A.R.; Filippone, A. Ultra-low dose CT colonography with automatic tube current modulation and sinogram-affirmed iterative reconstruction: Effects on radiation exposure and image quality. J. Appl. Clin. Med Phys. 2018, 20, 321–330. [Google Scholar] [CrossRef] [PubMed]
  19. Nagata, K.; Fujiwara, M.; Kanazawa, H.; Mogi, T.; Iida, N.; Mitsushima, T.; Lefor, A.; Sugimoto, H. Evaluation of dose reduc-tion and image quality in CT colonography: Comparison of low-dose CT with iterative reconstruction and routine-dose CT with filtered back projection. Eur. Radiol. 2015, 25, 221–229. [Google Scholar] [CrossRef] [PubMed]
  20. Liedenbaum, M.H.; Venema, H.W.; Stoker, J. Radiation dose in CT colonography—Trends in time and differences be-tween daily practice and screening protocols. Eur. Radiol. 2008, 18, 2222–2230. [Google Scholar] [CrossRef] [PubMed] [Green Version]
  21. Lambert, L.; Ourednicek, P.; Briza, J.; Giepmans, W.; Jahoda, J.; Hruska, L.; Danes, J. Sub-milliSievert ultralow-dose CT colonography with iterative model reconstruction technique. PeerJ 2016, 4, e1883. [Google Scholar] [CrossRef] [PubMed] [Green Version]
  22. Chang, K.J.; Yee, J. Dose reduction methods for CT colonography. Abdom. Imaging 2012, 38, 224–232. [Google Scholar] [CrossRef] [PubMed]
  23. Millerd, P.J.; Paden, R.G.; Lund, J.T.; Hara, A.K.; Stiles, W.L.; He, M.; Wu, Q.; Johnson, C.D. Reducing the radiation dose for computed tomography colonography using mod-el-based iterative reconstruction. Abdom. Imaging 2015, 40, 1183–1189. [Google Scholar] [CrossRef]
  24. ICRP. The 2007 Recommendations of the International Commission on Radiological Protection; ICRP Publication Annals; ICRP: Ottawa, ON, Canada, 2007; Volume 37, pp. 1–399. [Google Scholar]
  25. Söderberg, M.; Gunnarsson, M. Automatic exposure control in computed tomography-an evaluation of systems from different manufacturers. Acta Radiol. 2010, 51, 625–634. [Google Scholar] [CrossRef]
  26. Martin, C.J.; Sookpeng, S. Setting up computed tomography automatic tube current modulation systems. J. Radiol. Prot. 2016, 36, R74–R95. [Google Scholar] [CrossRef] [PubMed]
  27. Sulieman, A.; Adam, H.; Elnour, A.; Tamam, N.; Alhaili, A.; Alkhorayef, M.; Alghamdi, S.; Khandaker, M.U.; Bradley, D.A. Patient radiation dose reduction using a commercial iterative reconstruction technique package. Radiat. Phys. Chem. 2021, 178, 108996. [Google Scholar] [CrossRef]
  28. Moro, L.; Panizza, D.; D’Ambrosio, D.; Carne, I. Considerations on an automated computed tomography tube current modulation system. Radiat. Prot. Dosim. 2013, 156, 525–530. [Google Scholar] [CrossRef] [PubMed]
  29. Sookpeng, S.; Martin, C.J.; Gentle, D.J.; Lopez-Gonzalez, M.R. Relationships between patient size, dose and image noise under automatic tube current modulation systems. J. Radiol. Prot. 2014, 34, 103–123. [Google Scholar] [CrossRef]
  30. Smith-Bindman, R.; Miglioretti, D.L. CTDIvol, DLP, and Effective Dose Are Excellent Measures for Use in CT Quality Improvement. Radiology 2011, 261, 999. [Google Scholar] [CrossRef] [PubMed]
  31. AAPM, American Association of Physicists in Medicine. Size-Specific Dose Estimates (SSDE) in Pediatric and Adult Body CT Examinations (Task Group 204); American Association of Physicists in Medicine: College Park, MD, USA, 2011. [Google Scholar]
  32. Fujii, K.; McMillan, K.; Bostani, M.; Cagnon, C.; McNitt-Gray, M. Patient Size–Specific Analysis of Dose Indexes from CT Lung Cancer Screening. Am. J. Roentgenol. 2017, 208, 144–149. [Google Scholar] [CrossRef]
  33. Lubner, M.G.; Pooler, B.D.; Kitchin, D.R.; Tang, J.; Li, K.; Kim, D.H.; Del Rio, A.M.; Chen, G.-H.; Pickhardt, P.J. Sub-milliSievert (sub-mSv) CT colonography: A prospective comparison of image quality and polyp conspicuity at reduced-dose versus standard-dose imaging. Eur. Radiol. 2015, 25, 2089–2102. [Google Scholar] [CrossRef] [Green Version]
  34. Lambert, L.; Danes, J.; Jahoda, J.; Masek, M.; Lisy, J.; Ourednicek, P. Submilisievert ultralow-dose CT colonography using iterative reconstruction technique: A feasibility study. Acta Radiol. 2015, 56, 517–525. [Google Scholar] [CrossRef]
  35. Chang, K.; Caovan, D.B.; Grand, D.J.; Huda, W.; Mayo-Smith, W.W. Reducing radiation dose at CT colonography: Decreas-ing tube voltage to 100 kVp. Radiology 2013, 266, 791–800. [Google Scholar] [CrossRef] [PubMed] [Green Version]
  36. Shi, F.; Wang, J.; Shi, J.; Wu, Z.; Wang, Q.; Tang, Z.; He, K.; Shi, Y.; Shen, D. Review of Artificial Intelligence Techniques in Imaging Data Acquisition, Segmentation, and Diagnosis for COVID-19. IEEE Rev. Biomed. Eng. 2021, 14, 4–15. [Google Scholar] [CrossRef] [Green Version]
  37. Ahmad, O.F.; Soares, A.S.; Mazomenos, E.; Brandao, P.; Vega, R.; Seward, E.; Stoyanov, D.; Chand, M.; Lovat, L.B. Artificial intelligence and computer-aided diagnosis in colonoscopy: Current evidence and future directions. Lancet Gastroenterol. Hepatol. 2019, 4, 71–80. [Google Scholar] [CrossRef] [Green Version]
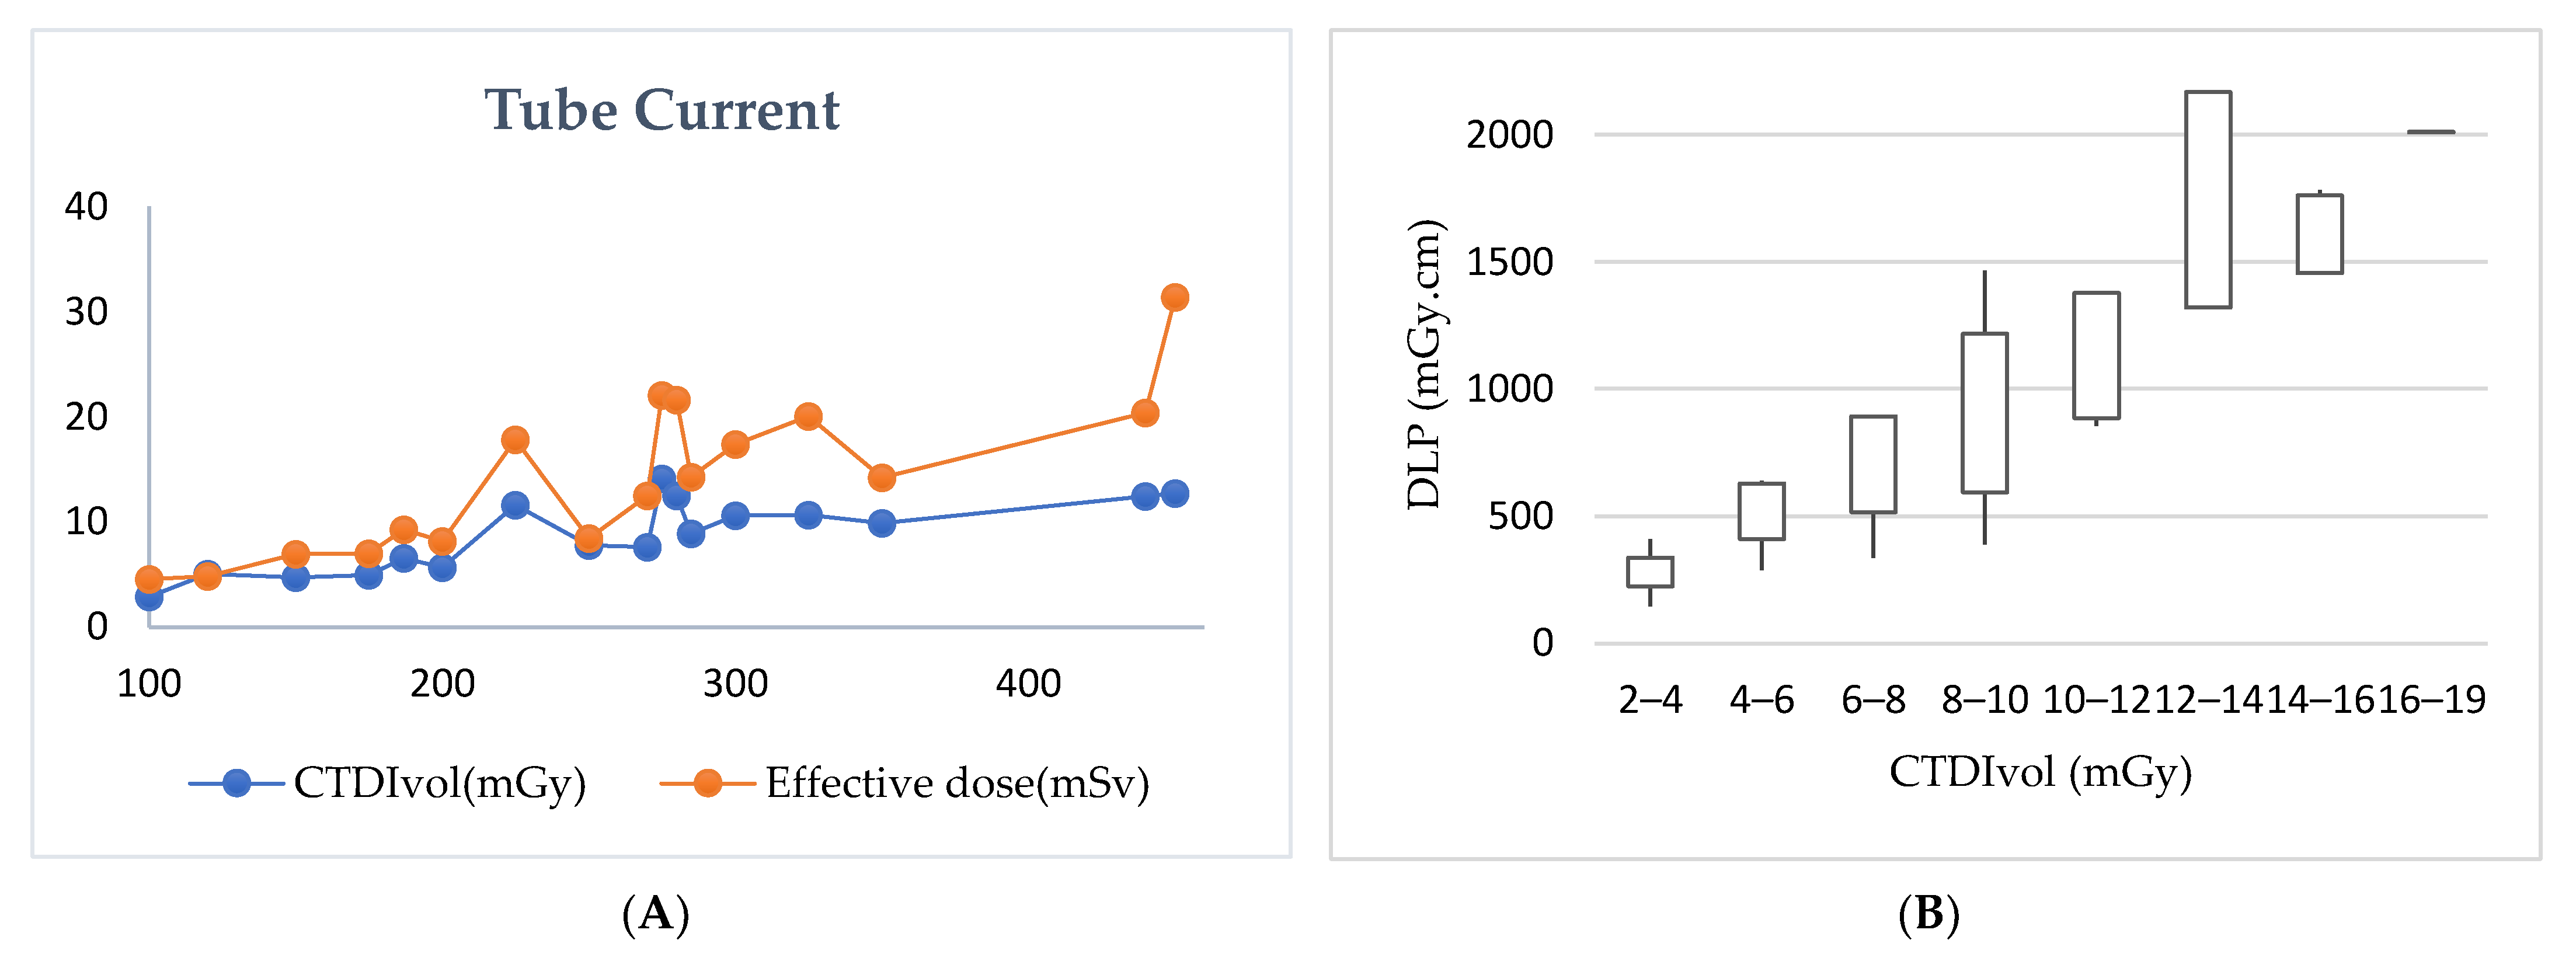
Figure 1. (A): Direct relation between tube current (mA), the CTDIvol (mGy) and effective dose (mSv). CTDIvol (mGy) and effective dose (mSv) increase with tube current value. (ACR recommendation for the effective dose is 10 mSv) (According to AAPM, the range of CTDIvol for average patient size is 3–6 mGy). (B): The relationship between CTDIvol (mGy) and DLP (mGy.cm), a wide variation being seen in DLP value as CTDIvol increases. (According to AAPM, the CTDIvol value is 2–4 mGy for 50–70 kg, 3–6 mGy for 70–90 kg, and 5–9 mGy for 90–120 kg patients.
Applsci 11 04761 g001
Figure 2. Patients with the same parameter factors in a supine position, the first three patients having optimum anatomical coverage while the last two patients less well indicated anatomical range coverage, accordingly registering greater effective dose.
Applsci 11 04761 g002
Figure 3. (A,B) Two female patients with the same scan parameters have a 16.5% difference in the effective dose due to anatomical coverage. The yellow line shows the scan coverage, the green line is the first part for the colon, and the red line shows the colon’s last level. (A) is an optimum anatomical coverage and (B) is improper anatomical coverage.
Applsci 11 04761 g003
Figure 4. Patient weight versus CTDIvol (mGy).
Applsci 11 04761 g004
Figure 5. Patient weight versus the effective dose (mSv).
Applsci 11 04761 g005
Table 1. Image acquisition parameters during CTC procedure.
ParametersPhilipsGE
Scan typeHelicalHelical
kVp *120120
mA *100120
Collimation (mm)40 (64 * 0.625)40 (64 * 0.625)
Rotation time (s)0.50.5
Pitch1.3751.375
SFOVLargeLarge
CoverageDiaphragm to ischiumDiaphragm to ischium
IRT40% ASIR50% ASIR
* For standard size patient (70–90 kg); SFOV: scan field of view; IRT: iterative reconstruction technique; GE: General Electric.
Table 2. Mean ± standard deviation (minimum − maximum) of (tube current (mA) and (CTDIvol (mGy) radiation dose is calculated for two decubitus according to the protocol.
ProtocolTube Current (mA) CTDIVOL (mGy)Effective Dose (MSV)
Supine Prone/DecubitusSupine Prone/Decubitus
Supine and one decubitus266.6 ± 144 (100–350)266.6 ± 144 (100–350)7.5 ± 4 (2.8–9.8)7.5 ± 4 (2.8–9.8)13 ± 5.9 (6.1–16.8)
Supine and two decubitus375 ± 106 (300–450)375 ± 106 (300–450)13.4 ± 1 (12.6–14.2)12.2 ± 0.57 (11.8–12.6)31.6 ± 0.38 (31.3–31.9)
Auto tube current (mA)253.1 ± 63 (150–325)256.2 ± 59 (150–325)11.2 ± 5.2 (2.2–18.3)10.5 ± 4.7 (2.1–16.5)18.7 ± 9.9 (3.06–31.9)
Routine (manual) 203 ± 96.3 (100–440)202.2 ± 96 (100–440)6.4 ± 3.3 (2.7–15.5)6.51 ± 3.9 (2.8–19.7)9.6 ± 6 (2.1–26.7)
Table 3. (A): Mean ± standard deviation (minimum − maximum) of the image acquisition parameter and radiation dose values according to the manufacturer and the tube current mode. * fixed values. (B): Mean ± standard deviation (minimum − maximum) radiation dose values according to the manufacturer and the tube current mode.
(A)
ModeTube Voltage (kVp)Tube current (mA)Rotation Time (s)PitchSlice Thickness (mm)
SupineProne
Auto mA (Philips)120287.5 ± 17 (275–300)287.5 ± 17 (275–300)0.85 ± 0.02 (0.84–0.87)0.9 *0.67 *
Auto mA (GE)116.6 ± 8.1
(100–120)
241.6 ± 70 (150–325)245.8 ± 65.9 (150–325)0.5 ± 0.1 (0.4–0.7)1.1 ± 0.2 (0.98–1.37)0.62 *
Manual mA (GE)120212.3 ± 104 (100–450)213.2 ± 105.5 (100–450)0.52 ± 0.06 (0.5–0.7)1.32 ± 0.1 (0.98–1.37)0.62 *
(B)
ModeCTDIvol (mGy)DLP (mGy.cm)Effective Dose (mSv)
SupineProne
Auto mA (Philips)16.2 ± 2.9 (14.2–18.3)14.6 ± 2.6 (12.7–16.5)1702.8 ± 436.7 (1394–2011.6)25.5 ± 6.5 (20.9–30.1)
Auto mA (GE)9.6 ± 4.8 (2.2–14.5)9.1 ± 4.6(2.2–15)1098.1 ± 686.5 (204–2128.8)16.4 ± 10.2 (3.06–31.9)
Manual mA (GE)6.6 ± 3.4 (2.7–15.5)6.7 ± 3.9 (2.8–19.7)690.1 ± 447.3 (145.2–2092.9)10.3 ± 6.7 (2.1–31.3)
Table 4. Mean ± sd, median and range of patient radiation dose values according to the patient gender.
GenderNumberAge (Y)CTDIVOL (mGy) SupineCTDIVOL (mGy) ProneEffective Dose (mSv)
M2558.64 ± 15.2, 58 (29–83)6.7 ± 4.42, 5.63 (2.27–15.56)6.5 ± 4.1, 5.6 (2.1–15.58)10.3 ± 7.95, 6.92 (2.17–31.9)
F3057.4 ± 12.3, 55 (24–82)7.84 ± 3.64, 8.02 (2.79–18.3)8.06 ± 4.3, 7.61 (2.8–19.76)12.6 ± 7.55, 10.99 (3.88–31.39)
Total5557.96 ± 13.6, 56 (24–83)7.33 ± 4, 7.02 (2.2–18.3)7.37 ± 4.3, 7.11 (2.2–19.7)11.57 ± 7.75, 9.25 (2.17–31.93)
Table 5. Comparison of the average radiation dose values with six worldwide studies per series.
Standard Imaging Protocol Modified *
AuthorsCountryCTDIvol (mGy)DLP (mGy.cm)Effective Dose (mSv)CTDIvol (mGy)DLP (mGy.cm)Effective Dose (mSv)
Chang et al. [22]USA5.32393.64.11973.0
Nagata et al. [19]Japan 2.37118.81.781.2247.40.9
Nagata et al. [19]Japan 2.53128.21.920.9242.20.7
Nagata et al. [19]Japan 2.63130.41.960.7736.40.6
Nagata et al. [19]Japan 2.51123.91.860.62290.5
Cianci et al. [18]Italy 3.87179.32.691.3265.31.0
Liedenbaum et al. [20]The NetherlandsN/A303.34.55N/A193.33.0
Millerd et al. [23]USA6.7327.84.912.7129.11.9
Current study Saudi Arabia7.3385.55.77.3385.55.7
* modified CTC imaging protocol.
Publisher’s Note: MDPI stays neutral with regard to jurisdictional claims in published maps and institutional affiliations.