1. Introduction
Organizations lose up to 5% of their annual revenue to fraud. Cases such as Enron, WorldCom, Parmalat, and Tyco are among the most prominent cases that demonstrate how devastating the impact of fraud can be. According to the Association of Certified Fraud Examiners (ACFE), occupational fraud is more likely to be detected through “tips” (notifications or complaints) than by any other means [
1]. All seems to indicate that even though detecting fraud has become a priority in organizations [
2], efforts to develop and introduce effective fraud prevention and detection mechanisms are still insufficient.
Several studies have reviewed the field’s current limitations. Most works agree that traditional fraud audits support their results by analyzing a limited random sample, which forms the basis from which the auditor infers conclusions about the situation existing in the period under review. The analyses are usually performed manually and focus on checking documents, static rules, risks, or control objectives that limit the auditable elements [
3].
The truth is, however, that the results are limited, and paradoxically, a considerable amount of time is spent on execution, in addition to the use of substantial human and material resources [
4,
5].
Traditionally, the auditing profession addressed fraud in two essential ways: searching for fraud using a passive approach by testing internal controls, or reacting to fraud allegations. Fraud audits arise as an alternative to uncover fraud by adopting a proactive approach. A fraud audit is the application of audit procedures to a population of business transactions to increase the likelihood of identifying fraud [
6].
In this context, audit analytics has emerged as an applied science focused on pattern discovery and analysis, anomaly identification, and the extraction and visualization of useful information, thus increasing the effectiveness of audits [
7]. Specifically, process mining stands out as a valuable technique for audits [
8,
9,
10,
11]. It has even been accurately determined as the most popular unsupervised method for external audits [
12]. Its main objective is to extract knowledge from the event logs of commonly available systems and provide timely information to decision makers.
Several approaches have sought to achieve automatic processing of traces, revolutionizing the traditional methods. The entire population is audited, fraud patterns that were not detectable using traditional techniques are discovered, and the consumption of resources is reduced. Nevertheless, current audit approaches present shortcomings as regards the use of the visual capabilities that support process mining techniques.
State-of-the-art reviews point to the fact that process mining and visualizations require more in-depth academic research applied to audits [
12]. We are not aware, however, of the existence of a formalized proposal that combines both disciplines to address fraud auditing.
The present work presents an approach that combines process mining techniques with visual analytics for fraud audits. It includes a method that guides auditors in their detection of fraudulent transactions during a fraud audit. The method can be generalized to any business domain. In this respect, existing process mining algorithms were reoriented towards the domain of fraud auditing, taking advantage of the visual capabilities.
Our proposal is based on a fraud audit approach. Specifically, the study “Fraud data analytics methodology: the fraud scenario approach to uncovering fraud in core business systems” [
13] was used as a reference.
Analysis techniques proposed in the approach were selected by a group of experts in fraud audits, using the Delphi method and the analytic hierarchy process (AHP). As a result, a number of the most widespread process mining techniques (dotted chart, trace alignment, fuzzy miner and performance sequences analysis, “PSA”) [
14] were chosen and extended in order to enable filtering for contextual analysis (evaluation of the context in which a process is executed; context analysis concentrates on specific domain attributes; this adds valuable information for the detection and investigation of irregular behaviors), to manage levels of abstraction of the process, and to facilitate its use by fraud auditors.
Based on the proposed approach, we developed a software solution that detects fraud data patterns during fraud audits. It is currently being implemented by internal auditors and compliance officers in six financial institutions, a telecommunications company, a hotel chain, and a large chain of outlets.
To present the proposal, the paper is structured as follows:
Section 2 discusses the background and related works;
Section 3 describes the methodology used;
Section 4 presents the proposed approach with the combination of visual capabilities for fraud audits. Finally, the implementation results of an actual case are described in
Section 5 for validation purposes.
2. Background and Related Works
This section begins with an overview of visual analytics and fraud audits (
Section 2.1). Next, we introduce process mining and its relationship with visual analytics (
Section 2.2). Details are then provided regarding the application of process mining to audit activities (
Section 2.3).
2.1. Visual Analytics and Fraud Audit
Previous studies estimate that at least 30 million neurons are activated in the visual cortex when we observe a single-object image [
15]. People have great visual abilities and can distinguish outliers, color variations, shape, and movement.
Iliinsky defines two categories of data visualization: explanation and exploration [
16]. Our research focuses on the latter. Visual data exploration applies when prior data knowledge is limited, and the objectives of exploration are imprecise. According to the author, visualization can help to perform a deeper exploration, identify sub-problems, raise new questions, and identify trends and outliers in the data.
Previous research has examined data visualization and its application to audits. In [
17], Wright concluded that auditors who used graphic formats made more accurate financial judgments. For their part, Anderson and Reckers, in an empirical investigation on the effects of presentation format on auditor’s judgment during analytical procedures, concluded that images and graphics facilitated data correlation tasks [
18]. Years later, Anderson and Mueller, in [
19], conducted a study to examine the interactions between experience and presentation format when applying audit judgments. They found that the auditors and student participants who used graphs performed significantly better, both in assessing correlations and in making predictions during the analytical review of the sales account.
Abdullah, in [
20], conducts a data visualization auditing study, comparing different presentation formats and their effects on auditors. The results reflect that visualization techniques enable faster data exploration in the presence of highly diverse and noisy data and that they are extremely useful to detect pattern violations and potential outliers in the data. Data visualization can support auditors in their tasks, such as fraud detection and risk assessment. In addition, it can be used to supplement their analytical procedures in order to discover risks that were previously unknown, ultimately improving audit quality.
Leite et al. [
21] later presented a comprehensive survey of existing visual fraud detection approaches in order to classify different tasks and solutions. In this work, fraud detection solutions are explored through five major domains: banks, the stock market, telecommunication companies, insurance companies, and internal frauds.
Yang et al. [
22] presented a comprehensive survey of visual analytics of anomalous user behaviors and classified them into four categories: social interaction, travel, network communication, and transaction. They also categorized visualization techniques that have been applied to anomalous user behaviors, including, among others: sequence (illustrates the relations between successive events with temporal information); graph (shows structured patterns composed of nodes and edges); chart (represents the attributes of a multidimensional data item using a chart). A number of authors refer to several successful approaches proposed in each category: sequence [
23,
24,
25,
26], graph [
27,
28,
29,
30], and chart [
23,
31,
32].
Beyond the works referenced above, auditing literature has lagged behind in showcasing the application of data visualization [
20]. To date, research that directly examines the efficacy of data visualization techniques for fraud detection is scarce [
33]. In this regard, Dilla and Raschke [
33] develop a theoretical framework to predict when and how investigators might use data visualization techniques to detect fraudulent transactions. They conclude that interactive data visualization tools present a substantial potential to render the fraudulent transaction detection process more efficient and effective; however, they raise the need for future research regarding the circumstances under which interactive data visualization might be used to detect fraud.
The studies analyzed show that it is possible to increase the effectiveness of fraud detection processes by introducing visual analytics tools in audits; however, the studies reviewed above do not link visual analytics to process mining techniques, nor do they specifically target fraud audits.
2.2. Process Mining and Visual Analytics
Process mining is an applied science situated between computational intelligence and data mining on the one hand, and between modeling and process analysis on the other [
34]. It consists of a set of techniques that act on event logs for discovery, monitoring, and process improvement. The premise to be able to apply this technique is that it must be possible to associate sequences of activities that make up the event log with instances of the process. The instance or case is the entity that is modified by the process, while the trace represents the unique sequence of activities undergone during each instance [
35].
There are three types of process mining: discovery, which enables building a directed graph automatically, using the process operations’ ordered sequence (its evolution was analyzed by van der Aalst in [
36]); conformance checking, which evaluates the conformity between the discovered model, the actual behavior of the operations registered in the traces, and the process’s regulated model [
37,
38]. Conformance checking can be used to compare real process executions with a normative model; however, the outcome of current conformance checking techniques is too vast for an auditor to inspect further [
39]. Finally, enhancement facilitates the extension of the process model in relation to contextual information stored in the traces. This makes it possible to identify optimization points and introduce changes that increase the efficiency of the process. A related case study is presented in [
40].
By using the input elements, process mining offers the possibility of covering various perspectives that are vital for audit analysis [
41]: The control-flow perspective, which is used to analyze the order in which activities are executed; the organizational perspective, which examines the behavior of actors (originators) and their relationship during the execution of the process; the case perspective, which focuses on the analysis of the particular behavior of attributes at each instance. Some proposals also include the time perspective, which focuses on the duration and frequency of occurrence of events [
42].
Several recent studies have emphasized the use of visual analytics to explore and understand large event logs as a major process mining challenge [
34]. In [
43], visual analytics focus on the combination of machine learning techniques, data mining, and visualization in order to take advantage of human capabilities for the parallel visual processing of large volumes of data and the identification of atypical patterns. The paper’s author mentions that scalability and the visual aggregation of events and cases constitute a major challenge and opportunity for process analysis when using visual analytics methods.
In [
44], an approach to the categorization of process mining techniques regarding aspects of visual analysis is presented, while in [
45], the general-purpose tool “InterPretA” is proposed to perform interactive process analysis, combining pre-existing process mining techniques with visual analytics. This tool supports exploratory analysis through different views of the process in order to identify and examine causes of deviations. This tool could be reused in the field of auditing to support an audit framework. As an added value, it makes use of the context-aware performance analysis framework proposed in [
46] to provide and rank the statistically significant attributes (i.e., the process context).
2.3. Process Mining and Audit
Wil van der Aalst’s proposals, in [
3,
47], stand out among the approaches to apply process mining techniques in audits. Both proposals include applications of all process mining perspectives to audits. The first part of the discovery of the process model subsequently covers the conformance checking and also includes rule verification, organizational analysis, and performance evaluation. The second part proposes an audit framework based on process mining. It focuses on the detailed technical design of the data layer and includes risk assessment and context analysis of the detected irregularities. Its limitation is that it does not conceive the analysis of behavior patterns, which is an important tool in this field.
Pattern analysis based on process mining for auditing was developed by Mieke Jans in [
48,
49]. Its methodology includes the evaluation of sequences of activities, along with the analysis of roles, attributes, and social networks; however, it does not take advantage of the potential of visual sequence analysis to detect unusual elements.
Several approaches have similarly simplified the use of process mining for audits or conformance checking, directing their analysis towards the evaluation of rules or restrictions in the event log. A proposal based on the use of temporal logic operators, specifically an extension of linear temporal logic (LTL) for checking restrictions on the trace, is included in [
50], while a detailed explanation of the LTL language can be found in [
51]. As a result of this proposal, a repository is created with 60 standard rules for audits, which can be reused in any business environment by users without any technical knowledge of the LTL language. Another interesting approach oriented toward conformance checking was proposed by Rozinat [
52]. It combines the event log comparison with a pre-established process model in order to detect irregularities, and the analysis is based on checking restrictions by using declarative approaches such as LTL. The author points out the limits of the approaches based on rule checking, which do not allow detecting that a rule is broken multiple times in the same trace. To use rule-based audits, it is imperative that the auditor visualize the risk scenarios in advance. The effectiveness, therefore, depends on the acting auditors’ experience and knowledge of the business.
Other approaches, such as those formalized in [
53,
54,
55], are based on the detection of anomalies as a basis for audits using process mining. (An anomaly is understood as an exceptional execution or noise in the event log, possibly caused by system failures, error in data entry, or by fraud attempts; generalizing the term anomaly could make inference to rare and infrequent events, deviations from normal or regulated behavior, unexpected results, or to states outside the usual range of variation [
53].) The first includes a conformance checking of the traces against the model discovered, classifying them as normal and anomalous. The second proposal focuses on security. It proposes conformance analysis based on “token games”, comparing the trace against pre-established or discovered process models. In both cases, the proposed audit analyses are limited since they only include the perspective of control flow without evaluating particular sequences or behavior patterns. The third approach presents the search for anomalous situations based on the frequency of occurrence of sequences in traces (it assumes that the frequency is lower for anomalous sequences), ignoring the cases in which fraud becomes a frequent practice. None of these three approaches exploits the visual possibilities of process mining for the detection of anomalies.
In [
56], Chiu presents a framework to apply process mining to the detection of potentially fraudulent transactions. The proposal links activity patterns to possible fraud schema and assigns a level of risk to each. Later, in [
57], the same author combines the patterns detected by the process mining with the transactions’ monetary values (transaction values), thus making it possible to prioritize all instances based on the risk score and threshold. The proposed risk assessment framework using process mining improves audit efficiency regarding the examination of process instances that present potential internal control violations. The proposals, however, are limited to specific accounting cycles and depend on a prior formalization of the categories and sub-categories to classify the detected patterns (such as those presented in [
58] for the evaluated process) and on the prior knowledge of the fraud schemes, which complicates generalizing them to other business environments.
In [
59], Zerbino proposes a five-step, mining-based methodology for information system audits and validates it by implementing a case study. Its main contribution is that the methodology integrates expert system techniques and risk management to perform audits of information systems using process mining. The approach recommends categorizing the deviations so as to assign them the right priority, as in previous proposals (e.g., [
39]). Disadvantages include the fact that domain experts are needed to formulate the criteria required to estimate the severity of the non-conformance; this requires the prior existence of “de jure models”, which, unfortunately, are not always available. Further, the method does not include the visual possibilities of process mining with respect to increasing the effectiveness of audits.
Baader and Krcmar in [
60] combine the red flag approach with process mining to reduce the number of false positives in fraud detection. Nevertheless, the use of process mining is limited to visualizing fraudulent process instances with the corresponding red flags; therefore, it does not use the visual capabilities of process mining to detect previously unknown fraud patterns or patterns not easily identifiable through traditional mechanisms.
Finally, in [
61], an algorithm is proposed that combines the perspectives of flow control and financial audit data. The proposal, which integrates the results obtained from previous works [
62,
63,
64,
65], allows discovering process models on a colored Petri net (CPN) enriched with financial information appertaining to the process. As an alternative, in [
66], Werner uses data dependencies related to the accounting structure of recorded events to discover the control flow rather than the temporal order of the events. It is important to point out that this is done from a financial perspective, framing its field of action in ERP or similar solutions, thus limiting its scope. Moreover, the algorithm is not applicable to highly variable business processes. Complementing previous research, the author recently presented a new way of visualizing process mining results specifically for financial audits, in an aggregate manner, as materiality maps. Such maps provide an overview of an organization’s identified processes and indicate which business processes should be considered for audits [
67].
3. Fraud Data Analytics Methodology
Fraud auditing is a combination of risk assessment, data mining, and audit procedures designed to locate and identify fraud scenarios. It incorporates the concept of red flags into the audit process, linked to the fraud scenario concealment strategy associated with data, documents, internal controls, and behavior [
13].
Our proposal is based on a fraud audit approach [
68]. In this sense, we used the “Fraud data analytics methodology using fraud scenario approach to uncovering fraud in core business systems”. This methodology, proposed by Vona in [
13], has been widely used internationally in the field of fraud audits.
Fraud data analytics is the process of using data mining to analyze data for red flags that correlate with a specific fraud scenario. It is not about identifying fraud but rather identifying red flags in transactions that require an auditor to examine and formulate a decision. In essence, the fraud data analytics methodology includes the following steps: 1. Define the scope and audit objectives; 2. fraud risk assessment; 3. fraud data analytics; 4. fraud audit procedure; 5. report or conclusion.
The third step, “Fraud data analytics”, enables detecting transactions consistent with a fraud data profile. The fraud scenario establishes the specifications to design the search routine. Each data interrogation routine uses pattern recognition; however, the approach’s detection capability is limited in two ways:
Our proposal focuses on the third step in the methodology (“fraud data analytics”). It includes a complement to the detection based on search routines. Our solution makes it possible to detect fraud patterns using techniques that combine process mining with visual analysis to cover the weaknesses described above.
4. The Fraud Audits Approach
We present an approach to uncovering fraud in core business systems. The approach provides organizational and technological elements that support the work of auditors, combining process mining with visual analytics techniques to perform fraud audits.
The starting assumption is that the auditor has minimal knowledge of the business domain enabling him/her to make inferences about the behavior of the audited process. This does not require an a priori process model, the formalization of business restrictions, or information about the actors involved and their activity according to their respective roles.
Based on the proposal, we developed a technological solution, ABACO, to detect fraud data patterns during fraud audits. (ABACO is an audit data analytics solution developed to provide technological support to fraud audits. It includes multiple algorithms and analysis components of process mining combined with visual analytics techniques, which provide the auditor with powerful tools for the detection and analysis of fraudulent actions. The solution includes the following modules: Scenarios (complex risk scenario evaluation engine), audits (tool for visual analysis of behavior patterns based on process mining algorithms and developed from the approach described in the paper), anomalies (tool for detecting anomalies with data mining algorithms), control (tool for detecting unusual operations from statistical process control), links (tool for link analysis), analytics (tool for exploratory analysis), and modules for the management of alarms, files, and cases. Analysis components act on a business entity and transaction data in an XES-style database) It is currently being implemented by internal auditors and compliance officers in six financial institutions, a telecommunications company, and a large chain of outlets. The software has also been used by a consulting group of auditors, certified fraud examiners, and data engineers to provide professional services for more than five years, especially to the hotel and services sector. Its analysis and algorithm components have gradually evolved since 2013, undergoing improvements to increase the solution’s fraud detection effectiveness based on user experience.
The approach consists of two layers, one for the persistence of data—data persistence—and another for the analysis—visual analysis (See
Figure 1).
4.1. Data Persistence Layer
The persistence layer is composed of two elements: the central data repository (core data) and processes with which to integrate data (data integration).
4.1.1. Central Data Repository (Core Data)
The repository stores information on the activities executed as part of the processes and includes the relevant data for the fraud audit.
The design of the database employed to store traces is based on the structure and extensions of the XES standard [
69,
70]. The repository’s data structure does not vary as a result of changes in the process or the system to be audited, nor due to new variables, and not even when changes in the business environment occur. In other words, the abstraction level achieved in the data layer allows extensive reuse of the solution.
The data are initially stored in a temporary schema, a “Current Log”, which enables performing an online analysis. Once the process instances are completed, the corresponding events are transferred to the historical schema, a “Historical Log”, which guarantees the execution of the post-mortem analysis.
4.1.2. Data Integration
The approach includes the design and implementation of the extract–transform–load (ETL) processes of relevant data for standard structures.
The integration includes a trace analysis of operational systems, an identification of the audited business entities and their attributes, a selection of transactions to be evaluated with their attributes, and the design and implementation of the ETL processes necessary for its processing and standardization.
Our approach assumes the existence of the data attributes proposed in the reference methodology [
13]: the identifier of the instance or entity monitored (control number); the activity (the transaction’s alpha description); the time stamp (the transaction date); adding the transaction identifier and the originator or executor of each transaction.
The magnitude of the data integration processes, and the subsequent effectiveness of the audits depend on the degree of maturity of the traces stored in the operational systems, the quality of the information contained in the business database, and the structural complexity of the process and object of analysis. A detailed description of the methodology used for data integration is not within the scope of this paper.
4.2. Visual Analysis Layer
The visual analysis layer constitutes the core of the approach. It consists of six phases and two repositories.
For its design, we compiled good practices and experiences in the application of visual analysis techniques in actual fraud audits. We also considered the eight detection metrics for possible fraud in business processes (skipped activity, wrong resources, wrong duty, wrong pattern, wrong decision, wrong throughput time, parallel event, and originator behavior) summarized in [
71] in the literature review.
The proposed sequence of activities was validated and enriched by auditors from different business environments, where the ABACO solution had been introduced.
For each phase, we proposed an analysis technique that guaranteed the execution of the proposed actions. The technique selection process was carried out in two stages:
Stage I. Definition and weighting of the criteria for the selection of analysis techniques using the Delphi method [
72]. Summary of the main actions, decisions, and results:
Hypothesis test:
Hypothesis 0: There is no significant agreement among the experts.
Hypothesis 1: There is a significant agreement among the experts.
CR: K(N − 1) W > χ2 α; n − 1
We rejected the null hypothesis (H0) (a significance level (α = 0.05) was considered) and concluded that there was a significant agreement among the experts (W = 0.826866). The weighting (Ci) calculated for each criterion is shown in
Table 2.
- 2.
Stage II. Selection of the analysis technique to propose for the corresponding phases. To select the best alternative, experts started with the criteria defined in the previous stage and used the multicriteria decision-making method: analytic hierarchy process (AHP) [
80]. The main results are summarized as follow:
Figure 2 shows, for illustrative purposes, the results of applying the AHP, aimed at selecting the discovery algorithm to be used in the corresponding analysis phase. The consistency ratio (CR) was kept below 0.1, indicating that the inconsistency was acceptable. The preferred alternative, according to the AHP model, was the “Fuzzy Miner” with a priority of 0.3544.
The selected algorithms and the description of the main modifications made, based on the analysis requirements identified by the auditors, are included in the description of each phase. They represent a proposal only: experienced auditors can use alternative process mining techniques to execute the actions provided by the approach.
The comprehensive visual analysis process that specifies the application sequence and the interactions established between the analysis phases is shown in
Figure A1 of
Appendix A. The phases of the analysis are described below:
4.2.1. Phase I: Preliminary Analysis
The purpose of the preliminary analysis is to acquire an initial view of the process under analysis.
To execute this phase, we use the fuzzy miner discovery algorithm [
81], previously selected by the experts. Fuzzy miner stands out for its potential as regards processing events in unstructured processes and its ability to handle large amounts of data [
60]. Once the process model is discovered, a visual inspection is carried out in order to identify the following elements:
Missing activities: activities that, despite being known to be part of the process, are not recorded in the traces or cannot be reconstructed on the basis of the information available in the business databases. They are not, therefore, shown in the process model.
Exceptional activities: activities that are not part of the so-called “expected flow” of the process. These usually constitute rejection, cancellation, or compensation activities (triggered by system errors). It is common for there to be alternative flows to the normal process behavior, but their execution significantly increases the risk of fraudulent activity and the auditors must pay particular attention to them.
Exceptional sequences: We preliminarily analyze the main branches of the model discovered in an attempt to identify the sequences of activities that are clearly exceptional and violate its normal behavior logic. For example, an activity that runs after any activity that ends the process; that is, if we were analyzing an accounting process that included the payment of checks, and two activities of the type “collect check” were successively executed, we would clearly be in the presence of exceptional behavior, with a high probability of constituting a fraudulent action.
For unstructured processes, the visual identification of irregular behaviors is difficult at this stage of the analysis. In these cases, it is necessary to use functionalities to manage the process’s level of abstraction. Auditors must identify which event attributes would be relevant for fraud audits and cluster the activities according to these attributes. This makes it possible to simplify the model according to audit interests, and different views of the process are obtained.
Worthy of note, some adaptations were made to the fuzzy miner algorithm for use in audits:
Enabling the grouping of activities based on the value of an event attribute defined by the user (group consecutive events with an equal value in the specified attribute). When an event does not have this attribute, it continues to be a primitive node within the resulting model.
The establishment of a single configuration parameter to use the algorithm, depending on an edge’s desired strength. A color scale is established for the graphic representation of the model according to the parameter. Greater opacity is given to those edges whose relative frequency of appearance is below the value of the parameter. Those nodes whose input edges have a value lower than the defined frequency threshold will be represented together with greater opacity.
4.2.2. Phase II: Temporal Logic Filter
The second phase makes it possible to filter by evaluating complex risk scenarios, linking several conditions, and including temporal relationships between a case’s events. Its main objective is to prune the input data to the visual analysis algorithms, concentrate the search spaces, and maximize the effectiveness of the visual analysis.
The filtering component uses an adaptation of the linear temporal logic (LTL) to the event registers, which contain information concerning activities, cases, timestamps, originators, and related data [
50].
The LTL makes it possible to define logical expressions using standard comparison operators and temporal logic. The filtering capabilities are increased by extending the language with operators, which makes it possible to accumulate, perform algebraic operations, summations, counts, compare regular expressions; perform operations with universal and existential quantifiers, with geospatial operators, etc.
Additionally, we incorporated the possibility of establishing filters, which is based on the duration of the process cycle. Given the trace <ABDFEG>, this is understood as duration or execution time (tABDFEG = tG − tA)
The filters act on the standard and domain-specific attributes included in the event log. Filtering with LTL also makes it possible to check business rules expressed according to the following criteria [
47]:
Ordering-based (execution order of activities in one case).
Agent-based (participation of roles and executors in cases).
Value-based (specific domain attributes associated with activities).
An evaluation engine based on extended LTL was implemented. The LTL formulas to be evaluated are composed of the attribute definitions and of the formula text itself. To facilitate the construction of the formula, we implemented a declarative editor that allows auditors to build the expression by clicking, in a language that resembles a natural language. Later, the LTL expression is automatically generated and validated.
The auditor should use the results of the preliminary analysis to define the initial filtering. During the successive phases, the filtering options will be executed according to the available operators. The objective is to create new filters or refine the filtering scenarios using the indications arising from the visual analysis, which is used as a basis.
4.2.3. Phase III: Temporal Analysis
The objective of the visual detection of temporal patterns is to characterize the behavior of process events in relation to their moment of occurrence. For this task, we use the dotted chart technique [
82], which provides the auditor with an integral visual inspection of the process from different angles at the same time [
83]. The following sequence is proposed for the analysis:
Inspect the log according to the duration of the instances. It is important to focus on exceptional instances, that is, those whose duration is well above or below average. Given the possibilities offered by the algorithm, the auditor must also concentrate on the activities whose execution time differs from the instance’s usual behavior (locate points (events) outside the area with the highest concentration of points that contain normal behavior).
Carry out a subsequent analysis of the activities’ behavior in relation to time, concentrating on the activities identified as exceptional in the previous phase. Here we look for possible explanations for instances with exceptional behavior.
Filter by dates and times of special interest (e.g., holidays or days with a special work regime) in an attempt to examine whether the activity level on those days and at those times corresponds to the process’s logical behavior.
Analyze the methods of action of the different originators, their level of activity over time, and their relationship with the execution of exceptional activities and instances in order to identify patterns that differ from the originators’ usual behavior.
Use filtering options by domain attributes (value-based). The objective is to detect anomalous elements in the business process.
As a result of this phase, we obtain a set of instances with unusual behavior that must be re-evaluated in later phases.
4.2.4. Phase IV: Sequences Analysis
The objective, in this phase, is to visually detect anomalous sequences. The aim is to discover irregular sequences according to the order in which the activities appear. This is done using the trace alignment algorithm (the trace alignment algorithm leads to a visual representation of the sequences of process activities; it generates a graph in which each row corresponds to a different sequence of activities, grouping all the instances that follow the sequence. For each sequence (individual row), the activities are represented as different colored boxes, organized from left to right according to the order of occurrence. The algorithm succeeds in aligning activities with the same name in columns, thus increasing the possibility that auditors will visually detect patterns.) [
84], whose use during the audit should be oriented as explained below:
Evaluate the sequences of activities corresponding to instances that were unusual in the previous phases.
Discover all behavior patterns in the event log, focusing on the “exceptional activities” identified in Phase I. Direct the visual examination towards identifying concentrations of exceptional activities (once vertically aligned, as shown in
Figure 3) across multiple different sequences. The agglomerations of exceptional activities in the image could be a symptom of inefficiency or fraudulent activity.
Determine the patterns of a higher frequency of occurrence and then visually examine compliance with the main precedence rules between the business activities. Irregular behaviors may be identified, which, according to their high frequency, can be established as part of the usual process execution. In organizations, they are usually assumed to be normal behaviors, and it is, therefore, difficult to detect them using traditional auditing methods.
Examine the less frequent sequences. In practice, occasional executions can exceptionally deviate from the designed process. Not all exceptions necessarily indicate fraud. Some deviations are attributable to the process, while others remain within legal limits but are ineffective, and others, still, constitute anomalous extreme values that require further investigation. The truth is that they constitute the main source of relevant information for the fraud audit. Therefore, according to the extent to which the sequences move away from the process’s usual behavior, the probabilities of being linked to illicit activity increase.
Once exceptional sequences have been identified, we use the capability of filtering by business domain attribute. The objective is to conduct a preliminary investigation in order to reach an initial hypothesis regarding the legal nature of the exceptional sequences.
In order to use the trace alignment algorithm in audits, some adjustments were made:
We suppressed the algorithm’s initial data pre-processing step. In the algorithm’s initial stage, loop-type structures and outliers are eliminated (traces whose number of activities differs significantly from the average length of the remaining traces). This initial refinement process improves the alignment but limits the possibilities of detecting anomalies. With the executed adaptation, all the traces are processed and the process’s anomalous sequences are identified.
As an alternative, in this step, we group the traces based on the similarity of the sequences of activities carried out; the subsequent alignment is thus performed on groups of instances sharing a similar behavior, which improves the quality of the alignment and makes it easier for the auditor to visually interpret any suspicious fraud patterns.
4.2.5. Phase V: Link Analysis
The fifth phase is oriented towards the visual analysis of the interactions established between the process’s actors, and between these actors and the activities. The link analysis is carried out in two ways:
Internal analysis of the social network of the process executors. This type of analysis evaluates the transfer of work between originators, using a graph in which the nodes are the actors (originators) and the edges that connect them represent work transfer. It does not, therefore, apply to processes in which an originator usually performs all the instance activities. For the audit, we proceed to analyze the social links in the instances that were exceptional in the previous phases. The objective is to visually identify the degree of involvement and the possible role of the different originators within the network containing suspicious activity. An algorithm variant for social analysis could be the modified fuzzy miner, using the originators as nodes. Alternatively, we can use social networks based on known metrics [
85] such as handover-of-work, subcontracting, reassignment (task delegation), or working together (joint work in the same case, not necessarily directly related). All of this provides additional, valuable information to the analyst about the behavior and the possible correlation between the executors.
The analysis of internal links is framed only in the relationships established between the executors of the case.
- 2.
External analysis of links between process entities. Unlike the previous analysis, the objective here is to visually analyze the network of links established between entities corresponding to the different instances of a process. The analysis applies to processes in which the instances exchange information based on the activities registered in the trace (for example, if we analyze the behavior of bank accounts as the instances of a process, a transfer of funds could link multiple accounts). As in the previous case, the analysis is triggered by the cases identified as unusual in previous phases. A network linking multiple instances with unusual behavior could indicate the presence of organized criminal activity. The resulting network is characterized by the implementation of a link analysis solution. This enables detecting communities automatically using the Louvain algorithm [
86] because of its effectiveness and suitability for large graphs; nodes with unusual behavior within the network are discovered using the community anomaly detection algorithm: “InterScore” [
87].
In [
88], a case study is presented for an internal audit of the procurement process at a financial services provider. In Section 6.4, “Social Network Analysis” of this paper, the author describes an interesting example of the Link Analysis application in the area of audits.
4.2.6. Phase VI: Exceptional Pattern Analysis
In this phase, the visual evaluation of exceptional patterns consists of a combined examination of the irregularities detected in the previous phases. This is done using the performance sequences analysis algorithm [
89]. The actions to be executed are explained below:
Use the algorithm’s capabilities to simultaneously evaluate exceptional execution sequences (patterns analyzed using trace alignment) and their behavior in relation to time (examined in Phase III using the dotted chart). The objective is to clarify or extend the analysis of irregular patterns that are more likely to constitute illicit actions. Instances involved in irregular patterns detected via Link Analysis can also be included. The analysis must be complemented with the filtering capabilities on sequences extended to the algorithm.
When the process is unstructured or contains many different activities, we increase the process’s level of abstraction by clustering sequences of activities in representative groups (extended algorithm functionalities). We generally group the sequences that describe the process’s regulated or expected behavior. This makes it possible to simplify the visual analysis of the resulting behaviors and concentrate the analysis on alternative sequences.
The data processing in this phase includes the possibility of detecting additional anomalous behaviors that have not yet been identified.
The adaptations made to the performance sequences analysis algorithm to enhance its use in audits are as follows (the PSA was evaluated as a potential audit tool because of its ability to analyze existing patterns [
88]. The proposal focuses on the frequency of pattern appearance, centering on the evaluation of infrequent patterns that may indicate fraud.):
Manage the process’s level of visual abstraction by clustering sequences of activities in representative groups. For example: given the sequence of events <ABCDEFG>, it is possible to define the sub-sequence <BCDEF> as “S1”. The behavior resulting from the new sequence is shown in
Figure 4. It is possible to run all the algorithm’s original features on the resulting patterns once the sequence event log has been modified (modified sequence).
Incorporate filtering options into activities or sub-sequences contained in the event log patterns. The filters allow the following: given two elements that are not necessarily consecutive, (activities <A> and <C> or a specific sub-sequence of activities <ABD>, or of certain originators <Juan-Pedro>), to determine the instances that contain them, filter by temporal restrictions and evaluate the behavior of the process’s execution times.
Added metrics that are valuable for audits, such as: the “Execution time” of an individual activity, or of a specific sub-sequence of activities previously specified as <ABD>.
4.2.7. General Considerations
According to the context of the application, it will not always be necessary to apply all the proposed phases or all the analysis elements included within each phase as a reference. Moreover, Phases III, IV, and V can be executed in any order, or even simultaneously, depending on the scenario. This makes it possible to use the partial outputs of each of these phases as inputs for the other two, thereby helping to perform a better analysis. The filtering possibilities included in Phase II can similarly be used alternatively during the three subsequent phases.
In addition to these phases, our proposal includes two repositories:
4.2.8. Knowledge Center
This repository stores filter combinations (risk scenarios defined in extended LTL) that are effective for pruning data prior to analysis, using process mining algorithms.
Stored here are the data also corresponding to process instances marked as suspicious by auditors in order to reanalyze them later using other algorithms.
The stored information should serve as a basis for future work using machine learning techniques combined with process mining. These should improve the detection of anomalous behaviors, thus raising fraud audit effectiveness levels.
4.2.9. Component Repository
All the analysis components of the developed tool are extensible through plugins. In this respect, a repository exists, enabling the selection of the appropriate algorithm and its subsequent use by auditors in order to cover the different phases of analysis explained above.
5. Use Case: Implementation at a Point of Sale of the Hospitality Sector
For lack of space, this section only describes the main implementation results of the “Visual Analysis Layer”, which is the core of the approach. The validation of the “Data Persistence Layer” will be included in subsequent works. For the purposes of the present use case, the integration and data persistence processes were considered to have been correctly executed.
We processed the traces by referring to the operations of customers (real people) at a restaurant (point of sale), which had been stored for three years in a hotel management system, totaling 6285 instances and 21,714 activities. When operations are recorded, they are associated with checks. A check is opened to receive a customer request, it is modified during consumption, and is closed once the bill is settled. A check is defined as the instance of the evaluated process.
Prior to executing the analysis described below, the hotel underwent an external audit which lasted a month. The audit findings presented were not detected by the external auditors.
5.1. Preliminary Analysis
We discovered the process model using the fuzzy miner algorithm (
Figure 5). The model provides an overview of the process’s behavior.
Five different activities were registered in the system beforehand. The process starts with the “Open Check” activity—the customer requests the service—and concludes with the “Close Check” activity—the customer pays the amount required for the products consumed. If errors occur during the check operation, the “Annul check” activity is recorded.
Two exceptional activities, “Annul check” and “suppress product”, were identified a priori, and designed into the system to correct the errors that occurred during the process. Both activities were represented with more opaque colors, indicating a lower significance in the process. However, in the case of “suppress product”, the significance became 0.27, indicating that in 27% of the processed checks, products were canceled. This was an unusual value that needed to be considered for further analysis. No exceptional process sequences were identified in this phase.
The preliminary analysis also showed the auditors that there were relevant operations—such as “Insert product”—that did not have traceability in the system (missing activities) and were not, therefore, reflected in the graph discovered.
5.2. Temporal Analysis
We employed a view to analyze the instances’ behavior over time using a dotted chart (It shows a graph of points on which each point represents an event with two dimensions. The time dimension is on the horizontal axis and the class to which the event belongs is on the vertical axis. The class may vary depending on the analyst’s objectives (the originators, the activities, or the instances of the process can be selected as a class). The color and shape of each point (event) can refer to different attributes) (
Figure 6). The figure presents a relative view of the moments in time (hours) of the operations (colored points according to the activity) performed on checks (rows).
It shows a compact grouping of points (events) executed during the first two hours of each instance. This coincides with the logical amount of time that a client stays in a restaurant; however, the red box contains a significant number of unusual points, indicating the existence of multiple operations performed on checks that exceeded three hours. This behavior is suspicious, considering the restaurant operates in shifts of 3 h and a normal customer does not take more than three hours to eat at a restaurant.
Using the capabilities of the filtering component (temporal logic filter), the data were pruned to visualize the behavior of the checks with an execution time that exceeded three hours (
Figure 7). We detected a higher incidence of suppressed product activities (bright blue dots) and the subsequent closure of checks (yellow dots). One behavior was visually detailed in which, 27 h after the check was opened, two product deletions occurred, the check was printed (a voucher with the bill shown to the customer), and the check was subsequently closed in the system. The above behavior is highly indicative of fraudulent activity considering that a customer does not stay in a restaurant, receiving services, for more than a day.
Figure 7 also shows the result of a “value-based” filter to detect instances lasting over three hours: restricting the payment is “effective”. The indicated check behaves as follows: the bill is printed (last operation registered in the system in the customer’s physical presence) and 23 h later, seven products are deleted, and the check is subsequently closed (with the corresponding record in the system’s bill). This behavior could indicate the use of ghost clients to commit fraud; that is, records in the system associated with a customer that never existed (it does not make sense to modify a check whose consumption bill was printed for the customer on the previous day).
Figure 8 shows a relative view over time, with the operations on checks (points) executed by the originators (shown in each row). The objective is to evaluate the incidence of the different executors regarding the operations performed using the system.
We then used filtering options to show the originators’ behavior in relation to the exceptional “Suppress product” activity according to the date on which they occurred (in
Figure 9, product cancellation activities are shown as points by each originator, according to the date on which they occurred). The results show that the user who canceled the greatest number of products was also the one who performed the biggest number of operations outside the established schedule.
Finally, a relative logical view was obtained using a dotted chart (the instances are placed in rows, the color of the points represents the type of operation to be performed, and the
x-axis shows the amounts of operations in each check). The image (
Figure 10) makes it possible to identify checks presenting more than 30 removed products (violet dots).
As a result of performing the “Temporal Analysis” phase, we identified irregularities referring to operations performed outside service hours, with a high incidence of exceptional product elimination activities. We also detected workers who frequently operated outside established hours and who tended to execute multiple product eliminations for each check.
5.3. Sequence Analysis
To identify irregular sequences according to the order in which the activities appeared, an overview of the process sequences was obtained using trace alignment (
Figure 11).
A preliminary examination of the sequences shown in
Figure 11 reveals the existence of 73 different process execution sequences. Only one sequence conformed to the expected normal process sequence (Open → Print → Close). According to the trace alignment results, of the total, 3570 instances followed the regulated process. Over 2700 instances (accounting for 43% of attended customers) followed exceptional sequences.
A high concentration of the exceptional operation “suppress product” (shown in red) could also be appreciated across the process’s different sequences. This behavior could be interpreted as a high error rate of product registrations during the checks or as habitual fraud, related to the exceptional operation. In total, product eliminations occurred in approximately 30% of the total processed checks. In addition, an average of more than two products was canceled per check, which is a high value.
We then analyzed the different patterns presenting the exceptional activity “suppress product” (and we also identified irregularities associated with this activity in the previous phase):
We used ordering-based filters to obtain the sequences in which product deletions occurred after printing. The filter specification in LTL language using the temporal logic filter was as follows:
ate.ACTIVITY as ACTIVITY = A equals “suppress product”;
ate.ACTIVITY as ACTIVITY = I equals “print check”;
formula := <>( (ACTIVITY == I /\ <>( ACTIVITY == A )));
The visual output of the trace alignment with the filtered data is presented in
Figure 12.
The cancellation of checks is an exceptional activity presenting the lowest frequency in the process. However, it is extremely risky because it can be used to charge the customer for a product or service and not leave records of the income in the system.
We filtered the sequences that contained the “Annul check” activity and visually detected a group of sequences with check cancellations without the prior suppression of the products inserted before closing the check (a business rule established by the hotel to prevent fraud). This behavior is visualized using a temporary ordering-based filter, which returns 66 checks incurring the anomalous behavior explained above. The filtered data are subsequently processed using trace alignment (See
Figure 13).
Filter specification is expressed in the LTL language, using the temporal logic filter:
ate.ACTIVITY as ACTIVITY =B equals “Annul check”;
ate.ACTIVITY as ACTIVITY =A equals “Suppress product”;
ate.ACTIVITY as ACTIVITY =C equals “Close Check”;
formula := (<>(ACTIVITY == B)/\ !(<>( (ACTIVITY == A/\ _O(ACTIVITY == C )))));
Figure 13 shows two sequences containing the behavior described, (the first “Open → Close → Annul_check” and the second “Open → Print → Close → Annul_check”).
We additionally employed visual analysis using trace alignment to identify a group of 211 checks in which products had been eliminated and the activity “Print_Check” was not executed (signifying that the user had paid without previously checking the consumption). This behavior could be used to commit fraud.
Figure 14 shows the algorithm’s output (the opening of the check in dark green -a0-; the eliminations of products -d0- in purple; the closing operation -c0- in purple and, at the end of the process, the annulment of checks-e0- in light green).
Figure 15 shows the sequences that include product deletions and whose means of payment (attribute of the instance) is “Credit Card” or “Cash”, using the filtering capabilities of Phase II.
Figure 15a shows only four sequences with suppressed products (activity indicated in red -b- on the image) when using a credit card. Keeping in mind that these sequences involve only eight checks in two years, we can infer that when credit cards are used, almost no products are suppressed. We could also appreciate that a product was never deleted after printing the bill for a customer who paid with a credit card.
Conversely,
Figure 15b shows that when paying in cash, 29 different sequences are found involving product suppressions (activity exposed in red -b-) across hundreds of checks. Therefore, it is likely that cash is being used for fraudulent actions at points of sale.
5.4. Exceptional Pattern Analysis
We used the performance sequences analysis in order to conduct a combined examination of the irregularities detected in previous phases. The algorithm enables simultaneously evaluating exceptional execution sequences and abnormal patterns detected according to the time and originators of the process.
There can be as many combinations of filters to be executed with the PSA to visually analyze the irregularities detected in previous phases as those projected by the auditor to clarify and guide the investigation.
As an illustration, we present a view of the PSA that shows instance patterns exceeding 12 h of execution (irregular temporal patterns), which also execute consecutive suppressions of over five products per check (filters by specific sub-sequences of irregular activities). To finish, we applied the following restrictions: that the check has not been annulled and that the means of payment is ‘charge to the room’ (filter for specific domain attributes). The algorithm’s output is shown in
Figure 16.
The algorithm’s visual output, combined with the statistics shown in the image, shows which instance with the longest duration in each pattern oscillates between 20 and 27 hours. Deletion sequences exceeding five products occur before the printing of the check (for patterns 2 and 3) and after the printing of the check (for pattern 0). For filtered cases, the possibility of errors having been incurred that justify the facts is minimal, and the probability of constituting fraudulent sequences is, therefore, high.
We also visually detected that “Pattern 1” included multiple product deletions without a subsequent printing of the bill to be signed by the customer, recording the consumption. This type of pattern could indicate the presence of fraudulent actions, which seek to charge products that were never consumed to the customer’s bill.
As a complement to the analysis and evidence accumulated, the auditor should initiate a field investigation of the checks and users involved, prioritizing the analysis of the most suspicious elements.
In this case, we did not use the extended functionalities that allowed clustering the activity sequences in order to achieve visual abstractions of the patterns. Indeed, we were in the presence of a structured process with few different activities, and carrying out the clustering would not have contributed any added value to the visual analysis.
6. Conclusions
Process mining is a promising approach when seeking to extract underlying information from traces found in systems.
In this paper, we conceptualized an approach based on the organizational and technological elements that support auditing work. The main advantage of our approach is how it combines the visual potential of existing process mining techniques and algorithms to apply to the field of fraud audits.
The approach is composed of two layers: a data persistence layer, “Core Data”, and an analysis layer, “Visual Analysis”. The visual analysis layer lies at the core of our approach. It is divided into six phases that describe the actions to follow to detect fraud patterns. The phases were conceptualized based on the experience of audits conducted using process mining over multiple real scenarios.
The analysis techniques proposed in the approach were selected by a group of experts in fraud audits, using the Delphi method and the analytic hierarchy process (AHP). Several algorithms used (fuzzy miner, performance sequences analysis, and trace alignment) were modified in order to enhance their effectiveness in audits.
Based on the proposed approach, we developed a technological solution (ABACO) to detect fraud data patterns during fraud audits. It is currently being implemented by internal auditors and compliance officers in six financial institutions, a telecommunications company, a hotel chain, and a large chain of outlets.
For demonstration purposes, we presented a real hotel management use case. As a result of the practical validation, we detected the following suspected fraudulent behaviors: operations on checks outside service hours; a concentration of activities and exceptional sequences of product deletions with fraudulent characteristics; a high incidence of specific users in the execution of anomalous activities; vulnerabilities in the handling of checks when cash or room charging was used as a means of payment; breaches of control objectives established to cancel checks, and multiple executions that followed alternative behavior patterns to those that were institutionally regulated.
The results validated the effectiveness of using process mining combined with visual analytics in fraud audits. The study thus lays the foundations for the evaluation of new methods and algorithms that will enhance and consolidate visual audits for fraud detection of traces.
7. Limitations and Future Work
Although we propose methodological elements that guide the audit process, the flows that combine the analysis techniques in a business domain are executed manually. The automatic reuse of analysis flows in similar environments is not yet possible.
As an additional limitation, the structure used to store the events does not allow examining the process from different perspectives. This limits the possibilities of analysis.
In the future, we plan to:
Work on a proposal for the MDA type (Model Driven Architecture) that will allow generating multiplatform code automatically from previously modeled analysis flows, combining process mining techniques and visual analytics for fraud audits.
Develop a proposal for the conceptual design of the phases of a multidimensional data warehouse that enables multi-perspective event log and focuses on fraud audits.
Work on a paper that includes new real use cases with more activities to extend the experimental validation of the proposal.
Author Contributions
Conceptualization M.M.-S., J.-F.R.-Q., J.T., A.M., and L.I.-N.; formal analysis J.-F.R.-Q. and A.S.-D.; funding acquisition M.M.-S. and J.T.; investigation M.M.-S., J.-F.R.-Q., J.T., and L.I.-N.; methodology M.M.-S., J.-F.R.-Q., J.T., and A.M.; project administration J.-F.R.-Q., M.M.-S., and L.I.-N.; software L.I.-N., J.-F.R.-Q., and A.S.-D.; supervision J.-F.R.-Q., M.M.-S., and L.I.-N.; validation J.-F.R.-Q.; visualization J.-F.R.-Q.; writing—original draft J.-F.R.-Q., A.S.-D., and A.M.; writing—review and editing J.-F.R.-Q., A.M., A.S.-D., J.T., L.I.-N., and M.M.-S. All authors have read and agreed to the published version of the manuscript.
Funding
This work has been co-funded by the ECLIPSE-UA (RTI2018-094283-B-C32) project funded by the Spanish Ministry of Science, Innovation.
Institutional Review Board Statement
Not applicable.
Informed Consent Statement
Not applicable.
Data Availability Statement
The data presented in this study are available on request from the corresponding author. The data are not publicly available due to the need to be anonymized.
Conflicts of Interest
The authors declare no conflict of interest.
Appendix A
Figure A1.
Visual analysis process.
Figure A1.
Visual analysis process.
References
- Association of Certified Fraud Examiners. Report to the Nations: 2018 Global Study on Occupational Fraud and Abuse; ACEF: Austin, TX, USA, 2018. [Google Scholar]
- Ngai, E.W.T.; Hu, Y.; Wong, Y.H.; Chen, Y.; Sun, X. The application of data mining techniques in financial fraud detection: A classification framework and an academic review of literature. Decis. Support Syst. 2011, 50, 559–569. [Google Scholar] [CrossRef]
- van der Aalst, W.M.P.; van Hee, K.M.; van der Werf, J.M.E.M.; Verdonk, M. Auditing 2.0: Using Process Mining to Support Tomorrow’s Auditor. IEEE Comput. 2010, 43, 90–93. [Google Scholar] [CrossRef]
- Werner, M.; Gehrke, N.; Nuttgens, M. Business Process Mining and Reconstruction for Financial Audits. In Proceedings of the 45th Hawaii International Conference on System Sciences, Maui, HI, USA, 4–7 January 2012; pp. 5350–5359. [Google Scholar]
- Accorsi, R.; Wonnemann, C. Auditing Workflow Executions against Dataflow Policies. In Proceedings of the Business Information Systems, 13th International Conference, BIS 2010, Berlin, Germany, 3–5 May 2010; pp. 207–217. [Google Scholar]
- Vona, L.W. Fraud Risk Assessment: Building a Fraud Audit Program; J. Wiley & Sons: Hoboken, NJ, USA, 2008. [Google Scholar]
- Byrnes, P.E.; Criste, T.R.; Stewart, T.R.; Vasarhelyi, M. Reimagining Auditing in a Wired World. In Audit Analytics and Continuous Audit: Looking toward the Future; American Institute of Certified Public Accountants (AICPA): New York, NY, USA, 2015. [Google Scholar]
- Lenz, R. Time Is Ripe to Revolutionize the Audit. EDPACS 2017, 56, 19–22. [Google Scholar] [CrossRef]
- Appelbaum, D.; Kogan, A.; Vasarhelyi, M.A. Big Data and Analytics in the Modern Audit Engagement: Research Needs. Audit. J. Pract. Theory 2017, 36, 1–27. [Google Scholar] [CrossRef]
- Gepp, A.; Linnenluecke, M.K.; O’Neill, T.J.; Smith, T. Big data techniques in auditing research and practice: Current trends and future opportunities. J. Account. Lit. 2018, 40, 102–115. [Google Scholar] [CrossRef]
- Li, H.; Dai, J.; Gershberg, T.; Vasarhelyi, M.A. Understanding usage and value of audit analytics for internal auditors: An organizational approach. Int. J. Account. Inf. Syst. 2018, 28, 59–76. [Google Scholar] [CrossRef]
- Appelbaum, D.A.; Kogan, A.; Vasarhelyi, M.A. Analytical procedures in external auditing: A comprehensive literature survey and framework for external audit analytics. J. Account. Lit. 2018, 40, 83–101. [Google Scholar] [CrossRef]
- Vona, L.W. Fraud Data Analytics Methodology: The Fraud Scenario Approach to Uncovering Fraud in Core Business Systems; John Wiley & Sons: Hoboken, NJ, USA, 2017. [Google Scholar]
- Claes, J.; Poels, G. Process Mining and the ProM Framework: An Exploratory Survey. In Proceedings of the Business Process Management Workshops—BPM 2012 International Workshops, Tallinn, Estonia, 3 September 2012; Revised Papers. pp. 187–198. [Google Scholar]
- Levy, I.; Hasson, U.; Malach, R. One Picture Is Worth at Least a Million Neurons. Curr. Biol. 2004, 14, 996–1001. [Google Scholar] [CrossRef]
- Iliinsky, N.; Steele, J. Designing Data Visualizations: Representing Informational Relationships; O’Reilly Media: Sebastopol, CA, USA, 2011. [Google Scholar]
- Wright, W.F. Superior loan collectibility judgments given graphical displays. Auditing 1995, 14, 144. [Google Scholar]
- Anderson, J.C.; Reckers, P.M.J. An empirical investigation of the effects of presentation format and personality on auditor’s judgment in applying analytical procedures. Adv. Account. 1992, 10, 19–43. [Google Scholar]
- Anderson, J.C.; Mueller, J.M. The Effects Of Experience And Data Presentation Format On An Auditing Judgment. J. Appl. Bus. Res. 2005, 21, 53–63. [Google Scholar] [CrossRef][Green Version]
- Alawadhi, A. The Application of Data Visualization in Auditing. Ph.D. Thesis, Rutgers University-Graduate School-Newark, Newark, NJ, USA, 2015. [Google Scholar]
- Leite, R.A.; Gschwandtner, T.; Miksch, S.; Gstrein, E.; Kuntner, J. Visual analytics for event detection: Focusing on fraud. Vis. Inform. 2018, 2, 198–212. [Google Scholar] [CrossRef]
- Shi, Y.; Liu, Y.; Tong, H.; He, J.; Yan, G.; Cao, N. Visual Analytics of Anomalous User Behaviors: A Survey. IEEE Trans. Big Data 2020, 1. [Google Scholar] [CrossRef]
- Leite, R.A.; Gschwandtner, T.; Miksch, S.; Kriglstein, S.; Pohl, M.; Gstrein, E.; Kuntner, J. EVA: Visual Analytics to Identify Fraudulent Events. IEEE Trans. Vis. Comput. Graph. 2018, 24, 330–339. [Google Scholar] [CrossRef]
- Fischer, F.; Keim, D.A. NStreamAware: Real-time visual analytics for data streams to enhance situational awareness. In Proceedings of the Eleventh Workshop on Visualization for Cyber Security, Paris, France, 10 November 2014; pp. 65–72. [Google Scholar]
- Suntinger, M.; Obweger, H.; Schiefer, J.; Gröller, M.E. The Event Tunnel: Interactive Visualization of Complex Event Streams for Business Process Pattern Analysis. In Proceedings of the IEEE VGTC Pacific Visualization Symposium 2008, PacificVis 2008, Kyoto, Japan, 5–7 March 2008; pp. 111–118. [Google Scholar]
- Legg, P.A. Visualizing the insider threat: Challenges and tools for identifying malicious user activity. In Proceedings of the 2015 IEEE Symposium on Visualization for Cyber Security, VizSec 2015, Chicago, IL, USA, 25 October 2015; pp. 1–7. [Google Scholar]
- Gómez, J.A.G.; Wilson, A.; Liu, J.; Davies, D.; Jarvis, P.; Bier, E. Network Explorer: Design, Implementation, and Real World Deployment of a Large Network Visualization Tool. In Proceedings of the International Working Conference on Advanced Visual Interfaces, AVI 2016, Bari, Italy, 7–10 June 2016; pp. 108–111. [Google Scholar]
- Niu, Z.; Cheng, D.; Zhang, L.; Zhang, J. Visual Analytics for Networked-Guarantee Loans Risk Management. In Proceedings of the IEEE Pacific Visualization Symposium, PacificVis 2018, Kobe, Japan, 10–13 April 2018; pp. 160–169. [Google Scholar]
- Didimo, W.; Liotta, G.; Montecchiani, F.; Palladino, P. An advanced network visualization system for financial crime detection. In Proceedings of the IEEE Pacific Visualization Symposium, PacificVis 2011, Hong Kong, China, 1–4 March 2011; pp. 203–210. [Google Scholar]
- Argyriou, E.N.; Symvonis, A.; Vassiliou, V. A Fraud Detection Visualization System Utilizing Radial Drawings and Heat-maps. In Proceedings of the 5th International Conference on Information Visualization Theory and Applications, IVAPP 2014, Lisbon, Portugal, 5–8 January 2014; pp. 153–160. [Google Scholar]
- Schäfer, M.; Wanner, F.; Mansmann, F.; Scheible, C.; Stennett, V.; Hasselrot, A.T.; Keim, D.A. Visual pattern discovery in timed event data. In Proceedings of the Visualization and Data Analysis 2011, San Francisco, CA, USA, 24–25 January 2011; p. 78680K. [Google Scholar]
- Sun, J.; Zhu, Q.; Liu, Z.; Liu, X.; Lee, J.; Su, Z.; Shi, L.; Huang, L.; Xu, W. FraudVis: Understanding Unsupervised Fraud Detection Algorithms. In Proceedings of the IEEE Pacific Visualization Symposium, PacificVis 2018, Kobe, Japan, 10–13 April 2018; pp. 170–174. [Google Scholar]
- Dilla, W.N.; Raschke, R.L. Data visualization for fraud detection: Practice implications and a call for future research. Int. J. Account. Inf. Syst. 2015, 16, 1–22. [Google Scholar] [CrossRef]
- van der Aalst, W.M.P.; Adriansyah, A.; de Medeiros, A.K.A.; Arcieri, F.; Baier, T.; Blickle, T.; Bose, R.P.J.C.; van den Brand, P.; Brandtjen, R.; Buijs, J.C.A.M.; et al. Process Mining Manifesto. In Proceedings of the Business Process Management Workshops—BPM 2011 International Workshops, Clermont-Ferrand, France, 29 August 2011; pp. 169–194. [Google Scholar]
- Walicki, M.; Ferreira, D.R. Sequence partitioning for process mining with unlabeled event logs. Data Knowl. Eng. 2011, 70, 821–841. [Google Scholar] [CrossRef][Green Version]
- van der Aalst, W.M.P.; Weijters, A.J.M.M. Process mining: A research agenda. Comput. Ind. 2004, 53, 231–244. [Google Scholar] [CrossRef]
- Rozinat, A.; van der Aalst, W.M.P. Conformance checking of processes based on monitoring real behavior. Inf. Syst. 2008, 33, 64–95. [Google Scholar] [CrossRef]
- Munoz-Gama, J.; Carmona, J. A Fresh Look at Precision in Process Conformance. In Proceedings of the Business Process Management - 8th International Conference, BPM 2010, Hoboken, NJ, USA, 13–16 September 2010; pp. 211–226. [Google Scholar]
- Hosseinpour, M.; Jans, M. Categorizing Identified Deviations for Auditing. In Proceedings of the 6th International Symposium on Data-driven Process Discovery and Analysis (SIMPDA 2016), Graz, Austria, 15–16 December 2016; pp. 125–129. [Google Scholar]
- Rozinat, A.; Mans, R.S.; Song, M.; van der Aalst, W.M.P. Discovering simulation models. Inf. Syst. 2009, 34, 305–327. [Google Scholar] [CrossRef]
- Jans, M.; Alles, M.; Vasarhelyi, M. Process Mining of Event Logs in Auditing: Opportunities and Challenges. Ssrn Electron. J. 2010. [Google Scholar] [CrossRef]
- van der Aalst, W.M.P. Process Mining—Data Science in Action, 2nd ed.; Springer: Berlin/Heidelberg, Germany, 2016. [Google Scholar]
- Gschwandtner, T. Visual Analytics Meets Process Mining: Challenges and Opportunities. In Proceedings of the Data-Driven Process Discovery and Analysis—5th IFIP WG 2.6 International Symposium, SIMPDA 2015, Vienna, Austria, 9–11 December 2015; pp. 142–154. [Google Scholar]
- Kriglstein, S.; Pohl, M.; Rinderle-Ma, S.; Stallinger, M. Visual Analytics in Process Mining: Classification of Process Mining Techniques. In Proceedings of the EuroVis Workshop on Visual Analytics, EuroVA 2016, Groningen, The Netherlands, 6–7 June 2016; pp. 43–47. [Google Scholar]
- Dixit, P.M.; Caballero, H.S.G.; Corvò, A.; Hompes, B.F.A.; Buijs, J.C.A.M.; van der Aalst, W.M.P. Enabling Interactive Process Analysis with Process Mining and Visual Analytics. In Proceedings of the 10th International Joint Conference on Biomedical Engineering Systems and Technologies (BIOSTEC 2017), Porto, Portugal, 21–23 February 2017; pp. 573–584. [Google Scholar]
- Hompes, B.; Buijs, J.C.A.M.; van der Aalst, W.M.P. A Generic Framework for Context-Aware Process Performance Analysis. In Proceedings of the On the Move to Meaningful Internet Systems: OTM 2016 Conferences—Confederated International Conferences: CoopIS, C&TC, and ODBASE 2016, Rhodes, Greece, 24–28 October 2016; pp. 300–317. [Google Scholar]
- van der Aalst, W.M.P.; van Hee, K.M.; van der Werf, J.M.E.M.; Kumar, A.; Verdonk, M. Conceptual model for online auditing. Decis. Support Syst. 2011, 50, 636–647. [Google Scholar] [CrossRef]
- Jans, M.; Alles, M.G.; Vasarhelyi, M.A. A Field Study on the Use of Process Mining of Event Logs as an Analytical Procedure in Auditing. Account. Rev. 2014, 89, 1751–1773. [Google Scholar] [CrossRef]
- Jans, M.; Depaire, B.t.; Vanhoof, K. Does Process Mining Add to Internal Auditing? An Experience Report. In Proceedings of the Enterprise, Business-Process and Information Systems Modeling—12th International Conference, BPMDS 2011, and 16th International Conference, EMMSAD 2011, held at CAiSE 2011, London, UK, 20–21 June 2011; pp. 31–45. [Google Scholar]
- van der Aalst, W.M.P.; de Beer, H.T.; van Dongen, B.F. Process Mining and Verification of Properties: An Approach Based on Temporal Logic. In Proceedings of the On the Move to Meaningful Internet Systems 2005: CoopIS, DOA, and ODBASE, OTM Confederated International Conferences CoopIS, DOA, and ODBASE 2005, Agia Napa, Cyprus, 31 October–4 November 2005; pp. 130–147. [Google Scholar]
- De Beer, H.; Van Den Brand, P.C.W. The LTL Checker Plugins: A Reference Manual. Eindhoven Univ. Technol. 2004, 132, 1–46. [Google Scholar]
- Rozinat, A. Process Mining: Conformance and Extension. Ph.D. Thesis, Technische Universiteit Eindhoven, Eindhoven, The Netherlands, 2010. [Google Scholar]
- de Lima Bezerra, F.; Wainer, J.; van der Aalst, W.M.P. Anomaly Detection Using Process Mining. In Proceedings of the Enterprise, Business-Process and Information Systems Modeling, 10th International Workshop, BPMDS 2009, and 14th International Conference, EMMSAD 2009, held at CAiSE 2009, Amsterdam, The Netherlands, 8–9 June 2009; pp. 149–161. [Google Scholar]
- van der Aalst, W.M.P.; de Medeiros, A.K.A. Process Mining and Security: Detecting Anomalous Process Executions and Checking Process Conformance. Electron. Notes Theor. Comput. Sci. 2005, 121, 3–21. [Google Scholar] [CrossRef]
- Bezerra, F.; Wainer, J. Auditing workflow logs for fraud detection. In Proceedings of the KDD 2008 Workshop on Data Mining for Business Applications, Las Vegas, NV, USA, 24–27 August 2008; pp. 1–5. [Google Scholar]
- Chiu, T.; Wang, Y.; Vasarhelyi, M. A Framework of Applying Process Mining for Fraud Scheme Detection. Ssrn Electron. J. 2017. [Google Scholar] [CrossRef]
- Chiu, T.; Vasarhelyi, M.; Alrefai, A.; Yan, Z. Validating Process Mining: A Framework Integrating Auditorrs Risk Assessment. Ssrn Electron. J. 2018. [Google Scholar] [CrossRef]
- Chiu, T.; Jans, M. Process Mining of Event Logs: A Case Study Evaluating Internal Control Effectiveness. Account. Horiz. 2019, 33, 141–156. [Google Scholar] [CrossRef]
- Zerbino, P.; Aloini, D.; Dulmin, R.; Mininno, V. Process-mining-enabled audit of information systems: Methodology and an application. Expert Syst. Appl. 2018, 110, 80–92. [Google Scholar] [CrossRef]
- Baader, G.; Krcmar, H. Reducing false positives in fraud detection: Combining the red flag approach with process mining. Int. J. Account. Inf. Syst. 2018, 31, 1–16. [Google Scholar] [CrossRef]
- Werner, M.; Gehrke, N. Multilevel Process Mining for Financial Audits. IEEE Trans. Serv. Comput. 2015, 8, 820–832. [Google Scholar] [CrossRef]
- Gehrke, N. Basic Principles of Financial Process Mining A Journey through Financial Data in Accounting Information Systems. In Proceedings of the Sustainable IT Collaboration Around the Globe, 16th Americas Conference on Information Systems, AMCIS 2010, Lima, Peru, 12–15 August 2010; p. 289. [Google Scholar]
- Werner, M. Colored Petri Nets for Integrating the Data Perspective in Process Audits. In Proceedings of the Conceptual Modeling—32th International Conference, ER 2013, Hong Kong, China, 11–13 November 2013; pp. 387–394. [Google Scholar]
- Werner, M.; Schultz, M.; Müller-Wickop, N.; Gehrke, N.; Nüttgens, M. Tackling Complexity: Process Reconstruction and Graph Transformation for Financial Audits. In Proceedings of the International Conference on Information Systems, ICIS 2012, Orlando, FL, USA, 16–19 December 2012. [Google Scholar]
- Werner, M.; Nüttgens, M. Improving Structure: Logical Sequencing of Mined Process Models. In Proceedings of the 47th Hawaii International Conference on System Sciences, HICSS 2014, Waikoloa, HI, USA, 6–9 January 2014; pp. 3888–3897. [Google Scholar]
- Werner, M. Financial process mining—Accounting data structure dependent control flow inference. Int. J. Account. Inf. Syst. 2017, 25, 57–80. [Google Scholar] [CrossRef]
- Werner, M. Materiality Maps—Process Mining Data Visualization for Financial Audits. In Proceedings of the 52nd Hawaii International Conference on System Sciences, HICSS 2019, Maui, HI, USA, 8–11 January 2019; pp. 1–10. [Google Scholar]
- Vona, L.W. The Fraud Audit: Responding to the Risk of Fraud in Core Business Systems; John Wiley & Sons: Hoboken, NJ, USA, 2011. [Google Scholar]
- XES Working Group. IEEE Standard for eXtensible Event Stream (XES) for Achieving Interoperability in Event Logs and Event Streams. IEEE Std 1849–2016 2016, 1–50. [Google Scholar] [CrossRef]
- Acampora, G.; Vitiello, A.; Stefano, B.N.D.; van der Aalst, W.M.P.; Günther, C.W.; Verbeek, E. IEEE 1849: The XES Standard: The Second IEEE Standard Sponsored by IEEE Computational Intelligence Society [Society Briefs]. IEEE Comput. Intell. Mag. 2017, 12, 4–8. [Google Scholar] [CrossRef]
- Omair, B.; Alturki, A. A Systematic Literature Review of Fraud Detection Metrics in Business Processes. IEEE Access 2020, 8, 26893–26903. [Google Scholar] [CrossRef]
- Skulmoski, G.J.; Hartman, F.T.; Krahn, J. The Delphi Method for Graduate Research. J. Inf. Technol. Educ. 2007, 6, 1–21. [Google Scholar] [CrossRef]
- Dalkey, N.; Brown, B.; Cochran, S. The Delphi Method, III: Use of Self-Ratings to Improve Group Estimates; RAND CORPL: Santa Monica, CA, USA, 1969. [Google Scholar]
- Almenara, J.; Osuna, J. La utilización del juicio de experto para la evaluación de TIC: El Coeficiente de competencia experta. Bordón. Rev. Pedagog. 2013, 65, 25–38. [Google Scholar] [CrossRef]
- van Dongen, B.F.; de Medeiros, A.K.A.; Verbeek, H.M.W.; Weijters, A.J.M.M.; van der Aalst, W.M.P. The ProM Framework: A New Era in Process Mining Tool Support. In Proceedings of the Applications and Theory of Petri Nets 2005, 26th International Conference, ICATPN 2005, Miami, FL, USA, 20–25 June 2005; pp. 444–454. [Google Scholar]
- Santos, A.C. Tecnología de Gestión de Recursos Humanos; Editorial Félix Varela: Zapata, Cuba, 2006. [Google Scholar]
- Siegel, S.; Castellan, N.J. Nonparametric Statistics for the Behavioral Sciences; McGraw–Hill, Inc.: New York, NY, USA, 1988. [Google Scholar]
- Schmidt, R.C. Managing Delphi Surveys Using Nonparametric Statistical Techniques*. Decis. Sci. 1997, 28, 763–774. [Google Scholar] [CrossRef]
- Minitab, I. MINITAB 15 Statistical Software, 15. 2007. Available online: https://www.minitab.com (accessed on 19 May 2021).
- Saaty, T.L. What is the Analytic Hierarchy Process? Math. Models Decis. Support 1988, 48, 109–121. [Google Scholar] [CrossRef]
- Günther, C.W.; van der Aalst, W.M.P. Fuzzy Mining—Adaptive Process Simplification Based on Multi-perspective Metrics. In Proceedings of the Business Process Management, 5th International Conference, BPM 2007, Brisbane, Australia, 24–28 September 2007; pp. 328–343. [Google Scholar]
- Song, M.; Aalst, W. Supporting Process Mining by Showing Events at a Glance. In Proceedings of the WITS 2007—Proceedings, 17th Annual Workshop on Information Technologies and Systems, Montreal, QC, Canada, 8–9 December 2007; pp. 139–145. [Google Scholar]
- van der Aalst, W.M.P. Process Mining—Discovery, Conformance and Enhancement of Business Processes; Springer: Berlin/Heidelberg, Germany, 2011. [Google Scholar]
- Bose, R.P.J.C.; van der Aalst, W.M.P. Process diagnostics using trace alignment: Opportunities, issues, and challenges. Inf. Syst. 2012, 117–141. [Google Scholar] [CrossRef]
- van der Aalst, W.M.P.; Reijers, H.A.; Song, M. Discovering Social Networks from Event Logs. Comput. Support. Coop. Work. 2005, 14, 549–593. [Google Scholar] [CrossRef]
- Campigotto, R.; Céspedes, P.C.; Guillaume, J.-L. A Generalized and Adaptive Method for Community Detection. arXiv 2014, arXiv:1406.2518v1. [Google Scholar]
- Prado-Romero, M.A.; Doerr, C.; Alonso, A.G. Discovering Bitcoin Mixing Using Anomaly Detection. In Proceedings of the Progress in Pattern Recognition, Image Analysis, Computer Vision, and Applications—22nd Iberoamerican Congress, CIARP 2017, Valparaíso, Chile, 7–10 November 2017; pp. 534–541. [Google Scholar]
- Jans, M.; Alles, M.; Vasarhelyi, M. Process mining of event logs in internal auditing: A case study. In Proceedings of the The 2nd International Symposium on Accounting Information Systems, Roma, Italy, 18–19 April 2011. [Google Scholar]
- Hornix, P.T.G. Performance Analysis of Business Processes through Process Mining. Master’s Thesis, Eindhoven University of Technology, Eindhoven, The Netherlands, 2007. [Google Scholar]
Figure 1.
Conceptual schema for fraud audits of business processes.
Figure 1.
Conceptual schema for fraud audits of business processes.
Figure 2.
Selection of the process discovery technique using AHP.
Figure 2.
Selection of the process discovery technique using AHP.
Figure 3.
Visual representation of the sequences of activities (the activities are represented as different colored boxes): (a) unaligned sequences; (b) aligned sequences.
Figure 3.
Visual representation of the sequences of activities (the activities are represented as different colored boxes): (a) unaligned sequences; (b) aligned sequences.
Figure 4.
Sequences of activities. (a) Includes the original sequence obtained by the algorithm. (b) Includes the modified sequence from a visual abstraction of the pattern.
Figure 4.
Sequences of activities. (a) Includes the original sequence obtained by the algorithm. (b) Includes the modified sequence from a visual abstraction of the pattern.
Figure 5.
Process model discovered using fuzzy miner. Translation: Abrir cheques (Open Check), Cerrar Cheques (Close Check), Anulación de cheques liquidados (Annul check), Anular productos (Suppress product), and Imprimir cheques (Print check)).
Figure 5.
Process model discovered using fuzzy miner. Translation: Abrir cheques (Open Check), Cerrar Cheques (Close Check), Anulación de cheques liquidados (Annul check), Anular productos (Suppress product), and Imprimir cheques (Print check)).
Figure 6.
View of the duration of the instances using a dotted chart.
Figure 6.
View of the duration of the instances using a dotted chart.
Figure 7.
View of the instances operating outside service hours.
Figure 7.
View of the instances operating outside service hours.
Figure 8.
View by the originator of the executed operations.
Figure 8.
View by the originator of the executed operations.
Figure 9.
View by the originator of the executed product suppressions.
Figure 9.
View by the originator of the executed product suppressions.
Figure 10.
View by instances of the number of operations performed on checks.
Figure 10.
View by instances of the number of operations performed on checks.
Figure 11.
View of the different sequences of the process activities.
Figure 11.
View of the different sequences of the process activities.
Figure 12.
View of the sequences of activities with product eliminations after printing.
Figure 12.
View of the sequences of activities with product eliminations after printing.
Figure 13.
Sequences with check cancellations without prior suppression of products.
Figure 13.
Sequences with check cancellations without prior suppression of products.
Figure 14.
Sequences with product eliminations without the printing of the check.
Figure 14.
Sequences with product eliminations without the printing of the check.
Figure 15.
Sequences with product deletions: (a) using credit cards; (b) using cash.
Figure 15.
Sequences with product deletions: (a) using credit cards; (b) using cash.
Figure 16.
Sequences with product deletions using credit cards.
Figure 16.
Sequences with product deletions using credit cards.
Table 1.
Kendall’s coefficient of concordance. Coef (Kendall’s coefficient of concordance), Chi-Sq (chi-square statistic), DF (degrees of freedom), p (p-value).
Table 1.
Kendall’s coefficient of concordance. Coef (Kendall’s coefficient of concordance), Chi-Sq (chi-square statistic), DF (degrees of freedom), p (p-value).
| Coef | Chi-Sq | DF | p |
|---|
| 0.826866 | 4.4179 | 6 | 0.0000 |
Table 2.
Summary results of the Delphi method to determine and weigh the selection criteria.
Table 2.
Summary results of the Delphi method to determine and weigh the selection criteria.
| Criteria | Description | Level of Agreement (Cc) | Weighting (Ci) |
|---|
| Understandability | Level of complexity to interpret the component’s visual output. | 0.93 | 0.172 |
| Quickness | Processing speed of data samples. | 0.80 | 0.079 |
| Comprehensiveness | Level of coverage of the auditor’s analysis needs. | 1.00 | 0.167 |
| Usability | Ease of use and interaction with the components’ visual interfaces | 0.87 | 0.095 |
| Generalizability | Possibility of extending its use to support fraud auditing in other business domains. | 0.93 | 0.136 |
| Effectiveness | Possibilities of detecting suspected fraud scenarios | 1.00 | 0.174 |
| Reliability | Level of truthfulness and accuracy of data processing results | 1.00 | 0.178 |
| Scalability | The component’s ability to react and adapt to the growth of data without losing quality. | 0.47 | Discarded |
| Publisher’s Note: MDPI stays neutral with regard to jurisdictional claims in published maps and institutional affiliations. |
© 2021 by the authors. Licensee MDPI, Basel, Switzerland. This article is an open access article distributed under the terms and conditions of the Creative Commons Attribution (CC BY) license (https://creativecommons.org/licenses/by/4.0/).


 ,
, 


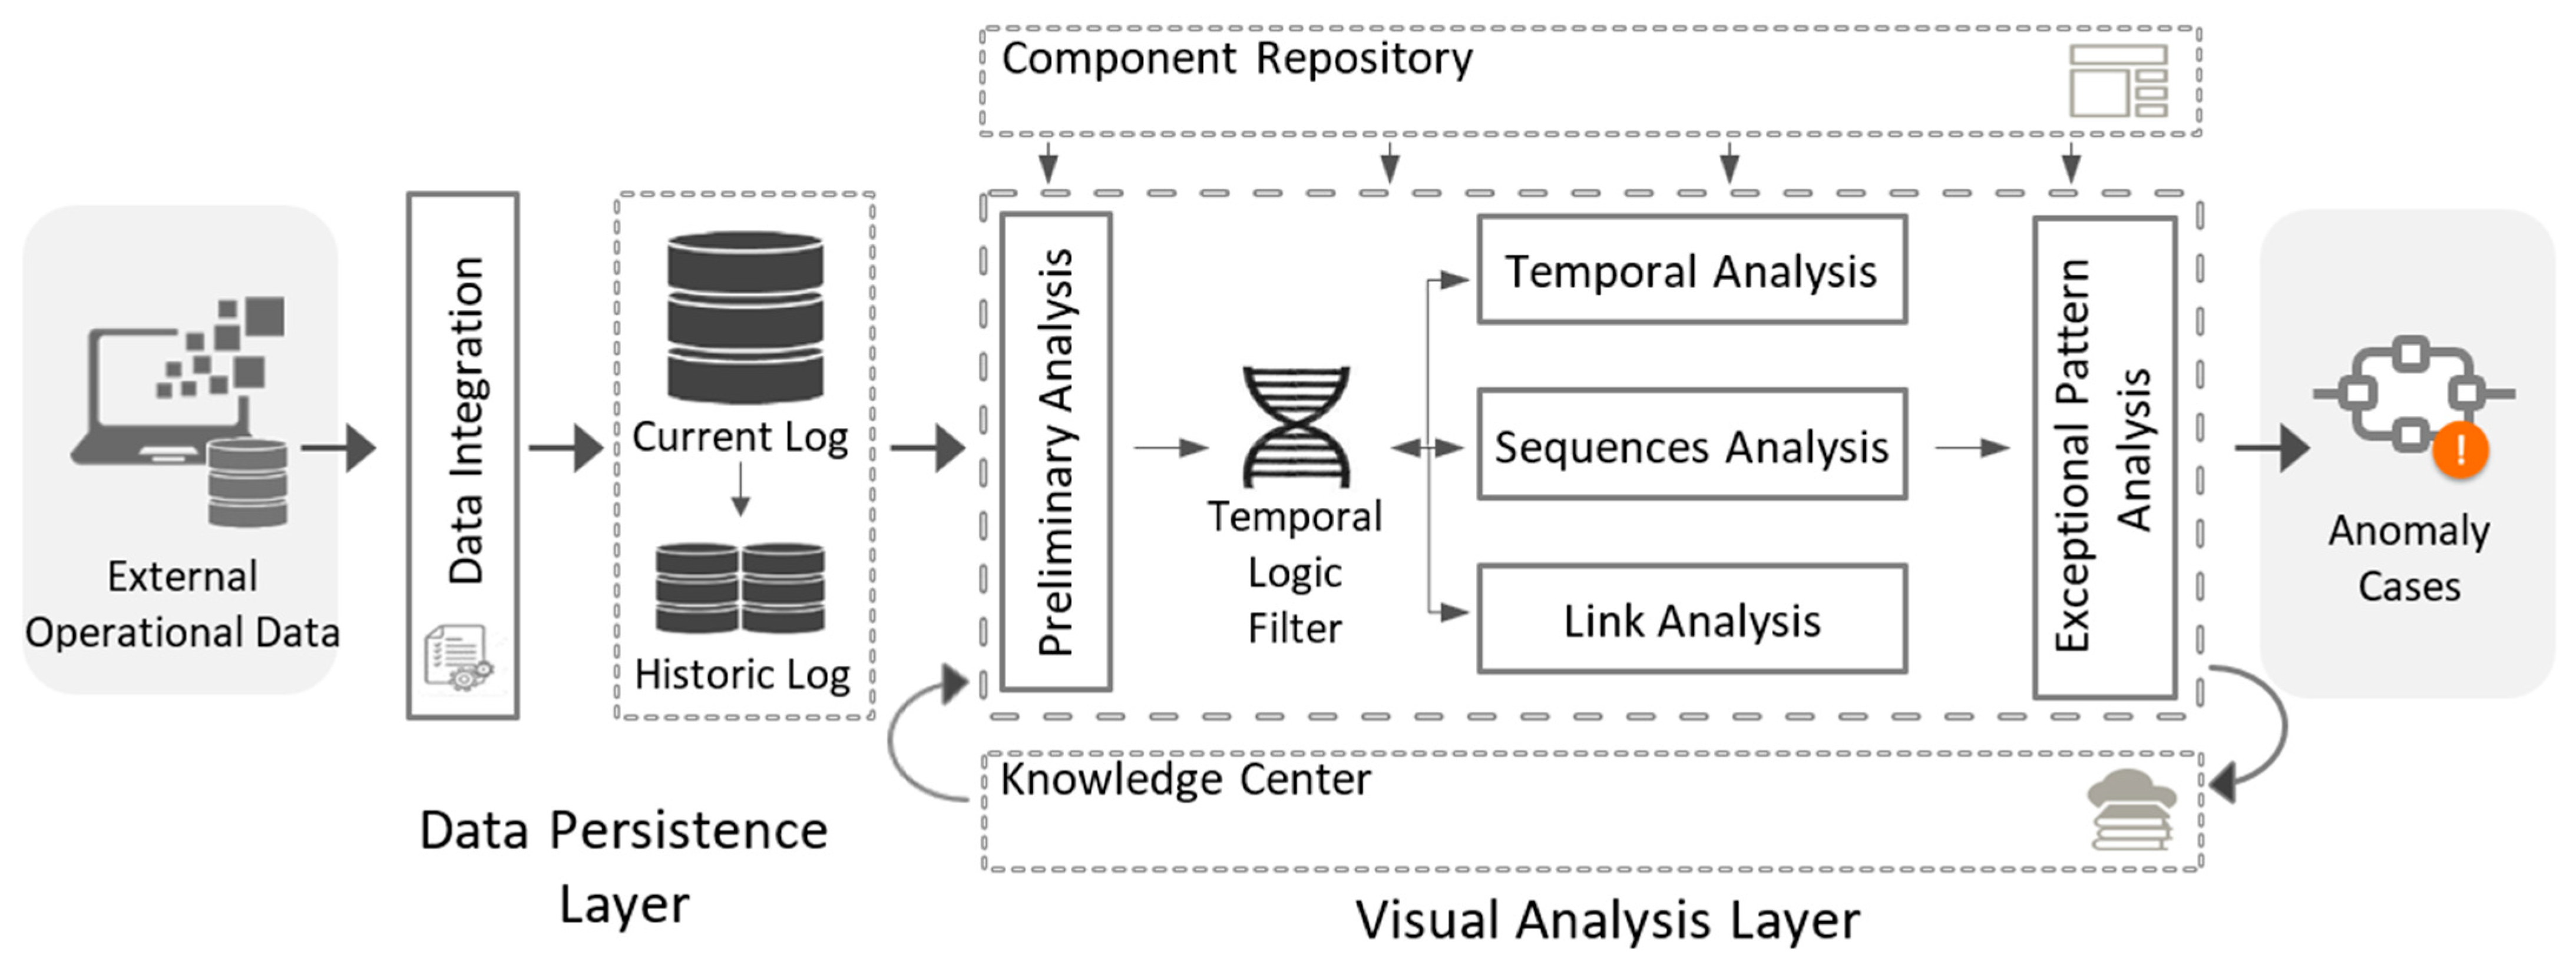
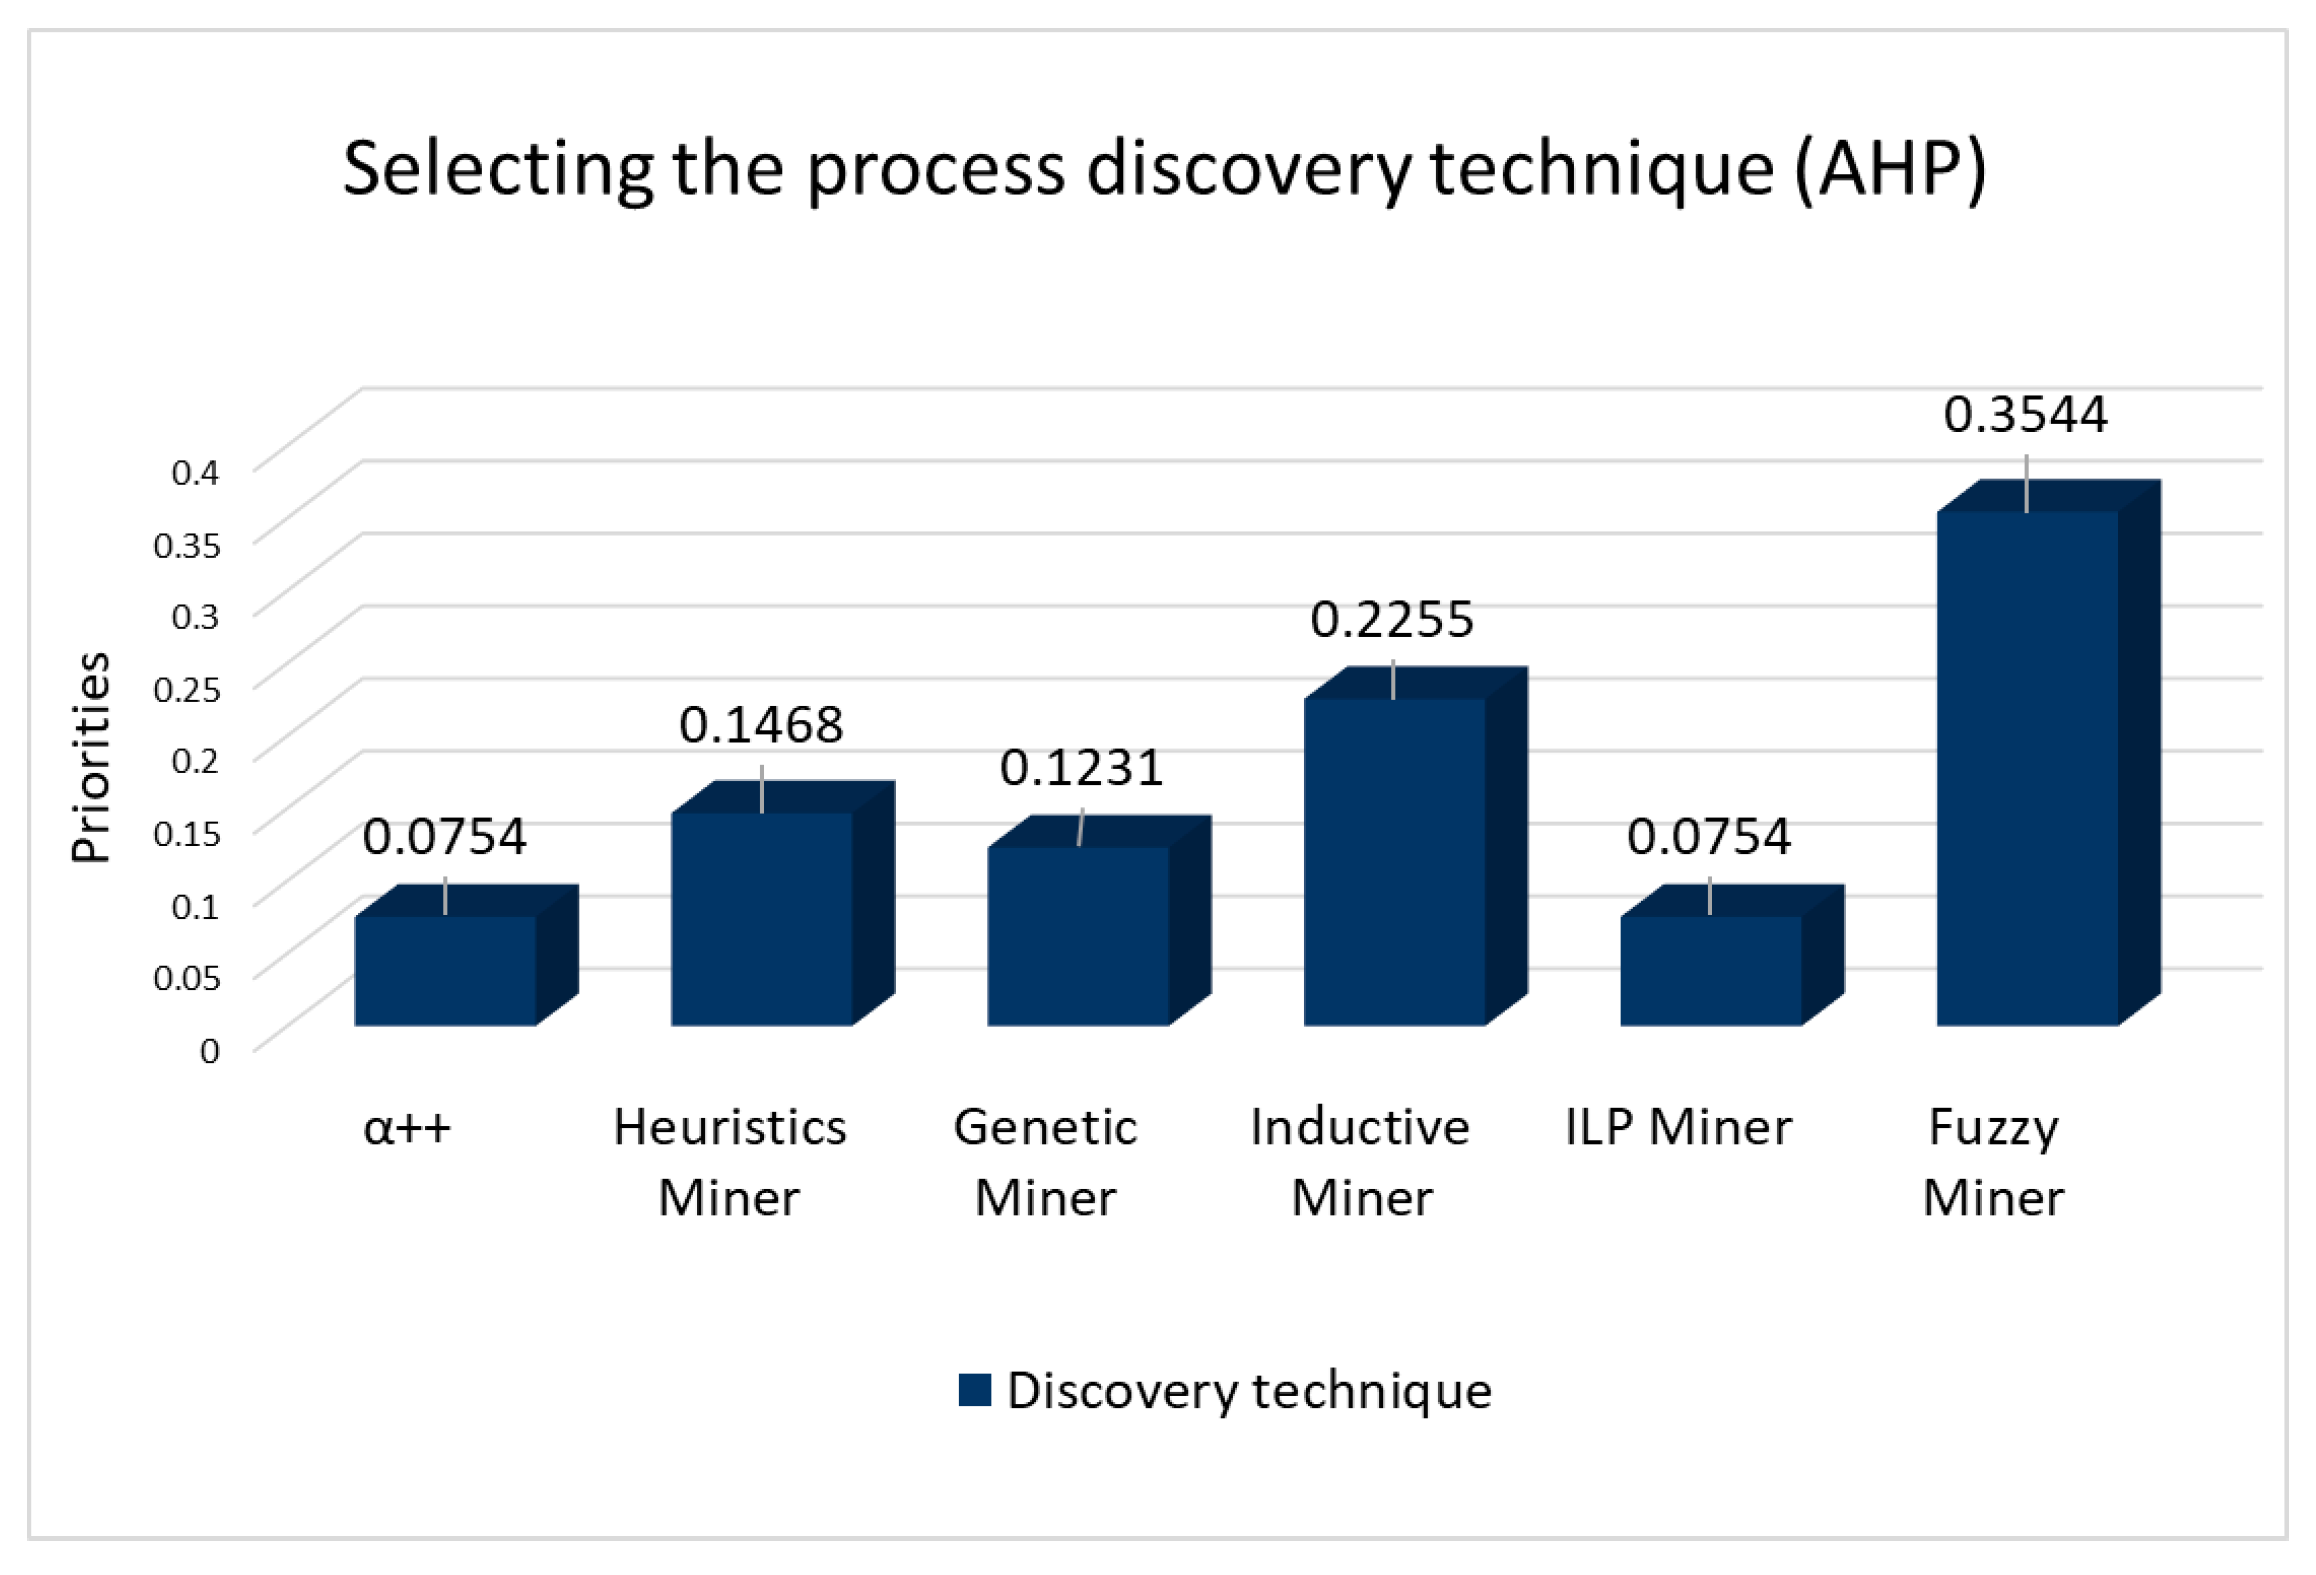
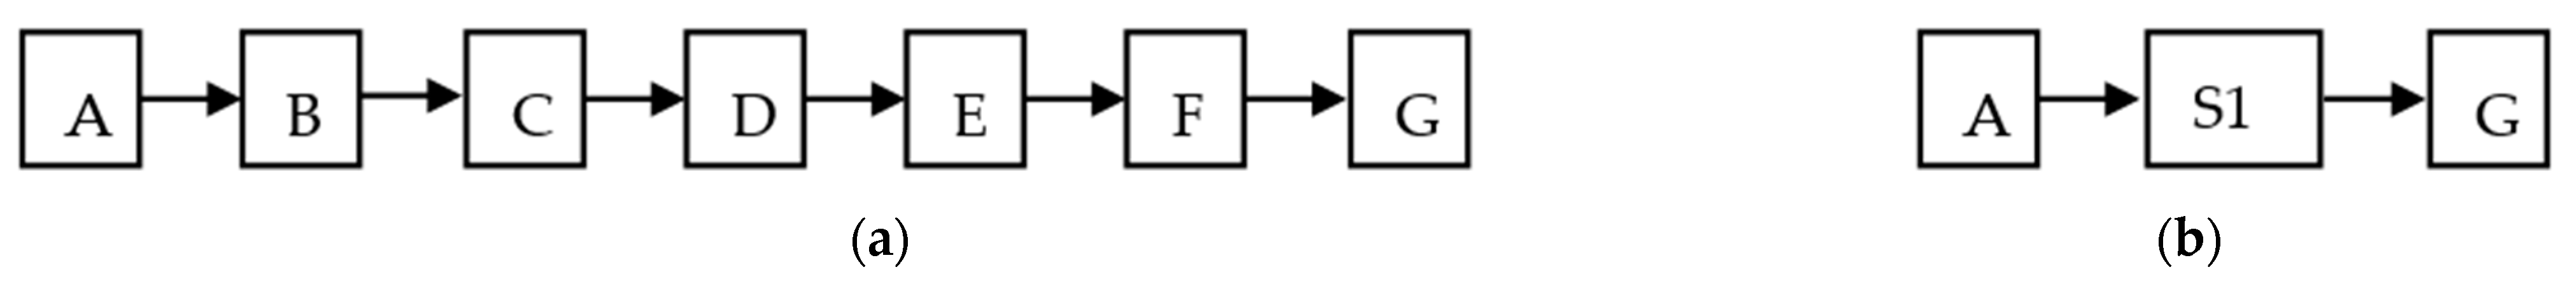
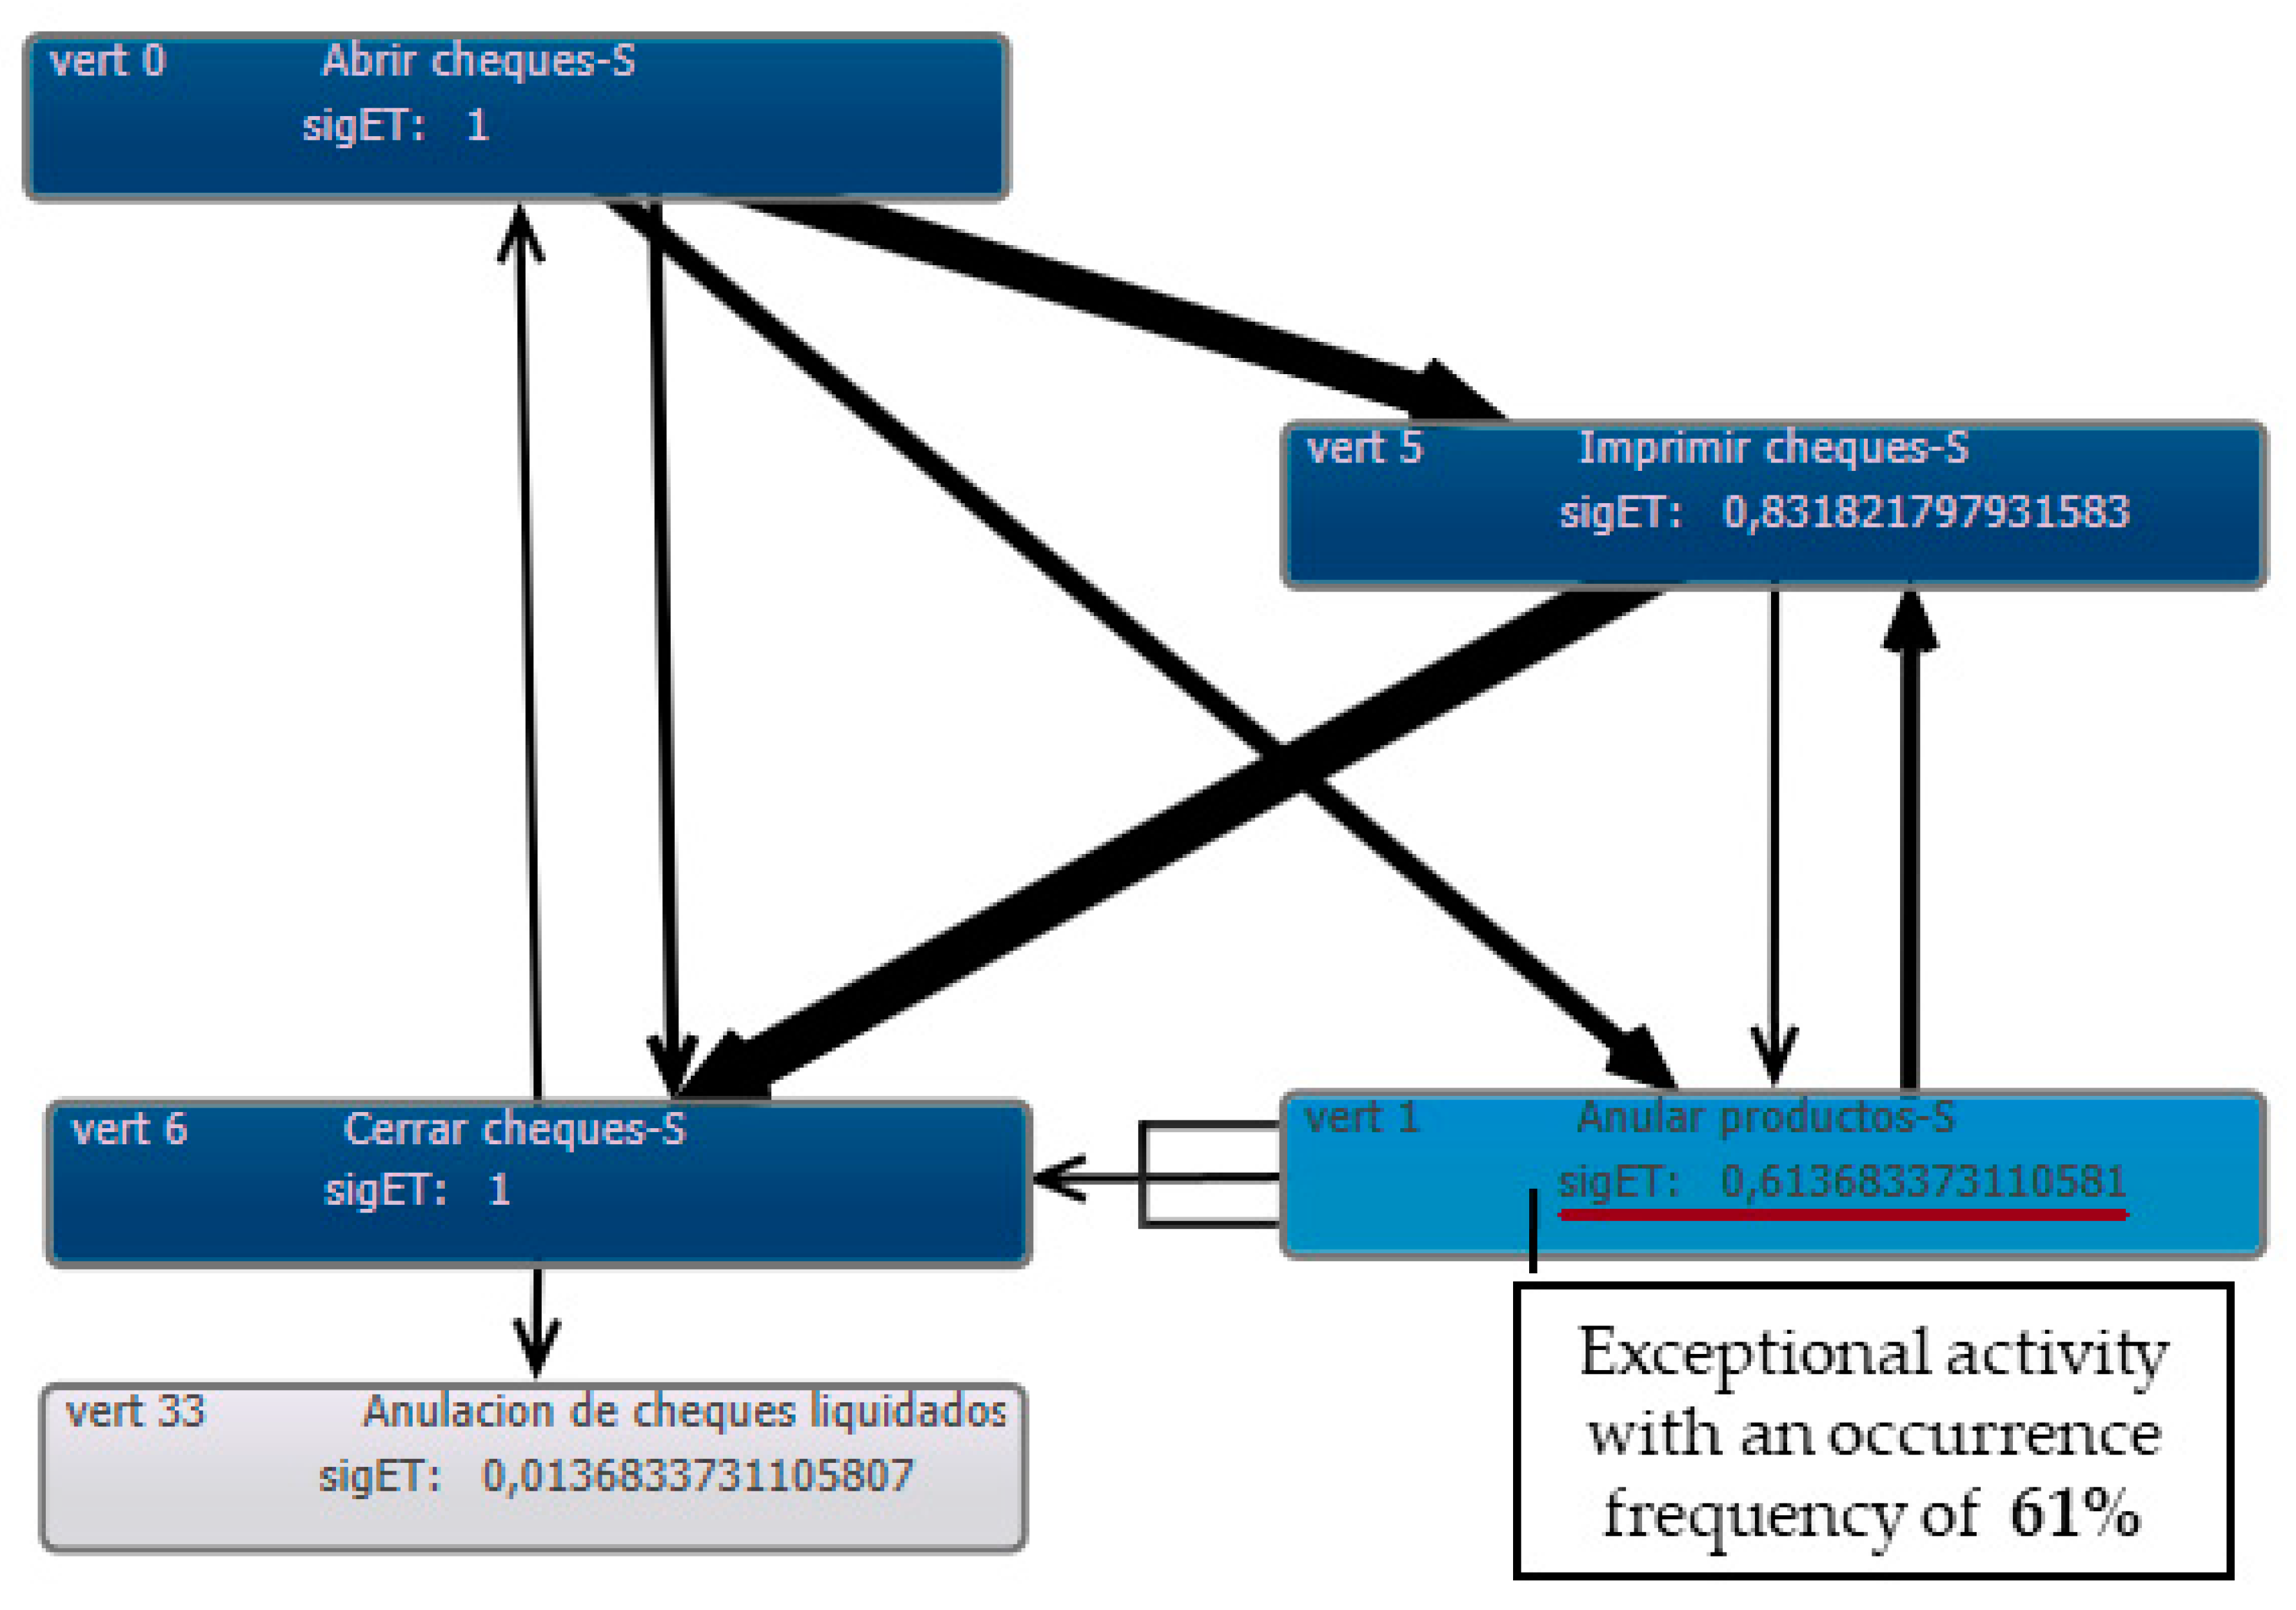
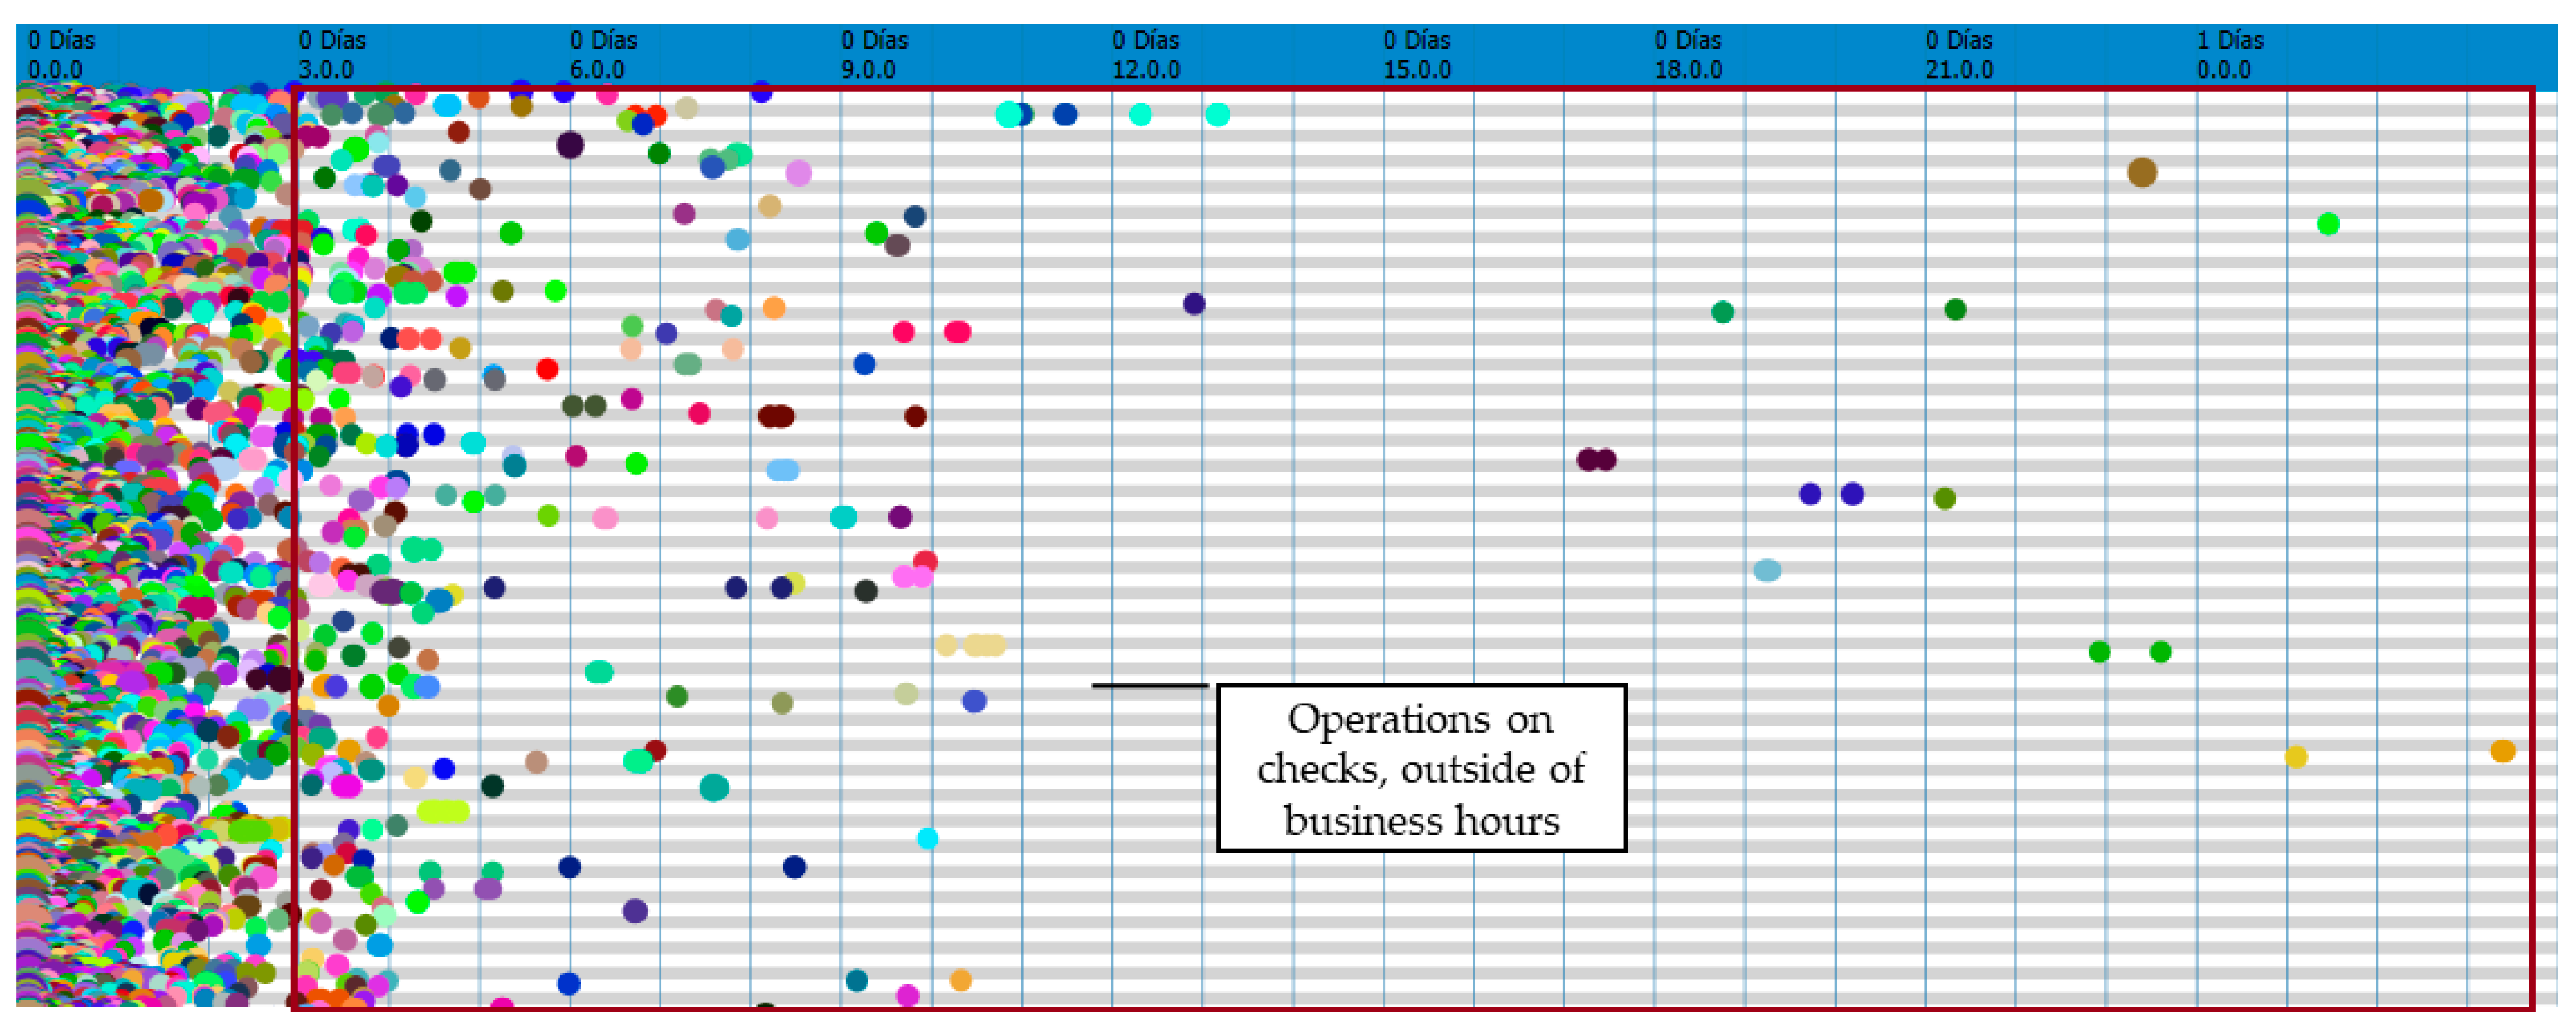
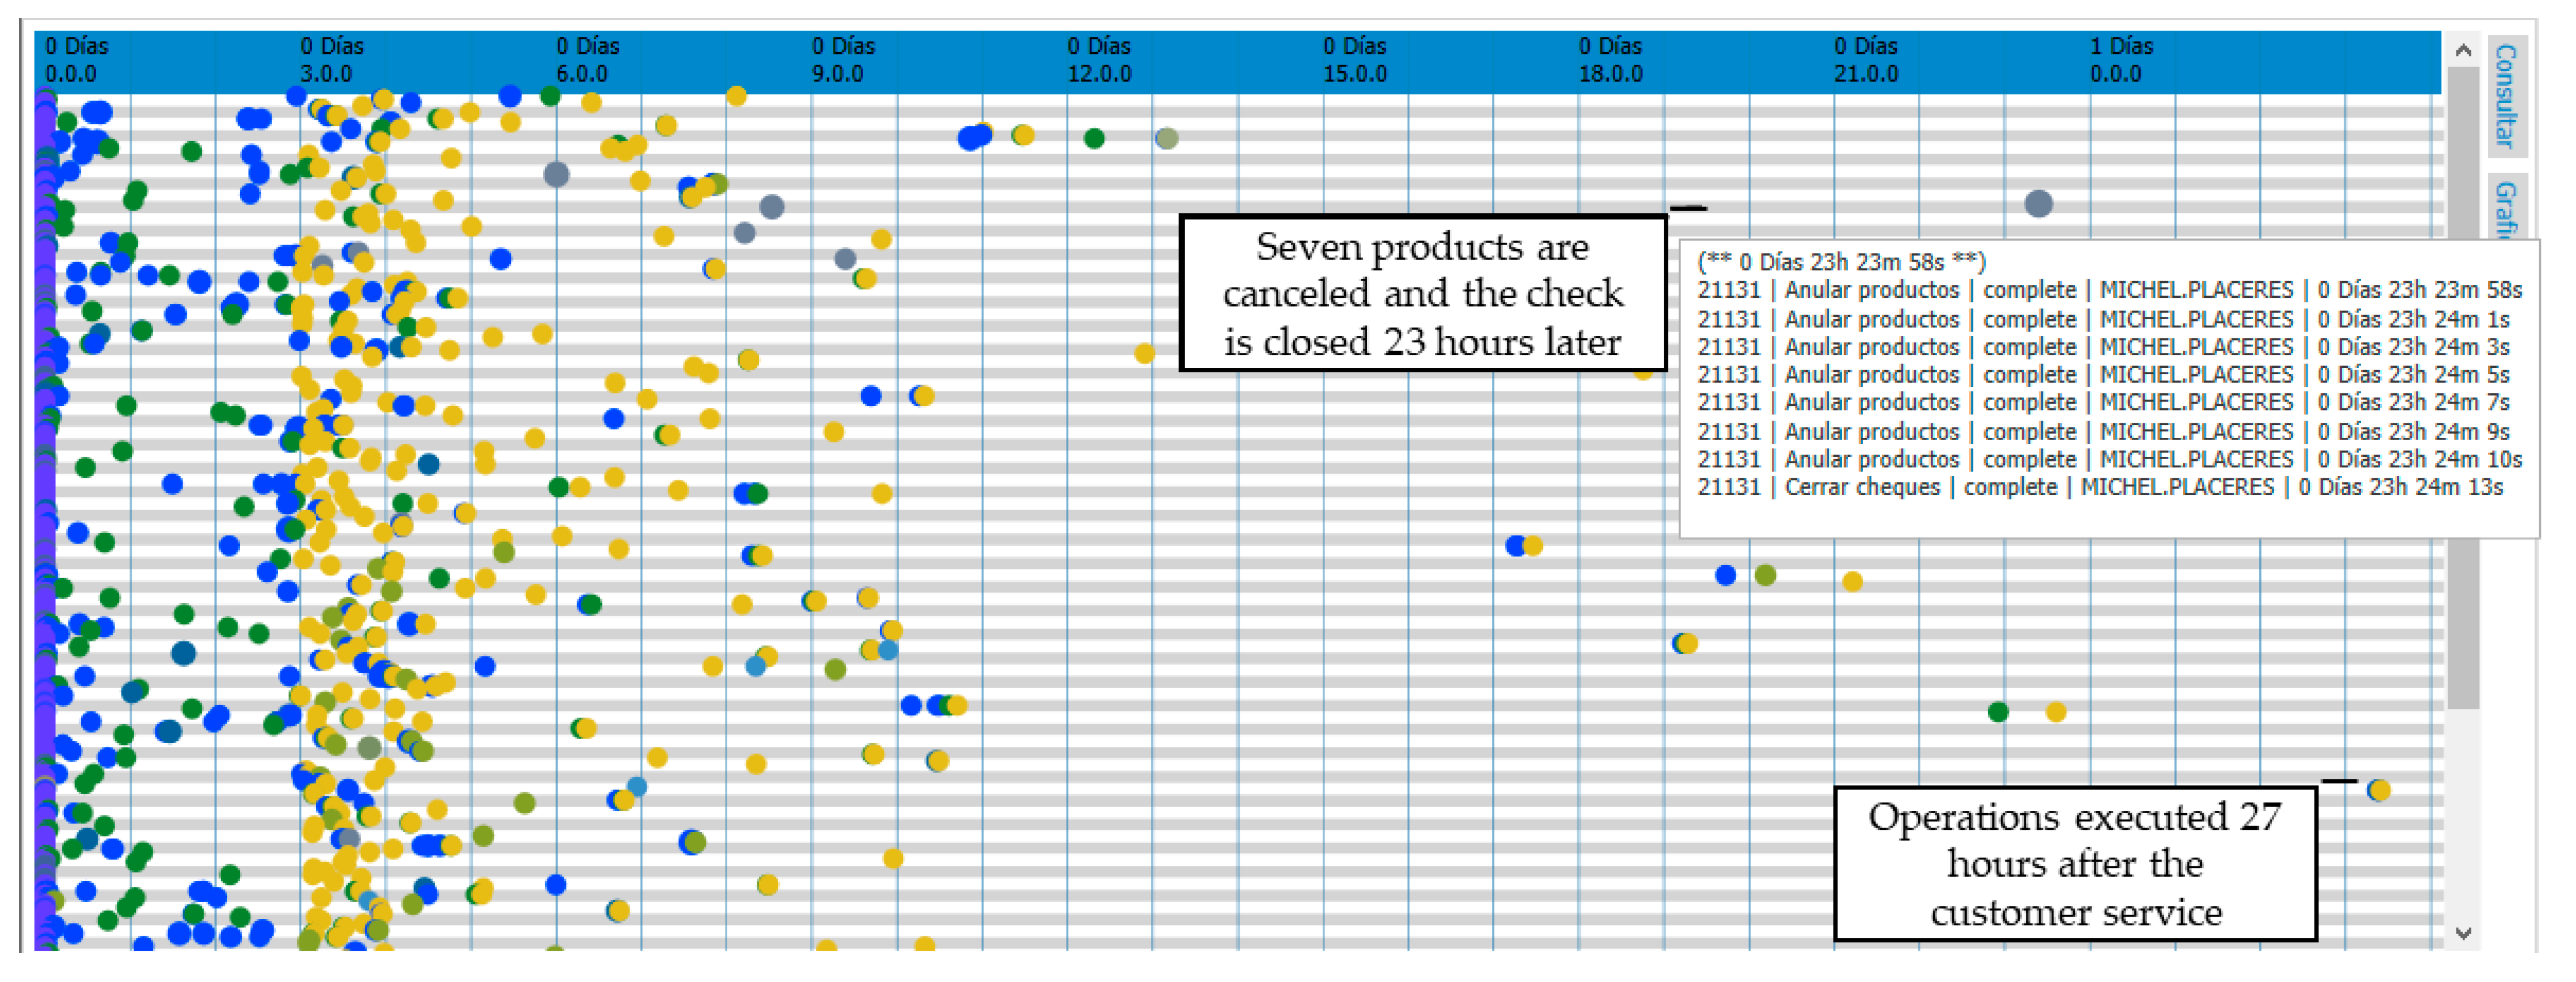
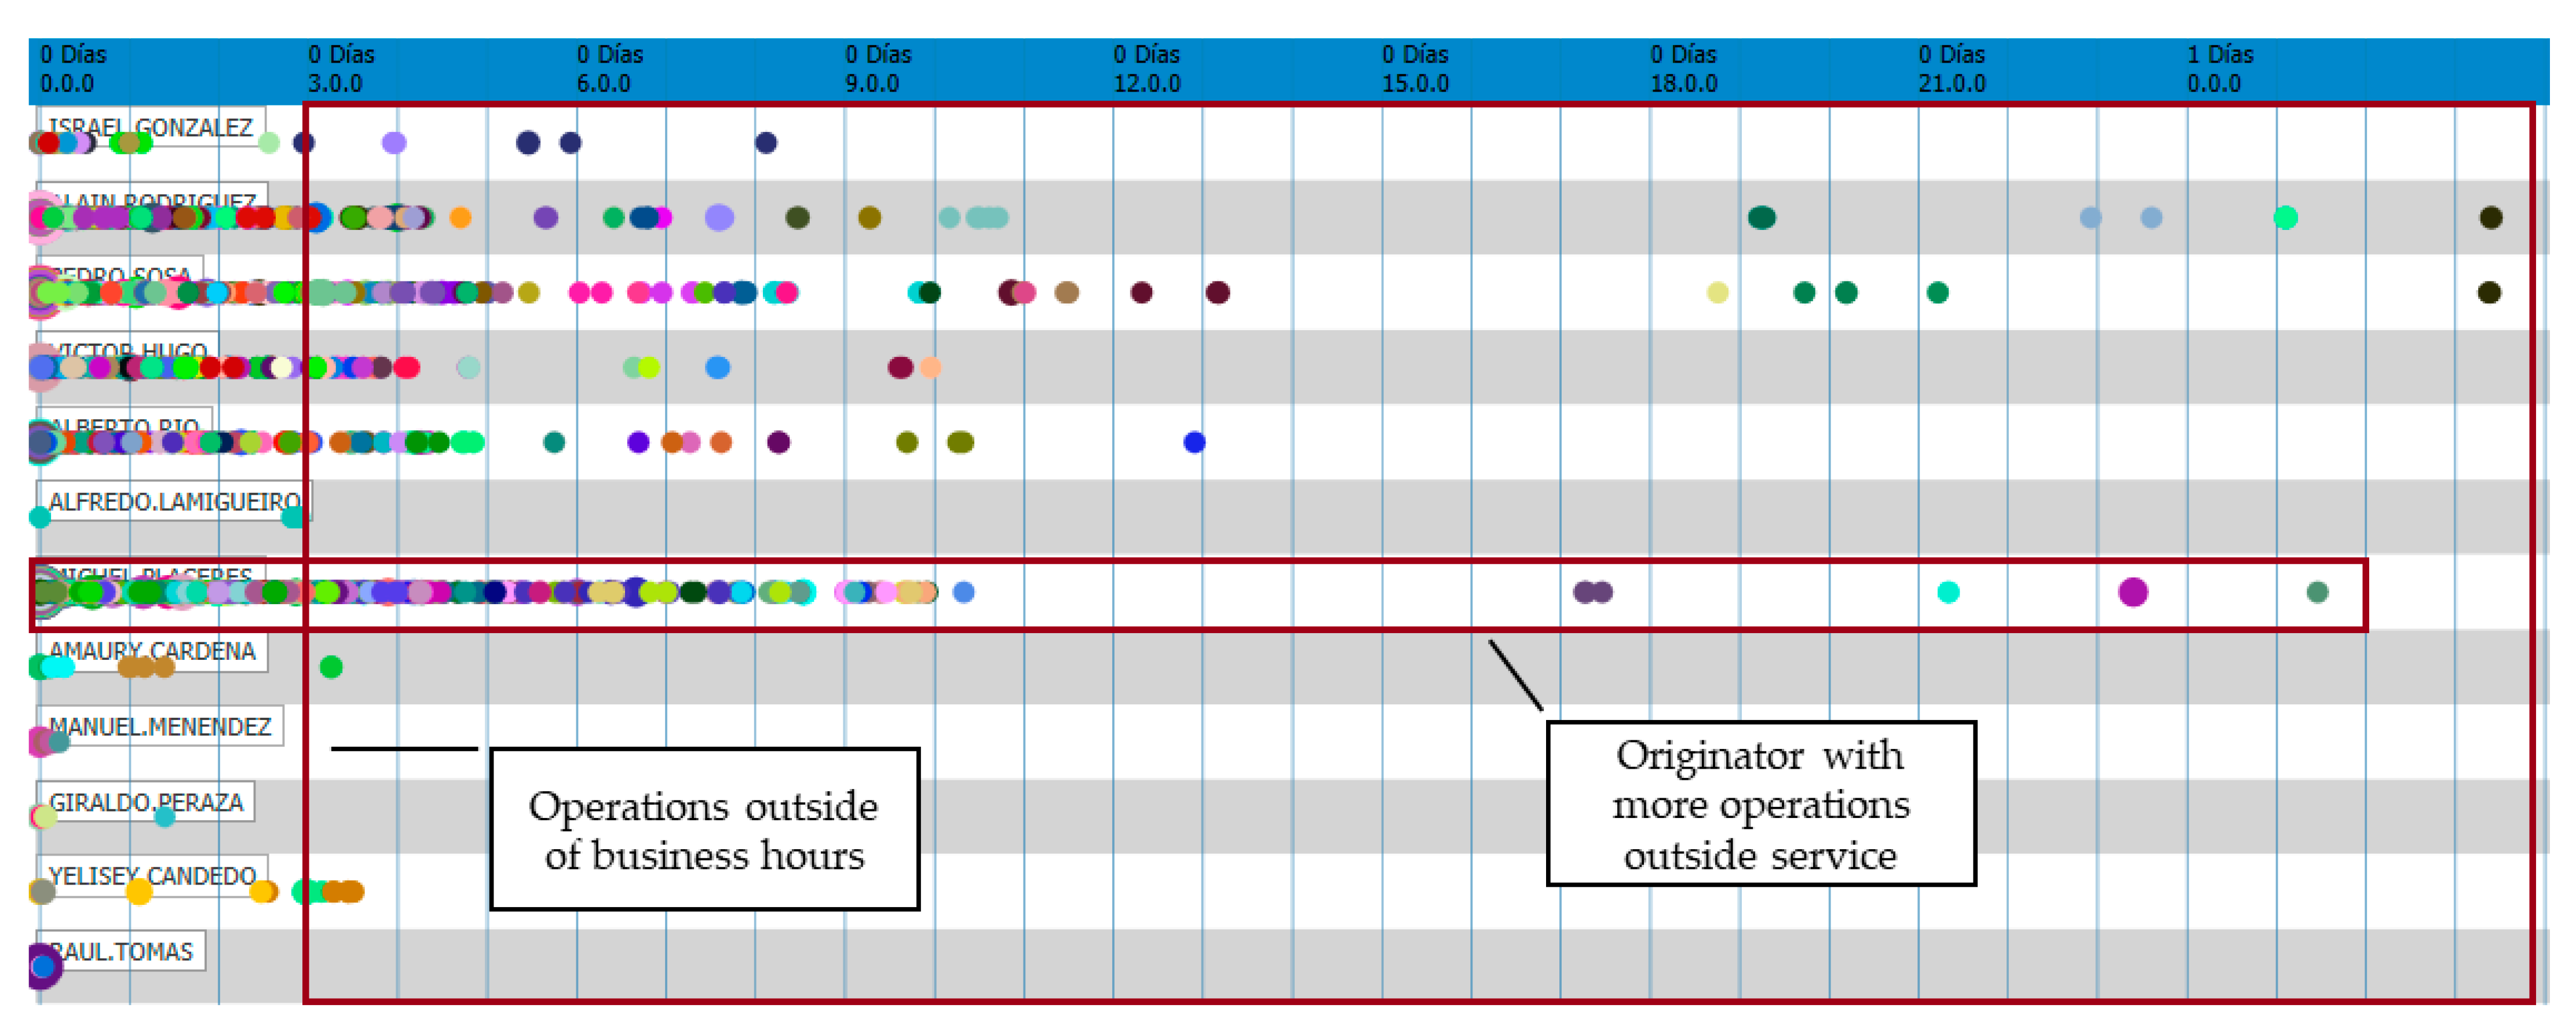
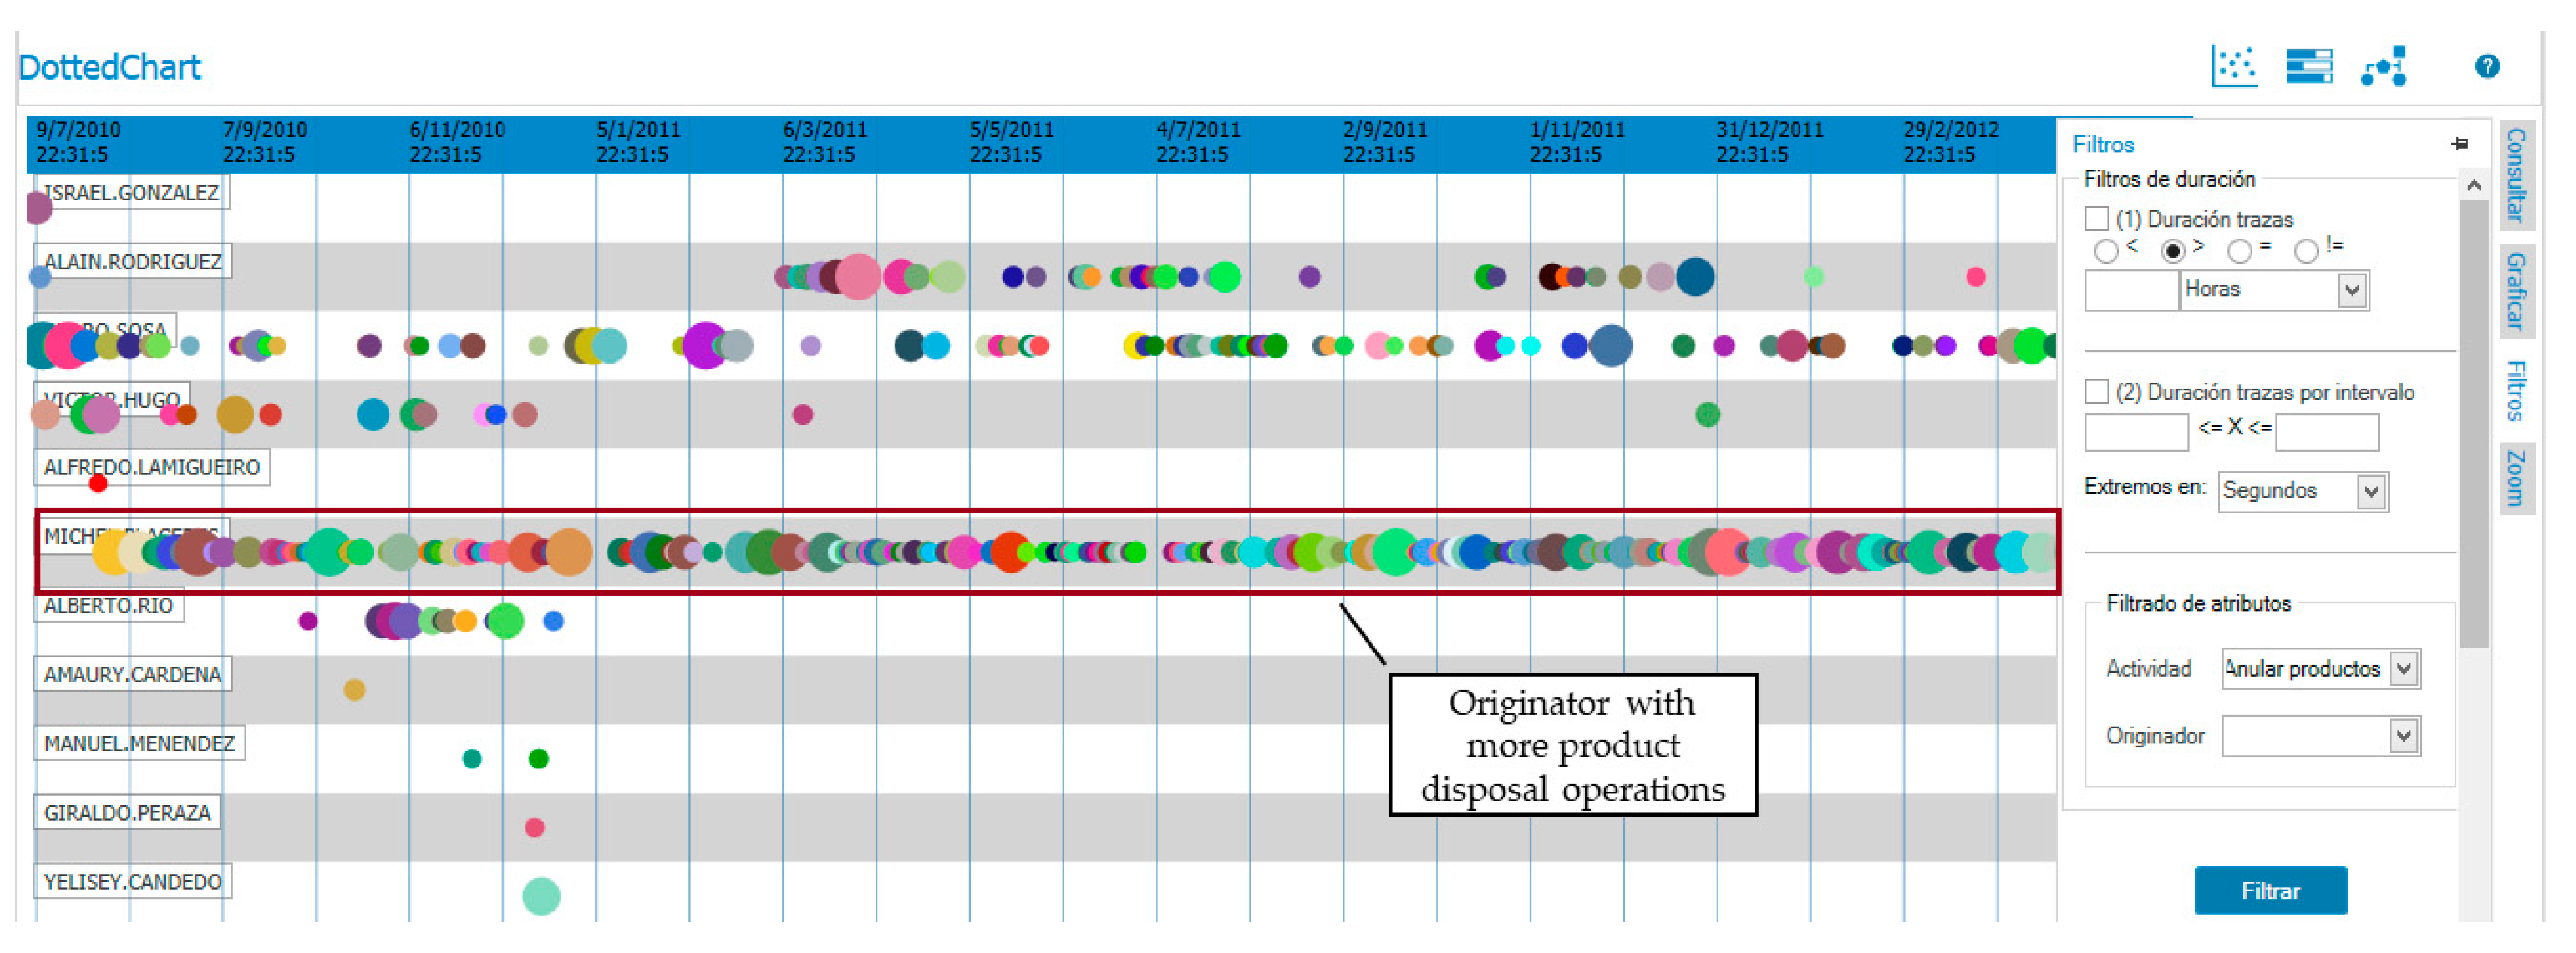
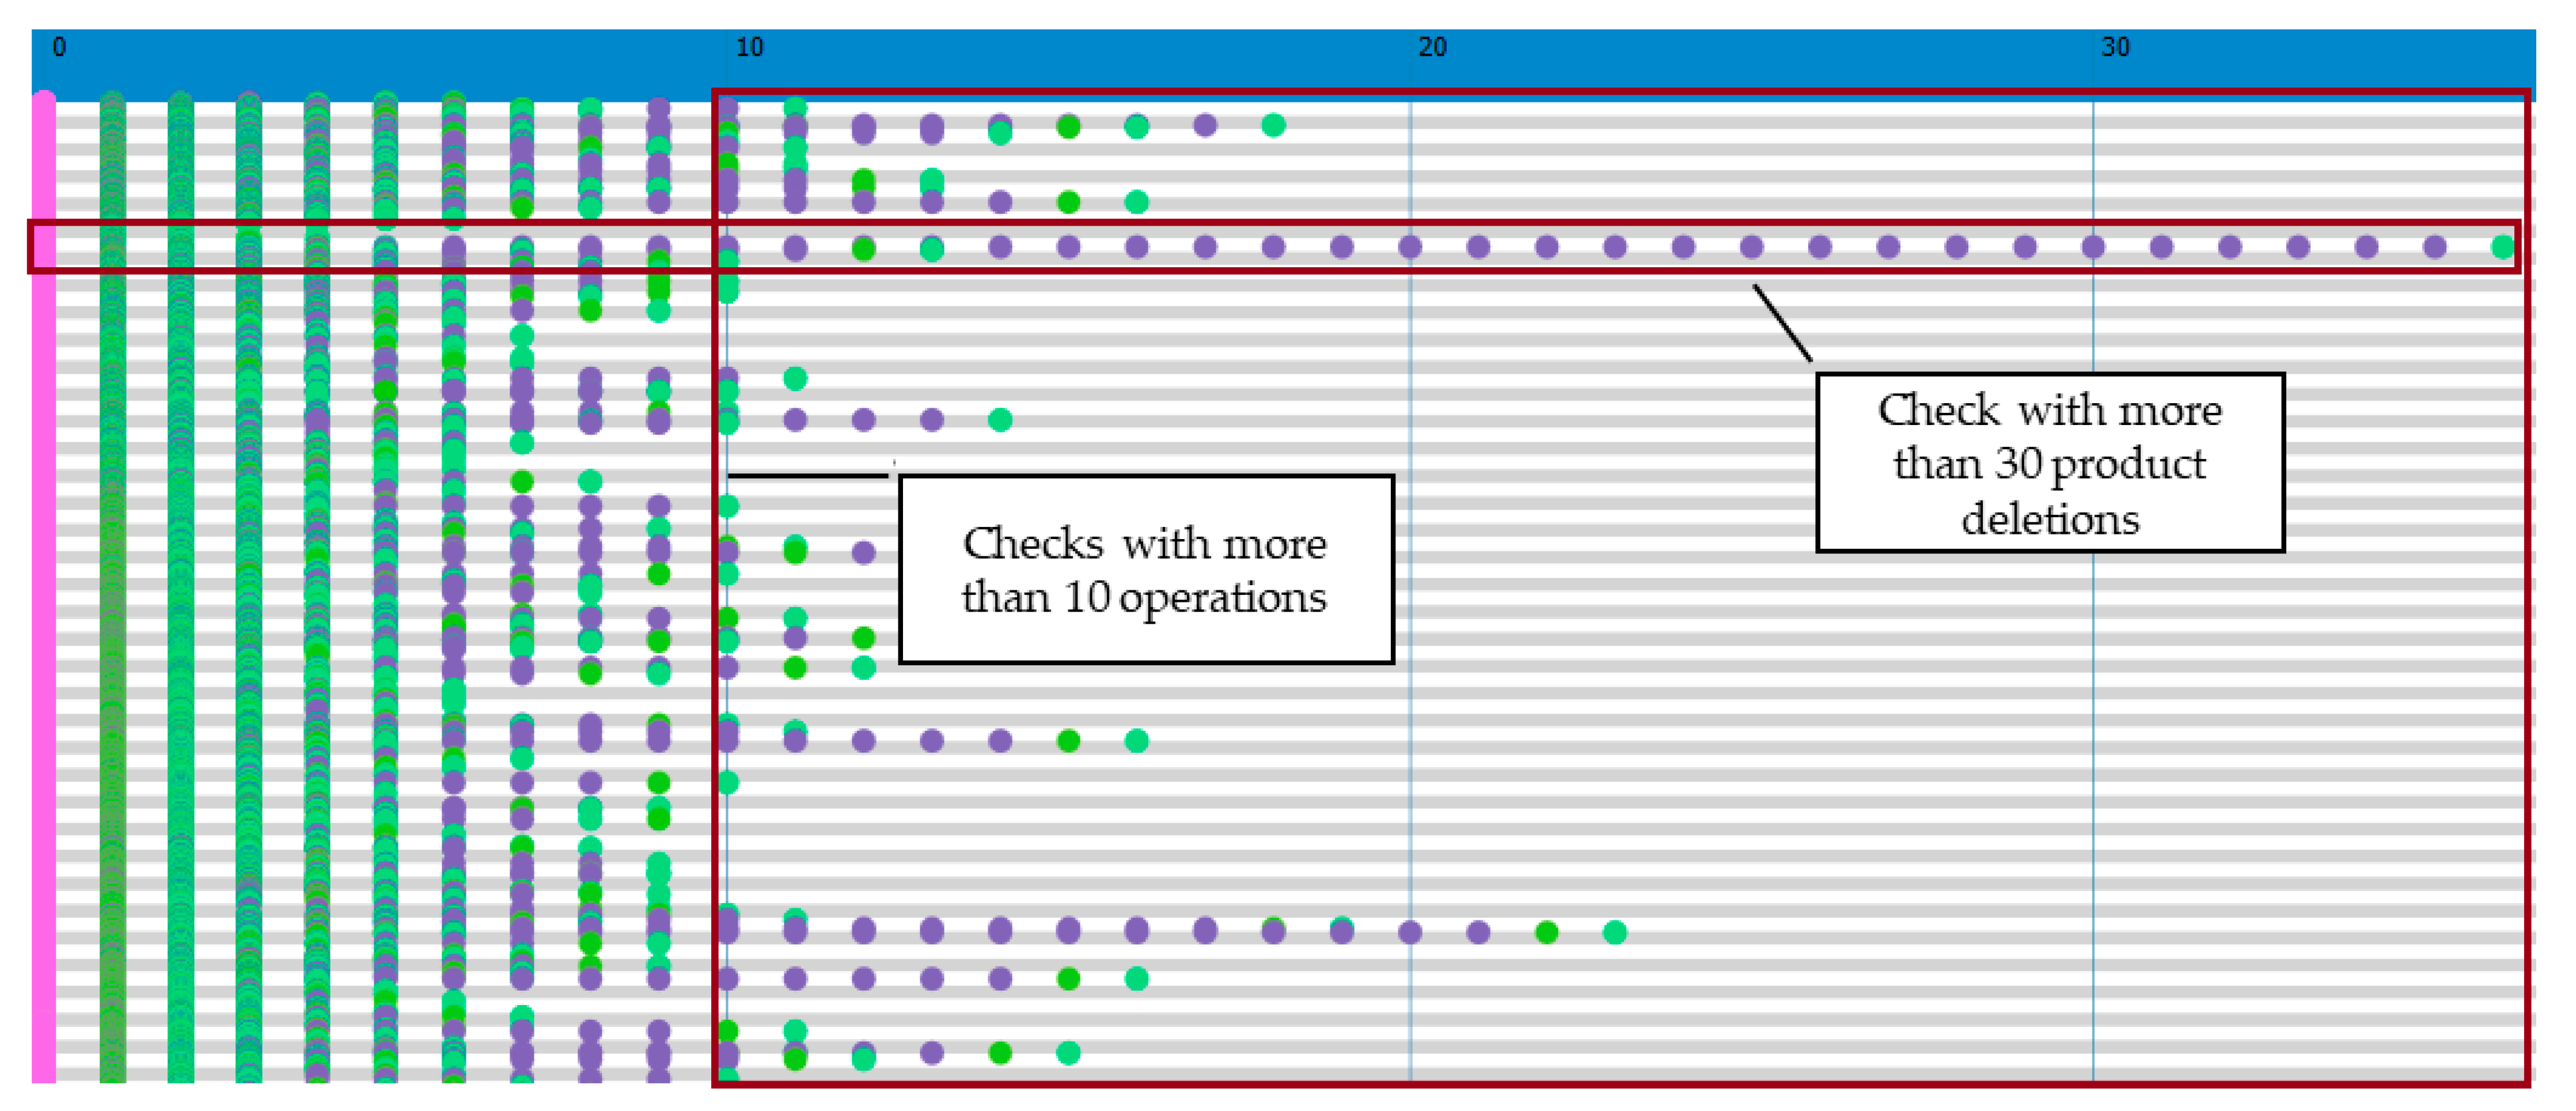
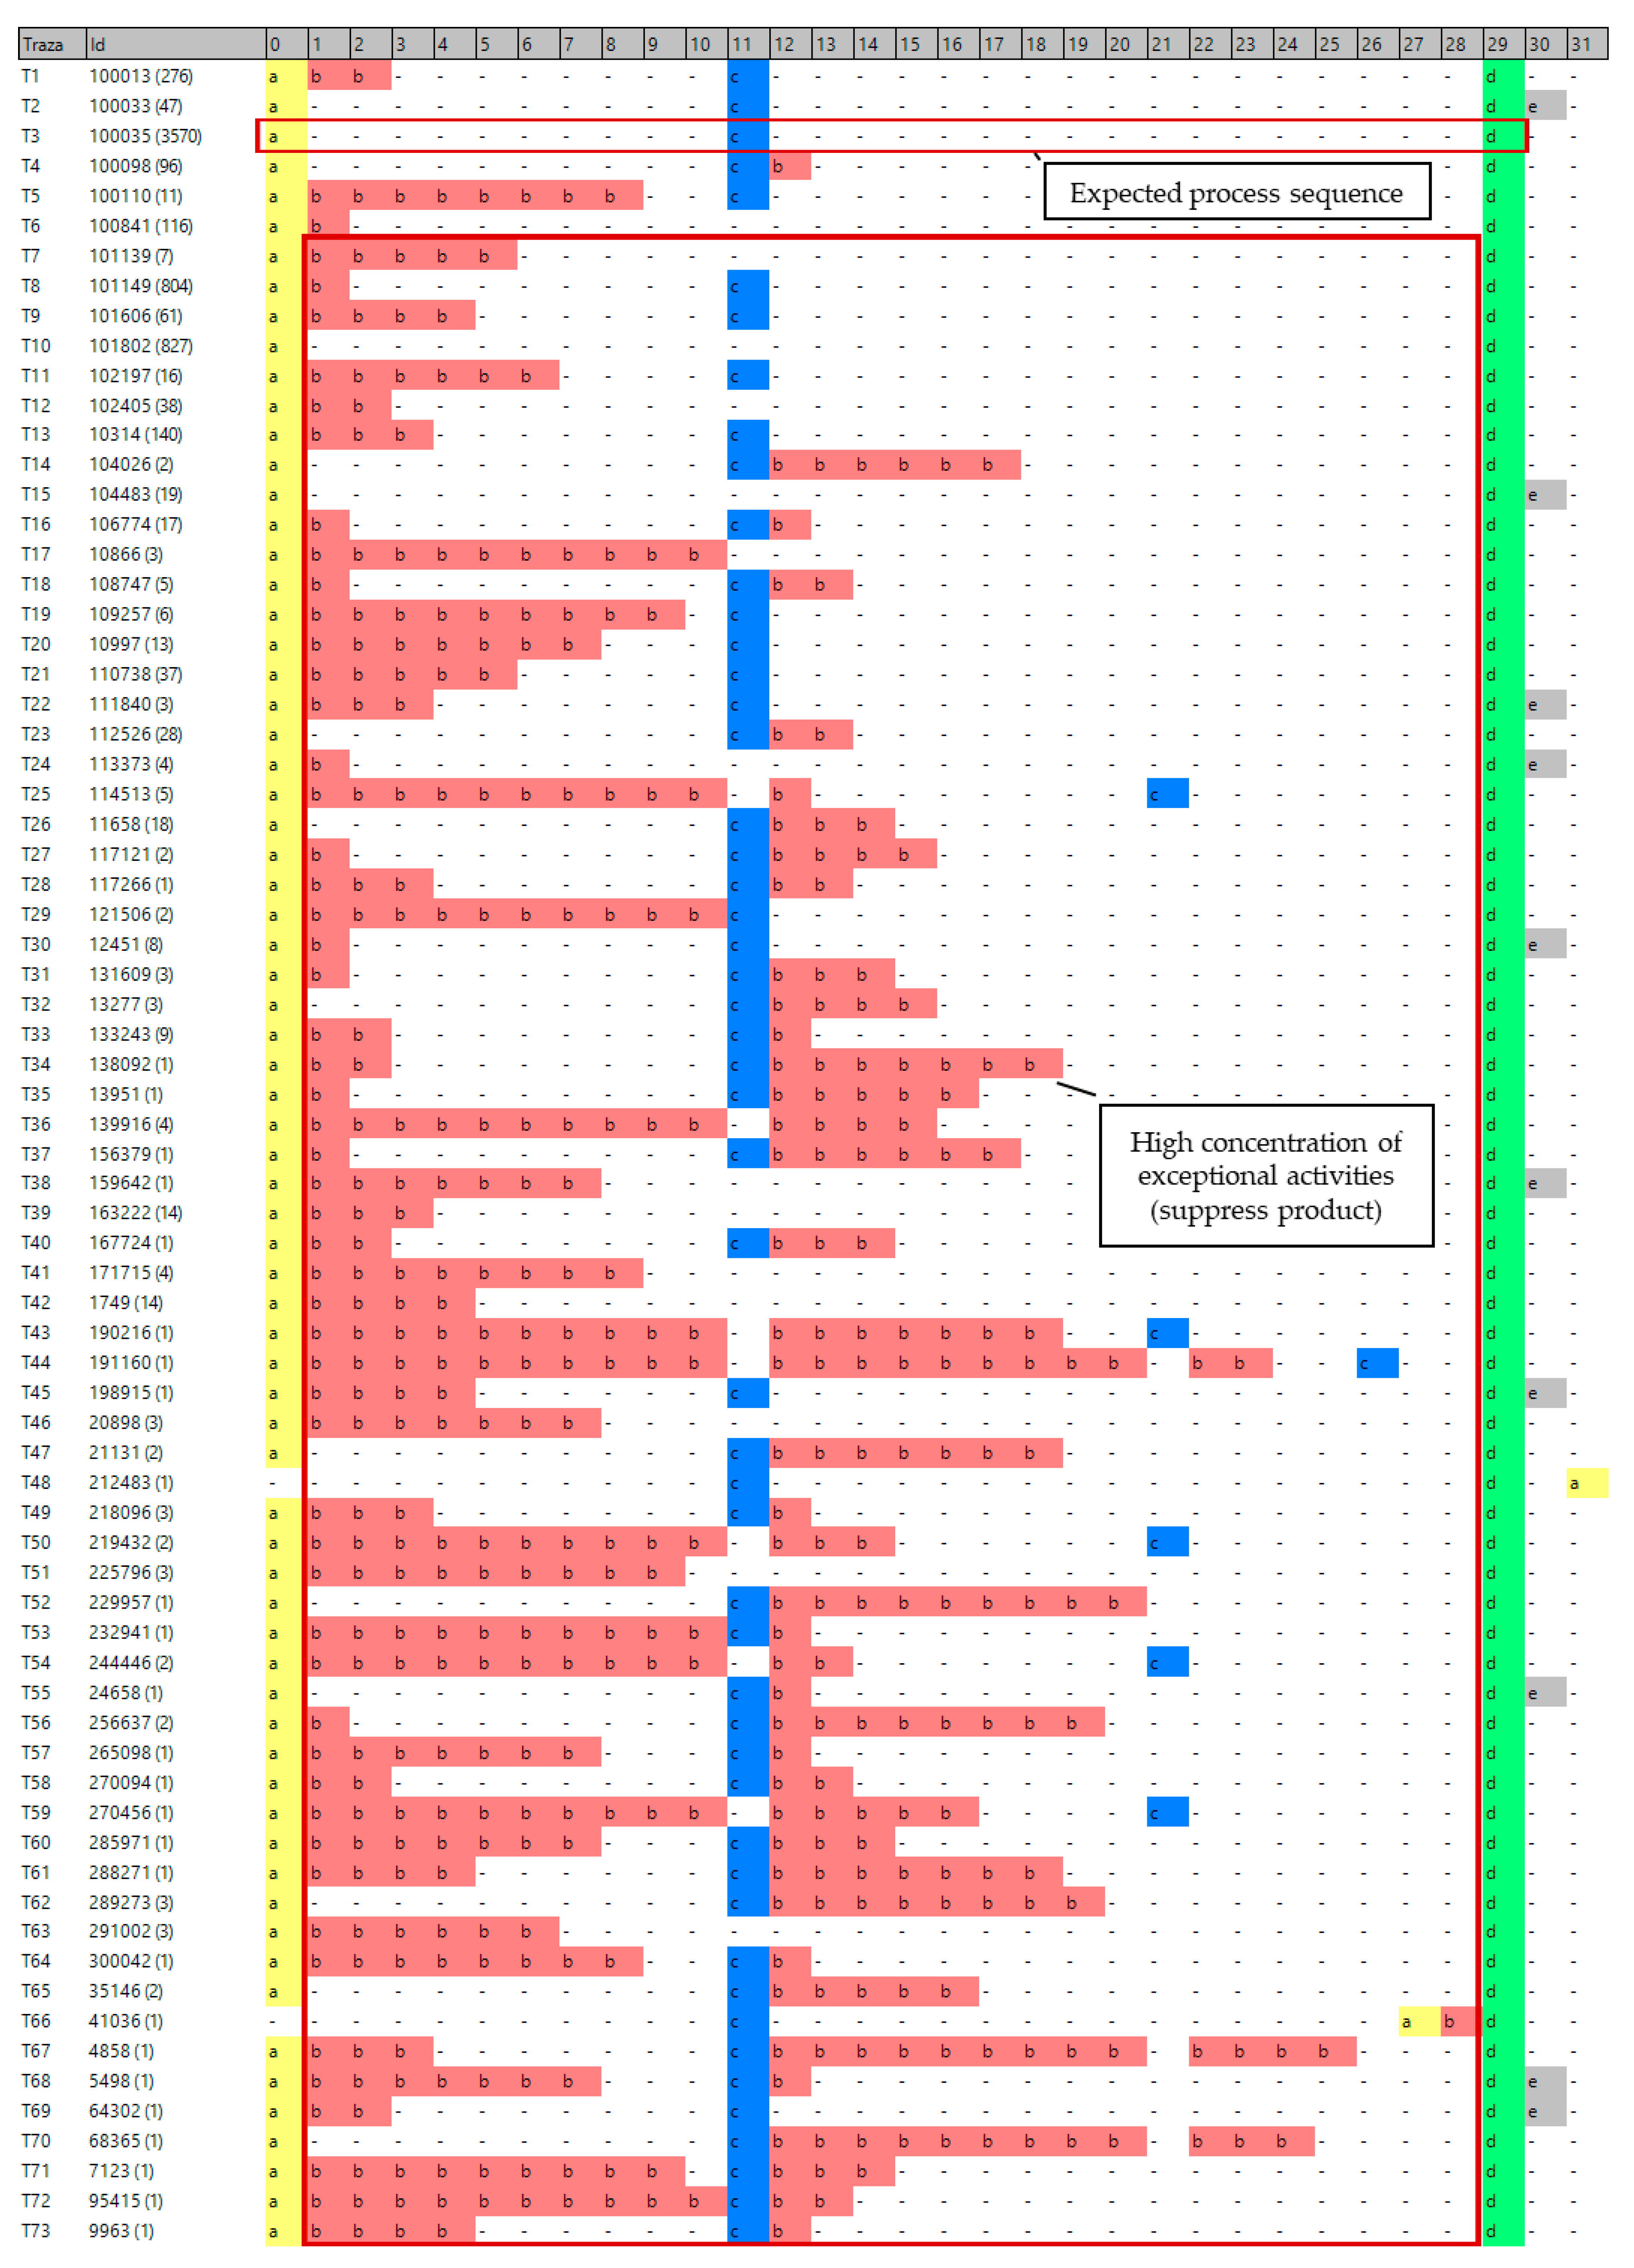
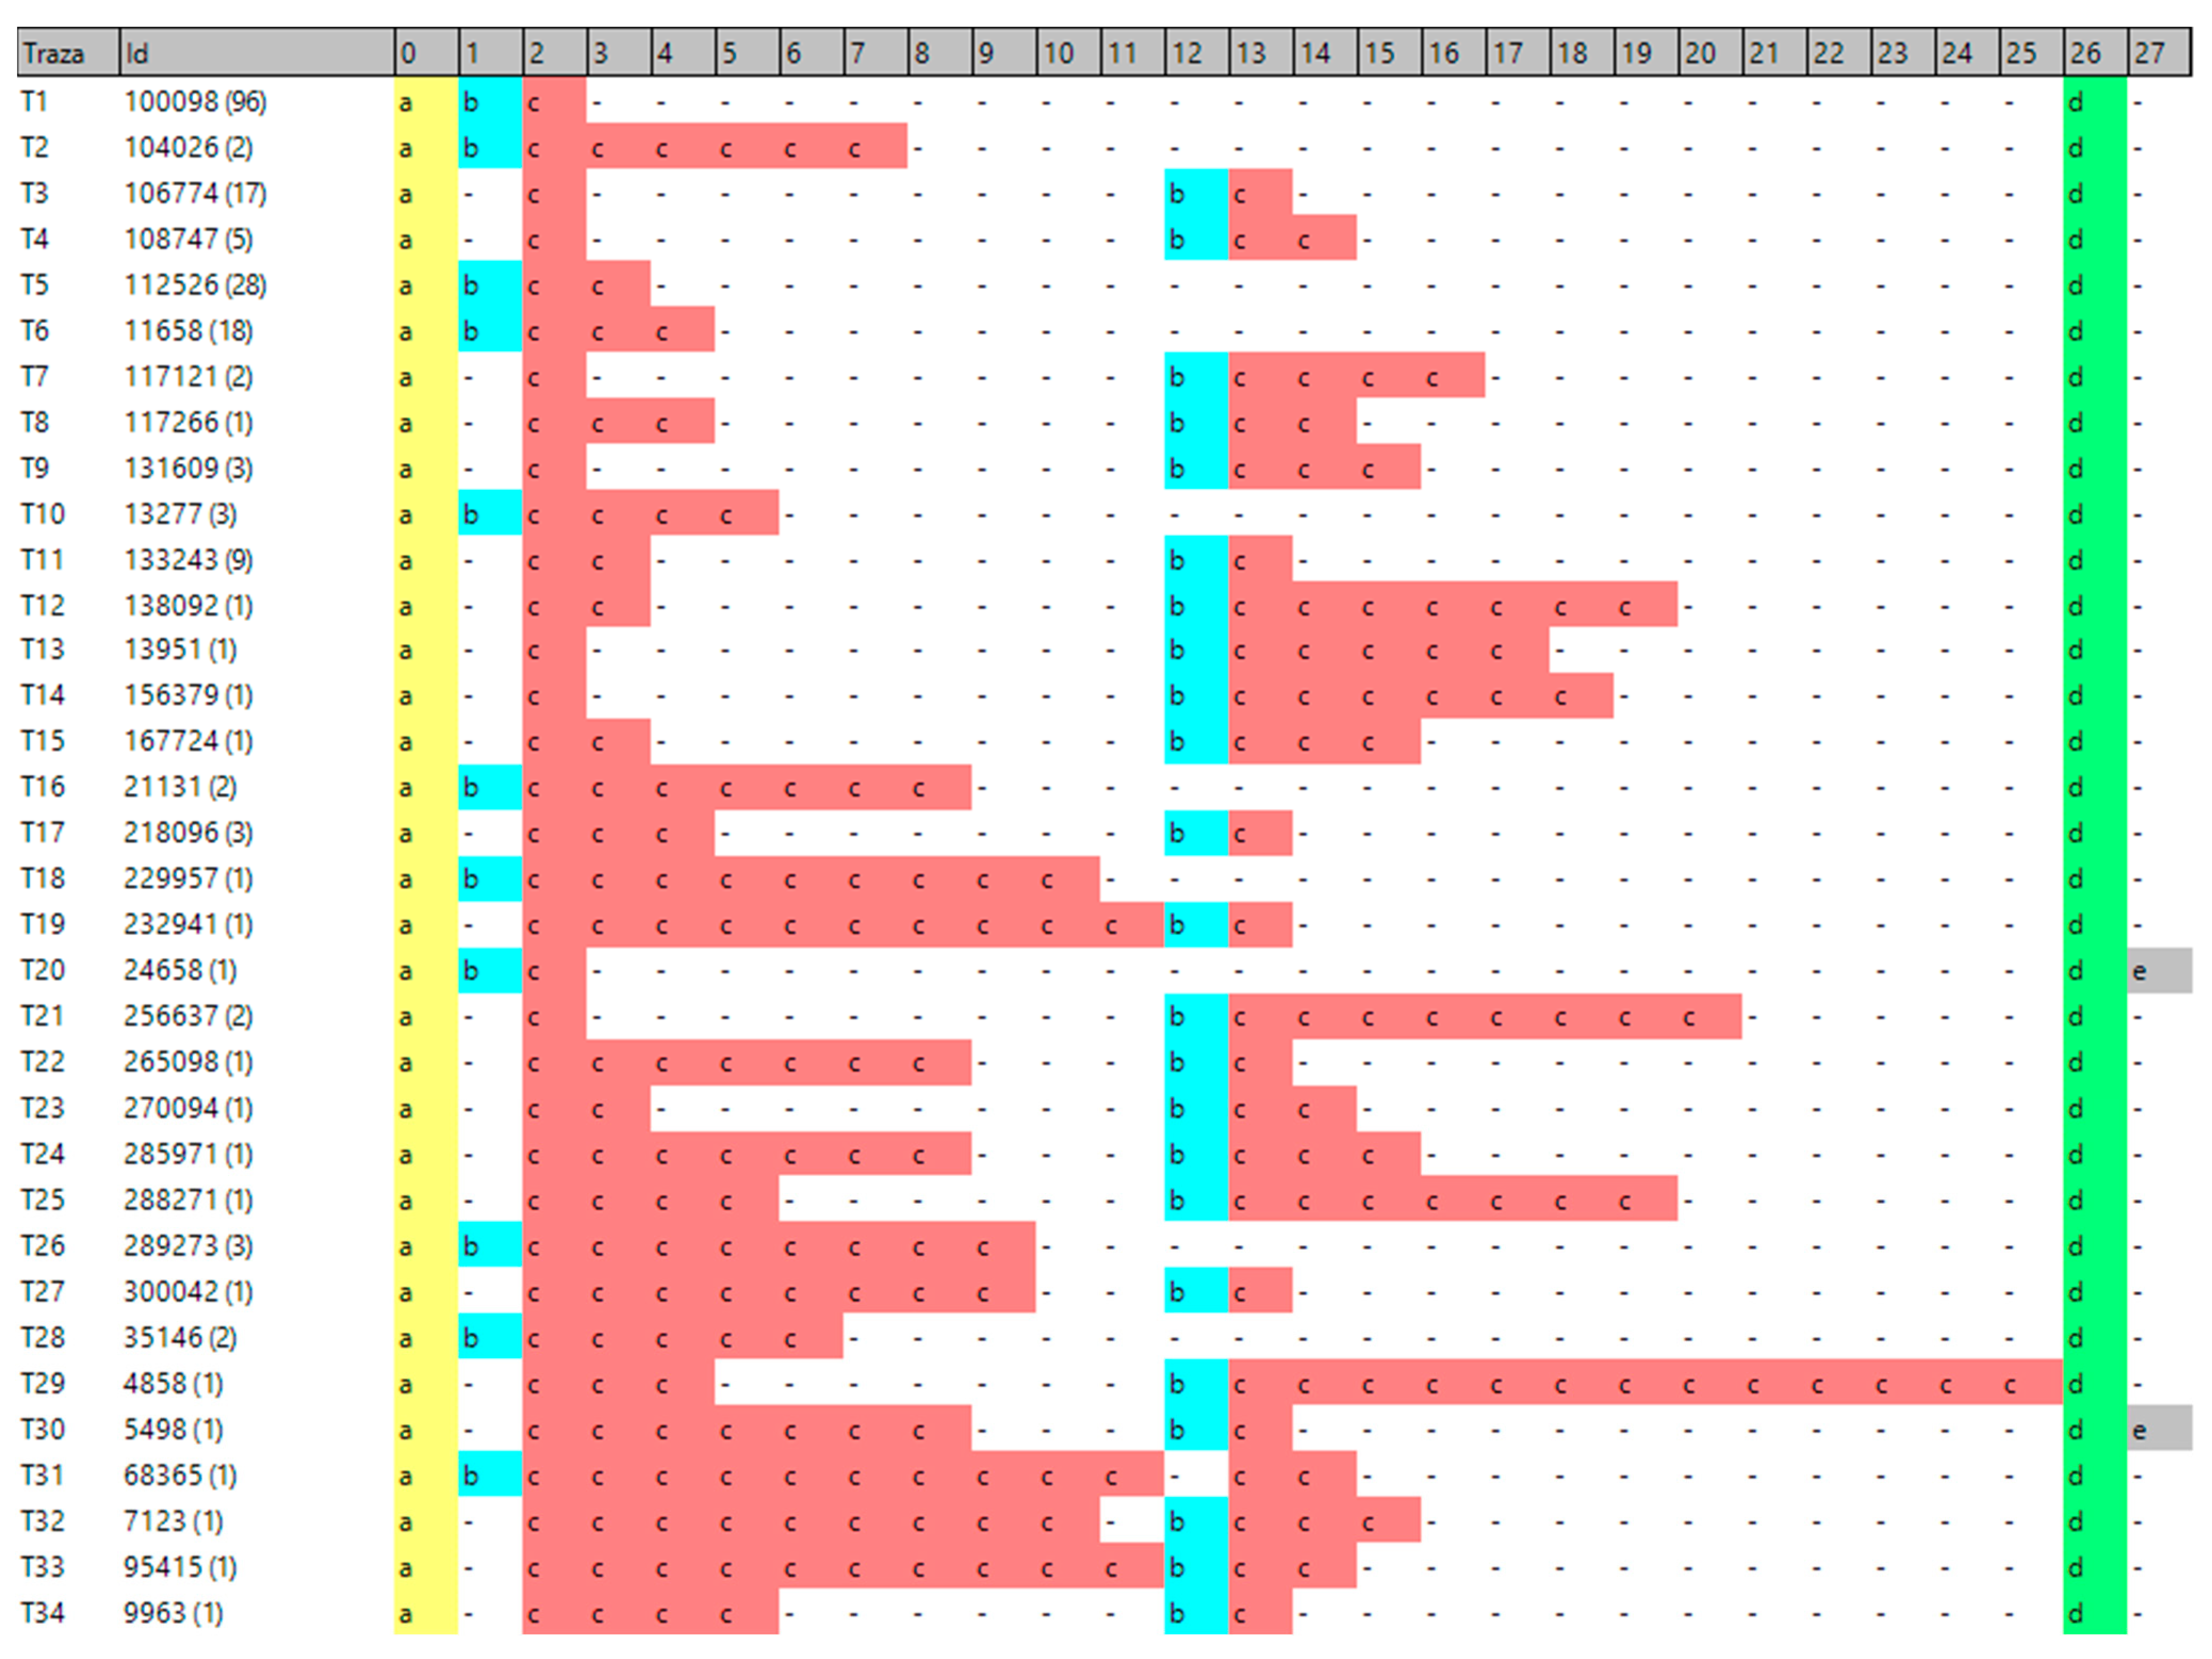
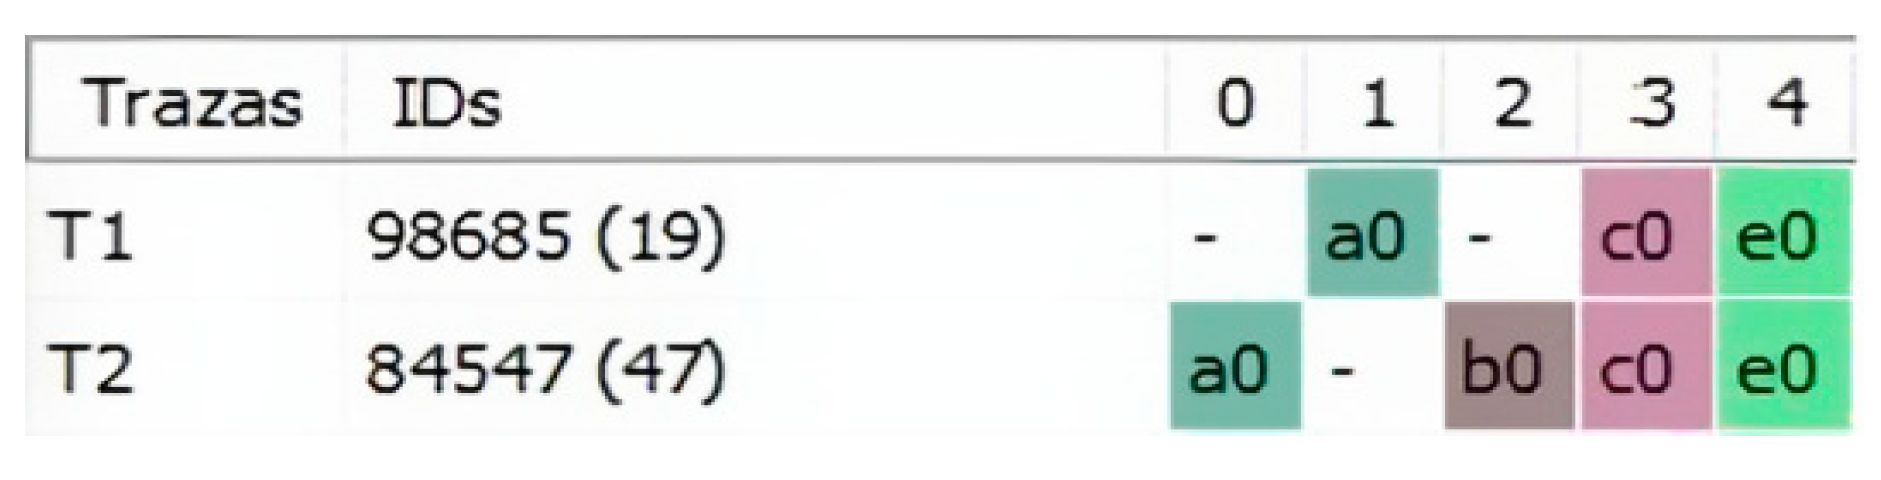
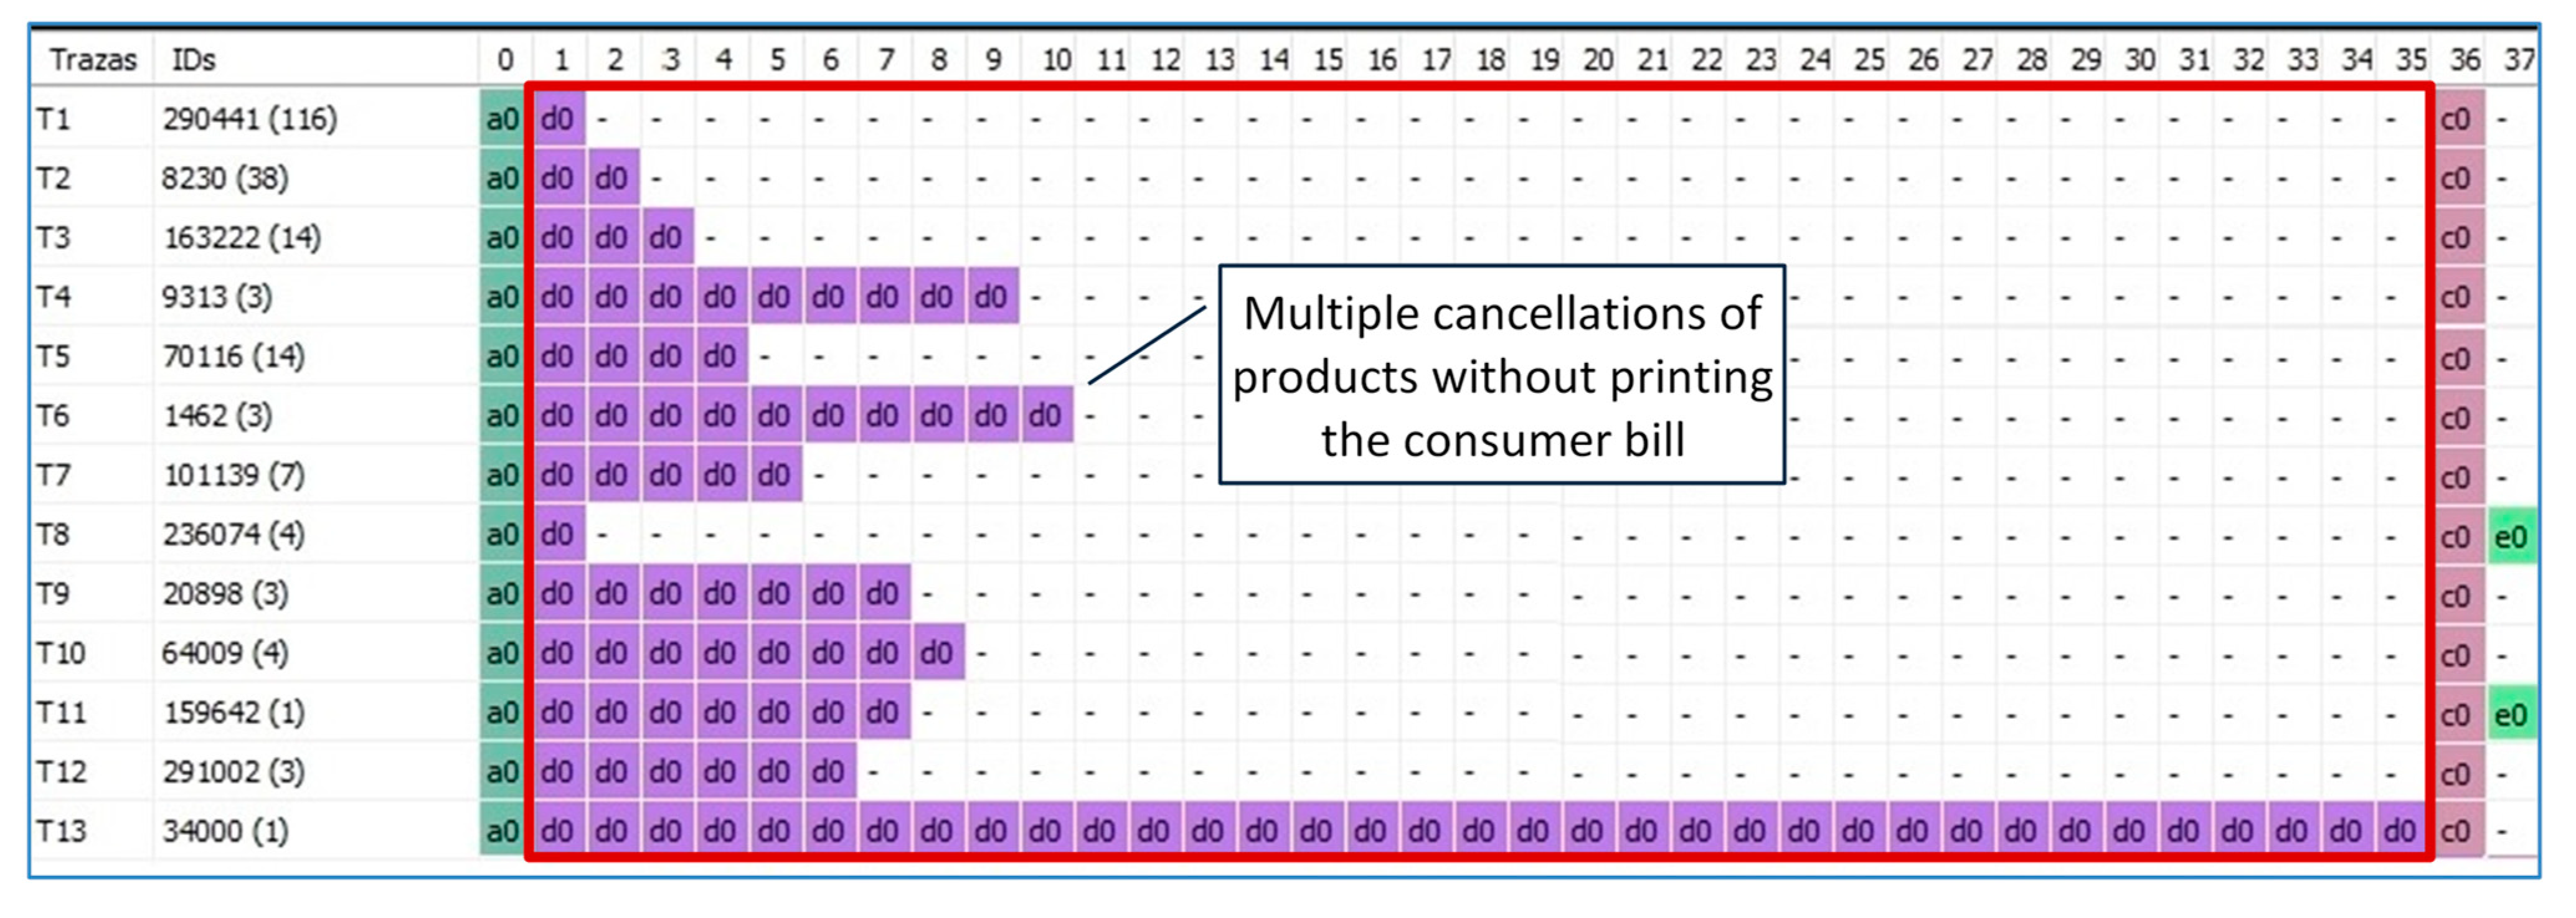
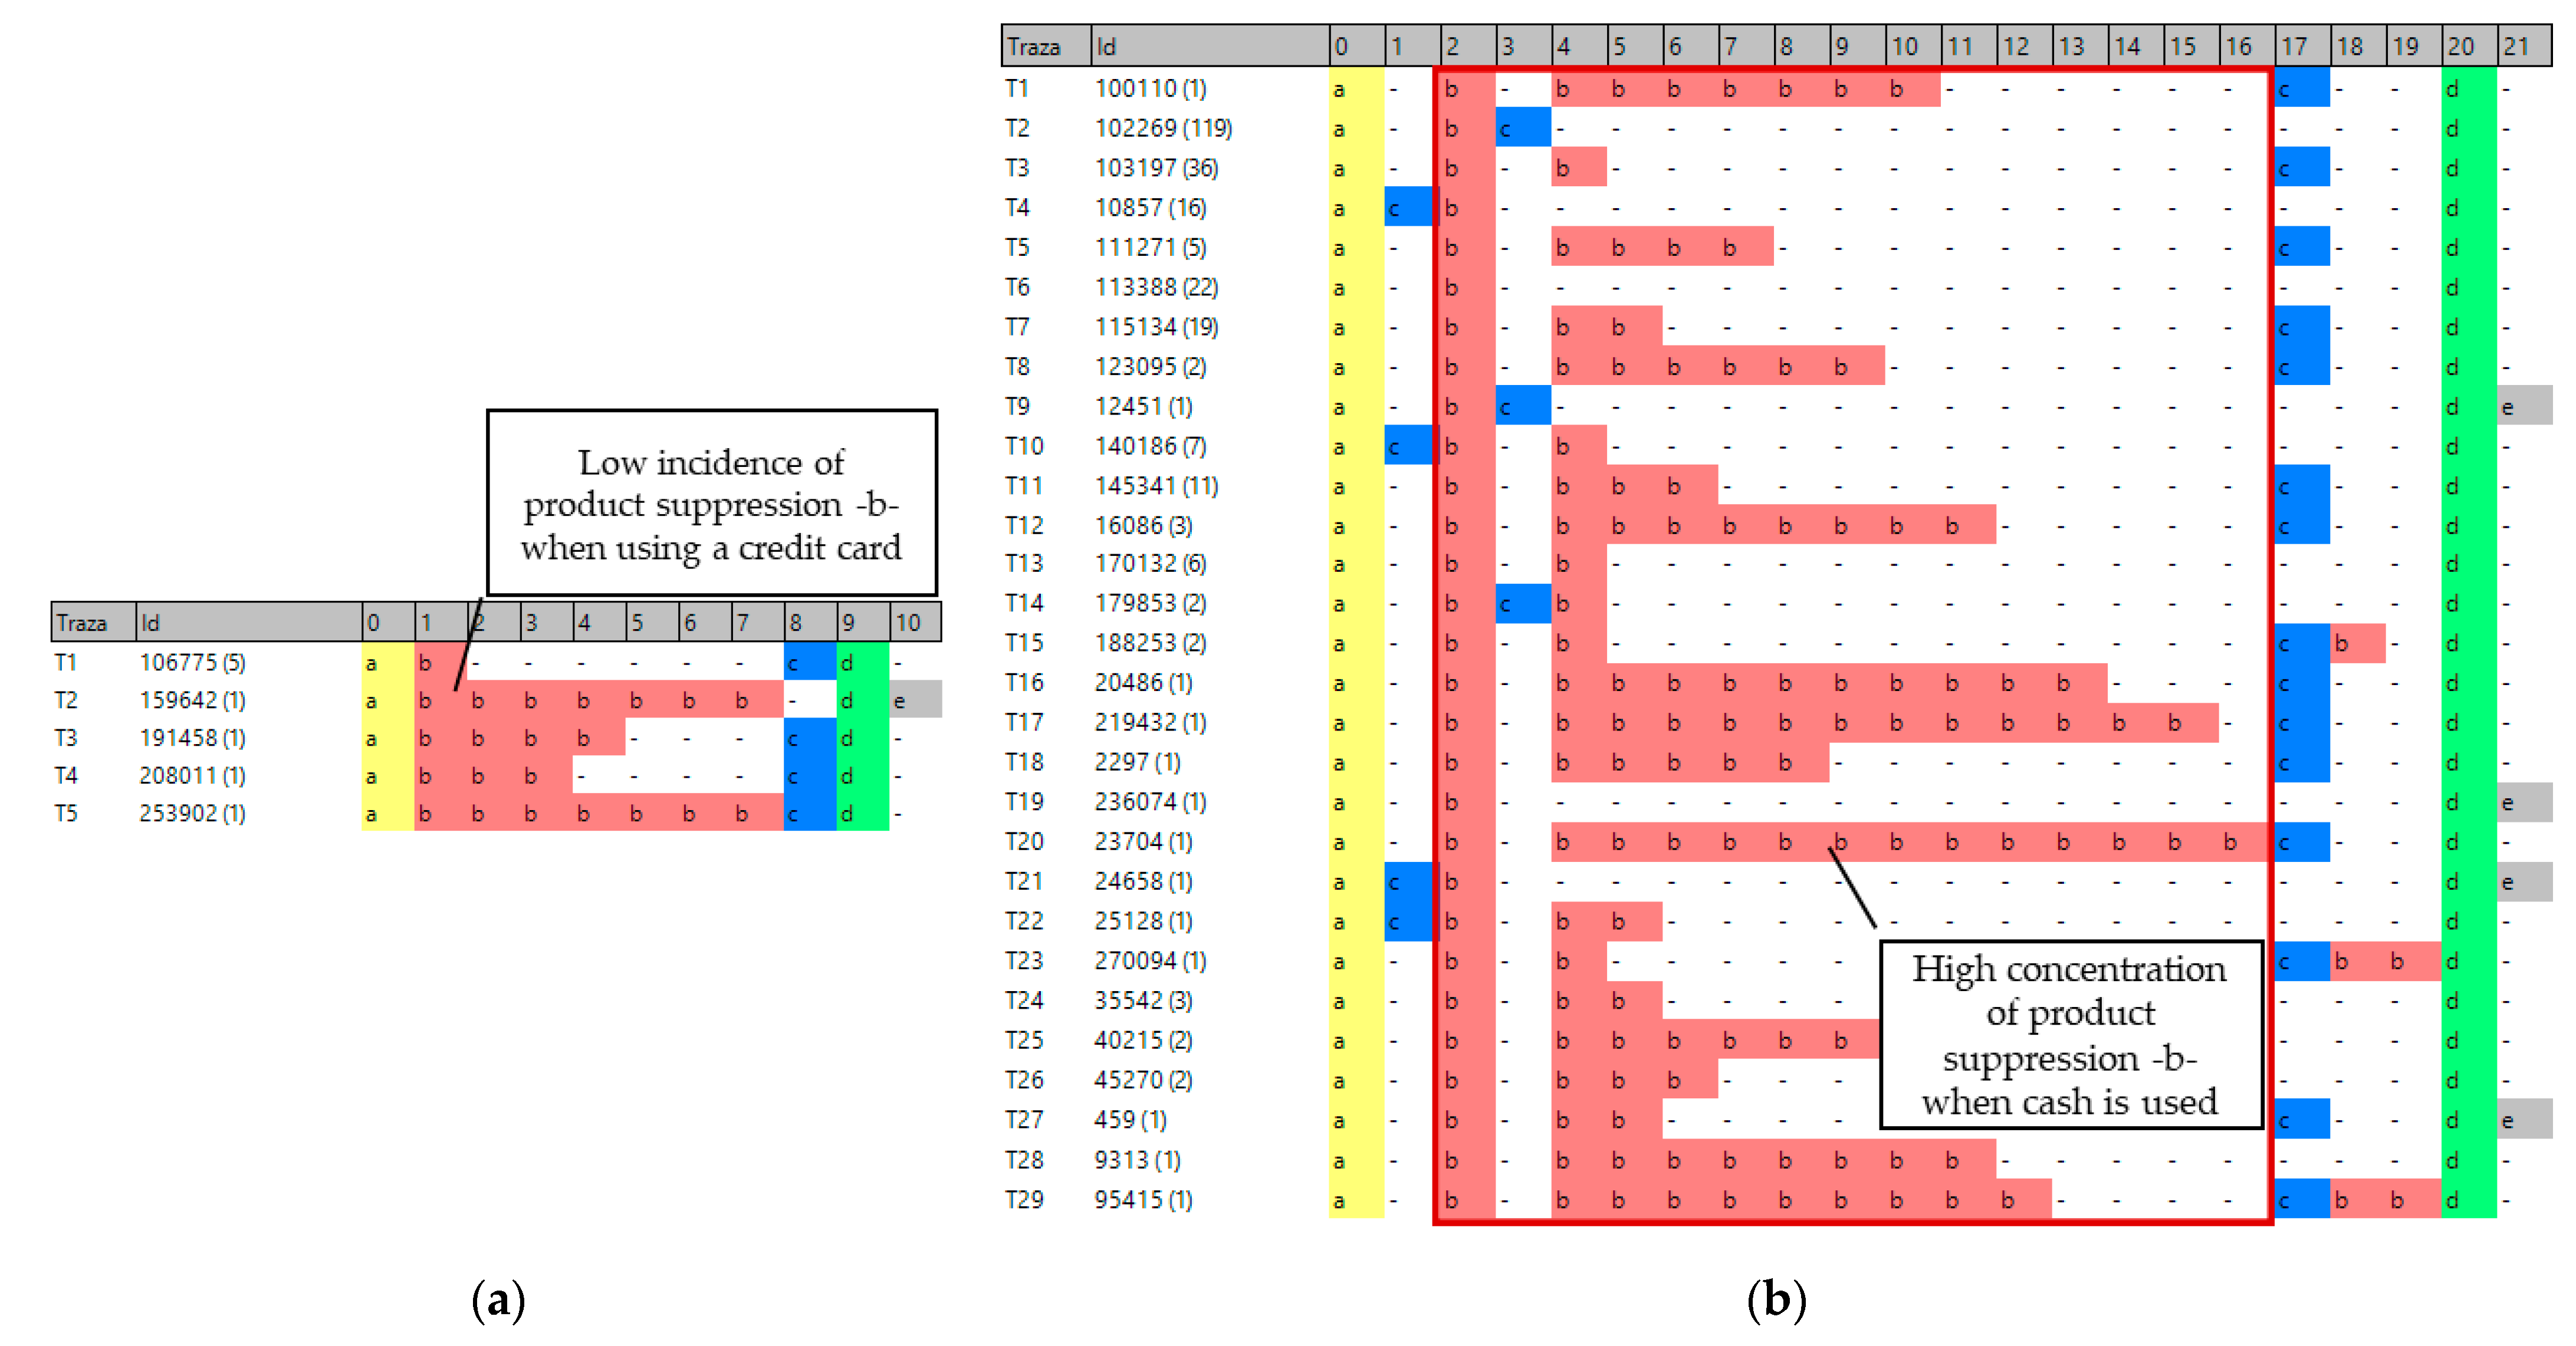
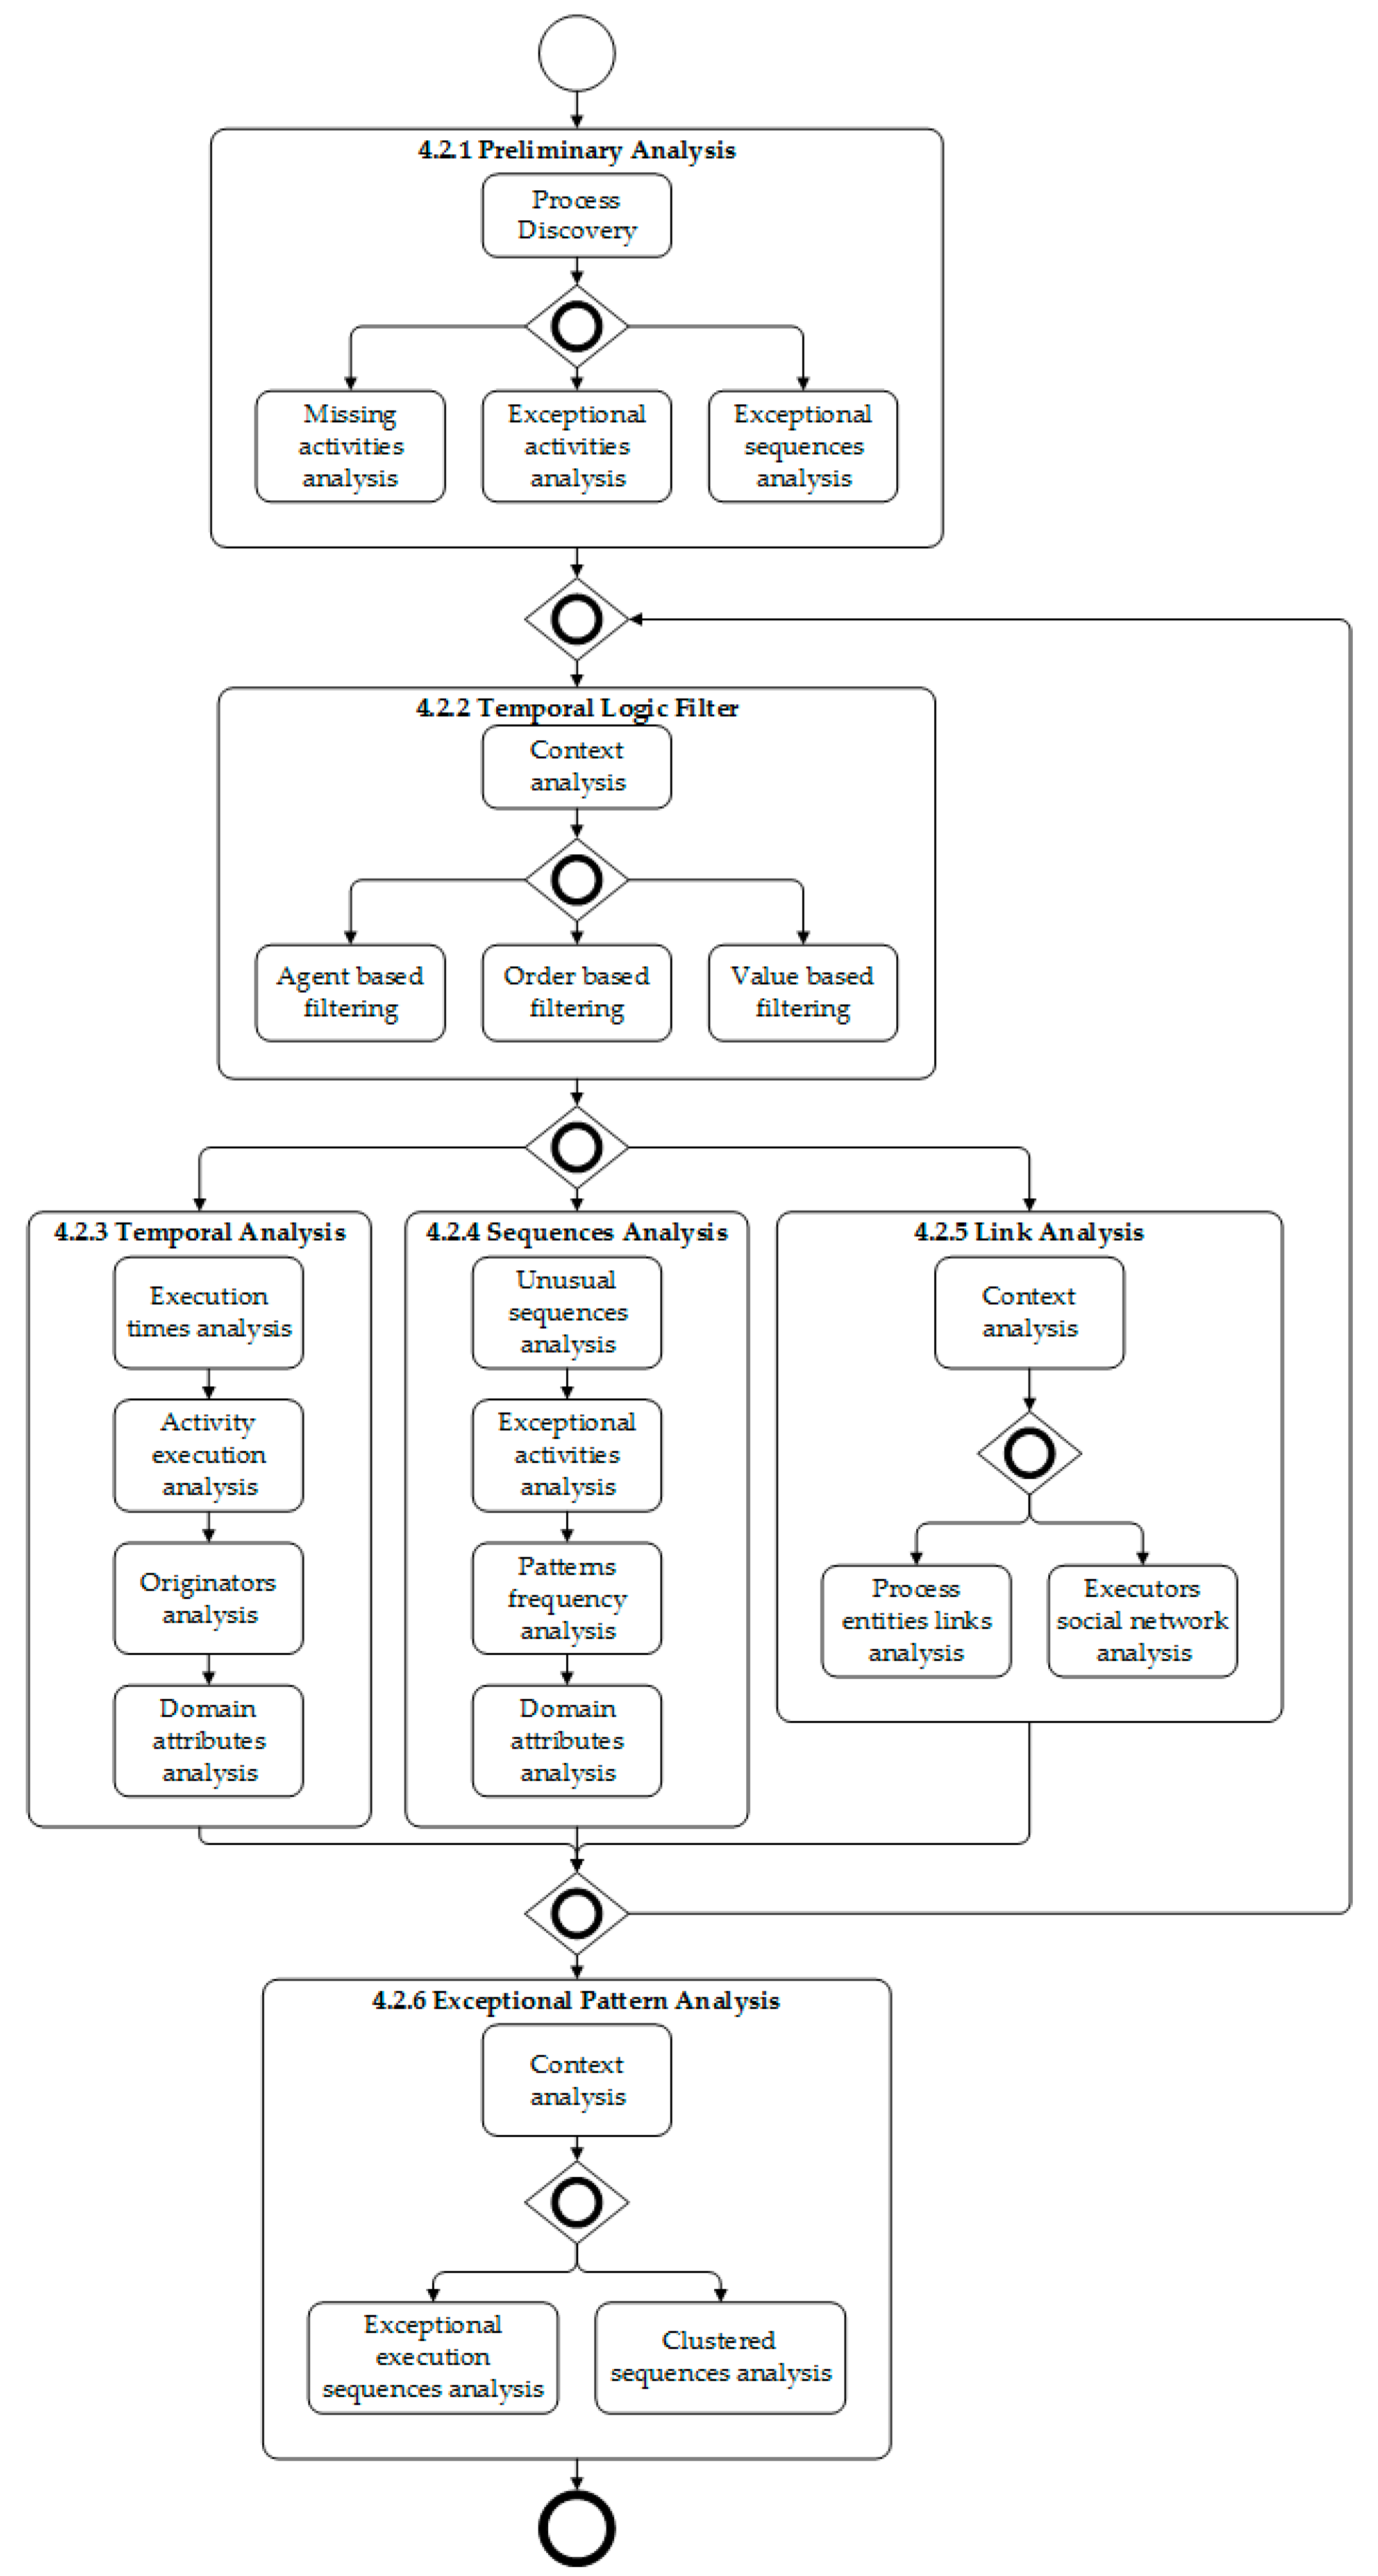