Article

Tribological Performance of Friction Pairs with Different Materials and Bi-Composite Surface Texture Configurations

1
Faculty of Mechanical and Electrical and Energy Engineering, Zhejiang University Ningbo Institute of Technology, Ningbo 315010, China
2
College of Petrochemical Engineering, Lanzhou University of Technology, Lanzhou 730050, China
3
Key Laboratory of Marine Materials and Related Technologies, CAS, Zhejiang Key Laboratory of Marine Materials and Protective Technologies, Ningbo Institute of Materials Technology and Engineering, Chinese Academy of Sciences, Ningbo 315010, China
*
Author to whom correspondence should be addressed.
Appl. Sci. 2021, 11(11), 4738; https://doi.org/10.3390/app11114738
Submission received: 7 April 2021 / Revised: 7 May 2021 / Accepted: 10 May 2021 / Published: 21 May 2021
(This article belongs to the Section Surface Sciences and Technology)

Abstract

:
Bi-composite surface texture configurations are proposed to study the friction performance of a mechanical seal under low speed. Three sets of comparative experiments were designed. They involved friction pairs with different pairing materials, single texture patterns, and bi-composite surface texture configurations. Tribological performances, such as friction coefficient, wear quantity, and surface topography, were measured. The research results showed that the average friction coefficient and surface temperature rise of the 3-C3 group (triangular texture in SSiC–conventional spiral groove in SSiC) were only 0.052 and 3.8 °C, respectively, which was the smallest friction coefficient and lowest temperature rise of all the test subjects. What’s more, the wear of M120D was mainly caused by the cutting effect of the texture edges, the adhesive wear of the non-textured areas, and the secondary wear caused by debris from the internal texture. It was indicated that the bi-composite patterns of spiral-triangle could produce a ‘synergistic effect’ by improving tribological performance and reaching lower friction in low-rotational-speed operation, which could provide a basis for designing a long-lasting and exceptionally reliable mechanical seal.

1. Introduction

Mechanical seal directly affects the thermal control and reliable operation of rotary machinery equipment, such as turbines, centrifugal compressors, communication radars, and so on. As operating conditions become more demanding, rotary seals are faced with more severe environments, such as conditions with low rotational speeds, swinging, and impacts. At low rotational speeds, an effective liquid film cannot be formed by the rotary and stationary rings of a mechanical seal, creating key issues such as friction damage and wear failure.
The friction and wear of the end surfaces of mechanical seals have been extensively investigated. Most studies have been based on experimental and simulation analyses. Shankar et al. [1] designed test equipment to conduct end surface friction and wear tests on mechanical seals with tungsten carbide and resin-impregnated carbon pairs. The friction characteristics of different lubrication conditions could be analyzed by this equipment. Sinou et al. [2] analyzed the local vibrations of a tribological system under interfacial lubrication conditions and verified the tribological performances of carbon and tungsten carbide seal pairings under different lubrication environments by studying the complex global response caused by local interface behavior. The trends of the leakage rate changes were determined by designing a test device to control the stability of the friction coefficient and change the surface roughness of the seal rings [3,4,5]. Kovalchenko et al. [6] conducted a test experiment on the wear resistance of mechanical seal rings for pumps. The friction and wear of rotary and stationary sealing rings is more prominent under low-rotational-speed and light-load operations. Yamakiri et al. [7] studied the theory of the surface micro-structure and confirmed that the hydrodynamic pressure effect was well controlled and improved by the surface micro-structure. The results of the study showed that the lubricating liquid and wear debris could be stored by the surface micro-structure. What’s more, the performance of wear has been significantly improved by striped grooves and lattice dimples with small pitches [8]. In addition, Kovalchenko et al. [9] used lasers to produce different types of grooves and found that the hydrodynamic pressure effect in the grooves generated an additional load-carrying force. To further improve the fluid carrying capacity, Wang et al. [10] applied an NSGA-II algorithm to further optimize the texture shapes and discussed the effects of the texture geometric parameters on the sealing performance. The results showed that the seal opening force is increased by more than 20% by a change in texture [11,12,13]. Subsequently, Zhang et al. [14] and Adjemout et al. [15] conducted actual tests on friction pairs with surface modifications and showed that the sealing lubricity and friction were improved by the textures of the end surfaces of the friction pairs. However, there are few studies on the friction performance of mechanical seal friction pairs under low rotating speed (nr ≤ 300 rpm), and there is a lack of research on the composite pattern texture of micro-grooves and micro-dimples. Thus, friction pair pairing schemes and bi-composite surface texture configurations are worth studying.
Based on the idea of texture in the rotating ring of a mechanical seal, this paper puts forward interesting patterns in which the micro-grooves and micro-dimples were combined in double rings (rotating and static rings), to which we refer as bi-composite surface texture configurations. It was designed in order to study the friction performance of a mechanical seal in low speed. This paper was mainly studied from three aspects, namely, friction pairs with different materials, single texture pattern, and bi-composite surface texture configurations in the surface of the friction pairs. Subsequently, the friction coefficients, temperatures, wears, and surface morphologies were analyzed in detail for use in the design of a mechanical seal.

2. Test Equipment and Specimens

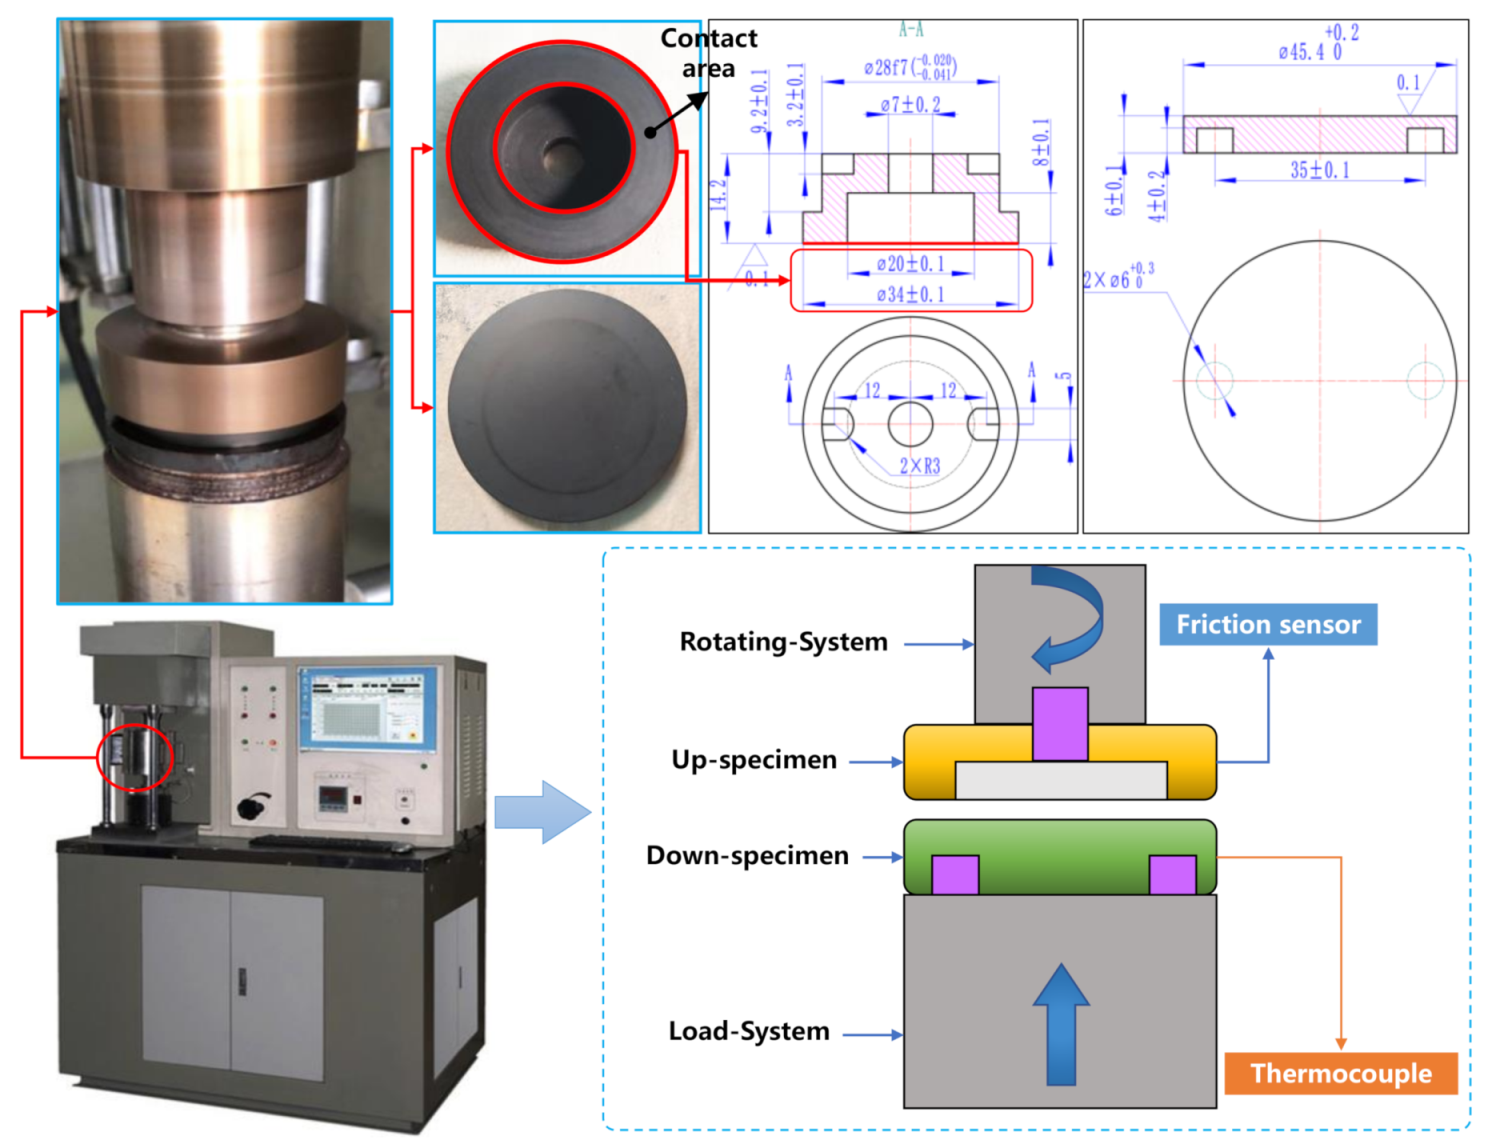
2.1. End Surface Friction and Wear Testing Apparatus

In this study, an HDM-2 end surface friction and wear testing apparatus was used, as shown in Figure 1. This apparatus was composed of a spindle, upper and lower specimen fixtures, upper and lower specimen boxes, loading devices, medium circulation devices, and heating and cooling circulation devices. It could operate at 0–3000 rpm and 20–3200 N. The temperature could be adjusted within the range of 0–200 °C. The upper specimen was mounted on the central screw hole of the spindle through the upper clamping plate and the fastening screw, and the lower specimen was mounted on the special lower specimen box and held with the lower clamping plate. To truly reflect the operating state of the friction pairs of the mechanical seals, the testing apparatus rotated the upper specimen and applied loads to the lower specimen so that the upper and lower specimens formed rotational friction. The structures, sizes, and materials of the upper and lower specimens could be designed independently. The lower specimen box was supported by spherical bearings and had good followability when the stationary ring was in contact with the rotational ring.
The testing apparatus was equipped with rotational speed and pressure sensors at the transmission device and hydraulic loading device, respectively. The sensor converted physical signals into digital signals and transmitted them to external equipment for real-time adjustment of the rotational speed and load. During a test, the rise rates of the friction surface temperature of the lower specimen was measured by a temperature sensor inserted in the hole in the lower specimen fixture. However, the friction coefficient is dimensionless and cannot be directly measured with sensors. Therefore, a torque sensor was connected to the lower specimen. The measured friction torque was transmitted to the host computer and converted into the friction coefficient. The following equations were used to determine the friction torque and friction coefficient:
M = F f L = r r π 2 μ σ r 2 d r = 2 3 π μ σ ( R o 3 R i 3 )
σ = F / π ( R o 2 R i 2 )
f = 3 F f L / 2 π σ ( R o 3 R i 3 ) = 3 ( R o 2 R i 2 ) F f L / 2 ( R o 3 R i 3 ) F
where M is the friction torque; Ff is the friction force; L is the equivalent arm length, L = 0.08 m; σ is the contact pressure in a unit area; F is the load; Ri is the inner radius of the upper specimen; Ro is the outer radius of the upper specimen; and f is the friction coefficient.

2.2. Test Specimens

The conventional materials of frictional pairs were M120D (graphite) and SSiC (silicon carbide) [16]. However, at low rotational speeds, the friction pair formed by the rotary ring and the stationary ring was in contact for a long period, so the stationary ring (M120D) wore out significantly, leading to premature failure of the mechanical seal. In this study, two pairing schemes of the friction pairs were designed, that is, M120D–SSiC (graphite and silicon carbide) and SSiC–SSiC (silicon carbide and silicon carbide). The M120D was only used as the upper specimen. The SSiC could be used as the upper or lower specimen. The structural dimensions of the upper and lower specimens are shown in Figure 1. The physical parameters of the M120D and the SSiC are shown in Table 1.
Considering the effects of the surface characteristics of the friction pairs on the tribological performance, three widely used texture patterns—triangular dimples [17], elliptical dimples [18], and conventional spiral grooves—were engraved on the SSiC surface. The specific geometric parameters of the texture patterns are shown in Table 2. Fiber optic processing technology was used to create these three textures. A galvanometer scanner and numerical control system were used to drive the laser beam to pass through the matrices [19,20,21,22]. A pulsed solid-state YAG laser with a pulse width in the range of 30 fs to 30 ps was used. The depth and aspect ratio were controlled by the laser pulse duration, wavelength, and power. The engraving process was as follows:
  • The laser power was set to 80%, and the engraving was performed repeatedly at this power to obtain the required depth of the texture.
  • The laser power was set to 50%. The surface was scanned, and finishing was performed on the texture areas that met the depth requirement. The uneven bottoms of the texture areas were repaired, and the roughness was improved.
  • The laser power was reduced to 20%. The burr on the edge of the pattern was improved.
  • Fine polishing was performed on the engraved specimens to further improve the quality of the bottoms of the texture.
  • Ultrasonic cleaning was performed on the specimen, after which it was placed in a drying oven to remove surface moisture.
The textured surface profile of the specimen was scanned, and a white-light interference three-dimensional profiler was used, as shown in Figure 2.

3. Test Plan and Process

3.1. Test Plan

The operating parameters of the mechanical seal are shown in Table 3. The mechanical seal is operated under low-rotational-speed and low-pressure conditions, and an effective hydrodynamic pressure cannot be formed by the rotary and stationary rings [23,24]. As a result, the friction pairs (rotating and static rings) are kept in contact.
The test was divided into three stages. The first stage was for the friction pairs mated with different materials, the second stage was for the friction pairs with the single surface texture patterns, and the third stage was for friction pairs in the bi-composite surface texture configurations. The rotational speed and load were the inputs of the surface friction and wear testing apparatus used in this test. According to the actual operating and structural parameters of the mechanical seal (shown in Table 3) and the size of the specimen in this test (shown in Figure 1), the linear velocity and pressure of the actual sealing rings must be consistent with that of the seal specimens because of the difference in size between the actual sealing rings and the seal specimens. According to the data in Table 3 (medium pressure was 0.3 MPa and rotating speed was 15–35 rpm) and Figure 1 (the contact area with an inner diameter of 20 mm and an outer diameter of 34 mm), the load was determined to be 200 N (contact area and medium pressure) and the working conditions of the seal specimens were 100–300 rpm, in which 250 rpm was the cruising speed. In addition, the first stage of the test involved 100, 150, 200, 250, and 300 rpm. The surface friction and wear testing apparatus increased speed from 0 to 100 rpm, and increased by 50 rpm at regular intervals, before finally reaching 300 rpm. The above process takes 6 min. At the same time, considering the fluctuation of the speed in the surface friction and wear testing apparatus and the integrity of experimental data, the operating time was set to 480 s. The detailed description of the test groups and the test plan are shown in Table 4.
(1)
Friction pairs with different materials
The 1-A1 group (M120D–SSiC) and the 1-A2 group (SSiC–SSiC) were tested with a constant load of 200 N and rotational speeds in the range of 100–300 rpm at an interval of 50 rpm. Each test lasted 480 s for each rotational speed. Test data, including the friction coefficient, the rise rates of the friction surface temperature, the wear of sealing rings, and sealing surface morphology, of the 1-A1 and 1-A2 groups were measured.
(2)
Single surface texture patterns
Triangular, elliptical, and conventional spiral grooves, as the variable of these tests, were separately engraved on three surfaces of rotating rings, which were made from SSiC. These rings were paired with three M120D surfaces to form the 2-B1 group (M120D–SSiC with triangular texture), the 2-B2 group (M120D–SSiC with elliptical texture), and the 2-B3 group (M120D–SSiC with conventional spiral grooves). The test conditions for each group were 200 N and 250 rpm (cruising rotational speed), which were maintained for 480 s. The friction coefficient, the rise rates of the friction surface temperature, the wear of sealing rings, and sealing surface morphology of the 2-B1, 2-B2, and 2-B3 groups were measured, respectively.
(3)
Bi-composite surface texture configurations
The 1-A2 group was used as the base to form friction pairs in the 3-C1 group (untextured SSiC–untextured SSiC), the 3-C2 group (SSiC with triangular texture–SSiC with elliptical texture), and the 3-C3 group (SSiC with triangular texture–SSiC with conventional spiral grooves). They were tested at 200 N and 250 rpm (cruising rotational speed) for 480 s. The friction coefficient and temperature of the friction pairs in the 3-C1, 3-C2, and 3-C3 groups were measured.

3.2. Test Procedure

The plan of this experiment was divided into three parts: (1) Friction pairs with different materials; (2) Single surface texture patterns; (3) Bi-composite surface texture configurations, as shown in Table 4. Although the three parts of the friction test were different in the surface structure and material of the friction pairs, the test steps were same. The specific test steps were as follows, as shown in Figure 3.
(1)
According to Table 2 and Table 4, different texture patterns were carved on the surface of SSiC by fiber laser machine.
(2)
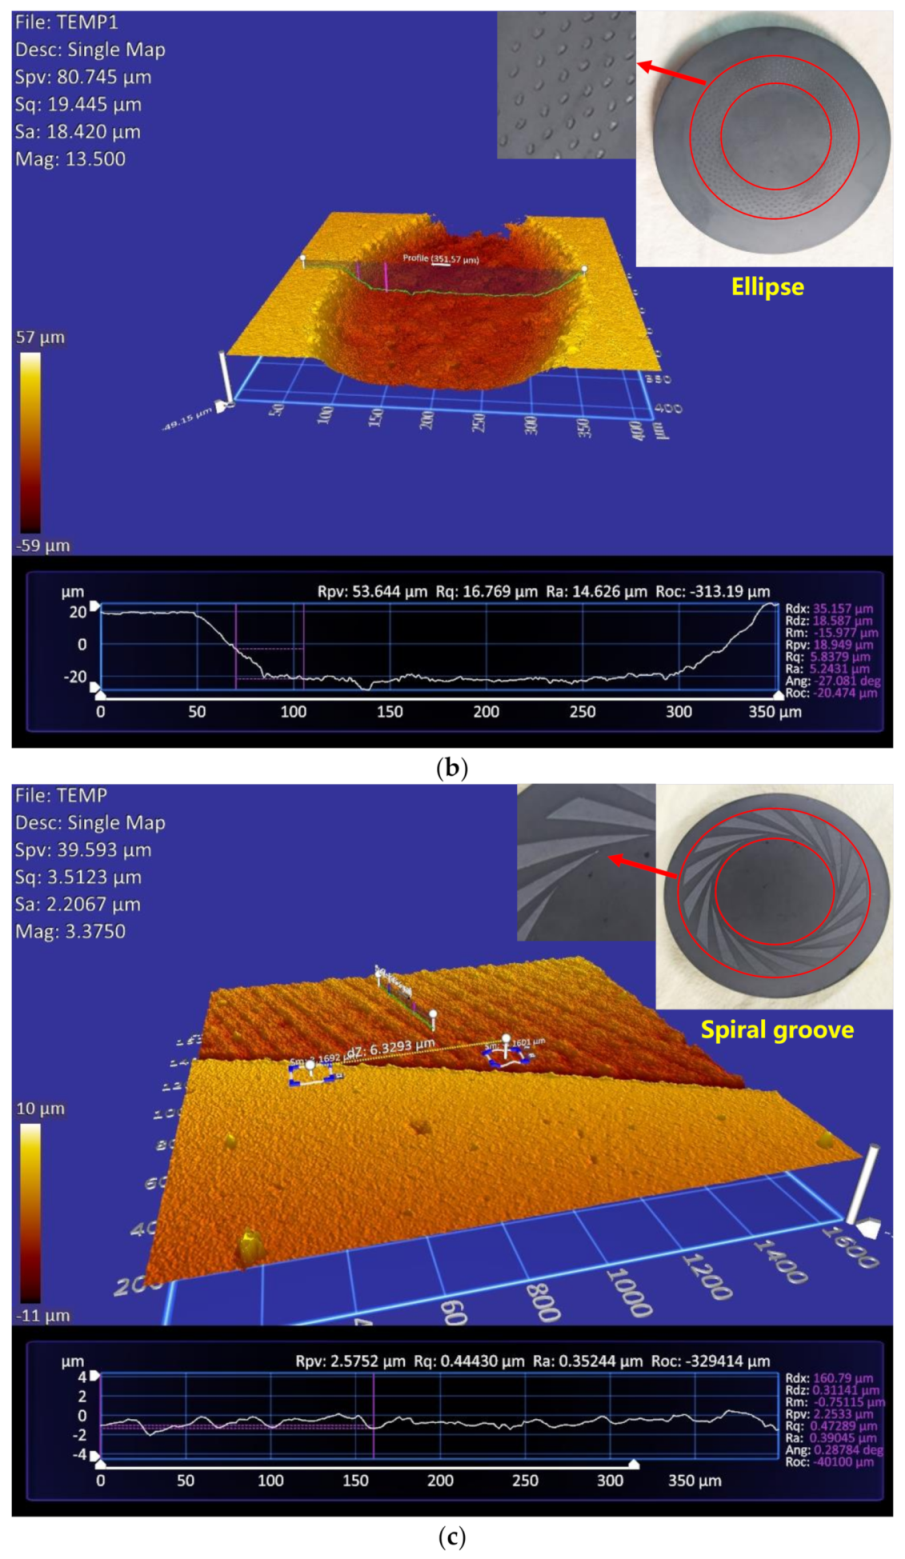
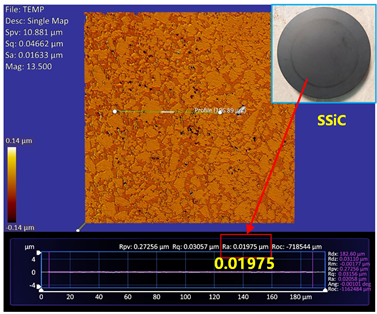
All the specimens were cleaned and dried, and the surface morphologies of all specimens were measured and scanned by white-light interference three-dimensional profiler and SEM (scanning electron microscope). The average surface topography parameters were read after three consecutive scans in the white-light interference three-dimensional profiler.
(3)
The initial weight of the sealing rings (M120D) was measured and recorded.
(4)
According to the plan of the experiment and Table 4, friction pairs with different materials were carried out first.
(5)
The specimen was installed in the end surface friction and wear testing apparatus.
(6)
The friction test was started, and the relevant data were recorded, such as friction torque, friction coefficient, and surface temperature of the friction pairs. After the load, speed and running time were set. Friction coefficient and surface temperature of the friction pairs were dynamic measurements, and each test corresponds to only one set of the friction pairs (stationary ring and rotating ring), so every group friction pair was tested only once.
(7)
At the end of a group test, the specimen was removed, cleaned, and dried. The sealing ring of M120D was weighed, and then the surface topography parameters of the specimen were measured by white-light interference three-dimensional profiler and SEM.
(8)
At the end of the first part of the testing plan, repeat the test steps of (5)–(7) to test the second group of single surface texture patterns and the third group of bi-composite surface texture configurations.
(9)
The weight of the sealing ring (M120D) was measured before and after the test, that is, the sealing rings (M120D) in the 1-A1, 2-B1, 2-B2 and 2-B3 groups. To ensure the accuracy of the data, the sealing rings (M120D) were measured three times each time, and the average weight of these three measurements was taken as the test result.

4. Discussion and Analysis

4.1. Performance of Friction Pairs with Different Materials

4.1.1. Friction Coefficient

Figure 4 shows the variations of the friction coefficient of the 1-A1 and 1-A2 groups with the rotational speed and running time. The friction coefficient range and average friction coefficient are listed in Table 5 for 1-A1 and 1-A2 groups under 100–300 rpm. The friction coefficients of both groups were decreased by an increase in rotational speed. In addition, the variations of the friction coefficient of the two groups gradually changed from being strong to being weak with the running time, which indicated that at the beginning of the contact, the surface morphology of the friction pairs needed to undergo a mutual matching process in order to improve the resistance formed by the interactions of the asperities on the surface of the friction pair and the attraction between the atoms. Therefore, as the test running time increased, the friction coefficient between the friction pairs was decreased gradually and tended to be stable. The comparison of the friction coefficient in the 1-A1 and 1-A2 groups showed that the friction coefficient of the 1-A1 group was lower and was mostly less than 0.1, and the real-time variation amplitudes of the friction coefficient were also exceedingly small because M120D is a self-lubricating graphite material.

4.1.2. Surface Temperature of Friction Pairs

Figure 5 shows the temperature changes of the friction pairs for the 1-A1 and 1-A2 groups during the test. The surface temperature of friction pairs and temperature rise are listed in Table 5 for 1-A1 and 1-A2 groups under 100–300 rpm. The surface temperature rises of the friction pairs in the tests of the two groups showed a trend of first increasing and then decreasing with the increase in the rotational speed. This is because in the process of rising rotational speed, more heat was produced by the relative motion path of the friction pairs per unit time; at the same time, a hydrodynamic pressure effect of the micro-interstitial fluids was increased by rotational speed and the convective heat exchange between the liquid films and the surrounding environment was accelerated. Further comparison of the surface temperature rises of the friction pairs in the 1-A1 and 1-A2 groups showed that the maximum temperature rises in these two groups were 12.3 °C and 9.9 °C at 250 rpm, respectively, and the minimum temperature rises in these two groups were 2.6 °C and 2.4 °C at 300 rpm, respectively. The significant difference in the maximum temperature rises between 1-A1 and 1-A2 indicated that the temperature rise was closely related to the materials of the friction pairs. SSiC has a higher thermal conductivity and lower expansion coefficient, which could better control the surface temperature rise.

4.2. Performances of Friction Pairs with Single Texture Patterns

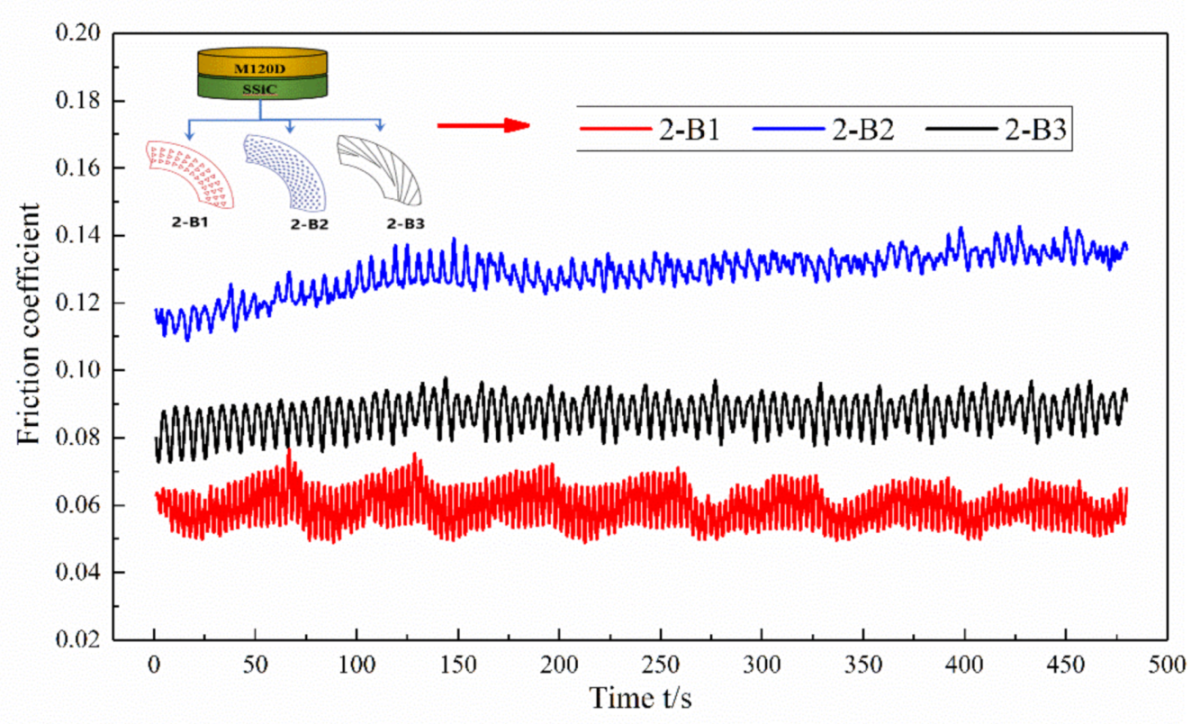
4.2.1. Friction Coefficient

Figure 6 shows the tests of the three different single textures with triangular, elliptical, and conventional spiral grooves under 250 rpm. The friction coefficient range and average friction coefficient are listed in Table 6 for 2-B1, 2-B2, and 2-B3 groups under 200 rpm and 200 N. According to Figure 6 and Table 6, the average friction coefficient of the 2-B1 group (triangles) was only 0.060, which was much smaller than the friction coefficient (0.071) of the 1-A1 group at a rotational speed of 250 rpm shown in Figure 4. A more complicated change was presented by the friction coefficient of the 2-B2 group (ellipses), and the amplitude of the 2-B2 group was smaller than that of the 2-B1 group. This was because the edges of the ellipses were smoother than the edges of the triangles. However, the average friction coefficient of the 2-B2 group was 0.129, which was 82.46% higher than the friction coefficient of the 1-A1 group at the rotational speed of 250 rpm shown in Figure 4. A steady and the lowest variation amplitude was presented by the friction coefficient of the 2-B3 group (conventional spiral grooves) and the average friction coefficient of the 2-B3 group was 0.081. The differences in the friction coefficient due to the different textures could be attributed to the following three reasons: (1) Since the boundaries of the elliptical micro-dimples were smoother, as fluid entered the elliptical micro-dimples, the micro-dimples were filled with more fluid, so adding the film thickness. Meanwhile, negative pressure formed readily during the operating process, resulting in an insufficient hydrodynamic pressure effect of the elliptical texture and an inability to improve the operating state of the friction pairs; (2) A strong ‘convergent wedge effect’ was produced by the sharp regions of the triangular micro-dimples. In addition, the lubrication of the micro-gap fluid was improved because of obvious directionality of the triangles; (3) The conventional spiral groove texture was a micro-groove with a large area and a small density, which was the complete opposite of the characteristics of the triangular and elliptical micro-dimples, which had small areas and large densities. An evident Rayleigh step was formed by the conventional spiral grooves that offset part of the vortex the was formed by fluid backflow because of the longer fluid domain wall, thus a vibration suppression effect was created.
From the above testing results, the following results can be concluded: (1) The average friction coefficient of the 2-B1 group (0.060) is smaller than that of the 1-A1 group (0.071), and the average friction coefficient of the 2-B2 group (0.129) is larger than that of the 1-A1 group; (2) For micro-dimple textures (triangular and elliptical), the shape is a key factor for affecting the tribological performance of a mechanical seal; (3) The effect of the micro-groove texture (conventional spiral grooves) is mainly reflected in the hydrodynamics, which can improve the stability of a mechanical seal.

4.2.2. Surface Temperature of Friction Pairs

Figure 7 shows the temperature changes of the friction pairs under 250 rpm. The surface temperatures of friction pairs and temperature rises are listed in Table 6 for 2-B1, 2-B2, and 2-B3 groups under 200 rpm and 200 N. The comparison of the temperature variation trends of the triangular, elliptical, and conventional spiral grooves indicated that the temperature rises of the 2-B1, 2-B2, and 2-B3 groups were 4.1, 12.3, and 15.3°C, respectively. In the initial testing stage, the temperature trend of the 2-B1, 2-B2, and 2-B3 groups were similar. However, as the test progressed, the surface temperature of the specimen in the 2-B1 group tended to reach equilibrium first, and it reached a maximum temperature of only 27.7 °C. Meanwhile, the surface temperature of the 2-B2 and 2-B3 groups increased slowly, which indicates that the higher frictional heat per unit of time was produced by the 2-B2 and 2-B3 groups and that the temperature dynamic equilibrium was delayed. Comparing Figure 5 with Figure 7, the temperature rise of the 2-B1 group (4.1 °C) was less than that of the 1-A1 group (12.3 °C), and the temperature rise of the 2-B3 group (15.3 °C) was higher than that of the 1-A1 group. Therefore, through the changes of the surface temperature of the friction pairs, it was determined that the friction heat can be affected by the surface texture. The temperature rise of the friction pairs could be well controlled and improved by the triangular texture.

4.2.3. M120D Wear Quantity

The weight of the M120D before and after the operations with the 1-A1, 2-B1, 2-B2, and 2-B3 friction pairs was measured, as shown in Figure 8. Relative to the wear quantity of M120D in 1-A1, the wear quantity of M120D in 2-B1 and 2-B2 decreased by 48.39% and 10.71%, respectively. However, according to the wear quantity of the 2-B3 group, it was indicated that the surface wear was significantly reduced by the triangular texture and the elliptical texture. In particular, the triangular texture was advantageous for controlling the surface wear of the friction pairs, but the amount of wear was increased by the conventional spiral groove because the cutting-edge length of the spiral groove surface was longer than those surfaces with the triangular and elliptical textures, so more debris was produced by the spiral groove texture from the M120D.

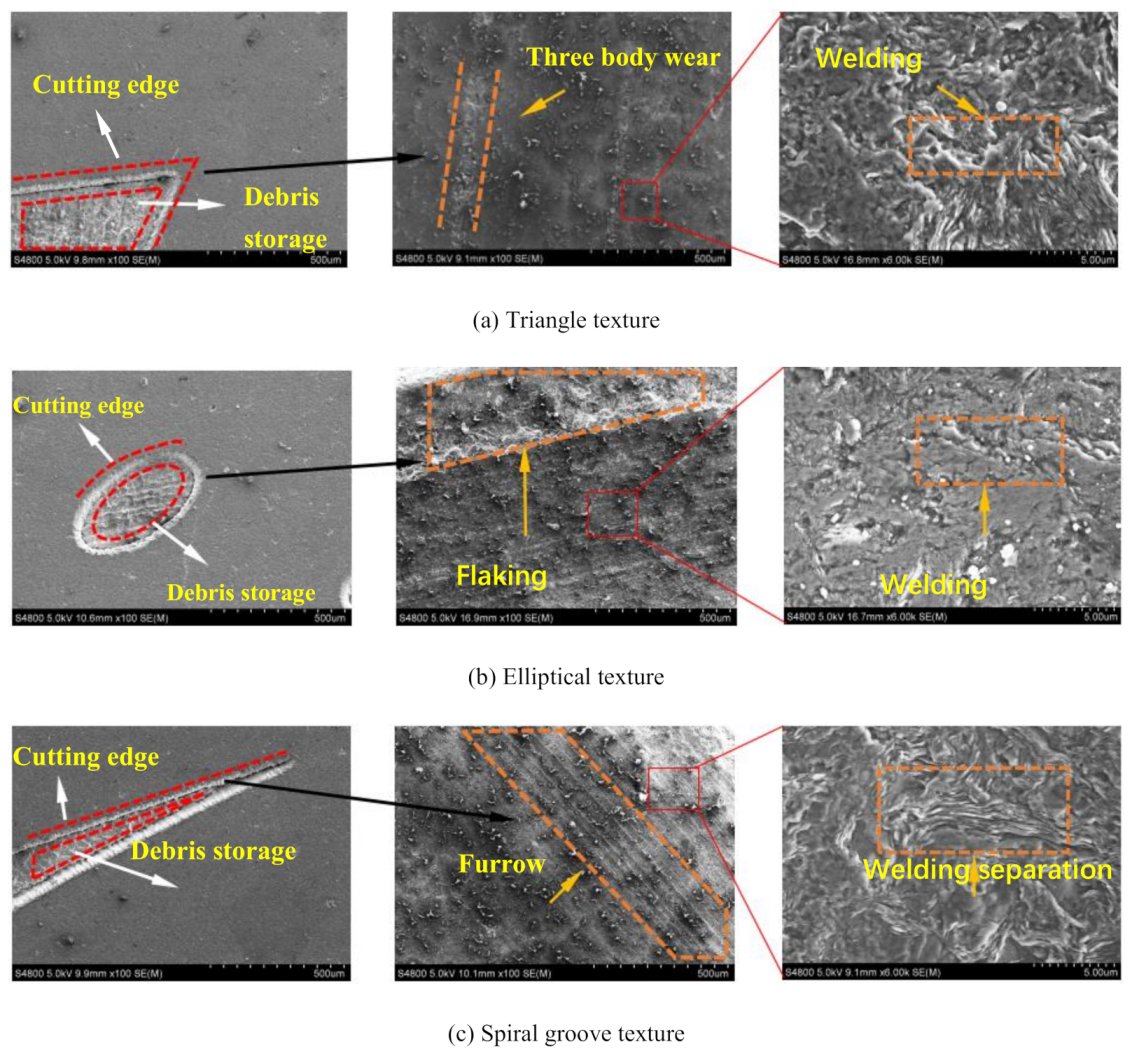
4.2.4. Micro Morphology of Friction Pairs

The friction pairs in the 2-B1, 2-B2, and 2-B3 groups were scanned by an electron microscope, as shown in Figure 9. Figure 9a shows that most of the surfaces of the 2-B1 group were lightly worn, but the wear in the areas corresponding to the sharp corners of the texture was more severe. This was because a large amount of wear debris was generated and gathered at the tips by the triangle geometry during the operation of the friction pair, while the rotation of the ring caused the wear debris stored in the tips to spread, thereby causing abrasive wear. Figure 9b shows that the surface wear of the 2-B2 group was more severe. The cutting edge of the elliptical texture was shorter along the direction of rotation and was prone to stress concentration, which caused damage to the surface structure and resulted in large flaking. Figure 9c shows that the surface wear of the 2-B3 group was mainly in the form of adhesive wear. Large furrows appeared on the surface material of the matrix. Due to the geometric characteristics of the spiral, the wear debris generated by the friction pair was transported from the outer diameter to the inner diameter and moved in the circumferential direction along the direction of rotation. Therefore, the wear debris was evenly distributed on the surface of the friction pairs during this process, and it did not tend to produce significant abrasive wear. Meanwhile, the evenly distributed wear debris of graphite had a certain lubricating effect. In this case, the graphite on the surfaces of the graphite rings in these three groups that was welded with silicon carbide detached from the matrix to form wear debris. The rest was in a semi-detached state. In summary, the wear of M120D was mainly composed of three processes: (1) The texture edge has a cutting effect on the surface of M120D; (2) Adhesive wear occurred on the untextured part of the surface of the friction pairs; (3) The secondary wear was caused by the debris inside the texture.

4.3. Performance of Friction Pairs in Bi-Composite Surface Texture Configurations

4.3.1. Friction Coefficient

Figure 10 shows the friction coefficient of the 3-C1, 3-C2, and 3-C3 groups with the test running time. The friction coefficient ranges of 3-C1, 3-C2, and 3-C3 are 0.094–0.147, 0.095–0.174, and 0.023–0.088, respectively. Moreover, the average friction coefficient of 3-C1, 3-C2, and 3-C3 is 0.123, 0.129 and 0.052, respectively. Meanwhile, the comparison of the tribological performance of three groups is listed in Table 7 under 250 rpm and 200 N. The average friction coefficient of the 3-C1, 3-C2, and 3-C3 groups were 0.123, 0.129, and 0.052, respectively. Based on the average friction coefficient of these three groups, the friction coefficient of 3-C3 was 59.69% lower than that of 3-C2. The tribological performance of the 3-C3 group was better than those of the 3-C2 and 3-C1 groups. What’s more, the comparison of the average friction coefficient of the 3-C3 group with those of the 2-B1, 2-B2, and 2-B3 groups indicated that when a sealing ring of SSiC with a triangular texture and another sealing ring of SSiC with conventional spiral grooves formed a friction pair, it results in a decrease of 12.90%, 59.69%, and 35.80% compared with those of the 2-B1, 2-B2, and 2-B3 groups, respectively. Unexpectedly, the average friction of the 3-C3 group (0.052) was much smaller than that of the 1-A1 group (0.071), which indicates that the friction coefficient of the 3-C3 group was the smallest of all the test subjects. However, the friction coefficient of the 3-C2 group was extremely unsatisfactory, which may indicate that the tribological performances could not be improved by the elliptical–triangular micro-dimple texture on the SSiC–SSiC pairing. Therefore, a ‘synergistic effect’ was exhibited by the conventional spiral and triangular grooves on the surface of the friction pairs.

4.3.2. Surface Temperature of Friction Pairs

Figure 11 shows the temperature trends of the friction pairs in the 3-C1, 3-C2, and 3-C3 groups. The ranges of surface temperature of friction pairs of 3-C1, 3-C2 and 3-C3 are 24.8–34.7, 23.7–34.8, and 24.1–28 °C, respectively. The temperature rises of 3-C1, 3-C2, and 3-C3 were 9.9, 11.1, and 3.8 °C, respectively, which indicates that the bi-composite surface texture configurations of 3-C3 played a positive role in reducing the surface temperature rise of the friction pairs. The bi-composite surface texture configurations were formed by the combination of the triangular and conventional spiral grooves, resulting in a ‘synergistic effect’ from the micro-grooves and micro-dimples, and with the high thermal conductivity and low expansion characteristics of the SSiC material, the temperature rise of the 3-C3 group was the smallest.

5. Conclusions

This paper mainly studied the tribological performance of low-speed mechanical seals. It involved looking at three aspects, which were friction pairs with different materials, single texture, and bi-composite surface texture configurations in the surface of the friction pairs. The following conclusions were obtained.
(1)
The 3-C3 group has the smallest friction coefficient and lowest temperature rise of all the test subjects.
(2)
For single texture patterns, such as micro-groove or micro-dimple, the tribological performance was affected by the shape of the texture, which was confirmed by the wear process of M120D.
(3)
A ‘synergistic effect’ was exhibited by the conventional spiral grooves and triangular grooves on the surface of the friction pairs.
The tribological performance could be improved by implementing a micro-structure of triangular and spiral grooves for a mechanical seal under low speed.
In the future, the internal relationship between wear, failure, and life will be explored to provide theoretical support for the reliability and life prediction of low-speed mechanical seals.

Author Contributions

Conceptualization, J.L., T.W. and X.D.; methodology, J.L. and T.W.; software, J.L. and T.W.; validation, J.L., T.W., and X.D.; investigation, H.S. and H.L.; writing—original draft preparation, J.L. and T.W.; writing—review and editing, H.S. and H.L.; project administration and funding acquisition, J.L. All authors have read and agreed to the published version of the manuscript.

Funding

The work presented in this paper was supported by the National Natural Science Foundation of China under Award No. 51905480, the Science and Technology Innovation 2025 Major Projects, China under Award No. 2020Z112 and 2018B10006, and Ningbo Natural Science Foundation under Award No. 2019A610161.

Institutional Review Board Statement

Not applicable.

Informed Consent Statement

Not applicable.

Data Availability Statement

The data presented in this study are available on request from the corresponding author. The data are not publicly available due to parts of the research results are being applied for new projects.

Conflicts of Interest

The authors declare no conflict of interest.

References

  1. Shankar, S.; Praveenkumar, G.; Kumar, P.K. Experimental study on frictional characteristics of tungsten carbide versus carbon as mechanical seals under dry and eco-friendly lubrications. Int. J. Refract. Met. Hard Mater. 2016, 54, 39–45. [Google Scholar] [CrossRef]
  2. Sinou, J.J.; Cayer-Barrioz, J.; Berro, H. Friction-induced vibration of a lubricated mechanical system. Tribol. Int. 2013, 61, 156–168. [Google Scholar] [CrossRef] [Green Version]
  3. Kanda, K.; Sato, H.; Miyakoshi, T.; Kitano, T.; Kanebako, H.; Adachi, K. Friction control of mechanical seals in a ventricular assist device. Biosurf. Biotribol. 2015, 1, 135–143. [Google Scholar] [CrossRef] [Green Version]
  4. Tomioka, J.; Miyanaga, N. Effect of surface roughness of mechanical seals for rotary blood pumps under blood sealing. J. Adv. Mech. Des. Syst. Manuf. 2014, 8, 1–9. [Google Scholar] [CrossRef] [Green Version]
  5. Tomioka, J.; Miyanaga, N. Blood sealing properties of magnetic fluid seals. Tribol. Int. 2017, 113, 338–343. [Google Scholar] [CrossRef]
  6. Kovalchenko, A.M.; Elam, J.W.; Erdemir, A.; Carlisle, J.A.; Auciello, O.; Libera, J.A.; Pellin, M.J.; Gruen, D.M.; Hryn, J.N. Development of ultrananocrystalline diamond (UNCD) coatings for multipurpose mechanical pump seals. Wear 2011, 270, 325–331. [Google Scholar] [CrossRef]
  7. Yamakiri, H.; Sasaki, S.; Kurita, T.; Kasashima, N. Effects of laser surface texturing on friction behavior of silicon nitride under lubrication with water. Tribol. Int. 2011, 44, 579–584. [Google Scholar] [CrossRef]
  8. Shi, L.; Wang, X.; Su, X.; Huang, W.; Wang, X. Comparison of the load-carrying performance of mechanical gas seals textured with microgrooves and microdimples. J. Tribol. 2016, 138, 021701. [Google Scholar] [CrossRef]
  9. Kovalchenko, A.; Ajayi, O.; Erdemir, A.; Fenske, G.; Etsion, I. The effect of laser surface texturing on transitions in lubrication regimes during unidirectional sliding contact. Tribol. Int. 2005, 38, 219–225. [Google Scholar] [CrossRef]
  10. Wang, X.; Shi, L.; Huang, W.; Wang, X. A multi-objective optimization approach on the spiral grooves for gas mechanical seals. J. Tribol. 2018, 140, 041710–041711. [Google Scholar] [CrossRef]
  11. Bai, S.; Peng, X.; Li, Y.; Sheng, S. A hydrodynamic laser surface-textured gas mechanical face seal. Tribol. Lett. 2010, 38, 187–194. [Google Scholar] [CrossRef]
  12. Yu, X.Q.; Liu, Q.G.; Gao, H.Q.; Yu, J.H. Liquid film performance analysis of the mechanical seals with a laser-textured micro-pore face. Adv. Mater. Res. 2010, 139–141, 418–421. [Google Scholar] [CrossRef]
  13. Yu, X.Q.; Liu, Q.G.; Gao, H.Q.; Yu, J.H. Numerical analysis on sealing properties of mechanical seals with a laser-textured face. Appl. Mech. Mater. 2012, 189, 429–432. [Google Scholar]
  14. Zhang, G.; Zhao, Y.; Zhao, W.; Liang, M. Study on the friction and wear performance of the micro-surface textured face seal under the water-lubricated conditions. J. Braz. Soc. Mech. Sci. Eng. 2019, 41, 1–11. [Google Scholar] [CrossRef]
  15. Adjemout, M.; Brunetière, N.; Bouyerv, J. Friction and temperature reduction in a mechanical face seal by a surface texturing: Comparison between TEHD simulations and experiments. Tribol. Trans. 2018, 61, 1084–1093. [Google Scholar] [CrossRef]
  16. Hu, T.Q. Friction and wear performance research and forecast of graphite sealing materials in high temperature. Ph.D. Thesis, Northeastern University, Shenyang, China, 2012. (In Chinese). [Google Scholar]
  17. Adjemout, M.; Andrieux, A.; Bouyer, J.; Brunetière, N.; Marcos, G.; Czerwiec, T. Influence of the real dimple shape on the performance of a textured mechanical seal. Tribol. Int. 2017, 115, 409–416. [Google Scholar] [CrossRef]
  18. Wang, X.Y.; Li, S.Y.; Dai, Q.W.; Huang, W.; Wang, X.L. Research progress in coordinated optimization of lubrication and leakage for textured mechanical seal. Surf. Technol. 2019, 48, 1–8. (In Chinese) [Google Scholar]
  19. Ryk, G.; Etsion, I. Testing piston rings with partial laser surface texturing for friction reduction. Wear 2006, 261, 792–796. [Google Scholar] [CrossRef]
  20. Marchetto, D.; Rota, A.; Calabri, L.; Gazzadi, G.C.; Menozzi, C.; Valeri, S. AFM investigation of tribological properties of nano-patterned silicon surface. Wear 2008, 265, 577–582. [Google Scholar] [CrossRef]
  21. Walker, J.C.; Kamps, T.J.; Lam, J.W.; Mitchell-Smith, J.; Clare, A.T. Tribological behaviour of an electrochemical jet machined textured Al-Si automotive cylinder liner material. Wear 2017, 376–377, 1611–1621. [Google Scholar] [CrossRef]
  22. Qiu, Y.; Khonsari, M.M. Investigation of tribological behaviors of annular rings with spiral groove. Tribol. Int. 2011, 44, 1610–1619. [Google Scholar] [CrossRef]
  23. Zhang, Y.A. Analysis on influential factors of end face specific pressure in mechanical seal of water joint. Mod. Radar 2018, 40, 87–90. (In Chinese) [Google Scholar]
  24. Chang, J.; Zhao, K.J.; Zheng, C.R.; Hu, F.; Liu, W.K. Leakage malfunction analysis and processing of ground-based radar liquid rotary joint. Mach. Electron. 2018, 36, 33–36. (In Chinese) [Google Scholar]
Figure 1. Friction and wear testing apparatus and specimen structure.
Applsci 11 04738 g001
Figure 2. Morphologies of triangle (a), ellipse (b) and conventional spiral groove (c) texture patterns.
Applsci 11 04738 g002aApplsci 11 04738 g002b
Figure 3. Test process of friction pairs with different materials and different surface structures.
Applsci 11 04738 g003
Figure 4. Real-time friction coefficient of friction pairs with different materials under 100–300 rpm.
Applsci 11 04738 g004
Figure 5. Surface temperature of friction pairs with different materials under 100–300 rpm.
Applsci 11 04738 g005
Figure 6. Real-time friction coefficient of friction pairs with single texture patterns under 250 rpm.
Applsci 11 04738 g006
Figure 7. Surface temperature of friction pairs with single texture patterns under 250 rpm.
Applsci 11 04738 g007
Figure 8. Wear quantity of M120D with texture and non-texture.
Applsci 11 04738 g008
Figure 9. Surface morphologies of specimens with triangular texture (a), elliptical texture (b), and spiral groove texture (c) after testing.
Applsci 11 04738 g009
Figure 10. Real-time friction coefficient of friction pairs with bi-composite surface texture configurations under 250 rpm.
Applsci 11 04738 g010
Figure 11. Surface temperature of friction pairs with bi-composite surface texture configurations under 250 rpm.
Applsci 11 04738 g011
Table 1. Material properties of M120D and SSiC.
Material ParameterM120DSSiC
Elastic modulus (MPa)25410
Poisson ratio0.150.15
Density (kg/m3)1.8 × 1033.21
Thermal conductivity (W·m−1·K−1)96.3110
Hardness (MPa)302840
Roughness (μm)0.0260.02
Applsci 11 04738 i001 Applsci 11 04738 i002
Table 2. Geometry parameters of triangle, ellipse, and conventional spiral groove texture patterns.
Texture ParameterSpiral GrooveTriangleEllipse
Outer diameter (mm)343434
Root diameter (mm)25.4//
Inner diameter (mm)202020
Deflection angle (°)//±9
Spiral angle (°)30 /
Radial number135
Circumferential number155296
Side length (mm)/1/
Half of the long axis (mm)//0.25
Half of the short axis (mm)//0.125
Groove depth (mm)0.040.040.04
Applsci 11 04738 i003 Applsci 11 04738 i004 Applsci 11 04738 i005
Table 3. Operating parameters of mechanical seal.
Operation ParametersSymbolValue
Rotating speednr15–35 rpm
Cruising speednr32 rpm
Pressure of water intakepin0.8–1 MPa
Pressure of backwaterpout0.2–0.4 MPa
FlowQ66 m3/h
Medium pressurep0.3 MPa
Outer diameter of the seal facedo210 mm
Inner diameter of the seal facedi198 mm
Table 4. Test grouping scheme.
Group 1 Friction Pairs of Different Materials
NoFriction MaterialsLoad F (N)Speed nr (rpm)Time t (s)
1-A1M120D–SSiC200100–300480
1-A2SSiC–SSiC200100–300480
Group 2 Friction pairs of single surface texture patterns
NoTextureLoad F (N)Speed nr (rpm)Time t (s)
2-B1Triangle200250480
2-B2Ellipse200250480
2-B3Conventional spiral groove200250480
Group 3 Friction pairs of bi-composite surface texture configurations
NoTextureLoad F (N)Speed nr (rpm)Time t (s)
3-C1/200250480
3-C2Triangle–Ellipse200250480
3-C3Triangle–Conventional spiral groove200250480
Table 5. Data of friction coefficient and surface temperature of friction pairs for 1-A1 and 1-A2 groups.
Load200 N
Rotating Speed100 rpm150 rpm200 rpm250 rpm300 rmin
Friction CoefficientReal time1-A10.087–0.10.078–0.090.061–0.080.058–0.0790.056–0.063
1-A20.146–0.1970.129–0.1530.111–0.1540.094–0.1470.08–0.197
Average1-A10.0910.0850.0740.0710.061
1-A20.1730.1420.1260.1230.095
Surface TemperatureReal time1-A124–29 °C24.1–31.4 °C24–34 °C23.9–36.2 °C24.4–27.1 °C
1-A224.1–27.5 °C24.2–30.7 °C24.1–32.4 °C24.8–34.7 °C23.8–26.3 °C
Rise1-A15 °C7.3 °C10 °C12.3 °C2.7 °C
1-A23.4 °C6.5 °C8.3 °C9.9 °C2.5 °C
Table 6. Data of friction coefficient and surface temperature of friction pairs for 2-B1, 2-B2, and 2-B3 groups.
LoadRotating SpeedFriction Coefficient2-B12-B22-B3
200 N250 rpmReal time0.044–0.0820.107–0.1460.07–0.1
Average0.0600.1290.081
Surface temperature2-B12-B22-B3
Real time23.5–27.7 °C24.6–37 °C24.1–39.4 °C
Rise4.1 °C12.3 °C15.3 °C
Table 7. Comparison of tribological performance of three groups under 250 rpm and 200 N.
Friction PairsFriction CoefficientTemperature RiseWear Quantity
Rotational speed: 250 rpm, Load: 200 N, and Time: 480 s
1-A1 Applsci 11 04738 i0060.071 Applsci 11 04738 i007 26.76% (3-C3 V.S. 1-A1)12.3 °C3.1
1-A2 Applsci 11 04738 i0080.123 Applsci 11 04738 i007 57.72% (3-C3 V.S. 1-A2)9.9 °C/
2-B1 Applsci 11 04738 i0090.060 Applsci 11 04738 i007 12.90% (3-C3 V.S. 2-B1)4.1 °C1.6
2-B2 Applsci 11 04738 i0100.129 Applsci 11 04738 i00759.69% (3-C3 V.S. 2-B2)12.3 °C2.8
2-B3 Applsci 11 04738 i0110.081 Applsci 11 04738 i007 35.80% (3-C3 V.S. 2-B3)15.3 °C3.3
3-C1 Applsci 11 04738 i0120.123 Applsci 11 04738 i007 57.72% (3-C3 V.S. 3-C1)9.9 °C/
3-C2 Applsci 11 04738 i0130.129 Applsci 11 04738 i007 59.69% (3-C3 V.S. 3-C2)11.1 °C/
3-C3 Applsci 11 04738 i0140.052 3.8 °C/
Publisher’s Note: MDPI stays neutral with regard to jurisdictional claims in published maps and institutional affiliations.

