Article

Experimental and Numerical Model Investigations of Oxygen-Enriched Characteristics in Air-Conditioned Rooms

1
College of Biochemical Engineering, Beijing Union University, Beijing 100023, China
2
School of Energy and Environmental Engineering, University of Science and Technology Beijing, Beijing 100083, China
3
Department of Agricultural and Biological Engineering, University of Illinois at Urbana-Champaign, Urbana, IL 61801, USA
*
Author to whom correspondence should be addressed.
Appl. Sci. 2021, 11(11), 4733; https://doi.org/10.3390/app11114733
Submission received: 8 April 2021 / Revised: 12 May 2021 / Accepted: 19 May 2021 / Published: 21 May 2021

Abstract

:
People who live and work in air-conditioned rooms with micro-hypoxia are prone to sick building syndrome (SBS). Enriching oxygen into an air-conditioned room to increase the oxygen concentration can improve indoor air quality (IAQ) and reduce ventilation to save building energy consumption. In the present paper, the number and diameter of the oxygen supply vents, the oxygen supply flow rate, the oxygen supply method and the air flow organization form were comparatively studied using a numerical model. The results were compared with the experiments results in un-air-conditioned rooms, which showed that this model can give a favorable prediction. The results show that the maximum axial velocity decreases with the increase of the axial distance under air-conditioned conditions. The relationship between the oxygen-enriched area and the oxygen flow rate is obtained by fitting. The diameter of the oxygen supply pipe is 0.006 m, and when oxygen supply methods 1# and 4# are adopted, the oxygen-enriched area is F = 0.4 + 0.383 Q and F = 0.237 + 0.8 Q, respectively.

1. Introduction

With high-efficiency building energy-saving requirements and the improvement of the sealing performance of indoor spaces, the amount of fresh air in these spaces has continually decreased, and the building space has shown a closed trend. This leads to two IAQ problems: on the one hand, insufficient infiltration and inadequate natural ventilation can increase indoor pollutant concentration [1,2], and on the other hand, micro-hypoxia problems are more common in air-conditioned rooms. These two issues have led to a reduction in work efficiency and SBS. In recent years, the problem of indoor air pollutants in confined building spaces has become more prominent. Therefore, there have been more studies and applications on indoor air pollutants’ removal in confined building spaces [3,4,5,6,7,8,9,10,11,12,13]. However, the removal of air pollutants does not solve the problem of micro-hypoxia in indoor environments. Although the problem of a micro-hypoxia environment is more prominent compared with air pollutants, studies focusing on this issue are still rare. The problem of micro-hypoxia in confined building spaces is serious but easily overlooked. People who have lived and worked in a micro-hypoxia closed building space for a long time are prone to many physical problems, such as headaches, chest tightness, fatigue, irritability, insomnia, and skin allergies [14,15,16,17]. Liu Yingshu [18] pointed out that the use of oxygen generated by special oxygen equipment increases the oxygen concentration in closed buildings and is expected to provide a new way to improve indoor air quality.
Oxygen-enriched technology is widely used in various places, such as tunnel construction, mine operations, and underwater submarine environments [19,20,21,22,23,24,25,26], and has achieved certain results in scientific research and practical applications. However, research on micro-hypoxia in air-conditioned rooms, such as office buildings, shopping malls, and supermarkets, is seldom conducted. Yang Guoping et al. [27] carried out field measurements of the oxygen concentration inside a typical room in Beijing, and the test results showed that the O2 concentration inside a densely populated and closed room was generally low.
The oxygen supply vent is used to inject a certain concentration of oxygen into closed building spaces, and the oxygen flows out by a gas jet. For jet problems, there are usually three research methods. The first method is to obtain practical empirical relations through experimental data. Liu Zhenyi et al. [28] carried out a small-scale experimental study of CO2 pipeline leakage, obtaining the peak concentration curve of the monitoring point by power function fitting and determining the safety distance of the production site. Jin Wufeng et al. [29] studied a combustible refrigerant R32 indoor air-conditioner. The leakage diffusion characteristics were experimentally studied. Jianmin Fu et al. [30] proposed a method for calculating the stable pressure of small hole leakage by constructing a small hole leakage experimental system for a liquid phase pipeline, which effectively solved the pressure solution problem in the classic calculation formula. The second method is to theoretically analyze the Gaussian distribution of the cross-sectional velocity of the jet [31,32]. The third method is Computational Fluid Dynamics (CFD) numerical simulation. With the continuous development of computer technology, the CFD method has been adopted by more and more researchers. Qu Yanpeng et al. [33] used different turbulence models to study the flow characteristics of circular jets based on fluent and considered that the standard model could obtain reasonable results. Ke Daoyou et al. [34] studied the hydrogen leakage process based on CFD simulation, and the results accurately predicted that the diffusion and the law of motion is suitable for emergency treatment. Wang Jiansheng et al. [35] studied the heat transfer characteristics of impinging jets based on numerical simulation. Shiying Cai et al. [36] investigated rarefication effects on jet impingement loads at an inclined plate surface, with the jet firing from a planar or round nozzle. The simulation results were compared with recently developed jet impingement flow formulas at the collisionless flow limits. Intarat Naruemon et al. [37] employed an improved one-dimensional diesel spray model to analyze the potential of varying injection rate shapes to lower the pollutant emissions of diesel engines and find the optimized injection strategy.
The most effective way to improve the IAQ of traditional closed air-conditioned rooms is to introduce fresh air. But the energy used to process the fresh air during the air-conditioning process accounts for approximately 25% to 30% of the total building energy consumption, and 40% [38] for hotels and office buildings. Therefore, it is particularly important to study the alternative or supplementary schemes of closed air-conditioned room ventilation to improve IAQ in closed air-conditioned rooms. In order to effectively improve the micro-hypoxia environment to meet people’s physiological needs and improve work efficiency, local oxygen supply can be provided to closed air-conditioned rooms. This method achieves the dual effects of improving indoor air quality and reducing energy consumption by eliminating micro-hypoxia and reducing fresh air supply. Therefore, based on experiments and CFD numerical simulations, this paper studies the number of oxygen supply vents, the diameter of the oxygen supply vents, the oxygen supply flow rate, the oxygen supply method, and the different air flow organization forms on the oxygen enrichment of a closed air-conditioned room. This article has reference significance for establishing oxygen-enriched safety standards, increasing the amount of fresh air in air-conditioned rooms, and reducing air-conditioning energy consumption.

2. Experimental Investigation

A schematic view of the experimental system used in the present study is shown in Figure 1. The system consists of two parts. One is the oxygen generator system, which consisted of a pressure swing adsorption (PSA) unit, a zirconia sensor oxygen measurement system, a buffer tank, a control panel, a rotometer, and control valves. The other is the oxygen delivery system, consisting of a oxygen delivery port, 22 oxygen sensors, a data collector, and a computer.
All experiments were carried out in an artificial climate chamber; the dimensions were 6.8 m in length, 4 m in width, and 2.9 m in height. The PSA oxygen generator is a two-stage PSA oxygen system developed by our research group [39,40], and the obtained oxygen volume fraction is 99%. The zirconia sensor oxygen measurement system (ZO-101T) was used to measure the oxygen concentration produced by the PSA oxygen generator, with an accuracy of ±2.0% of full scale and a measuring range of 0.1~100%. The volumetric flow rate of the oxygen was controlled by the rotameter (DK800-6F), with a measuring range of 0~2 m3·h−1. The data collector (USB5936) was used to collect the oxygen concentration signal and record it in real time. The oxygen sensors (Figaro, KE-25) were used to measure oxygen concentration at different locations, with an accuracy of ±1% and a measuring range of 0~100%. The oxygen sensor was placed at a height of 1.5 m from the ground.

3. Modeling and Simulation

3.1. Physical Model

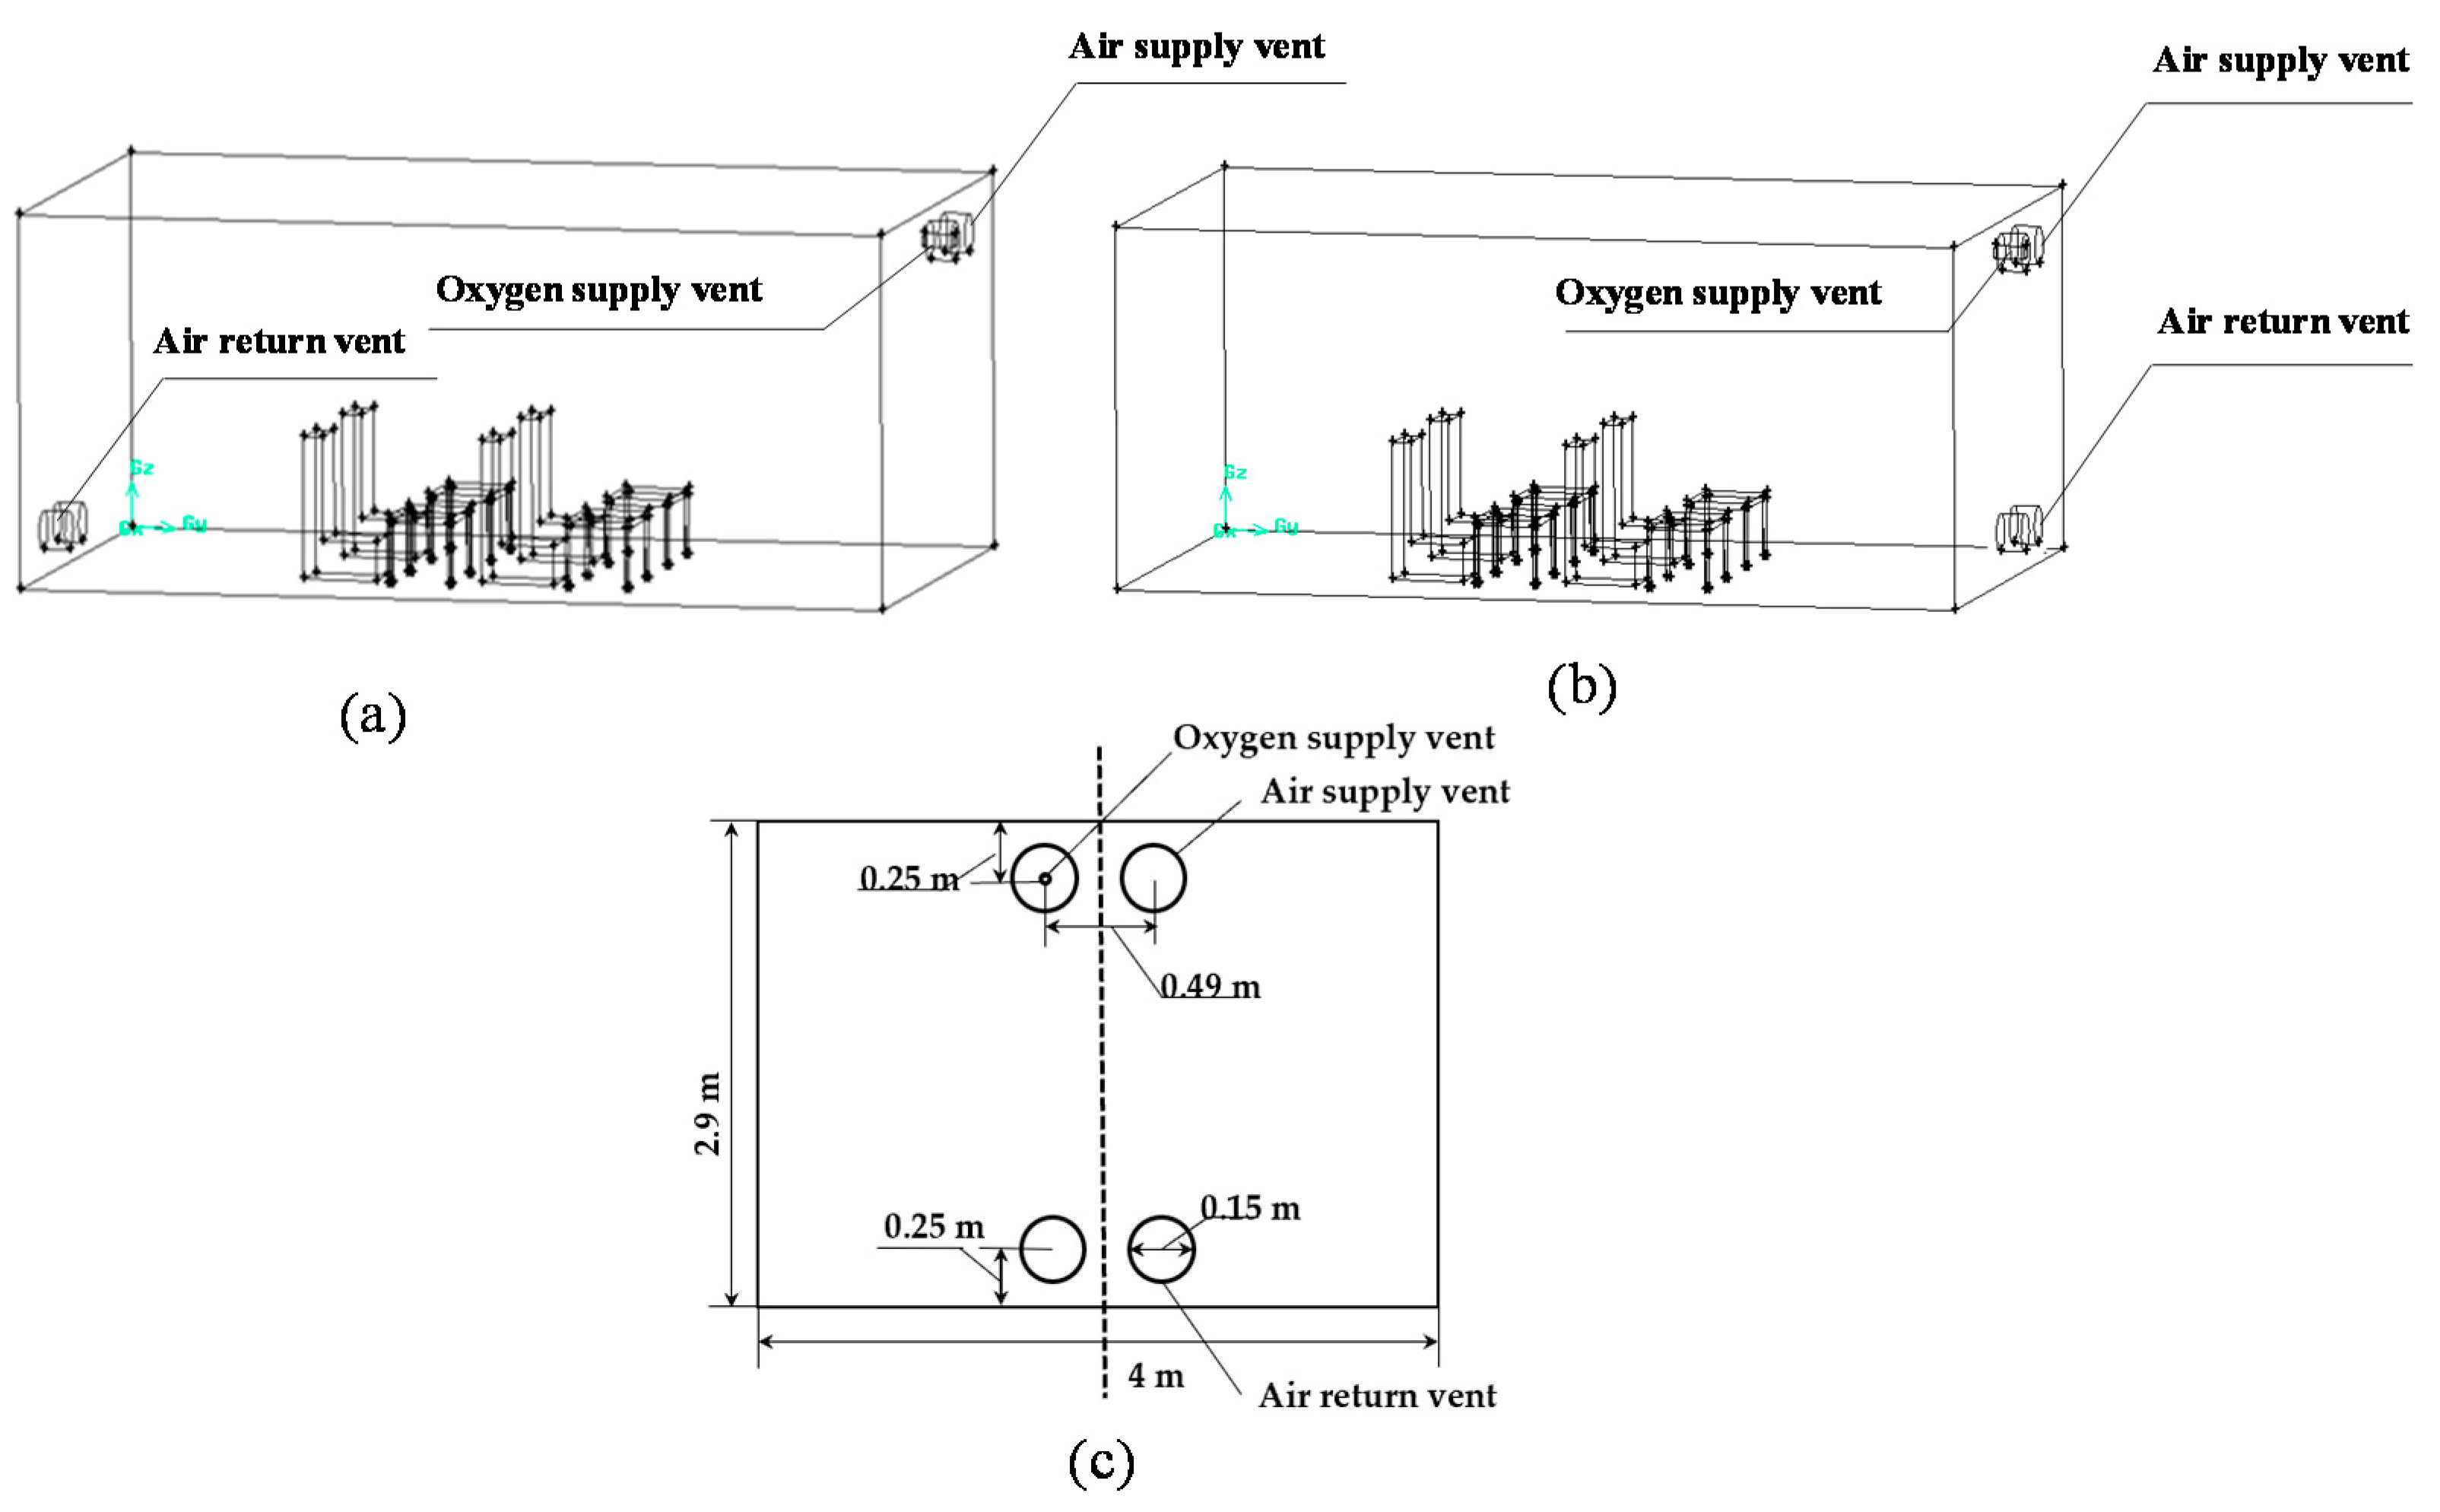
This article takes an artificial climate chamber as the research object and establishes a 3-D mathematical model; the specific physical model is shown in Figure 2. The model contains four seats and four tables, two air supply vents, two air return vents, and an oxygen supply vent. The x-axis is the length direction, the y-axis is the width direction, and the z-axis is the height direction. The oxygen supply under un-air-conditioned and air-conditioned conditions was studied separately. For the oxygen supply in an un-air-conditioned environment, we studied the different indoor air flow characteristics and oxygen-enriched effects, such as the number of oxygen supply vents, the diameter of the oxygen supply vents, the oxygen flow rate, and the oxygen supply method. For the oxygen supply under an air-conditioned environment, we studied the indoor air flow characteristics and oxygen-enriched area. The main structural parameters of the artificial climate chamber are shown in Table 1.

3.2. Mathematical Model

To simplify the model, according to Wang et al. [41], the following assumptions were made:
(1)
The oxygen supply vent sends out oxygen-enriched gas in the form of a jet, which is mainly a binary ideal gas mixture of O2 and N2, and the oxygen volume fraction is 99%.
(2)
The oxygen supply vent has a small diameter and limited diffusion effect in a closed room after being sent out as a jet; therefore, the free jet theory can be used to describe this flow accordingly.
(3)
The fluid is considered incompressible and steady, and the turbulence model uses a dual equation model [42].
The governing equation can be expressed as follows:
The continuity equation is expressed as
u i x i = 0
Momentum balance is expressed as
( ρ u i ) t + ( ρ u i u j ) x j = x j [ ( μ + μ t ) ( u i x j + u i x i ) ] p x i + S i
The component conservation equation is given by
c A t + ( u j c A ) x j = 1 ρ ( D A B + D T ) x j ( c A x j )
Stakic et al. [43] simulated the characteristics of a two-phase free jet formed at the exit of a long vertical tube and believed that the k ε model was in good agreement with the experimental results. Akbarzadeh et al. [44] used standard k ε and k w models to simulate the characteristics of the free jet formed by rectangular nozzles and believed that the standard k ε can effectively predict the jet characteristics. Qu Yanpeng et al. [33] used different turbulence models to study the flow characteristics of circular jets and believed that the standard k ε model could obtain more reasonable results. Therefore, the turbulence model in this paper uses the standard k ε model.
The k ε model takes the following form:
ρ k t + ρ ( k u i ) x i = x j [ ( μ t σ k + μ ) k x j ] + P k ρ ε
            ρ ε t + ρ ( ε u i ) x i = x j [ ( μ t σ ε + μ ) ε x j ] + C ε 1 ε k P k ρ C ε 2 ε 2 k
The model constants were determined experimentally and were assigned a standard value of C μ = 0.09 , σ k = 1.0 , σ ε = 1.3 , C ε 1 = 1.44 , C ε 2 = 1.92 [45].

3.3. Initial and Boundary Conditions

No penetration and non-slip conditions were imposed at all solid wall boundaries. The air supply vent was defined as the velocity supply (Vin). The air supply velocity was distributed evenly; Vin = Q M−1, where Q is the supply flow of the air supply vent and M is the cross-sectional area of the air supply vent. The input velocities of the air supply vents came from experimental measurements. The pressure of the outlet boundary was imposed at the air outlet vent (pressure outlet), 101,325 Pa. The supply air was assumed to be sent into the room with a constant air temperature of 298 K. Initial indoor air temperature was 294 K.
The oxygen supply vent sent oxygen out with an oxygen volume fraction of 99% and entered into the confined building spaces in the form of a jet. The diameters of the oxygen supply vents were 0.006 m and 0.01 m, respectively. The oxygen supply methods were carried out by a single oxygen supply vent and double oxygen supply vents, and the oxygen-enriched characteristics and effects in the confined building spaces under the un-air-conditioned and the air-conditioned were studied, respectively.
The single oxygen supply vent was located in the center of the air supply vent on the side wall and was 1.5 m above the ground; the single oxygen supply vent was vertical forward (represented by the symbol 1#) and the double oxygen supply vents were located in the center of the air supply vents on the side wall. The three oxygen supply methods were vertical forward (symbol 2#), relative 45° (symbol 3#), and opposite 45° (symbol 4#); the initial conditions of oxygen supply vents methods are shown in Table 2. Initial conditions of the oxygen supply parameters are shown in Table 3. The velocity of air flow in the air-conditioned environment is shown in Table 4.

3.4. Meshing and Method of Solution

The mathematical model described above was realized in CFD software Fluent using the control volume method.
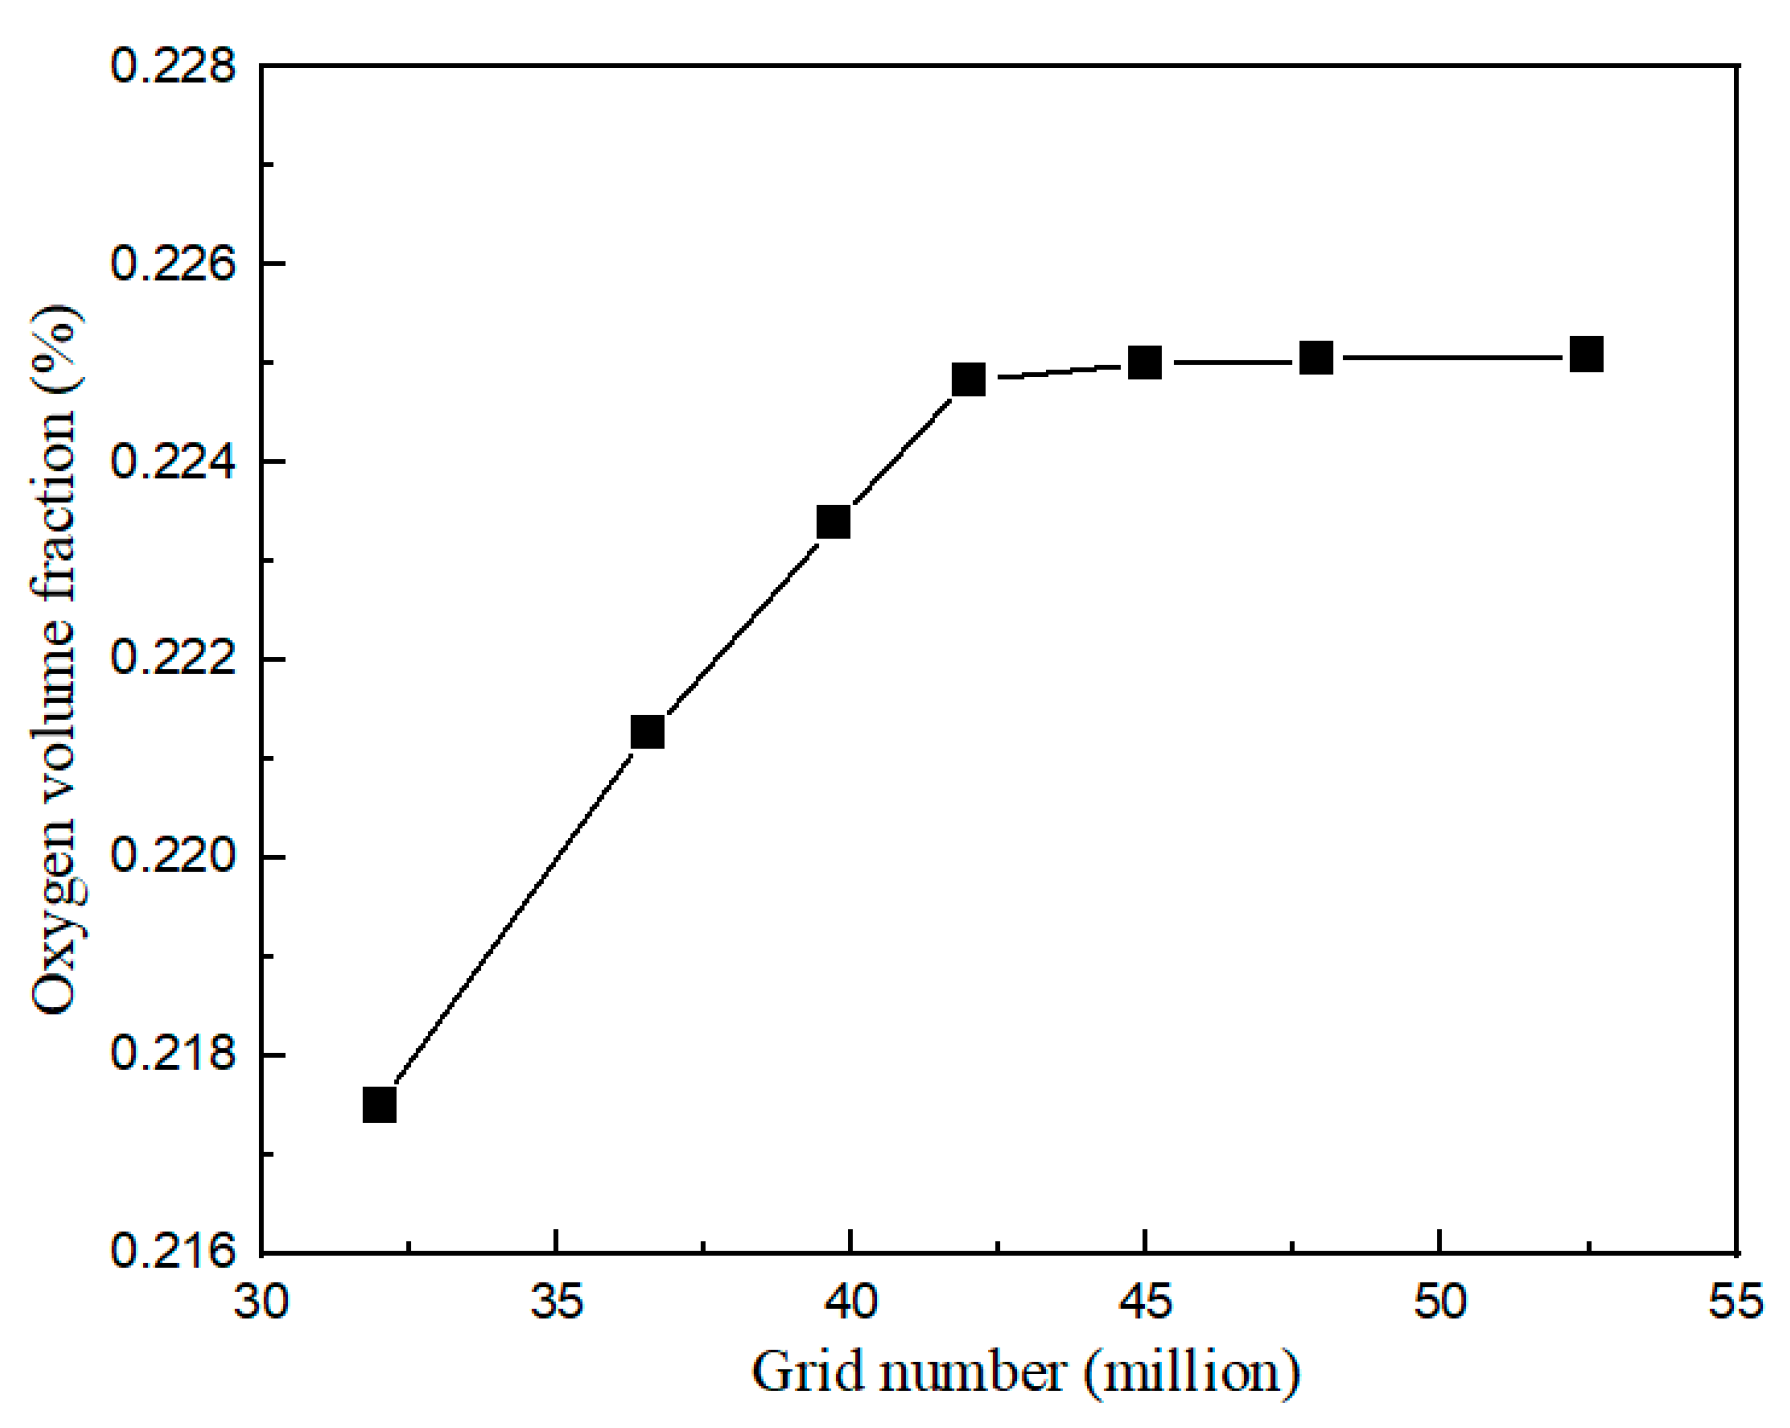
To obtain reasonable and accurate calculation results more efficiently with limited computing resources, this paper first uses three sets of grids for pre-calculation and unstructured grid division of the artificial climate chamber model. Due to the large difference between the geometric dimensions of the artificial climate chamber model and the oxygen supply port, local grid encryption is performed near the oxygen supply port. The pre-calculation sets the same boundary conditions and only differs in the number of grid cells. The verification result of grid independence is shown in Figure 3. The number of grids is changed from 42 million to 53 million and the change in axial velocity is very small, which satisfies the requirement of independence. Therefore, considering the accuracy and computational efficiency, selecting a model with a mesh number of 42 million can meet the requirements.
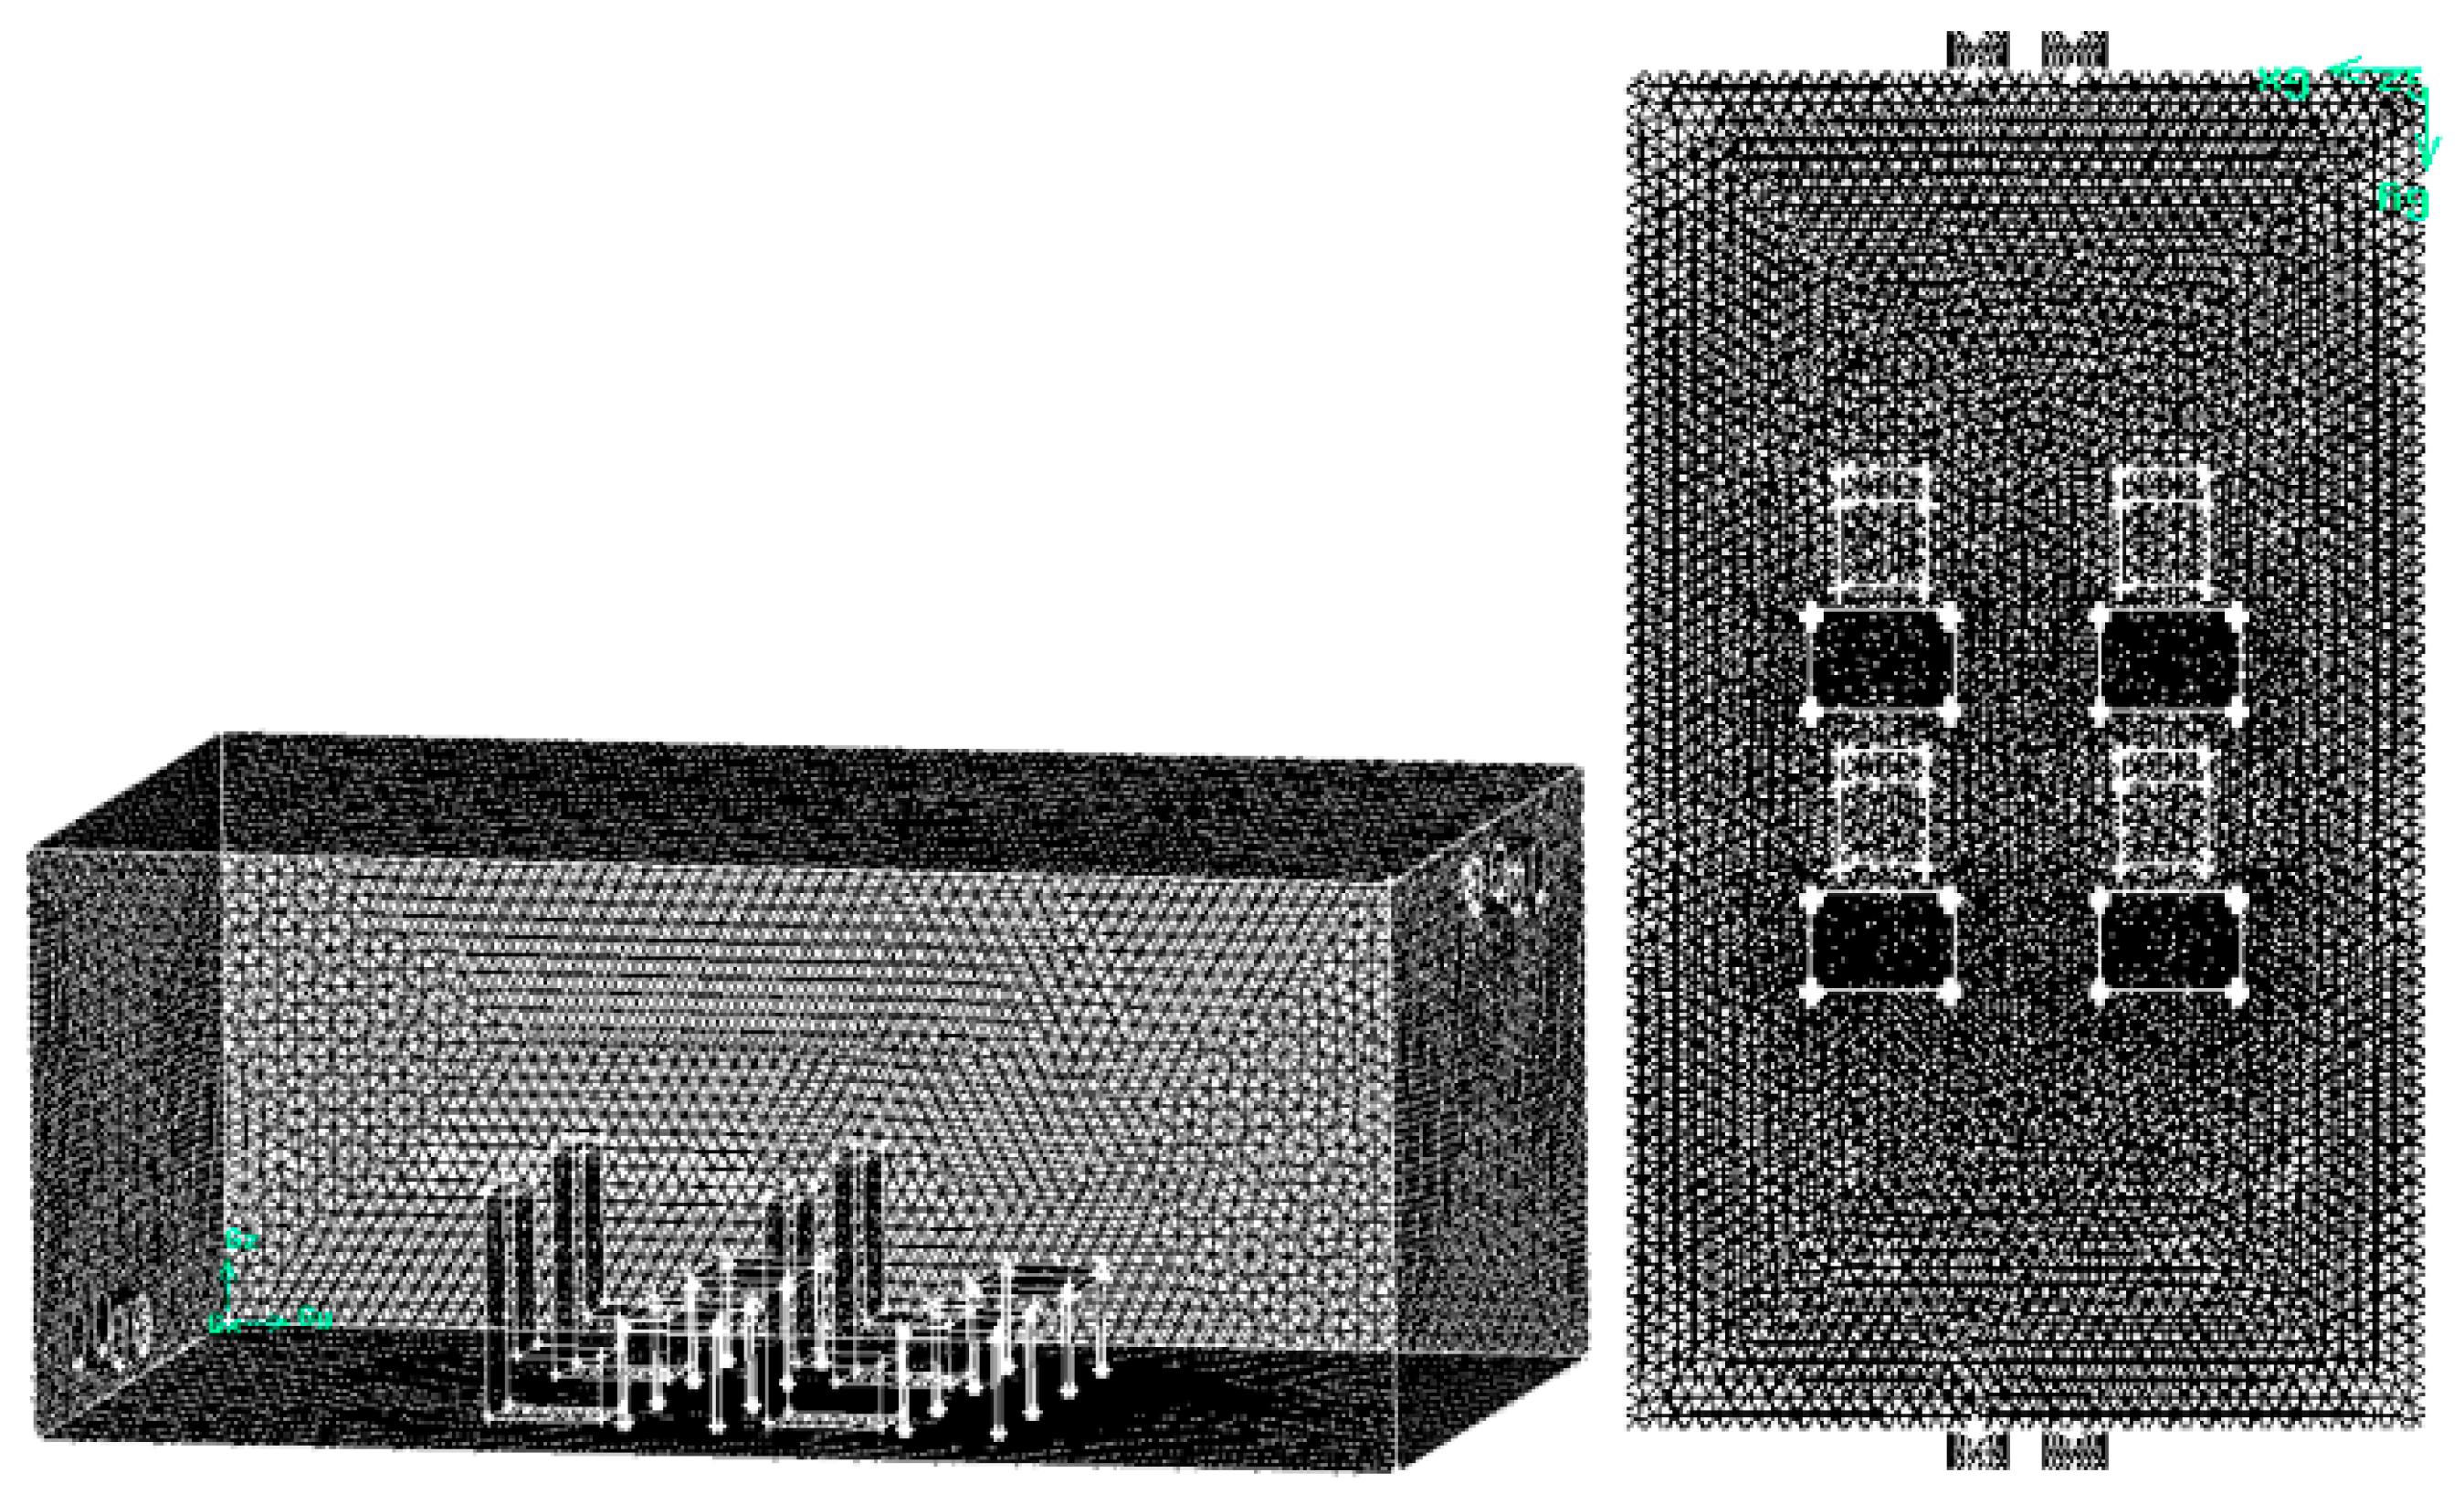
The computational grid of the model is shown in Figure 4. CFD simulations were performed using a double-precision unsteady-state implicit solver, with the coupled algorithm to solve the pressure-velocity coupling problem in the momentum equations. A SIMPLE discretization scheme was used for the pressure and velocity. To reduce numerical diffusion, a second-order upwind scheme was selected for the discretization of the momentum and energy equations. The solution was assumed to converge when the different residuals had reached sufficiently low steady values of 10−4. The time step was 0.01 s, and the overall calculation time was 1200 s.

4. Results and Discussion

4.1. Model Validation

Figure 5 shows the comparison between the simulated and the experimental values of the oxygen-enriched area in the un-air-conditioned environment. The cross-section of the oxygen-enriched area is placed at a height of 1.5 m, which is consistent with the position of the oxygen sensor in the experiment. The oxygen-enriched effect is achieved when the oxygen volume fraction predicted by the model is greater than 22%. Liu et al. [46] pointed out that the hypoxic environment formed by factors such as elevated altitude, closed places and environmental pollution affects people’s normal life and occupational safety, and the standard for supplying oxygen to the hypoxic environment is that the volume fraction of oxygen reaches about 22%. The simulation values of the oxygen-enriched area formed in the axial and radial directions are larger than the experimental values, regardless of the single oxygen supply vent or the double oxygen supply vents. This is because, during the experiment, there is low wind speed in the confined building room in addition to human interference. Thus, the diffusion effect of indoor oxygen is strengthened, and the loss of oxygen during the diffusion process is increased. It can also be seen that the axial and radial errors of the simulated and experimental values of the oxygen-enriched area are less than 0.25 m; the difference between the simulated value and the experimental value of the axial velocity is small. Therefore, the mathematical model can better predict the oxygen-enriched characteristics and effects in a confined building room.

4.2. Oxygen-Enriched Flow Characteristics and Oxygen-Enriched Area under Un-Air-Conditioned Conditions

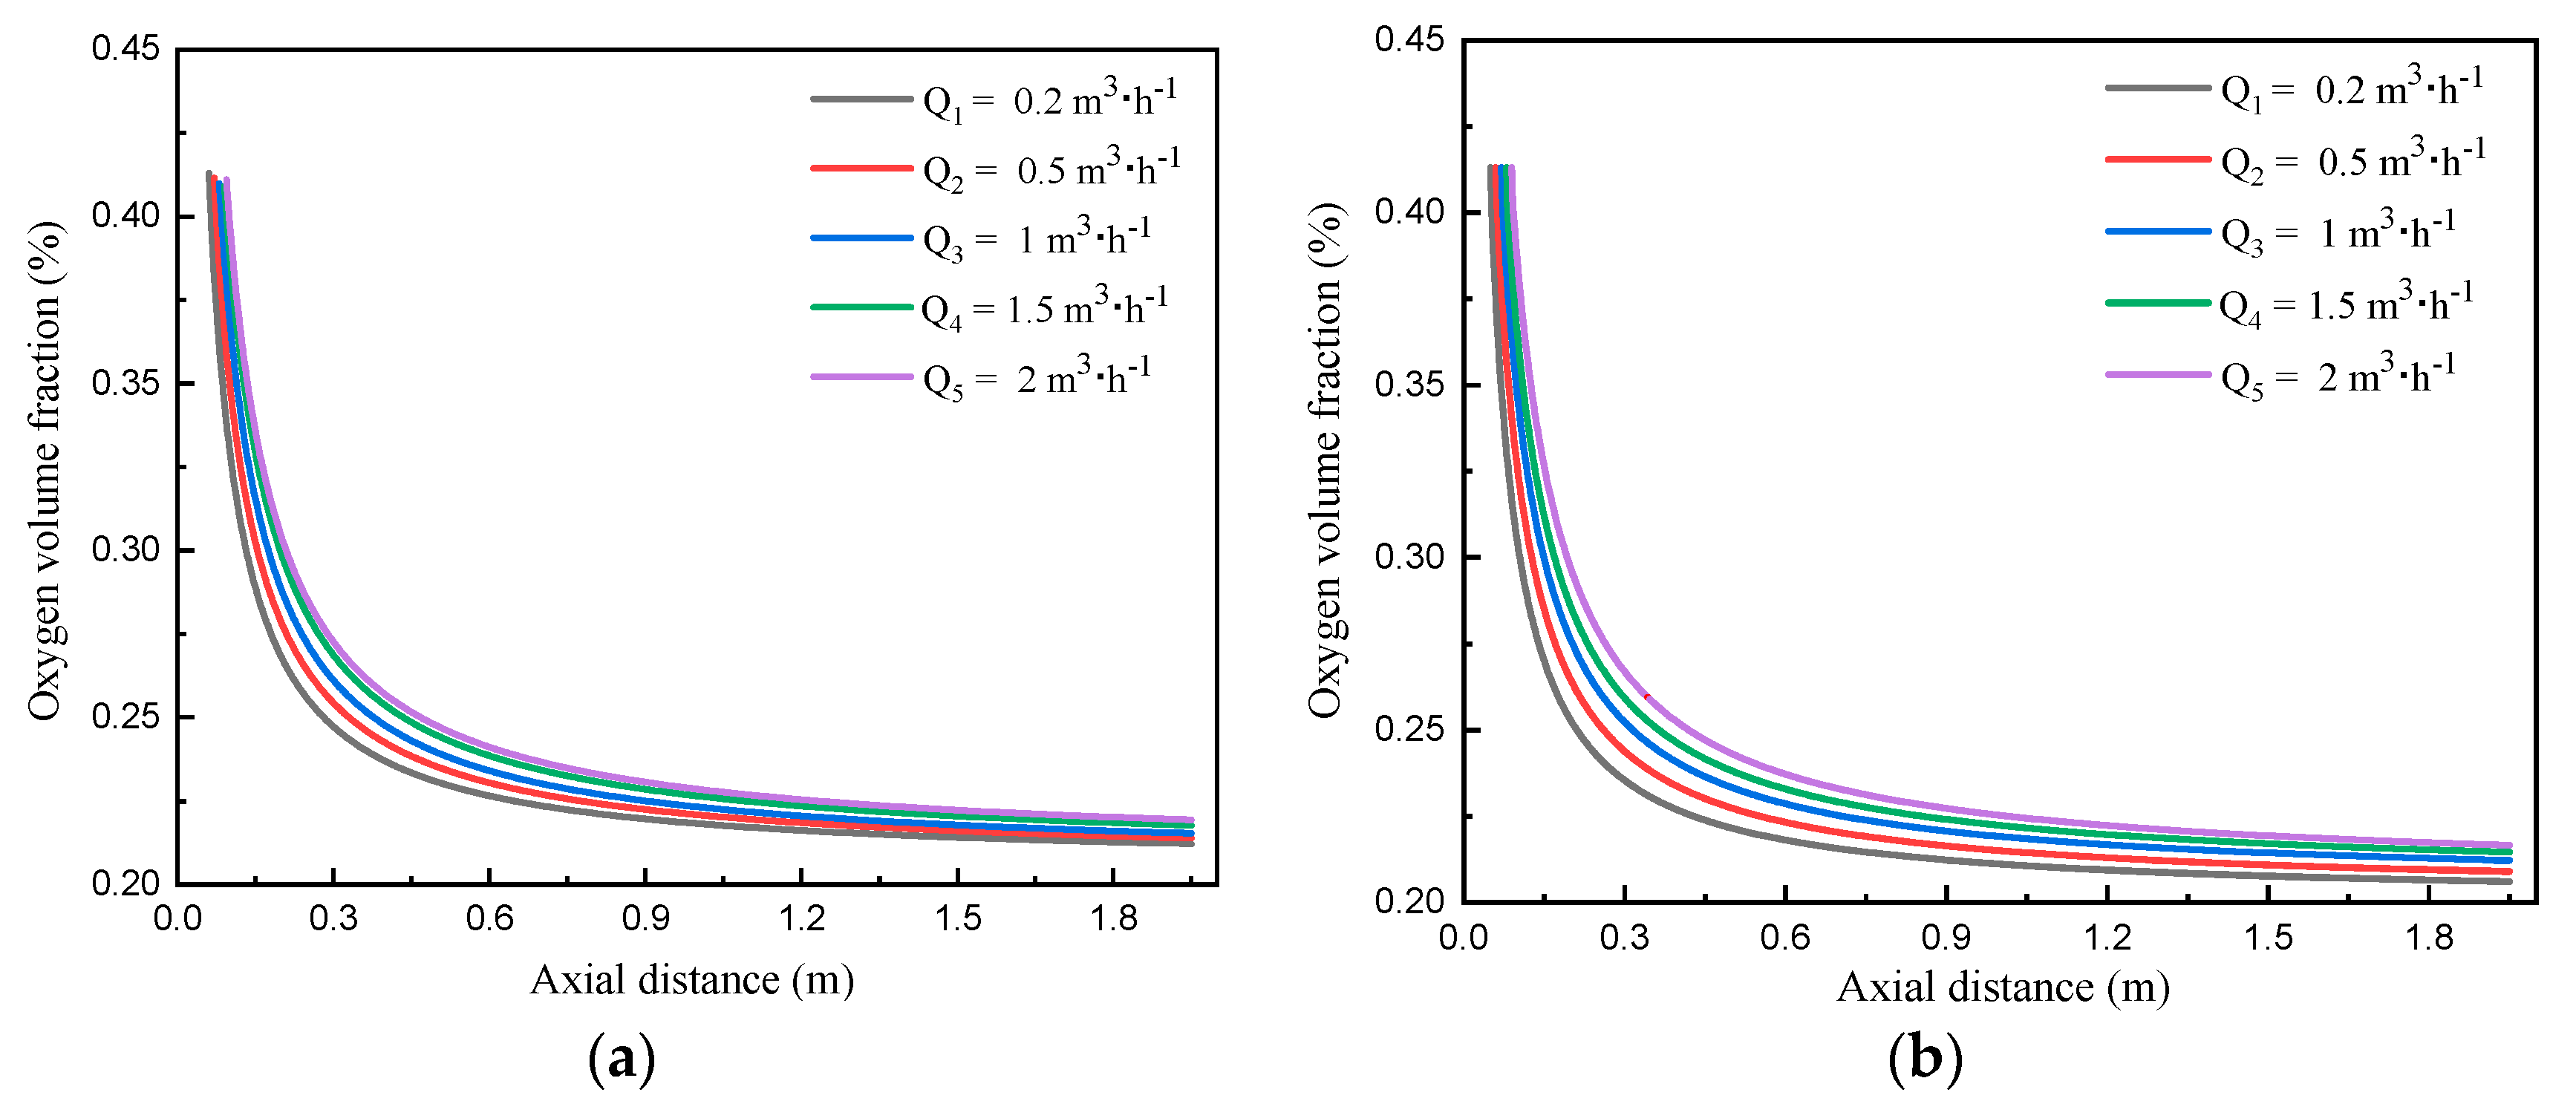
Figure 6 shows the maximum axial concentration distribution of oxygen with different oxygen supply flow rates in the single oxygen supply vent. When the axial distance gradually increases, the maximum axial oxygen concentration decreases; the axial concentration of oxygen decreases rapidly within a range of 0.55 m and then becomes close to the oxygen concentration in the environment. This is due to the convection diffusion process between pure oxygen and the surrounding air, with the difference in oxygen concentration as a driving force to mix oxygen quickly with indoor air.
Figure 7 shows the distribution of oxygen mass fraction at the end of each time with the single oxygen supply process at a position 1.5 m above the ground. With the increase of the oxygen supply time, the oxygen-enriched area gradually expands, and the oxygen-enriched effect becomes more obvious.
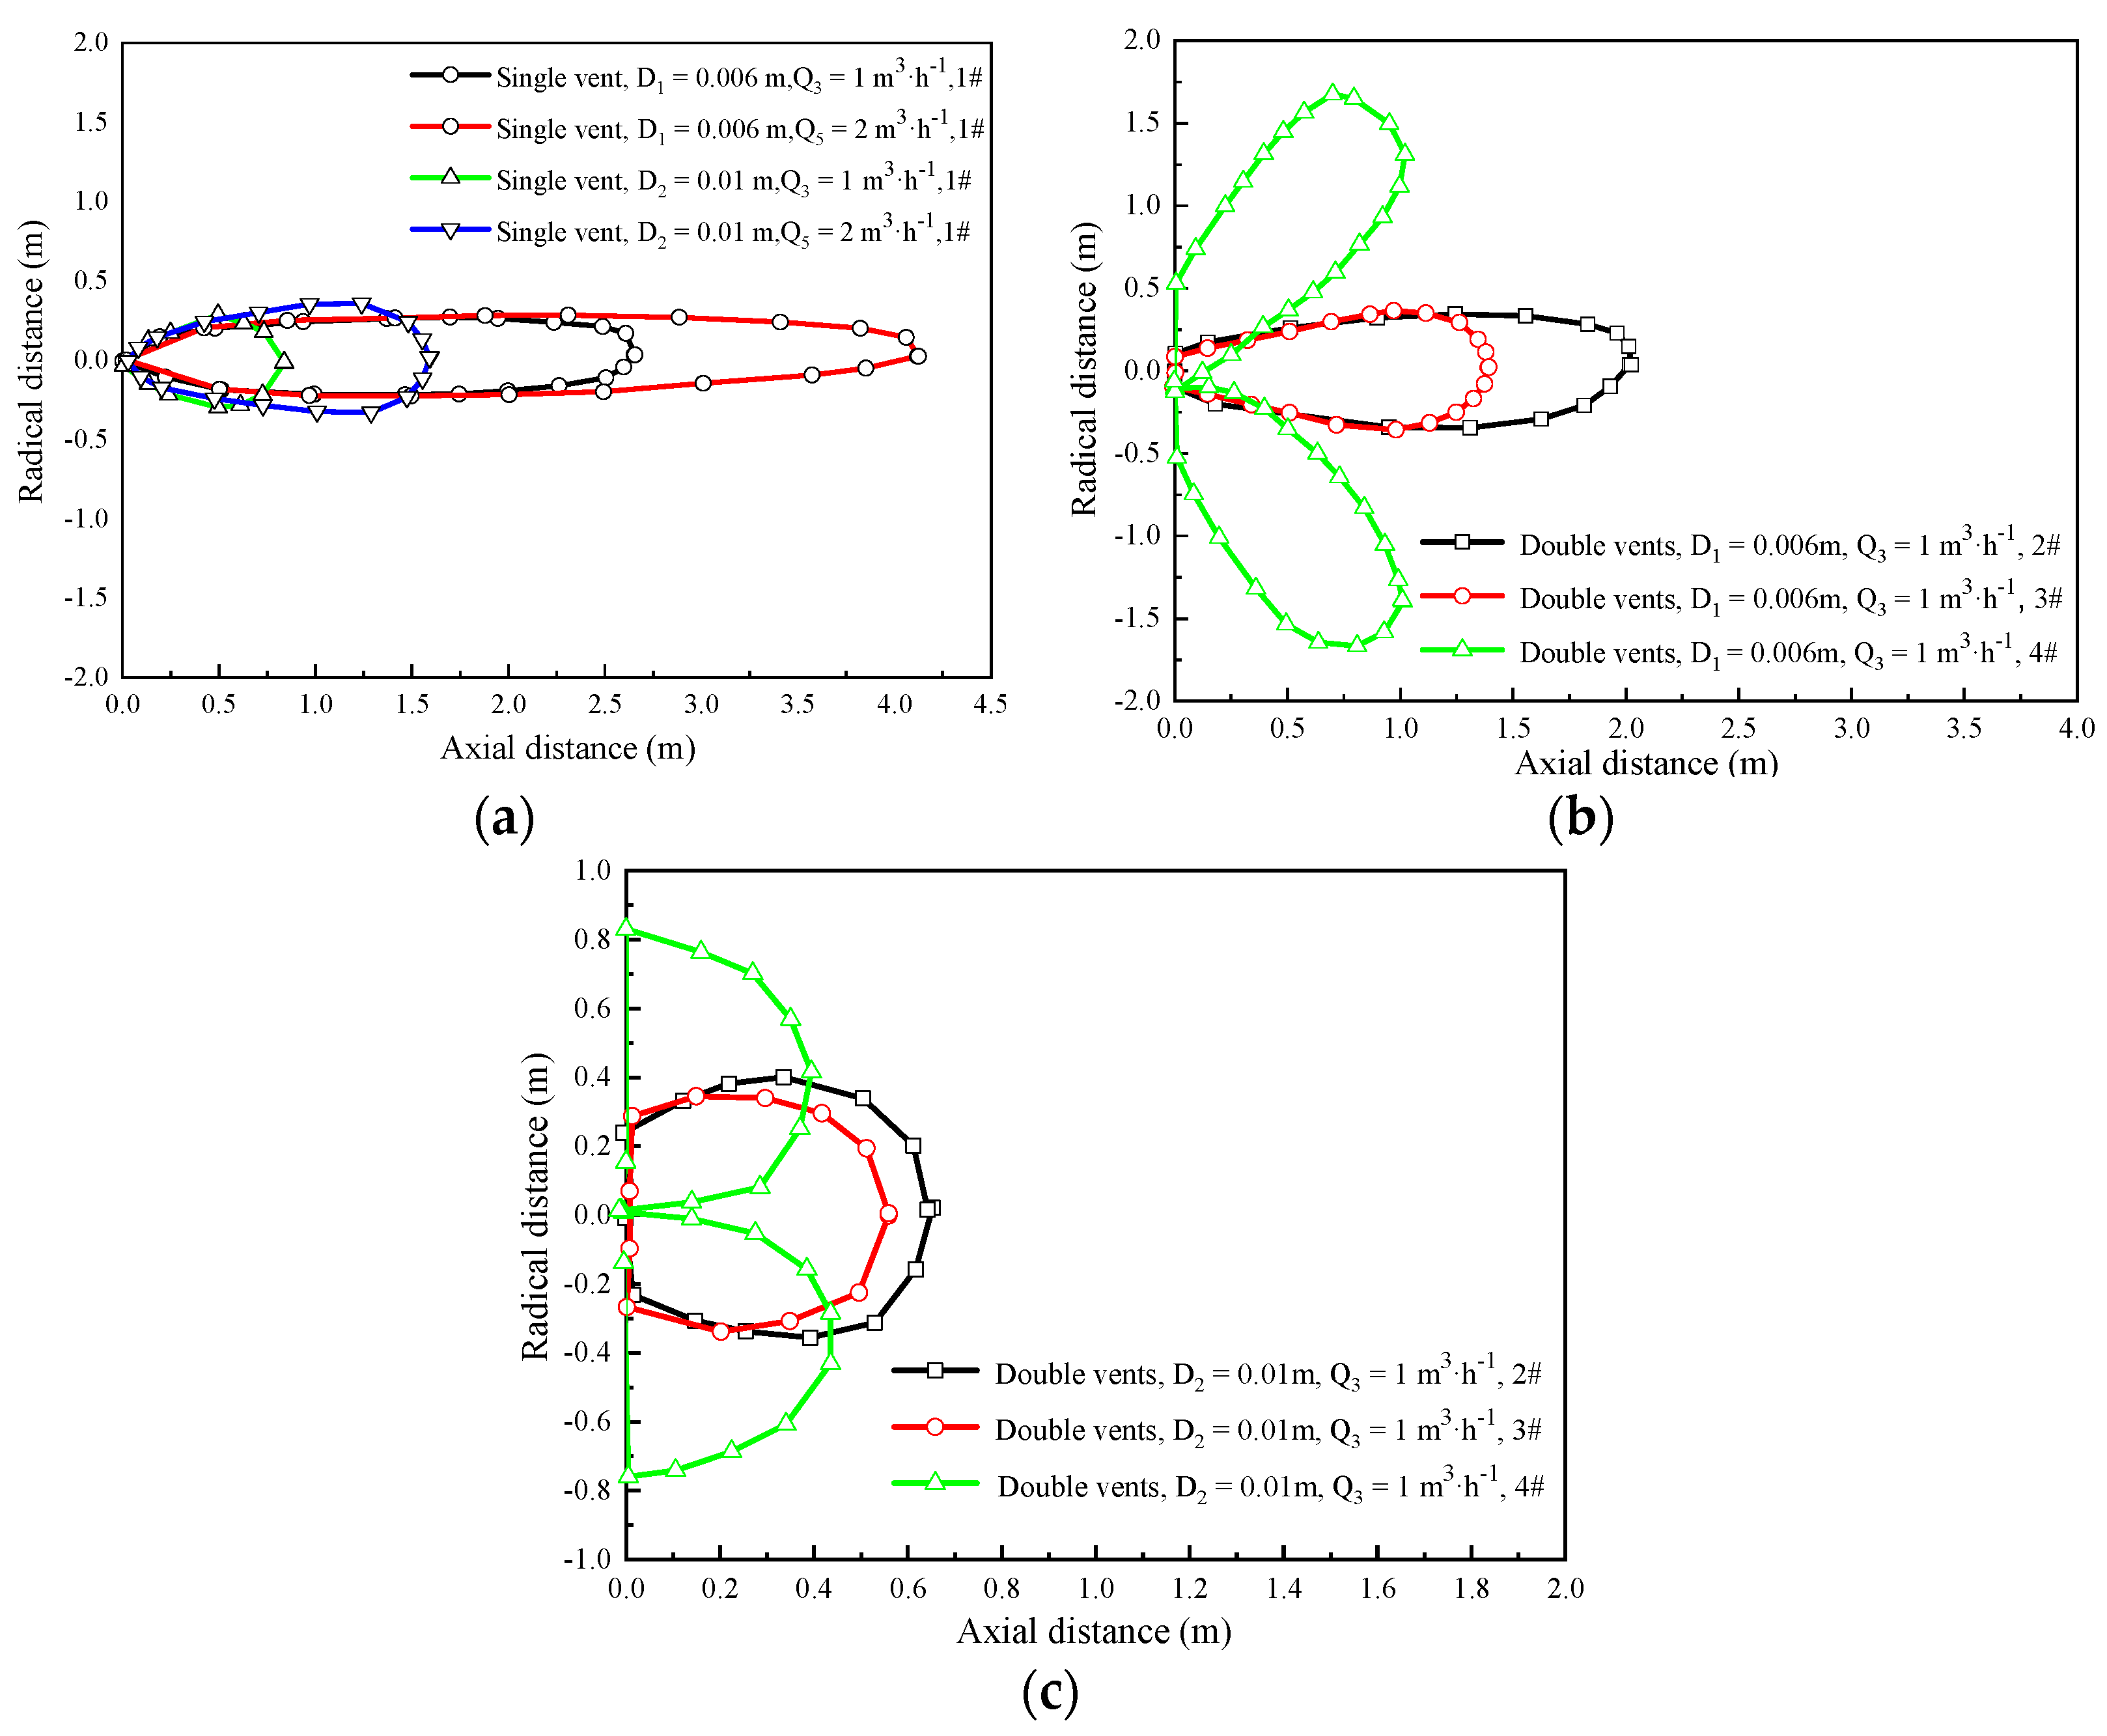
Figure 8 shows the oxygen-enriched area when the number of oxygen supply vents and the oxygen supply method are different under un-air-conditioned conditions at t = 120 s. With the different pipe diameters and different oxygen supply modes (in the form 1#, 2#, 3#, and 4#), the oxygen-enriched area varies widely. This is because when 3# is used for oxygen supply, after the oxygen is ejected from the oxygen supply vent at a certain outflow speed, the two gases meet, and the gas molecules directly collide with each other, making the flow velocity of the gas weaken. When the 4# is used for oxygen supply, the oxygen-enriched area formed by the double oxygen supply vents with a pipe diameter of 0.006 m roughly consists of two fan-shapes.
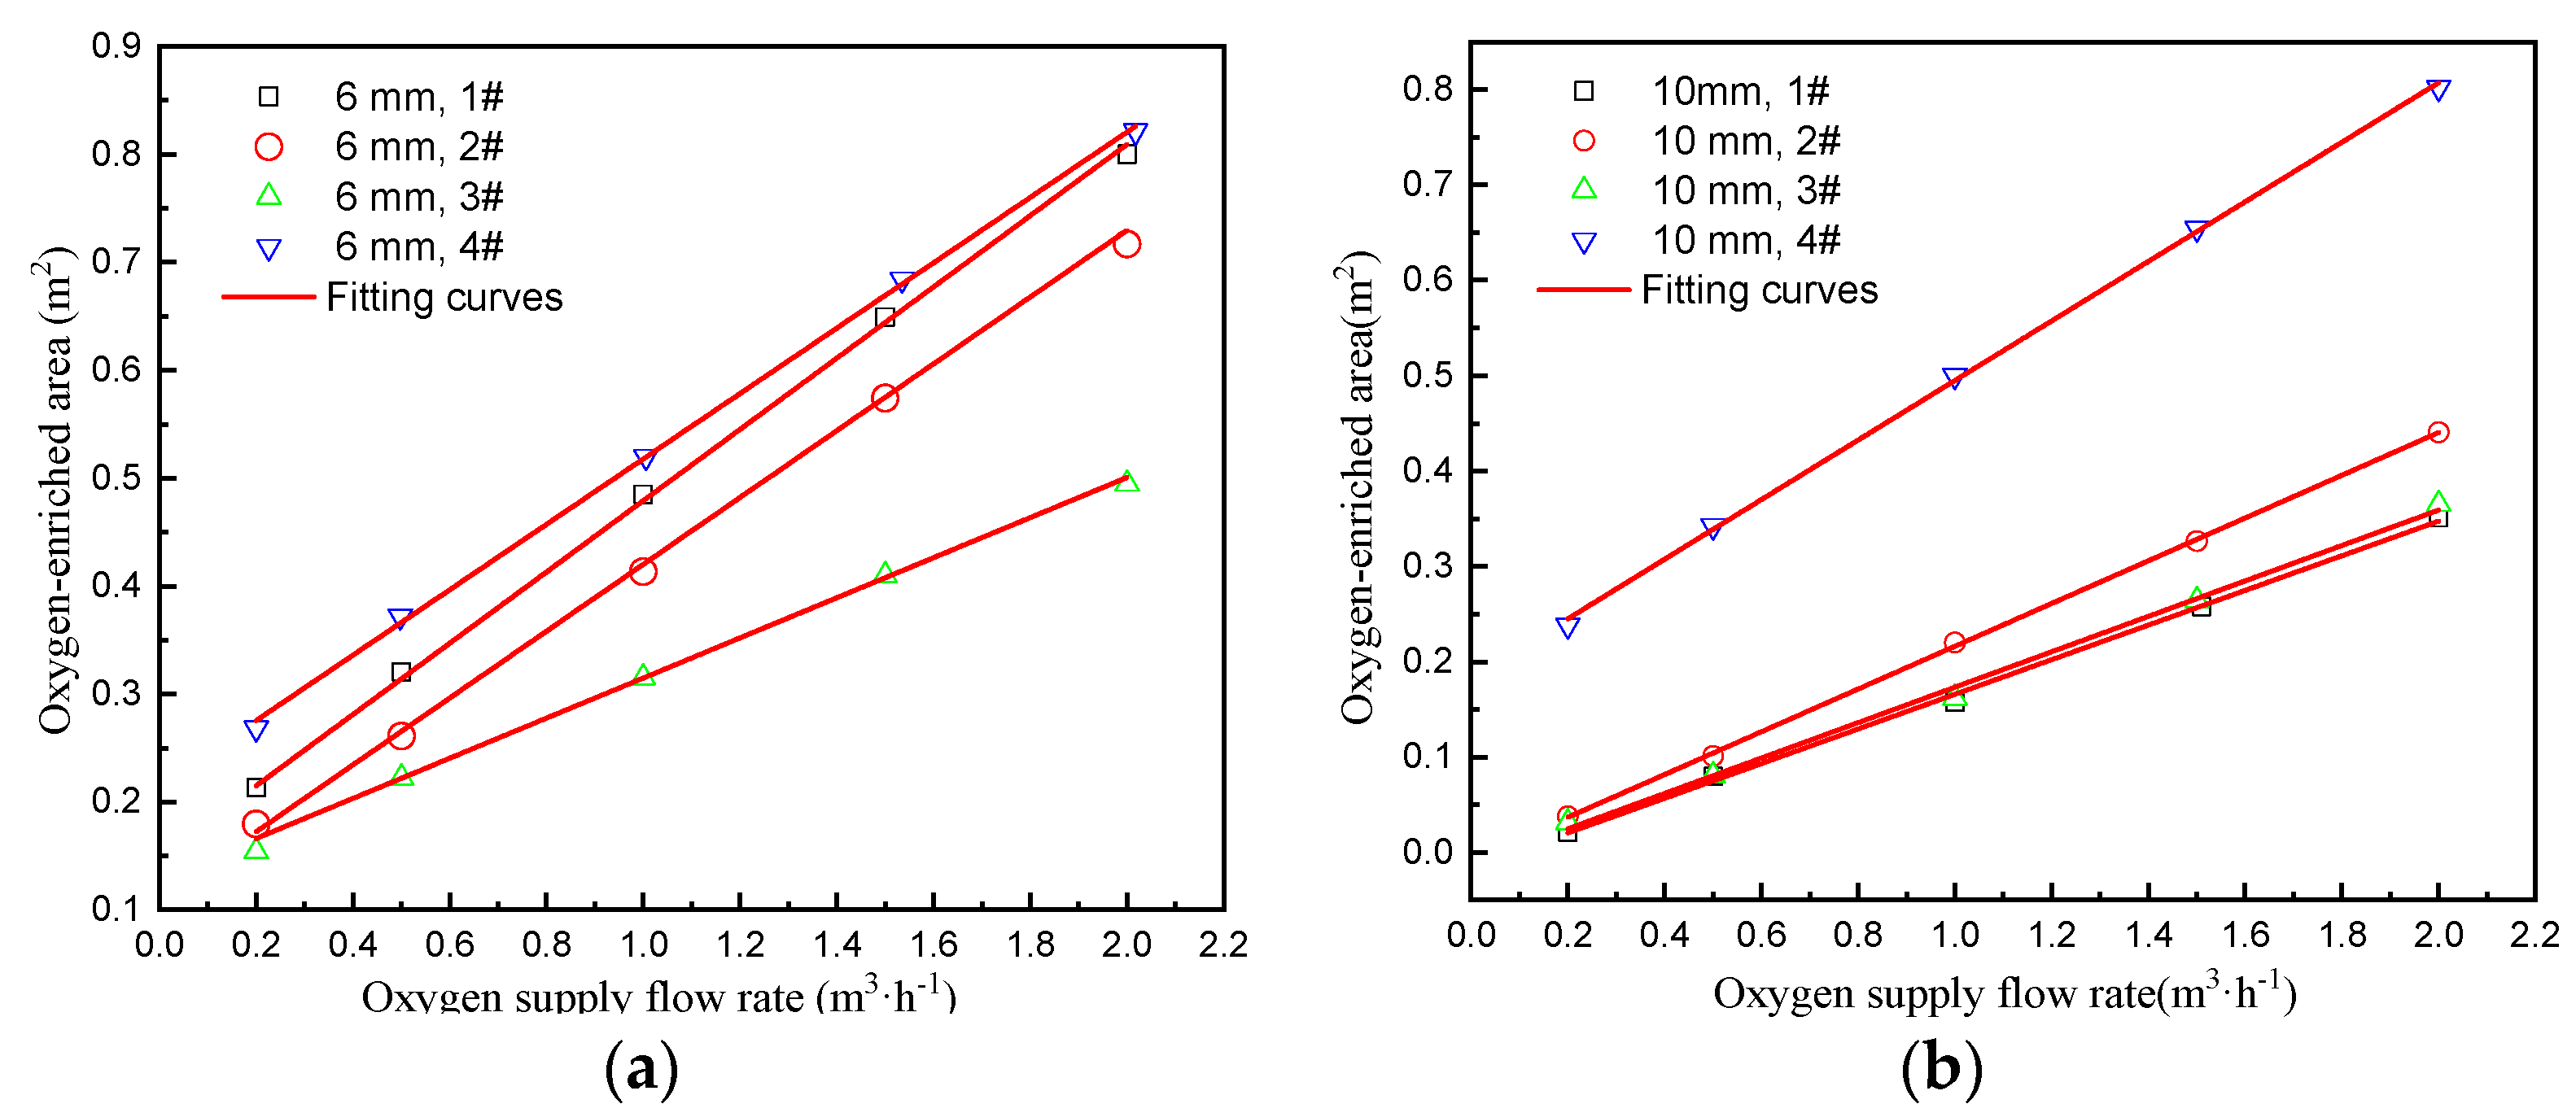
Figure 9 shows the calculation of the oxygen-enriched area under different oxygen pipe diameters and different oxygen supply methods. It can be seen from Figure 9 that as the oxygen flow rate increases, the corresponding oxygen-enriched area also increases. The relationship between the oxygen-enriched area and the oxygen flow rate obtained by fitting is a linear relationship, as shown in Table 5. The oxygen-enriched area with a pipe diameter of 0.006 m is larger than that formed by a diameter of 0.01 m with the same oxygen flow rate. Therefore, the research will mainly study the oxygen supply pipe diameter of 0.006 m. It also can be seen that because the oxygen-enriched area of 2# and 3# is relatively small, the oxygen-enrichment effect is poor, so it is no longer considered 2# and 3#.

4.3. Oxygen-Enriched Flow Characteristics and Oxygen-Enriched Area under Air-Conditioned State

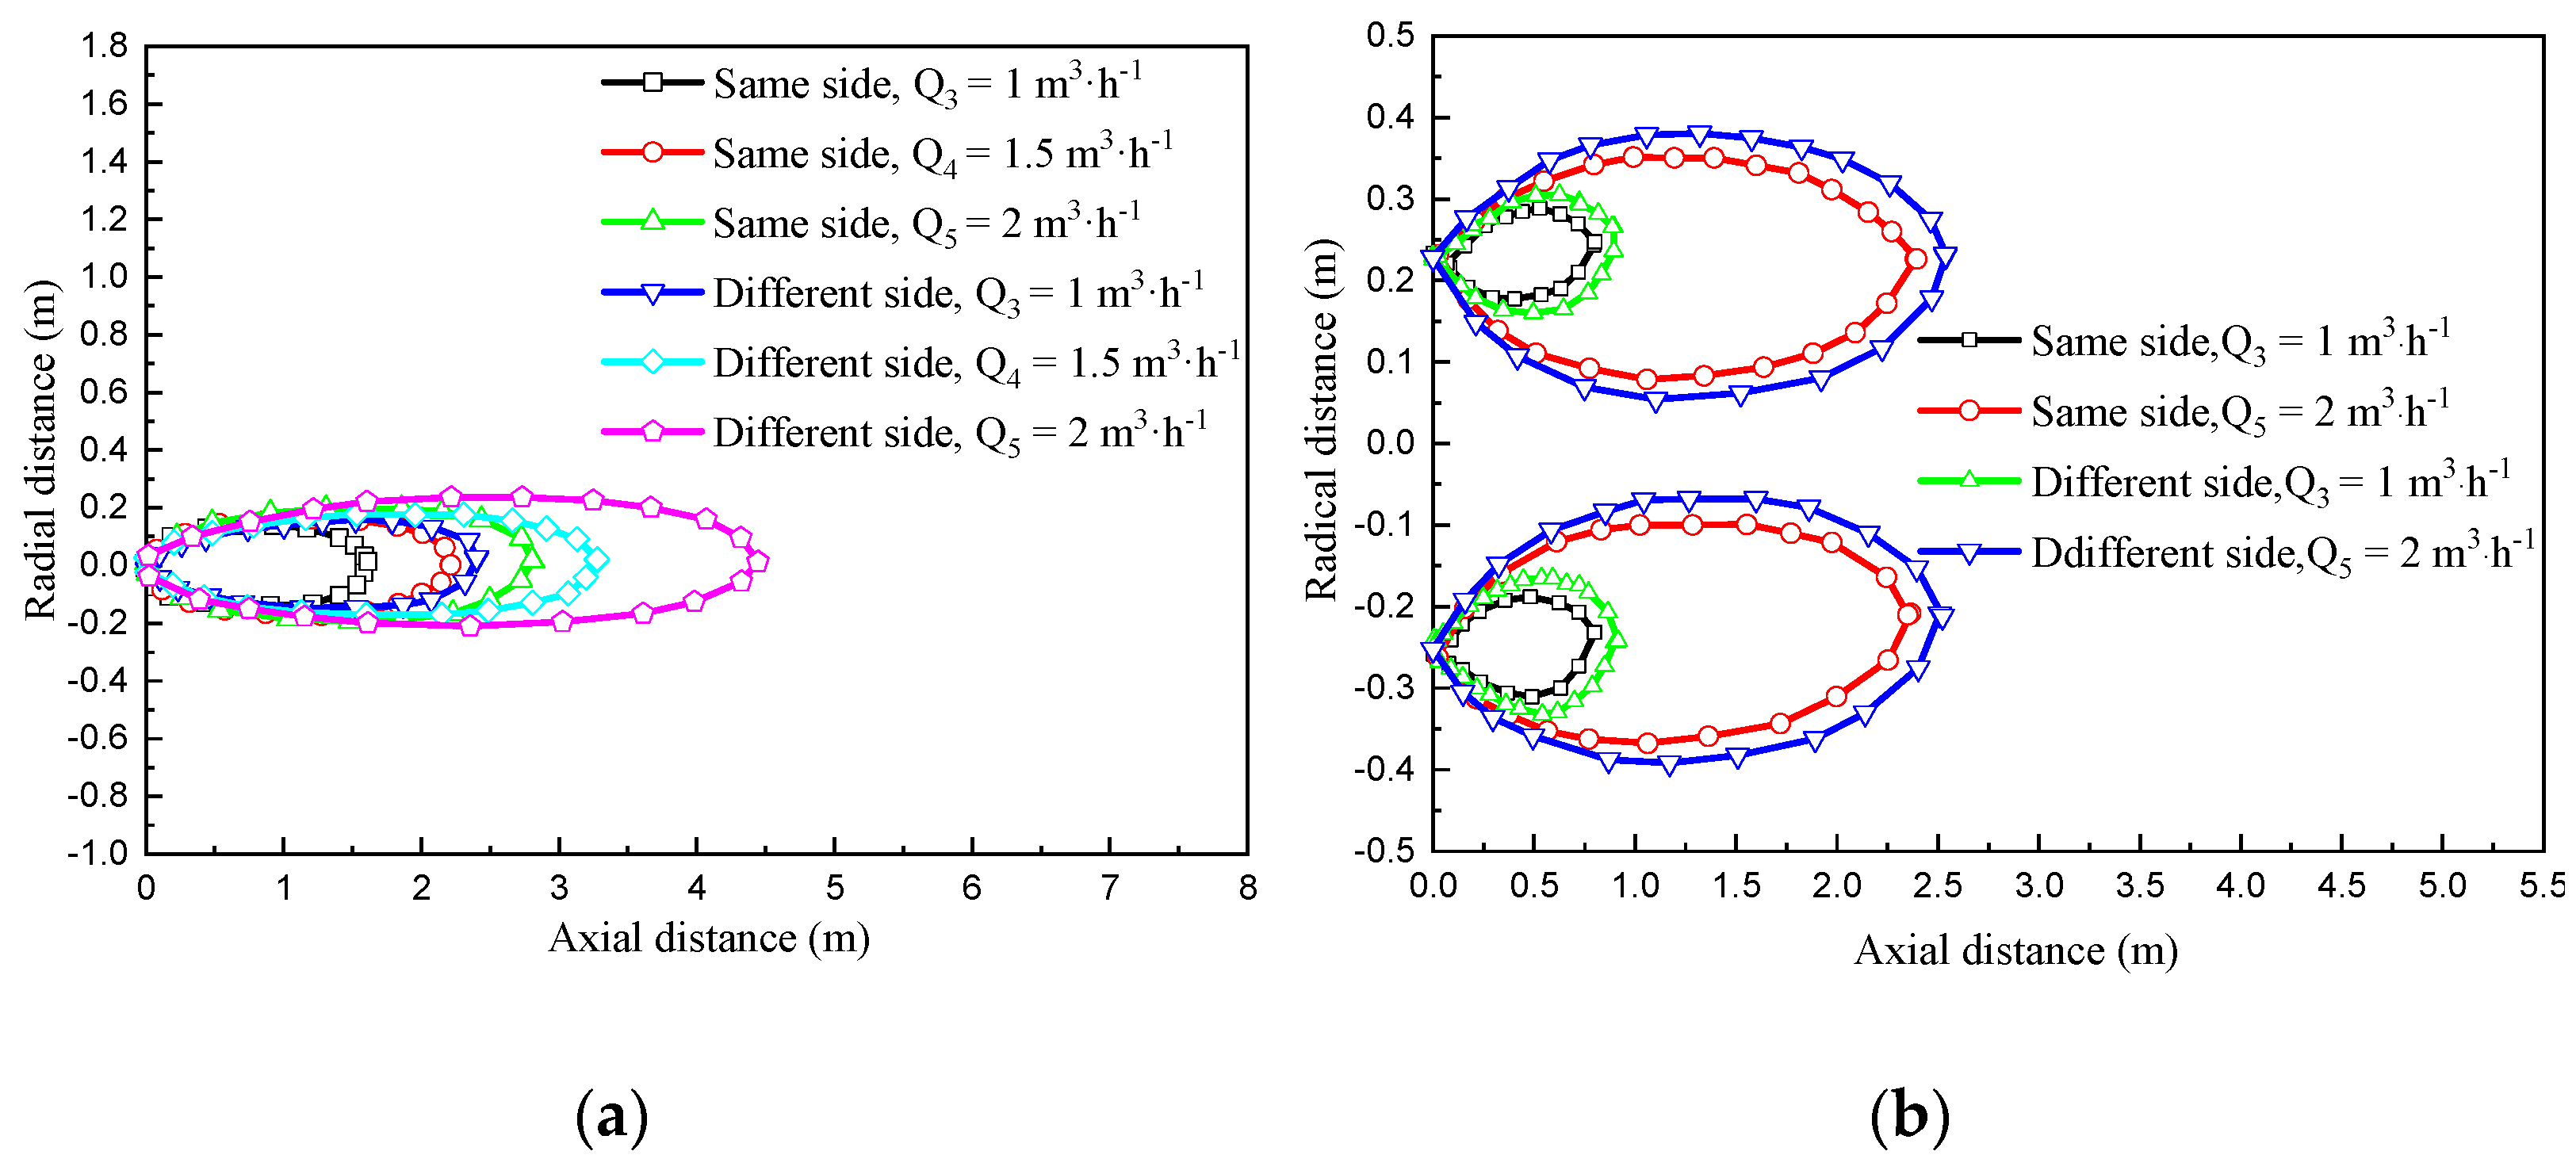
Figure 10 shows the oxygen-enriched area with the oxygen supply method and oxygen supply flow rate is different under air-conditioning (Vin = 0.85 m·s−1) at t = 120 s in the form 1# and 2#. Under air-conditioning, it is appropriate to use a single oxygen supply vent and an air flow supply on the opposite side. Thus, in the subsequent analysis, we will focus on the analysis of the single oxygen supply vent with a diameter of 0.006 m and the air flow supply on the opposite side.
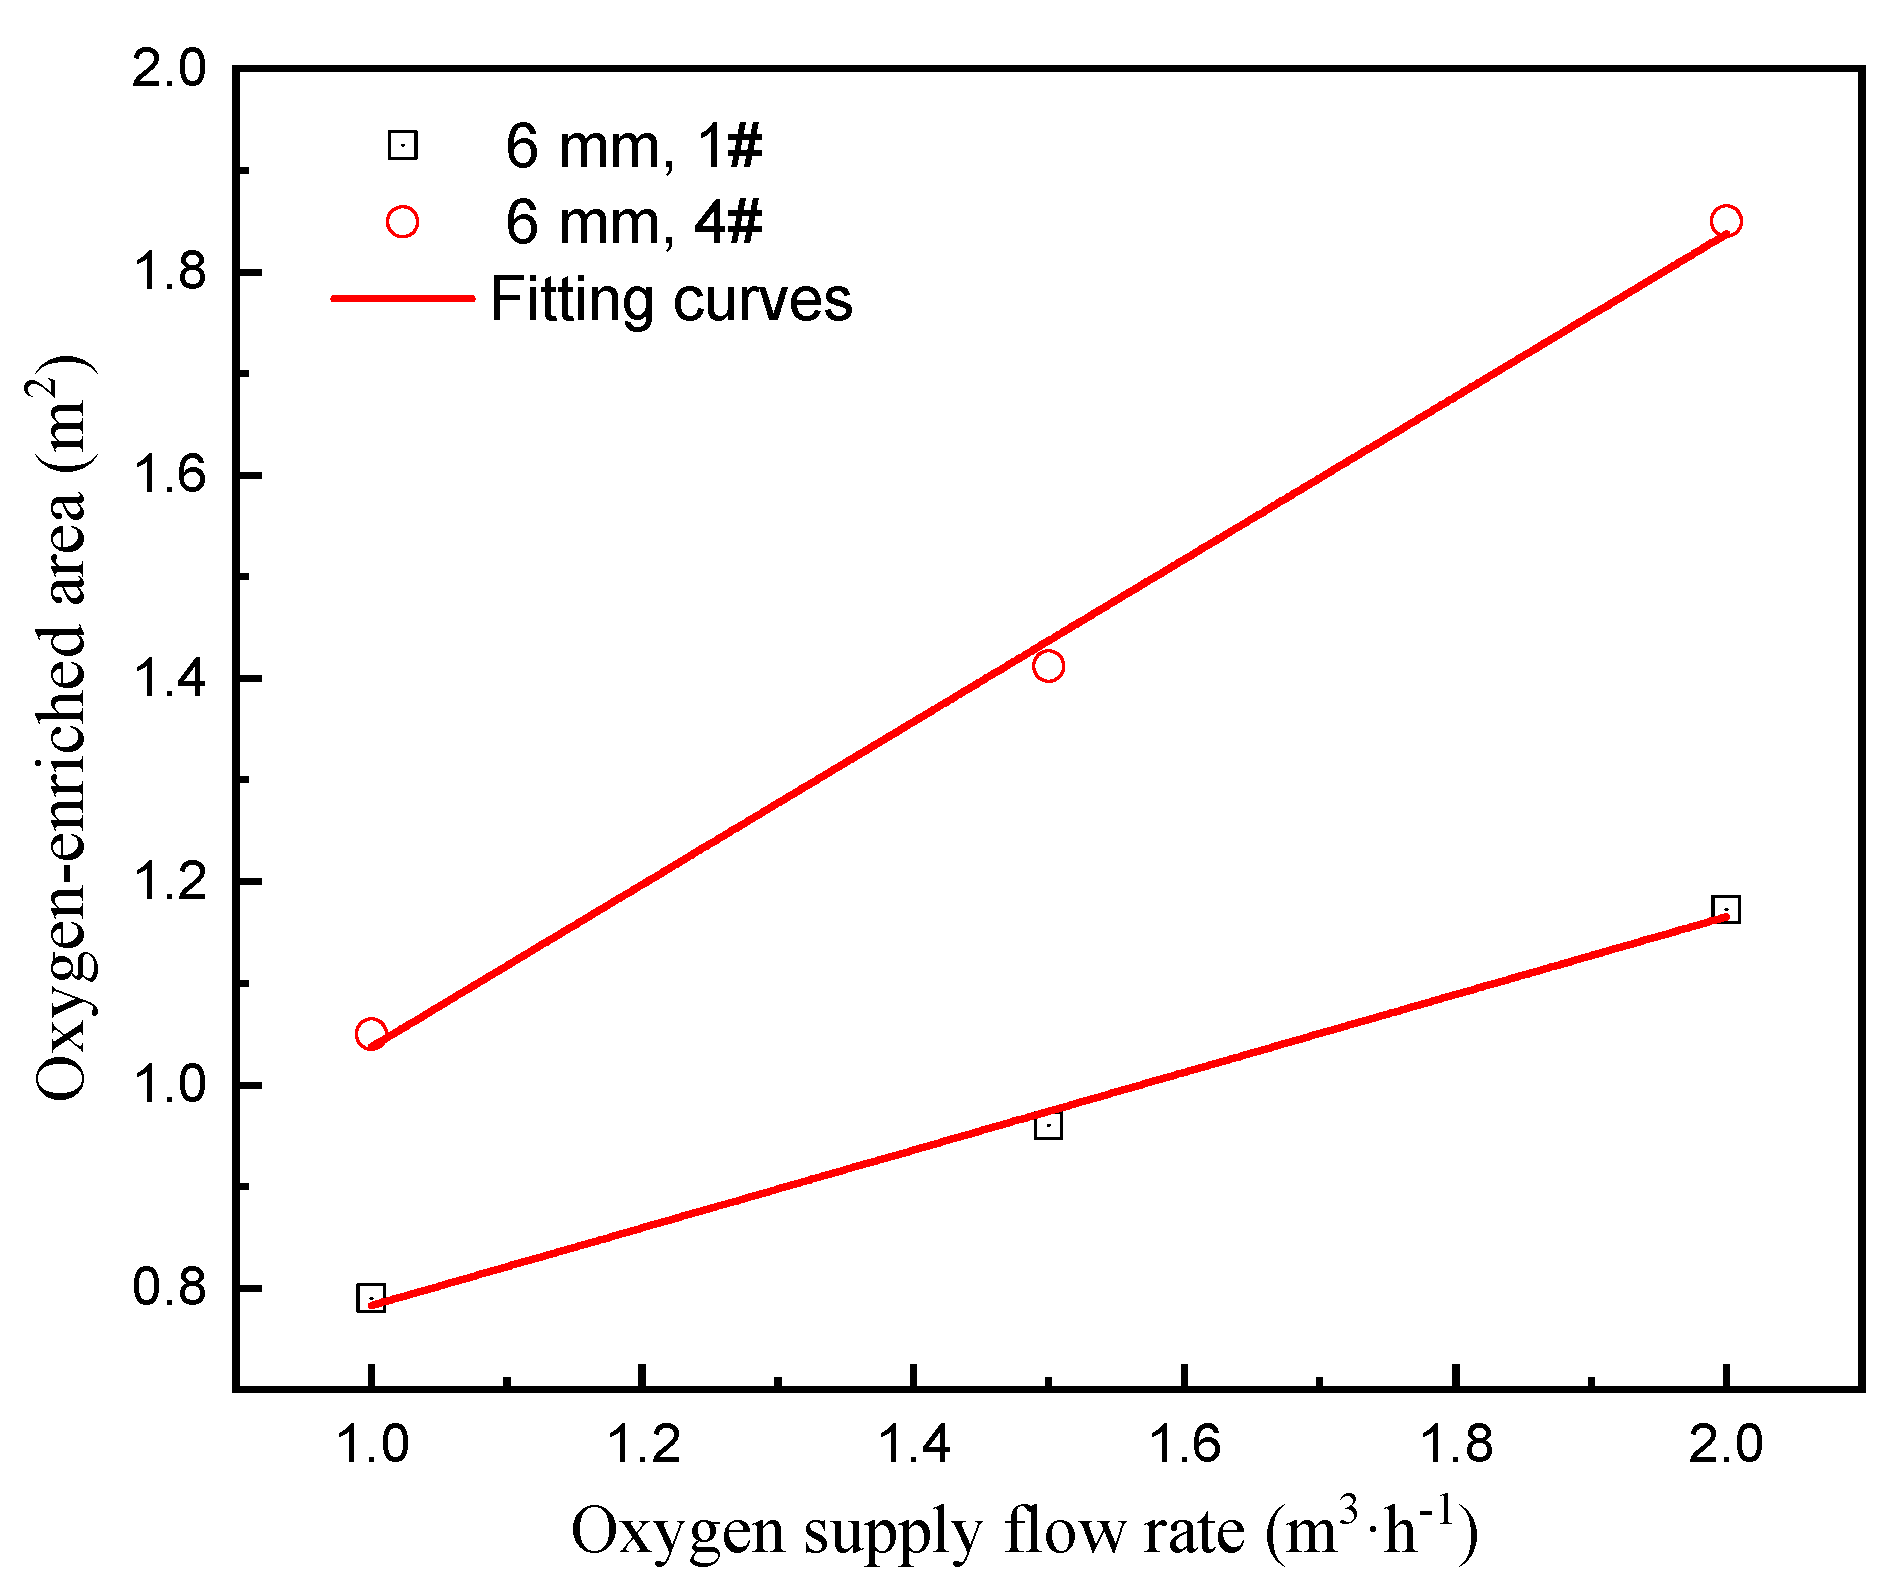
Figure 11 shows the oxygen-enriched area with different oxygen supply flow rate under air-conditioning (Vin = 0.85 m·s−1) at t = 120 s in the form 1# and 4#. The relationship between the oxygen-enriched area and the oxygen flow rate obtained by fitting is a linear relationship, as shown in Table 6. Under the same conditions, 4# has a larger oxygen-enriched area than 1#, and the oxygen enrichment effect is better. Therefore, the two are suitable for different office occasions: 1# is suitable for a centralized office area where office personnel is concentrated in the middle of the office, and 4# is suitable for a personalized oxygen delivery method in an office where personnel are dispersed.

4.4. Energy Consumption and Economic Analysis in Conventional HVAC

Under the same conditions, the traditional method of increasing fresh air volume for oxygen supplementation and PSA oxygen generation is used to supply oxygen to the same air-conditioned room (two adult men are working in the room), and the energy savings and economic efficiency of these two oxygen supplement methods are compared.

4.4.1. Energy Consumption in Traditional Method of Increasing Fresh Air Volume for Oxygen Supplementation

According to the Design Code for Heating, Ventilation and Air Conditioning of Civil Buildings (GB50736-2012) [47], the fresh air volume per person in the working environment is determined to be 30 m3/h. The indoor and outdoor meteorological parameters in summer and winter in Beijing are shown in Table 7. The fresh air load is calculated according to Formula (6) [48].
L Q W = G W × ( h W h N )
Through calculation, it can be concluded that the traditional air-conditioning system, with increased fresh air volume, consumes 0.502 kW/Day and 1.098 kW/Day in summer and winter, respectively. The air-conditioning system runs 24 h a day and runs for three months in summer and winter. The total energy consumption for the whole year is 3456 kWh. The annual operating cost of the traditional air-conditioning system with fresh air is 1728 RMB.

4.4.2. Energy Consumption in PSA Oxygen Generation for Oxygen Supplementation

According to the national standard [48], the oxygen consumption of an adult man in a light physical work state is 0.03 m3/h, and the oxygen consumption of two adult men in an air-conditioned room is 0.06 m3/h. Using the PSA oxygen production system to produce 1 m3/h of oxygen, the power consumption is about 0.35 kWh, and the oxygen consumption of two individuals per hour requires the power consumption of the oxygen production system to be 0.021 kWh. With the electricity fee set to 0.5 RMB/(kWh), the annual operating cost of the oxygen generation system is 0.021 × 24 × 365 × 0.5 = 91.98 RMB. The PSA oxygen supplementing air-conditioning system consumes 5.05 × 10⁻⁴ kW in summer and 1.1 × 10⁻³ kW in winter, so the annual load cost is 3.47 RMB. The PSA oxygen-making air-conditioning system can save 1632.55 RMB per year compared with the traditional air-conditioning system with additional fresh air. According to the current oxygen production level of the PSA oxygen generator, the average cost of oxygen production for 1 m3/h is about 2500 RMB [47], and the equipment investment and the installation costs required to meet the oxygen enrichment for two people is about 150 RMB. The payback period of the equipment is 0.1 year, which is 33 days.
The combination of PSA oxygen production technology and air-conditioning systems can deliver a certain concentration of oxygen to air-conditioned rooms, which can not only improve indoor air quality, but also reduce building energy consumption. Compared with the traditional increase of fresh air volume to supplement oxygen in air-conditioned rooms, PSA oxygen generation technology has certain advantages in terms of operating costs and energy consumption.

5. Conclusions

The oxygen-enriched flow characteristics and oxygen-enriched area were investigated experimentally and numerically in the un-air-conditioned and air-conditioned room. The following conclusions can be derived.
The maximum axial velocity decreases with the increase in the axial distance under un-air-conditioned conditions. Within the axial distance of 0.6 m, there is a maximum axial velocity gradient.
The number of oxygen supply vents, the diameter of the oxygen supply vent, the oxygen supply flow rate, and the oxygen supply method are different, and the formed oxygen-enriched areas vary greatly.
The relationship between the oxygen-enriched area and the oxygen flow rate is obtained by fitting. Under the un-air-conditioned state, when the diameter of the oxygen supply pipe is 0.006 m and the oxygen supply methods 1# and 4# are adopted, the oxygen-enriched area is F = 0.149 + 0.33 Q and F = 0.215 + 0.313 Q. When the diameter of the oxygen supply pipe is 0.01 m and the oxygen supply methods 1# and 4# are adopted, the oxygen-enriched area is F = −0.016 + 0.182 Q and F = 0.183 + 0.312 Q.
Under the air-conditioned state, the best way to supply oxygen to the room is by using an airflow supply on the opposite side with a diameter of 0.006 m. When the diameter of the oxygen supply pipe is 0.006 m and the oxygen supply methods 1# and 4# are adopted, and the oxygen-enriched area is F = 0.4 + 0.383 Q and F = 0.237 + 0.8 Q.

Author Contributions

Conceptualization, H.W.; methodology, H.W., C.Z., X.Y., C.L., X.M. and Z.L.; writing, H.W., Y.Z. (Yu Zhao) and C.Z.; project administration, Y.L., C.L., Y.Z. (Yuanhui Zhan), X.M. and H.W. All authors have read and agreed to the published version of the manuscript.

Funding

The study was supported by the China National Key R&D Program ‘Energy-saving design and key technical equipment development for clean air-conditioning plants’ (Grant No. 2018YFC0705204), the National Natural Science Foundation of Beijing (Grant No. 8182019), the National Natural Science Foundation of China (Grant No. 51578065), the Beijing Education Commission General Project (Grant No. KM202011417007), and the Premium Funding Project for Academic Human Resources Development at Beijing Union University.

Institutional Review Board Statement

Not applicable.

Informed Consent Statement

Not applicable.

Data Availability Statement

Not applicable.

Conflicts of Interest

The authors declare no conflict of interest.

Nomenclature

pGas pressure, Pa
SiGeneralized source term of the momentum conservation equation
tTime, s
CAMolar concentration of component A
ui, ujVelocity vector, m·s−1
DABDiffusion coefficient of component A in component B
DTTurbulent diffusion coefficient
μDynamic viscosity of the fluid, Pa·s
μtTurbulence viscosity of the fluid
ρDensity of fluid, kg·m−3
LQWFresh air load, kW
GWFresh air rate, kg/s
hWOutdoor air enthalpy, kJ/kg
hNIndoor air enthalpy, kJ/kg

References

  1. World Hearth Origanization (WHO). WHO Guidelines for Indoor Air Quality: Selected Pollutants, WHO Regional Office for Europe; WHO: Geneva, Switzerland, 2010. [Google Scholar]
  2. Martin, B. Air Quality in Airplane Cabin and Similar Enclosed Spaces; Springer: Berlin/Heidelberg, Germany, 2005. [Google Scholar]
  3. Lee, S.; Li, W.; Ao, C. Investigation of indoor air quality at residential homes in Hong Kong-case study. Atmos. Environ. 2002, 36, 225–237. [Google Scholar] [CrossRef]
  4. Wyon, D. The effects of indoor air quality on performance and productivity. Indoor Air 2004, 14, 92–101. [Google Scholar] [CrossRef] [PubMed]
  5. Cao, Z.; Zhao, L.; Shi, Y.; Feng, X. Pollution and exposure characteristics of polycyclic aromatic hydrocarbons in indoor dust in Xinxiang. Environ. Monit. Assess 2017, 187, 4150–4158. [Google Scholar]
  6. Xu, X.; Zhang, L.; Liu, Z.; Wang, Y. Simulation analysis of indoor PM2.5 concentration. Chin. J. Environ. Eng. 2017, 11, 1755–1760. [Google Scholar]
  7. Yue, G.; Lu, M.; Jia, H. Numerical simulation of indoor pollutant diffusion on ventilation optimization. Fluid Mach. 2014, 42, 81–85. [Google Scholar]
  8. Zaatari, M.; Novoselac, A.; Siegel, J. The relationship between filter pressure drop, indoor air quality, and energy consumption in rooftop HVAC units. Build. Environ. 2014, 73, 151–161. [Google Scholar] [CrossRef]
  9. Yang, F.; Kang, Y.; Gao, Y.; Zhong, K. Numerical simulations of the effect of outdoor pollutants on indoor air quality of buildings next to a street canyon. Build. Environ. 2015, 87, 10–22. [Google Scholar] [CrossRef]
  10. Zani, C.; Donato, F.; Grioni, S.; Viola, G.; Feretti, D. Feasibility and reliability of a questionnaire for evaluation of the exposure to indoor and outdoor air pollutants, diet and physical activity in 6–8-year-old children. Ann. Ig. 2015, 27, 646–656. [Google Scholar]
  11. Park, J.; Loftness, V.; Aziz, A.; Wang, T. Critical factors and thresholds for user satisfaction on air quality in office environments. Build. Environ. 2019, 164, 1–16. [Google Scholar] [CrossRef]
  12. Choi, J.; Moon, J. Impacts of human and spatial factors on user satisfaction in office environments. Build. Environ. 2017, 114, 23–35. [Google Scholar] [CrossRef]
  13. Azuma, K.; Uchiyama, I.; Uchiyama, S.; Kunugita, N. Assessment of inhalation exposure to indoor air pollutants: Screening for health risks of multiple pollutants in Japanese dwellings. Environ. Res. 2016, 145, 39–49. [Google Scholar] [CrossRef] [PubMed]
  14. Jafari, M.; Khajevandi, A.; Mousavi Najarkola, S.; Yekaninejad, M.; Pourhoseinhholi, M.; Omidi, L.; Kalanyary, S. Association of sick building syndrome with indoor air parameters. Tanaffos 2015, 14, 55–62. [Google Scholar]
  15. Pitarma, R.; Marques, G.; Ferreira, B. Monitoring indoor air quality for enhanced occupational health. J. Med. Syst. 2017, 41, 23–30. [Google Scholar] [CrossRef]
  16. Pettit, T.; Irga, P.; Torpy, F. Towards practical indoor air phytoremediation: A review. Chemosphere 2018, 208, 960–974. [Google Scholar] [CrossRef] [PubMed]
  17. Pitarma, R.; Marques, G.; Caerano, F. Monitoring indoor air quality to improve occupational health. Mobile Wirel. Health 2017, 41, 23–31. [Google Scholar]
  18. Liu, Y.; Du, X.; Zhao, H.; Che, X. Feasibility of oxygen enriched air conditioning. J. HV AC 2006, 4, 38–42. [Google Scholar]
  19. Wei, Y.; Yang, H.; Liu, J. Probe into specific characteristics of transportation organization and safety system of Qinghai-Tibet railway. China Saf. Sci. J. 2003, 3, 22–26. [Google Scholar]
  20. Wei, J.; Xu, Z.; Li, C.; Xu, M. Discussion on severely cold and oxygen deficiency problems and their countermeasures in Qing-Zang railway construction. China Saf. Sci. J. 2006, 4, 72–75. [Google Scholar]
  21. Jia, Y.; Liu, Y.; Liu, W.; Li, H.; Wang, H. Study on the effect of oxygen supplementation for tunneling workers of plateau mine. Met Mine. 2012, 41, 142–146. [Google Scholar]
  22. Liu, Y.; Cui, H.; Liu, W.; Feng, J.; Yue, K.; Yu, Q. Study on technology of oxygen supply in tunnel development in high attitude area. Min Metall. 2005, 14, 5–12. [Google Scholar]
  23. Xiang, G. Application of emergency shelter in mine disaster rescue. Labour Prot. 2006, 4, 92–93. [Google Scholar]
  24. Zhu, Y.; Jia, X.; Zhang, X. Circumstances controlling technology of high altitude tunnel during construction in permafrost regions. Rock Soil Mech. 2006, 27, 2177–2180. [Google Scholar]
  25. Zhang, X.; Lian, Z.; Lan, L. Improving measures of thermal comfort and air quality in submarine cabin. Chin. J. Ship Res. 2012, 7, 11–16. [Google Scholar]
  26. Wang, S.; Jin, L.; Ou, S.; Li, F.; Li, J. Prediction model of human comfort index in underground emergency refuge facilities. Chin. J. Eng. 2015, 37, 551–555. [Google Scholar]
  27. Yang, G.; Liu, Y.; Che, X. Experimental study on oxygen enrichment in a relatively closed environment. Build. Sci. 2008, 24, 24–28. [Google Scholar]
  28. Liu, Z.; Zhou, Y.; Huang, P.; Sun, R.; Wang, S.; Ma, X. Scaled field test for CO2 leakage and dispersion from pipelines. CIESC J. 2012, 63, 1651–1659. [Google Scholar]
  29. Jin, W.; Zhang, N.; Zhang, Y.; Bai, X. Experimental study on the leakage and diffusion performance of flammable refrigerant R32 in split-type air-conditioner. J. Refrig. 2015, 6, 10–16. [Google Scholar]
  30. Fu, J.; Zhao, Z.; Chen, G.; Luo, H.; Zhang, B.; Zhang, B.; Ye, C.; Zhu, Y. Influences of liquid pipeline flow and pressure on small-hole leakage rate. Acta Petro. Sin. 2016, 37, 257–265. [Google Scholar]
  31. Liu, P. Free Turbulent Jet Theory; Beihang University Press: Beijing, China, 2007. [Google Scholar]
  32. Xie, X. Turbulent Jet Theory and Computation; Science Press: Beijing, China, 1975. [Google Scholar]
  33. Qu, Y.; Chen, S.; Wang, X.; Teng, S. Discussion on the numerical simulation of ax-symmetric jet with different turbulent model. J. Eng. Thermophys. 2008, 29, 957–959. [Google Scholar]
  34. Christopher, D.; Bi, J.; Li, X. Integral model and CFD simulations for hydrogen leaks. CIESC J. 2013, 64, 3088–3095. [Google Scholar]
  35. Wang, J.; Wang, Z.; Li, M. Heat transfer characteristics of square wave impinging jets with different duty cycles. CIESC J. 2013, 64, 2428–2435. [Google Scholar]
  36. Cai, S.; Cai, C.; Zhang, K.; Li, J. Rarefication effects on jet impingement loads. Aerospace 2017, 4, 48. [Google Scholar] [CrossRef] [Green Version]
  37. Naruemon, I.; Liu, L.; Mei, Q.; Ma, X. Investigation on an injection strategy optimization for diesel engines using a one-dimensional spray model. Energies 2019, 12, 4221. [Google Scholar] [CrossRef] [Green Version]
  38. Chien, T.; Liang, C.; Wu, F.; Chen, C.; Pan, T.; Wan, G. Comparative Analysis of Energy Consumption, Indoor Thermal–Hygrometric Conditions, and Air Quality for HVAC, LDAC, and RDAC Systems Used in Operating Rooms. Appl. Sci. 2020, 10, 3721. [Google Scholar] [CrossRef]
  39. Cui, H. Experimental Study and Mathematical Simulation on Two Stage Pressure Swing Adsorption Processes of Producing High Purity Oxygen; University of Science and Technology Beijing: Beijing, China, 2004. [Google Scholar]
  40. Yue, K.; Yu, Q.; Liu, Y.; Cui, H.; Zhang, D. High purity oxygen production system by PSA based on PLC. J. Univ. Sci. Technol. Beijing 2003, 23, 185–188. [Google Scholar]
  41. Wang, H.; Liu, Y.; Zhang, C.; Chen, F.; Ma, X.; Li, C. Simulation of oxygen enrichment characteristics and effect in hypoxia air-conditioning room. Chin. J. Eng. 2019, 42, 1061–1073. [Google Scholar]
  42. Zhang, C.; Liu, Y.; Wang, H.; Wu, Y.; Ma, X.; Chen, F. Oxygen enrichment characteristics of an enclosed architectural space under anoxic conditions. Chin. J. Eng. 2018, 40, 1380–1388. [Google Scholar]
  43. Stakic, M.B.; Zivkovic, G.S.; Sijercic, M.A. Numerical analysis of discrete phase induced effects on a gas flow in a turbulent two-phase free jet. Int. J. Heat Mass Transfer. 2011, 54, 2262–2269. [Google Scholar] [CrossRef]
  44. Mohsen, K.; Madjid, B.; Brahim, S. Numerical simulation of a turbulent free jet issuing from a rectangular nozzle. Comput. Therm. Sci. 2012, 4, 1–22. [Google Scholar]
  45. Yong, L.; Xia, S.; Zhu, J. Study on flow characteristics of gas-mist two phase confined jet. J. Sichuan Univ. Eng. Sci. Ed. 2001, 33, 54–58. [Google Scholar]
  46. Liu, Y.; Zhang, H.; Liu, W. Anoxic Environment Oxygen Making and Supply Technology; Metallurgical Industry Press: Beijing, China, 2010; pp. 207–263. [Google Scholar]
  47. Ministry of Housing and Urban-Rural Development of the People’s Republic of China (GB 50736-2012). Design Code for Heating Ventilation and Air Conditioning of Civil Buildings; China Architecture Publishing & Media Co, Ltd.: Beijing, China, 2012. [Google Scholar]
  48. Wang, H.; Liu, Y.; Zhang, C.; Li, C.; Wu, Y.; Chen, F. Influence of hypoxia problem in air-conditioned room on human bodyand the oxygenating method. Low Temp. Spec. Cases 2018, 36, 10–15. [Google Scholar]
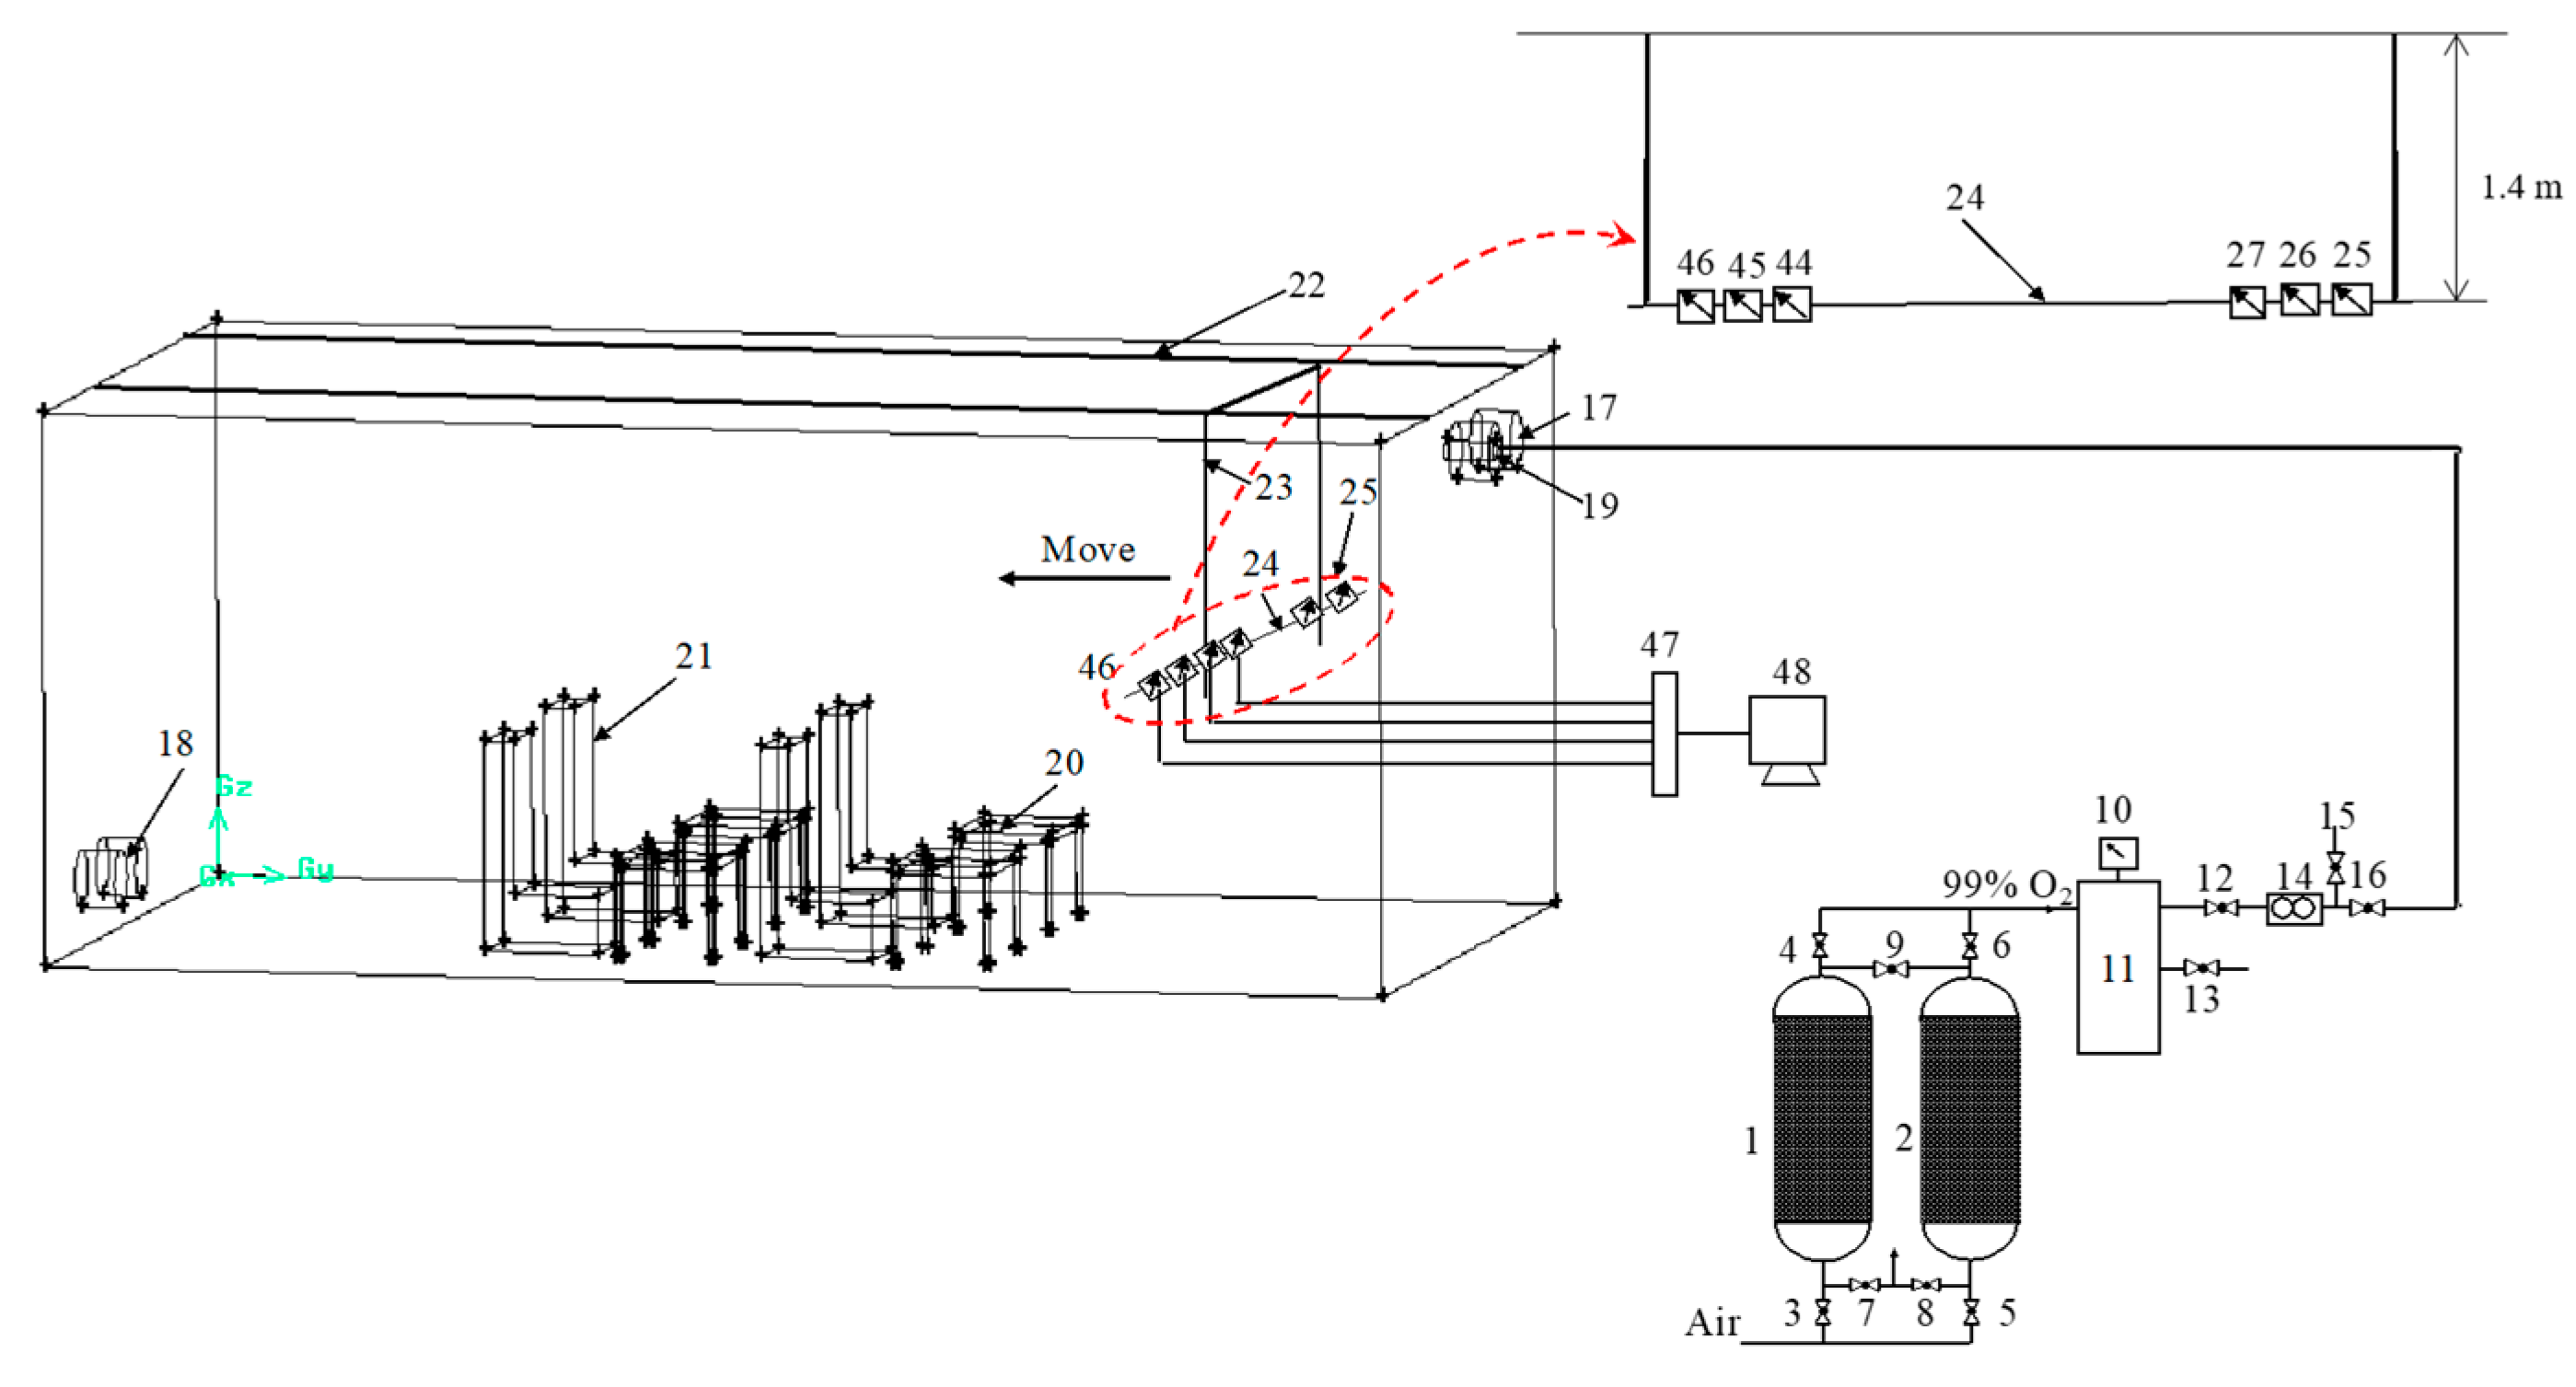
Figure 1. Schematic diagram of the experimental setup. (1) PSA adsorber; (2) PSA adsorber; (10) Zirconia sensor oxygen measurement system; (11) Buffer tank; (3), (4), (5),(6), (7), (8), (9), (12), (13), (15), (16) Ball valve; (14) Rotometer; (17) Air supply vent; (18) Air return vent; (19) Oxygen delivery port; (20) Table; (21) Chair; (22) Suspended track; (23) Wire; (24) Holder of the oxygen sensor; (25)~(46) Oxygen sensors; (47) Data collector; (48) Computer.
Applsci 11 04733 g001
Figure 2. Physical model of the artificial climate chamber (air-conditioned, with single oxygen supply vent). (a) Up-supply and down-return on the opposite side, (b) up-supply and down-return on the same side, (c) side view of the model.
Applsci 11 04733 g002
Figure 3. Verification results of grid independence.
Applsci 11 04733 g003
Figure 4. Computational grid of the artificial climate chamber model.
Applsci 11 04733 g004
Figure 5. Comparing model results with experimental results in the oxygen-enriched area under un-air-conditioned conditions. (a) 1#, (b) 2#.
Applsci 11 04733 g005
Figure 6. Axial oxygen concentration distribution with a single oxygen supply vent for different oxygen flow rates: (a) D1 = 0.006 m, (b) D2 = 0.01 m.
Applsci 11 04733 g006
Figure 7. Oxygen mass fraction distribution of the single oxygen supply vent under un-air-conditioned conditions. (a) 5 s, (b) 20 s, (c) 60 s, (d) 90 s, (e) 120 s.
Applsci 11 04733 g007
Figure 8. Oxygen-enriched area with different oxygen supply vents and oxygen supply mode in un-air-conditioned state. (a) 1#, (b) 2#, 3#, 4# (D1 = 0.006 m), (c) 2#, 3#, 4# (D2 = 0.01 m).
Applsci 11 04733 g008
Figure 9. Oxygen-enriched area with different oxygen supply modes and oxygen flow rates in un-air-conditioned state.
Applsci 11 04733 g009
Figure 10. Oxygen-enriched area with different oxygen flow rates and oxygen supply modes under air-conditioning (Vin = 0.85 m·s−1) in the form 1# and 2#. (a) 1#, (b) 2#.
Applsci 11 04733 g010
Figure 11. Oxygen-enriched area with different oxygen supply modes and oxygen flow rates under air-conditioning.
Applsci 11 04733 g011
Table 1. Structural parameters of the artificial climate chamber.
Parameter (m)Values
Diameter of air supply and return vent0.15/0.15
Distance between the center of the air supply and return vent to the ground 2.65/0.25
Center distance between two air supply and return vents0.49/0.49
Diameter of oxygen supply vent0.006/0.01
Table surface and legs ( length × width ×   height ) 0.5 × 0.72 × 0.05 / 0.03 × 0.03 × 0.5
Chair surface and back ( length × width ×   height ) 0.57 × 0.42 × 1.1 / 0.15 × 0.42 × 1.1
Table 2. Initial conditions of the oxygen supply vent methods.
Number of Oxygen Supply VentsOxygen Supply MethodSymbolSchematic Diagram
Single ventvertical1# Applsci 11 04733 i001
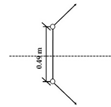
Double ventsvertical2# Applsci 11 04733 i002
Double vents relative 45 o3# Applsci 11 04733 i003
Double vents opposite 45°4# Applsci 11 04733 i004
Table 3. Initial conditions of the oxygen supply parameters.
Oxygen Supply MethodsOxygen Supply Vent
Diameter (m)
Oxygen Supply
Flow Rate (m3·h−1)
Oxygen Supply Velocity (m·s−1)
Single vent (1#)D1 = 0.0060.2, 0.5, 1, 1.5, 21.96, 4.91, 9.83, 14.74, 19.66
Single vent (1#)D2 = 0.010.2, 0.5, 1, 1.5, 20.71, 1.77, 3.54, 5.31, 7.08
Double vents (2#,3#,4#) D1 = 0.0060.2, 0.5, 1, 1.5, 20.98, 2.46, 4.91, 7.37, 9.83
Double vents (2#,3#,4#) D2 = 0.010.2, 0.5, 1, 1.5, 20.36, 0.89, 1.77, 2.66, 3.54
Table 4. Numerical simulation conditions and contents under air-conditioning.
Air Supply FormatVelocity (m·s−1)
Up supply down return on the same sideVin = 0.85Vin = 1Vin = 1.4
Up supply down return on the opposite sideVin = 0.85Vin = 1Vin = 1.4
Table 5. The relationship between the oxygen-enriched area and oxygen flow rate in un-air-conditioned state.
Oxygen Supply MethodRelation of Oxygen-Enriched Area (m2)
D1 = 0.006 mD1 = 0.01 m
1#F = 0.149 + 0.33 QF = −0.016 + 0.182 Q
2#F = 0.11 + 0.309 QF = −0.008 + 0.224 Q
3#F = 0.129 + 0.186 QF = −0.013 + 0.186 Q
Table 6. The relationship between oxygen-enriched area and oxygen flow rate under air-conditioning.
Oxygen Supply MethodRelation of Oxygen-Enriched Area (m2)
1#F = 0.4 + 0.383 Q
4#F = 0.237 + 0.8 Q
Table 7. Indoor and outdoor meteorological parameters in summer and winter in Beijing area.
SummerWinter
OuthoorIndoorIndoorOuthoor
Temperature (K) 299306.2295261
Relative humidity (%) 50604545
Enthalpy (kJ/kg) 5982.540.9−10.4
Publisher’s Note: MDPI stays neutral with regard to jurisdictional claims in published maps and institutional affiliations.