Article

Construction Planning and Scheduling of a Renovation Project Using BIM-Based Multi-Objective Genetic Algorithm

by
Pornpote Nusen
1,
Wanarut Boonyung
2,
Sunita Nusen
3,
Kriengsak Panuwatwanich
4,
Paskorn Champrasert
2 and
Manop Kaewmoracharoen
2,*
1
Department of Civil Engineering, Faculty of Engineering, Chiang Mai University, Chiang Mai 50200, Thailand
2
Optimization Theory and Applications for Engineering SYStems Research Group (OASYS), Chiang Mai University, Chiang Mai 50200, Thailand
3
Department of Civil and Environmental Engineering, Faculty of Engineering, Rajamangala University of Technology Lanna, Chiang Mai 50300, Thailand
4
School of Civil Engineering and Technology, Sirindhorn International Institute of Technology, Thammasat University, Pathum Thani 12120, Thailand
*
Author to whom correspondence should be addressed.
Appl. Sci. 2021, 11(11), 4716; https://doi.org/10.3390/app11114716
Submission received: 31 March 2021 / Revised: 7 May 2021 / Accepted: 17 May 2021 / Published: 21 May 2021

Abstract

:

Featured Application

Building information modeling with multi-objective genetic algorithm.

Abstract

Renovation is known to be a complicated type of construction project and prone to errors compared to new constructions. The need to carry out renovation work while keeping normal business activities running, coupled with strict governmental building renovation regulations, presents an important challenge affecting construction performance. Given the current availability of robust hardware and software, building information modeling (BIM) and optimization tools have become essential tools in improving construction planning, scheduling, and resource management. This study explored opportunities to develop a multi-objective genetic algorithm (MOGA) on existing BIM. The data were retrieved from a renovation project over the 2018–2020 period. Direct and indirect project costs, actual schedule, and resource usage were tracked and retrieved to create a BIM-based MOGA model. After 500 generations, optimal results were provided as a Pareto front with 70 combinations among total cost, time usage, and resource allocation. The BIM-MOGA can be used as an efficient tool for construction planning and scheduling using a combination of existing BIM along with MOGA into professional practices. This approach would help improve decision-making during the construction process based on the Pareto front data provided.

1. Introduction

Nowadays, construction management is facing several uncontrollable and controllable challenges. Unpredictable weather, local resource scarcity, and a range of strict regulations are common uncontrollable factors in the construction industry [1]. Traditional construction management also deals with controllable factors such as inconsistent design, lack of constructability, inaccurate documentation, and redundant work processes [2]. Building information modeling (BIM) has been widely used for a decade to improve the efficiency of a construction project, especially in construction planning and documentation. It provides data and visualization to project managers to make better decisions for improved quality and faster processes [3,4,5]. Through clash detection capability, BIM also helps resolve design conflict resulting from the complex interface between various building elements which commonly exist in large buildings and renovation work [6]. Construction complexity has a direct impact on project communication and performance [7]. Renovation projects are particularly complex because of physical constraints, such as obsolete conditions, limited access, and unknown conditions. Some renovation projects become more complex if there is a requirement for the business to remain open during the renovation [8]. The contractors are required to take extra care in planning in order to ensure that the construction activities do not interfere with on-going business.
The apparent benefit of BIM in dealing with the technical complexity of a construction project has seen a widespread adoption of BIM technology as a tool to improve efficiency in construction management. Recently, an artificial intelligence optimization approach has been suggested to further enhance BIM capability. Such an advancement represents a research opportunity to develop and apply a BIM-based optimization approach to existing traditional construction approaches [9].

1.1. Building Information Modeling

Building information modeling (BIM) was introduced in the early 2000s as an information model of building elements [10]. It has been widely used in the construction industry since then because it enables better project information flow throughout a building life cycle, from pre-construction to construction, post-construction, and operation [11]. It is used for the improvement of planning and design, clash detection, visualization, cost planning, and data management. A BIM model consists of (1) physical properties in three dimensions, such as material, density, weight, or location, and (2) embedded information, such as construction specifications or repair manuals [12]. Several researchers and practitioners have used BIM in a variety of aspects [13]. Most notably, it is used to improve communication between the project stakeholder over a traditional non-BIM approach [14] and to improve information synchronization of building coordination in a three-dimensional space. This is a significant improvement on traditional construction drawings and is very useful for complex projects, such as extra-large buildings that require synchronization between multi-disciplinary parties as well as multi-source documents [15].
BIM has been used for existing buildings in either renovation projects or for the improvement of existing facilities. Facility management [16] and sustainability improvement for existing buildings are the major benefits of BIM [17]. It also significantly improves construction processes when working on existing buildings; however, several challenges need to be addressed, including the difficulty of stakeholder involvement and the lack of automated data capturing [18]. In converting existing buildings to BIM, laser scanning surveyance and total station techniques are suggested [19]. This technique is also used for collecting historical building information [20]. It can be seen that using BIM as a tool for complex renovation projects is viable for making the project more successful.

1.2. Construction Planning and Scheduling Optimization

Construction planning and scheduling are two of the most important activities in all phases of construction. A well-planned and optimized construction schedule contributes significantly to a successful project. Several researchers adopted optimization techniques to solve construction planning and scheduling problems [21,22,23]. In the past, linear programming was one of the techniques most widely used to solve this issue. Multi-objective linear programming is suggested for optimization when faced with constrained resource problems, including construction costs, project duration, resource idle time, and project delivery time [24]. A particle swarm optimization is also suggested for construction scheduling problems in order to solve resource constraint issues [25]. An ant colony optimization, which focuses on minimizing project duration while varying activity sequences, is another approach for resource-constrained projects [26]. Genetic algorithms (GA) have been used in several construction scheduling research problems, such as resource allocation and leveling optimization [27], concrete precast production optimization [28], nonproductive resource determination [29], and building performance assessment for long time usages [8]. The basic concept and overview of the applications of optimization algorithm in construction processes can be further found in References [9,30,31], where advantages and limitations were also discussed.
In real construction projects, there are always multiple objectives forming a set of solutions as optimization data for project managers to make decisions. Consequently, the field of multi-objective optimization has been studied intensively [32,33]. Multi-objective genetic algorithms (MOGA) were first introduced by Tadahiko Murata in 1995 to provide decision-makers with Pareto optimization instead of constant weights [34]. It has been discussed in several construction optimization studies. For example, it is used for construction time–cost trade-off optimization [35] by defining optimal time and cost with variable crane locations and crews by minimizing crane stoppage time [36]. It is also used to improve safety by optimizing safety costs on different project layouts [37]. Even construction quality is used as an objective function for MOGA along with construction project time and cost, with the results showing their weights and Pareto solutions for the repetitive scheduling method [38]. The optimization results can be used for the decision-maker in other applications, such as planning, scheduling, or even unpredictable situations such as construction logistics network during a hazard [39].
A combination of BIM and optimization techniques has been discussed in the past [30], such as genetic algorithms (GA), particle swarm optimization (PSO), and fuzzy theory working with Autodesk Revit as a BIM tool [9] used to improve information flow and visualization. An optimization technique such as a genetic algorithm was used with BIM for possibilities usage of information from BIM directly and parsing the data to GA directly [40]. More than the fuzzy-logic dataset was possible usages in GA for construction scheduling [41]. Other applications of BIM-based optimization were used for the construction assembly line [42], building energy performance evaluation [43] and planning of construction site layout [44].
Regarding such characteristics of renovation projects, more flexible planning models unique to the extra-large-scale renovation projects are needed in order to improve the planning efficiency in terms of actual construction time, total cost, and worker utilization fluctuation [27,45,46,47], especially in real construction projects where there are always multiple objectives forming a set of solutions for project managers to make decisions. Therefore, with the performance of BIM, this paper explored opportunities to develop a systematic BIM-based multi-objective approach for construction planning and scheduling of renovation projects.
In this paper, the proposed BIM-based MOGA model is discussed. A two-year building renovation project is used as a case study. The project construction planning and scheduling data are optimized and building information modeling data are combined and optimized. To achieve this aim, the paper is organized as follows. In the next section, the related works and research methodology are discussed. The BIM-MOGA process is described along with an experimental design based on a case study. This is followed by discussion of the possibility of applying the proposed model to complex construction projects.

2. Materials and Methods

2.1. Project Background

A renovation project of Chiang Mai University Main Library, with a size of 15,768 square meters and built in 1964, was used in this research. The renovation was approved by the University in 2015 and started in 2018, with a budget of 86,000,000 baht (approximately 2,350,000 Euro). The project’s challenges were (1) the requirement for regular operating hours with only partial closure, (2) extra-large building regulations, as defined by the Thailand Ministerial Regulations ACT 33 B.E. 2535 (announced in 1992), and (3) complicated governmental-university regulations.
The project started on 17 October 2018, with a construction duration of 720 days. The proposed schedule was divided into four phases: (1) the 4th floor renovation from day 1 to 180, (2) the 3rd floor renovation from day 181 to 360, (3) the 2nd floor renovation from day 361 to 540, and (4) the 1st floor renovation and landscape from day 541 to 720.
The project was finally completed on 2 November 2020, after an extension period of 36 days. The project scopes were to improve the current look and atmosphere of the building, update MEP (mechanical, electrical, and plumbing) and ICT systems to modern standards, and to revamp the landscape and surrounding area with a new concrete patio.
Renovations are often carried out in an existing building that remains in operation. Unique challenges for the renovations are, for instance, an additional level of uncertainty (unexpected problems that suddenly arise when the demolition phase has started, the unavailability or inaccuracy of existing as-built drawings) and particular management issues (e.g., difficulty in managing the interaction between the construction team and users due to limited working space) [8,48]. The project site of Chiang Mai University Library during the renovation is displayed in Figure 1.

2.1.1. Construction Scheduling

Before the project commenced, the project schedule was initially set according to the project contract. Information was extracted from the contract, which consisted of a project delivery system, bill of quantities (BOQ), resources, phasing, and payment. Then, during the construction, the actual schedule and resources usage were retrieved on-site from daily site progress reports. The first phase focused on the demolition of existing walls and removing existing ceilings and floors. Then, the project closed each floor, starting with the 4th floor, while the 1st, 2nd, and 3rd floors remained operational as usual.
The original scheduling data were retrieved from the main contractor in the form of Microsoft Project and Microsoft Excel files. Over two years, on-site data were collected, including the number of workers, crew sizes, actual durations, and project progress. Then, all data from different sources were used to create the BIM.

2.1.2. BIM Model Development

Over 50 years, there had been several minor renovations and modifications which were not recorded in any hardcopy format. A BIM was developed based on the as-is condition from the original as-built drawings, terrestrial laser scanning survey data, and on-site survey data.
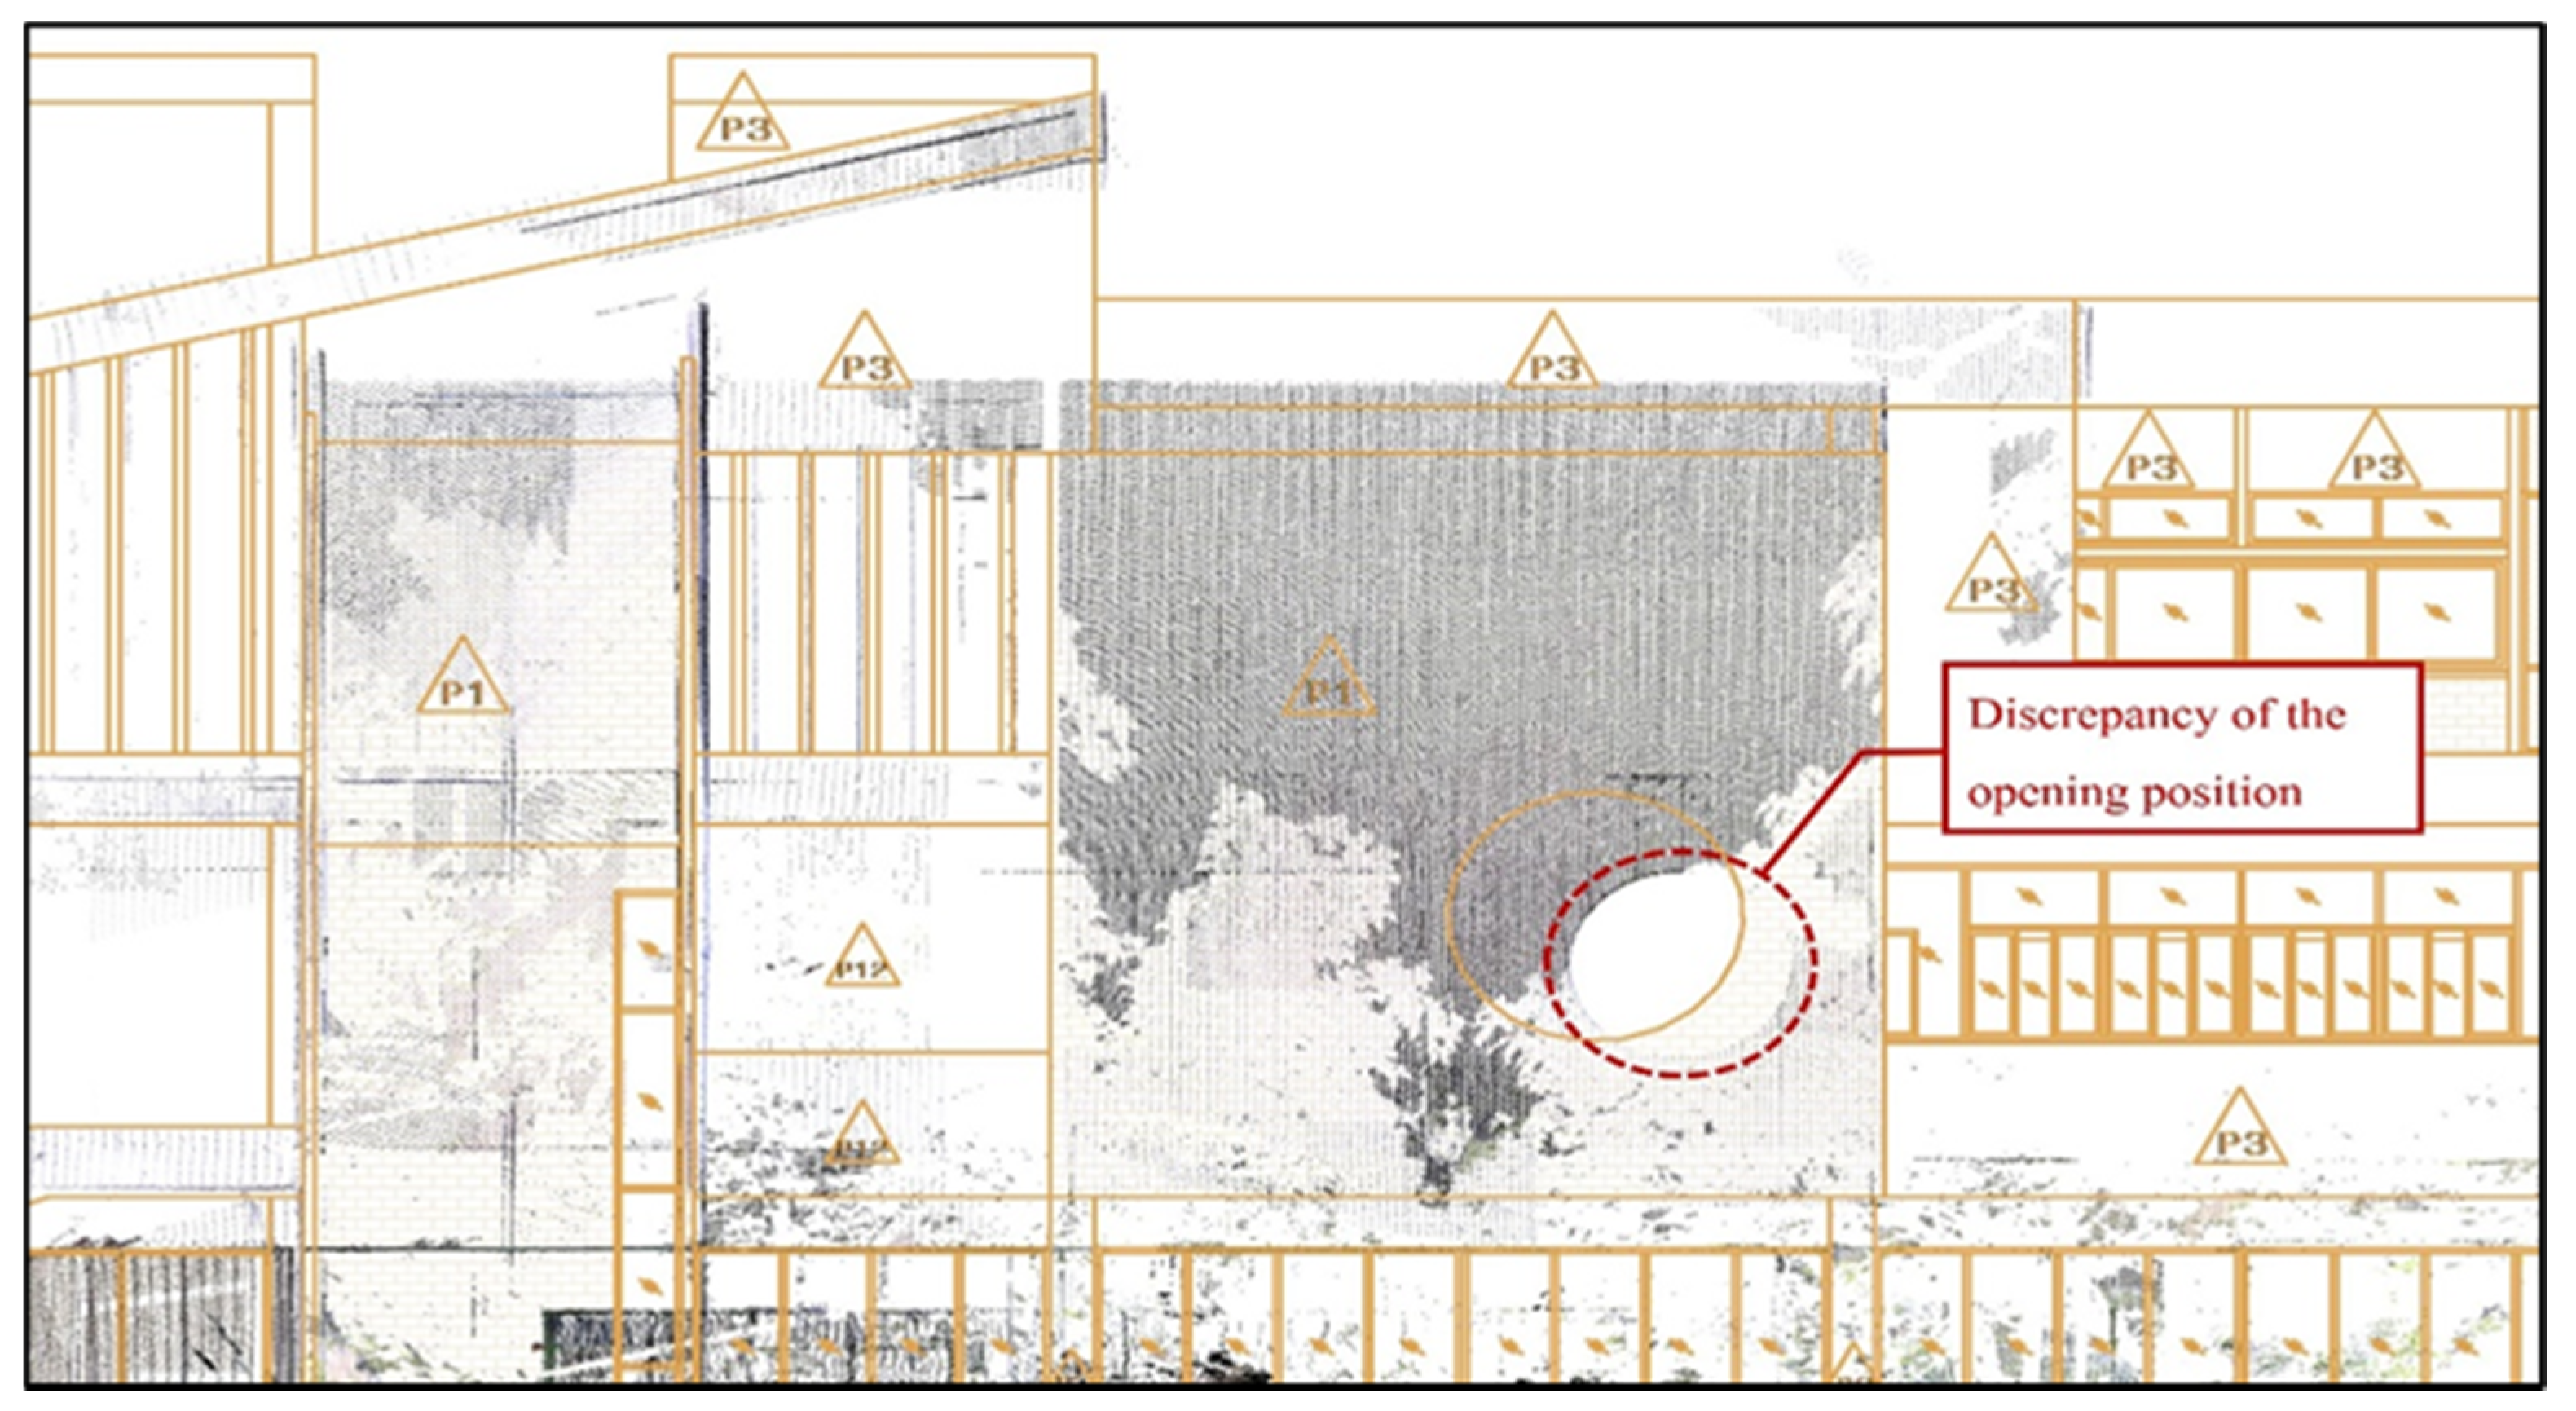
The BIM model of the renovation project was initially created based on the as-built drawings; however, several details were missing either due to faded blueprints or non-recorded renovation activities. Moreover, information from a traditional two-dimensional blueprint was obscure and prone to error due to several unconnected figures, tables, and remarks. Then, a traditional on-site survey along with a terrestrial laser scan was carried out in order to collect the as-is condition of the building and surrounding area. Three-dimensional point cloud data were retrieved from the survey. Then, the point cloud data were laid on top of the existing as-built drawings to complete the building information. When data from different sources were combined, discrepancy data appeared, as illustrated in Figure 2, which shows an example of an opening position error when comparing the as-built drawings and as-is condition. Today, this approach is a typical initial BIM procedure for gathering data in renovation projects.
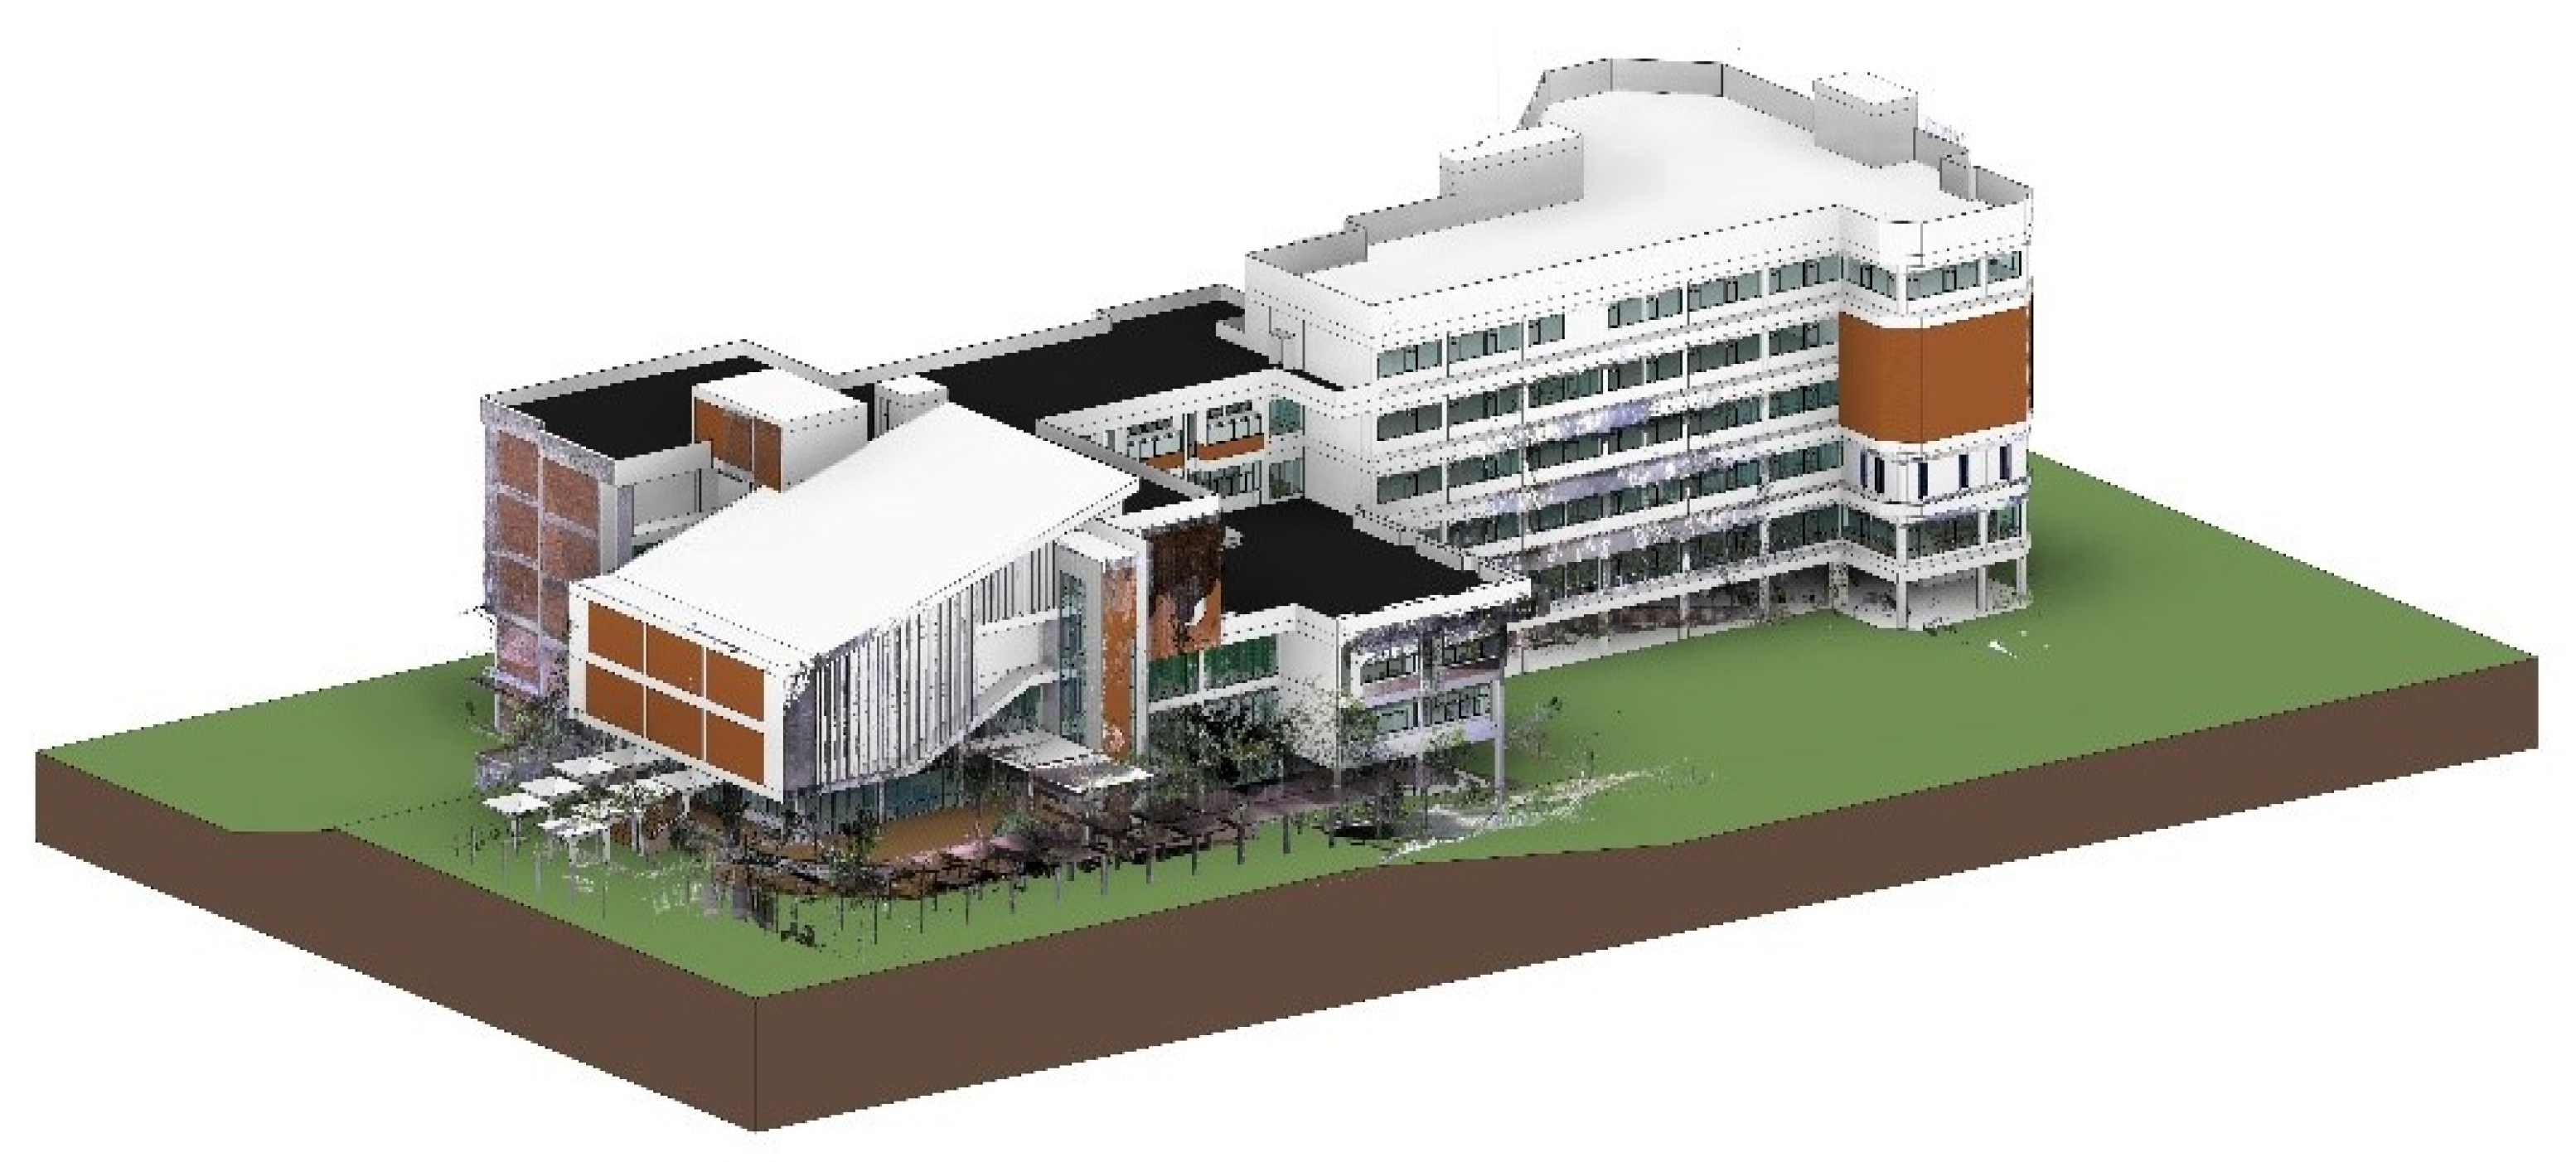
Following the above procedure, the BIM model was created for visualization of the project (3D BIM) and the project schedule (4D BIM). Figure 3 displays the 3D BIM model for visualization. It displayed the final appearance when the renovation was completed. This was used for communication between project stakeholders. The scheduling and cost data model are displayed in the BIM model from a combination of the 3D BIM and a project Gantt chart, as illustrated in Figure 4. The appearance of building elements was changed and highlighted according to a specific date. This allowed the project stakeholders to discuss and monitor the current project schedule in an efficient manner. Moreover, the 4D BIM renovation was helpful since several demolition tasks were not displayed in the model but required significant project resources. This allowed the project stakeholders to plan and schedule for non-element construction tasks much more easily than in a traditional approach. In this 4D BIM, a demolition model and a new renovation model were overlapped for planning and scheduling in different project phases.
During construction, schedule and resource information was collected on site and put back into the model for control and monitoring. Finally, total cost data were then used for project management throughout the project life cycle.

2.2. Optimization Definitions

The optimization problem for the multi-objective optimization was defined with the goal of minimizing total cost, construction time, and variance in the number of workers per day. The relevant parameters and associated formula are presented in Equations (1)–(10).

2.3. Problem Definitions

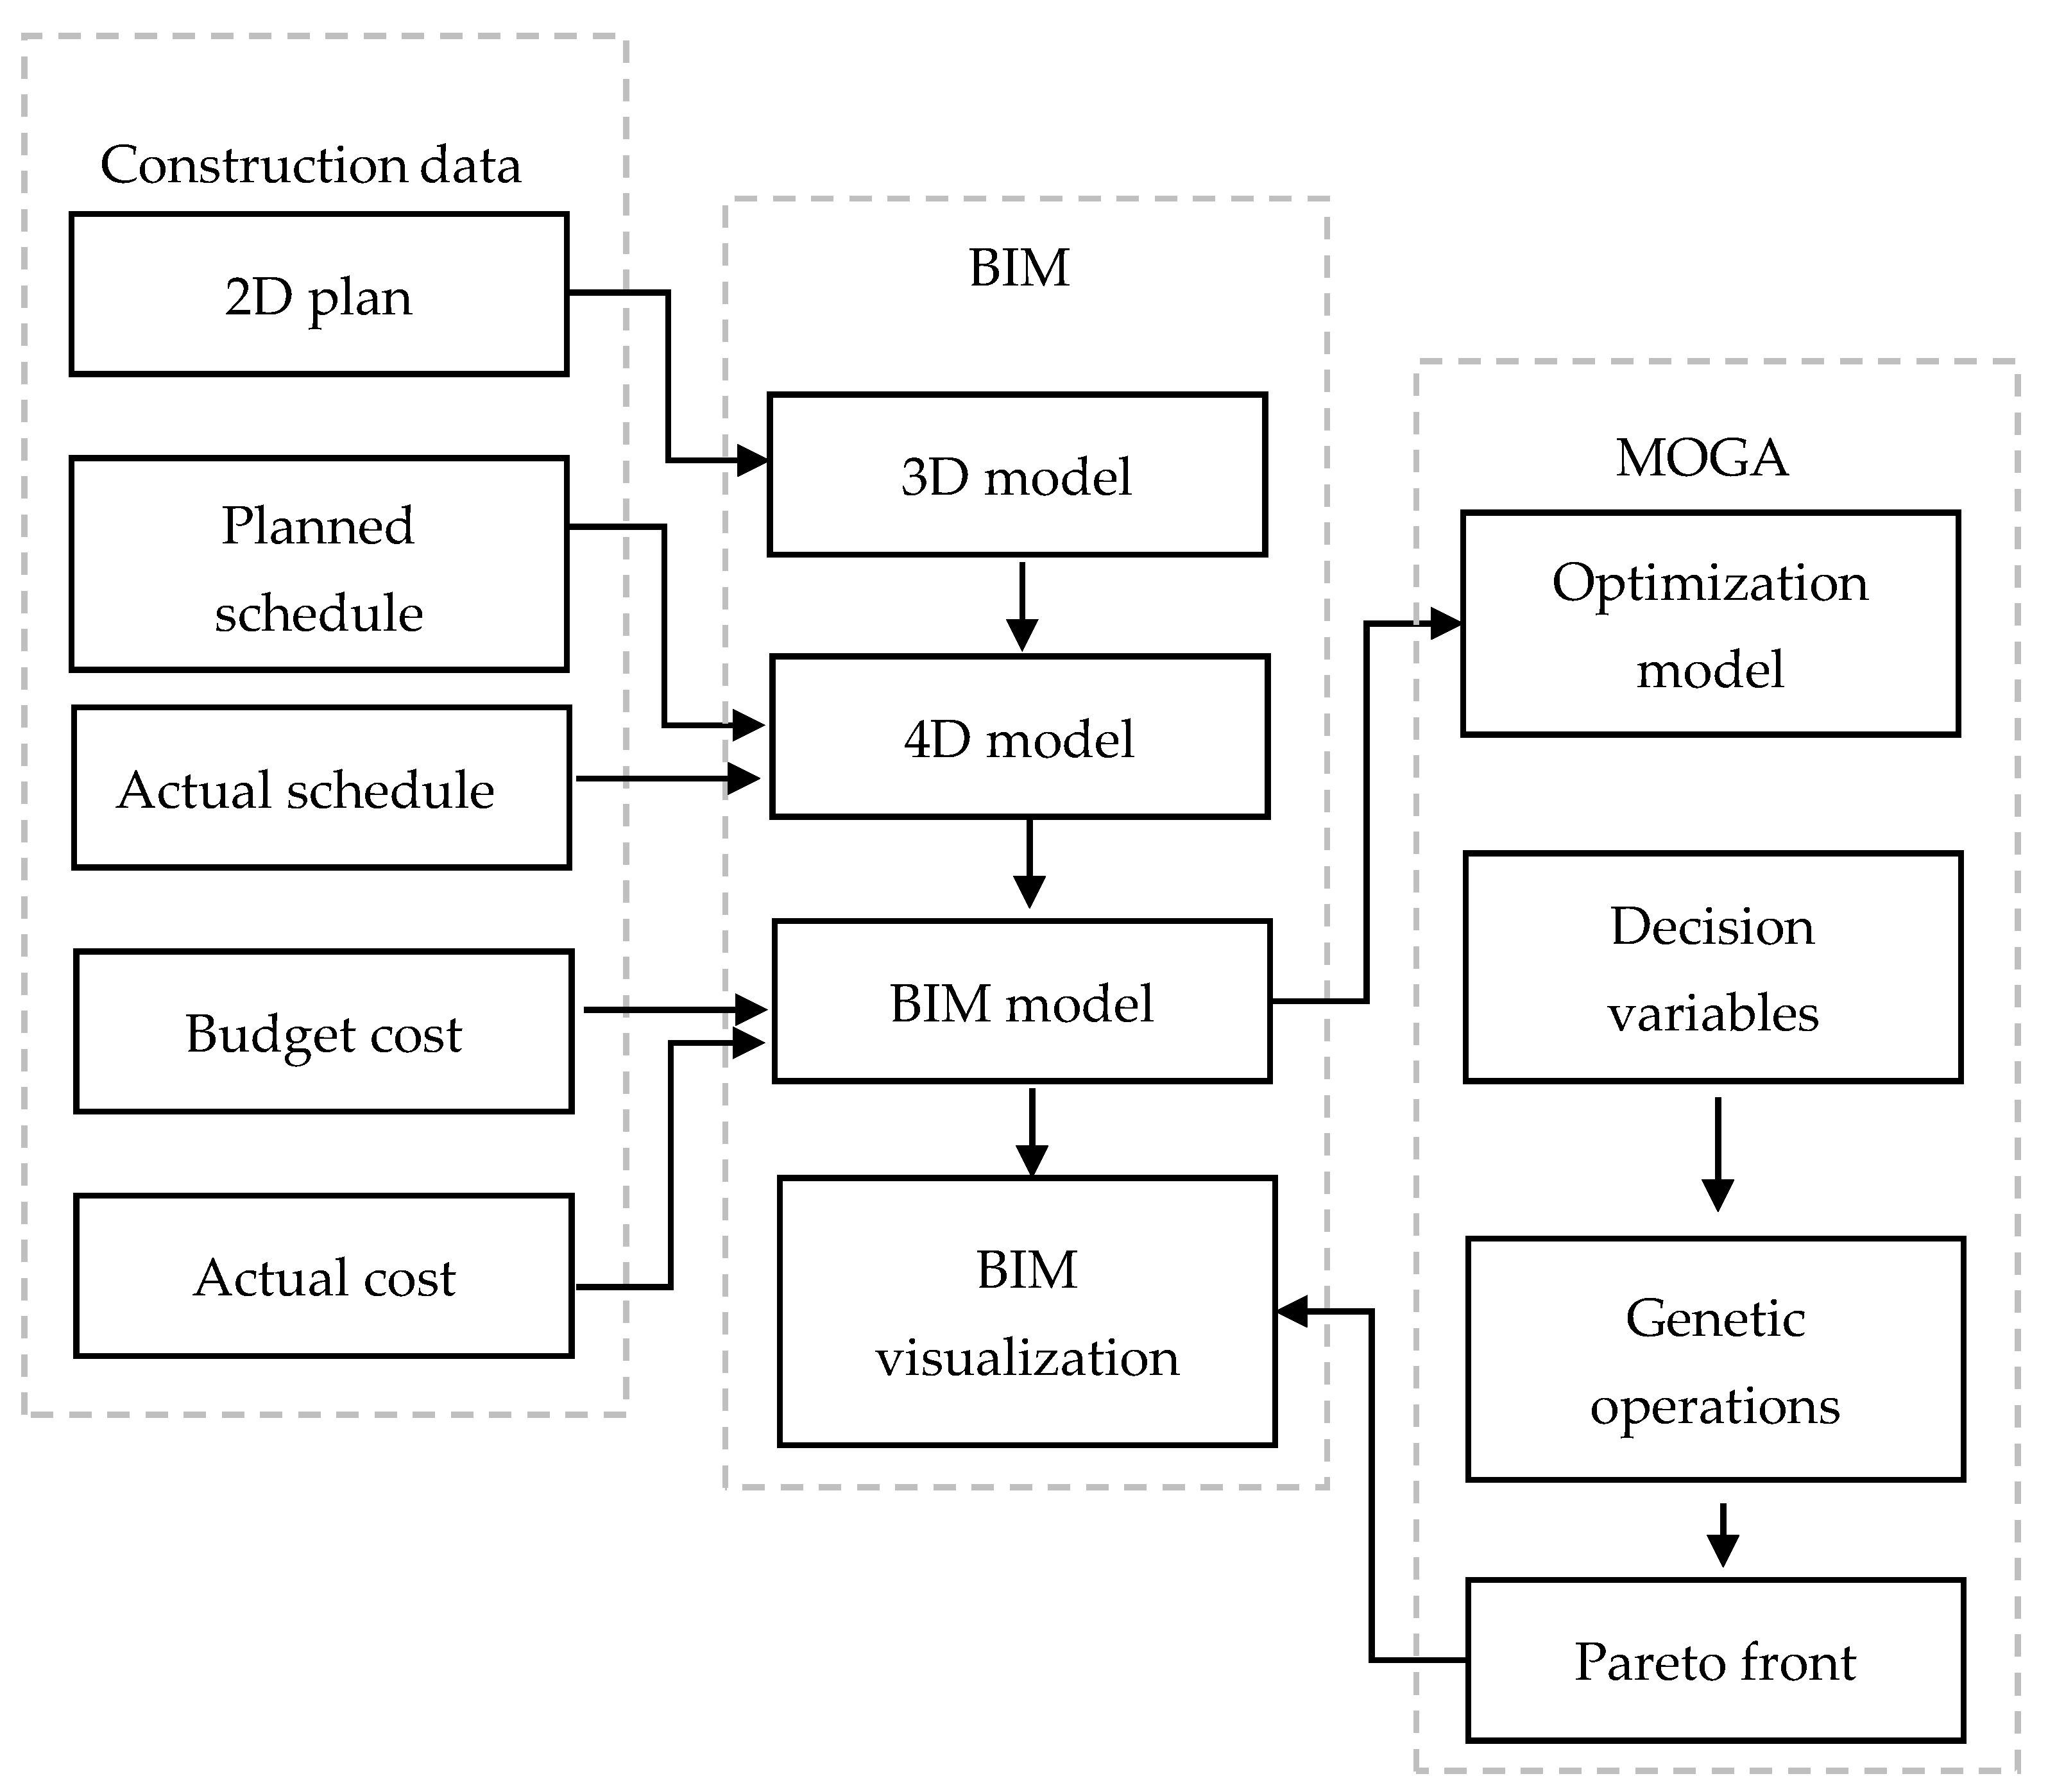
Optimizing project cost, duration, and resource usage while maintaining the BIM data collection is crucial for this research. Typically data in the BIM model itself are interconnected to the 3D model and schedule to enable 4D modeling with an automatic update of scheduling information. However, when dealing with a complex solution, BIM requires external optimization tools and needs to leave the BIM data pipeline. This causes redundant manual tasks which are prone to error. The goal was to optimize those objectives and exchange data back and forth via BIM. To satisfy these requirements, the BIM model can be used to embed information into a three-dimensional representation [40,49] and then connect to the multi-objective genetic algorithm (MOGA) to solve multi-objective problems. At the end, optimal Pareto front is provided for decision-makers instead of static objective weights for cost, duration, and resources.

2.4. BIM-MOGA Model

In this section, the development of BIM-MOGA is described. After retrieving project information and constraints from the BIM model, which is prepared in Excel spreadsheet format, the spreadsheet is created by formulating actual construction time, resource utilization fluctuation, and total cost calculations, as shown in the following subsections. It is then transferred to the MOGA module. These two modules are connected by Activity ID. A Python-based modeling tool was written to automate the MOGA process. The MOGA process solves multi-objective optimization problems using GA. In doing so, a Pareto front must firstly be defined. Once the Pareto front has been defined, the best solution will then be chosen by the decision-makers. The renovation scheduling was generated by Microsoft Project. After that, the researchers exported the file to Autodesk Navisworks and exported the BIM model from Autodesk Revit to Autodesk Navisworks in order to create a 4D BIM for the renovation project. This allowed the concerned parties to monitor the process and reduce workloads and conflicts while working at the site. It also helped improve collaboration between the concerned parties. Each related part is explained in detail in the following sections.
The proposed model is a multi-objective optimization for minimizing project duration, cost, and resources simultaneously. The steps to generate an optimized schedule are illustrated in Figure 5.

3. Optimization Model

The optimization model was developed and organized into three main modules: (1) Initialization Module: Construction data are calculated, i.e., an initial project schedule and the number of total float days, (2) BIM Module, and (3) MOGA Module. These three main modules are described in more detail, as follows.

3.1. Initialization Module

There are three main calculations for this module, as listed in the following subsections.

3.1.1. Actual Construction Time (Ta) Calculations

The calculation used construction data from each activity and project calendar constraint, i.e., activity duration (Di), activity sequence, and exception date (ei) from the baseline schedule. The precedence networks were created using the Precedence Diagram Method (PDM). In the PDM, there are four precedence relationship constraints: Finish to Start (FS), Start to Start (SS), Finish to Finish (FF), and Start to Finish (SF), with overlapping time (Li). The PDM calcuation procedure used sequential forward and backward calculations via the network to calculate the early start times (STi) to early finish times (FTi), and late start times (LSi) to late finish times (LFi) for each activity. From these values, actual construction time (Ta) and total float time (TFi) were determined using Equations (1) and (2):
Ta = Max FTi
T F i = L F i F T i D i e i + 1

3.1.2. Resource Utilization Fluctuation (Mx) Calculations

The resource utilization fluctuation, also known as the static moment, Mx, was calculated by summing the total numbers of daily fluctuations in Equations (3) and (4):
M x = t = 1 T [ N u m b e r   o f   w o r k e r s   p e r   d a y   t ] 2
N u m b e r   o f   w o r k e r s   p e r   d a y   t = i = 1 n ( Q i D i   x   P D R i )
where n is the total number of activities in day t, Qi is the quantity of activity i, Di is the duration of activity i, PDRi is the productivity rate of the worker for activity i, and T is the total number of project working days.

3.1.3. Total Cost (Ct) Calculations

Total cost (Ct) was calculated using Equation (5), which is referred to as direct cost (DC), indirect cost (IC), and late penalty fee (LPF). DC was calculated using Equation (6), which includes material cost and labor cost, and related costs including freight and transportation. Material cost was a function of material quantity from the BIM model, as shown in Equation (9), and labor cost was the function of daily payrate of workers, as shown in Equation (10). Indirect costs were majorly calculated as overhead cost based on working time with a project delay causing surplus indirect cost. IC was calculated using Equation (7) and LPF was calculated using Equation (8).
Ct = DC + IC + LPF
DC = MC + LC
IC = Indirect factors × Ta
LPF = Daily penalty fee × (TaTc)
where Tc is the contract construction time.
M C = i = 1 N [ M a t e r i a l   c o s t   u n i t   r a t e i   x   Q i   ]  
L C = t = 1 T a [ N u m b e r   o f   w o r k e r s   p e r   d a y   t   x   P a y   r a t e   t   ]  

3.2. BIM Module

Once the construction data were calculated, they were transferred to the BIM module. BIM enabled the concerned parties to see the 3D visualization of the project in its current stage. A collision check was conducted before the start of the construction to identify any visible clash between building elements. The schedule planning was correlated with the model. The BIM-based schedule was integrated to the 4D model and used as a visualization tool. The Activity ID generated by the 4D BIM was used to link schedules with 3D objects. To create the actual construction stimulation, actual work start time and end time were fed into the model. Resources and cost were also monitored. The “BIM Model” was used during the process as a dynamic management process simulation of project progress. A baseline schedule providing required BIM data was subsequently imported to the optimization module.

3.3. MOGA Module

The MOGA module starts by defining optimization objectives, constraints, and project parameters. The parameters which were retrieved from construction data were project activities, activity predecessors, successors, resource availability, cost data, and project calendars. Then, a genetic algorithm optimizer was employed. Once the MOGA process is complete, several optimal solutions are obtained as a Pareto front. The data is then used in BIM for scheduling, budgeting, and planning for different optimal alternatives. This allows a decision-maker to select an optimum solution from a set of solutions based on construction project constraints.

3.3.1. Optimization Model

Considering the multi-objective optimization problem with different scales and units, the nondominated sorting genetic algorithm 2 (NSGA-II) [50] was adopted in order to minimize the three objectives listed in Equations (11)–(13). Furthermore, because of deficiencies with respect to depicting the optimal Pareto front, the weighted-sum genetic algorithm approach [51] was not an option for the multi-objective optimization problem. Several optimal solutions for multi-objective problems were obtained with the following objectives and constraints.
Objectives:
Minimize f1(s, x): Ta
Minimize f2(s, x): Ct
Minimize f3(s, x): Mx
where Ta is the actual construction time, Ct is the total cost, Mx is the worker utilization fluctuation moment, s is the shifting time set, and x is the predecessor option set.
Constraints:
T a   M a x i m u m   C o n t r a c t   d a y s
r x t M W A x
L P F 10 %   o f   C o n t r a c t   p r i c e
where r x t is the worker demand type-x on day t, M W A x is the maximum worker availability of resource type x, and LPF is the late penalty fee.
This study considers four types of resource, namely general workers, skilled carpenters, sanitary plumbers, and electricians. LPF was calculated from the construction contract, and was not allowed to be greater than 10% of the total contract cost, otherwise the contract will be terminated.

3.3.2. Decision Variables

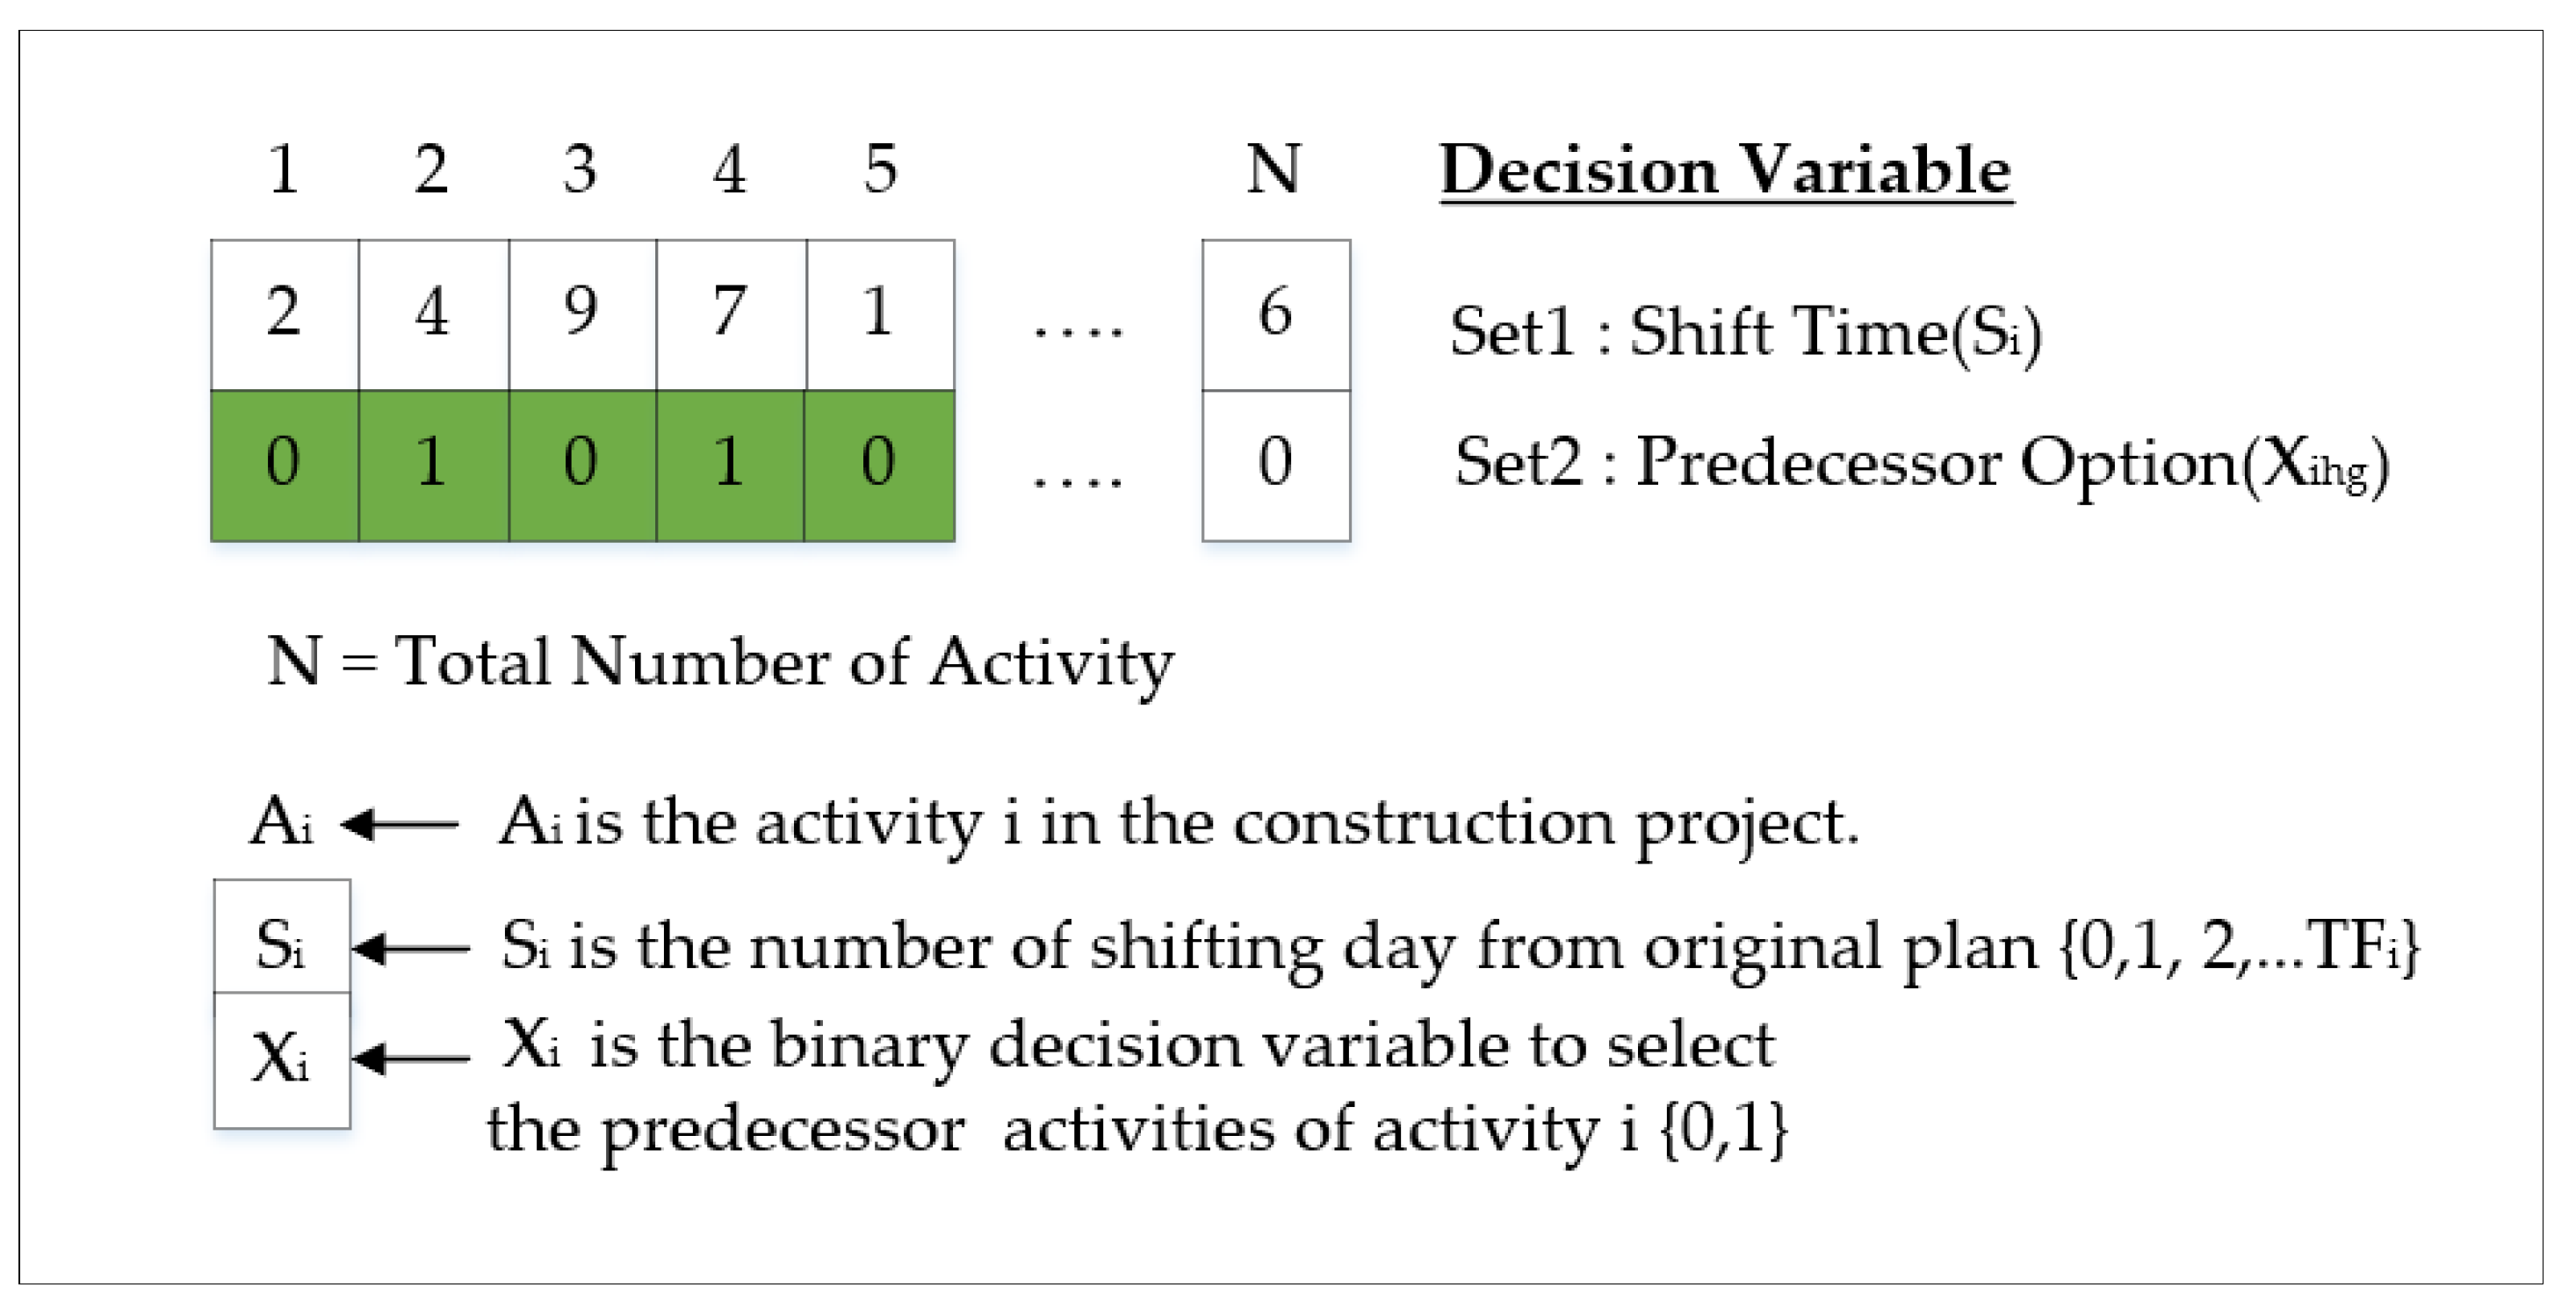
Each solution comprises an N number of blocks, as displayed in Figure 6. Each block represents individual problem decision variables providing two different values. The first value is the number of shifting times from the original plan, while the second value is a predecessor activity option.
0 S i T F i
0 x i h g 1
where Si is the shifting time of activity i, TFi is the total float of activity i, and Xihg is the predecessor option between h or g of activity i.
Initial decision variables are a dataset where:
Set1:
Defines shifting time and sets lower and upper bounds
(Si = 0 to total float of activity i)
Set2:
Defines predecessor option (Xihg) and sets lower and upper bounds
(Xihg = [0, 1])
The predecessor option is defined (Xihg) and optimal scheduling is now processed by considering both Set1 and Set2 options. The Set2 option is proposed based on the renovation project characteristics, including additional levels of uncertainties and particular management issues. If the interactive planner’s viewpoint is obtained, selecting the Set2 option can provide more efficient optimal scheduling. The shifting time and predecessor option are two sets of decision variables with 250 total number of activities for all decision variables. The population size is chosen as 500, as suggested in previous research for double or quadruple design variables [52].

3.3.3. Genetic Operations

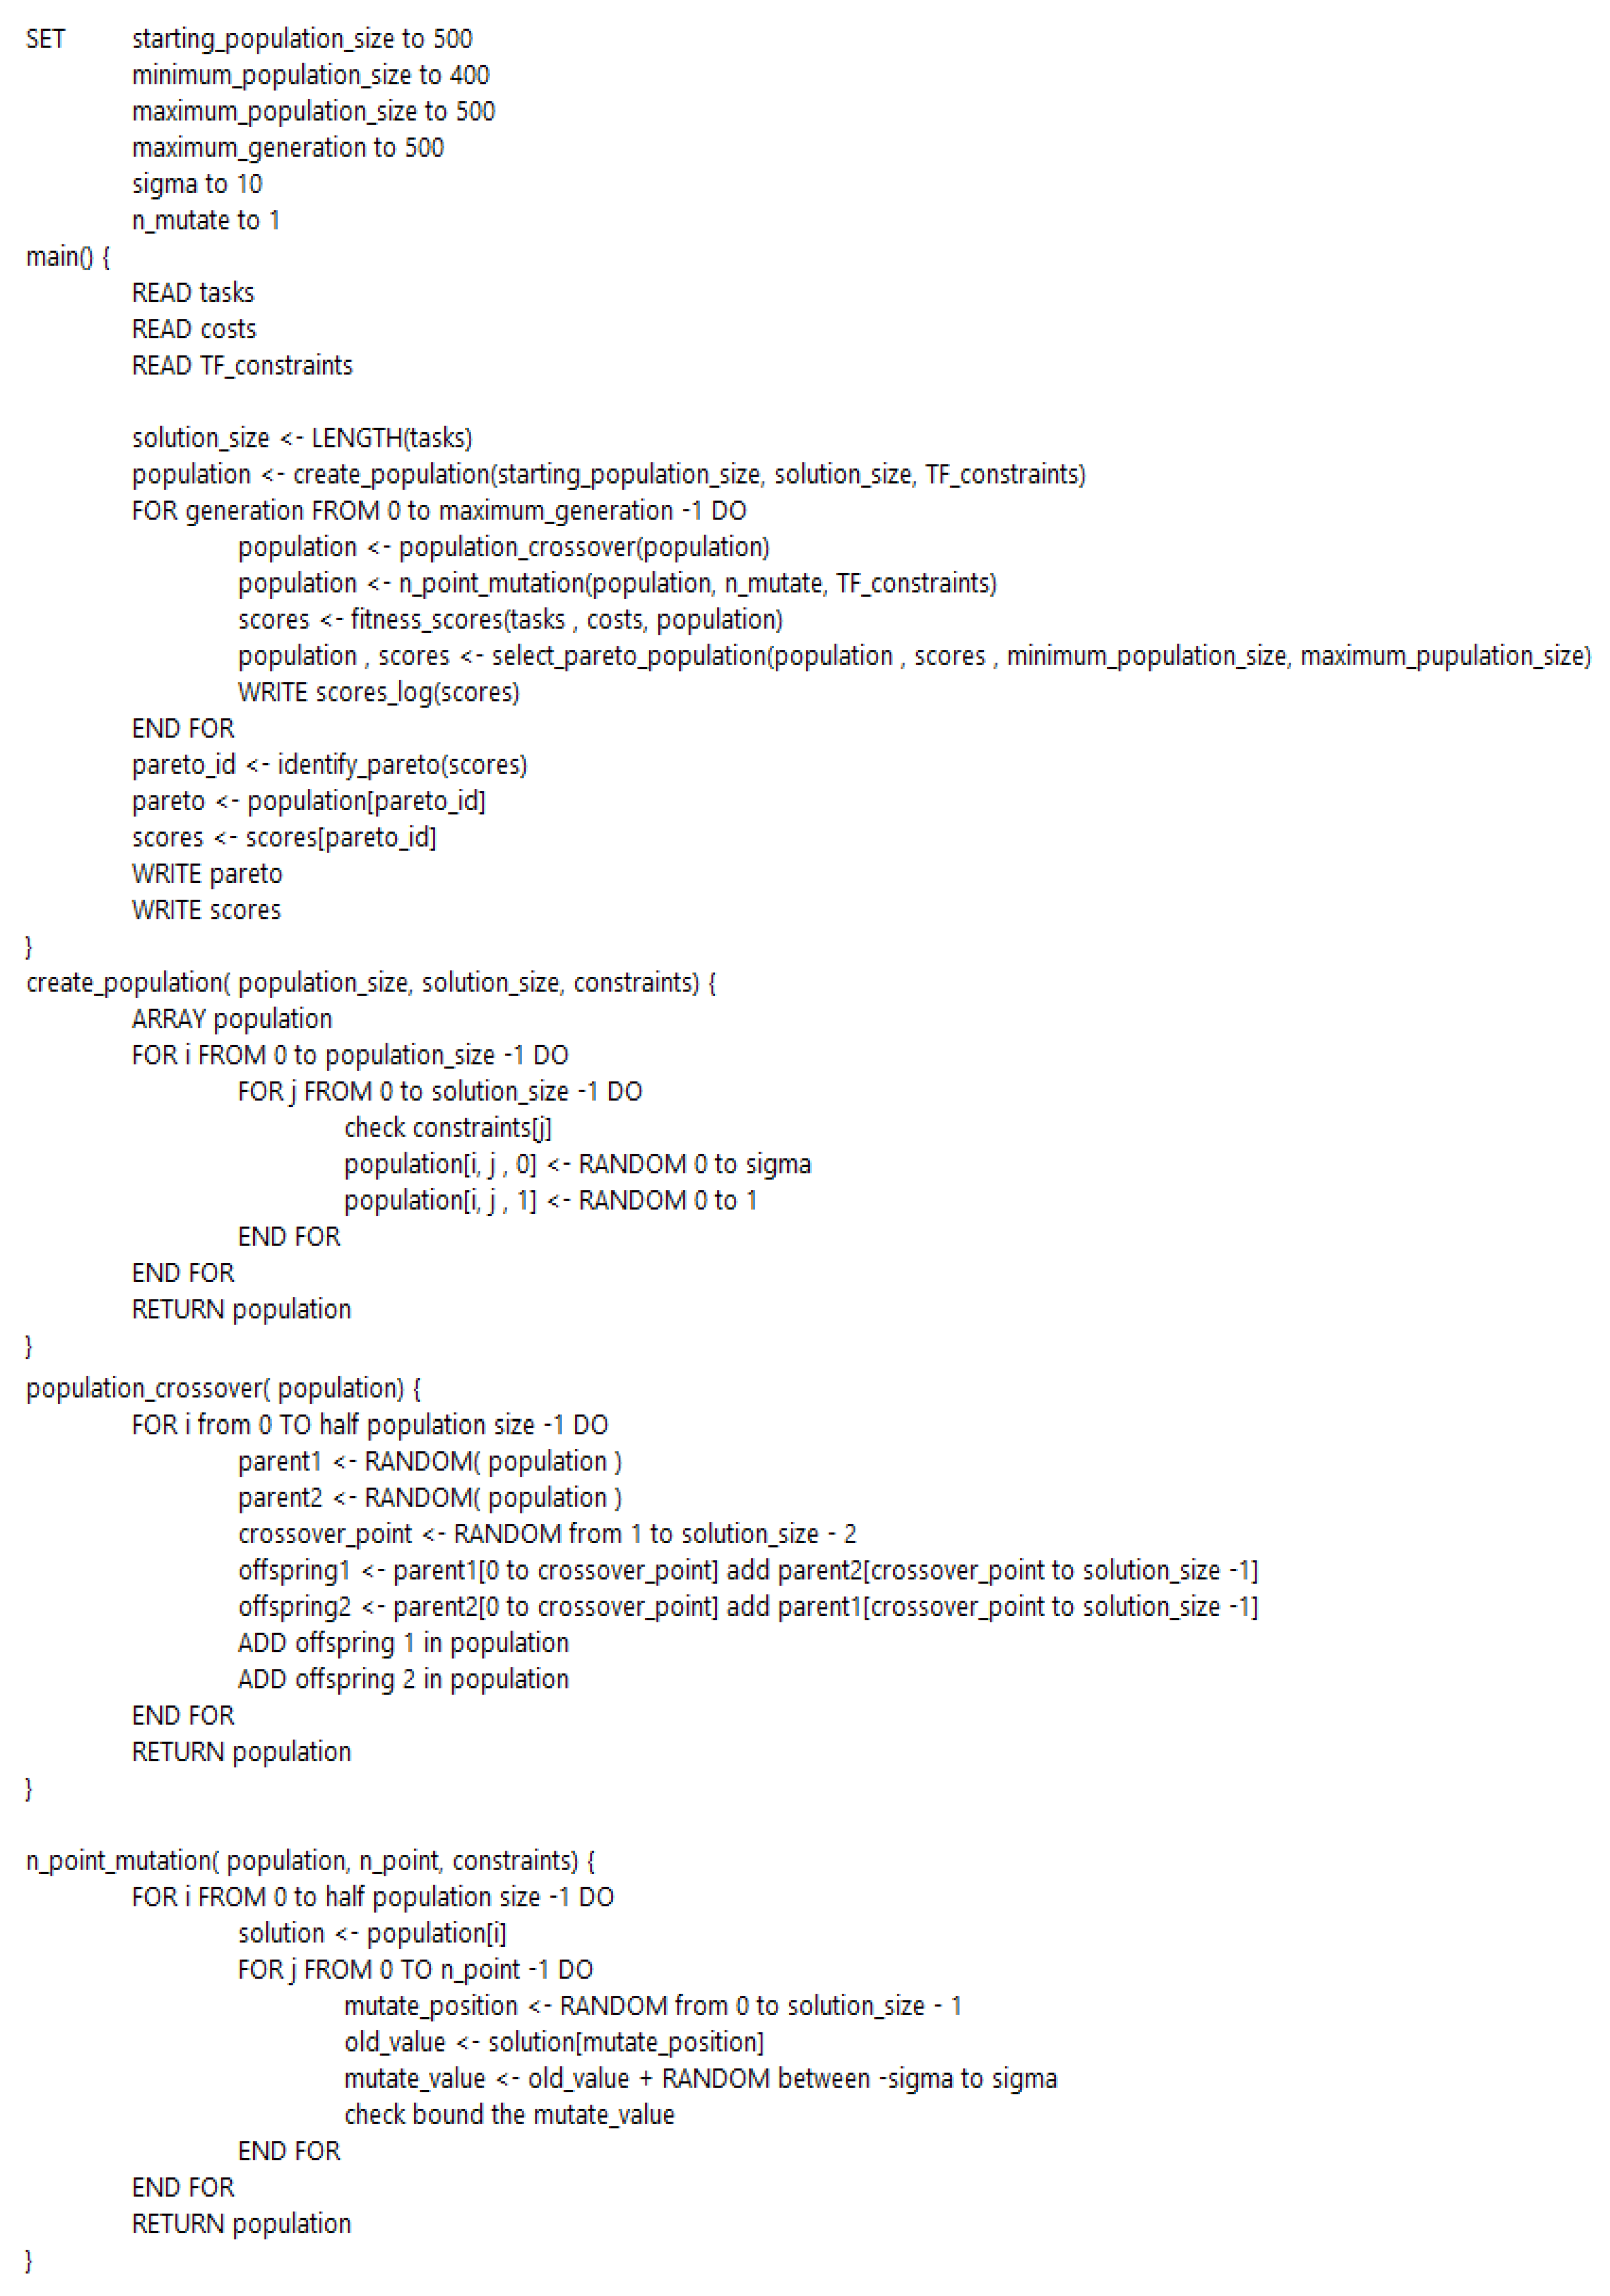
By performing GA operator, a next generation population is created based on fitness value calculations using GA, including a selection, crossover, and mutation. The selection technique depends on a uniform random mechanism. The crossover is performed using a one-point crossover routine. The mutation is performed by uniform randomization around old variable values. The number of mutations proportionally changes based on the setting of the mutation rate between the value of 0 and 1 [53]. The GA steps are listed below, with the pseudocode displayed in Figure A1 in the Appendix A.
  • Population creation: in each solution, the shifting time set values (Set1) and predecessor option set values (Set2) are randomized. Set1 is uniformly randomized from 0 to a sigma parameter value, while Set2 is uniformly randomized from 0 to 1. From continuous adjustment, the sigma parameter value in this research was set at 10, which is within the upper and lower bounds.
  • Parent selection: the uniform random technique is used to select two parents with equal selection probability. After the parents are selected, they breed with the one-point crossover method.
  • Crossover: one crossover point is selected randomly with the one-point crossover method. The initial solution values are copied from the first parent, while the other solution values are copied from the second parent.
  • N-point mutation: this paper also proposed an n-point mutation technique to reduce computation complexity. The technique initially selects n number of decision variables in a solution by uniform randomization. Then, they are mutated by uniform randomization around old values with upper and lower bounds. The upper bound is the old value that adds the sigma value, while the lower bound is the old value that subtracts the sigma value. If the mutated values are out of bounds, then the value is uniformly randomized in possible value bounds. The parameters set, in this research, were n as 1 and possible values were between 0 and TF value. However, if the shifting time was out of bounds, the sigma value was used instead.
  • Fitness calculation: the NSGA-II algorithm is used to calculate fitness scores, which are used to find non-dominated solutions, called a Pareto front. A challenge of the fitness score calculation in this research was the requirement for the PDM network to re-create everytime after mutation, resulting in complexity of the computation.
  • Pareto front selection: the Pareto front selection uses the crowding distance technique to reduce the number of Pareto front which is over the upper bound. This is based on a tournament of crowding distances.
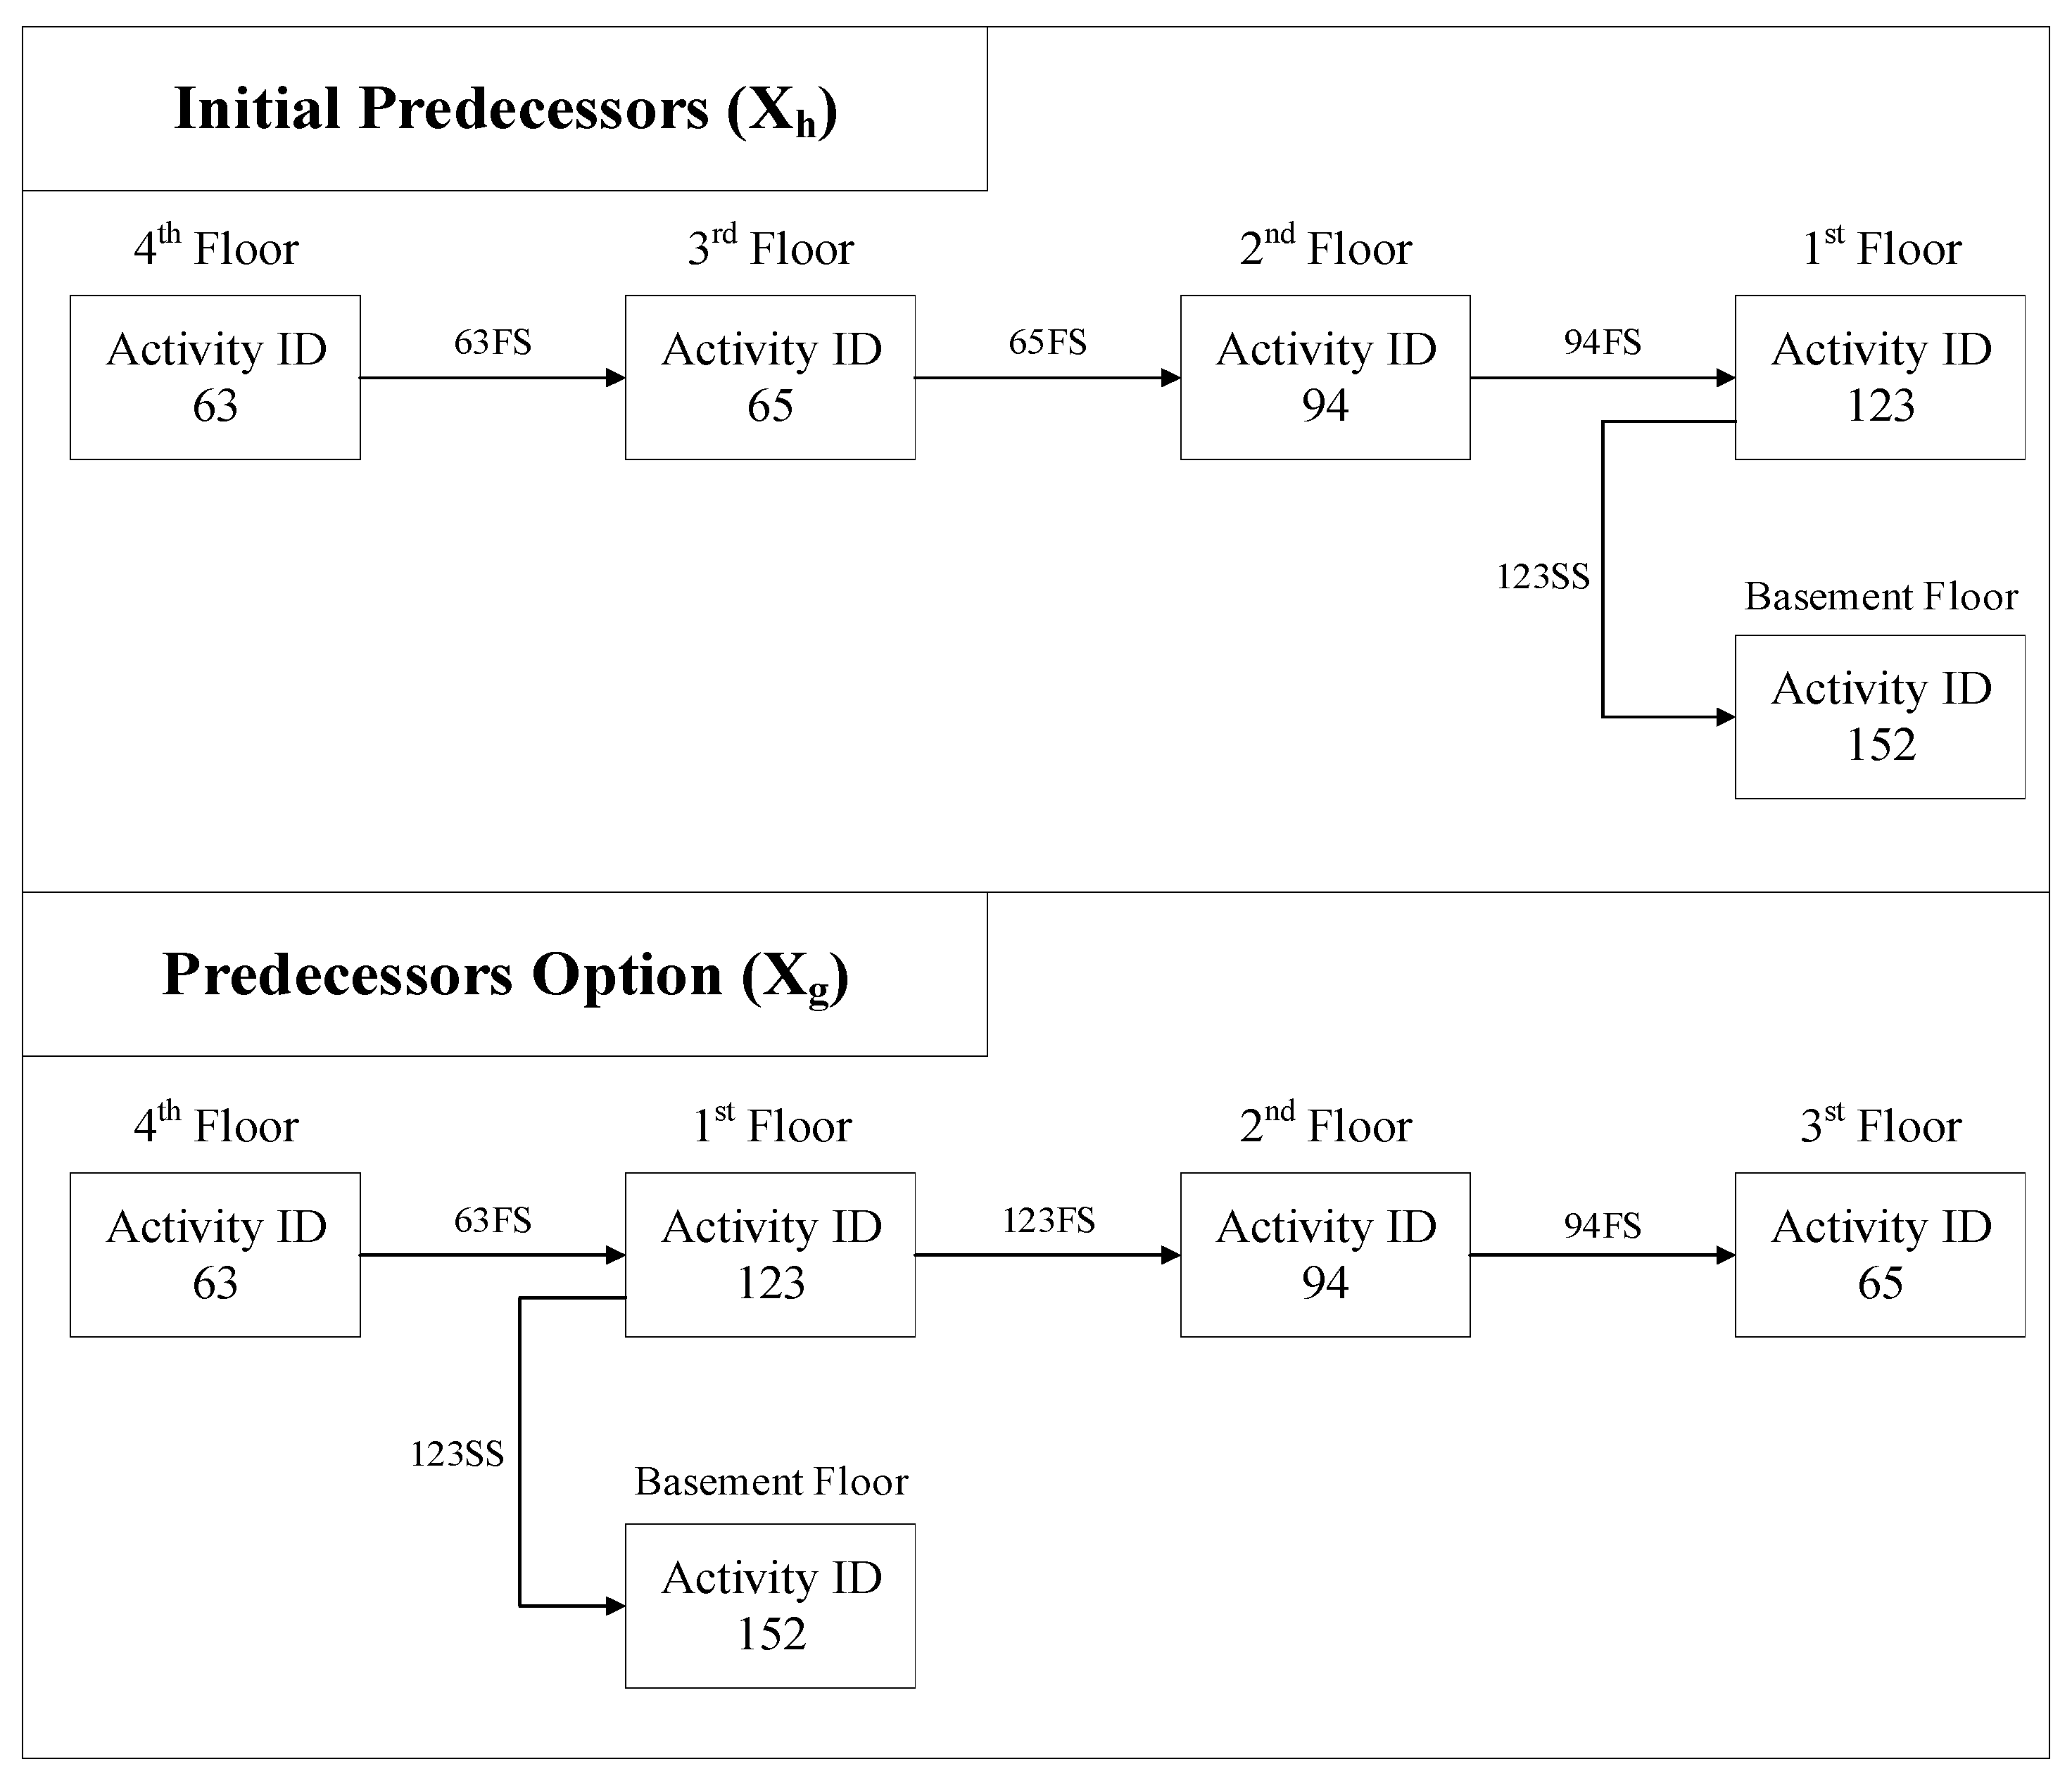
  • Predecessor option (Xihg): In renovation projects, construction phases are normally considered based on work spaces. This is also defined as Set2 decision variables. Figure 7 illustrates the initial predecessor (Xh), where construction sequences start with the 4th floor, followed by the 3rd, 2nd, and 1st floors, and then the basement. A suggestion of renovation sequences is displayed as an alternative (Xihg). The renovation starts from the 4th floor, followed by the the 3rd, 2nd, and 1st floors, while simultaeneously working on the basement.

4. Results

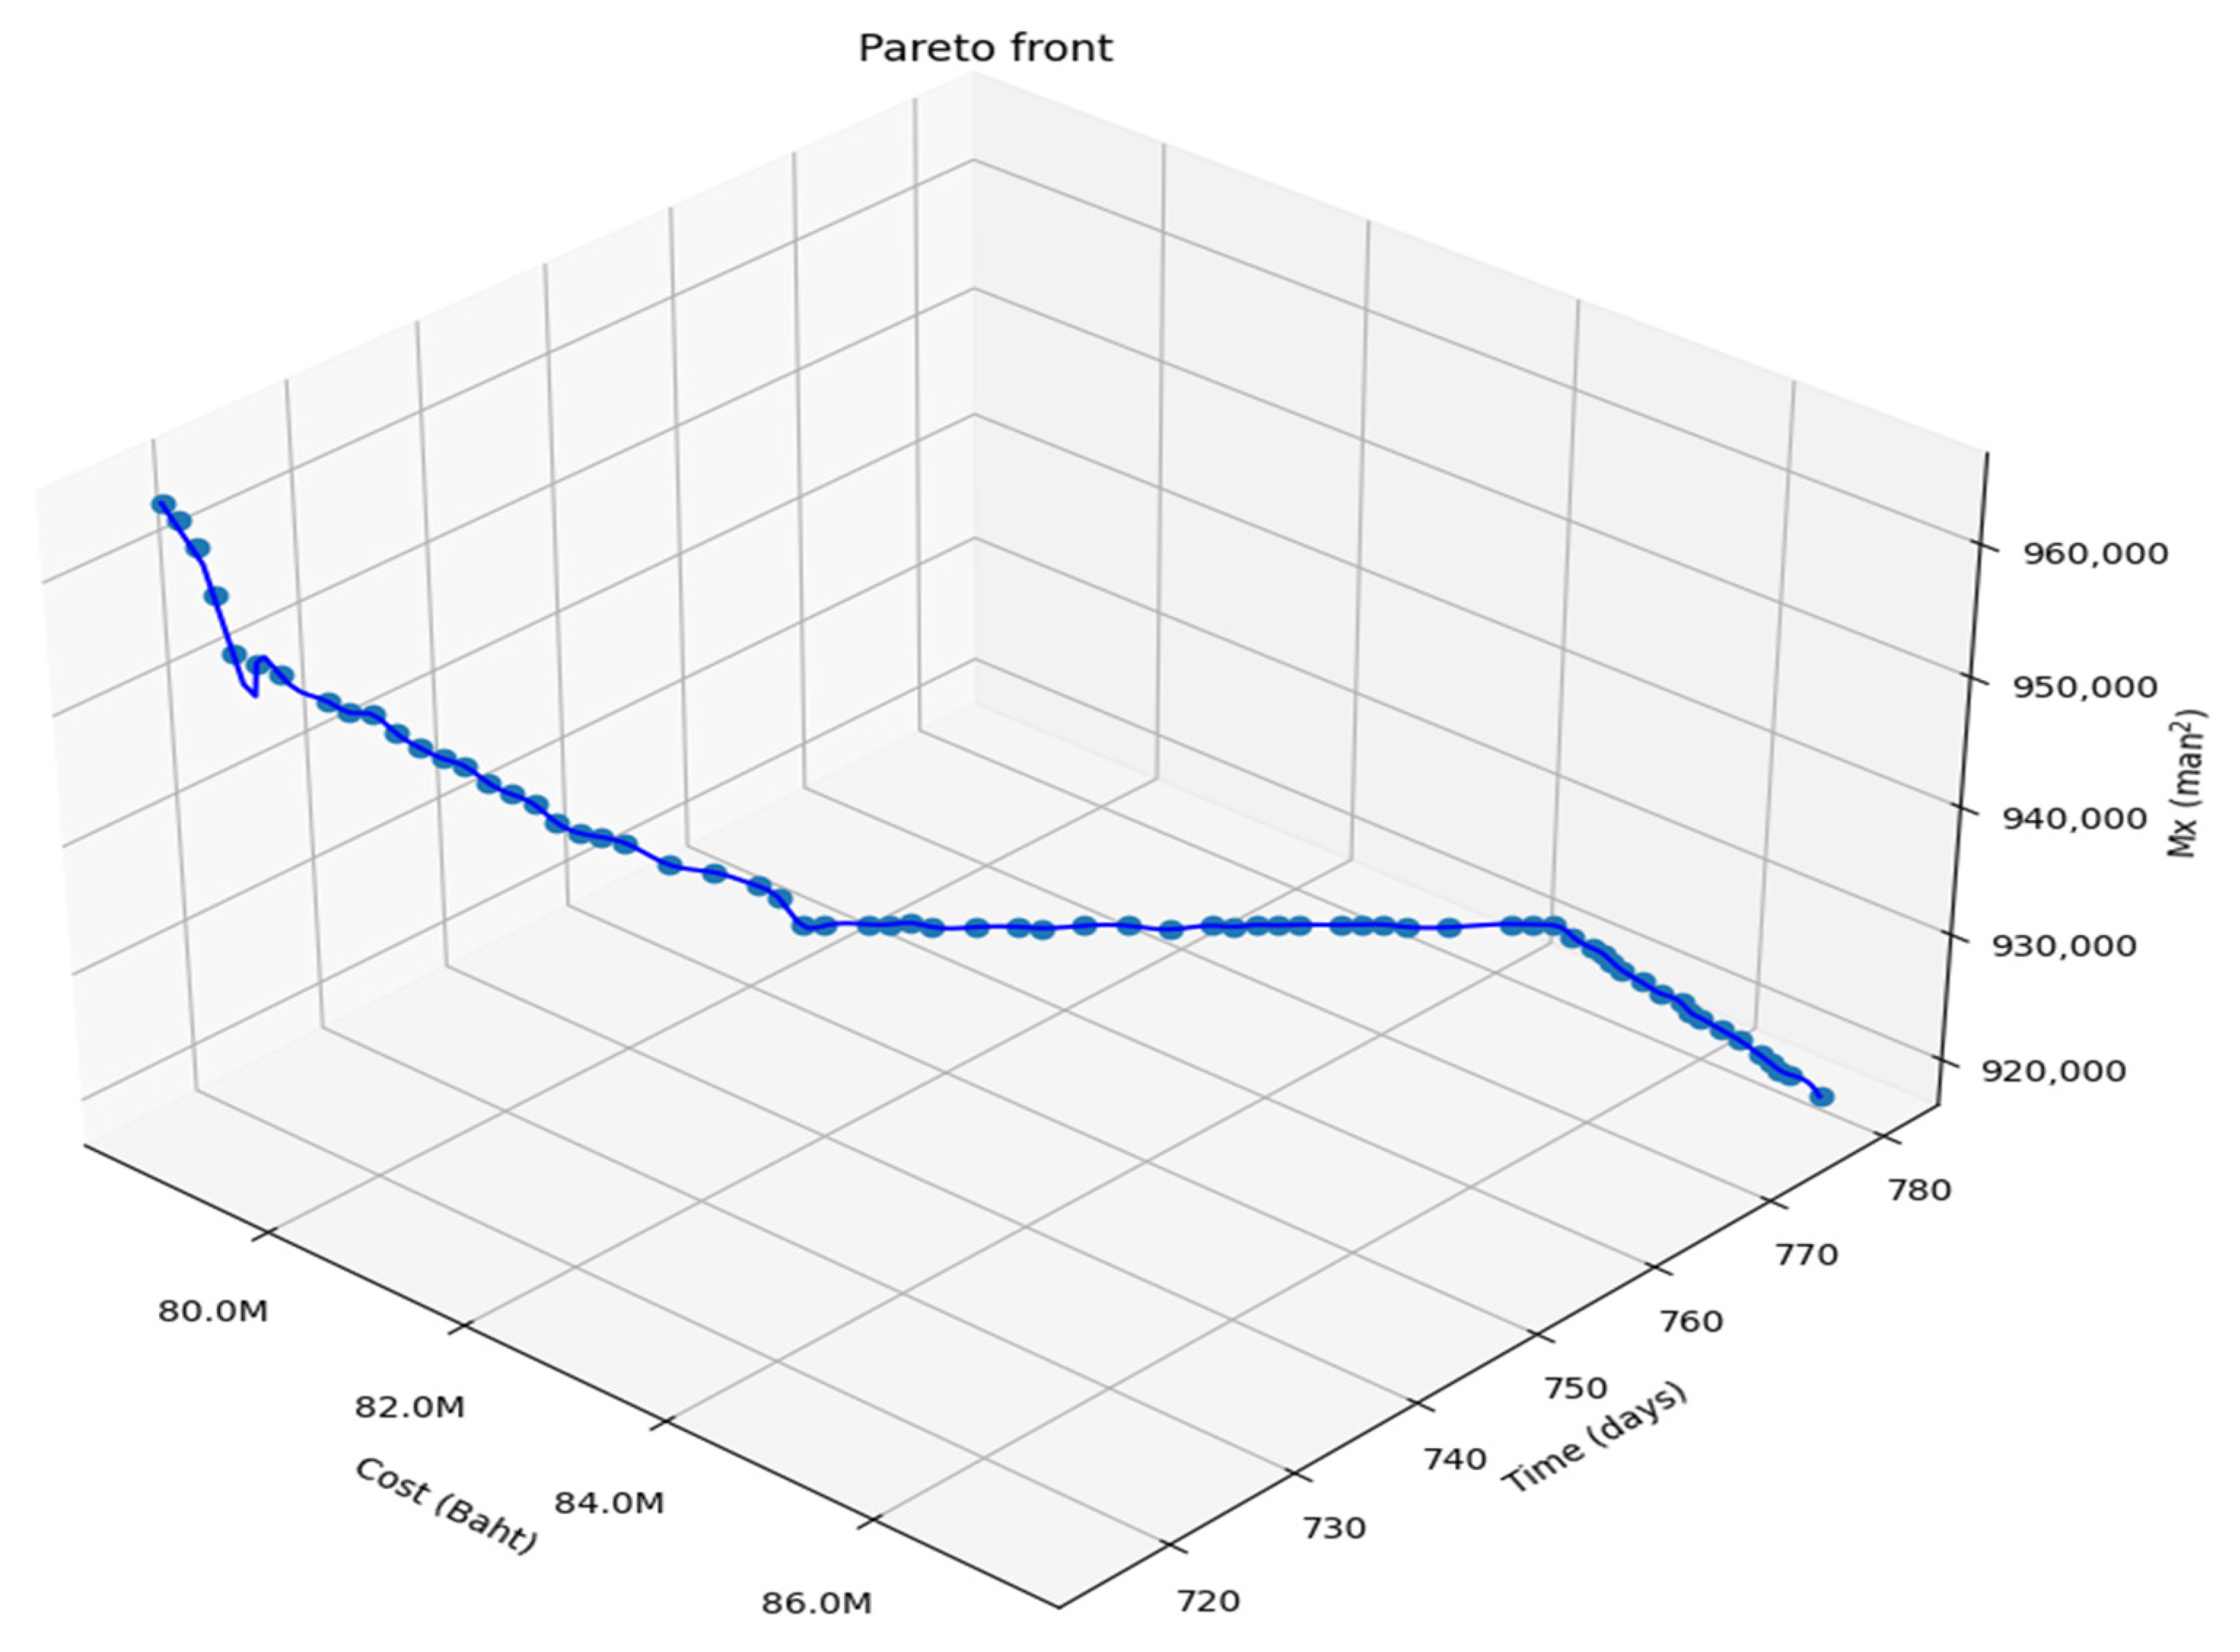
A Pareto front displays optimum points of the proposed BIM-MOGA model. The data were analyzed and coded in Python with the library of Pandas, Numpy, and Math [54]. The Pareto front was calculated based on the relationship between time, cost, and resource utilization fluctuation moment (Mx), with parameters and values listed in Table 1.
Figure 8 presents data in the Pareto front for the optimal solutions with the axes of total cost, time usage, and resource allocation. The charts in Figure 9 are separated into three different objective pairs.
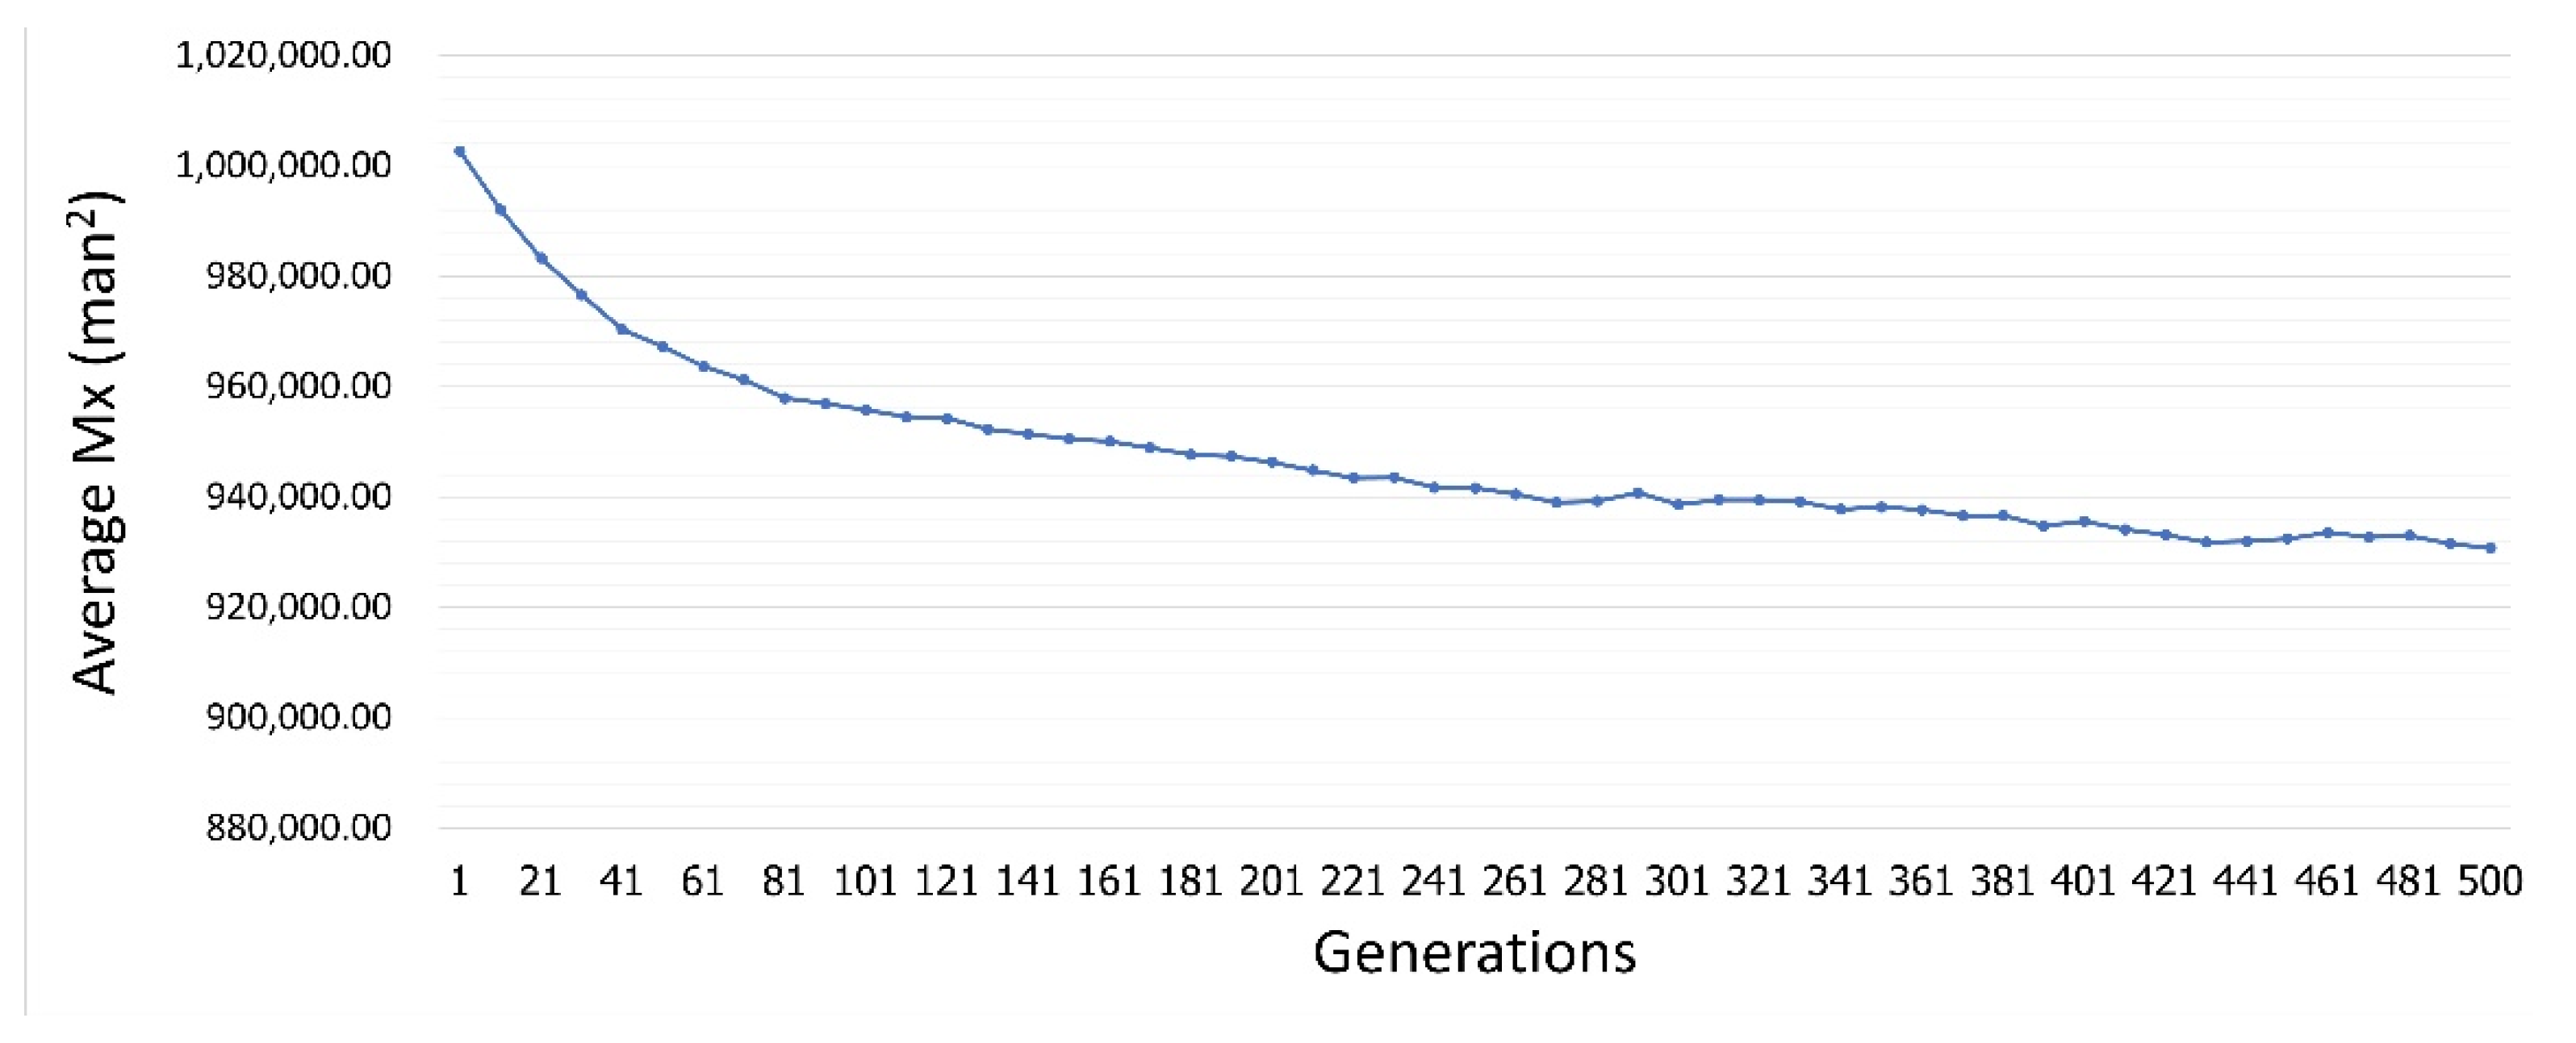
There are 70 total numbers of optimal solutions, as displayed in Table 2. Due to the construction contract termination, optimal solutions for a duration over 780 days are removed. The ability to extend the duration without contract termination would result in better outcomes for both cost and resources fluctuations. Figure 10 displays optimal resource fluctuation moment over GA generations.
Pareto front gives numbers of optimal plans which could be appropriate options for the project manager to make a decision. Cost, time, and resource utilization fluctuation were considered as the objective functions. These parameters need to be correlatively considered to generate the optimal scheduling. Moreover, they were also considered as constraints in the optimization process.

5. Discussion

This study shows the possibility of applying BIM-MOGA to complex construction projects. It provides optimization data for a project manager to make decisions based on existing data underneath the project during the project life cycle. NSGA-II is a simple MOGA algorithm which is easy to understand and implement.

5.1. Cost

Cost is one of the analyzed factors displayed in an axis of the Pareto front chart. It relates directly to project time and resource utilization fluctuation. This relationship is depicted as a renovation process where cost data is varying according to time, visualized by 4D BIM. Although indirect costs are changed based on the project time, fluctuation of resources causes both direct and indirect costs. These relationships are clearly organized by using the BIM-MOGA technique to produce optimum solutions based on minimizing total cost. This is useful for the project with limited cost, especially the govermental project under a lumpsum contract.

5.2. Time

Time generally has an inverse relationship with cost in construction projects, while resource utilization fluctuation can have a positive or negative relationship with the time. The Pareto front displays optimized solution between these relationships. Minimum time shown in Table 2 can be reduced by either changing time constraint (i.e., predecessor option and activity relationship) or resource constraint (i.e., resource availability). This is useful for the project with limited time preventing delay liquidated damages or penalties.

5.3. Resource Utilization Fluctuation (Mx)

Resource utilization fluctuation (Mx) is an effective improvement in the process. It can have either positive or negative impacts on both cost and time factors. Pareto front displays optimum results retrieved from BIM-MOGA. This is useful for further analysis, such as human resource risk management.
Table 3 displays an example of a comparison between the original plan and an optimal plan with a set of selected data from the Pareto front. The optimal plan is selected based on the original cost with the maximum time without delay in order to avoid blacklisting for a following governmental project. When considering the cost and time of both plans, which are equal, it shows that the optimized Mx objective is clearly better than the non-optimized Mx objective. This means we can reduce worker density on the construction site, leading to reduced risk-related worker factors. Furthermore, there are many optimal plans for utilizing that are better than one original plan.

6. Conclusions

This paper provided a systematic BIM-based multi-objective genetic algorithm approach for construction planning and scheduling of renovation projects. The results showed a potential application of a multi-objective optimization problem using BIM with MOGA. The outputs displayed several alternatives for different scenarios for further analysis. It creates opportunities for construction experts to develop more robust and efficient tools for construction planning and scheduling using a combination of existing BIM along with MOGA in professional practice. The construction process will benefit from useful information for better decision-making depending on the strategies based on the Pareto front data provided.
It was simulated for a governmental project of an extra-large building renovation between 2018 and 2020. Direct and indirect project costs, actual scheduling, and resource usage were tracked and retrieved by the researchers. After the information was modeled as a BIM-based MOGA, the optimization results were displayed as a Pareto front with 70 combinations among total cost, time usage, and resource allocation. The increase in generation provided better results, as shown in Figure 10, which this research used at 500 generations. BIM and MOGA worked together through standard spreadsheet files, such as .xls, .xlsx, and .csv extensions. The standard file formats are easy for reading, editing, and sharing, which is beneficial when the model’s results need to be sent and the receiver only has standard spreadsheet programs such as Microsoft Excel, Google Sheets, Smartsheet, or Numbers.

Author Contributions

Conceptualization, P.N., M.K. and P.C.; methodology, P.N., M.K. and P.C.; validation, P.N., S.N. and W.B.; formal analysis, S.N. and W.B.; investigation, M.K. and P.N.; data curation, P.N.; writing—original draft preparation, P.N. and S.N.; writing—review and editing, M.K., P.C. and K.P.; visualization, P.N. and S.N.; supervision, M.K. All authors have read and agreed to the published version of the manuscript.

Funding

This research received no external funding.

Institutional Review Board Statement

Not applicable.

Informed Consent Statement

Not applicable.

Data Availability Statement

Data available on request due to restrictions, e.g., privacy or ethical.

Acknowledgments

The authors would like to express our gratitude to Chiang Mai University Library, Optimization Theory and Applications for Engineering SYStems Research Group (OASYS), and Chiang Mai University for all valuable assistance. We also would like to give special thanks to Information Technology Services Center (ITSC), Chiang Mai University for supporting processing computers.

Conflicts of Interest

The authors declare no conflict of interest.

Appendix A

Figure A1. Main loop pseudocode.
Applsci 11 04716 g0a1

References

  1. Olawale, Y.A.; Sun, M. PCIM: Project Control and Inhibiting-Factors Management Model. J. Manag. Eng. 2013, 29, 60–70. [Google Scholar] [CrossRef] [Green Version]
  2. Marle, F.; Vidal, L.-A. Managing Complex, High Risk Projects. Manag. Complex High Risk Proj. 2016. [Google Scholar] [CrossRef]
  3. Czmoch, I.; Pękala, A. Traditional Design versus BIM Based Design. Procedia Eng. 2014, 91, 210–215. [Google Scholar] [CrossRef]
  4. Hardin, B.; Mccool, D. BIM and Construction Management ProvenTools, Methods, and Workflws, 2nd ed.; John Wiley & Sons, Inc.: Hoboken, NJ, USA, 2015. [Google Scholar]
  5. Azhar, S. Building Information Modeling (BIM): Trends, Benefits, Risks, and Challenges for the AEC Industry. Leadersh. Manag. Eng. 2011, 11, 241–252. [Google Scholar] [CrossRef]
  6. Mitropoulos, P.; Howell, G.A. Renovation Projects: Design Process Problems and Improvement Mechanisms. J. Manag. Eng. 2002, 18, 179–185. [Google Scholar] [CrossRef]
  7. Luo, L.; He, Q.; Jaselskis, E.J.; Xie, J. Construction Project Complexity: Research Trends and Implications. J. Constr. Eng. Manag. 2017, 143, 04017019. [Google Scholar] [CrossRef]
  8. Shiue, F.-J.; Zheng, M.-C.; Lee, H.-Y.; Khitam, A.F.; Li, P.-Y. Renovation Construction Process Scheduling for Long-Term Performance of Buildings: An Application Case of University Campus. Sustainability 2019, 11, 5542. [Google Scholar] [CrossRef] [Green Version]
  9. Dasović, B.; Galić, M.; Klanšek, U. A Survey on Integration of Optimization and Project Management Tools for Sustainable Construction Scheduling. Sustainability 2020, 12, 3405. [Google Scholar] [CrossRef] [Green Version]
  10. Lee, D.G.; Park, J.Y.; Song, S.H. BIM-Based Construction Information Management Framework for Site Information Man-agement. Adv. Civ. Eng. 2018, 2018, 5249548. [Google Scholar]
  11. Arayici, Y.; Aouad, G. Building information modelling (BIM) for construction lifecycle management. In Construction and Building: Design, Materials, and Techniques; Nova Science Publishers: New York, NY, USA, 2010; pp. 99–118. [Google Scholar]
  12. Li, J.; Wang, Y.; Wang, X.; Luo, H.; Kang, S.-C.; Wang, J.; Guo, J.; Jiao, Y. Benefits of Building Information Modelling in the Project Lifecycle: Construction Projects in Asia. Int. J. Adv. Robot. Syst. 2014, 11, 124. [Google Scholar] [CrossRef]
  13. Kocakaya, M.N.; Namlı, E.; Işıkdağ, Ü. Building Information Management (BIM), A New Approach to Project Management. J. Sustain. Constr. Mater. Technol. 2019, 4, 323–332. [Google Scholar] [CrossRef]
  14. Saad, M.; Baba, S.; Amoudi, O. A suggested solution to improve the traditional construction planning approach. Jordan J. Civ. Eng. 2015, 9, 185–196. [Google Scholar]
  15. Pūlmanis, E. Public Sector Project MANAGEMENT EFFICIENCY PROBLEMS, CASE OF LATVIA. Reg. Form. Dev. Stud. 2021, 11, 177–188. [Google Scholar] [CrossRef] [Green Version]
  16. Carbonari, G.; Stravoravdis, S.; Gausden, C. Building information model implementation for existing buildings for facilities management: A framework and two case studies. Build. Inf. Model. BIM Des. Constr. Oper. 2015, 1, 395–406. [Google Scholar] [CrossRef] [Green Version]
  17. Khaddaj, M.; Srour, I. Using BIM to Retrofit Existing Buildings. Procedia Eng. 2016, 145, 1526–1533. [Google Scholar] [CrossRef] [Green Version]
  18. Volk, R.; Stengel, J.; Schultmann, F. Building Information Modeling (BIM) for existing buildings—Literature review and future needs. Autom. Constr. 2014, 38, 109–127. [Google Scholar] [CrossRef] [Green Version]
  19. Mill, T.; Alt, A.; Liias, R. Combined 3D building surveying techniques-Terrestrial laser scanning (TLS) and total station sur-veying for BIM data management purposes. J. Civ. Eng. Manag. 2013, 19, 23–32. [Google Scholar] [CrossRef]
  20. Barazzetti, L.; Banfi, F.; Brumana, R.; Gusmeroli, G.; Previtali, M.; Schiantarelli, G. Cloud-to-BIM-to-FEM: Structural simulation with accurate historic BIM from laser scans. Simul. Model. Pract. Theory 2015, 57, 71–87. [Google Scholar] [CrossRef]
  21. Zhou, J.; Love, P.E.D.; Wang, X.; Teo, K.L.; Irani, Z. A review of methods and algorithms for optimizing construction scheduling. J. Oper. Res. Soc. 2013, 64, 1091–1105. [Google Scholar] [CrossRef] [Green Version]
  22. Fahmy, A.M. Optimization Algorithms in Project Scheduling. Optim. Algorithm. Methods Appl. 2016. [Google Scholar] [CrossRef] [Green Version]
  23. Werner, F.; Burtseva, L.; Sotskov, Y.N. Special Issue on Algorithms for Scheduling Problems. Algorithms 2018, 11, 87. [Google Scholar] [CrossRef] [Green Version]
  24. Ipsilandis, P.G. Multiobjective Linear Programming Model for Scheduling Linear Repetitive Projects. J. Constr. Eng. Manag. 2007, 133, 417–424. [Google Scholar] [CrossRef]
  25. Joy, J.; Rajeev, S.; Narayanan, V. Particle Swarm Optimization for Resource Constrained-project Scheduling Problem with Varying Resource Levels. Procedia Technol. 2016, 25, 948–954. [Google Scholar] [CrossRef] [Green Version]
  26. Zhang, H. Ant Colony Optimization for Multimode Resource-Constrained Project Scheduling. J. Manag. Eng. 2012, 28, 150–159. [Google Scholar] [CrossRef]
  27. Hegazy, T. Optimization of Resource Allocation and Leveling Using Genetic Algorithms. J. Constr. Eng. Manag. 1999, 125, 167–175. [Google Scholar] [CrossRef]
  28. Chan, W.T.; Hu, H. Precast production scheduling with genetic algorithms. In Proceedings of the 2000 Congress on Evolutionary Computation, CEC00 (Cat. No.00TH8512), La Jolla, CA, USA, 16–19 July 2002; Volume 2, pp. 1087–1094. [Google Scholar]
  29. El-Rayes, K.; Jun, D.H. Optimizing Resource Leveling in Construction Projects. J. Constr. Eng. Manag. 2009, 135, 1172–1180. [Google Scholar] [CrossRef]
  30. Venkrbec, V.; Galić, M.; Klanšek, U. Construction process optimisation—Review of methods, tools and applications. J. Croat. Assoc. Civ. Eng. 2018, 70, 593–606. [Google Scholar] [CrossRef]
  31. Obradović, D. Review of Nature-Inspired Optimization Algorithms Applied in Civil Engineeering. Elektron. Časopis Građevinskog Fak. Osijek 2018, 74–88. [Google Scholar] [CrossRef]
  32. Sanchez, B.; Rausch, C.; Haas, C.; Saari, R. A selective disassembly multi-objective optimization approach for adaptive reuse of building components. Resour. Conserv. Recycl. 2020, 154, 104605. [Google Scholar] [CrossRef]
  33. Liang, C.; Xu, X.; Chen, H.; Wang, W.; Zheng, K.; Tan, G.; Gu, Z.; Zhang, H. Machine Learning Approach to Develop a Novel Multi-Objective Optimization Method for Pavement Material Proportion. Appl. Sci. 2021, 11, 835. [Google Scholar] [CrossRef]
  34. Murata, T.; Ishibuchi, H. MOGA: Multi-objective genetic algorithms. In Proceedings of the 1995 IEEE International Conference on Evolutionary Computation, Perth, Australia, 29 November–1 December 1995; Volume 1, pp. 289–294. [Google Scholar]
  35. Eshtehardian, E.; Afshar, A.; Abbasnia, R. Fuzzy-based MOGA approach to stochastic time–cost trade-off problem. Autom. Constr. 2009, 18, 692–701. [Google Scholar] [CrossRef]
  36. Peng, B.; Flager, F.L.; Wu, J. A method to optimize mobile crane and crew interactions to minimize construction cost and time. Autom. Constr. 2018, 95, 10–19. [Google Scholar] [CrossRef]
  37. Zhao, S.; Li, Z. Multi-objective Optimization for Construction Site Layout Planning Problem under Fuzzy Random Environment. In Proceedings of the 2014 Seventh International Joint Conference on Computational Sciences and Optimization, Beijing, China, 4–6 July 2014; pp. 641–645. [Google Scholar]
  38. Monghasemi, S.; Nikoo, M.R.; Khaksar Fasaee, M.A.; Adamowski, J. A novel multi criteria decision making model for optimizing time-cost-quality trade-off problems in construction projects. Expert Syst. Appl. 2015, 42, 3089–3104. [Google Scholar] [CrossRef]
  39. Tachaudomdach, S.; Upayokin, A.; Kronprasert, N.; Arunotayanun, K. Quantifying Road-Network Robustness toward Flood-Resilient Transportation Systems. Sustainability 2021, 13, 3172. [Google Scholar] [CrossRef]
  40. Faghihi, V.; Reinschmidt, K.F.; Kang, J.H. Construction scheduling using Genetic Algorithm based on Building Information Model. Expert Syst. Appl. 2014, 41, 7565–7578. [Google Scholar] [CrossRef]
  41. Moon, H.; Kim, H.; Kamat, V.R.; Kang, L. BIM-Based Construction Scheduling Method Using Optimization Theory for Reducing Activity Overlaps. J. Comput. Civ. Eng. 2015, 29, 04014048. [Google Scholar] [CrossRef]
  42. Gbadamosi, A.Q.; Mahamadu, A.M.; Oyedele, L.O.; Akinade, O.O.; Manu, P.; Mahdjoubi, L.; Aigbavboa, C. Offsite construction: Developing a BIM-Based optimizer for assembly. J. Clean. Prod. 2019, 215, 1180–1190. [Google Scholar] [CrossRef]
  43. Asl, M.R.; Bergin, M.; Menter, A.; Yan, W. BIM-based Parametric Building Energy Performance MultiObjective Optimization. In Proceedings of the 32nd eCAADe Conference—Volume 2, Newcastle, UK, 10–12 September 2014; pp. 455–464. [Google Scholar]
  44. Amiri, R.; Sardroud, J.M.; Soto, B.G. De BIM-based Applications of Metaheuristic Algorithms to Support the Decision-making Process: Uses in the Planning of Construction Site Layout. Procedia Eng. 2017, 196, 558–564. [Google Scholar] [CrossRef]
  45. Huang, J.-W.; Wang, X.-X.; Chen, R. Genetic Algorithms for Optimization of Resource Allocation in Large Scale Construction Project Management. J. Comput. 2010, 5, 1916–1924. [Google Scholar] [CrossRef]
  46. Agrama, F.A. Multi-objective genetic optimization for scheduling a multi-storey building. Autom. Constr. 2014, 44, 119–128. [Google Scholar] [CrossRef]
  47. Eid, M.S.; Elbeltagi, E.E.; El-Adaway, I.H. Simultaneous multi-criteria optimization for scheduling linear infrastructure projects. Int. J. Constr. Manag. 2021, 21, 41–55. [Google Scholar] [CrossRef]
  48. Kemmer, S. Development of a Method for Construction Management in Refurbishment Projects. Technol. Forecast. Soc. Chang. 2018, 104, 1–15. [Google Scholar]
  49. Zanchetta, C.; Cecchini, C.; Bellotto, C. BIM-Based multi-objective optimization process for energy and comfort simulation: Existing tools analysis and workflow proposal on a case study. J. Build. Sustain. 2018, 1, 11–26. [Google Scholar]
  50. Deb, K.; Pratap, A.; Agarwal, S.; Meyarivan, T. A fast and elitist multiobjective genetic algorithm: NSGA-II. IEEE Trans. Evol. Comput. 2002, 6, 182–197. [Google Scholar] [CrossRef] [Green Version]
  51. Salama, T.; Moselhi, O. Multi-objective optimization for repetitive scheduling under uncertainty. Eng. Constr. Arch. Manag. 2019, 26, 1294–1320. [Google Scholar] [CrossRef]
  52. Rao, S.S. Engineering Optimization: Theory and Practice; John Wiley & Sons: Hoboken, NJ, USA, 2019. [Google Scholar]
  53. Palisade Corporation. Palisada Corporation Evolver User’s Guide. In The Genetic Algorithm Solver for Microsoft Excel, Version 7; Palisade Corporation: Ithaca, NY, USA, 2015; p. 14850. [Google Scholar]
  54. Ghoddousi, P.; Eshtehardian, E.; Jooybanpour, S.; Javanmardi, A. Multi-mode resource-constrained discrete time–cost-resource optimization in project scheduling using non-dominated sorting genetic algorithm. Autom. Constr. 2013, 30, 216–227. [Google Scholar] [CrossRef]
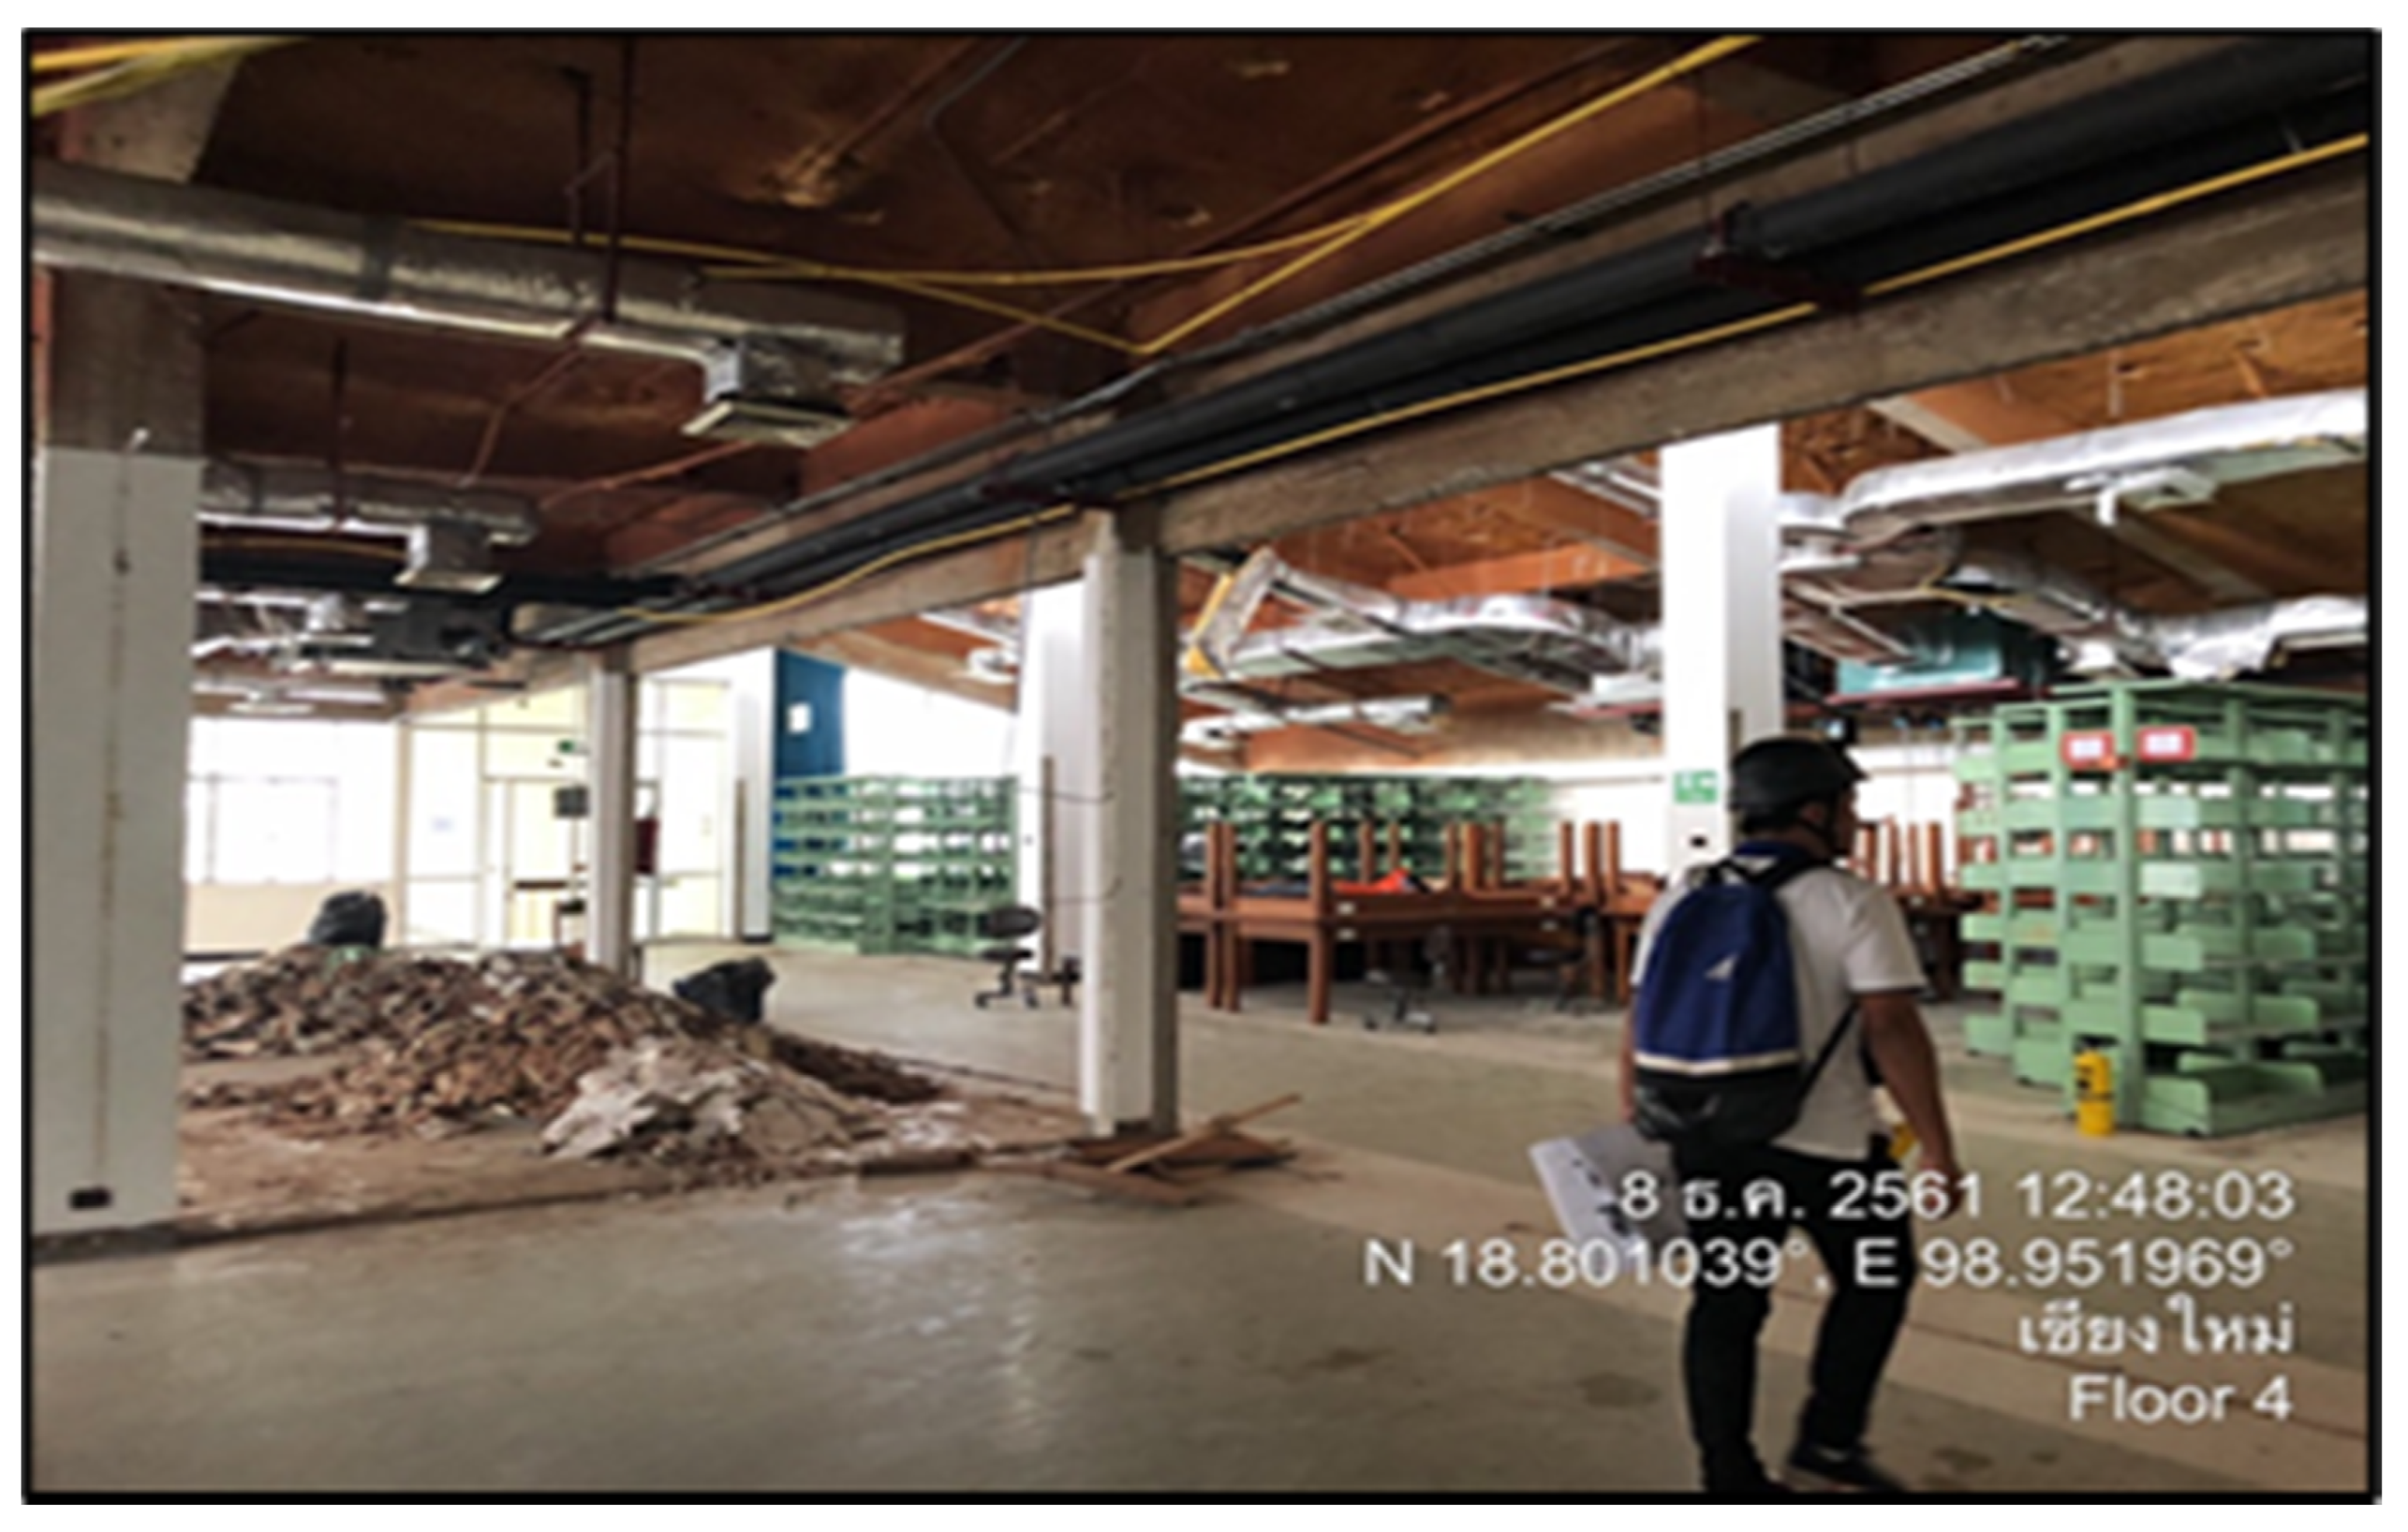
Figure 1. Project site of Chiang Mai University Library during the renovation.
Applsci 11 04716 g001
Figure 2. Point cloud dataset from terrestrial laser scanner overlaid on the existing building and its surrounding of Chiang Mai University Library.
Applsci 11 04716 g002
Figure 3. Rendered BIM model of Chiang Mai University Library for visualization.
Applsci 11 04716 g003
Figure 4. BIM models and construction scheduling data using Autodesk Navisworks.
Applsci 11 04716 g004
Figure 5. The flow diagram of the optimization procedure.
Applsci 11 04716 g005
Figure 6. Solution structure for GA operation.
Applsci 11 04716 g006
Figure 7. Initial and optional construction sequences.
Applsci 11 04716 g007
Figure 8. Pareto front solutions for 500 generations in 3 objectives.
Applsci 11 04716 g008
Figure 9. Pareto front solutions for 500 generations in each objective pair.
Applsci 11 04716 g009
Figure 10. Relation graph between generation and optimal resource fluctuation.
Applsci 11 04716 g010
Table 1. MOGA simulation parameters and values.
Parameter NameValues
The size of start population500
The size of minimum population400
The size of maximum population500
The maximum generation500
The crossover rate (Pc)0.5
The mutation rate (Pm)0.004
n1
sigma10
Maximum days (from construction contract)780 days
Table 2. Pareto front solutions.
Solution No.CostTimeMxSolution No.CostTimeMx
178,701,296716965,7143682,230,313756925,806
278,718,612717964,0563782,422,522758925,672
378,735,928718961,6923882,614,730760925,346
478,753,245719957,7883982,806,939762924,718
578,770,561720952,9564082,999,147764924,690
678,866,665721951,9304183,095,252765924,434
778,962,770722951,0304283,191,356766924,418
879,154,978724948,6984383,287,460767924,216
979,251,082725947,6464483,383,564768924,112
1079,347,187726947,3724583,575,773770923,754
1179,443,291727945,7604683,671,877771923,644
1279,539,395728944,5084783,767,981772923,458
1379,635,499729943,5004883,864,085773923,114
1479,731,603730942,7524984,056,294775922,744
1579,827,708731941,3045084,344,607778922,526
1679,923,812732940,2765184,440,711779922,330
1780,019,916733939,3485284,536,815780922,084
1880,116,020734937,7145384,729,024>780921,826
1980,212,125735936,7525484,921,232>780921,552
2080,308,229736936,2745585,017,336>780921,494
2180,404,333737935,6885685,113,440>780921,134
2280,596,542739933,6305785,209,545>780920,800
2380,788,750741932,7105885,401,753>780920,500
2480,980,958743931,3125985,593,962>780920,228
2581,077,063744930,1286085,786,170>780920,194
2681,173,167745927,8246185,882,274>780919,716
2781,269,271746927,6406285,978,379>780919,604
2881,461,480748927,4306386,170,587>780919,362
2981,557,584749927,2466486,362,795>780919,130
3081,653,688750927,2106586,555,004>780918,650
3181,653,688750927,2106686,651,108>780918,378
3281,653,688750927,2106786,651,108>780918,378
3381,749,792751926,7166886,747,212>780918,094
3481,942,001753926,3846986,843,317>780918,084
3582,134,209755926,0727087,131,629>780917,338
Table 3. Results’ comparison to the original plan.
CostTimeMx
Original Plan78,701,2967161,009,040
An Optimal Plan78,701,296716965,714
Difference0%0%4.3%
Publisher’s Note: MDPI stays neutral with regard to jurisdictional claims in published maps and institutional affiliations.