1. Introduction
Classic software engineering lifecycles include such important stages as requirements engineering, design of the software architecture, implementation (or coding), testing and maintenance. In this sequence, the software testing is a process of investigation of the software product aimed at checking the correspondence between actual behavior of the program code and its expected behavior on a special set of tests (the so-called test cases) selected in a certain way. The testing stage is a very costly one, taking up to 40–60 percent of the total software development time.
The goal of testing is to ensure accordance of the developed program with the specified requirements, compliance with logic while data processing, and obtaining of the correct final results. There are two major testing techniques allowing the checking of the software under testing (SUT) for errors with different levels of access to the code. These approaches are black-box testing and white-box testing [
1]. The black-box testing considers the software as a “black box” investigating functionality without seeing the source code. Its objective is to find out when the input-output behavior of the SUT does not agree with its specification. It is also called functional or specification-based testing.
On the contrary, the white-box testing examines the internal code structure and behavior of the SUT by execution of the source code. The tester chooses the SUT’s inputs to exercise paths through the code and determine the appropriate outputs. It is also called program-based or structural testing. Test data are derived from the SUT’s input domains. In some cases, the test data is already available, but in most cases, it is required to be generated.
Test data generation is a complex and time-consuming process which needs a lot of effort and a large budget. Therefore, automation of this process, at least partially, is an urgent research problem, the solution of which could improve the efficiency of the software testing. One of the goals of the automatic test data generation is to create such a multitude of test data that would ensure a sufficient level of quality of the final product by checking most of the various code paths, i.e., to provide maximum code coverage to satisfy some criteria (for example, statement or branch coverage).
In paper [
2], three types of test data generators were indicated: pathwise generators, data specification generators, and random generators. Data specification generators mainly refer to the black-box testing strategy while pathwise test data generators refer to the white-box testing. Random test data generation [
3] is the simplest blind strategy that can be applied both for the black- and white-box testing. It is now used in its original form mainly as a lowest point for evaluating the quality of more efficient methods. However, there are several fairly successful improvements to this method based on the use of more advanced statistical modeling. Therefore, paper [
4] suggests the improvement of the classic random method in the form of a random walk operator, which turned out to be very effective even in comparison with more sophisticated optimization methods. Another strategy for developing the random method is to use advanced statistical models. For example, in [
5], a specially built Markov model is used to test the reliability of Unmanned Aircraft Systems, as they are of vital importance in practical applications. The experiments showed that the proposed method could reduce the redundancy of test data while ensuring the coverage ratio.
Black-box test data generation from software specification prepares test cases for software developers before the code development phase [
6,
7]. A combination between black-box and white-box testing is sometimes called gray-box testing. Gray-box testing measures the quality of test data using the software specification as in black-box testing, but also uses the internal information from the behavior of the software specification as in white-box testing.
The most advanced requirements specification model suitable for the gray box testing is the UML diagram. There are some publications based on UML. For example, in [
8,
9] it is proposed to use genetic algorithms to generate triggers for the UML diagrams, which allow finding the critical path in the program. Paper [
10] proposes an improved method based on a genetic algorithm to select test data for many parallel paths in UML diagrams. In addition to UML diagrams, the specification can be displayed in the form of Classification-Tree Method [
11]. The problem of constructing the trees was considered and an integrated classification tree algorithm was proposed [
12] and the developed ADDICT prototype (AutomateD test Data generation using the Integrated Classification-Tree methodology) for an integrated approach was studied [
13].
Having test cases before coding helps the developers to control their code to conform to the specification. However, the use of the already written code in the white-box testing allows one to build a more perfect test suite, which simultaneously possesses both the property of non-redundancy of the set of cases and optimal code coverage. Historically, the first approach to pathwise test data generation was a static method of the code analysis based on the use of symbolic evaluation considered in papers [
14,
15,
16,
17,
18]. Symbolic evaluation involves executing a program using symbolic values of variables instead of actual values. After a path is selected, symbolic evaluation is used to generate a system of path constraints, i.e., a set of equalities and inequalities on the SUT’s input variables. This system of path constraints must be solvable for the path to be traversed. A number of algorithms have been used for the inequality solution. There are different approaches to solving the system of constraints. Consequently, in [
19], a set of tools (collectively called Godzilla) that automatically generates constraints and solves them to create test cases for unit and module testing was implemented. Ref. [
20] proposed using Constraint Logic Programming and symbolic execution to solve the problem. In [
21], Constraint Handling Rules are used to help in manual verification of problem areas in the computer program.
However, there are several problems connected with static approach. The first one is, of course, the problem of the complexity of symbolic computations, which limits the SUT size. The second problem is related to an array element determination when the index of an array depends on input values.
So, currently, the most effective and commonly used method for automatic test data generation in white-box testing is a dynamic approach which is based on actual execution of the SUT, optimization methods, and dynamic data flow analysis. Test data are developed using actual values of input variables. When the program is executed for some input variables, the program execution data flow is monitored. One of the first execution-oriented approaches was the chaining method [
22], which used data dependency analysis to guide the search process. Dependency analysis automatically forms a sequence of statements that is to be executed prior to the execution of the current statement.
Studies of execution-oriented techniques using Data Flow diagrams were carried out in papers [
23,
24]. Some of the researchers suggest using hybrid approaches. For example, an approach proposed in [
25] combines Random Strategy, Dynamic Symbolic Execution, and Search-Based Strategy. Ref. [
26] proposed a hybrid approach based on the Memetic Algorithm for generating test data. Ref. [
27] compared different methods for generating test data, including genetic algorithms, random search, and other heuristic methods.
As for optimization methods, currently, evolutionary approaches have proven a powerful tool for test data generation. A large number of publications on this topic investigated the use of a genetic algorithm (GA) to solve the problem of generating test data; see, for example, [
27,
28,
29,
30]. Note, however, that most often, when using GA, the researchers limit themselves to the so-called path-oriented generation approach, which does not provide the generator with a possibility of selecting among a set of paths, as in the goal-oriented generation approach, but focus only on one specific path [
31]. As a result of running the GA, from the final generation of test cases individuals are selected that are the most fitted to traversing a given path. This can be either a path specified by the researcher, or the most complex path of the SUT. If the goal is to form a population of test cases that provides full coverage of all paths or at least some of the most complex paths of the program, then the classical GA is not suitable, since it drifts towards the most fitted (for example, the most difficult) path. That is, in the process of passing from one generation to another, all individuals will be more and more similar to each other. This problem can be solved by running the GA multiple times [
32]. However, this approach cannot be called efficient, since the optimization problem is solved separately for each SUT path.
Researchers are trying to solve the indicated problem of the GA drift using other evolutionary methods. In [
33], the simulated repulsion algorithm based on particle systems was proposed for the automatic generation of diversity-oriented test sets (DOTS) obtained by taking random test sets and iteratively improving their diversity. Another means of increasing the diversity of the test cases is the combination of the GA with the Particle Swarm Optimization (PSO) method.
Reference [
34] compared two computational techniques, GA and PSO. It was noticed that PSO produces more distinct test cases than GA, but PSO can solve only discrete problems while the GA can solve both discrete and continuous ones. In [
35], the GPSMA (Genetic-Particle Swarm Mixed Algorithm) was proposed using the individual’s update mode to replace the mutation operation in the GA on the basis of population division. In [
36], on the basis of the classical genetic algorithm, the algorithm divided the population into “families,” influencing the convergence efficiency by crossover in family, keeping the diversity of the population by crossover between families. In [
37], an approach for coupling-based integration testing of object-oriented programs using PSO was proposed.
With a certain success of hybrid evolutionary approaches to increase the diversity of the population, the problem of automating the test suite generation is far from a final solution. It should be noted that the majority of works use a simple formulation of fitness function that expresses the degree of coverage of an individual path with a test case. At the same time, in most papers, the mathematical form of the fitness function is not defined at all, while this is a very important aspect of GAs. Due to the formulation of fitness function, it is possible to increase the diversity of the population, see, for example, [
38,
39].
In the present paper, we use the idea of an Improved Genetic Algorithm for Multiple Paths Automatic Software Test Case Generation proposed in [
38], where an additional term responsible for the greatest diversity of the population, along with a term responsible for the complexity of each path, is included into the fitness function. We investigated this approach, identified its shortcomings, and proposed an improved form of the fitness function, as well as changes into the GA, allowing us to achieve a more uniform increase in the percentage of code coverage. Our research confirmed greater effectiveness of the proposed approach compared to the original version.
The paper is organized as follows.
Section 1 introduces the problem and gives the literature review.
Section 2 discusses theoretical issues of the research, including the mathematical description of the proposed method. In
Section 3, we describe experimental results for two different SUT.
Section 4 provides the discussion of the results.
2. Theoretical Background
2.1. Basic Concepts
In this paper, we use a dynamic approach to automatic test data generation, which is based on actual execution of a SUT, dynamic data flow analysis, and fitness function optimization. Test data is developed using actual values of input variables. When the program is executed on some input data, the program execution flow is monitored.
A control flow graph (CFG) of the program under testing is a directed graph , where is a set of graph nodes, is a subset of cartesian product determining a binary relation on (a set of graph edges), and are, respectively, unique entry and unique exit nodes .
For the sake of simplicity, we restrict our analysis to a subset of structured C-like programming language constructs, namely: sequencing statements (for example, assignments), conditional statements (if-then-else), cycle statements (for and while). A node in corresponds to the smallest single-entry, single-exist executable part of a statement in P that cannot be further decomposed. A single node corresponds to an assignment statement, input or output statement, or the <expression> part of an if-then-else or while statement. An edge corresponds to a possible transfer of control from the node to the node . The edge is called a branch. Each branch in the CFG can be labeled by a predicate, describing the conditions under which the branch will be traversed.
An input variable of SUT is a variable , which appears in an input statement, e.g., , or it is an input parameter of a procedure. Input variables may be of different types, e.g., integer, real, Boolean, etc. Let ( be a vector of input variables of the SUT. The domain of input variable is a set of all values which can hold. By the domain of the SUT we mean a cartesian product , where each is the domain of input variable , i.e., a set of all values that can hold.
Thus, a SUT input is a single point in the -dimensional input space . A path in a CFG is a sequence of nodes , such that , . A path is feasible if there exists a SUT input for which the path is traversed during program execution, otherwise the path is infeasible.
The maximum goal of automated test data generation problem is to find the so-called test case, being a set of the SUT inputs , on which the whole variety of feasible SUT paths will be traversed. This problem can be solved gradually. One can initially formulate a partial purpose of finding one SUT input on which a given path will be traversed. By sequentially choosing all possible SUT paths (or a subset of the most critical paths), one can iteratively find a test case that provides the greatest path coverage.
In order to solve the problem of finding a SUT input for a given path
various optimization methods can be used. For example, in [
29], the GA is successfully applied. In this case, as a fitness function it is reasonable to use a weight function that assigns nonzero weights for those nodes or branches of CFG along which the considered path
passes, and zero values for those nodes or branches along which path does not pass. For example, in [
29], to solve the above problem, a function is used of the following form
where
are the nonzero weights corresponding to the path of the CFG generated by the input value
;
is the number of statements (or branches) covered by the path.
The application of the above approach to the search for a test case that covers the vast majority of graph paths is not optimal, since it involves multiple runs of the GA without taking into account the previous results. At the same time, the use of a different formulation of fitness function in the GA (introduction of additional terms into (1)) could make it possible to take care not only of the coverage of a specific CFG path, but also of the diversity of paths in the population, which allows hope for obtaining diverse test-cases that ensure maximum coverage of the most complex subsets of paths in one GA run. The idea of such a promising approach was proposed in [
38]. However, the form of the fitness function presented in [
38], in addition to containing uncertainties and inaccuracies, is unstable for various tested code. In the present paper, we propose a significant development and refinement of this approach, and also provide results on the study of its effectiveness for large dimensional SUT.
2.2. Genetic Algorithm for Test Data Generation
Genetic Algorithm borrows its idea and terminology from the biological world. In such a way, it uses different representations for potential solutions referred to as chromosomes, genetic operators such as crossover and mutation used to generate new offspring solutions, and also selection and evaluation mechanisms derived from nature.
With regard to the problem considered here, a set of generated test data, which best contributes to the software testing process, can serve as potential solutions. Depending on the values of the input variables supplied to the SUT input, the code execution process can follow various paths determined by the sequence of statements, among which there can be both linear statements following one after another, conditional statements (if-then-else), and loops (while, for), leading to branching of the computations. It is the latter that ultimately determines the variety of paths of the SUT execution.
In this paper, we assume that input variables
of the SUT can take their values from the continuous domains
. Therefore, it is reasonable to use continuous (real-valued) GA (unlike the binary GA), where the values of input variables are the genes included into the chromosomes that determine potential solutions to the problem of generating input test data. Denoting chromosomes as
, we determine a test data population, consisting of
m individuals each containing
N genes (values of the input variables)
The genetic algorithm for test data generation includes the following main stages:
Initialization. The initial population is formed randomly, taking into account constraints on the values of input variables. The volume of the initial population is selected based on the size of the SUT (namely, the number of feasible paths). It should be noted that the results of the initialization stage can be used to compare the method proposed in this work with the simplest random test data generation.
Population evaluation. Each of the chromosomes is evaluated by a fitness function. In the following sections, we define and explore a fitness function based on the statement coverage of SUT. The proposed fitness function consists of two terms, the first of which is responsible for the coverage of the current path. Another term is responsible for the variety of paths in one population.
Selection. The best 20 percent of chromosomes are selected for the next generation directly; the remaining 80 percent of chromosomes are obtained as a result of crossover.
Crossover. Among 80 percent of the offspring obtained as a result of crossover, 50 percent is obtained by randomly crossing 20 percent of the best chromosomes of the previous generation with each other. The remaining 50 percent is obtained by randomly crossing all the chromosomes of the previous generation with each other.
Crossover occurs through the random choice of a constant
for each
and subsequent blending where a single
l-th offspring gene comes from a linear combination of
l-th genes of the two random chromosomes from the parents’ pool [
40]:
Mutation. With a given mutation probability 0.05 the l-th gene, , can change its value randomly within the domain . The main goal of mutations is to obtain solutions that could not be obtained from the existing genes.
Forming the test cases as a pool of elite chromosomes. In each generation, chromosomes are chosen into the pool of elite chromosomes sequentially, in the order of their fitness, i.e., the ability to cover the most complex SUT paths. The next chromosome is added (or not) if it provides (or not) additional code coverage compared to the existing pool of elite chromosomes.
After all the stages have been carried out, it is assessed whether the test case has reached the desired fitness, or has come to a limit on the number of generations M.
2.3. Criteria for SUT Quality
For almost any realistic program system, an exhaustive set of test cases (the so-called test suite) contains an infinite number of test cases, so that this test suite can never be executed. Therefore, selection of the finite test suite from the infinite one is an important task. An adequate criterion to solve this task is to maximize the chance of detecting an error or a fault in the SUT while minimizing the cost of executing the test suite [
41].
A simple test adequacy criterion could require, for example, that each statement in the SUT should be executed at least once when the code is tested. The methodologies that use such criteria are usually called coverage analyses, because certain paths of the source code are to be covered by the test cases.
There is a hierarchy of increasingly complex coverage criteria defining levels of coverage. At the top of the hierarchy is the multiple condition coverage level, requiring researchers to ensure that every permutation of values for the Boolean variables in every condition executes at least once. At the bottom of the hierarchy is function coverage, which requires only that every function be called once under the test suite.
Somewhere between these extreme levels are statement, branch, and path coverage. Path coverage is the most complete of all coverage criteria. Only if every possible path in the SUT is executed could the path coverage achieve 100%, which is usually impossible and impractical. Statement or branch coverage is an acceptable alternative.
Statement coverage is based on counting the statements of the SUT that will be performed when the code is run by a particular test case, compared to the total number of operations. The different code paths are determined by conditions and loops. We can say that if a condition or a loop is executed, then all statements within these paths will be performed. Therefore, the purpose of statement coverage is to execute as many statements of the SUT as possible in comparison with the total number of statements:
This coverage approach is also called C0-coverage and is relatively weak. A stronger coverage criterion is branch coverage, also called C1-coverage, defined as follows:
Branch coverage value will always be lower than the statement coverage. However, the difference between these criteria lies more in the ignoring of unloaded branches (if without else) in conditional statements, which is not particularly important. Therefore, without loss of generality, we will restrict ourselves to the statement coverage criterion (3). Thus, in this research, we consider statement coverage as the quality criterion for the generated test case population (2).
Therefore, the purpose of the statement coverage criterion is to execute as many statements of the program as possible in comparison with the total number of statements. Thus, the GA fitness function for a certain chromosome has to be formulated to take into account the statement coverage requirement. That is, the test case corresponding to the most fitted chromosome traverses the most loaded (more complex) path containing as many SUT statements as possible.
A complementary approach to the formulation of the fitness function is the requirement for maximum coverage not only by one test case, but also by multiple test cases at once (preferably 100% coverage by the chromosome population). The latter leads to the possibility of obtaining the final solution in one GA run, and can be heuristically provided by the inclusion of special terms into the fitness function ensuring as much variety of individuals and distance between them in the population (2) as possible.
2.4. Fitness Function for Maximum Statement Coverage and Population Diversity
In this section, we will formulate the fitness function of the genetic algorithm in such a way that maximizes statement coverage by both individual test cases and the whole test cases population.
The first step of white-box testing is to translate the source code into a Control Flow Graph (CFG). In the CFG, the statements are represented as nodes (boxes) and the con-trol flows between the statements are represented as edges. Denote the vector of nodes of the CFG by
, where
is a separate node of CFG (one or more statements of the code). Note that the order of execution of separate nodes
may differ depending on various input data, since the program code contains conditional statements when computations are branched along several paths. Thus, different initial data of the program lead to traversing along different paths of the CFP, ensuring the execution of only quite specific (not all) statements of the program. Let us denote
a vector that is an indicator of the coverage of the graph nodes by a path initiated by a specific set of the test case
:
where
Assigning weights to edges of CFG, we can take into account the fact that different paths of executing program code have different complexity. More weights are assigned to statements that are critical, being part of the more error-prone paths. Following the procedure proposed in [
29] an initial credit is taken (for example, 100 or 10), if CFG is dense. i.e., large numbers of statements are there, than initial credit should be taken as 100 and if CFG is sparse (small code) then it can be taken as 10. At each node of CFG, the incoming credit (the sum of the weights of all the incoming edges) is divided and distributed to all the outgoing edges of the node. For the conditional and loops statements, we have used an 80–20 rule: 80 percent of weight of the incoming credit is given to loops and branches and the remaining 20 percent of the incoming credit is given to the edges in sequential path. If we encounter a conditional statement with two or more conditions, fulfillment of each one leads to the execution of certain following statements, the weight of such a conditional statement is divided by the number of outgoing edges.
Let us denote by
a vector of weights assigned to all statements in accordance with the above-described method. Then the fitness function for the individual chromosome
can be formulated as follows
Indeed, the higher the sum of weighted statements covered by a path initiated with the test case , the more fit is the chromosome .
On the other hand, the use of Formula (4) for the fitness function will lead to a situation where the most adapted and capable of reproduction will always be individuals that lead to the most complex pieces of the code, to the detriment of the diversity of individuals in the population, since the population aspect in this formula not taken into account. As a result of using the GA with such a fitness function, we get the fittest individuals, however, if we evaluate the fitness of the resulting population as a whole, it will not provide maximum code coverage, since the chromosomes of the population will generate very similar paths.
To ensure a greater diversity of the population, it is necessary to introduce into the fitness function a term that gives preference to chromosomes that provide the greatest possible distance from each other—all paths that are generated by test cases of the population’s chromosomes.
In order to calculate the
-th similarity coefficient
of two chromosomes
and
we compare if the node
of the CFG is covered or uncovered by both paths initiated by these two test cases
The more matching bits are there between the two paths, the greater is the similarity value between the chromosomes. The following formula takes into account weights of corresponding CFG nodes:
The value of similarity between the chromosome
and the rest of the chromosomes in the population is calculated as
Now we can determine the maximum value of path similarity in the whole population
Thus, we can formulate the term of fitness function responsible for the diversity of paths in a population. It is
Thus, the fitness function for the chromosome
is calculated by the formula
where
and
are defined by Formulas (4) and (5). The first term
determines the complexity of the path initialized by the chromosome
, and the second term
determines the remoteness of this path from other paths in the population. The constant
k determines relation between the two terms. The best value of
k will be empirically determined in the next section.
3. Experiment Results
To investigate the GA’s ability to work with the proposed fitness function (6), we used two examples of SUT, namely, SUT1 and SUT2, which both were specially designed for the research.
3.1. Experiment Results for SUT1
The first SUT1 was designed to test the data generation method. It contains six conditional statements and three cycles, thus allowing to define a sufficient number of different paths of the program code.
Appendix A shows a CFG of this code. FOR 1 is the main cycle of the program and contains most of the statements and conditions, so many operations will be executed multiple times. Conditions IF 1, IF 2, and IF 3 are checked sequentially and require different test cases to fulfill. Condition IF 6 will only be achieved if both IF 4 and IF 5 are true and cycle WHILE 1 is completed. The code has different approaches to representing conditions, so the proposed method will generate data under different circumstances.
In the course of our research, we examined two versions of GA, using the Formula (6) to calculate the fitness function for the number
m = 100 of individuals in the population. In the first version, we assigned
k = 0 in Formula (6). Since for this version complete code coverage was never achieved in one population with a single run of GA, each application of it was used to find one best-fit chromosome. Furthermore, the statements covered by the graph path initiated by the test case found in the previous GA launch received zero weights, and the process of searching for the next best-fit chromosome continued in a similar way. The results of computational experiments obtained with this method are presented in
Table 1. A total of six experiments with different number of generations and population size were carried out, in each we received different number of test cases that completely covered all the statements of the program code. However, these solutions were not obtained in an optimal way, since we had to run the GA four times or more consecutively (single path at a time), achieving with each new test case more and more coverage. Moreover, there may be test cases that do not increase code coverage at all (such test cases are italicized in
Table 1). The statement coverage indicators of the graph nodes, colored green, correspond to the newly covered nodes with the current test case.
Table 2 shows the results of studying the GA work with a nonzero value
k = 10 in the Formula (6) for the fitness function (i.e., with the presence of both terms), with different M and
m. In the six experiments, it only possible to achieve 100% coverage with sufficient number of
m =
M = 20. Therefore, the improvement of the form of fitness function formulation and careful selection of its parameters remains topical.
To study the effect of the constant
k in the relation (6) to the results of GA runs, the values of the population size and the number of generations were specially selected,
m =
M = 35 for which complete 100% statement coverage of the SUT1 presented in
Appendix A was achieved quite rarely.
Figure 1a shows the average value of the achieved statement coverage for various values of
k from 0 to 50, calculated from 40 GA independent runs, each time carried out with new random initial populations
m = 35 and maximum
M = 35 generations.
Thus, we see a non-linear dependence of the average coverage on the value of k, which determines the ratio between the terms F1 and F2 in the expression for the fitness function. First, as k grows, the statement coverage increases, reaching its maximum for k = 10. After that, the value of the fitness function begins to decline, as excessive attention begins to be paid to F2, which is responsible for the diversity of paths in the population at the expense of the coverage for each path.
It is also interesting to consider the distribution of different degrees of code coverage, as shown in
Figure 1b. As you can see, for a larger number of
k, the largest share of coverage falls into the group from 70% to 80%. Only for
k = 10, the largest share falls into the 81–99% group. Further, it can be noted that for
k = 20 and
k = 50, in general, the distribution worsens compared to
k = 10 (although the share of variants with 100% coverage is higher, the share with low coverage also increases).
Therefore, there is a certain value of k (in our case, it is k = 10), at which a balance is achieved between the terms and in the sum (6). If outweighs, then the resulting population is not diverse enough to cover the entire code. If outweighs, then excessive attention is paid to the diversity of the population to the detriment of the quality of coverage of each individual.
3.2. Experiment Results for SUT2
As a SUT2, a specially generated program with a large number of operations and conditions was used.
Appendix B shows the CFG of only a part of the program. The main functionality is found in the functions that are not presented here due to space limitations. In addition to a larger number of operations and functions in SUT2, a hierarchy of conditions is introduced to test the performance of the proposed method for automatic generation of test data.
The dependence of the code coverage on
k for different number of chromosomes in the population for SUT2 is shown in
Figure 2. To represent a different percent (not always 100%) of coverage, it was decided to use only 75 generations. The trend of the code coverage versus
k for SUT2 is very similar to that for SUT1 shown in
Figure 1a. The best coverage value is achieved at
k = 10, even though the tested codes SUT1 and SUT2 differ significantly in the number and complexity of statements. Thus, the value
k = 10 can presumably be recommended as an initial one for other SUTs as well.
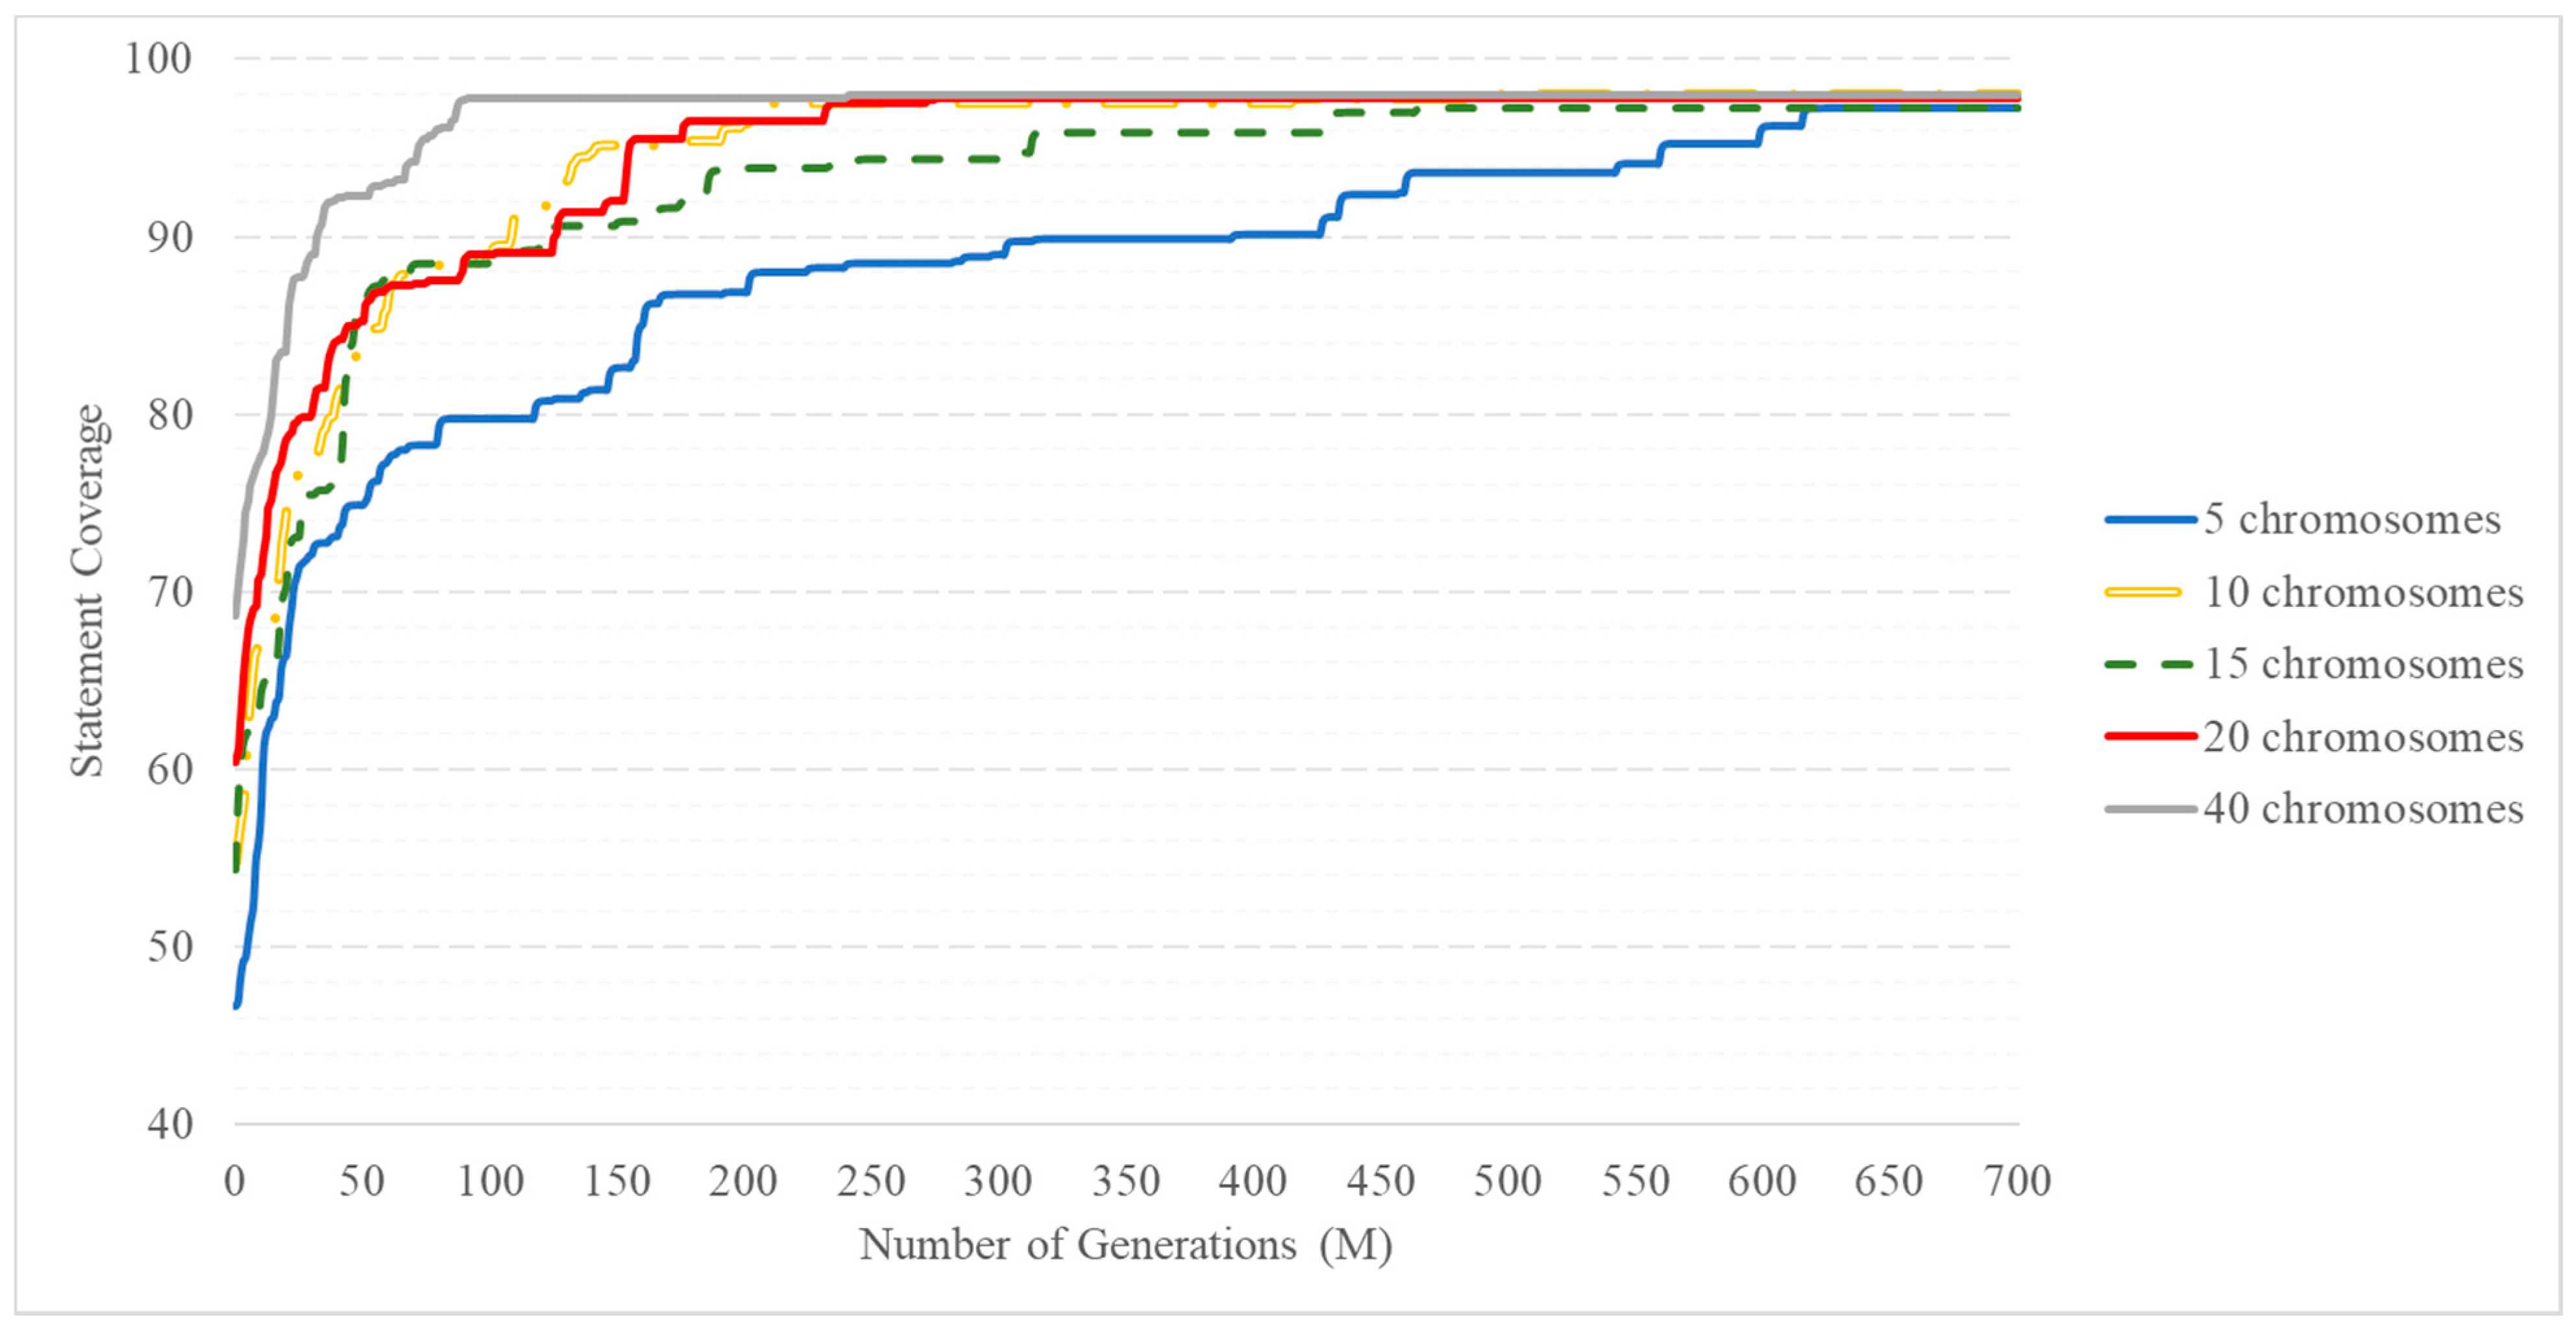
For the SUT2, research of the dependence of the average value of statement coverage on the number of generations varying from 1 to 700 were carried out. The average coverage value was calculated from 10 random GA launches with a fitness function calculated by Formula (6) with
k = 10. The results of calculations are presented for different population sizes (
m = 5, 10, 15, 20, and 40), and it is assumed that it does not change from generation to generation.
Figure 3 clearly shows how much the convergence rate of the algorithm differs when using a different number of chromosomes in the population.
First of all, it should be noted that in all cases the proposed algorithm stably ensures the accumulation of a pool of elite chromosomes, providing almost complete code coverage (at least 98% on average). The difference between the results obtained for different population sizes mainly consists in different rates of convergence to complete code coverage when m = 5, the lowest speed is achieved and the final coverage value is the lowest of the considered variants. An algorithm with 5 chromosomes in the population accumulates a pool of elite chromosomes for an extremely long time (700 generations), which provides almost complete coverage in about 700 generations.
An algorithm of test data generation with a population size of 10, 15, and 20 chromosomes shows somewhat better results. It reaches the maximum coverage value at ~270–450 generations, i.e., the convergence rate is much higher. Note that a value of 20 is an upper bound for the number of different paths providing complete coverage for the SUT2.
As expected, an increase in the number of chromosomes in a population significantly increases the convergence rate of the algorithm, i.e., the rate of increase in the degree of code coverage in the pool of elite chromosomes. This is achieved by providing more sample diversity. The algorithm achieved the best values of coverage and convergence rate for 40 chromosomes in the population. The maximum value of statement coverage is reached within 70–80 generations.
For the proposed code, as mentioned above, the number of generated variants is approximately 15–20. That is, for better generation of test data, it is necessary to have at least 2 times more chromosomes than the required number of test cases required for complete code coverage. A further increase in the number of chromosomes in the population will lead to an increase in the convergence rate, but negatively affect the overall speed of the method, because it leads to an exponential increase in the amount of computation.


