1. Introduction
In the case of precision machining and finishing, spindle error movements may affect inaccuracies in the workpiece and may deteriorate the quality of the machined surface as well as the dynamic accuracy of the contour being made. In cutting machine tools, the machining process is influenced by many factors (axis parallelism, positioning repeatability, stiffness, accuracy of the measuring system, regulator settings, etc.), which determine the accuracy and quality of the machined object. Many measurement methods for testing the accuracy of machine tools are still being developed; however, it seems that the studies of spindle error movements constitute a small percentage of all methods. In accordance with national standards, geometric accuracy tests are limited to static tests (when the spindle remains stationary or rotates slowly). For rotational motion, only the radial or axial runout is tested, i.e., the difference between the maximum and minimum indications of the sensor attached to the control surface. Such static tests are certainly not sufficient to determine the spindle condition and do not reflect even approximate operating conditions, especially of high-speed spindles.
Spindles are often blamed for causing problems with CNC (Computer Numerical Control) machines, but in many cases, the spindle is not the primary cause of machine tool malfunction. Collisions, heavy loads, and even daily use of the machine lead to the need for reconstruction or renovation when there are problems maintaining the appropriate quality of products. It is then necessary to determine the condition of individual units of the machine in order to determine the scope of the renovation. For this purpose, measurement tools are necessary to identify the cause of deterioration of the production process. It has become common to use various methods and systems to determine the condition of a machine tool; however, as previously described, methods and devices for investigating spindle error movements are poorly used and known to a small group of specialists. This study aims to update the knowledge on this niche topic.
2. Introduction to the Issue
A spindle, in the case of machine tools, can be defined as a cylindrical object that is mounted on a bearing, rotating, transmitting torque from the drive to a fixed tool or workpiece.
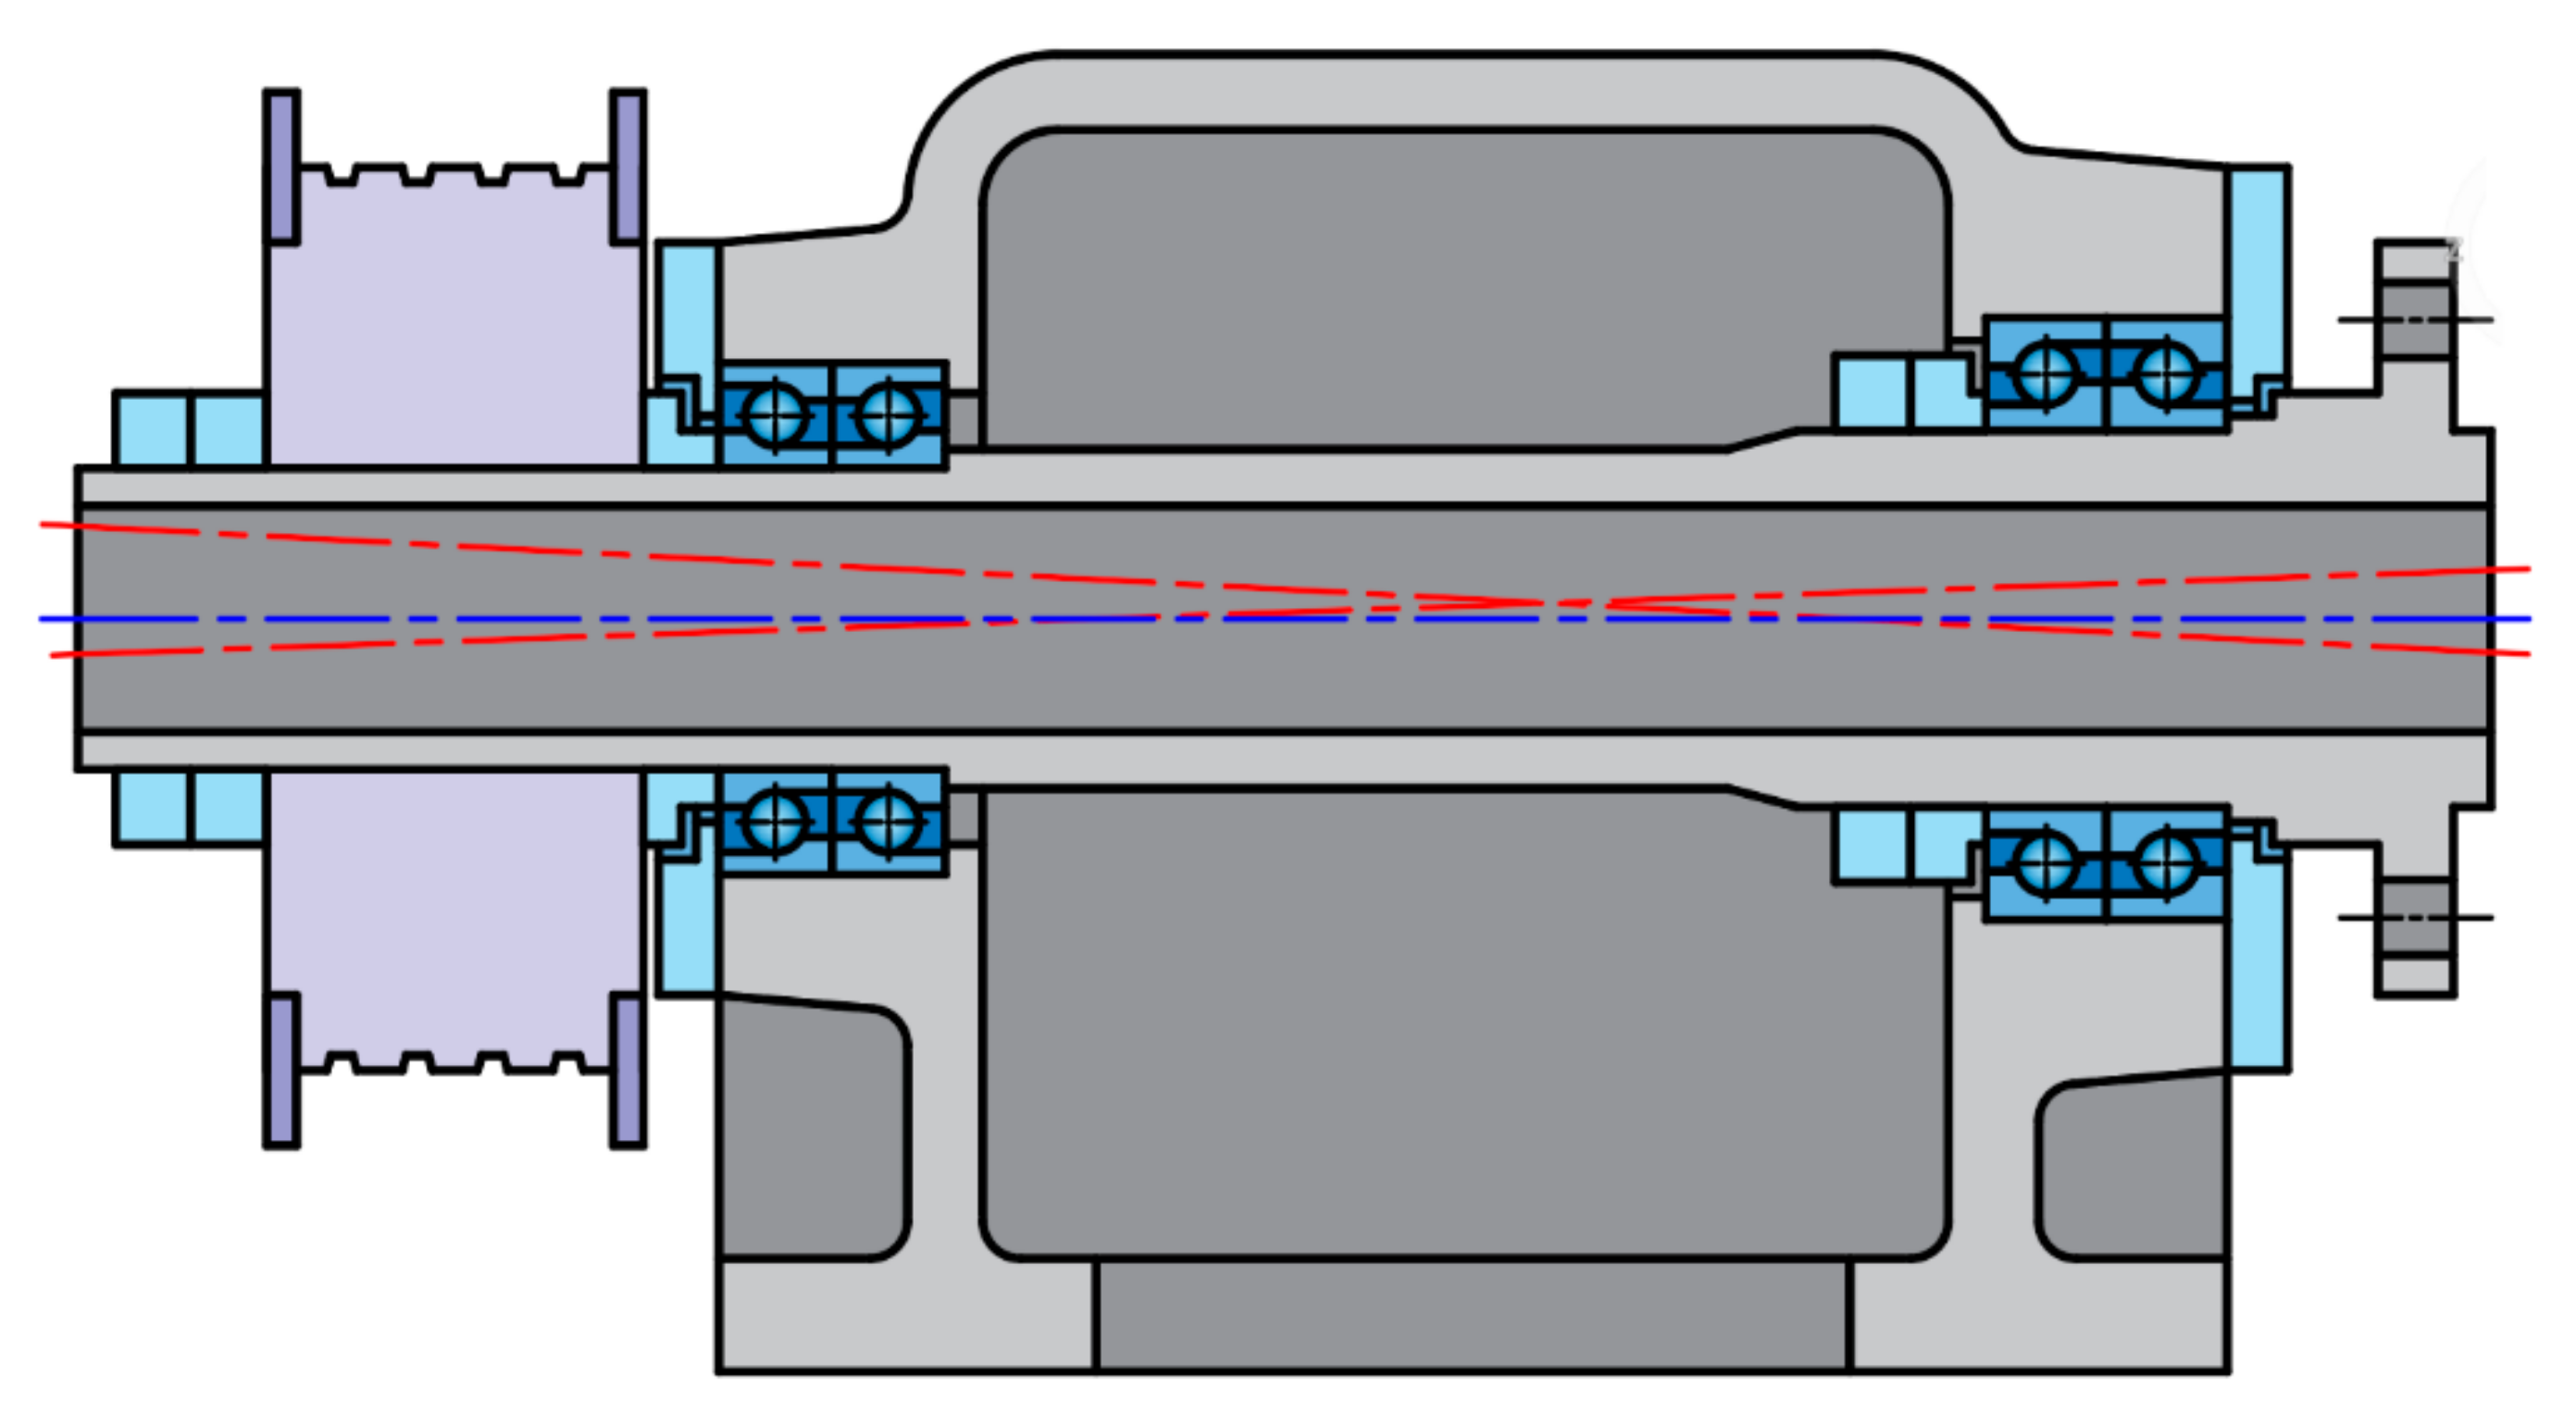
An ideal spindle has one degree of freedom—only rotation around its axis (C). Any movement in the remaining five degrees of freedom is undesirable and can be classified as either a spindle error or a reaction to external disturbances such as thermal deformation, excessive forces (e.g., from machining), vibration, etc. Unfortunately, an ideal spindle is a concept purely theoretical. Also, the concept of a spindle axis is theoretical. In fact, the commonly used concept of the spindle axis consists of a number of factors, e.g., concentricity of the outer (bearing) and inner surface (here, we attach, for example, a tool), concentricity of the bearing rings, misalignment of tool holder clamping, and many others. Instead of the spindle axis, we should use the term “axis of rotation”. In sum, it can be said that the spindle axis is a theoretical line outlined in the technical drawing, but in fact, there is an axis of rotation and, due to undesirable movements in the remaining five degrees of freedom, it is an undefined solid of revolution (
Figure 1).
In order to correctly determine the condition of the spindle, it is necessary to find and identify the sources of unwanted movements. The list of factors from which spindle error movements can arise is quite long, and many of their components may be completely unrelated to the spindle. For example, the measurement of error movements can be influenced by environmental disturbances such as floor vibrations, hall noise, or signal noise in the electrical network. On the other hand, it is easy to identify the influence of external factors such as temperature, load, speed, air pressure in the supply network, and direction of rotation. Therefore, identification, measurement, and analysis are required from the system that measures the spindle error movements in order to determine the influence of individual factors.
Many of the key concepts for measuring spindle accuracy are based on specifying one error motion parameter in each of three different classifications—this topic is described in details at [
1]. It is also important that, due to the small value of the measured quantity (micrometres), high precision of the measuring system is required (uncertainty in nanometres), which translates directly into its costs. The costs also depend on the number of degrees of freedom we measure simultaneously.
Few commercially available kits for measuring spindle error movements are offered. The manufacturer is required to have the correct design, execution and system software ensuring stability, the required resolution, and operational reliability. From the analysis of the literature, it can be concluded that, with the development of measuring sensors and DAQ (Data Acquisition) cards, more and more research centres are involved in the field of studying spindle error movements.
2.1. Theoretical Basis for Determining the Spindle Error Movements
As previously described, each rotating shaft (spindle) has one desired degree of freedom—the ECC, rotation around the stationary Z reference axis—and possible error movements in the remaining five degrees of freedom. Standards [
2,
3] define the types and directions of shifts of the real axis of rotation in relation to the Z reference axis.
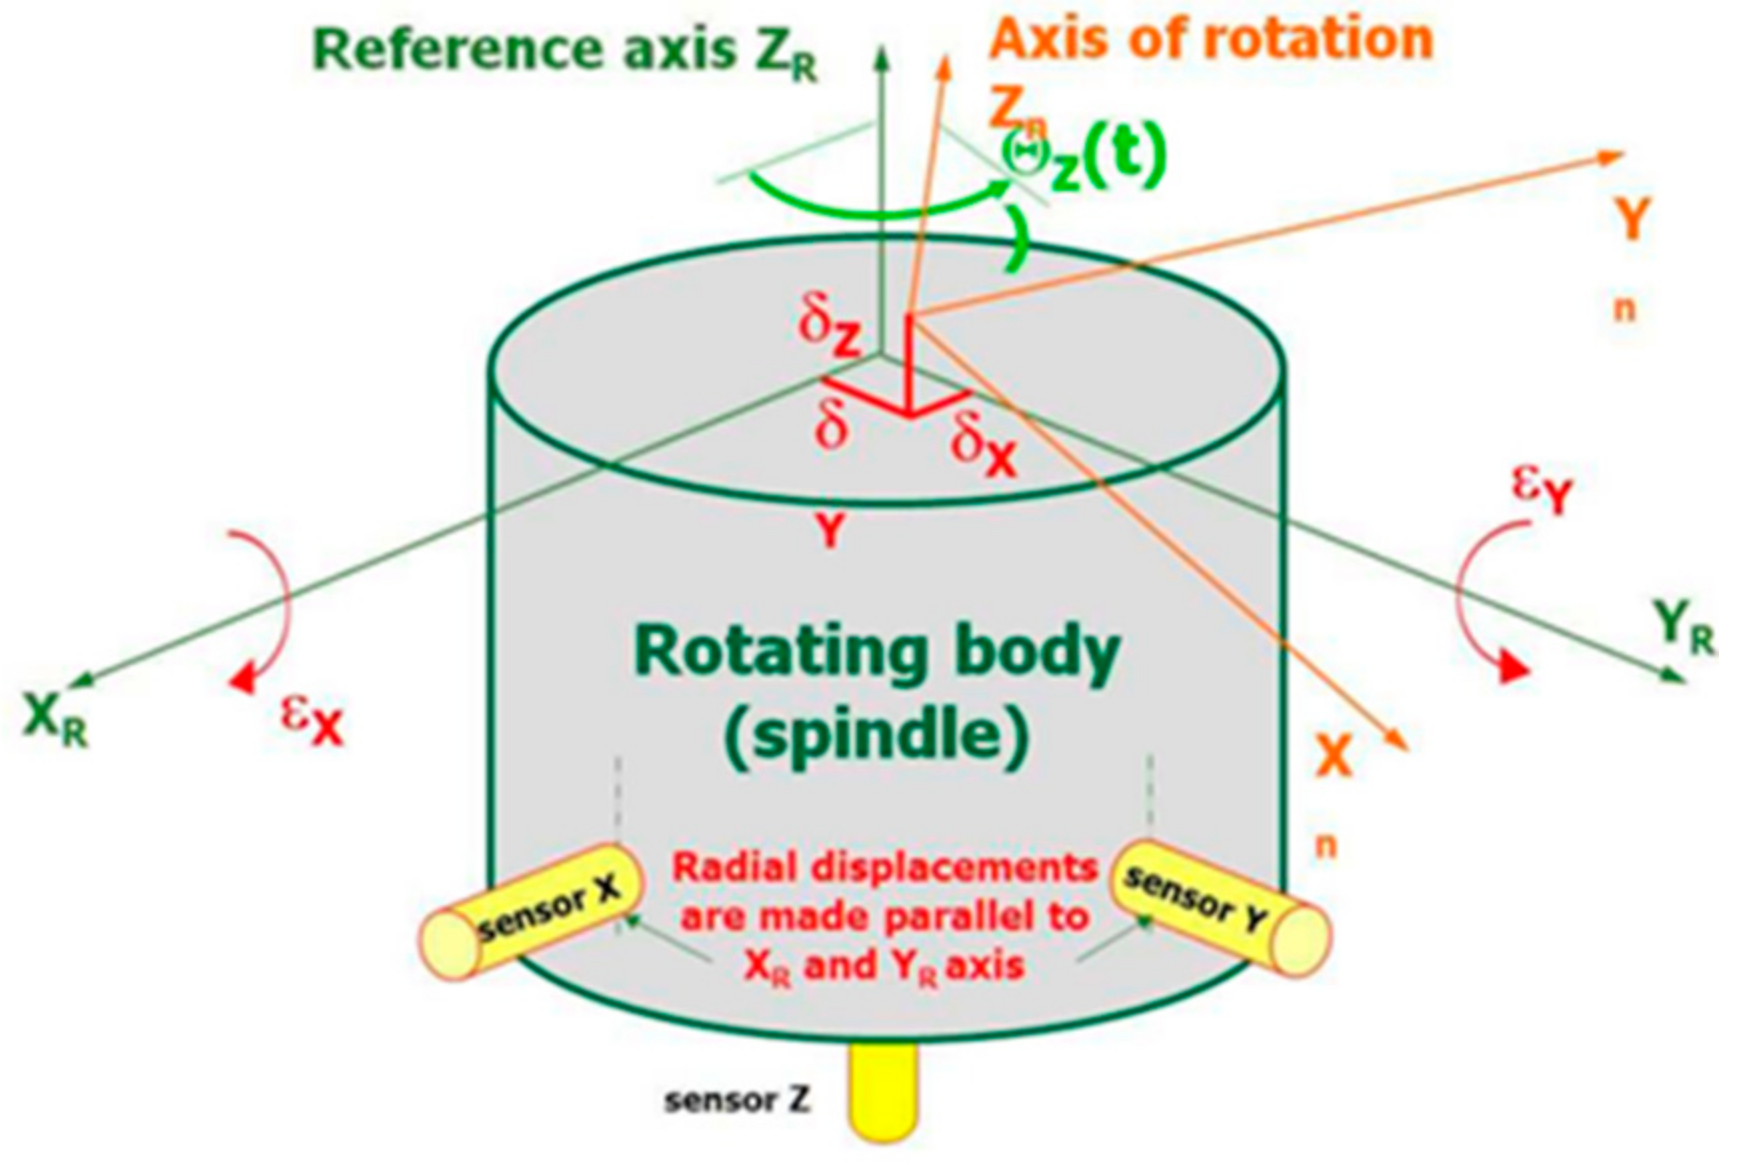
Figure 2. presents the method of spindle error measurement [
4].
EXC—radial displacement in the direction of the X reference axis;
EYC—radial displacement in the direction of the Y reference axis;
EZC—axial displacement in the Z axis;
EAC—rotational movement in regard to the X reference axis;
EBC—rotational movement in regard to the Y reference axis.
These error movements can be measured using five contactless sensors (capacitive or inductive) close to the mandrel mounted on the spindle: two in the Z-X and Z-Y planes and one in the spindle axis (ZR) (
Figure 2). Measurements made during fast spindle revolutions (several dozen or more measurements during one revolution) inform about spindle error movements in a stationary reference frame.
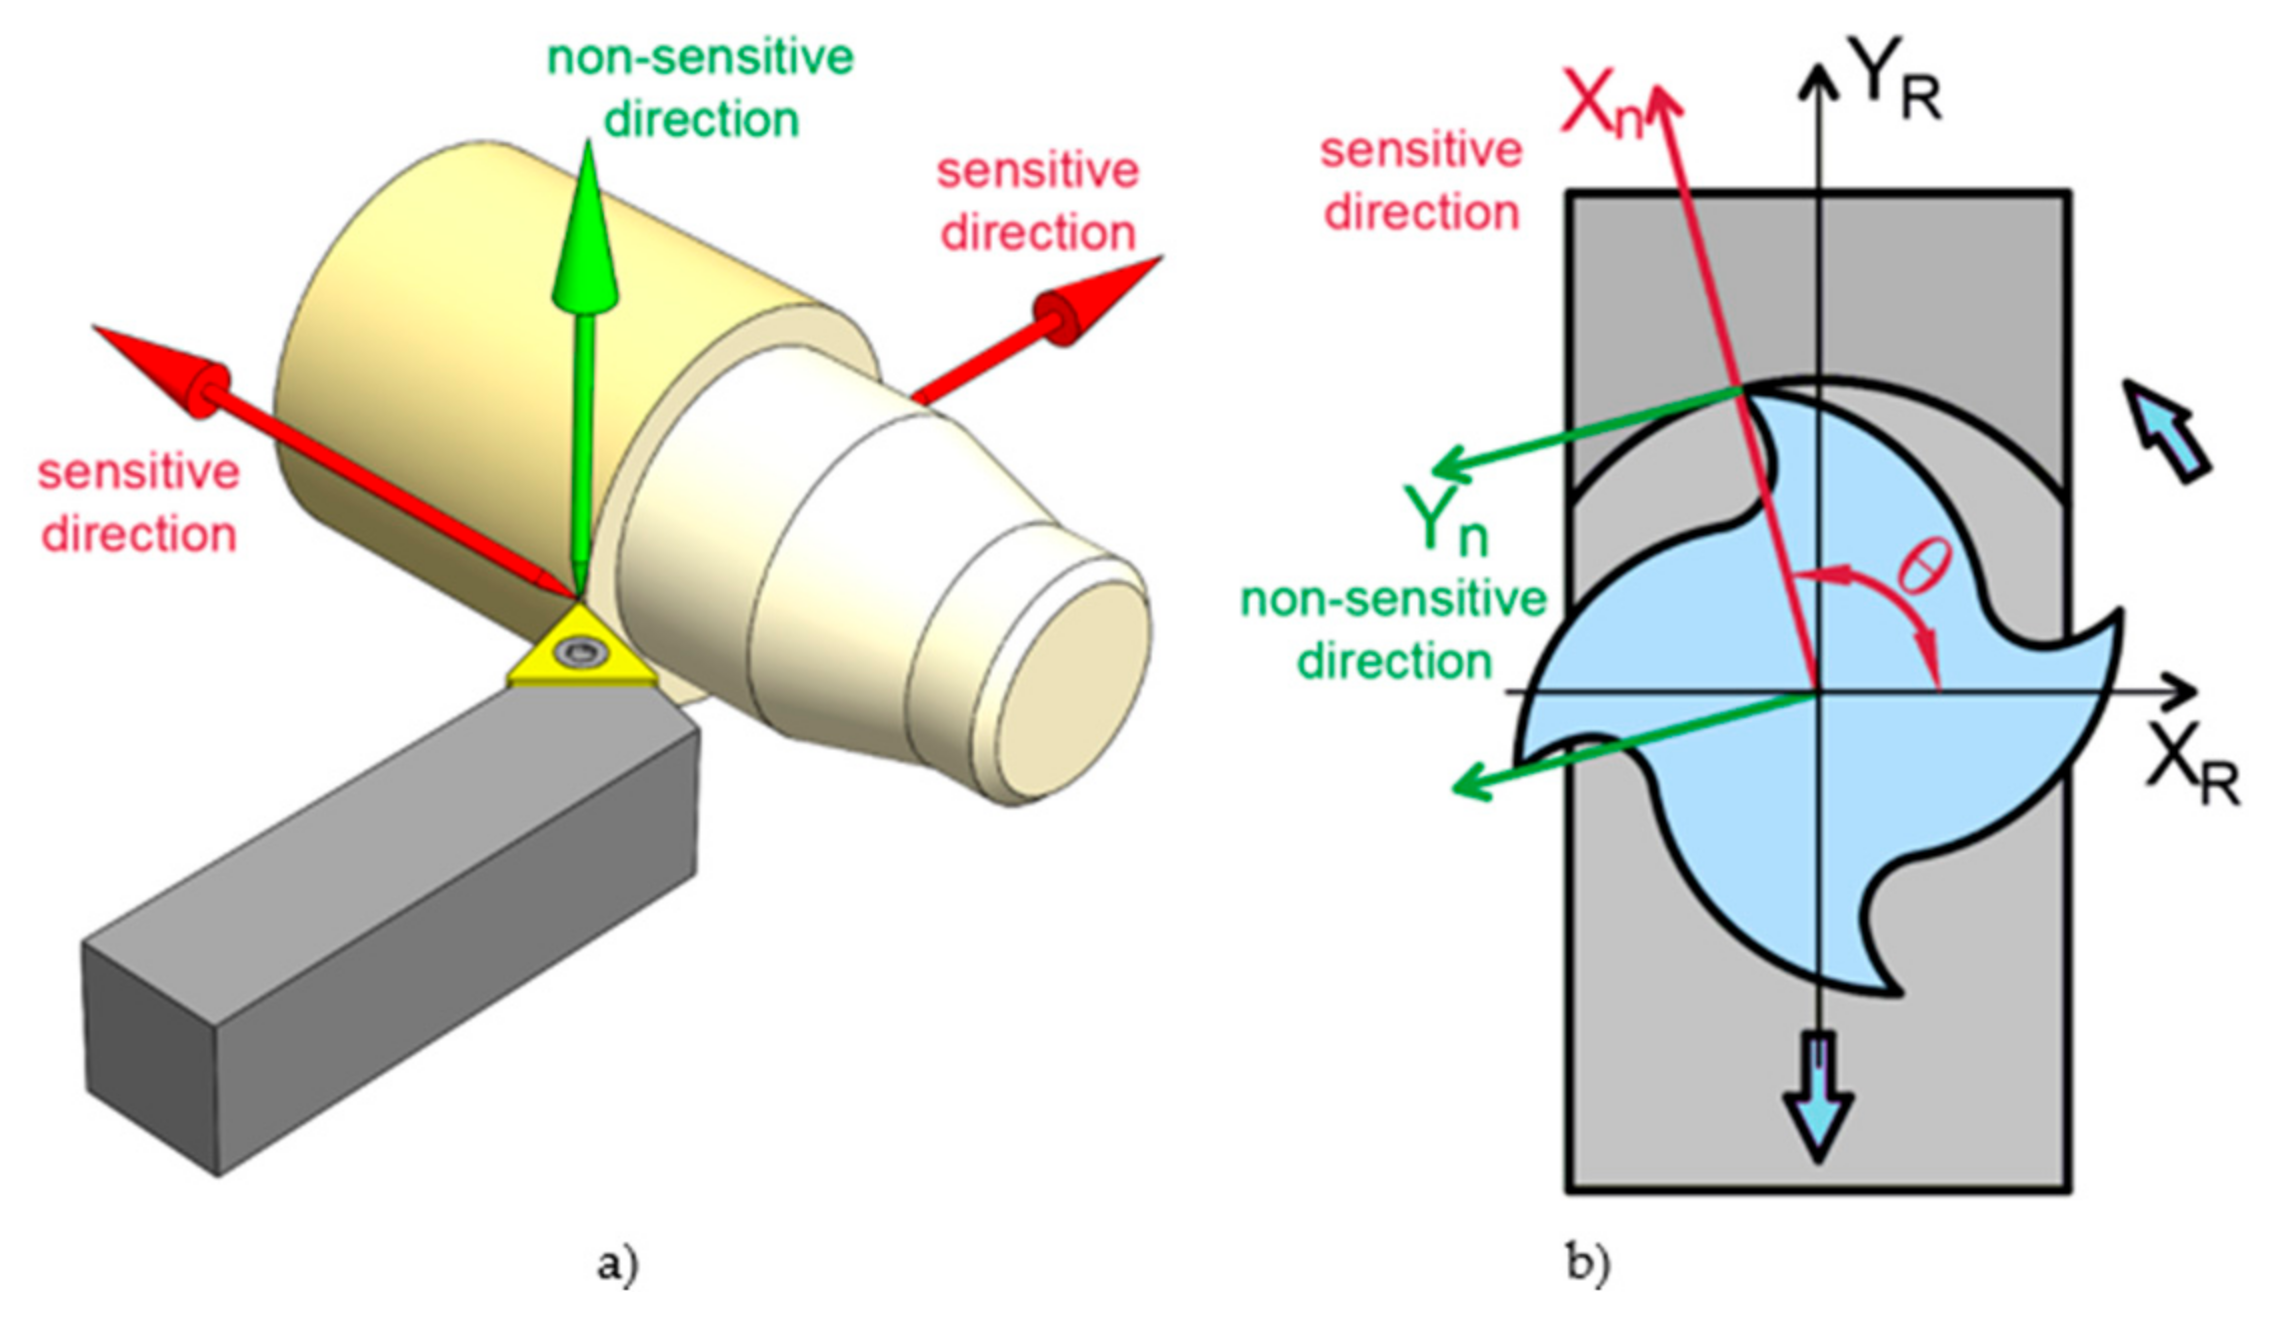
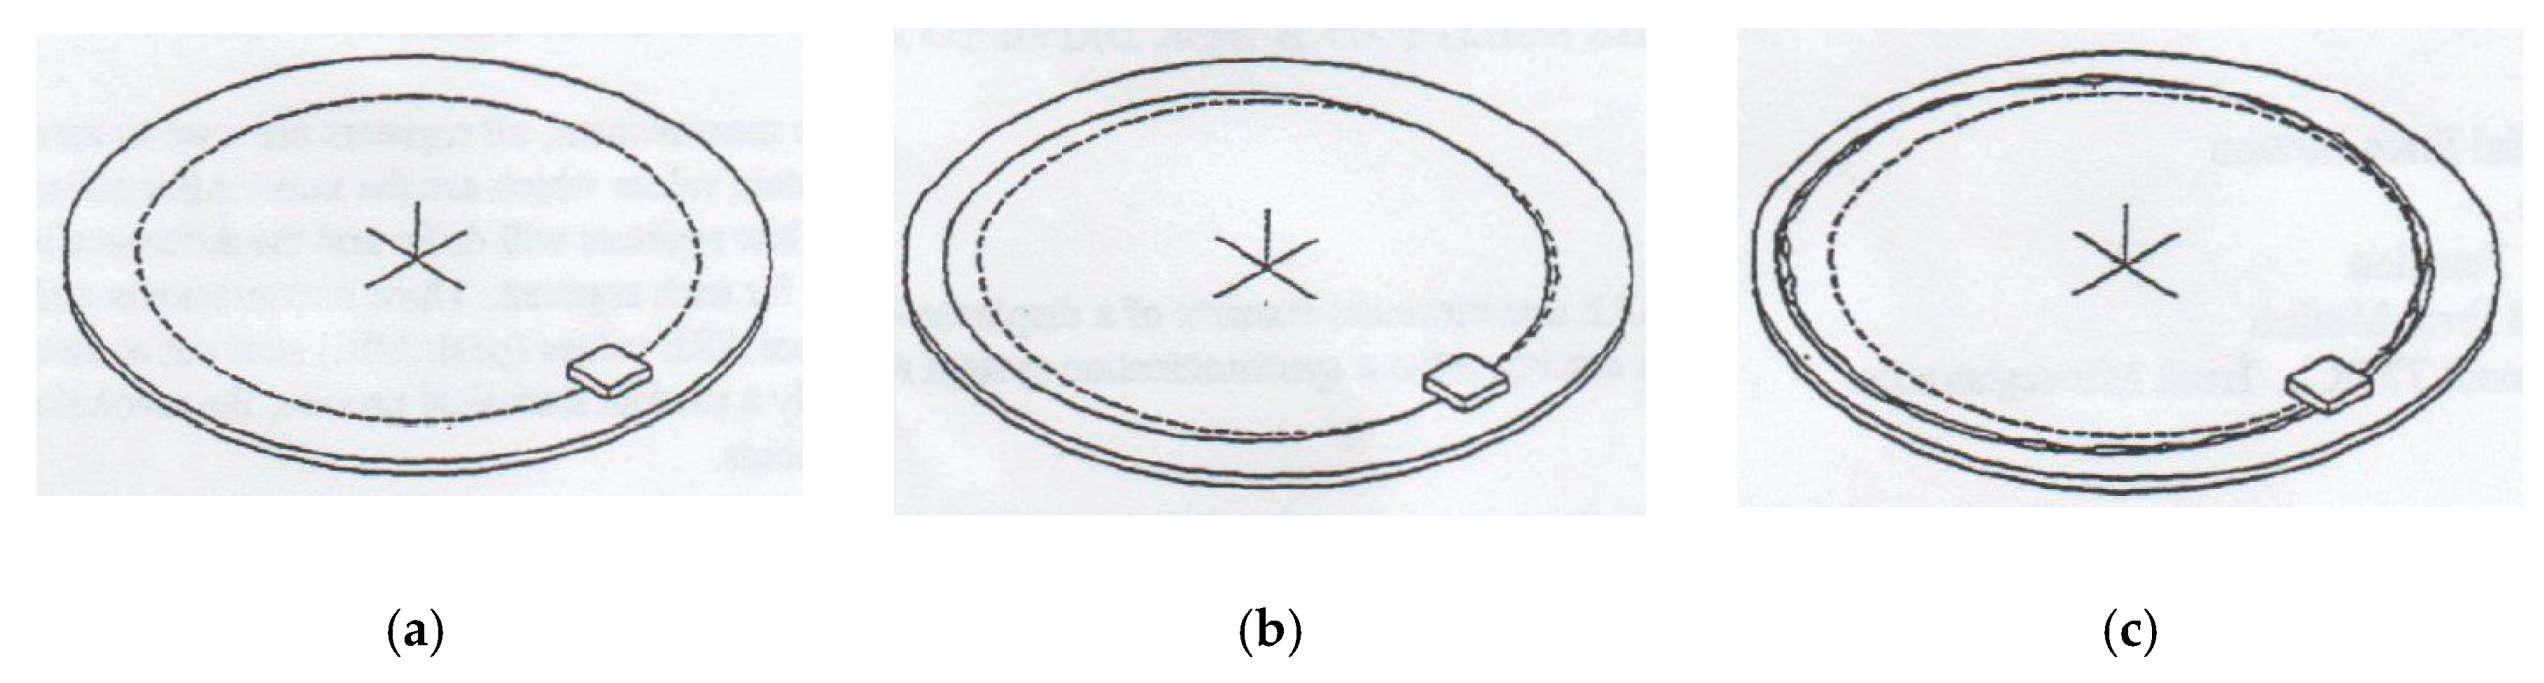
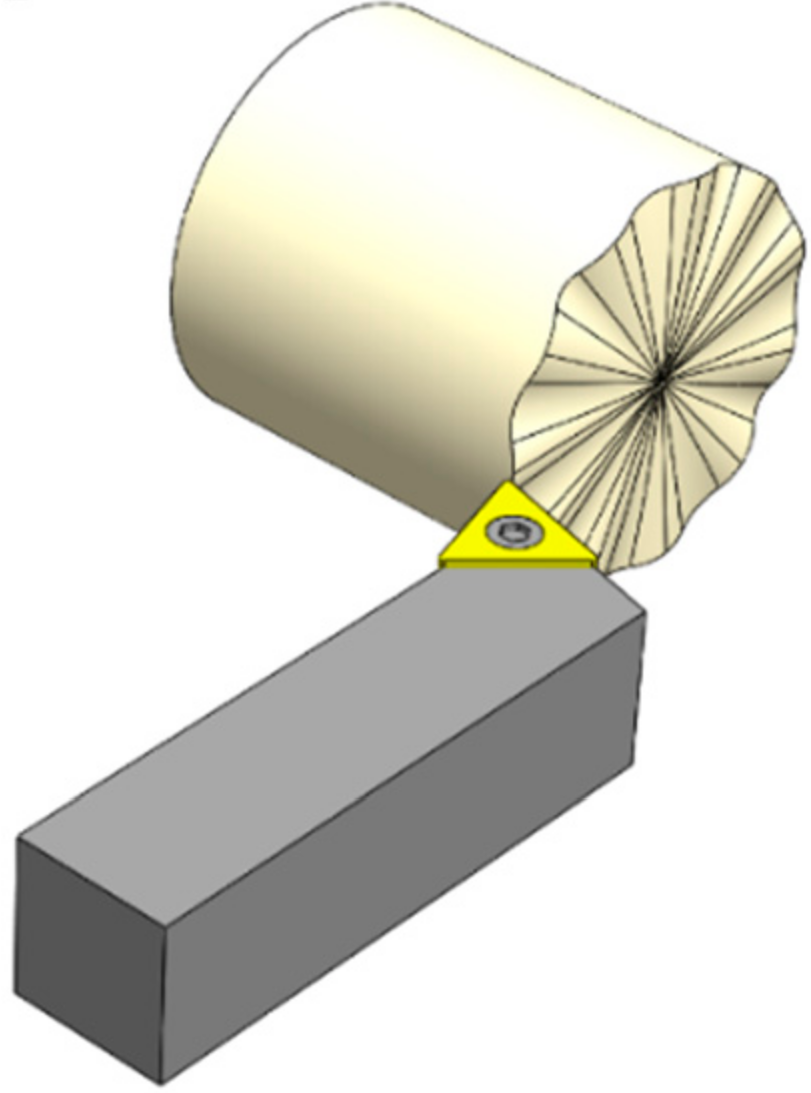
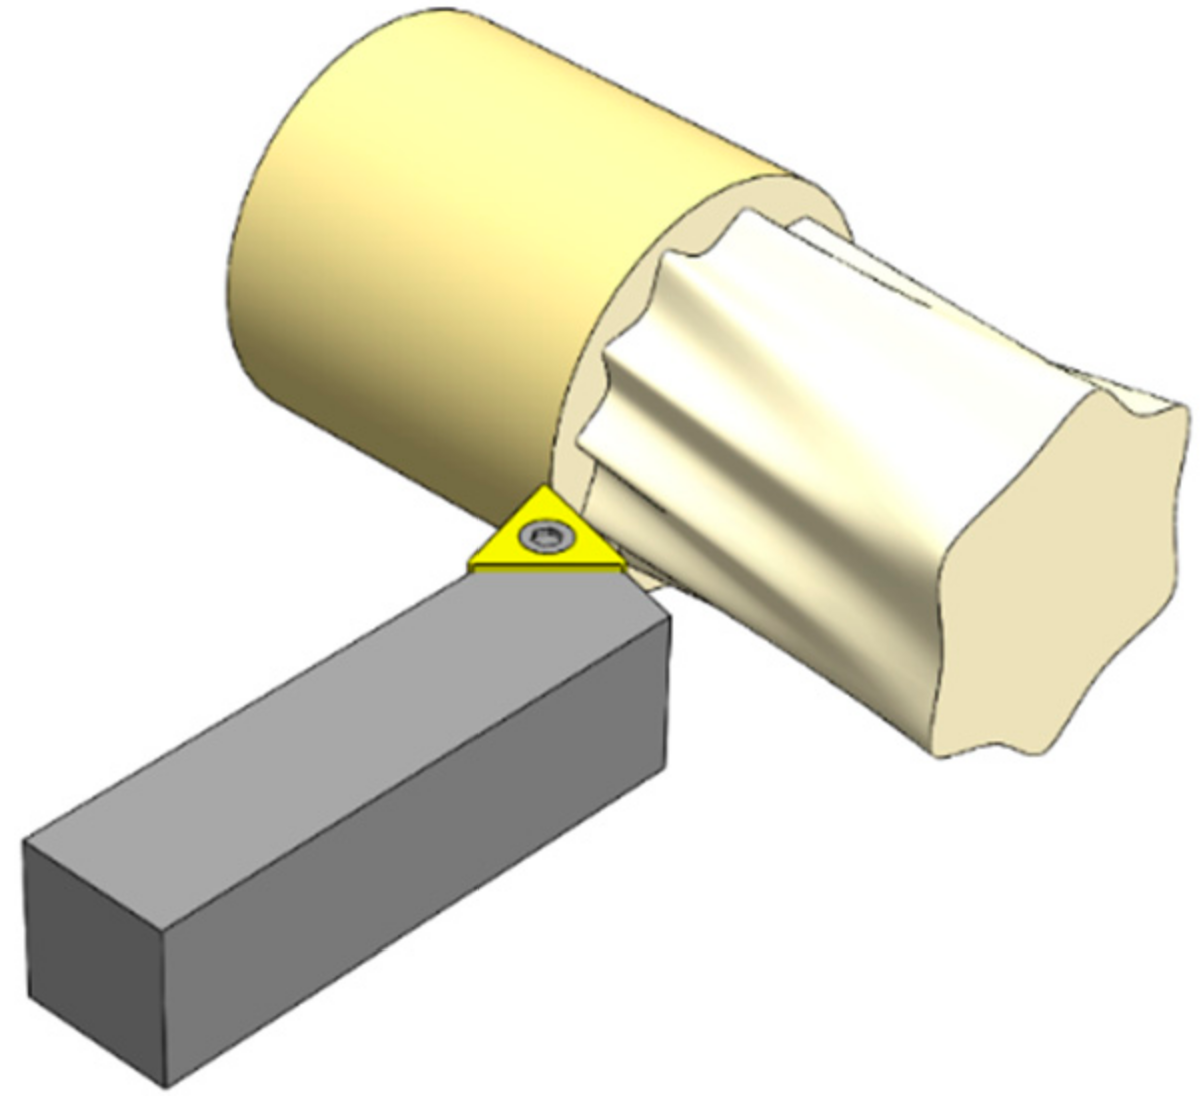
Meanwhile, from the point of view of machining accuracy, displacements in the so-called sensitive directions are important. For turning, this direction is stationary (like the tool in
Figure 3a), while for milling, it rotates with the tool (
Figure 3b).
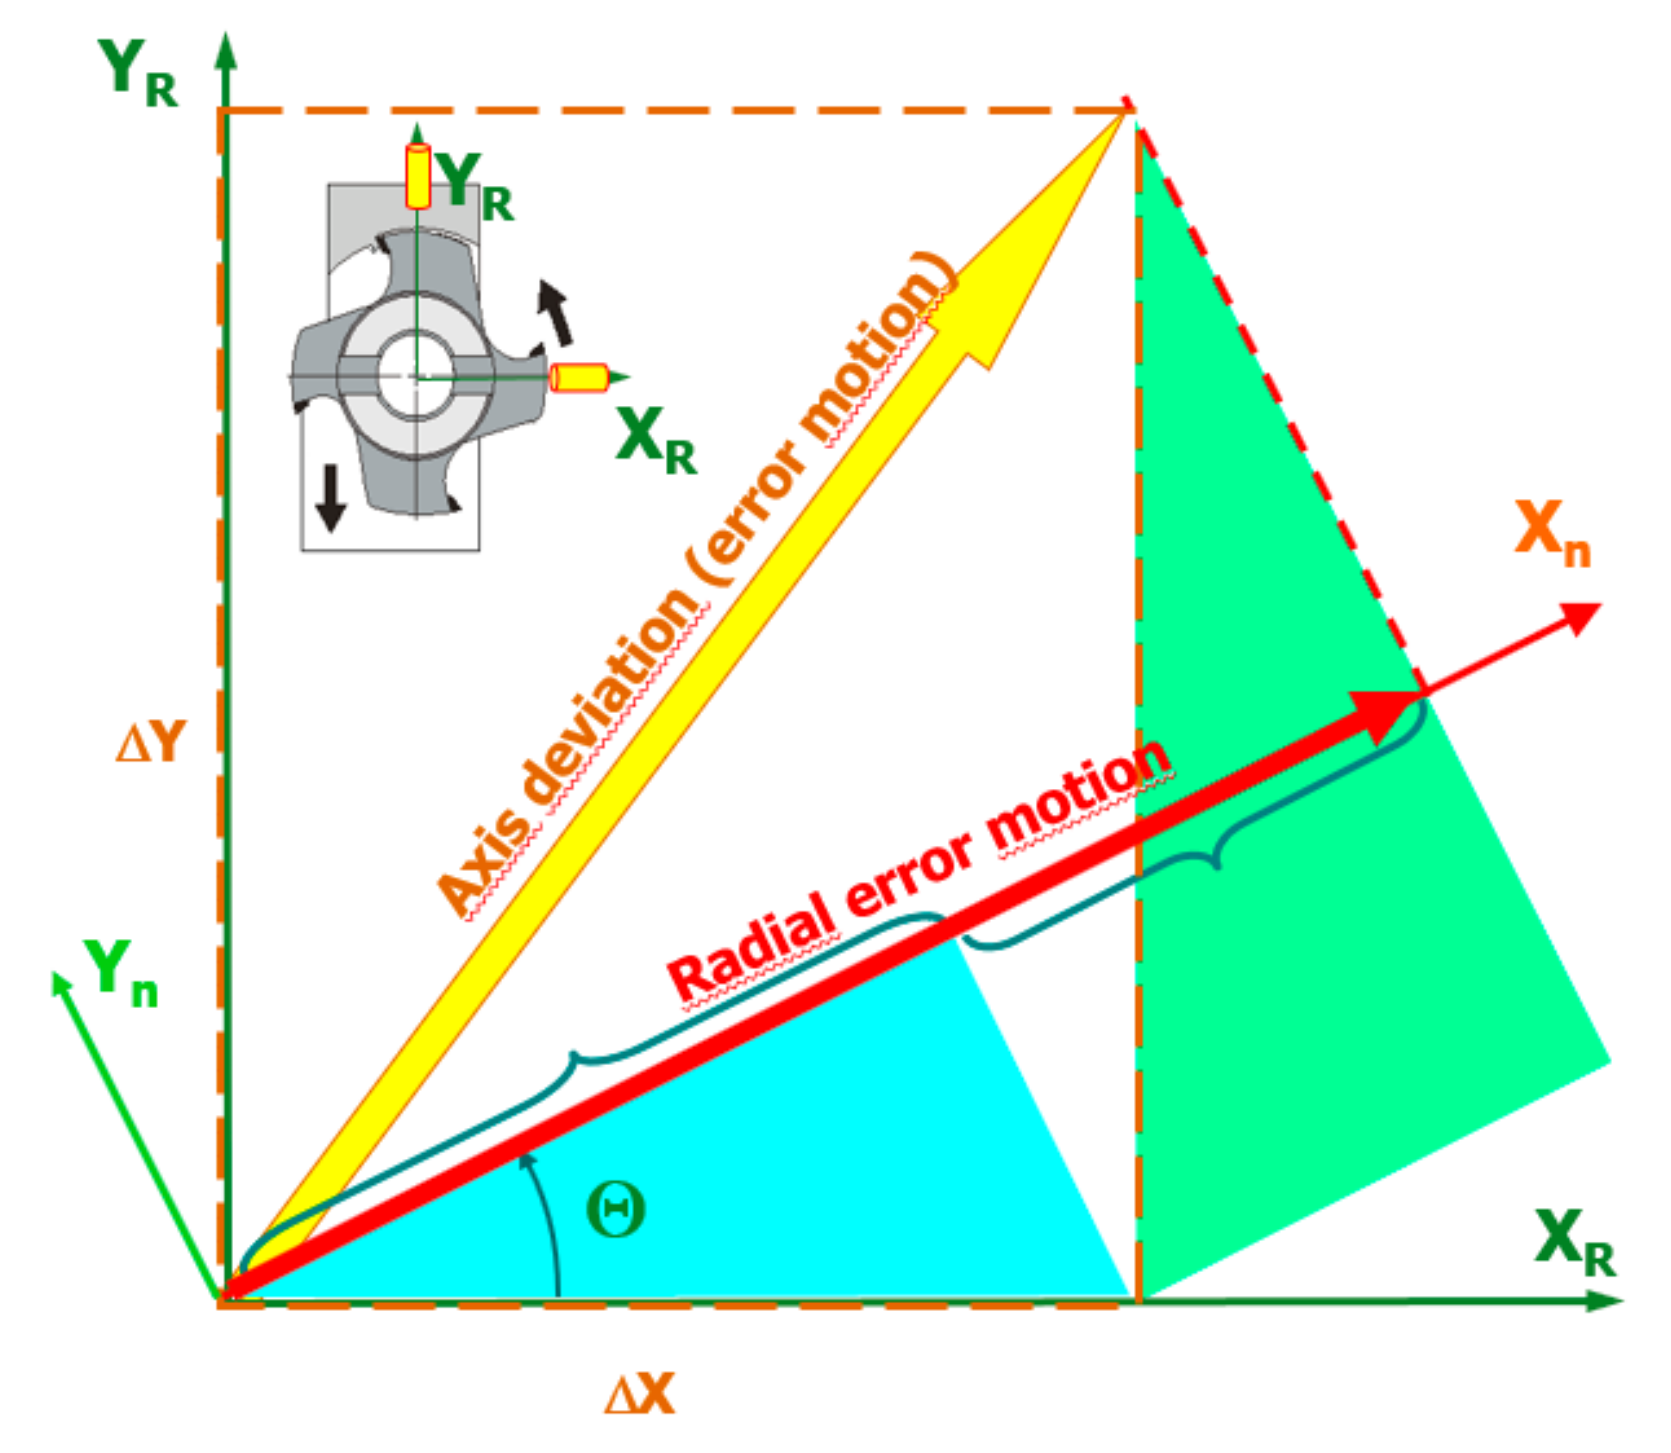
It follows that, for a turning spindle, you can limit yourself to three sensors and measure the displacements (error movements) of the spindle in one plane. The procedure for face milling is shown in
Figure 4.
Determination of the error radial motions is based on the radii of the circles determining the ideal and real motions of the rotating spindle. At outset, for example, by the least squares method, a mean circle (LSC (Least Squares Circle) is defined that represents the stationary axis of rotation of the spindle, and its centre, along with the graph, moves to the centre of the coordinate system. Its radius results from the gauge plunger eccentricity with respect to the axis of rotation and is not related to error movements. This eccentricity can be introduced to enable determination of the instantaneous rotation angle of the spindle θ (
Figure 2 and
Figure 4). The radius of the LSC can also be increased or even created virtually (mathematically) to make the graph more readable.
The results of measurements in XY coordinates must be projected onto the sensitive direction and presented as a function of the angle of rotation according to the following formula (
Figure 4):
Error movement data are plotted graphically in polar diagrams (
Figure 5) as originally suggested in 1959 by spindle metrology pioneer J. Tlusty [
5].
In the polar diagram of error movements, radial deviations from the multi-revolution equilibrium position relative to the rotation angle θ of the spindle axis position are indicated by radial lines. This graph may be the subject of further analysis, i.e., determination of total, synchronous (correlated with rotation) and asynchronous errors.
The current description of spindle measurement issues is dealt with in standards [
2,
3,
6,
7,
8]. These standards are mainly intended for OEMs (Original Equipment Manufacturer) and end-users; they update the methods testing and describing the spindle movement and reflect the progress in measuring and describing the movement of spindles. A key role in new measurement technologies is played by contactless capacitive sensors.
Measurements of synchronous and asynchronous errors during spindle rotation are described. Temperature measurement is also recommended.
The conducted measurements allow OEMs and spindle sellers to determine their capabilities:
determination of velocities causing resonance,
start-up time after which stable working conditions are established,
determination of repeatability,
determination of thermal conditions of both the machine and its surroundings,
possibility to analyse the spindle operation after a collision.
The machine user should receive complete diagnosis of the spindle condition, which allows them to determine the tolerance with which they will be able to make parts.
Generally, the standards define error movements that should be determined and provide a number of definitions and recommendations but do not provide detailed research methodology, especially the methodology of data acquisition and analysis.
2.2. Synchronous and Asynchronous Error Movements
Total error movement is a combination of all radial error movements of the spindle. Its value is the worst case possible, giving a preliminary estimate of the accuracy of the machine tool. The total error movement consists of asynchronous and synchronous error movements. It is important to distinguish between them because their causes are different.
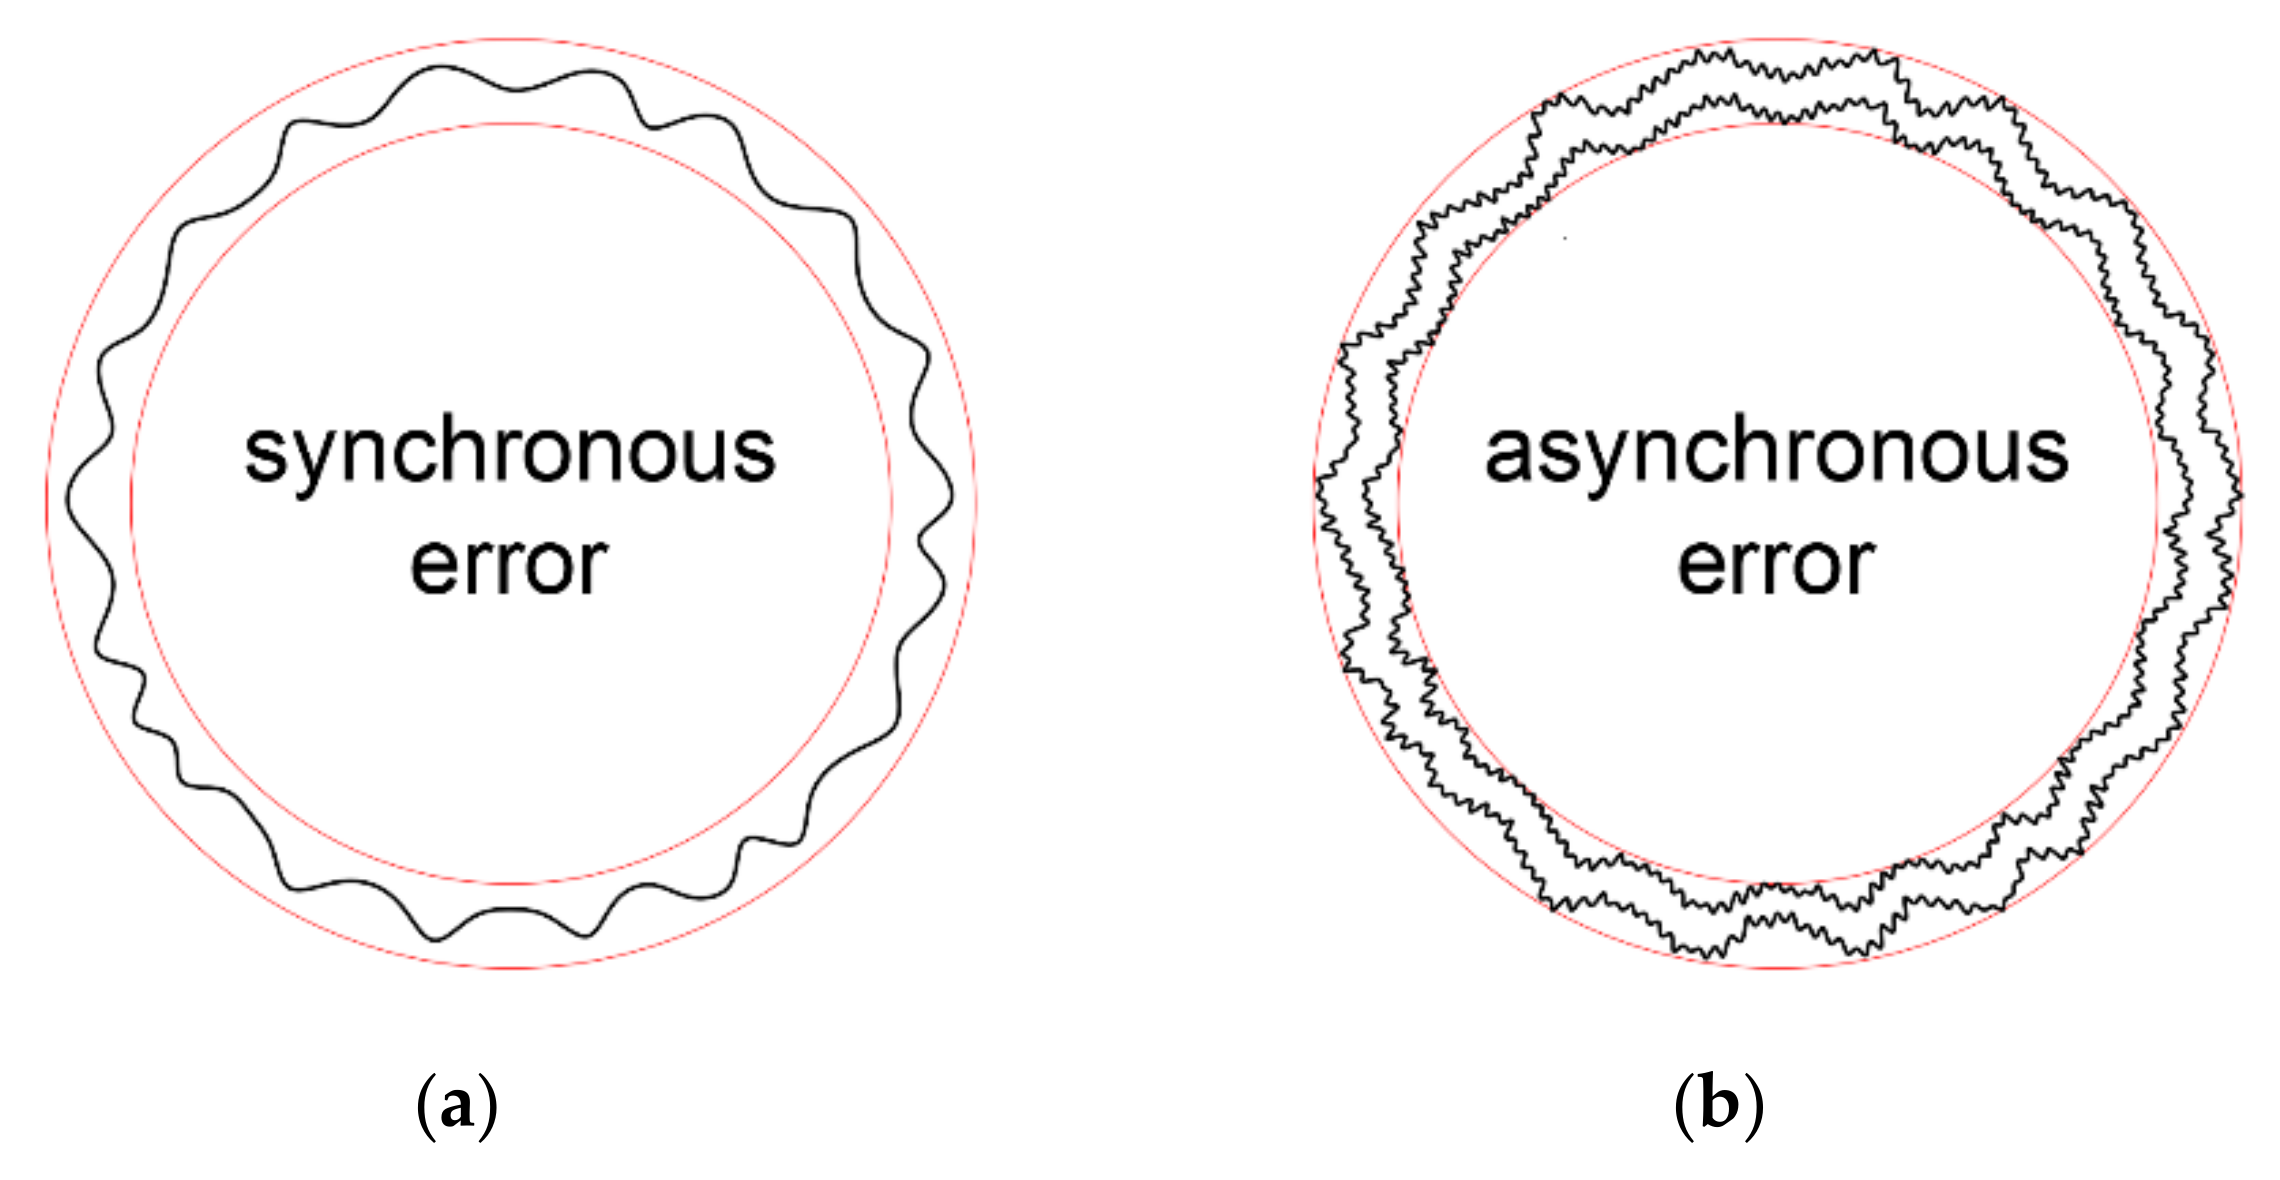
Synchronous movement errors are related to the spindle’s speed (angular position). This means that their value is the same at a certain angular position in every rotation.
The chart (
Figure 6) shows “lobes” that repeat with each revolution. In machining, a synchronous error movement causes, for example, irregularities in milled holes or turned external surfaces. The item will be made with the same number of “lobes” as shown in the diagram of synchronous movement error. The phenomenon of “lobes” in the synchronous error diagram is described in [
9].
Asynchronous error movements are not related to the rotational speed (angular position) of the spindle. They are characterized by “blurring” in polar diagrams and affect the quality of the treated surface. Although their sources may be well-defined and repeatable, they are not speed-synchronized, i.e., their frequency is not a multiple of the rotation frequency.
An excellent example to understand the importance of synchronous and asynchronous errors is shown in
Figure 7 [
10].
Figure 7a shows the path drawn by the head on a perfect disk rotating without error movements. In
Figure 7b, the rotating disk has only synchronous error movement. You can see that the path is not circular but has zero thickness despite multiple revolutions. In
Figure 8b, asynchronous error movement has been added. With each turn, the head leaves a slightly different trace. This increases the thickness of the path.
As can be seen from
Figure 8, the asynchronous error is not a random error but is an error that repeats for every non-complete multiple of the spindle’s rotation. In general, most movement errors in spindles on ball bearings are usually asynchronous errors.
It should be noticed that the problem of error separation is a very important part of the research on spindle error movements, which has been described in detail in many scientific publications [
11,
12,
13,
14,
15,
16,
17,
18]. The three most common types of spindles used in precision machining are spindles mounted on rolling, aerostatic, or hydrostatic elements. In spindles mounted on rolling elements, the value of synchronous error movement is usually less than 100 nm but the asynchronous error is usually much larger (100–1000 nm). The value of the total error movement is also significantly influenced by a level of pre-stress error less than the bearings [
19]. In high-quality aero or hydrodynamic spindles, the asynchronous error is less than 5 nm and the synchronous error is 25 nm [
20].
Based on the measurements and the analysis performed, one can, for example:
determine the condition of the bearings, the expected surface quality due to the obtained result of synchronous and asynchronous errors, improper machine levelling, and improper preload of the machine;
conclude at what rotational speeds the spindle will be susceptible to resonant vibrations (this information is especially important from the operators’ point of view); and
receive information on how the spindle will behave with sudden changes in speed, whether it results in deterioration of the workpiece geometry or not.
As previously mentioned, the condition of the machine tool spindle has a significant impact on the course of the machining process. The actual working conditions of the spindle, in particular, the continuous microscopic displacement of its axis of rotation, may cause deterioration of the surface quality and difficulty in meeting the requirements for geometric accuracy of the finished workpiece.
Figure 9 shows the example of the end face profile obtained as a result of machining on a lathe, the spindle of which is burdened with synchronous error movements—in particular, these are axial errors and tilt errors. For comparison, in
Figure 10, example of profile of the cylindrical surface after machining on the spindle with error movements are presented.
It should be remembered that the study of erroneous movements of machine tool spindles is only a small part of the extensive area of technical knowledge related to the design and operation of various types of machine tools. The International Organization for Standardization has developed a whole category of specialized standards [
21] dedicated to this issue.
3. Methods of Measuring Error Movements
Standards [
2,
3], apart from defining the basic concepts and formulating general recommendations, do not define a detailed research methodology and the issue of data acquisition and subsequent analysis is treated very briefly. In the process of planning a spindle error movement research strategy, it is necessary to identify the size and impact of possible geometry errors such as radial run-out consisting in the eccentric position of a spindle’s seat in relation to the bearing locating surfaces. This task is relatively easy because the methods to check geometric accuracy are widely known and their use allows relatively easy detection of basic manufacturing or assembly errors of the spindle’s components. It should be remembered that the known errors of spindle geometry should be included in the calculations of its error movements—such a task is easiest to accomplish by implementing appropriate mathematical algorithms in the control system. The same principles should be applied during testing with reference gauge plungers fixed to the spindle [
4].
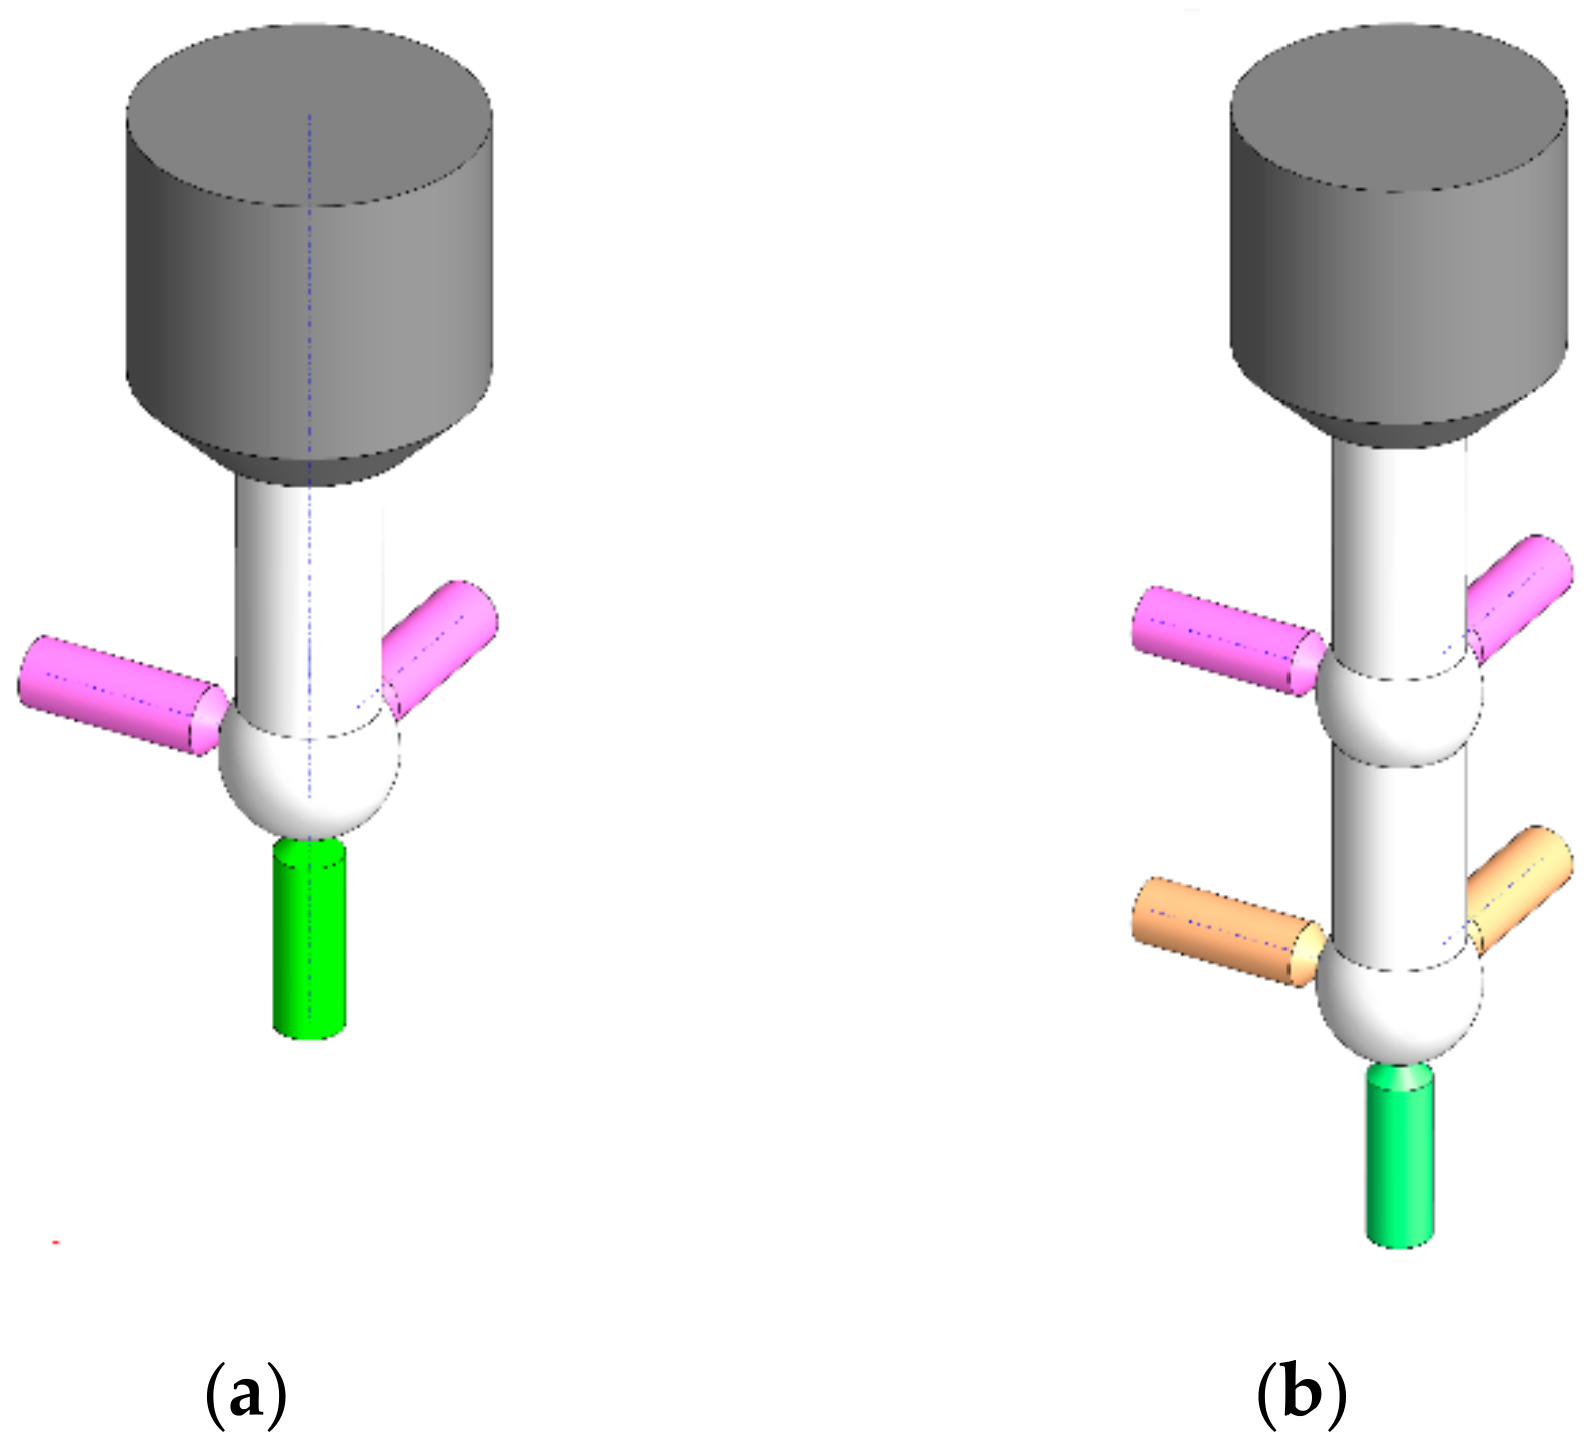
A configuration containing sensors (most often capacitive) and a metal, precise ball standard pattern (target) is called a traditional, conventional, or standard measurement method.
Figure 11 shows the measurement system consisting of three (a), and five (b) sensors, which additionally enables tilt measurement.
4. Commercial Systems for Testing Error Movements of High-Speed Spindles
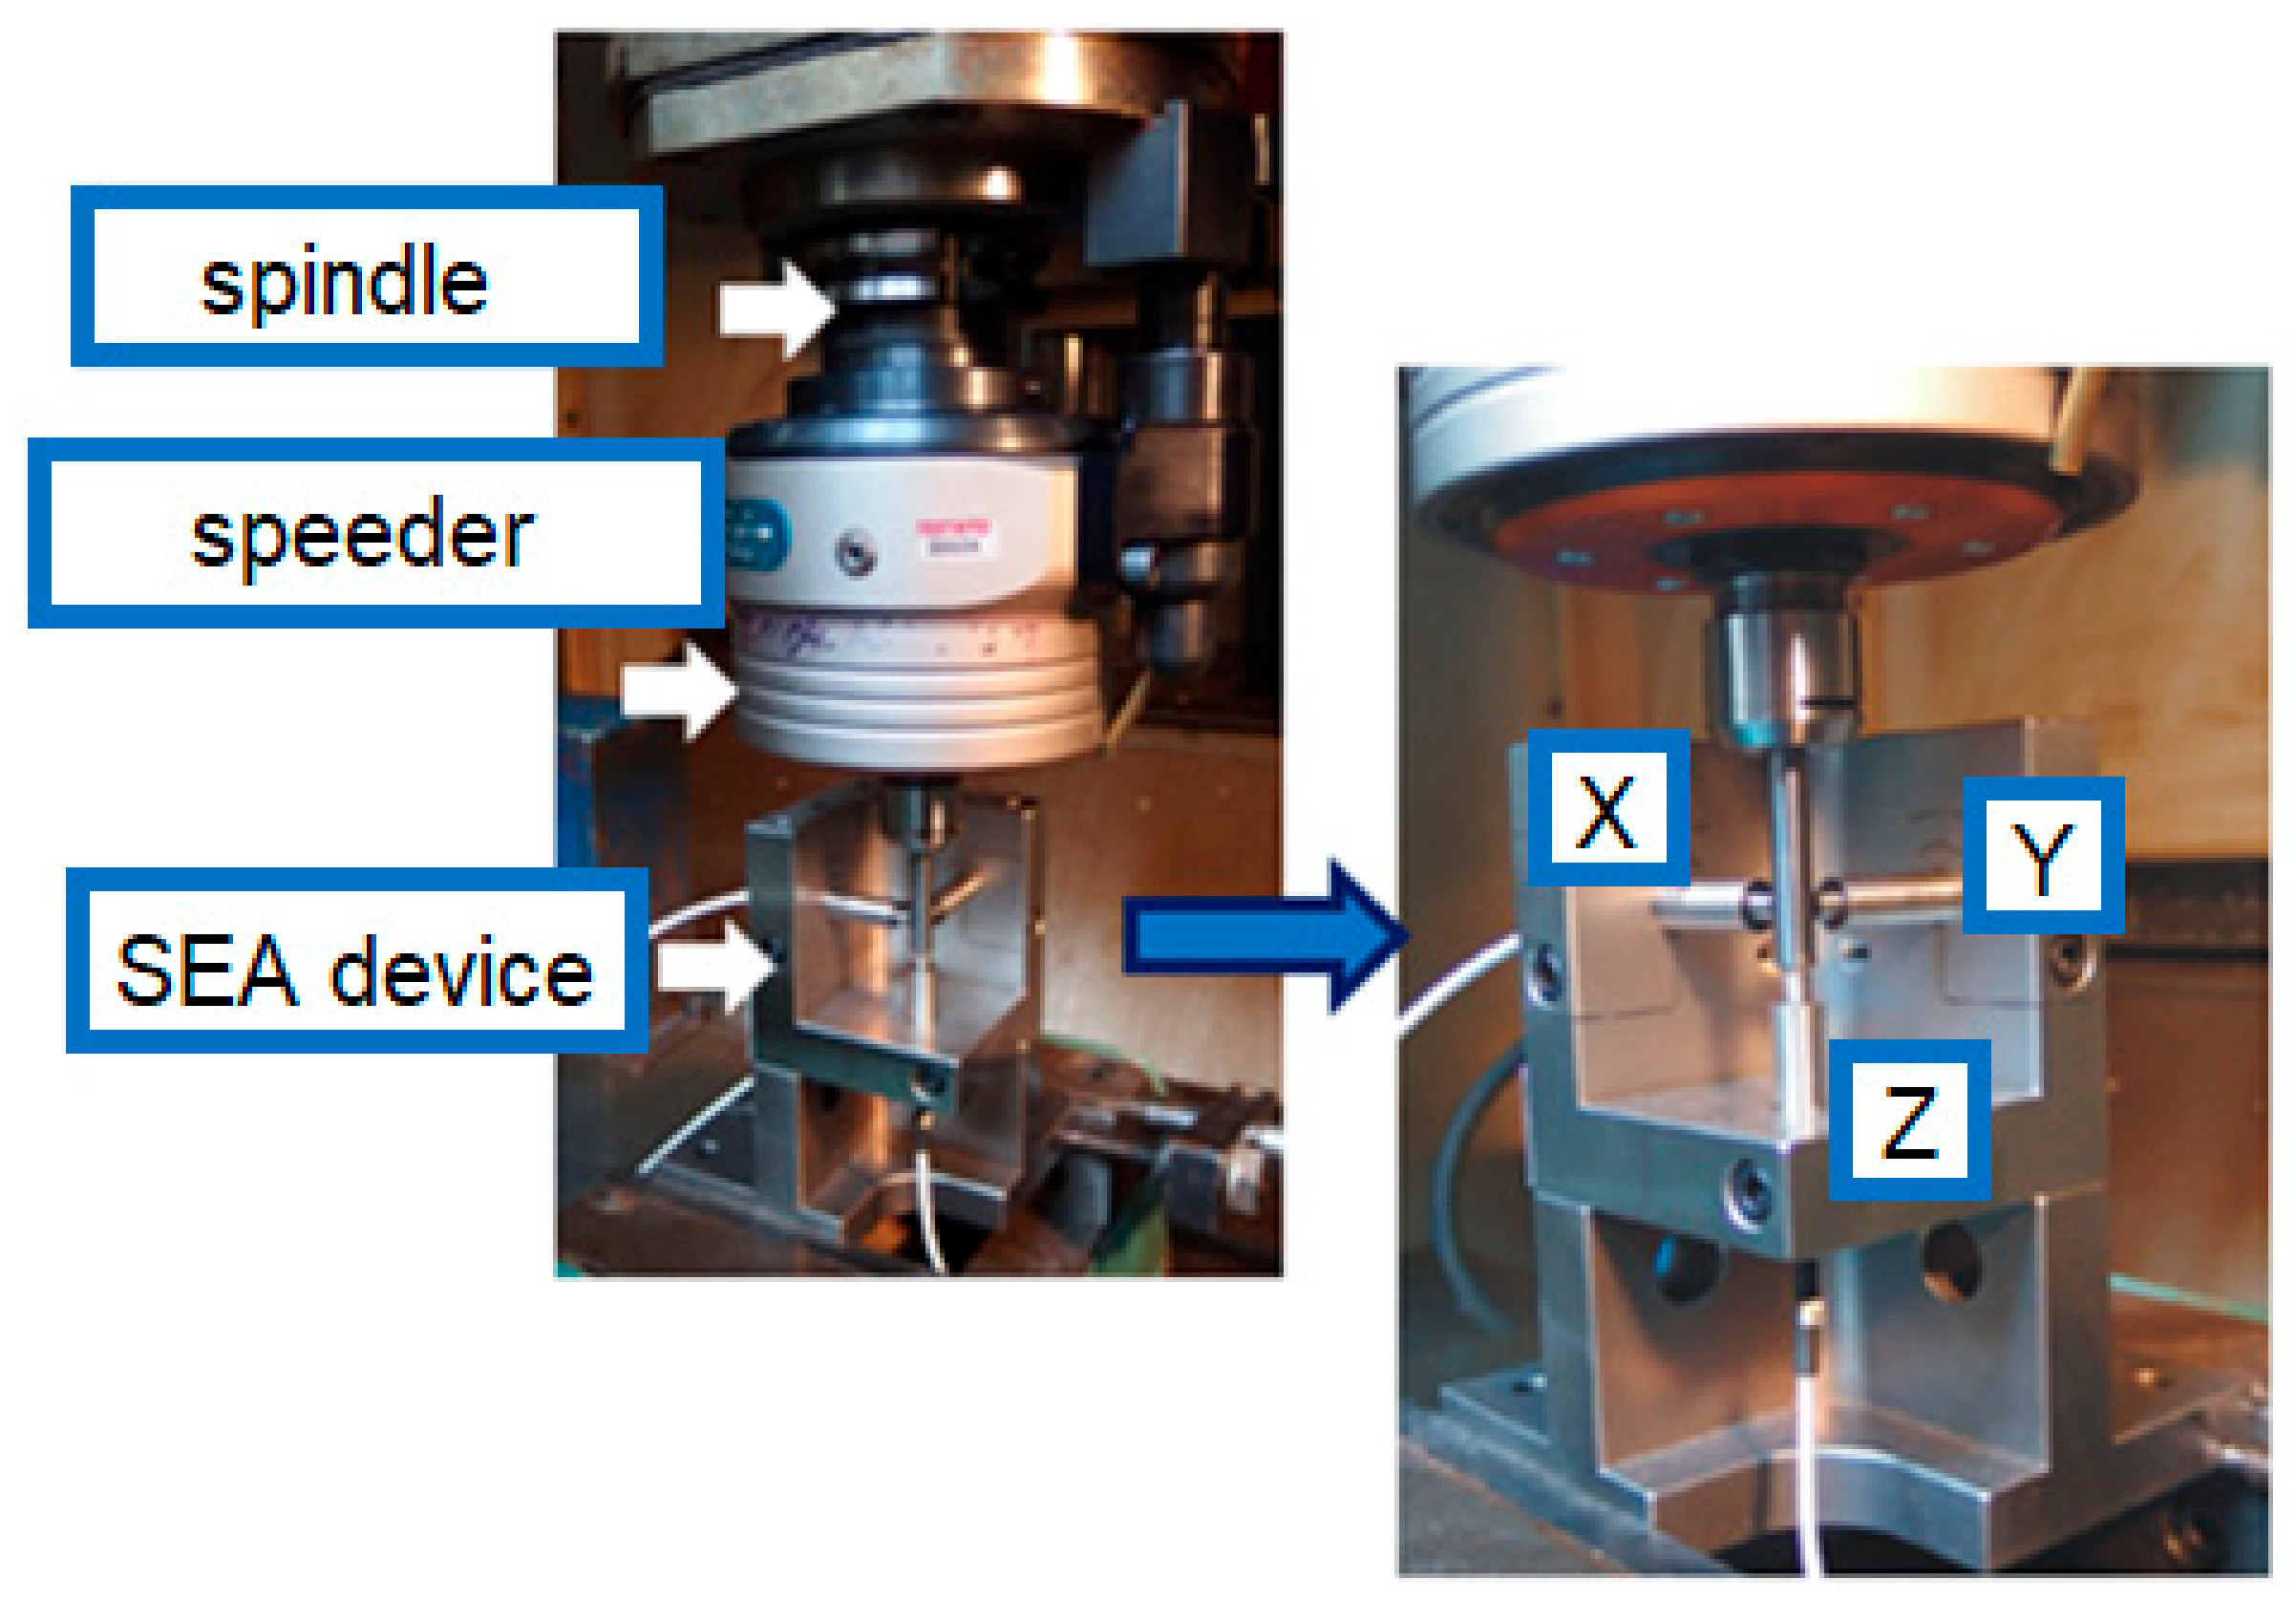
4.1. System SEA (Spindle Error Analyzer)—Lion Precision
Lion Precision is one of the few systems that developed a comprehensive system for testing spindle error movements (current version SEA 8.5). The system is designed in such a way that, without expert knowledge, the intermediate user can easily perform measurements on a machine tool located in the production hall, in a real environment in which the user works. This allows for calculation of how spindle error movements affect the tolerance of the workpiece. The configuration of the sets proposed by Lion Precision is based on the traditional measurement method.
The company states that, by measuring machines with the SEA system before purchase, the user can avoid buying a machine (which is not cheap) that is unable to produce items with a strictly defined tolerance. The basic measuring elements of the SEA system are contactless, precise capacitive displacement sensors. The system may use three or five sensors depending on the tested rotational speed of the spindle. Additionally, you can connect up to seven temperature sensors and the output from the encoder for measuring the spindle’s rotation angle.
The signals from the sensors and the encoder, after passing through the filters and amplification, are fed to the inputs of the National Instruments DAQ card. The copyrighted software from Lion Precision interprets the sensor outputs as changes in the dimensions of the position and displays the results digitally and graphically. For detailed information, especially that needed for FFT analysis, many samples per revolution are required. Five measuring channels are available for testing faster spindle speeds (in the range of 120–180 thousand (rpm)). Along with development of the software, more and more attention is paid to the ease of use of the device. In the new version, manufacturer’s support during operation of the measuring system is practically redundant. In addition, problems related to the sampling rate of the device and software installation have been resolved.
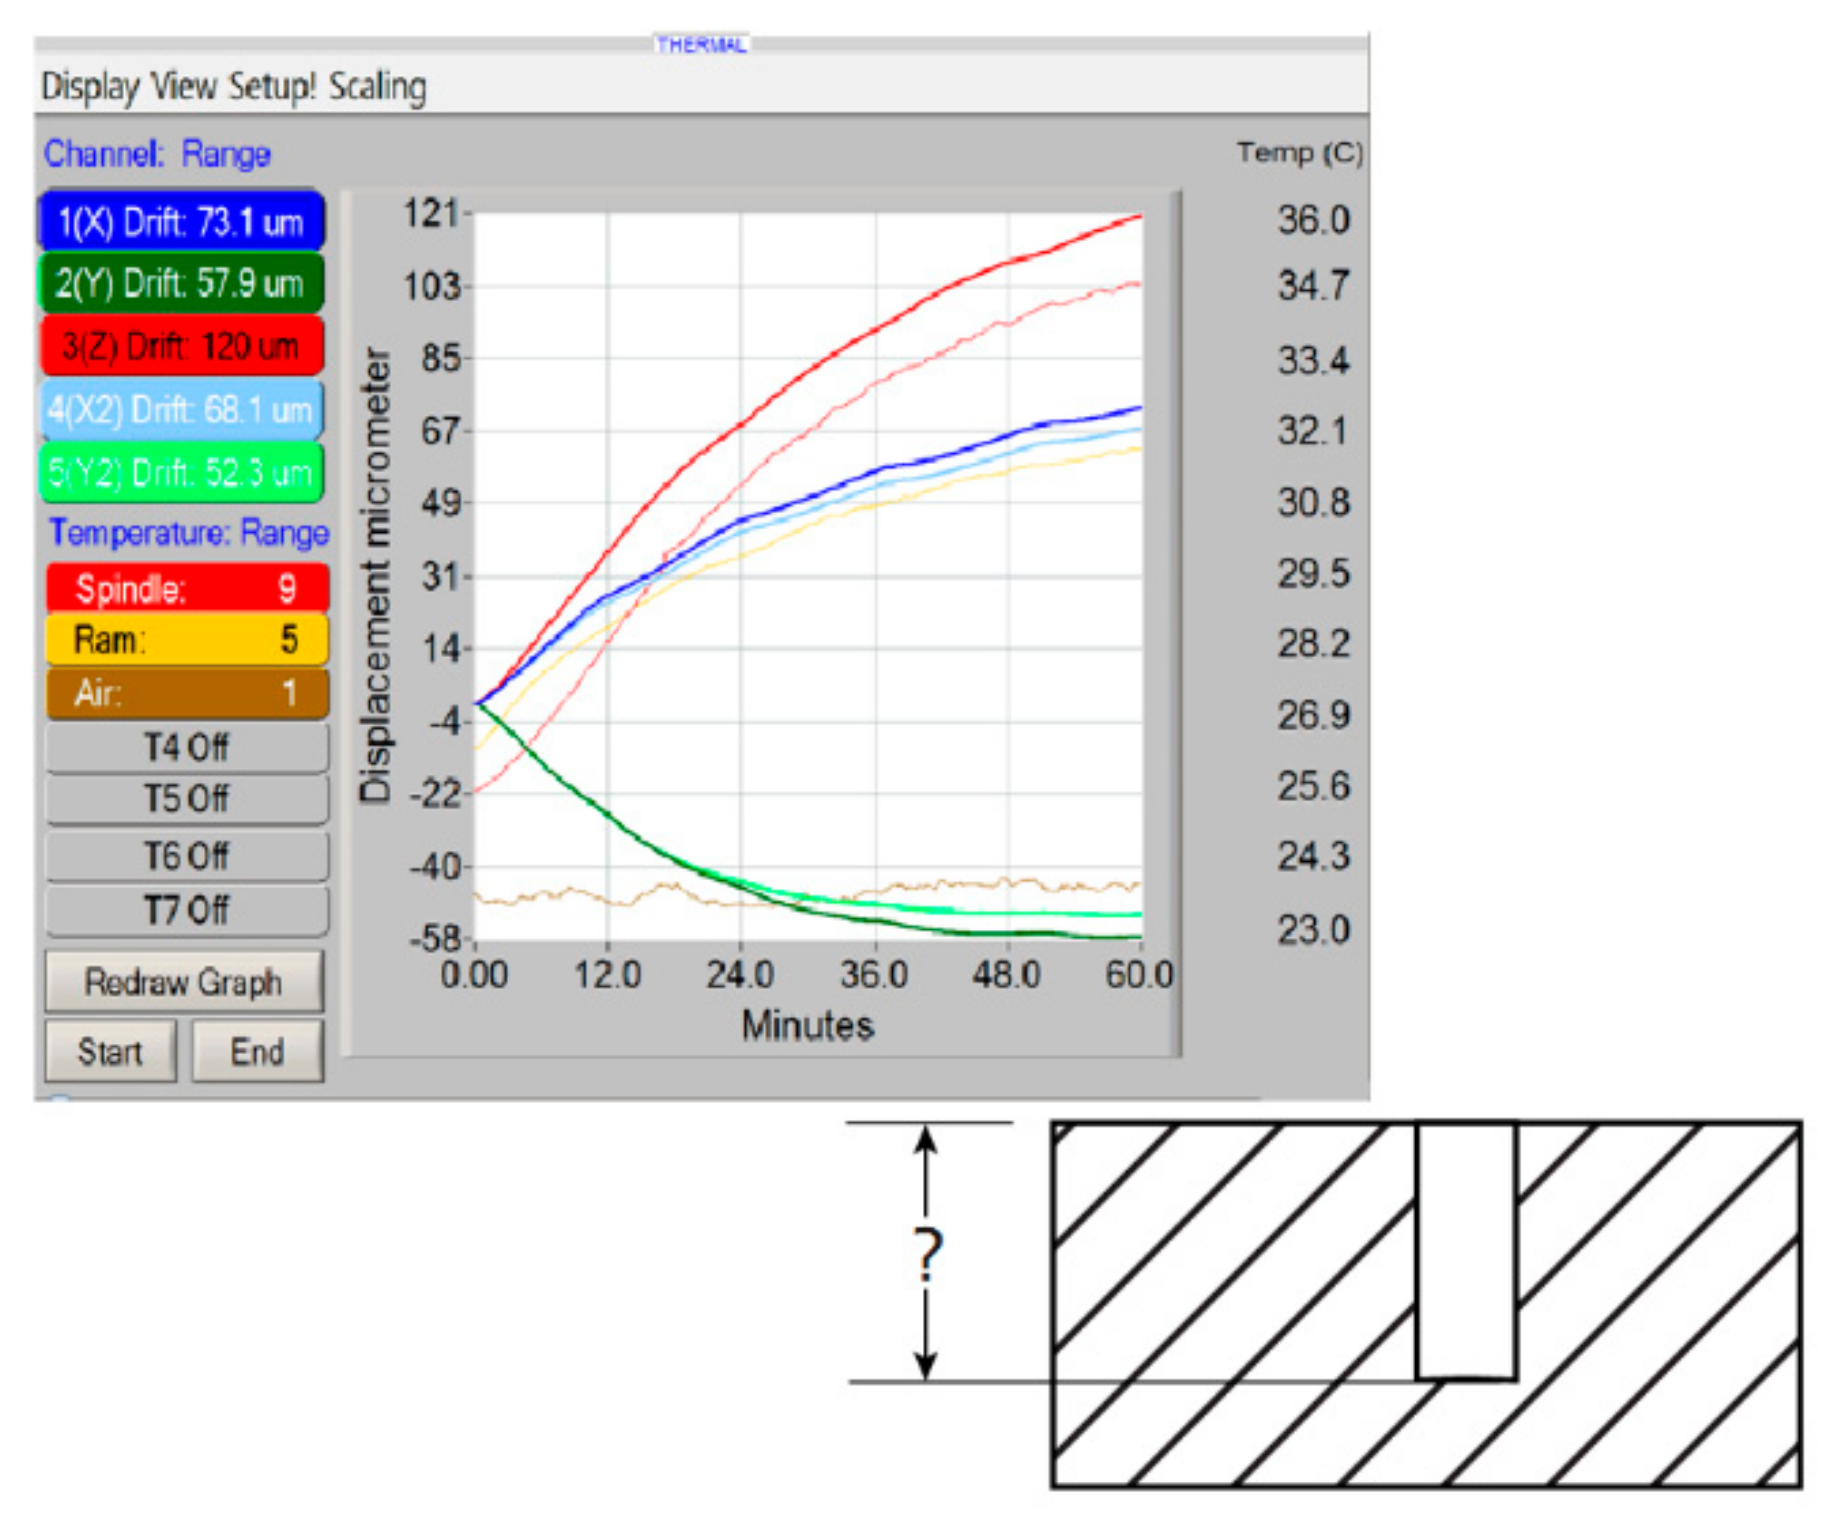
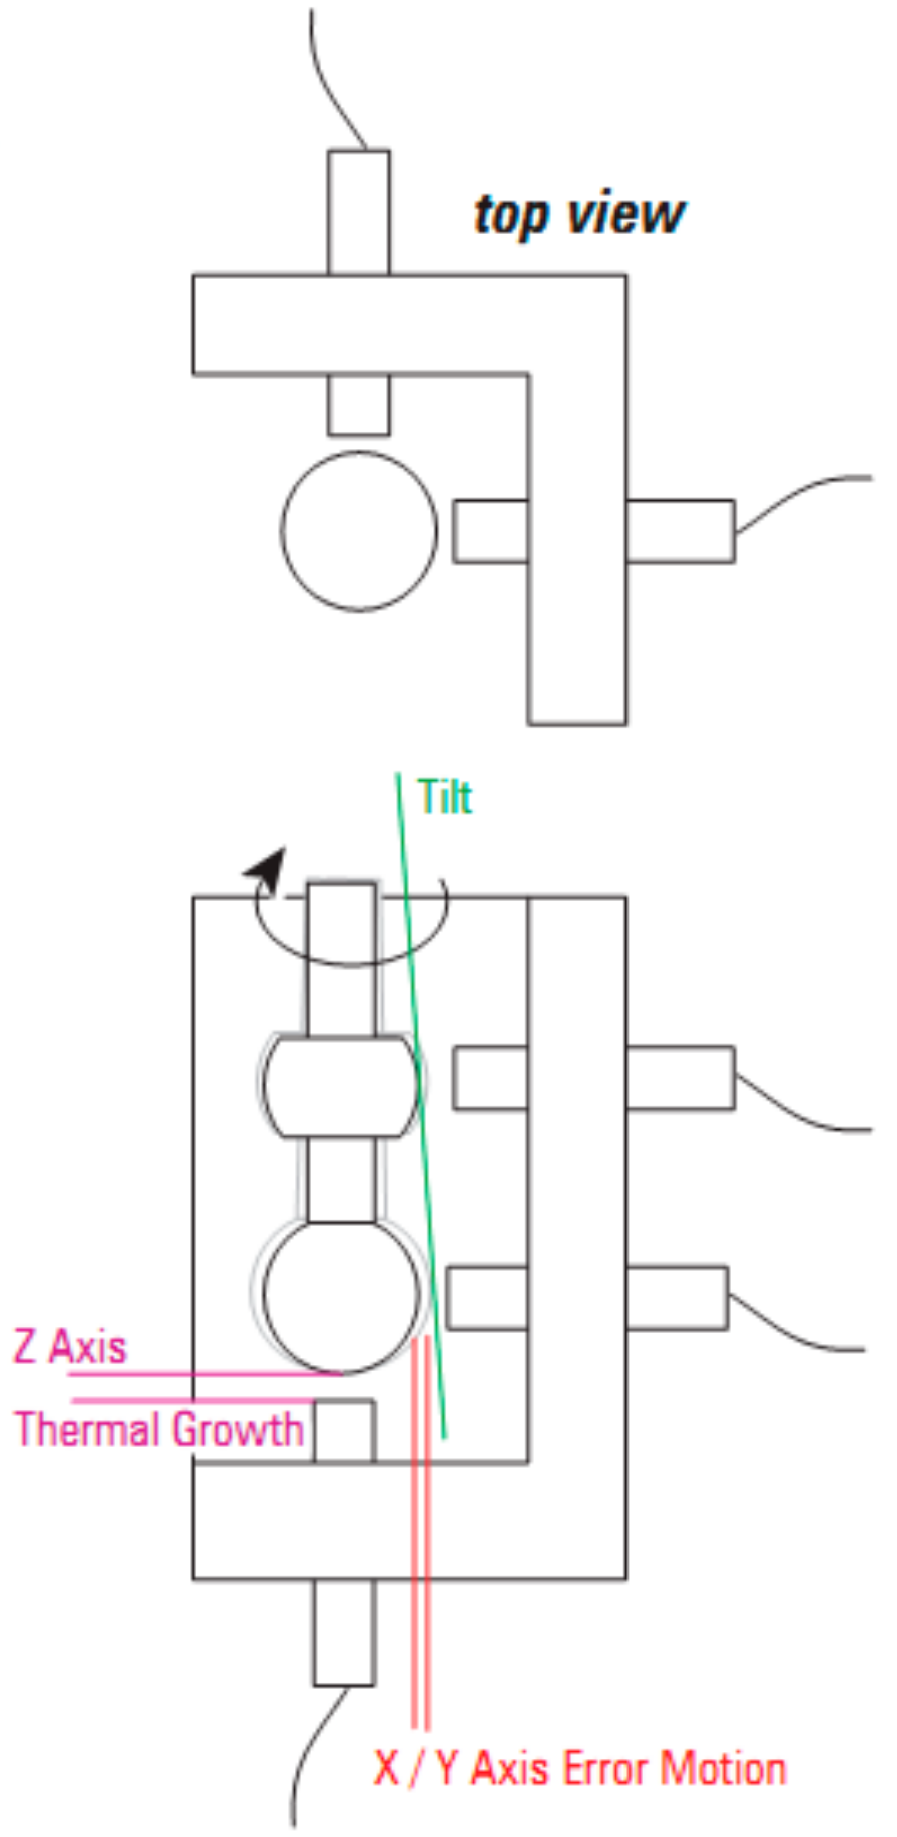
New versions of the system focus on two types of errors:
- -
related to ambient temperature and operation of the machine itself (
Figure 13)
- -
related to spindle error movements.
To measure spindle error movements, sensors positioned perpendicular to each other, preferably parallel to the main axes of the machine, measure the distance to a precisely machined sphere or cylinder, with known non-roundness, mounted in the spindle’s holder. Arrangement of sensors is shown in
Figure 14.
Depending on the type of machine and the tested rotational speed of the spindle, the set comes with several options (
Table 1).
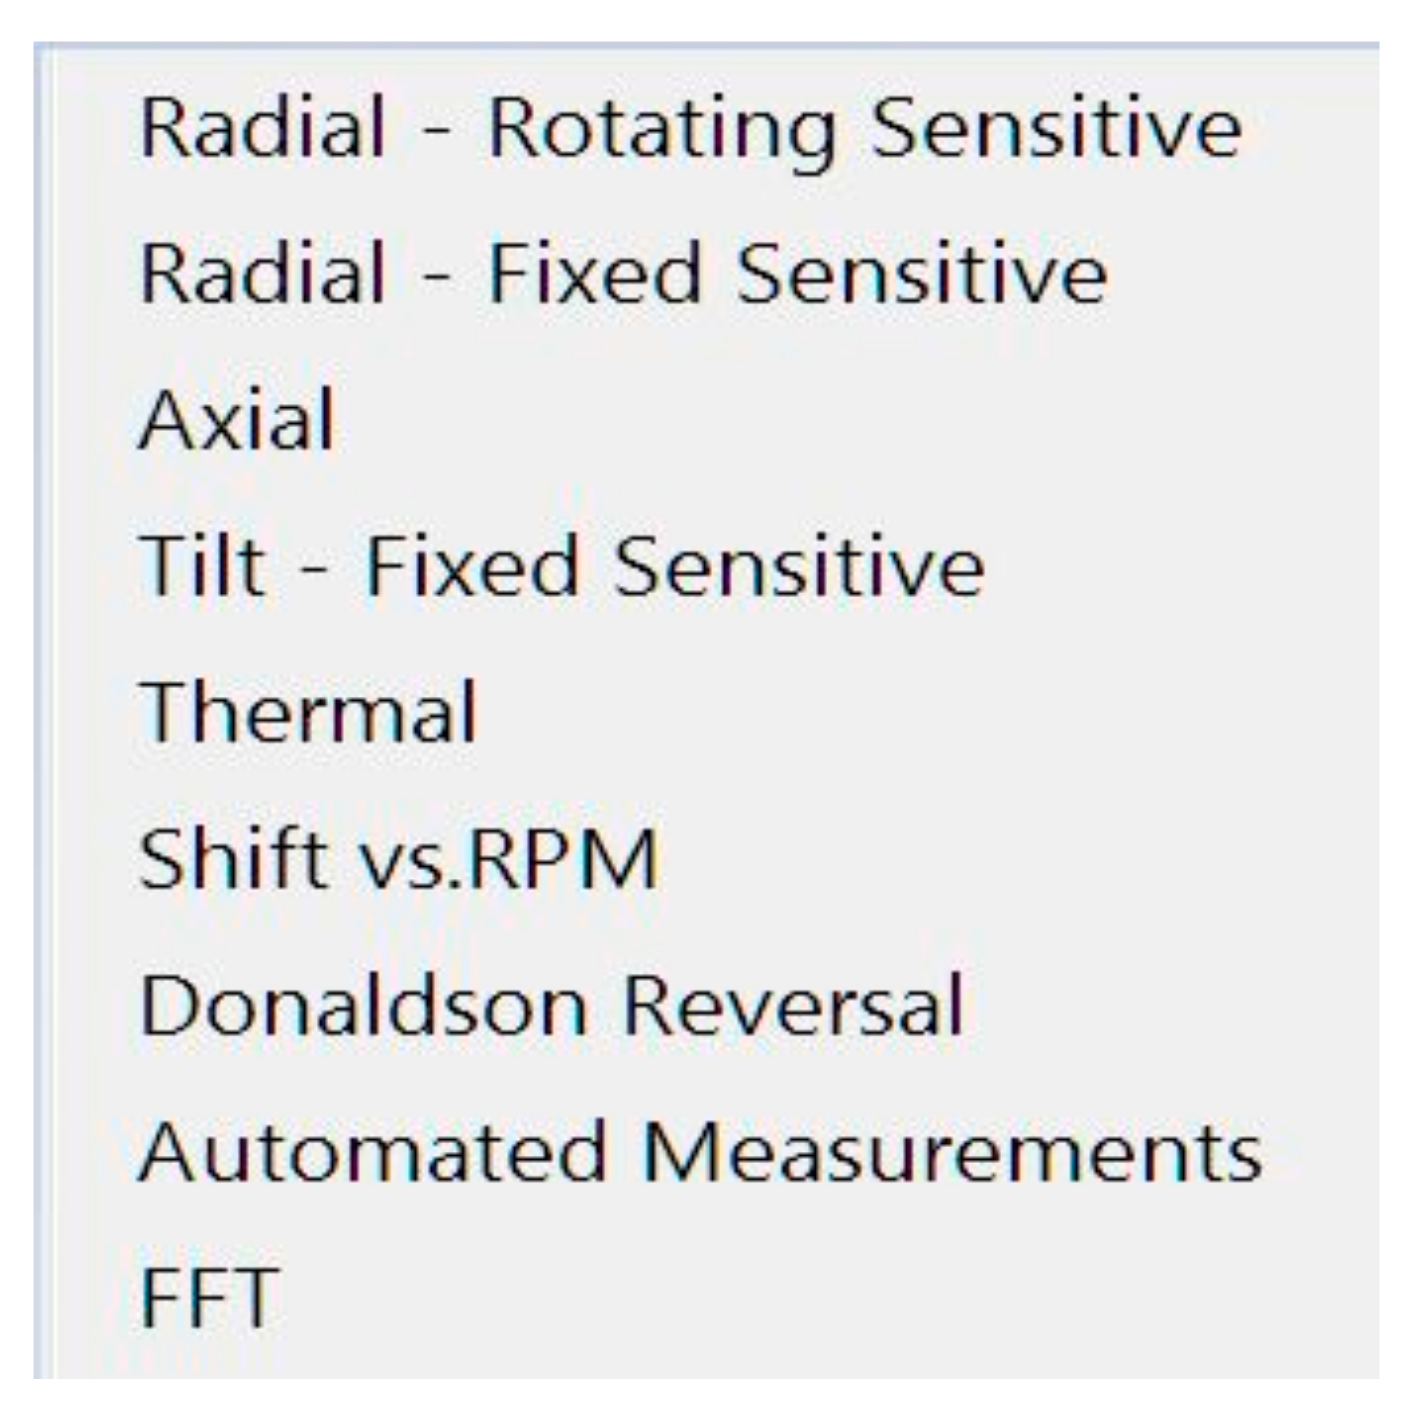
SEA 8.5 System Software
The software included with the system is an original development of Lion Precision. It is a proprietary software; the algorithms are not described, and the source version is not available to the user. According to the manufacturer, the software enables comprehensive spindle tests.
Figure 15 shows the program menu with available tests and analyses.
Additionally, the software offers the following:
4.2. Set for Measuring Spindle Error Movements—by Optodyne
For the measurement of spindle error movements, the Optodyne company, known for its laser measuring devices and the selection of CNC machine tools, recommends using the MCV-500 (Compact Linear Machine Calibration System) set with DI-500 (Non-contact Laser Dial-Indicator) [
23].
The company records state that measurements with a laser system are easier than with capacitive sensors. With higher accuracy, resolution and range do not require such precise patterns (sphere, target, and artefact) subject to periodic calibration and mounted in the spindle. In addition to the above, it is possible to make a polar diagram by measuring only one axis.
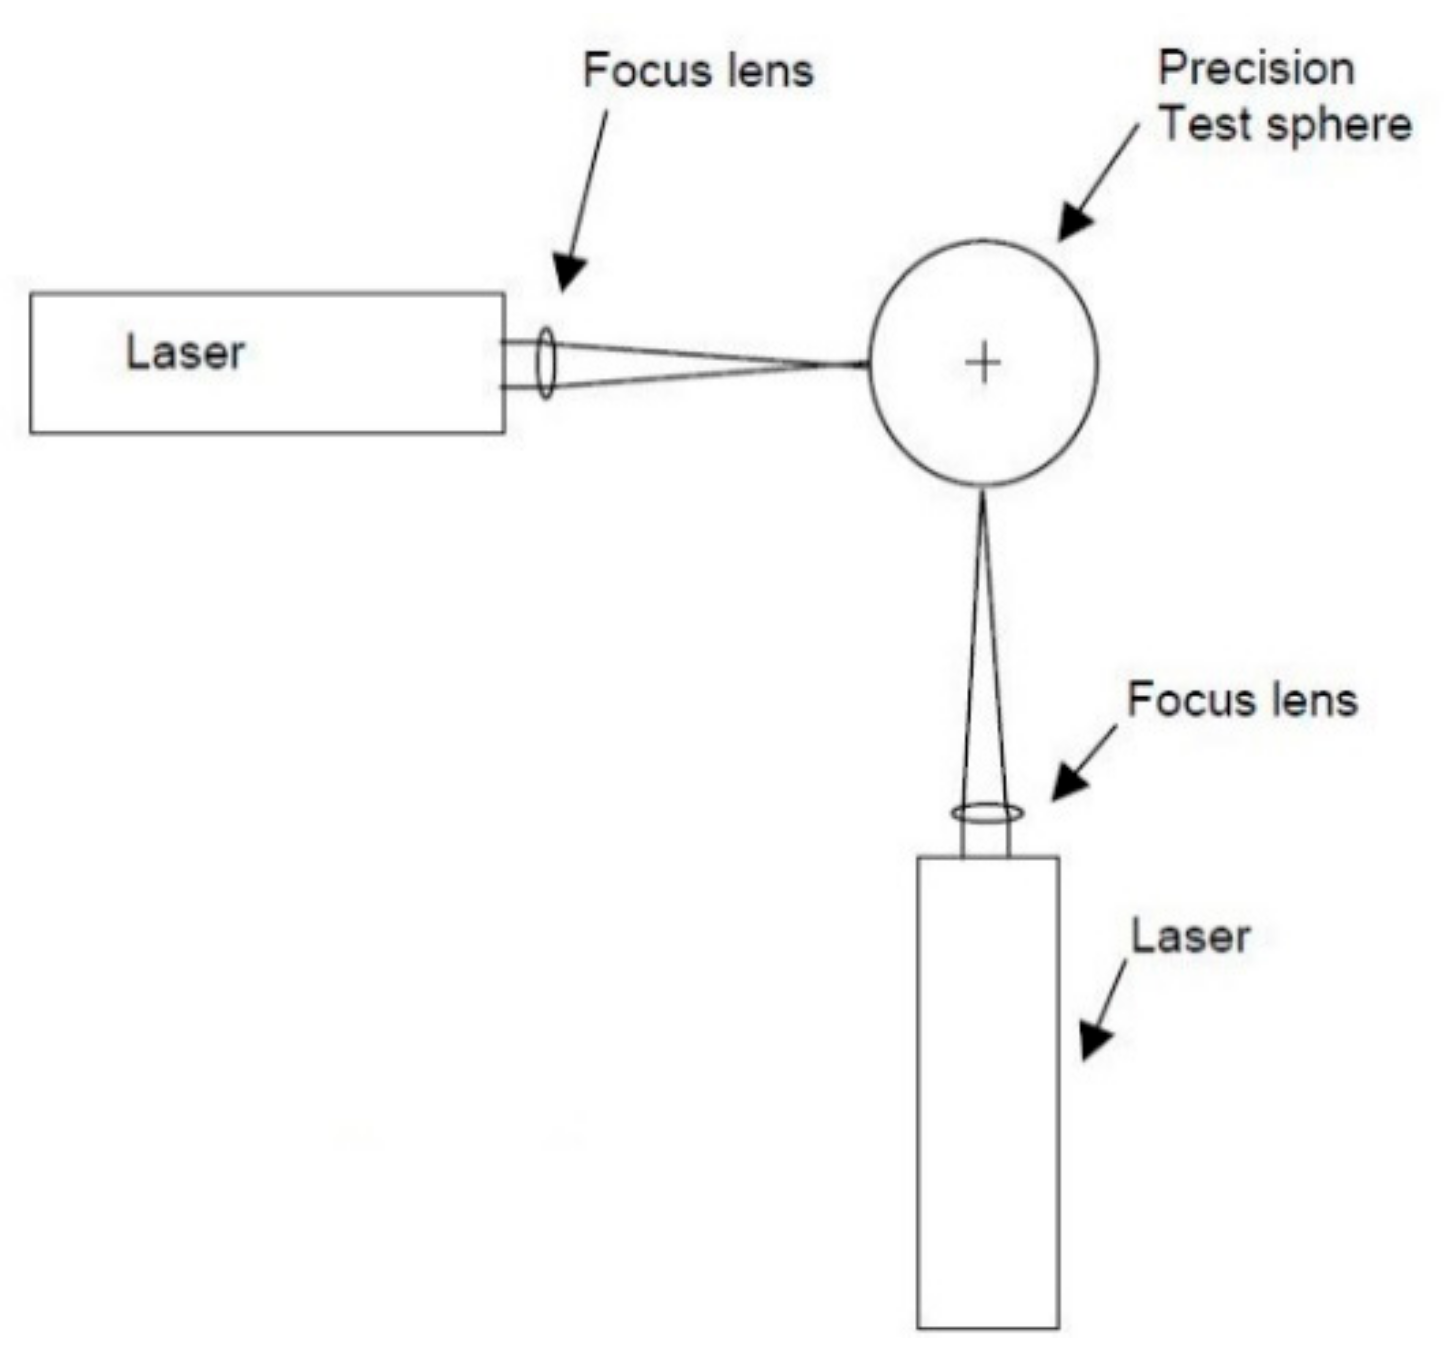
A unique feature of the LDDM (Laser Doppler Displacement Meter) system used is the use of a single optical element, both for sending and receiving the laser beam. For this reason, the reflecting surface can be a polished flat or spherical surface. In the case of a spherical one, in order to strengthen the reflected ray, additional focus lenses are used. The idea of the measurement is presented in
Figure 16.
Details of the devices used to build the test stand can be found in [
24].
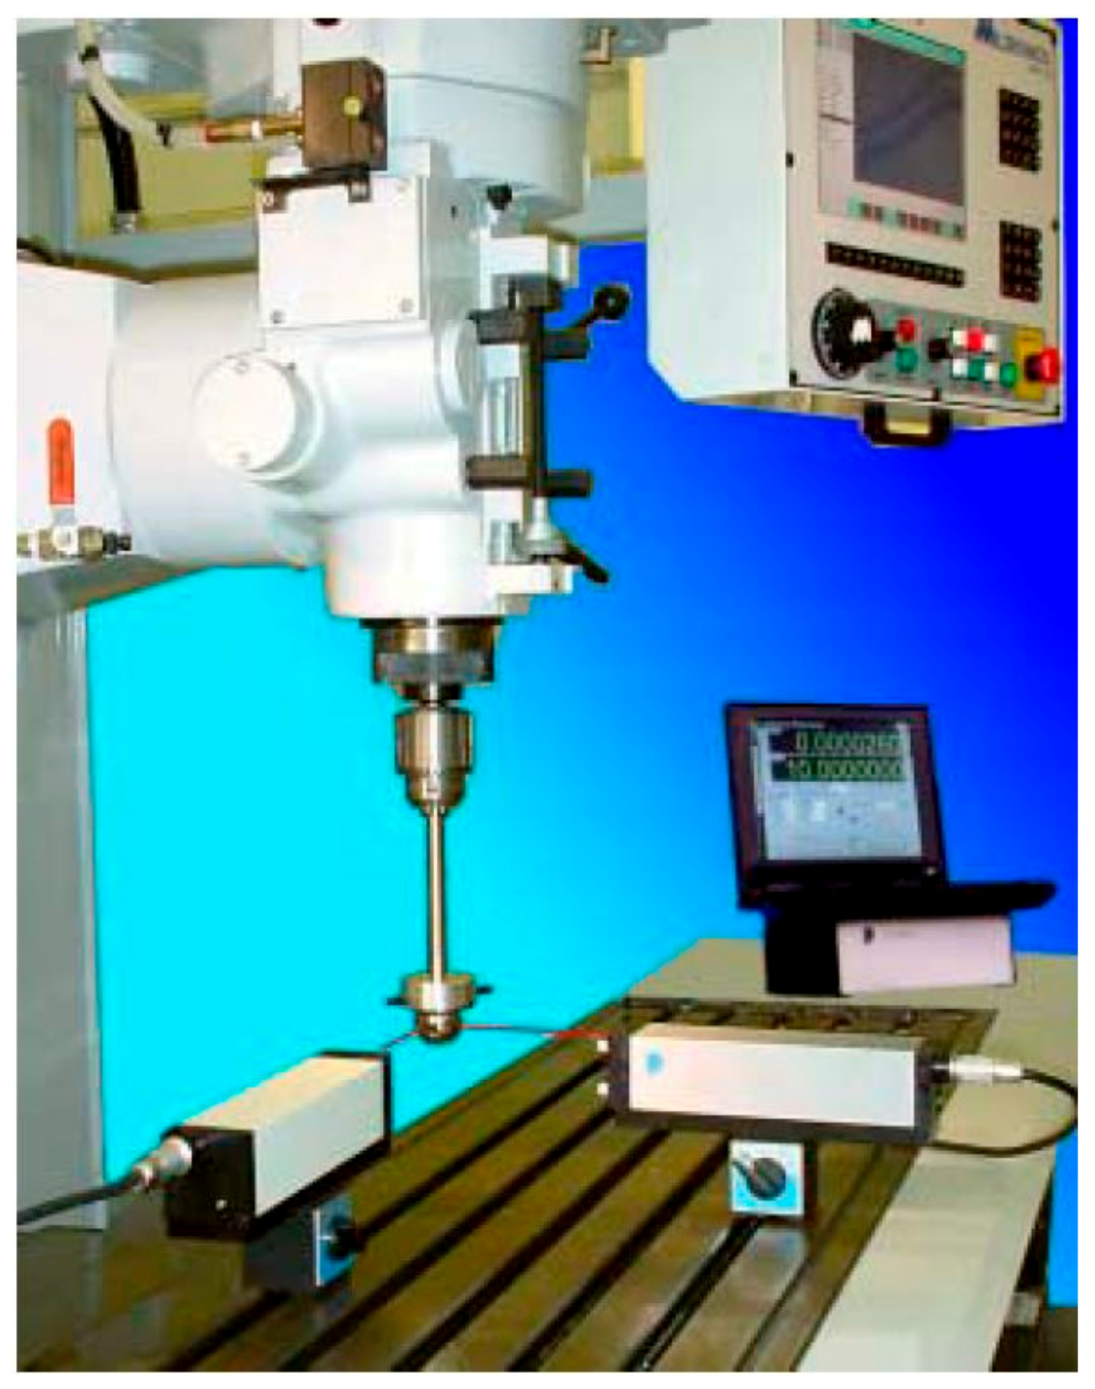
Figure 17 shows a photograph taken during the measurements.
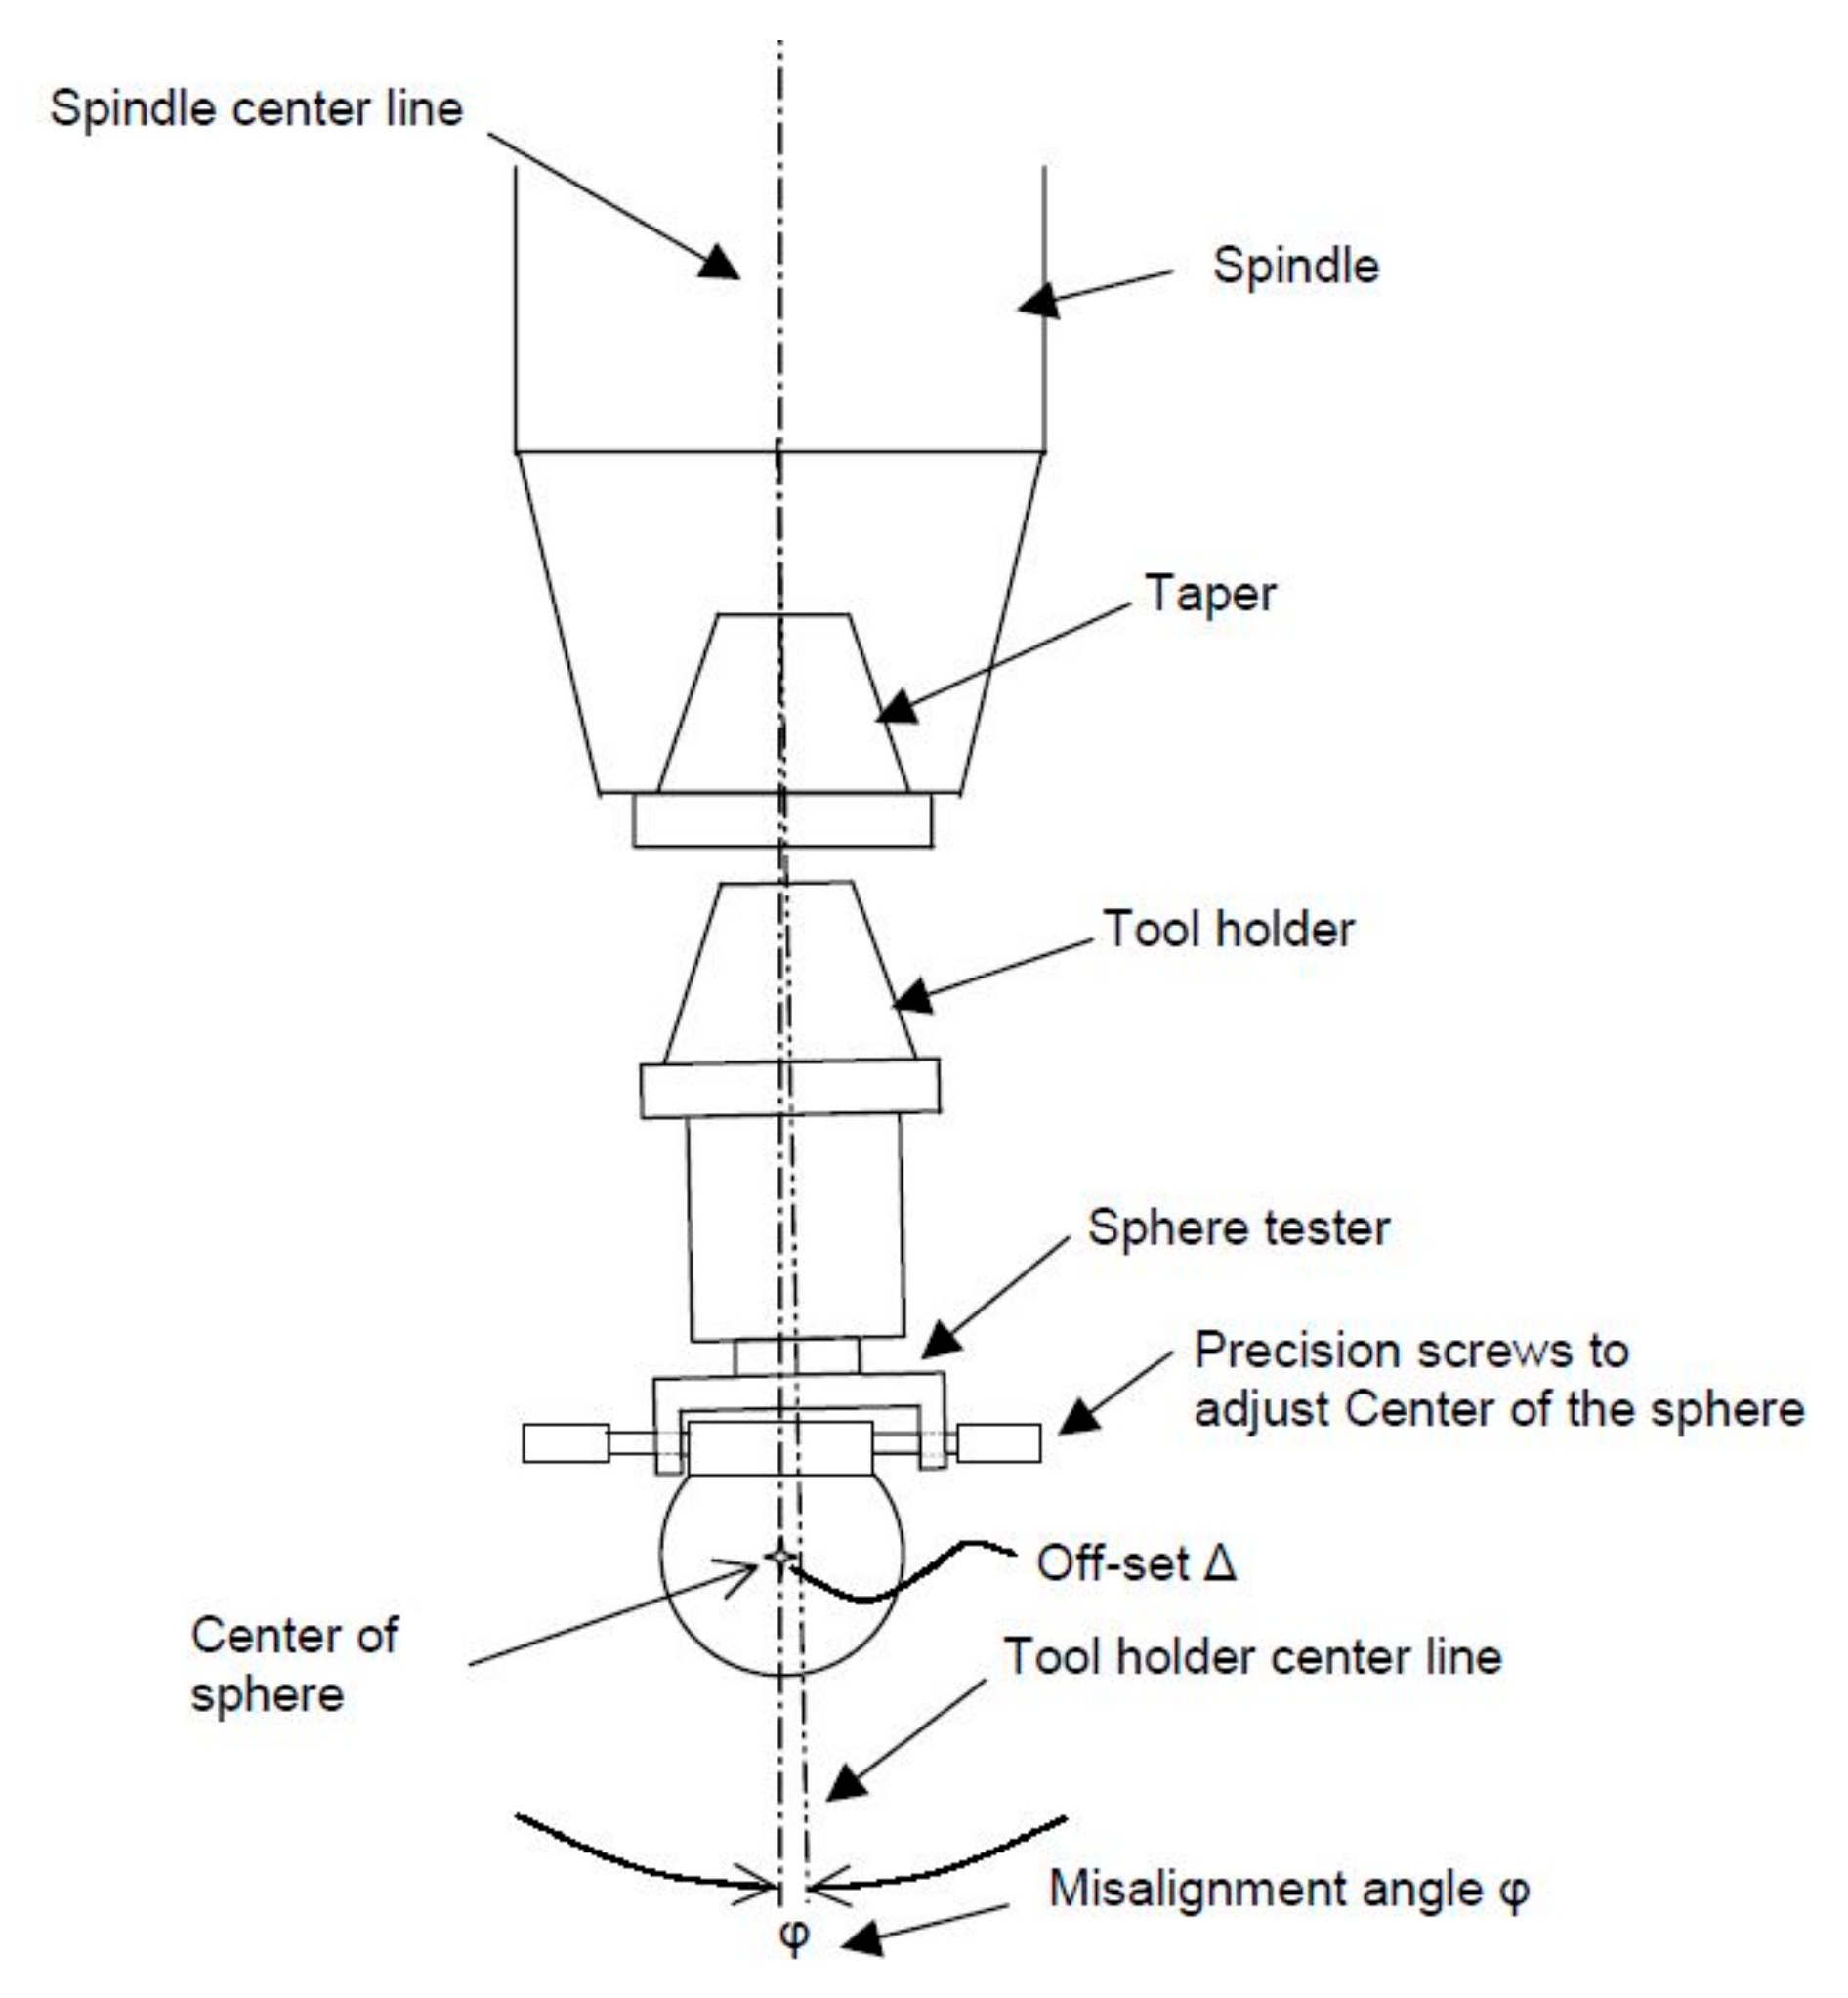
One laser head measures in the X direction, and the other measures in the Y direction. As shown in
Figure 18, first, a ball standard is set at the axis of rotation of the spindle with 4 fine-pitch screws, and then, the spindle is rotated 180 degrees.
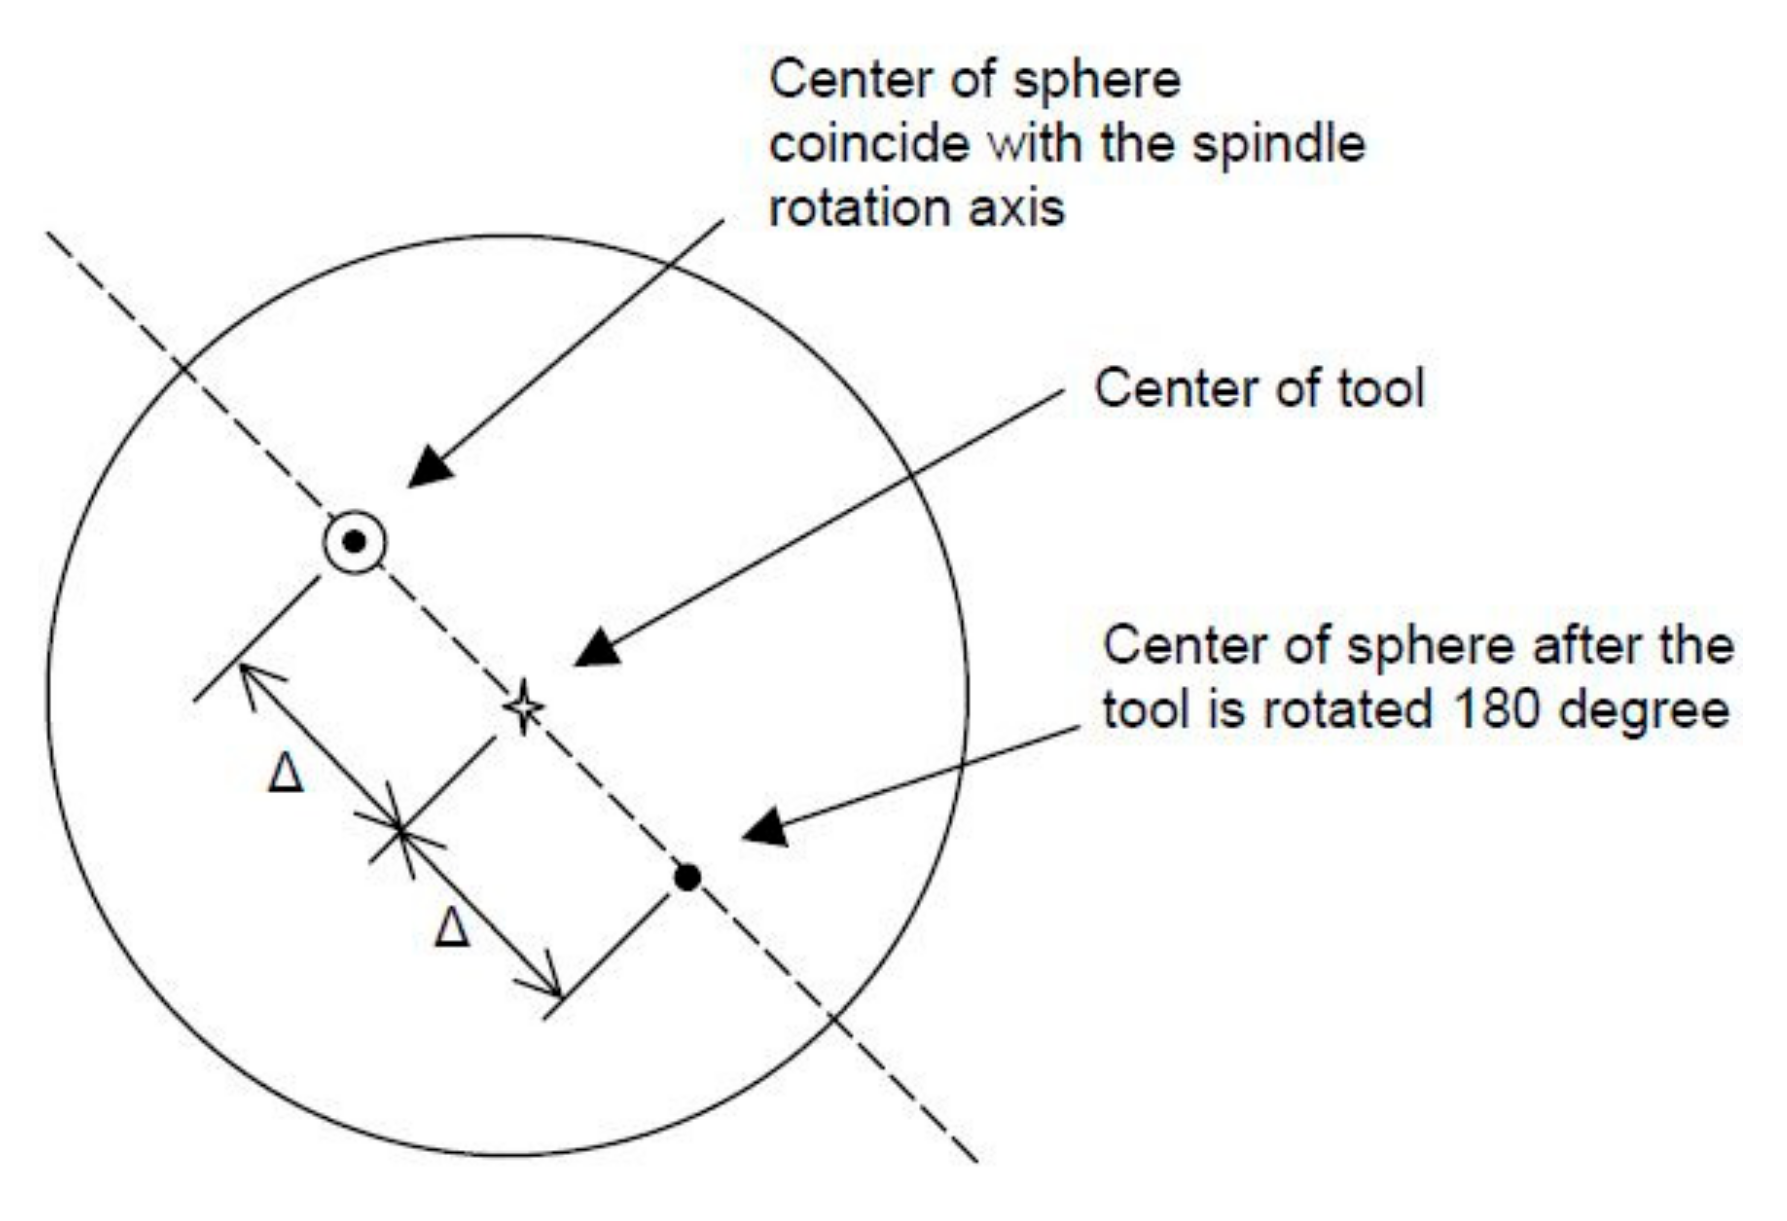
After rotating the spindle 180 degrees, as shown in
Figure 19, the offset is twice as large as before rotation. The maximum difference in the X direction is marked ΔX
M, and that in the Y direction is marked ΔY
M. The shift between the axis of rotation of the spindle and the centre of the sphere 0 can be determined from the following formula:
The uncertainty of measurement depends on the execution error of the ball standard (typically 0.5 μm). To measure the total spindle error movement, the spindle is rotated and the readings of the laser system ΔX(t) i ΔY(t) are recorded for several dozen revolutions.
As Optodyne performs the measurement of spindle error movements by combining two commercially available, independent devices, the software for calculating the values of error movements is not provided. It is true that a technical article [
23] provides formulas according to which the error value can be calculated based on the indications of laser systems, but the calculation algorithms and polar diagrams recommended in the standards must be programmed by the user. A spreadsheet (e.g., Excel) can be used for this purpose.
5. Publications Related to the Measurement of Spindle Error Movements
Most publications use three sensors placed in one plane to measure spindle error movements. According to [
25] in the case where the spindle error movement is similar in value to the pattern execution inaccuracy, it is desirable to separate the pattern circularity error from the spindle movement error. The exact geometric model with the necessary patterns is presented in the abovementioned article. Since the precise pattern (with satisfactory inaccuracy) is practically offered only by Lion Precision, the remaining methods are mostly based on measurements with three sensors in one plane and the transformations proposed in [
25].
5.1. Measurement Methods with Optical Sensors
5.1.1. Measurement with a Laser Interferometer
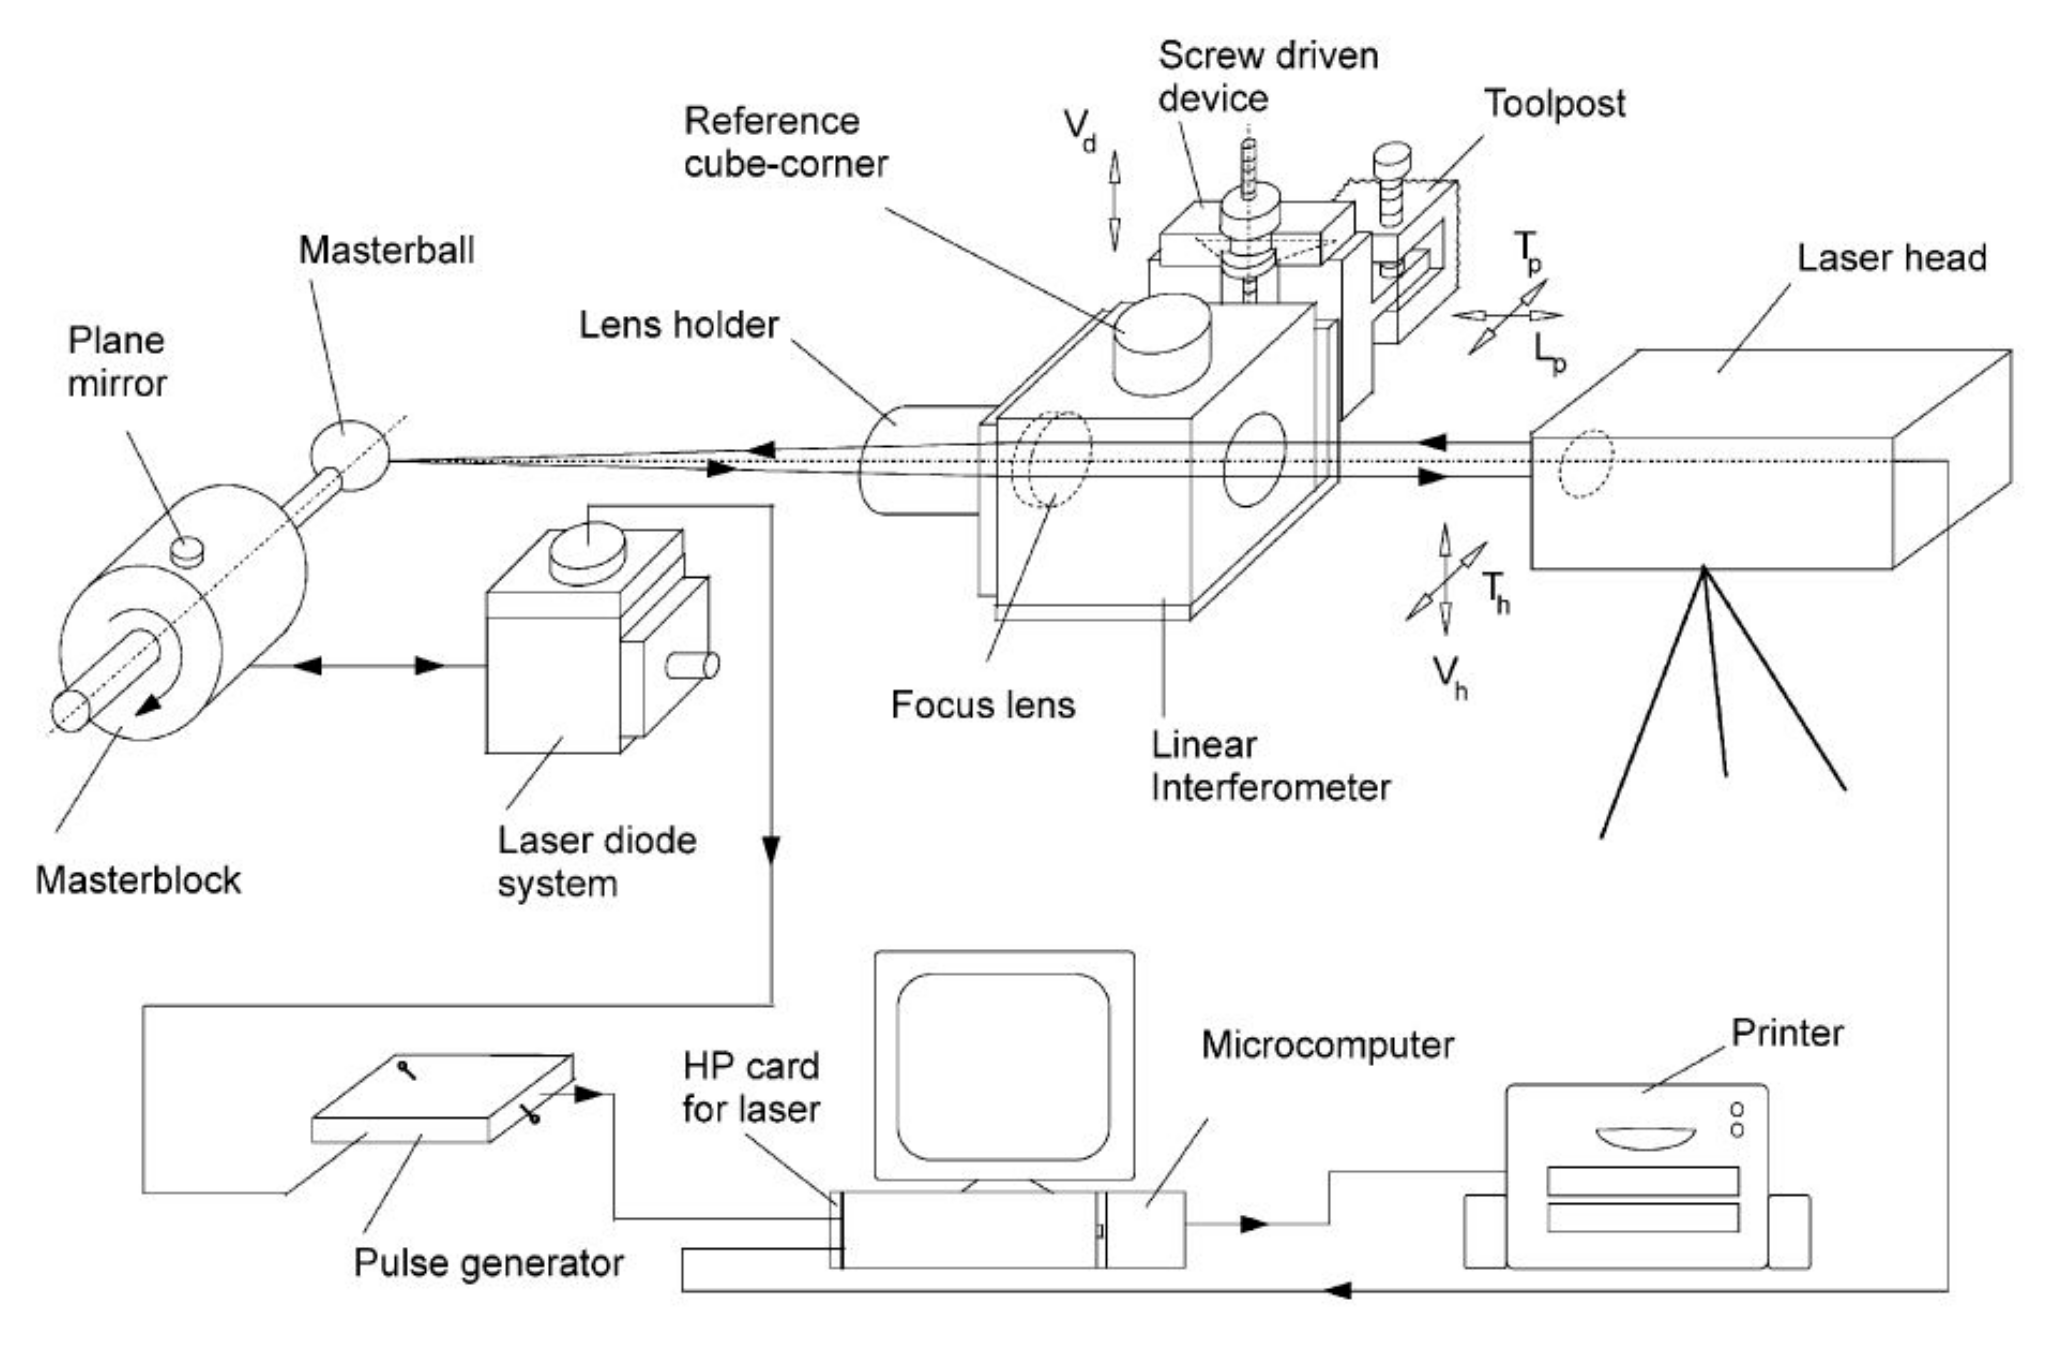
The method using a laser interferometer and an exact ball standard is described in [
26]. In this case, the pattern’s sphere is treated as an optical reflector. The measuring principle is similar to linear measurements with a laser interferometer, and the sphere is equivalent to a retroreflector. Additionally, a lens is inserted to focus the laser beam on the spherical surface. An example of the set for measurements on a lathe is shown in the
Figure 20.
Measurement accuracy rates are the same as for standard linear interferometer measurement. This method has advantages over the measurement of standard contactless sensors:
higher resolution and measurement accuracy (1 nm resolution);
high sampling rate (2.5 MHz) (ultrahigh-speed spindles);
small dimensions of the measured surface (pattern);
the laser does not have to be mounted on the machine being measured. It does not transfer disturbances caused by vibrations, noise and acoustics;
the circularity error of the pattern used in the measurements is measured precisely, and its size is entered by the user into the software. The data acquisition program subtracts the circularity error from the measurement results.
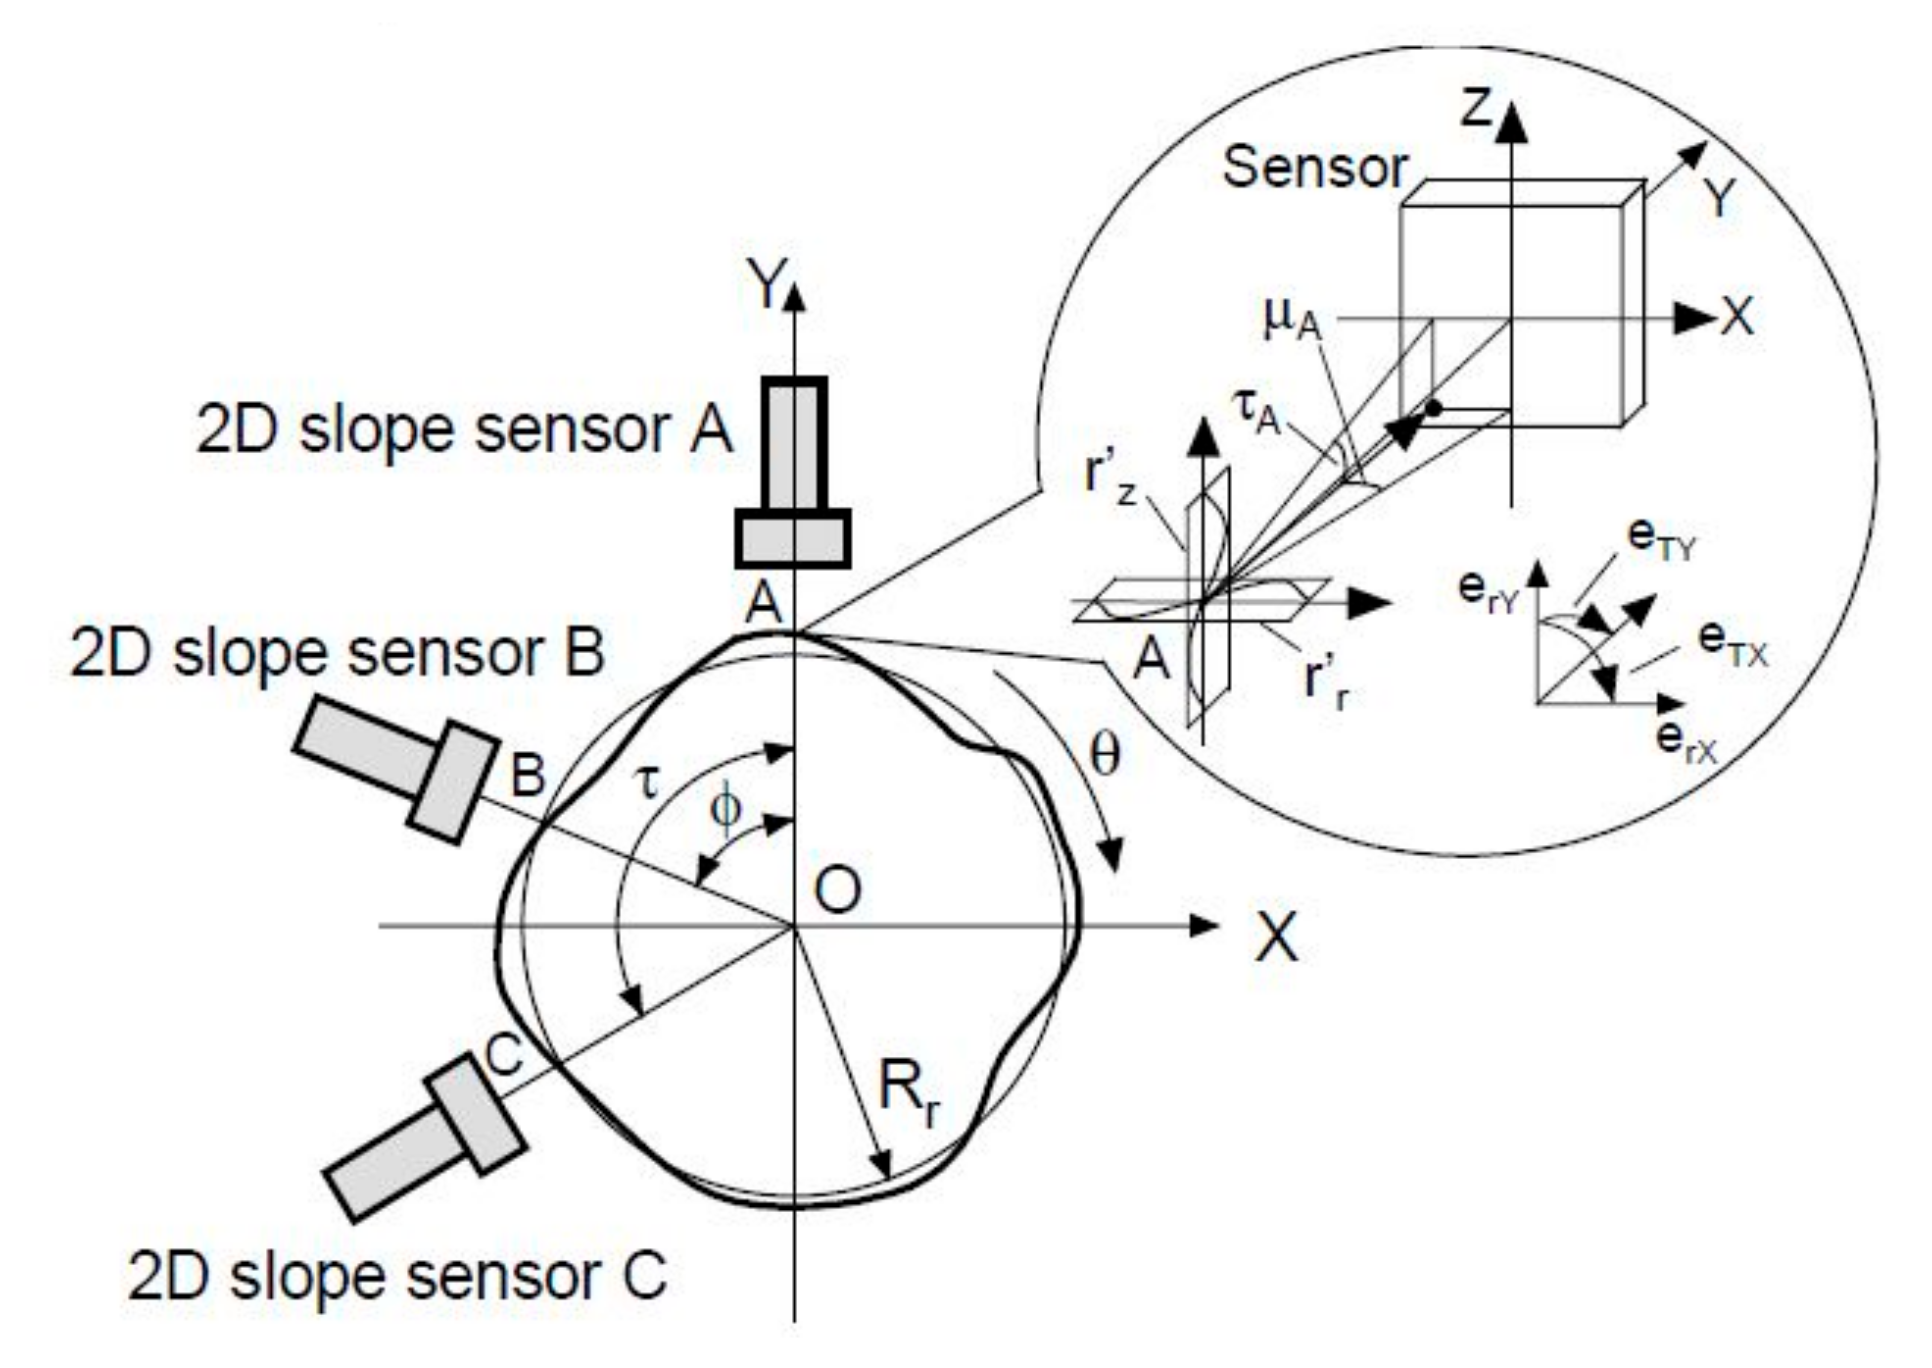
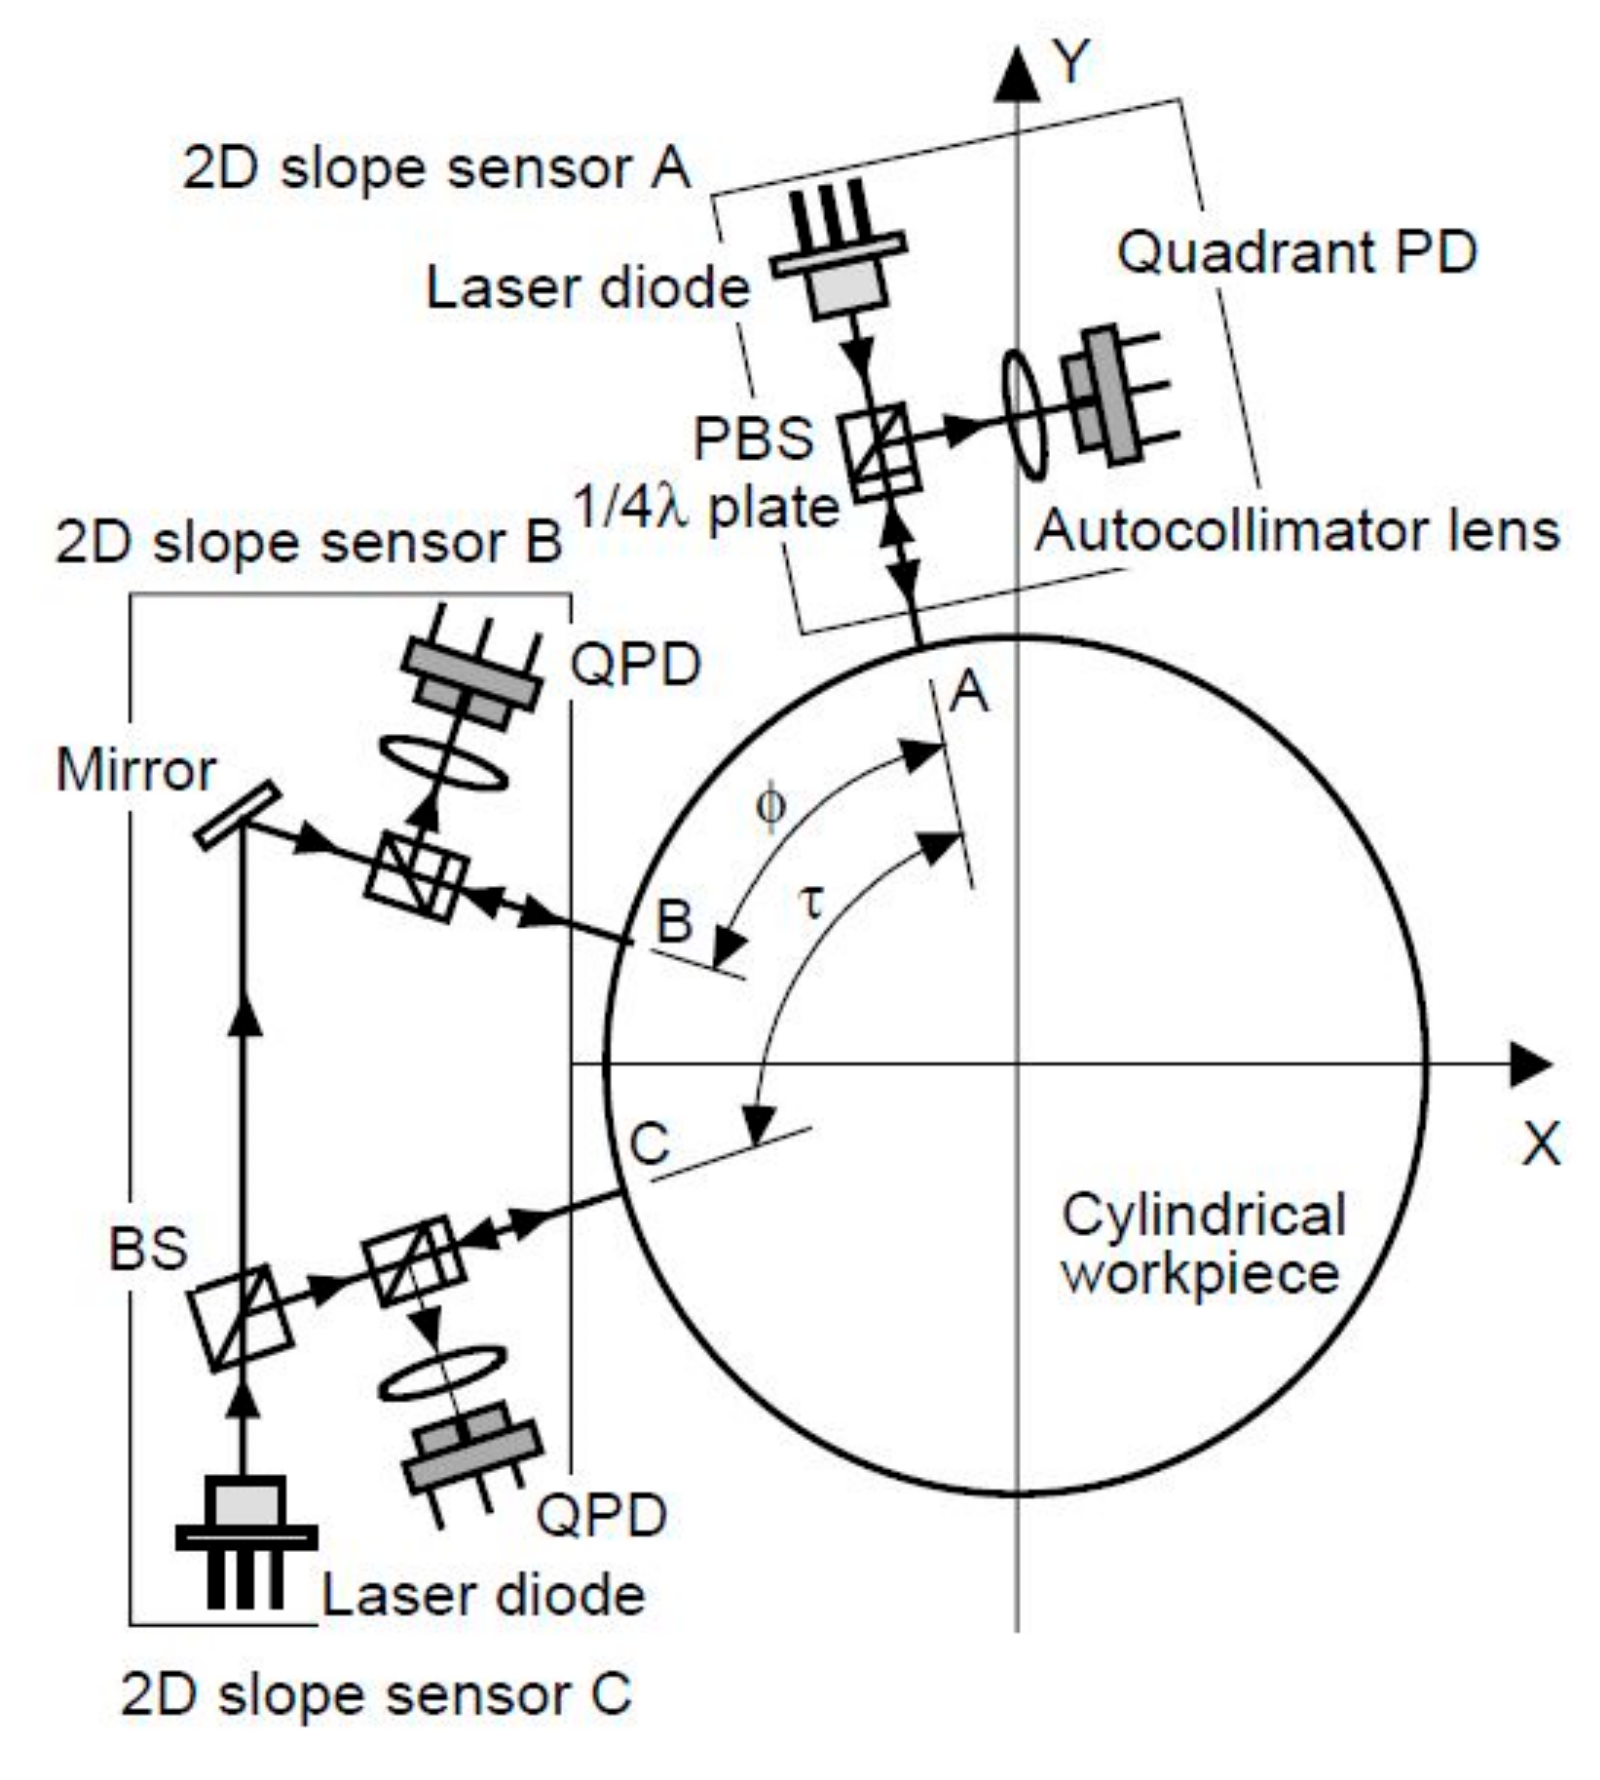
5.1.2. Multi-Sensor Measurement with 2D Slope Sensors (Biaxial)
The system enables measurement of spindle movement errors and circularity error. The sensors are disposed in the XY plane around a cylindrical object mounted in a spindle as it is shown in the
Figure 21. In traditional methods (SEA, Optodyne), the accuracy of the pattern (cylinder or sphere) and especially the circularity error interfere with the measurement of radial error movements. Therefore, the pattern circularity error should be much smaller than the spindle movement error. This is difficult to achieve especially in the case of testing ultra-precise machines. In addition, it would also be beneficial to measure the movement error while the machine is running, when the workpiece tool is used instead of a precise pattern. In this case, to determine the accuracy of the measurements, it is necessary to separate the spindle error from the non-circularity of the pattern.
Slope sensors that measure the local tilt of a surface are successfully used to measure the profile of a workpiece. The described method of determining the spindle error movement consists in the use of three sensors for measuring the tilt in the plane located around the surface of the cylindrical object.
Each of the sensors detects a two-dimensional local slope at a point on the workpiece surface, which is defined as follows:
where
r(θ
z) is the surface profile of the cylindrical workpiece. θ is the spindle’s rotation angle, and
Rr is the mean radius of the cylindrical surface of the workpiece.
R(θ) is related to the error of the circularity of the workpiece at the point
z. Then, the method to calculate the error movement in the radial and angular directions is given.
Figure 22 shows the specially designed biaxial slope sensors used in the tests.
The tests were carried out on a laboratory stand consisting of a pneumatic spindle with an angular encoder connected, and a cylinder with a diameter of 80 mm, turned with a diamond plate, was used as the reference object.
The spindle was mounted on a cross table as it is shown in the
Figure 23.
It should be noted that, for proper operation, a system calibration procedure is needed, requiring the object (pattern in the spindle) to be moved against the sensors. As a result of the conducted research, the value of the radial error movement in the X axis was approx. 2 µm and, in the Y direction, was 3.3 µm. The angular error movement was 9.9 arcseconds in the X direction and 12 s in the Y direction. The test results confirmed that the slope sensors used can measure both circularity errors and the value of spindle error movement. Work on improving the system is still ongoing.
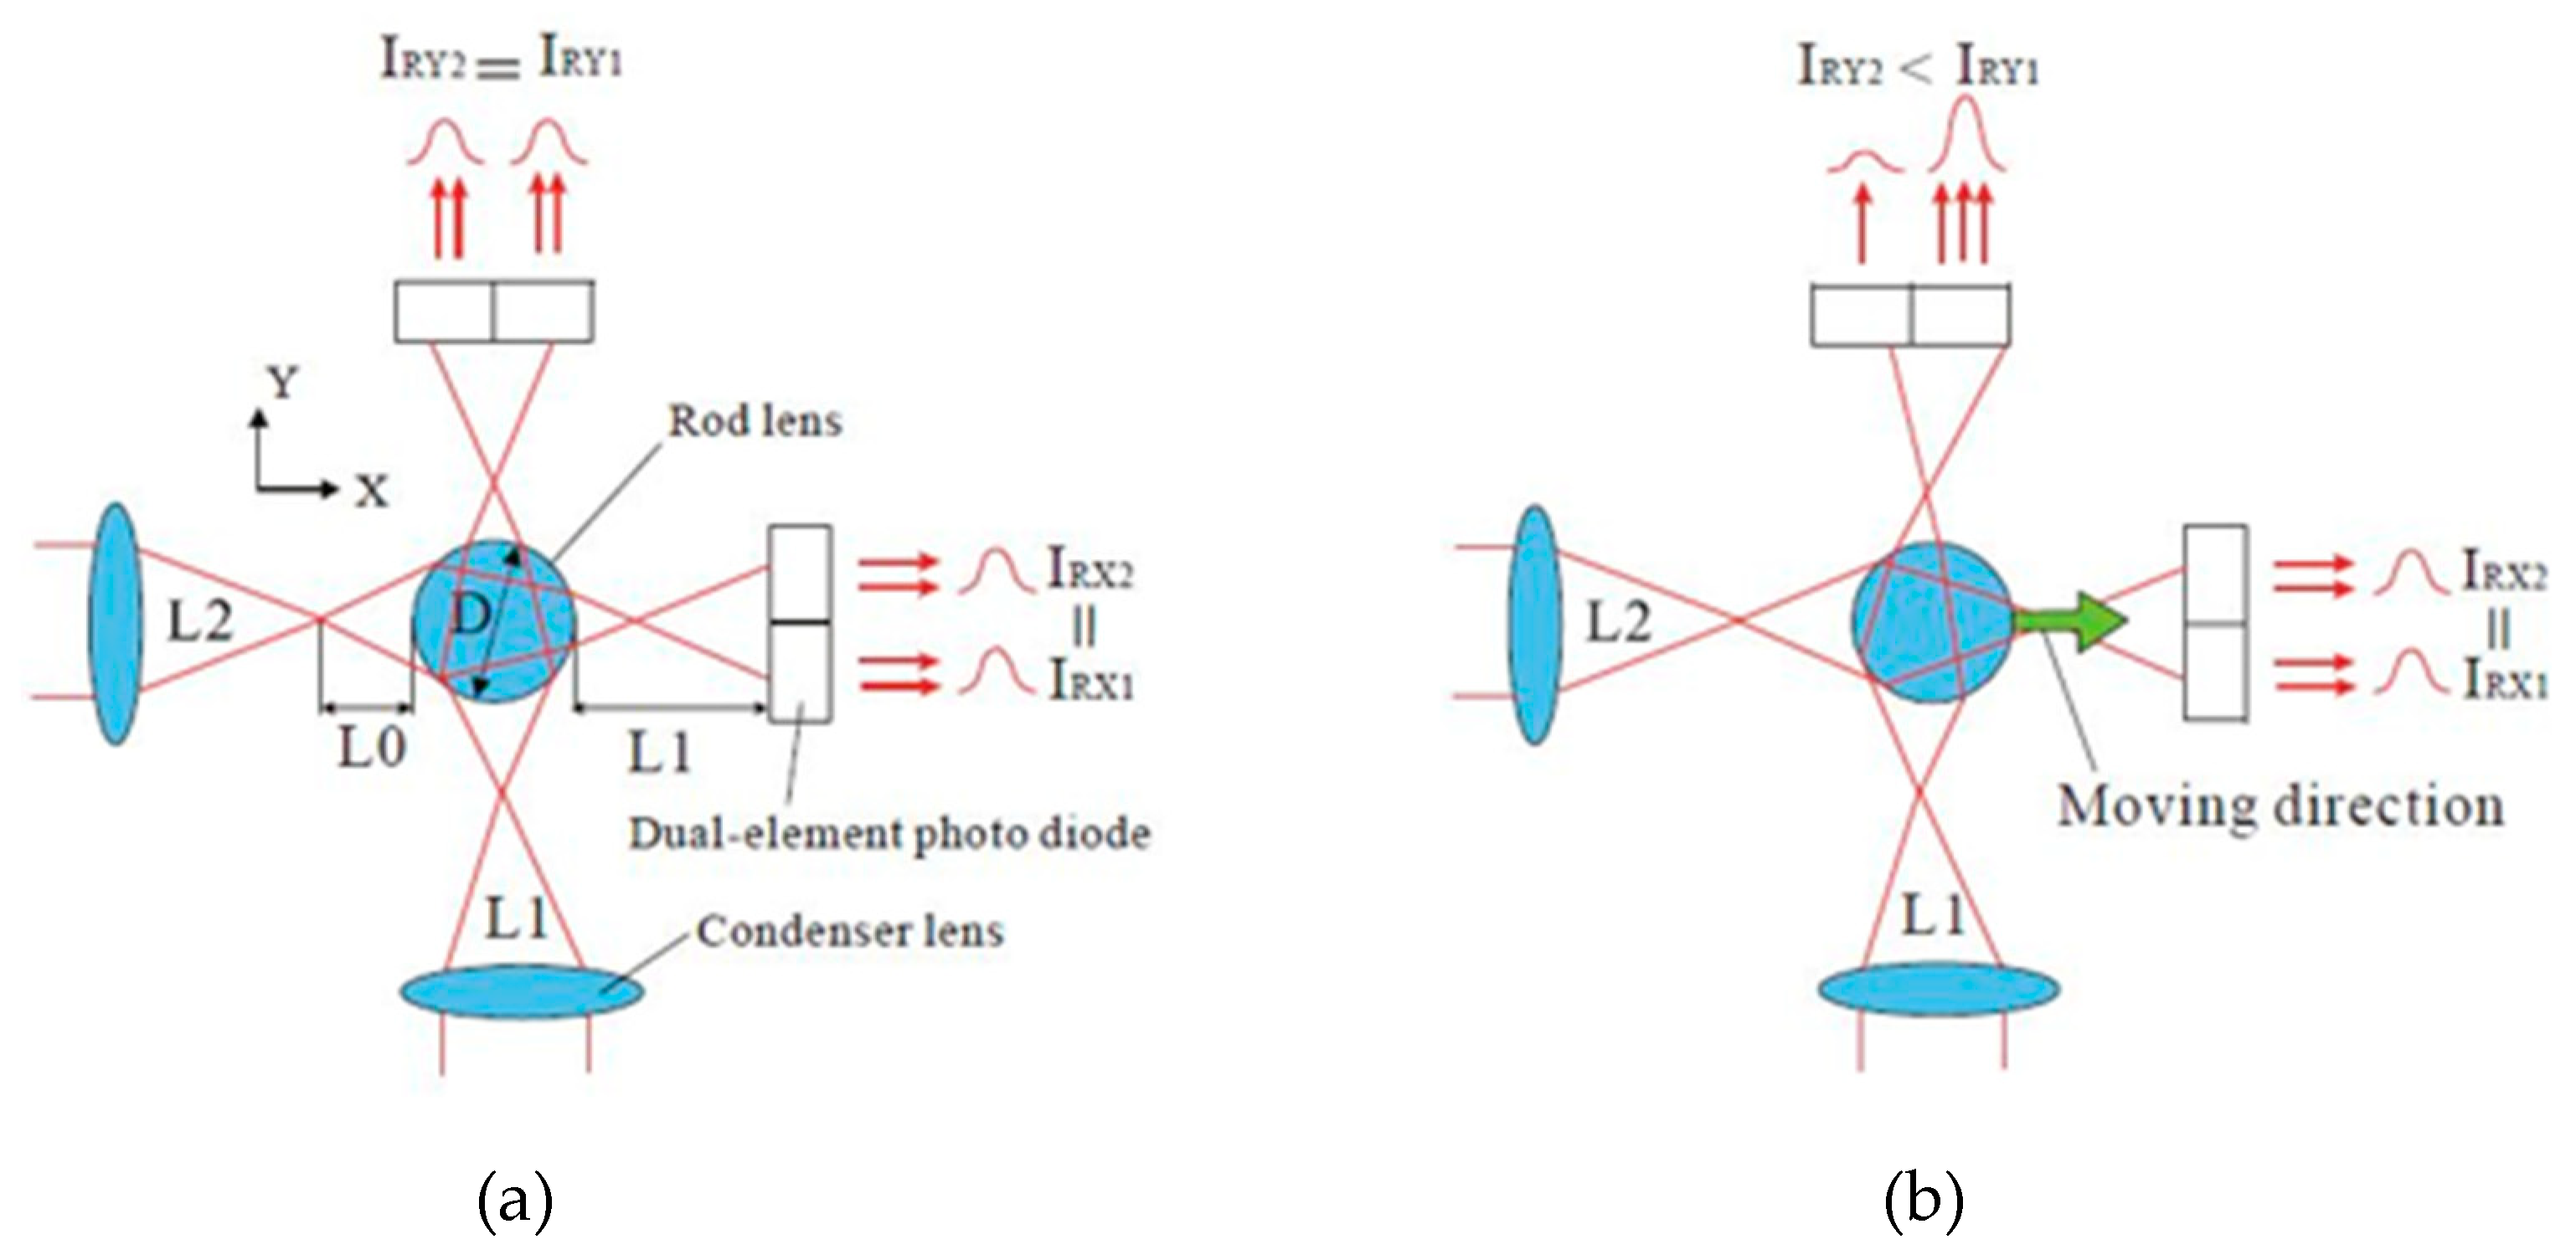
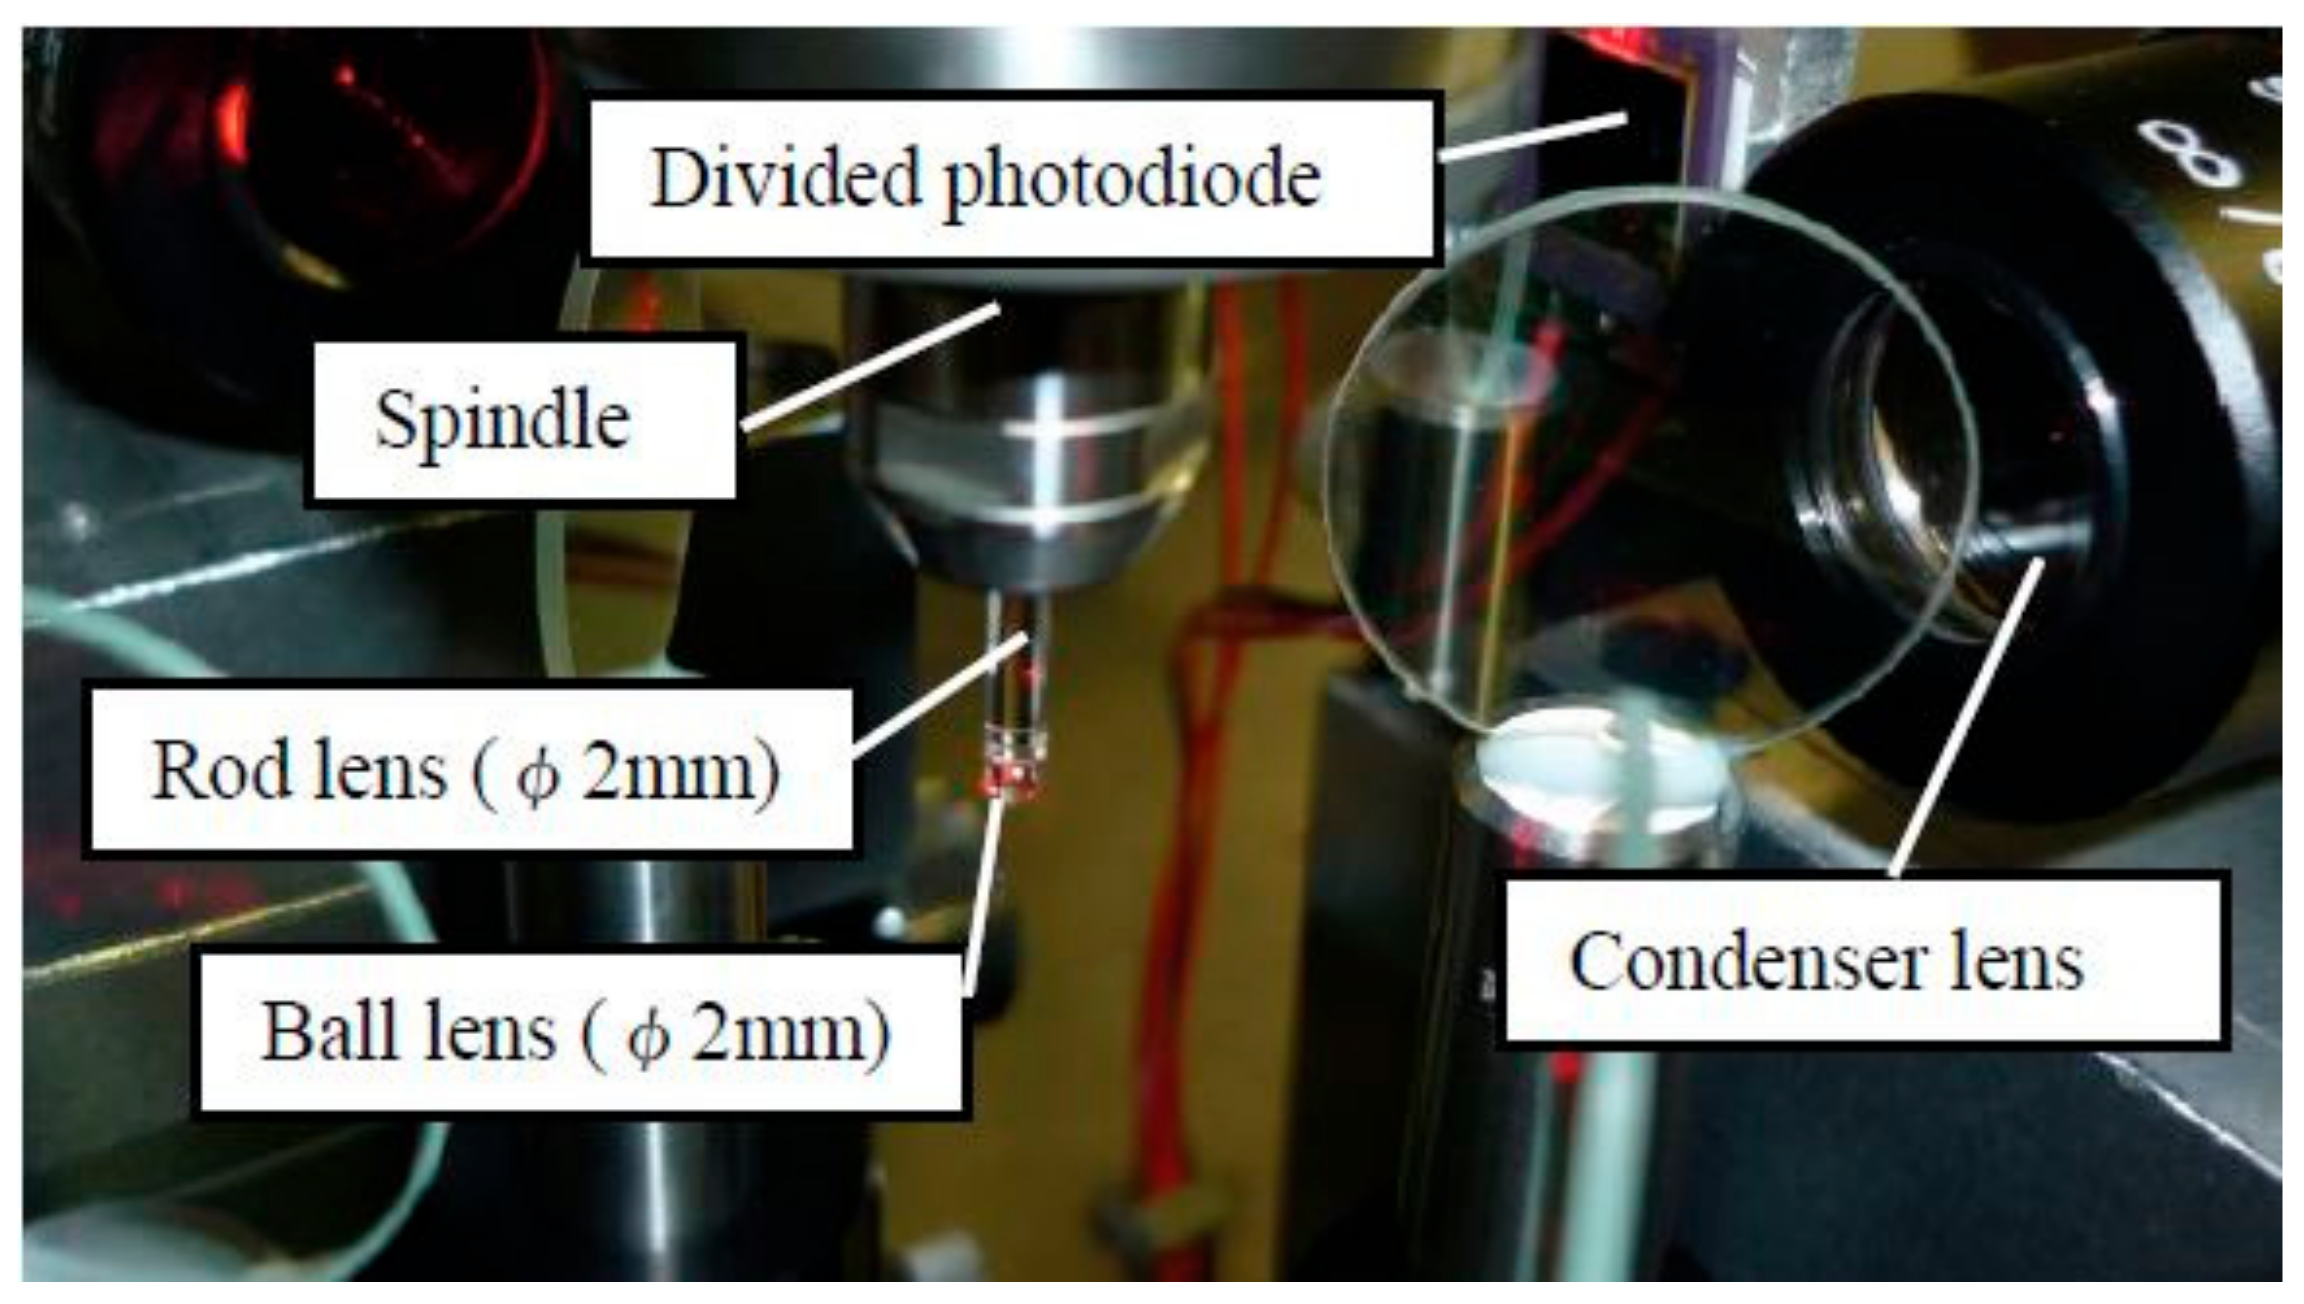
5.1.3. Measurement with a Glass Pattern and Laser Diodes
The measurement procedure, construction of the stand, conducted research, and measurement results are presented in [
28]. The concept of measurement is based on the use of laser sensors in place of capacitive sensors (
Figure 24) and a glass pattern. The obtained measurement results can be analysed with traditional software, e.g., SEA.
The diameter of the glass cylinder and ball is 2 mm.
The course of light rays for the initial and shifted states is shown in
Figure 25.
The light signals incident on the Ir photodiode halves are converted into voltage. The voltage difference remains in the halves; in the data acquisition and analysis system, it is converted into an offset value. The article also presents the principle of selection of the optical system for the given limit value of the displacement measurement (e.g., −5 + 5 μm).
The results of the spindle tests (
Figure 26) confirmed the usefulness of the system. The resolution of the measuring system is 5 nm.
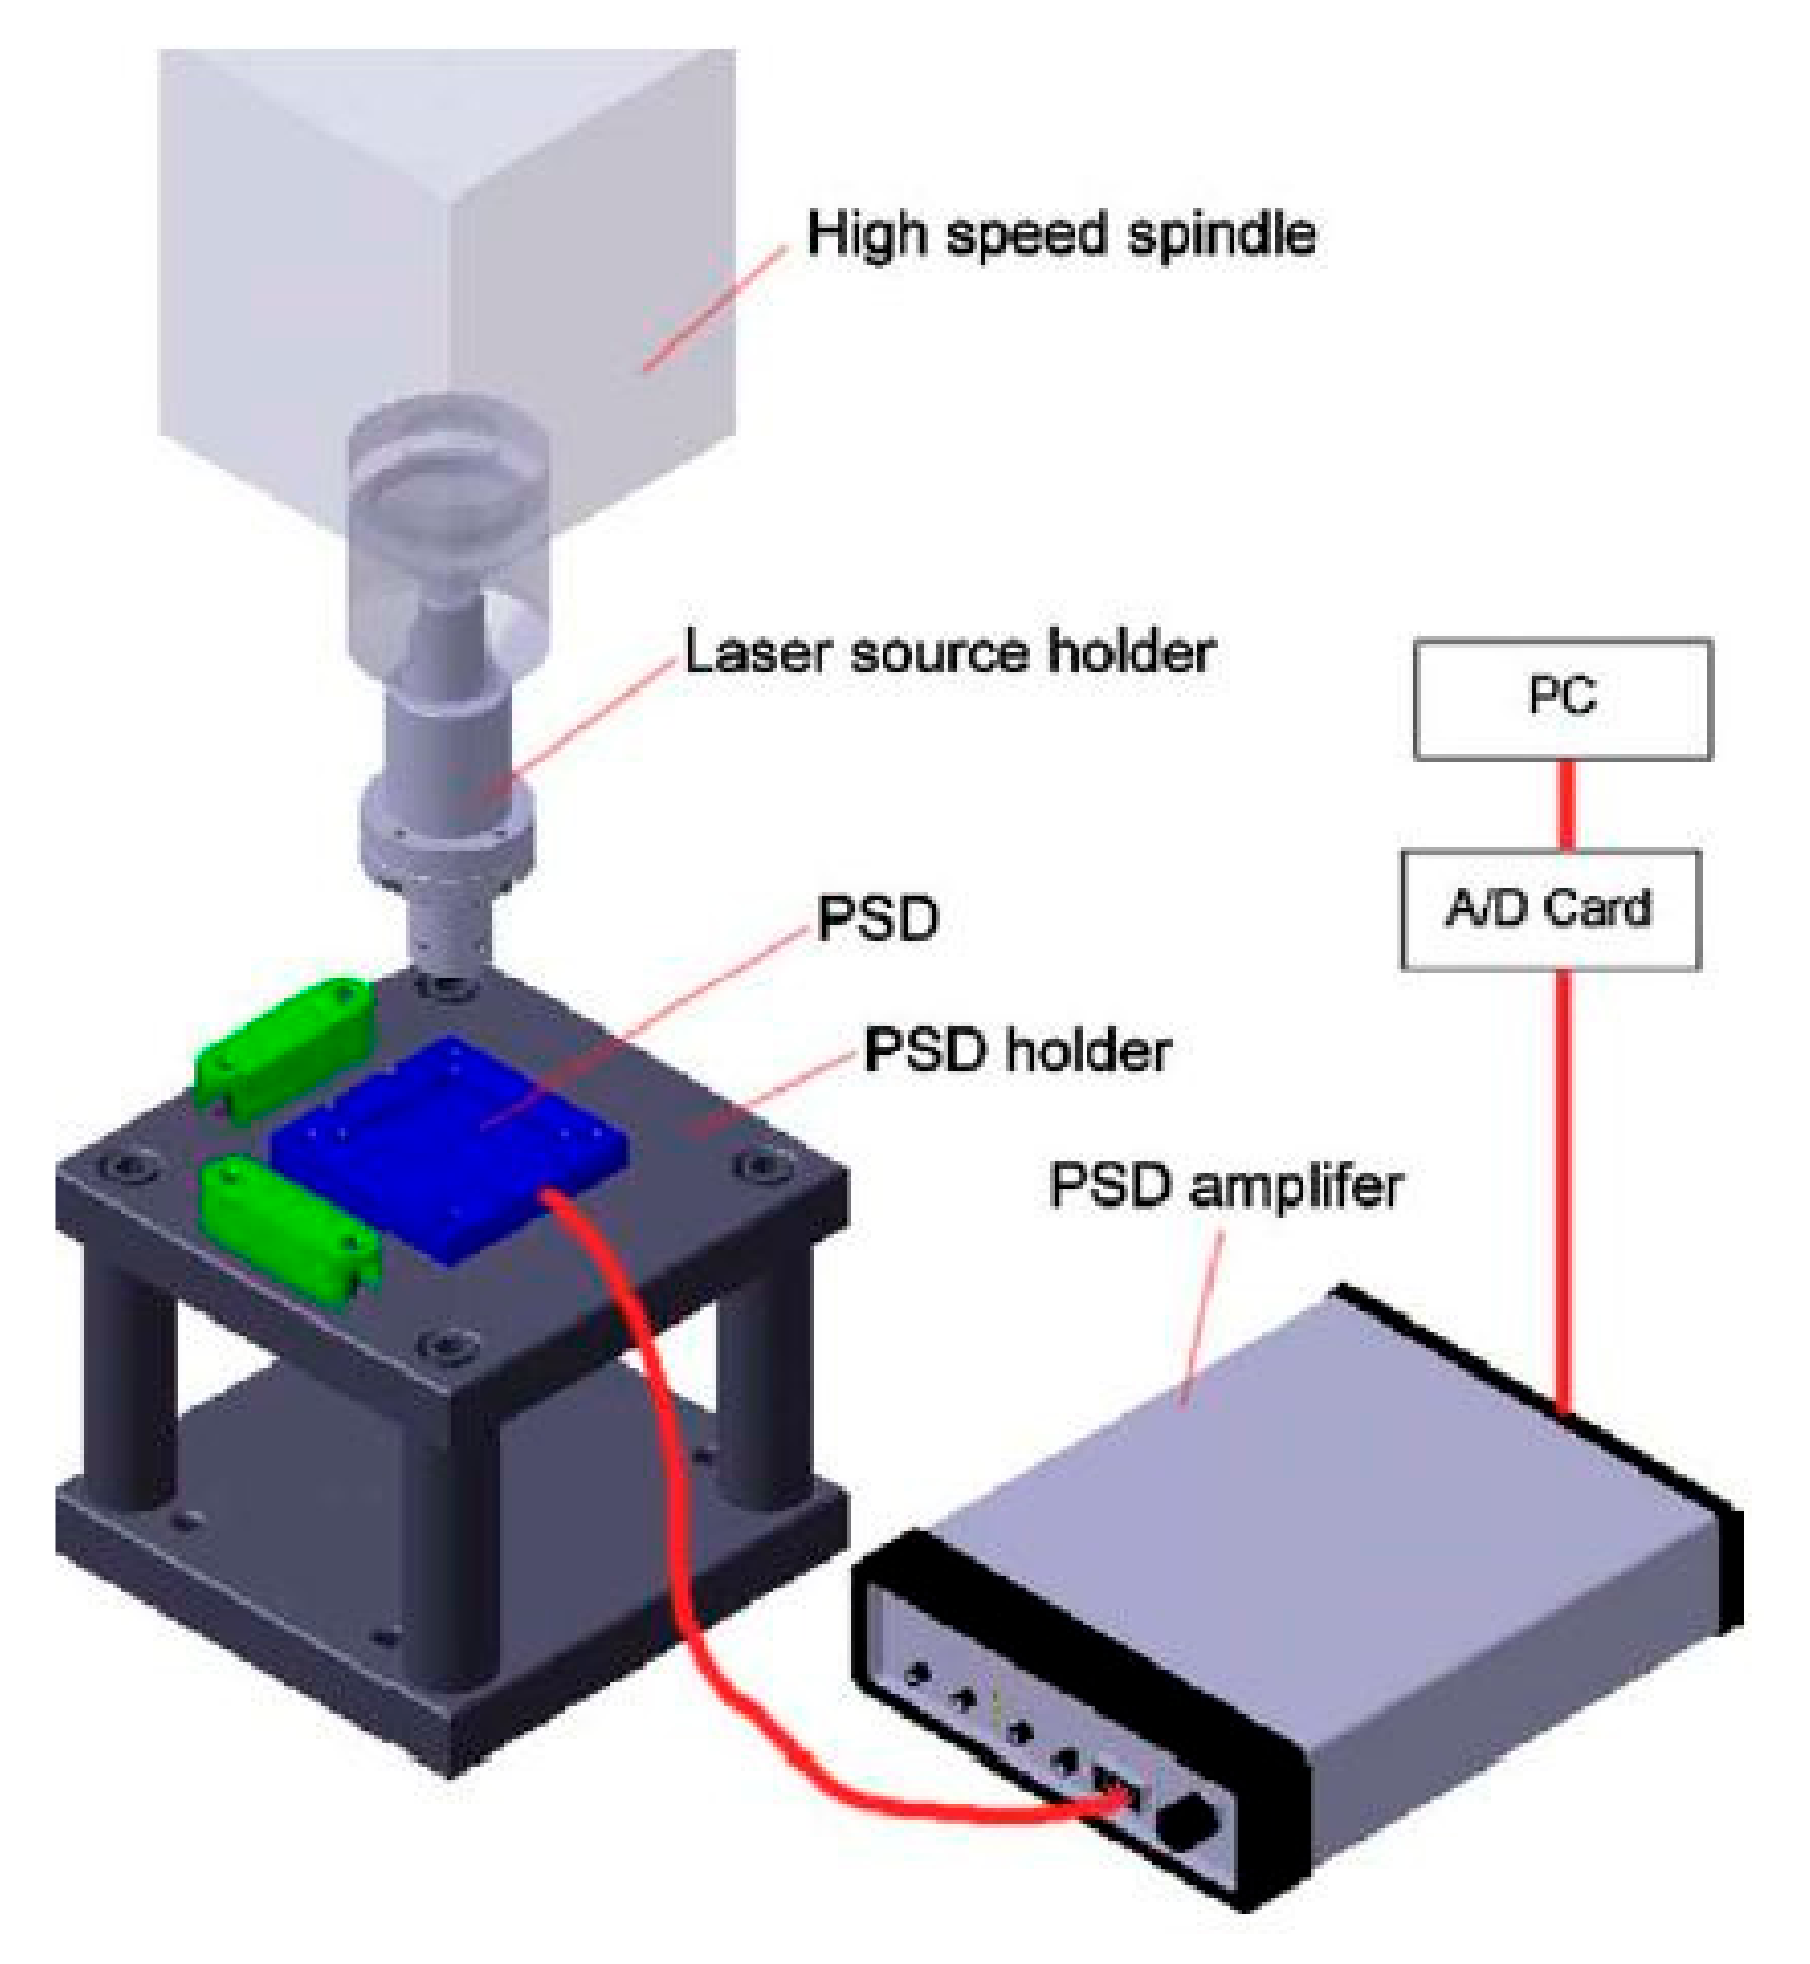
5.1.4. Measurement with Diode and PSD Matrix
Contrary to the traditional measurement set (
Figure 11), a measurement performed with a laser diode and Position Sensitive Detector (PSD) matrix was proposed [
29]. The idea of the measurement is presented in
Figure 27. The tests of the used sensor are described in [
30].
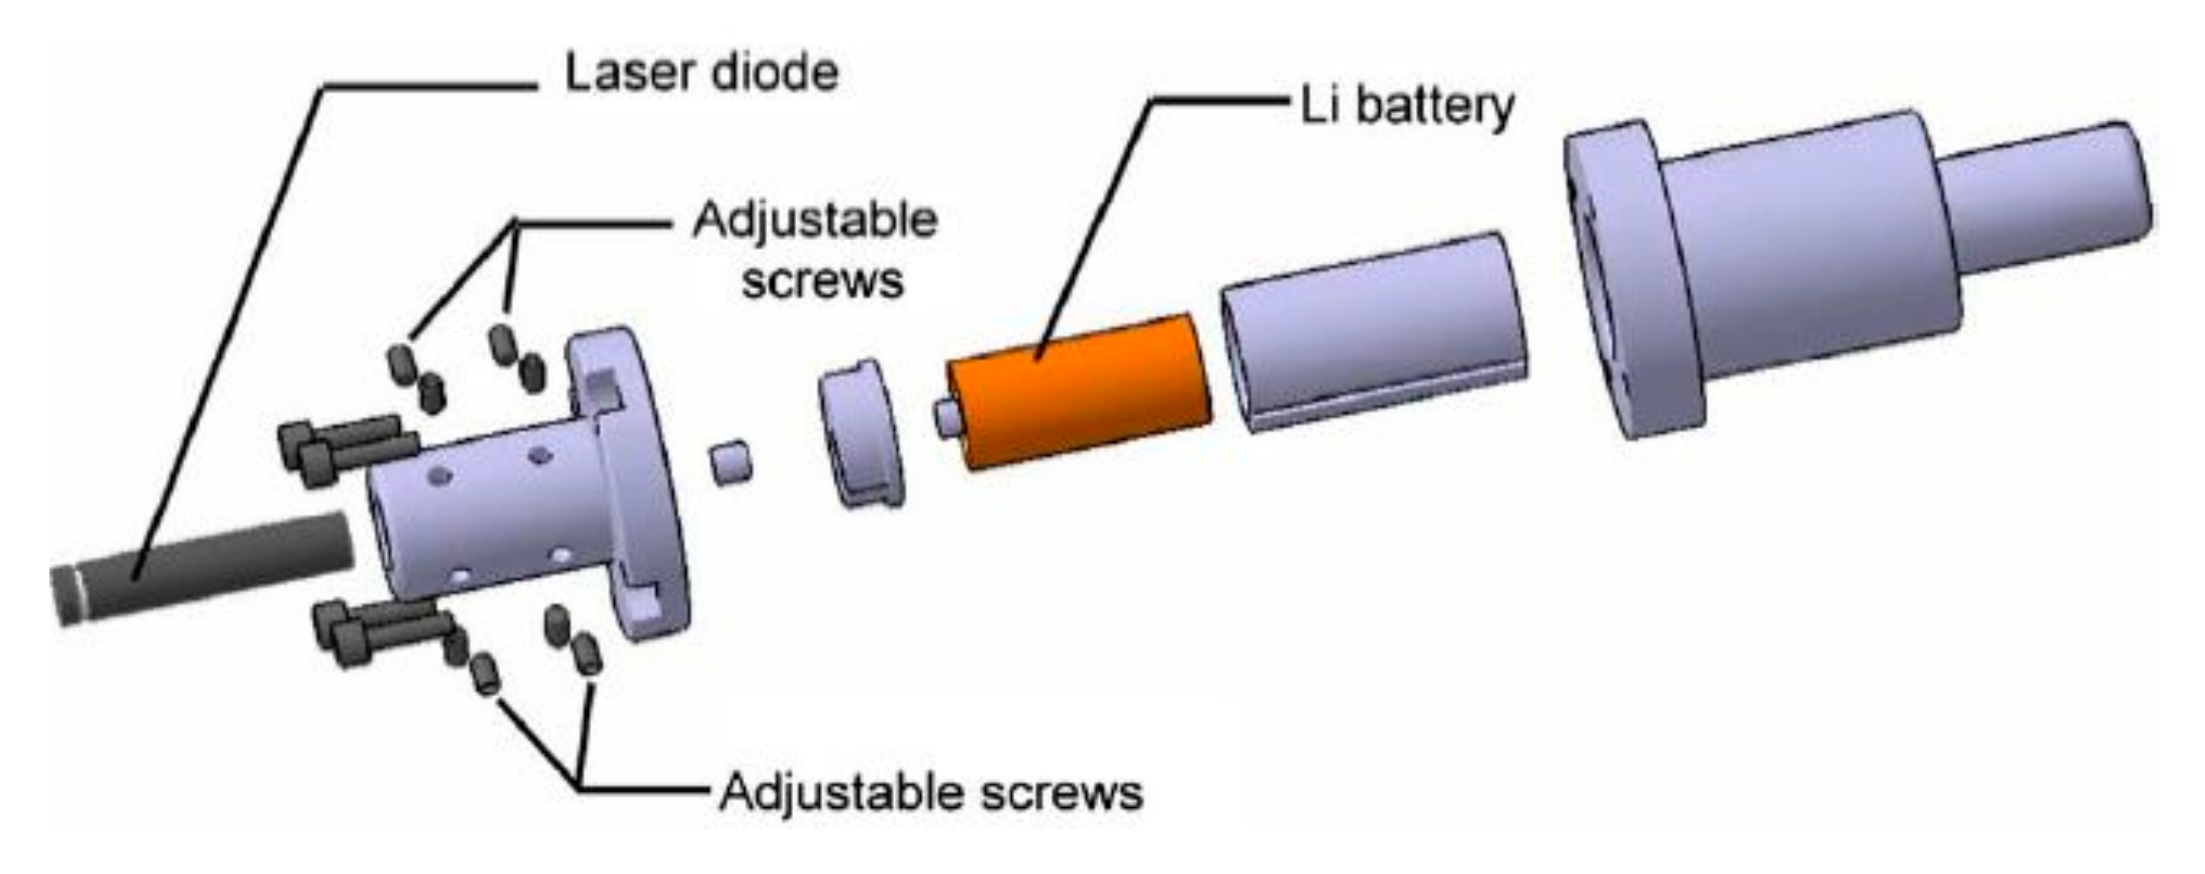
The PSD matrix determines the position of the light signal from the laser diode, and after A/D processing, the signal is sent to the computer. The authors of the idea shown in the
Figure 28 state that the diode casing is made of aluminium alloy; that, together with the battery, weigh less than 200 g; and that its length is not more than 10 cm with a diameter of 4 cm.
Due to its low weight, the device can be mounted in high-speed spindles. The properties of the PSD matrix allow the measurements of the following:
incorrect spindle movement,
spindle rotational speed, and
angular position of the spindle.
All these measurements are performed at the same time during the test.
Comparative tests were carried out using capacitive sensors. They proved that the idea of measuring spindle error movement with a laser diode and a position sensor (PSD) can be applied. The advantage is the lightness of the device mounted in the spindle, easy assembly, no expensive elements (e.g., ball standard), and only one sensor. The system can be used up to 300,000 rpm. The
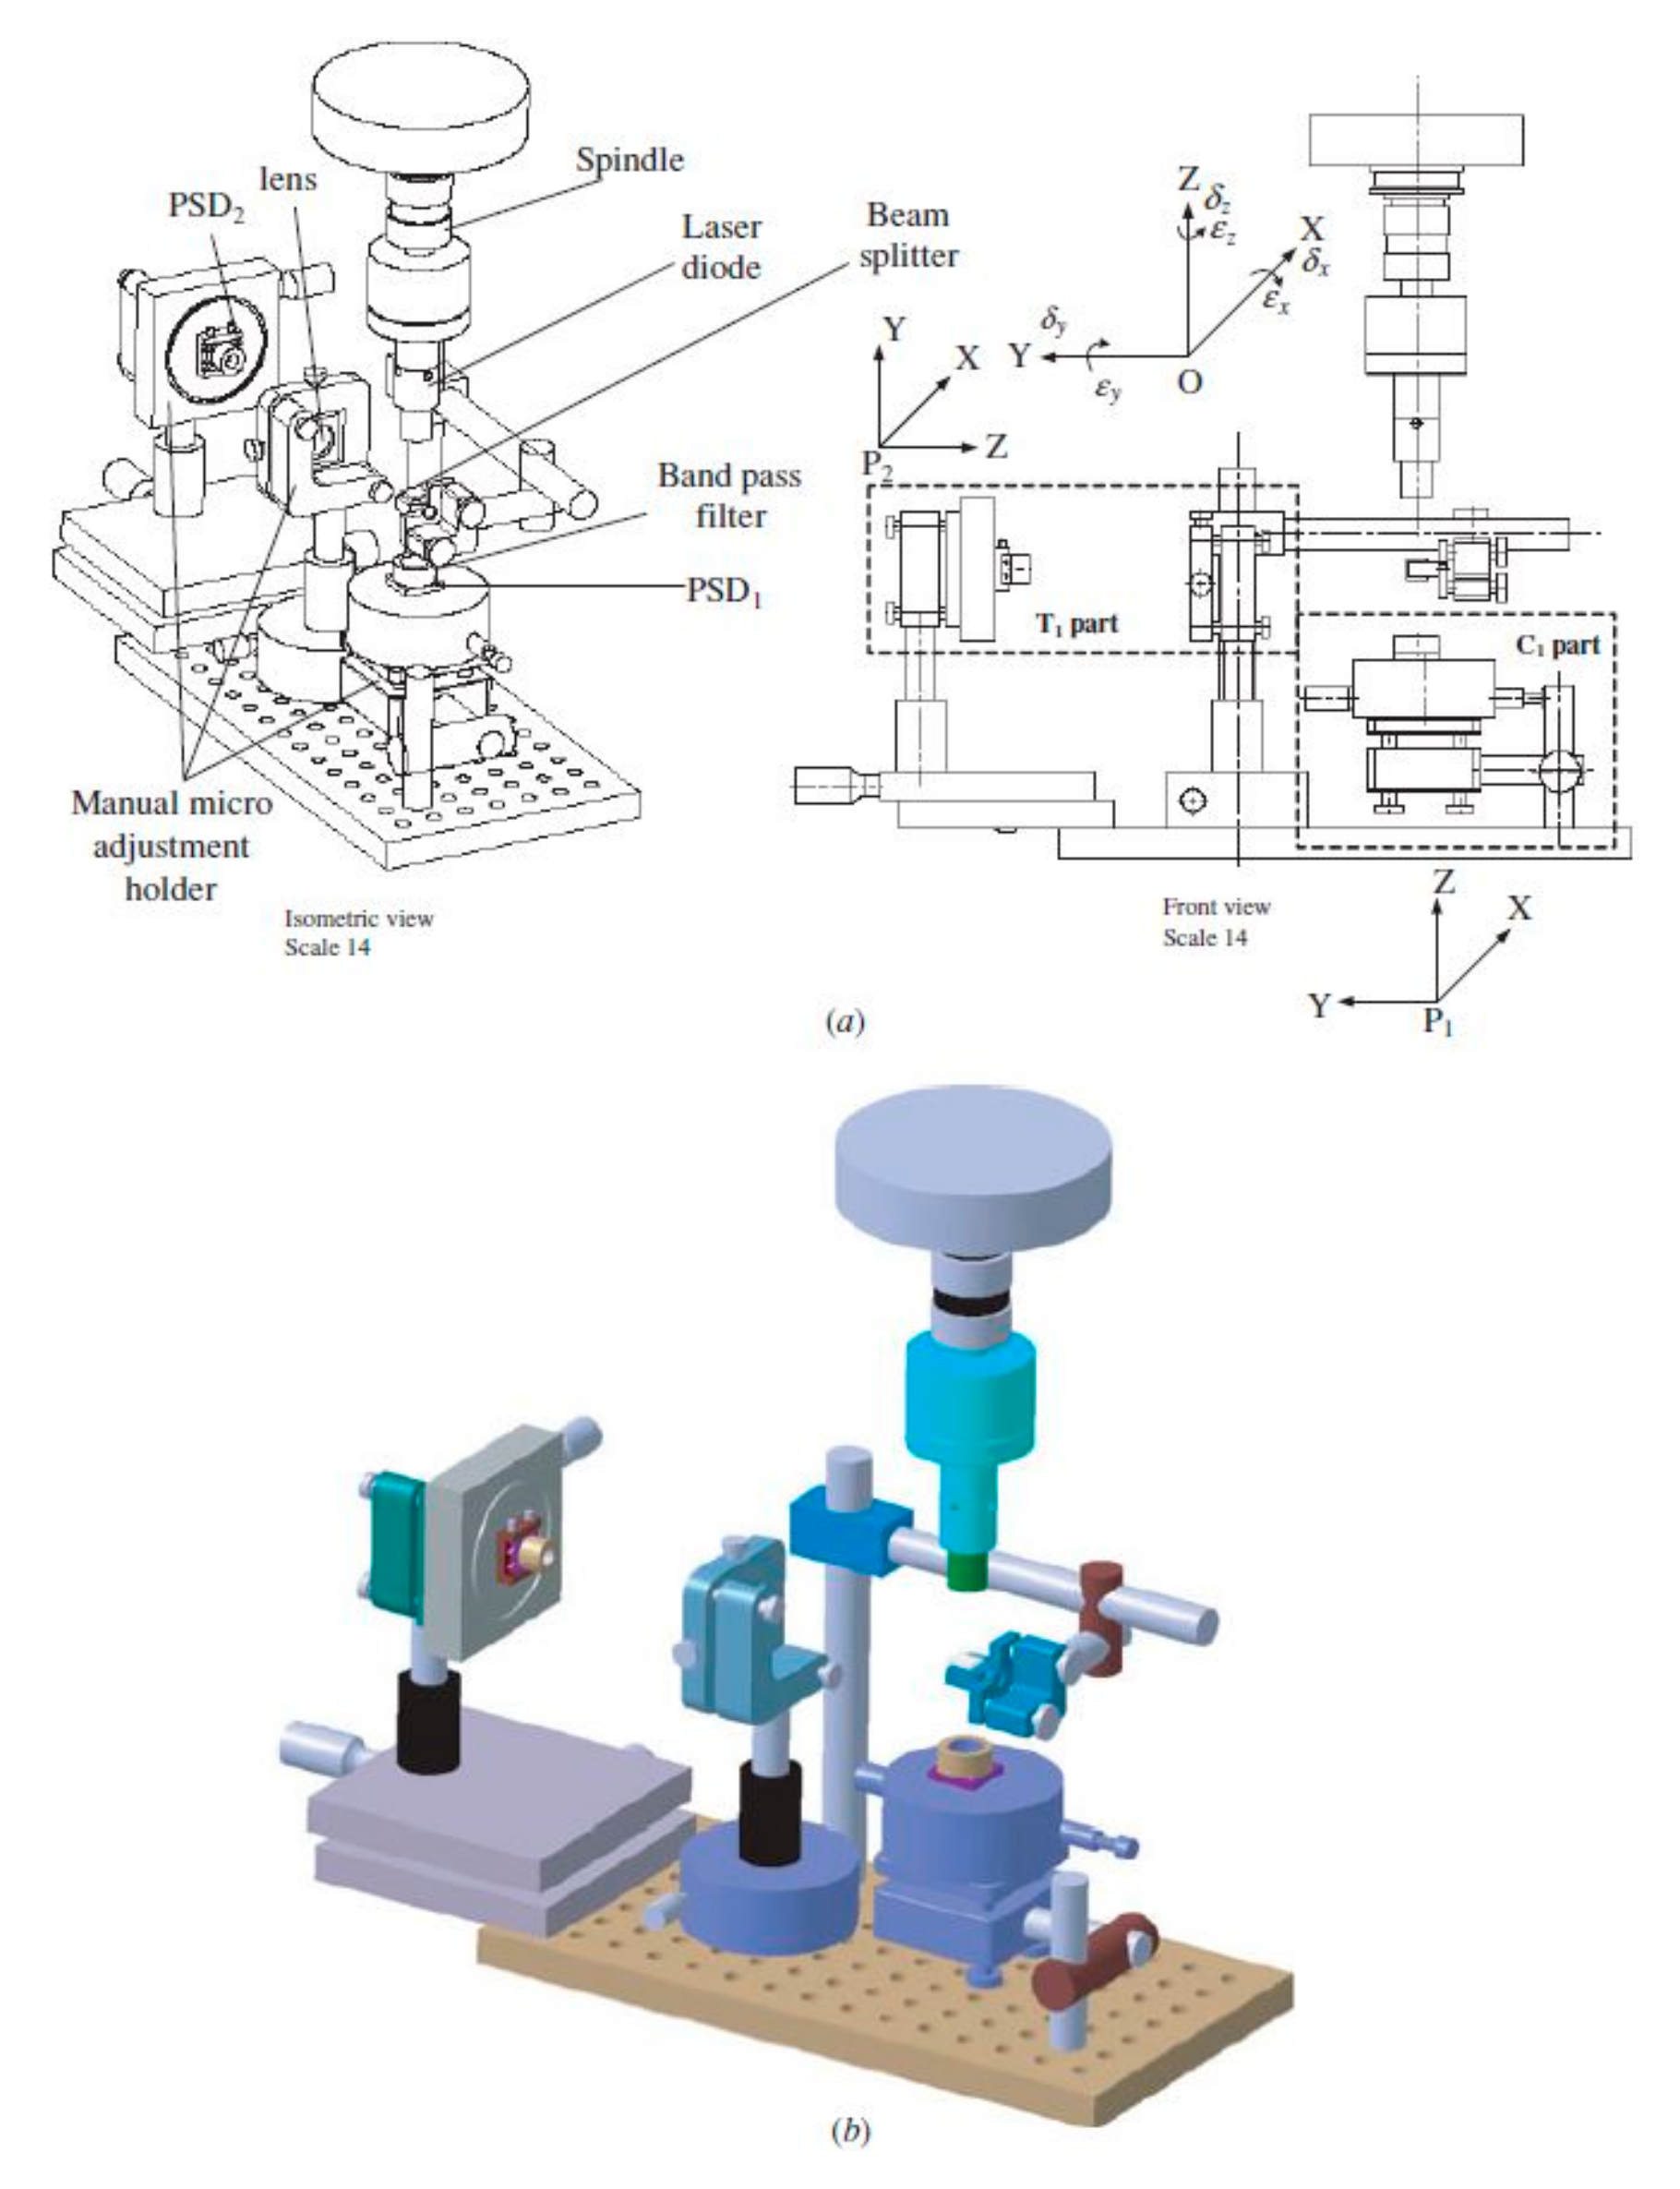
Figure 29 shows prototype device with a laser diode and two Position Sensitive Detector (PSD) sensors.
Previous studies of a similar system but with two position sensors are described in [
30]. The light signal from the laser diode mounted in the spindle was split into two streams. One PSD sensor measured the components of error movement in the X and Y axes, and the other measured angular tilt. Both sensors are fixed to the machine table: one in the XY plane and the other in the perpendicular to it. The laser beam coming from the diode mounted in the spindle is divided into two, perpendicular to each other (
Figure 29). During spindle rotation, error movements change the position of the laser beams, and these changes are read by PSD sensors. The value measured by the sensors (total error) is converted by the software into two radial errors and one angular error. The study presents the method to measure the individual components of the error movement. The research confirmed theoretical considerations, and the authors believe that the proposed solution can be used to measure the spindle error movements.
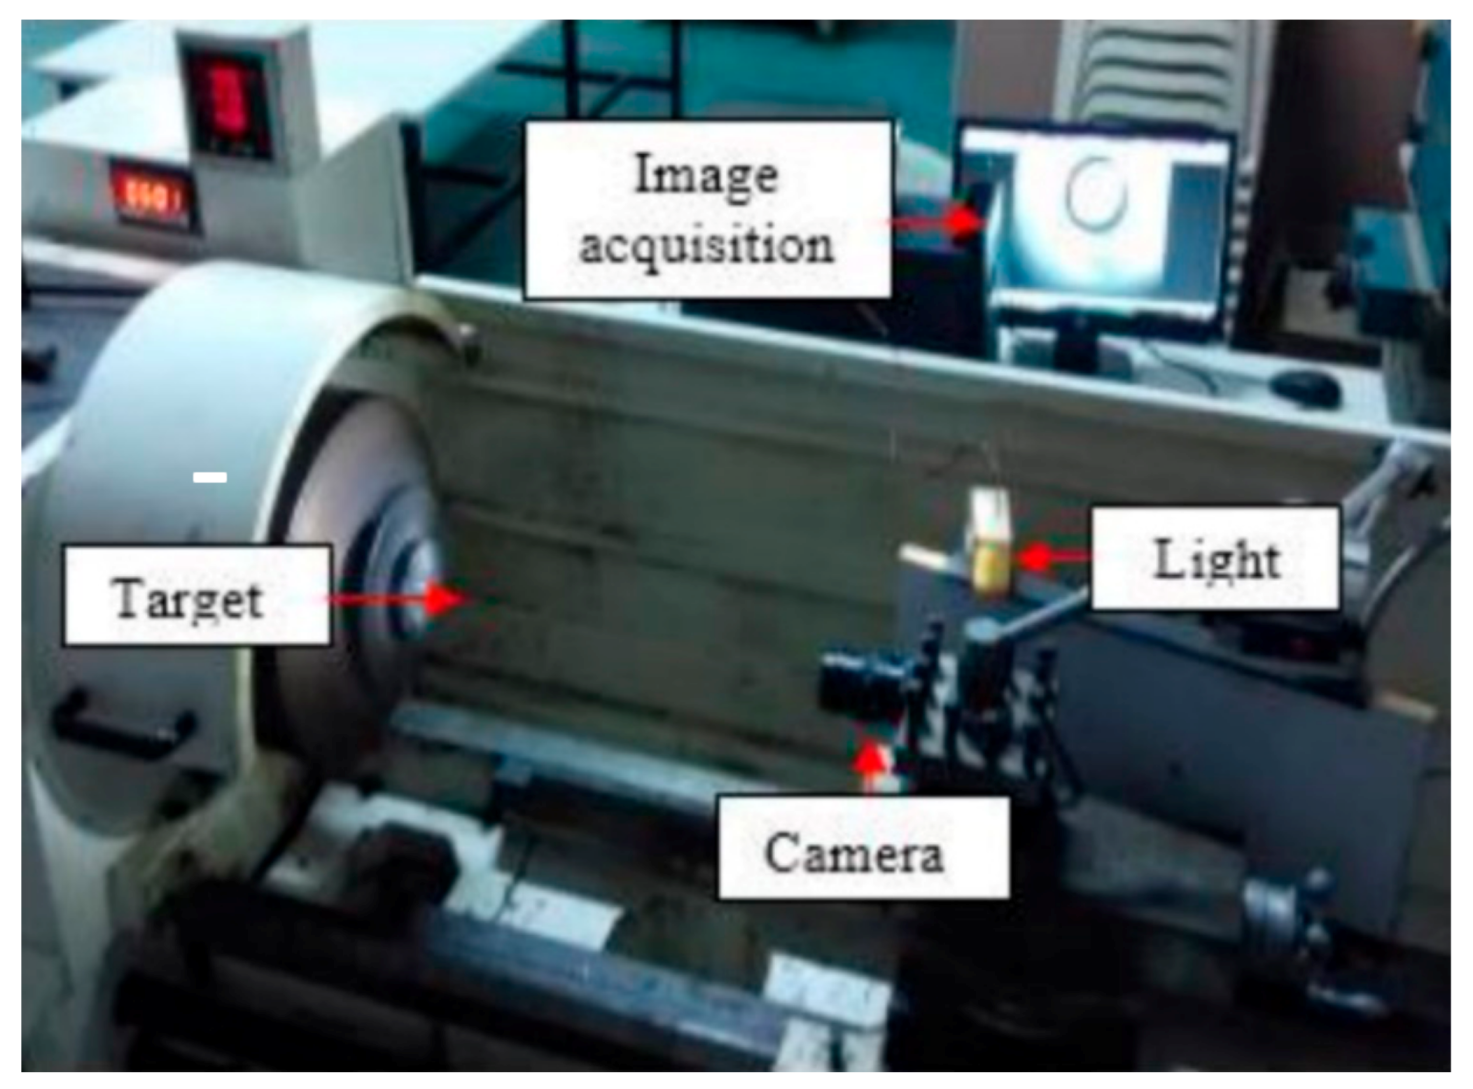
5.2. Measurement of Spindle Error Movements Using Vision Methods
The papers [
31,
32] describe an experimental method measuring error movements of a lathe spindle thanks to the use of a specially constructed vision system (machine vision), tracking the displacements of the edge of the cylindrical spindle face (master cylinder) mounted in the three-jaw self-centring chuck of the machine spindle. The vision system consisted of a complementary metal-oxide semiconductor (CMOS) camera mounted in a tool holder and an image acquisition system implemented on a PC. An important element of the stand was a properly selected and set strong light source, which allowed for even illumination of the front surface of the gauge plunger and for reductions in unwanted shadows and in adverse influence of ambient light.
Figure 30 shows a general view of the described test stand. The research team proposed its own methodology for measuring spindle error movements.
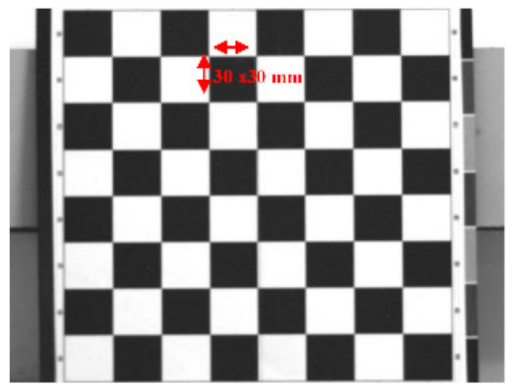
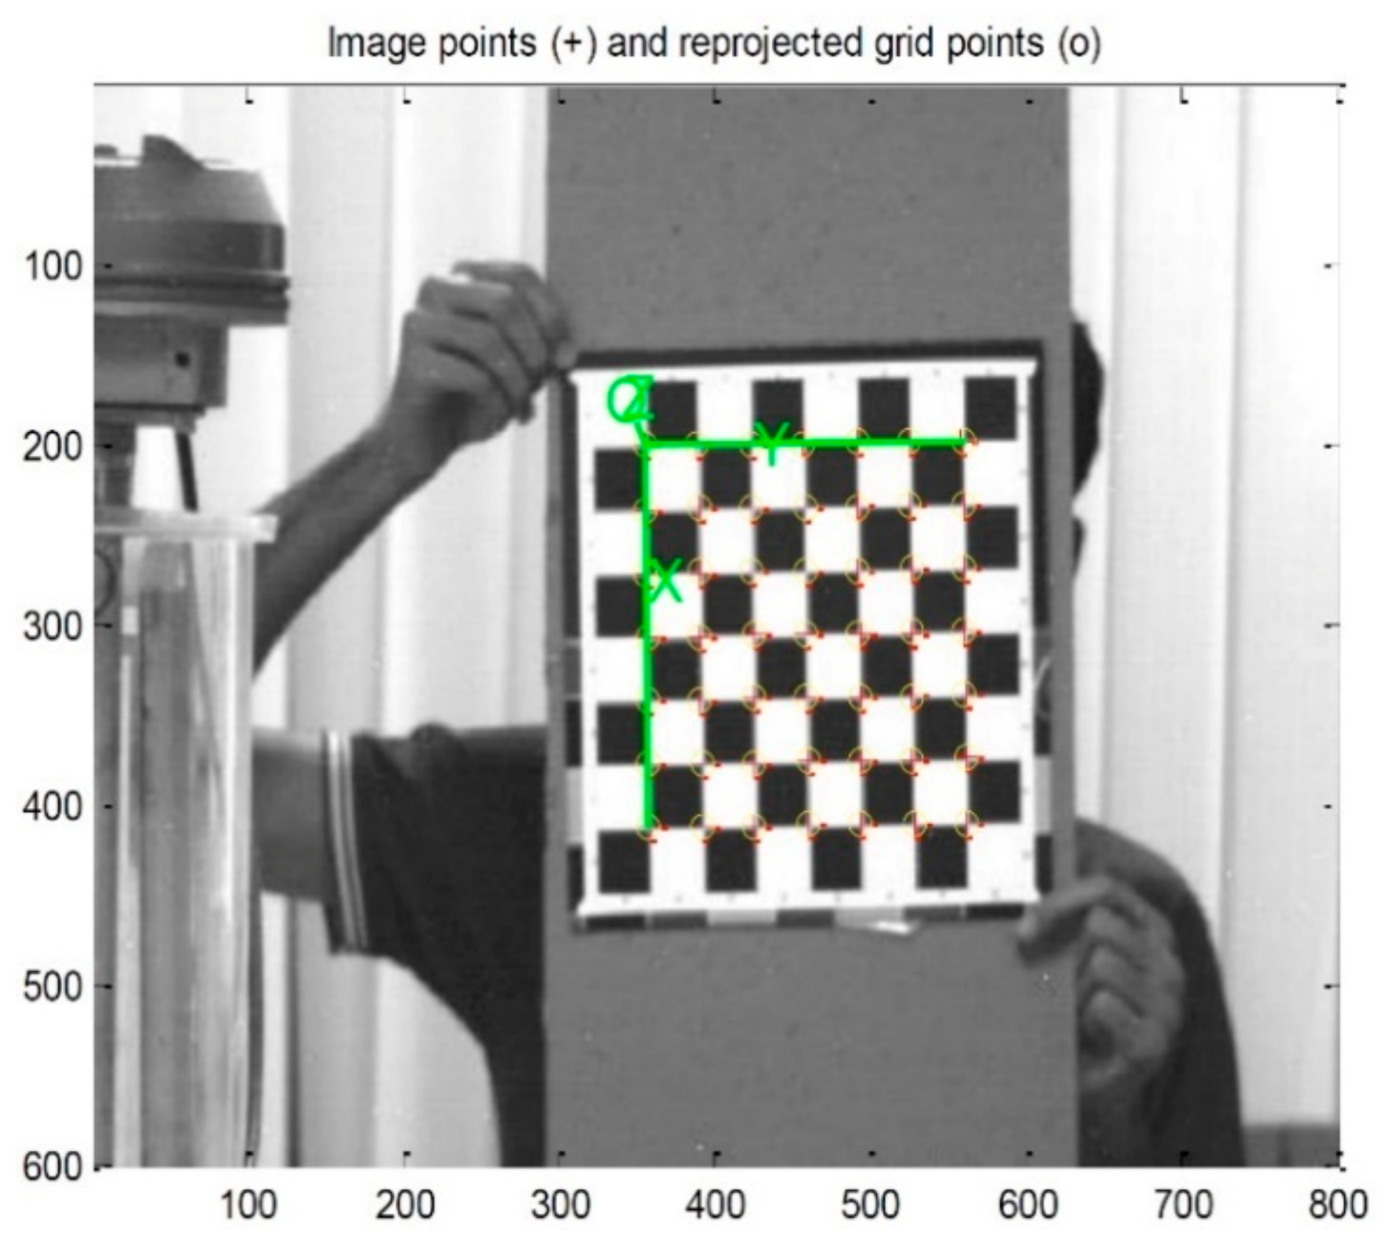
Before starting the tests, the camera were calibrated, the purpose of which was to determine the so-called conversion coefficient to convert dimensions from pixels to millimetres. For this step, photos of the gauge slip or a specially prepared board with a pattern representing a chessboard (
Figure 31 and
Figure 32) with known field sizes were used. After taking pictures of these objects, their size expressed in pixels was compared to the actual size expressed in millimetres, which made it possible to calculate the conversion coefficient. It should be emphasized that the use of a board with a chessboard pattern additionally allows you to check the level of distortions generated by the objective lens.
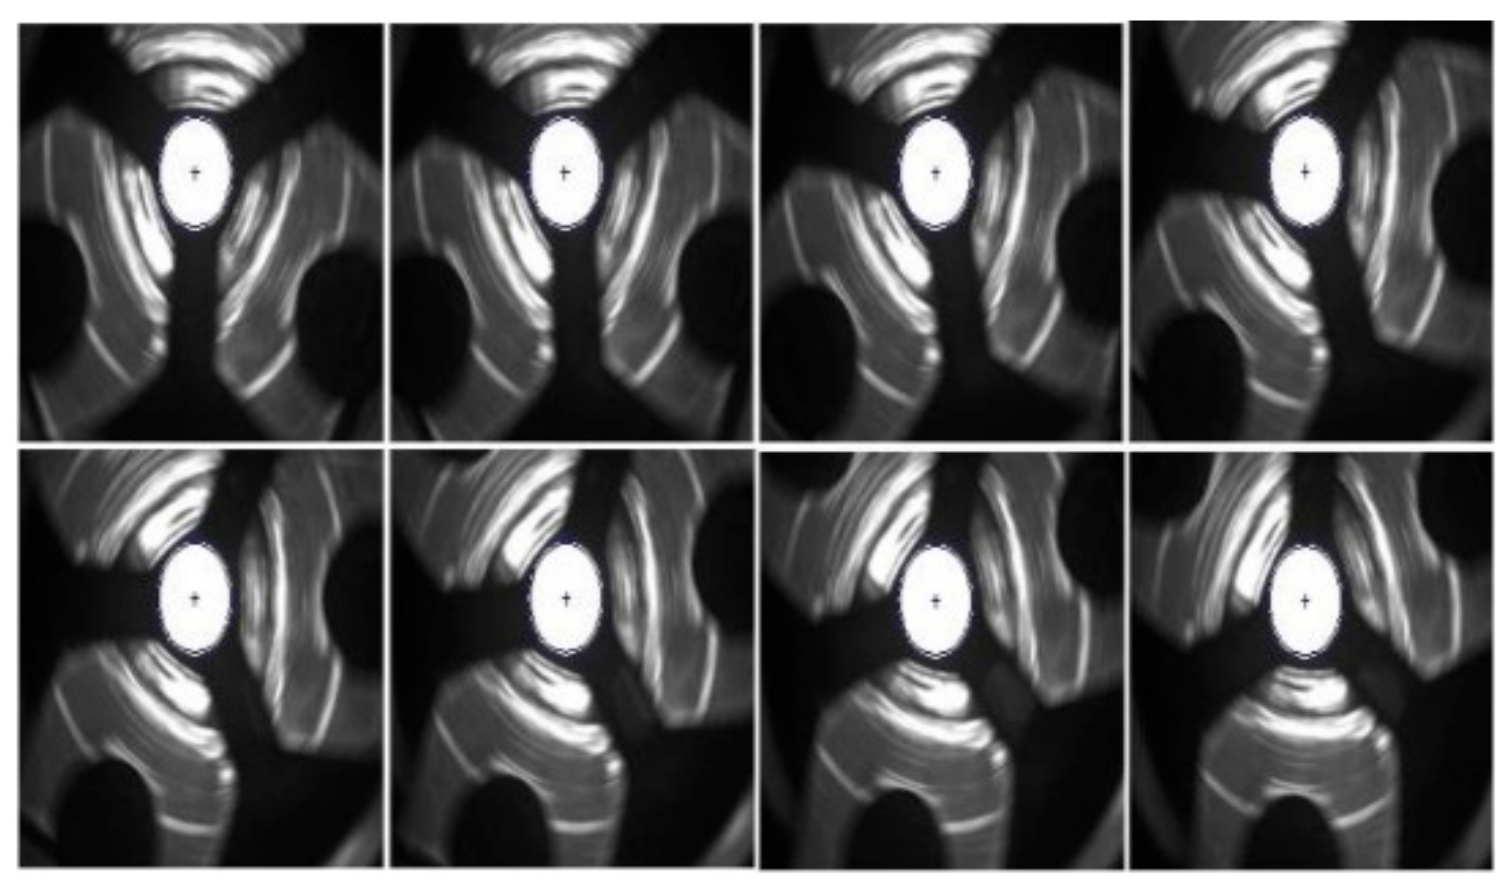
After setting the light source and calibrating the camera, the main phase in investigating error movements began for the next selected rotational speeds of the lathe spindle. For this purpose, a gauge plunger was attached to its holder, the rotation of which was recorded by the CMOS AVT Marlin F-131b camera, and changes in its angular position were saved on a PC in the form of a sequence of consecutive shots (
Figure 33) using the so-called IEEE-1394A frame grabber cards and LABVIEW Image software.
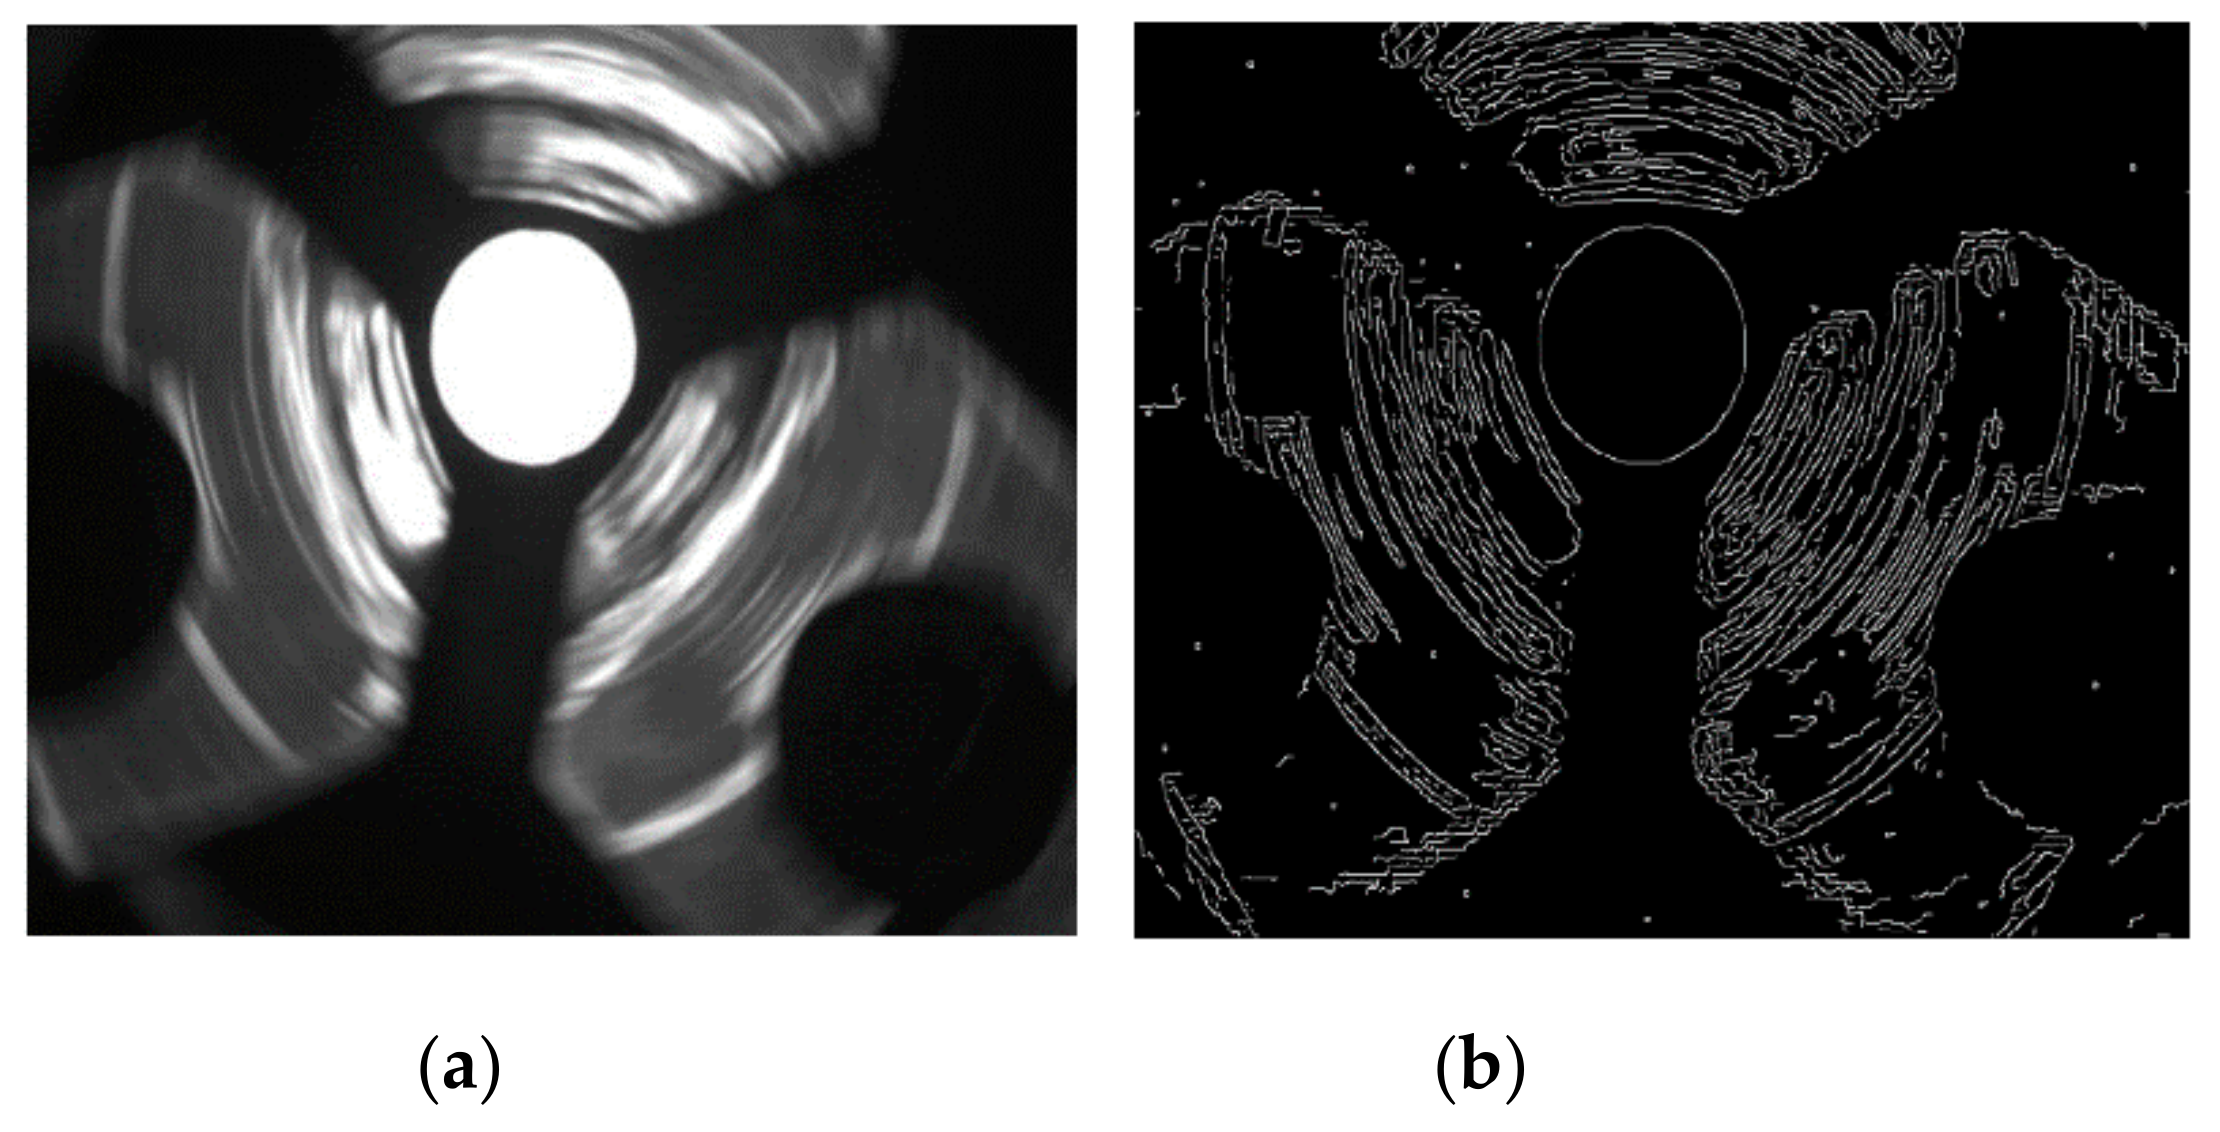
In further data processing, the software controlling the measurement system automatically analysed the collected shots and performed the next steps of the research algorithm to detect edges based on the so-called Canny operator (
Figure 34).
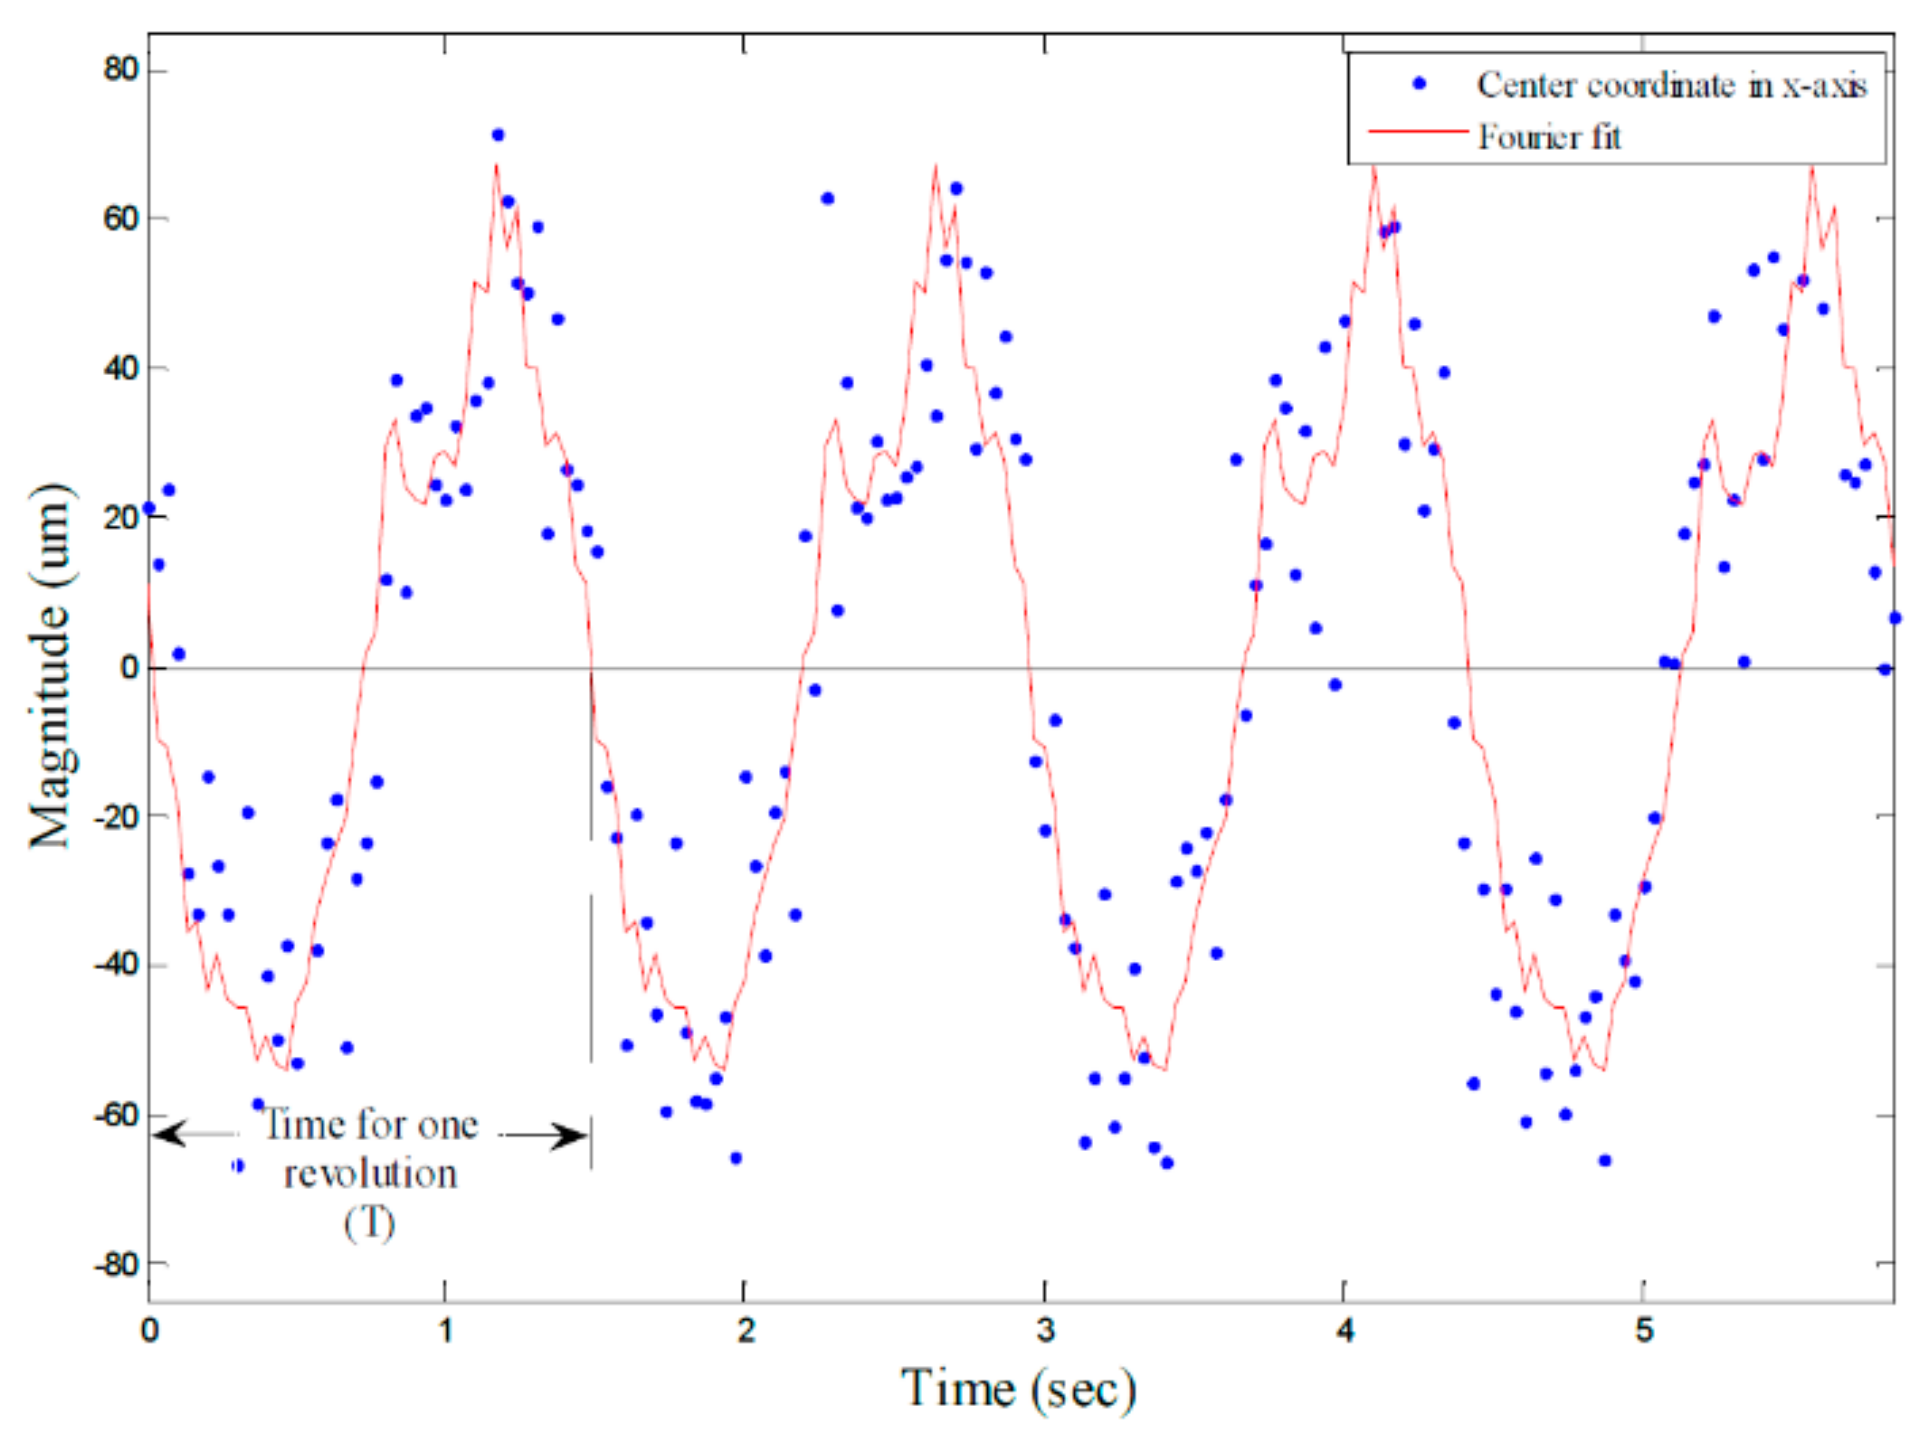
The next step was to determine the position of specific subpixels that best match the images of the previously detected edge position—for this purpose, the control program performed calculations based on the Circular Hough Transform (CHT). The results of these calculations were then subjected to further transformations, among others based on the least squares method and the Fourier transformation, which led to determination of the instantaneous positions of the axis of rotation (
Figure 35) and then to separation of the synchronous and asynchronous components and finally gave the value of the error movement of the tested spindle (
Figure 36).
Extraction of periodic components using the least squares fitting of the Fourier curve [
32]
The repeatability of the results was assessed, and satisfactory results were obtained. Summing up, the proposed method seems to be interesting due to the possibility of obtaining precise measurements with a relatively cheap test stand (compared to the cost of commercial sets).
5.3. Measurement with an Experimental Optoelectronic Device
The work in [
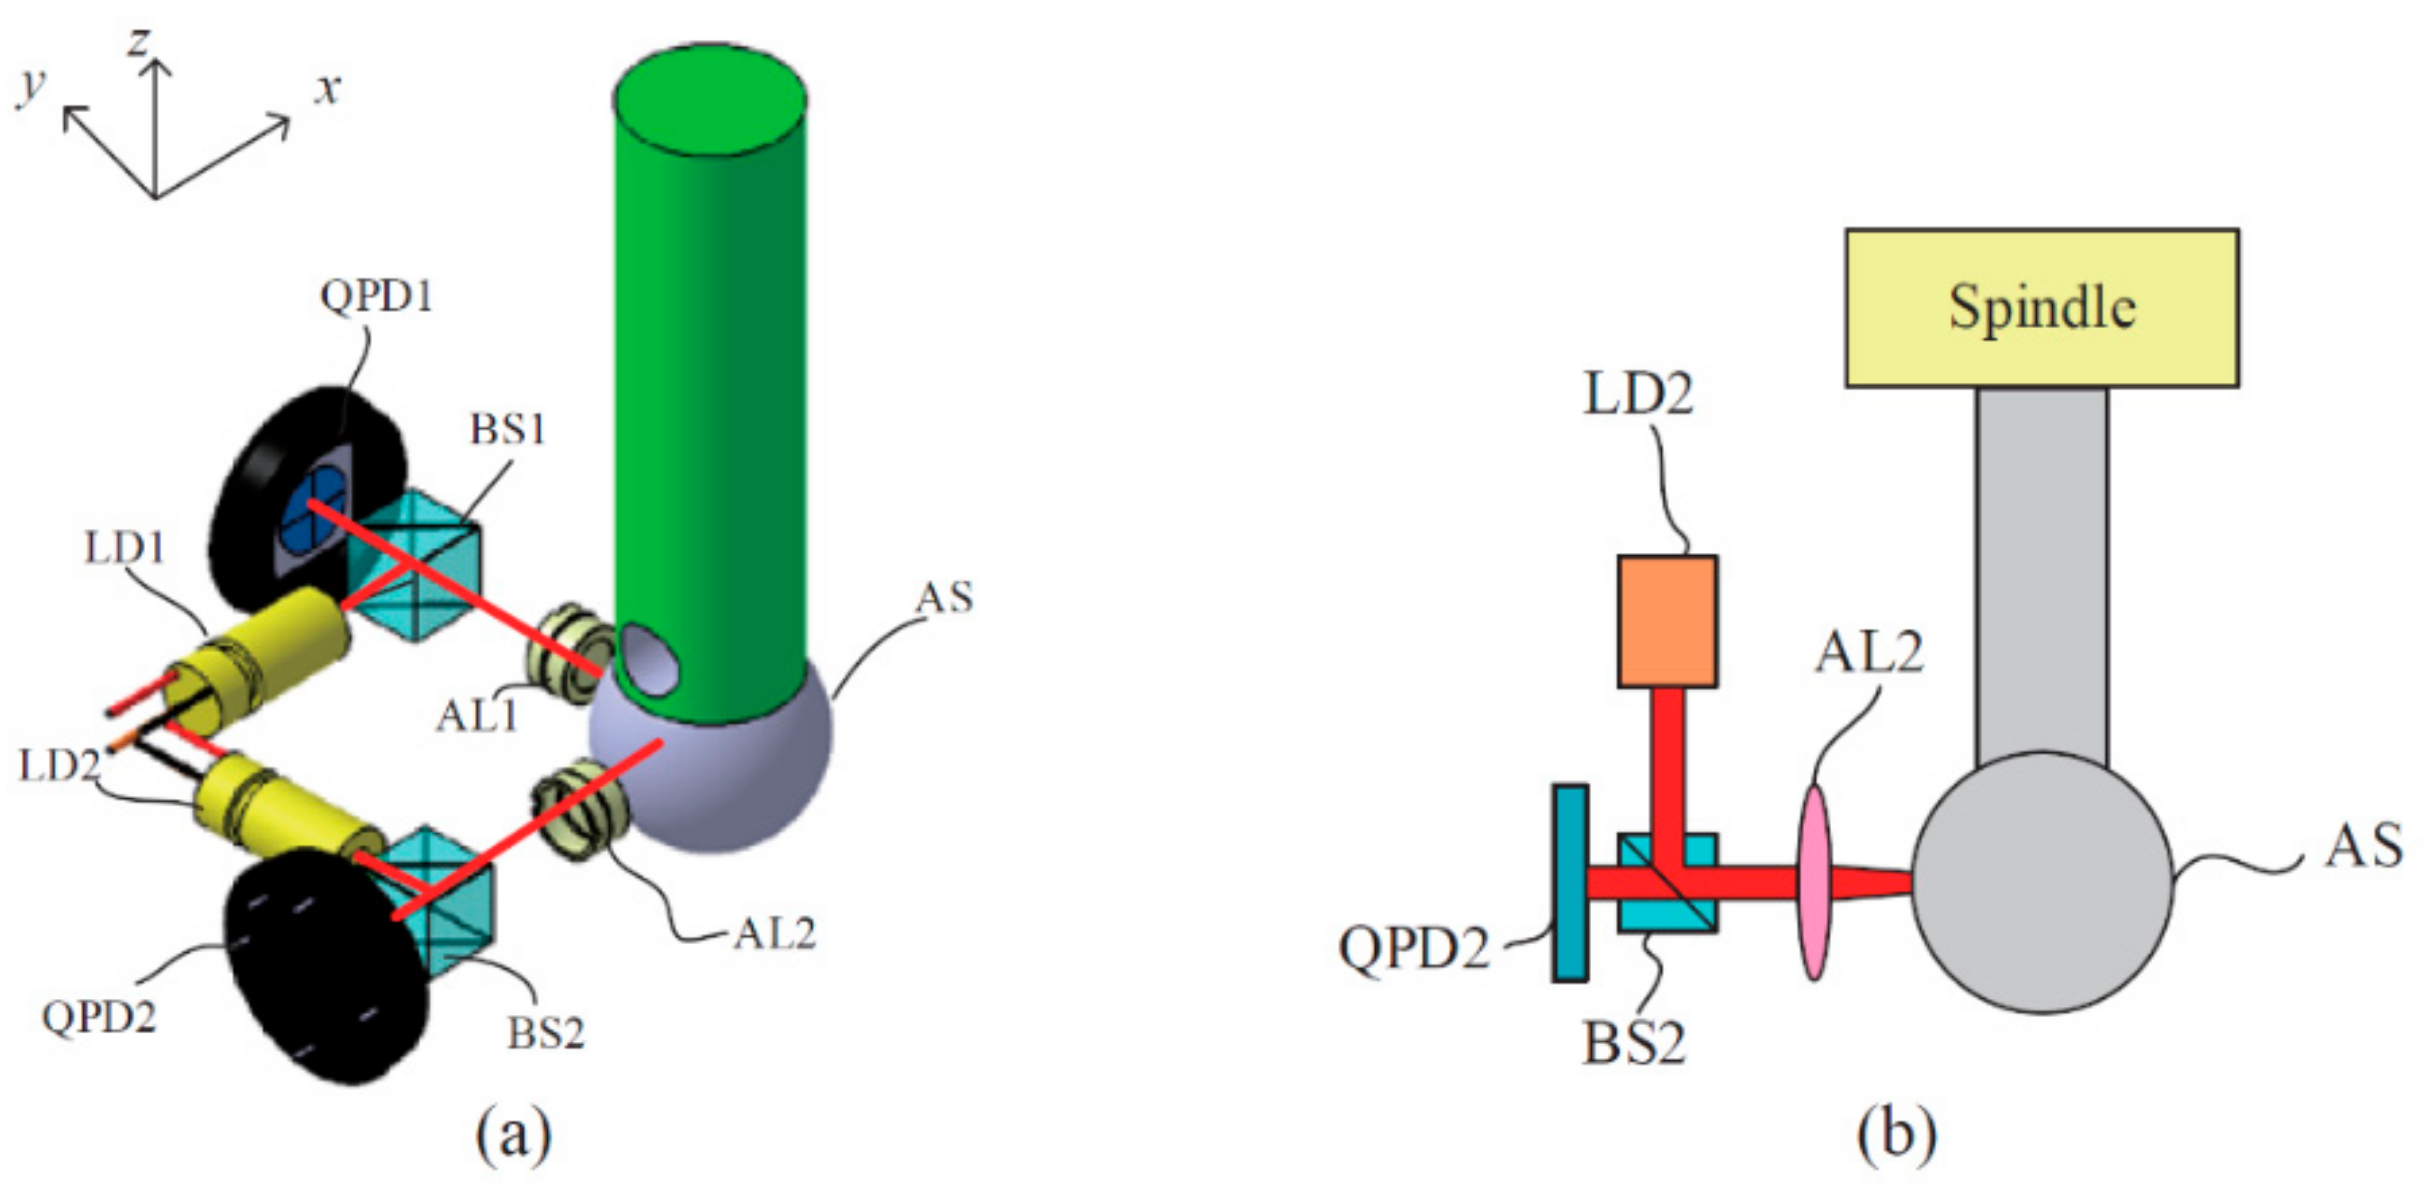
33] describes a method for measuring spindle error movements based on an experimental research device equipped with an optical system operating as an autocollimator.
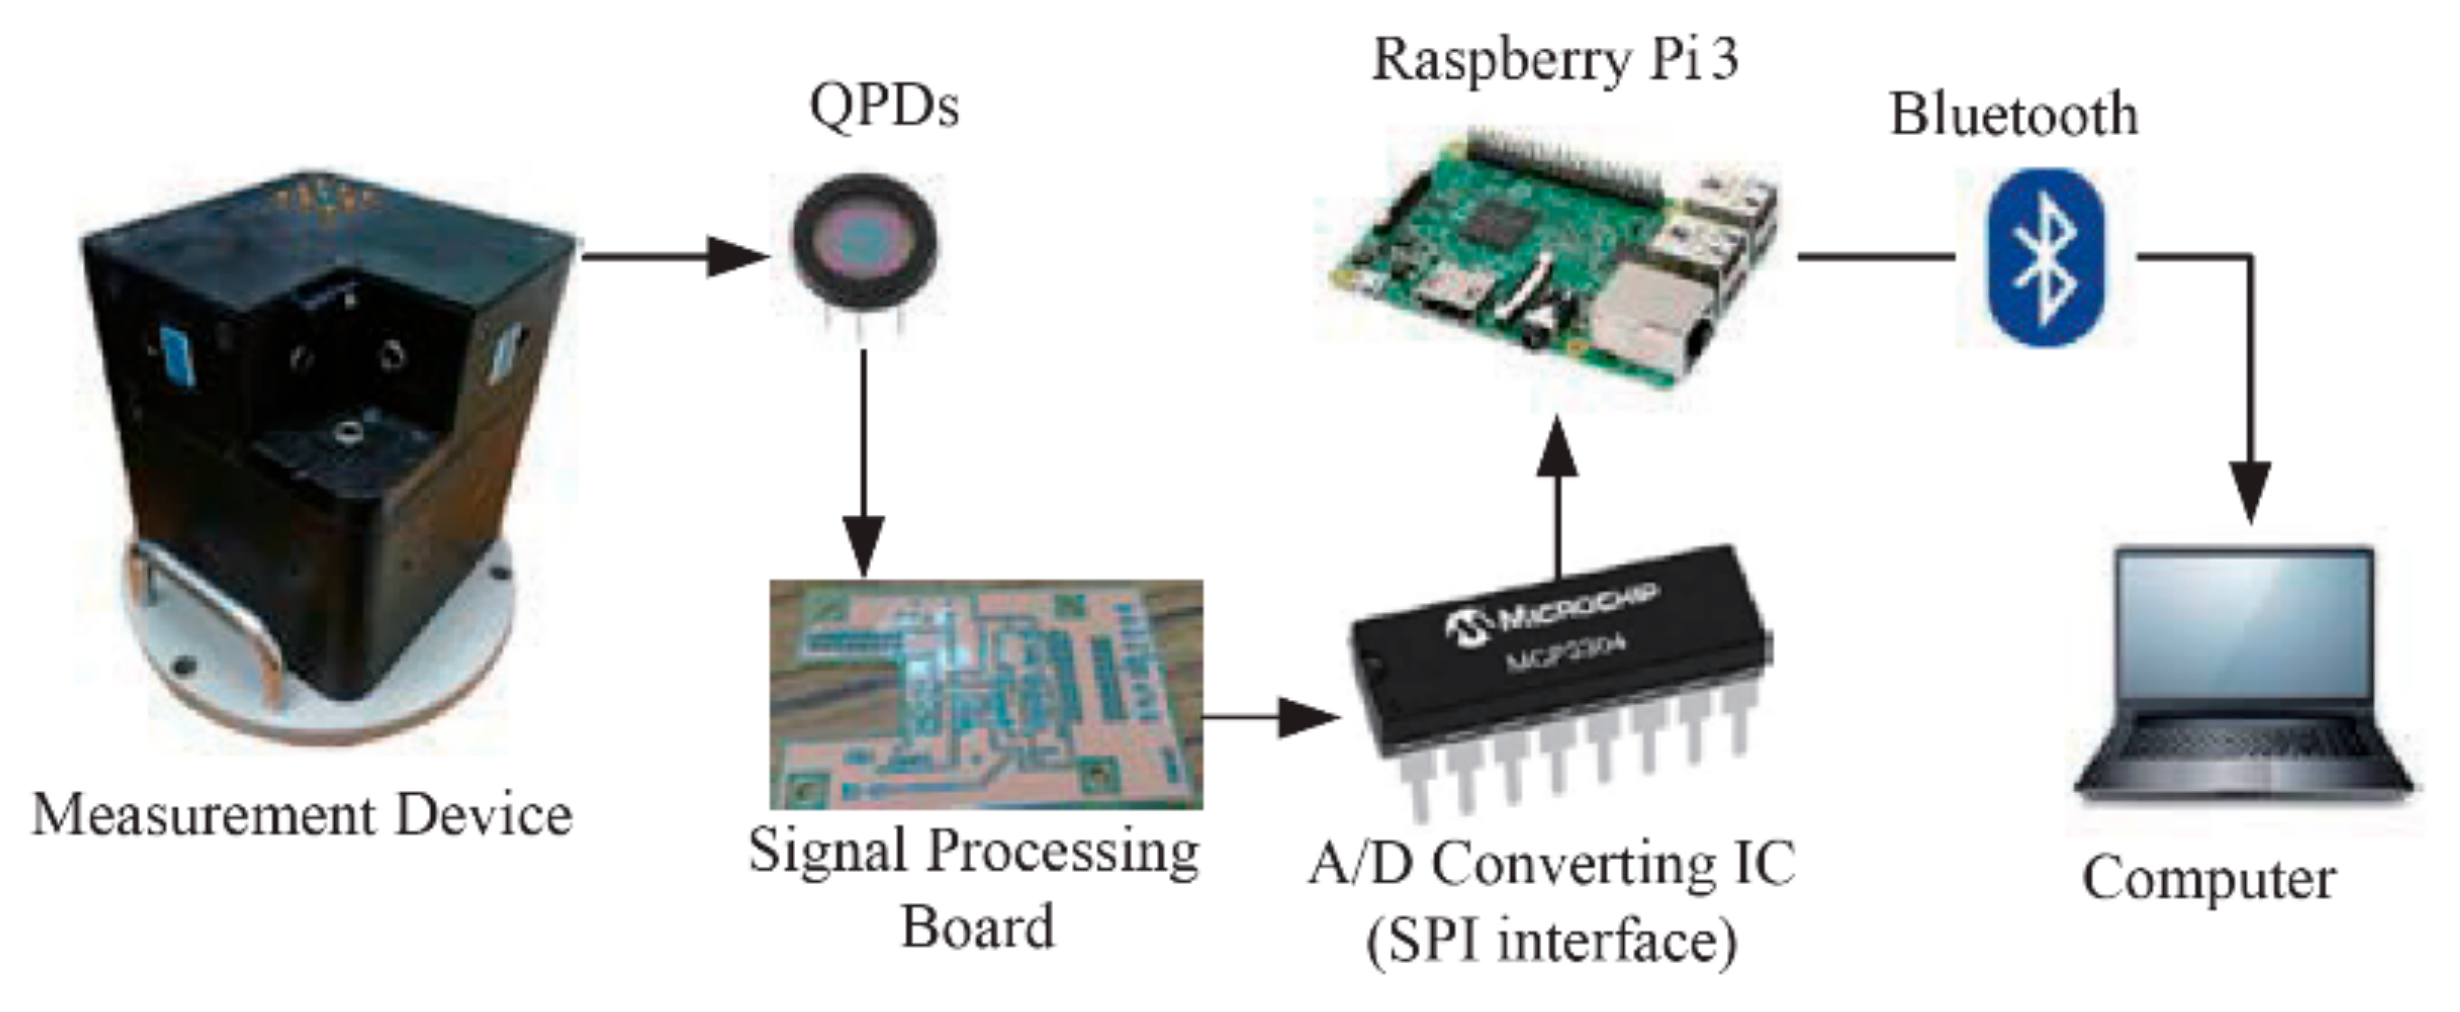
Figure 37 shows a diagram of a measuring station using the so-called artificial standard sphere (AS) mounted in the tested spindle and two measuring modules, each of which consists of the following:
a laser diode with a wavelength of 633 nm and a power of 2 mW,
a photodetector sensitive to changes in the position of the incident light beam QPD (quadrant-position-sensing detector) by OSI Optoelectronics (model SPOT-9D),
an aspherical lens by Thorlabs (model A280TM-A), and
a beam splitter dividing in a 50/50 proportion.
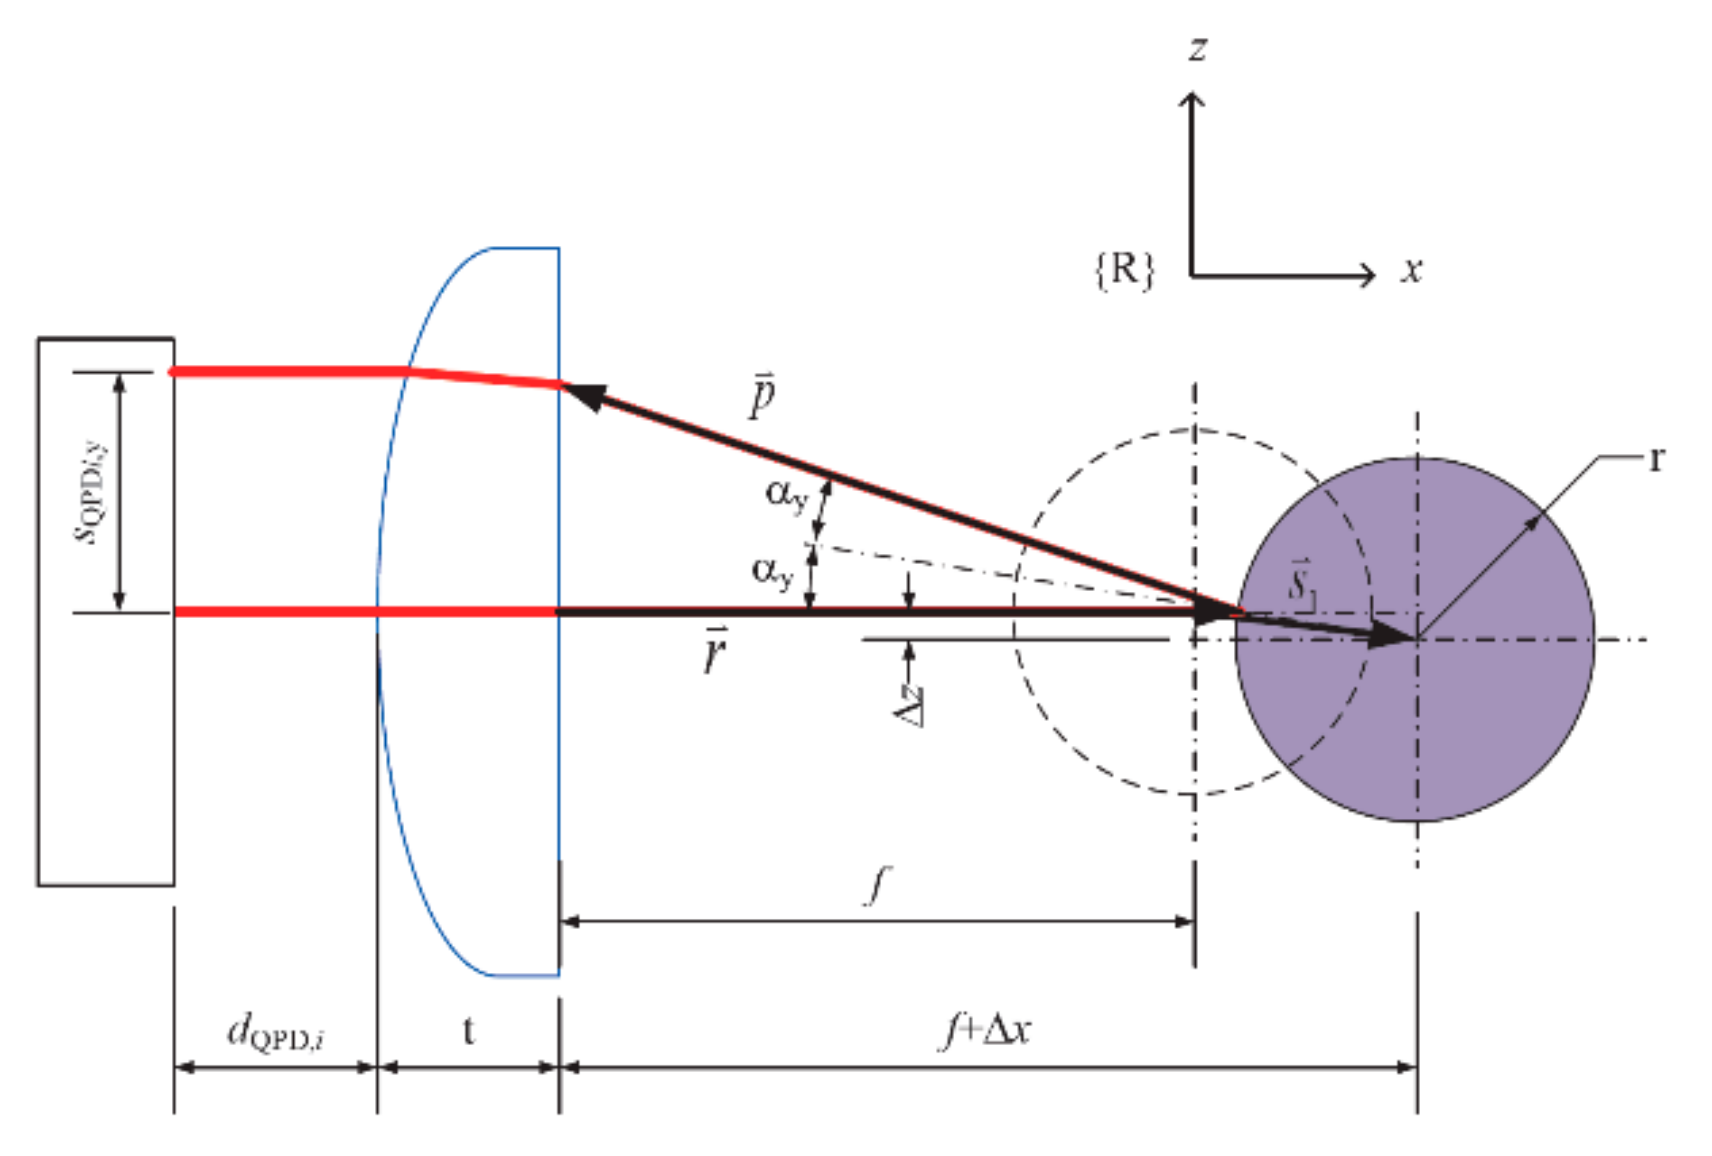
The light beam emitted by the laser diode (LD) passes through the beam splitter (BS) and is focused by the aspherical lens (AL) on the surface of the artificial sphere (AS). Then, the light beam reflected from the surface of the artificial sphere (AS) returns through the aspherical lens (AL), passes through the beam splitter (BS), and falls on the measuring surface of the QPD (quadrant-position-sensing detector) photodetector.
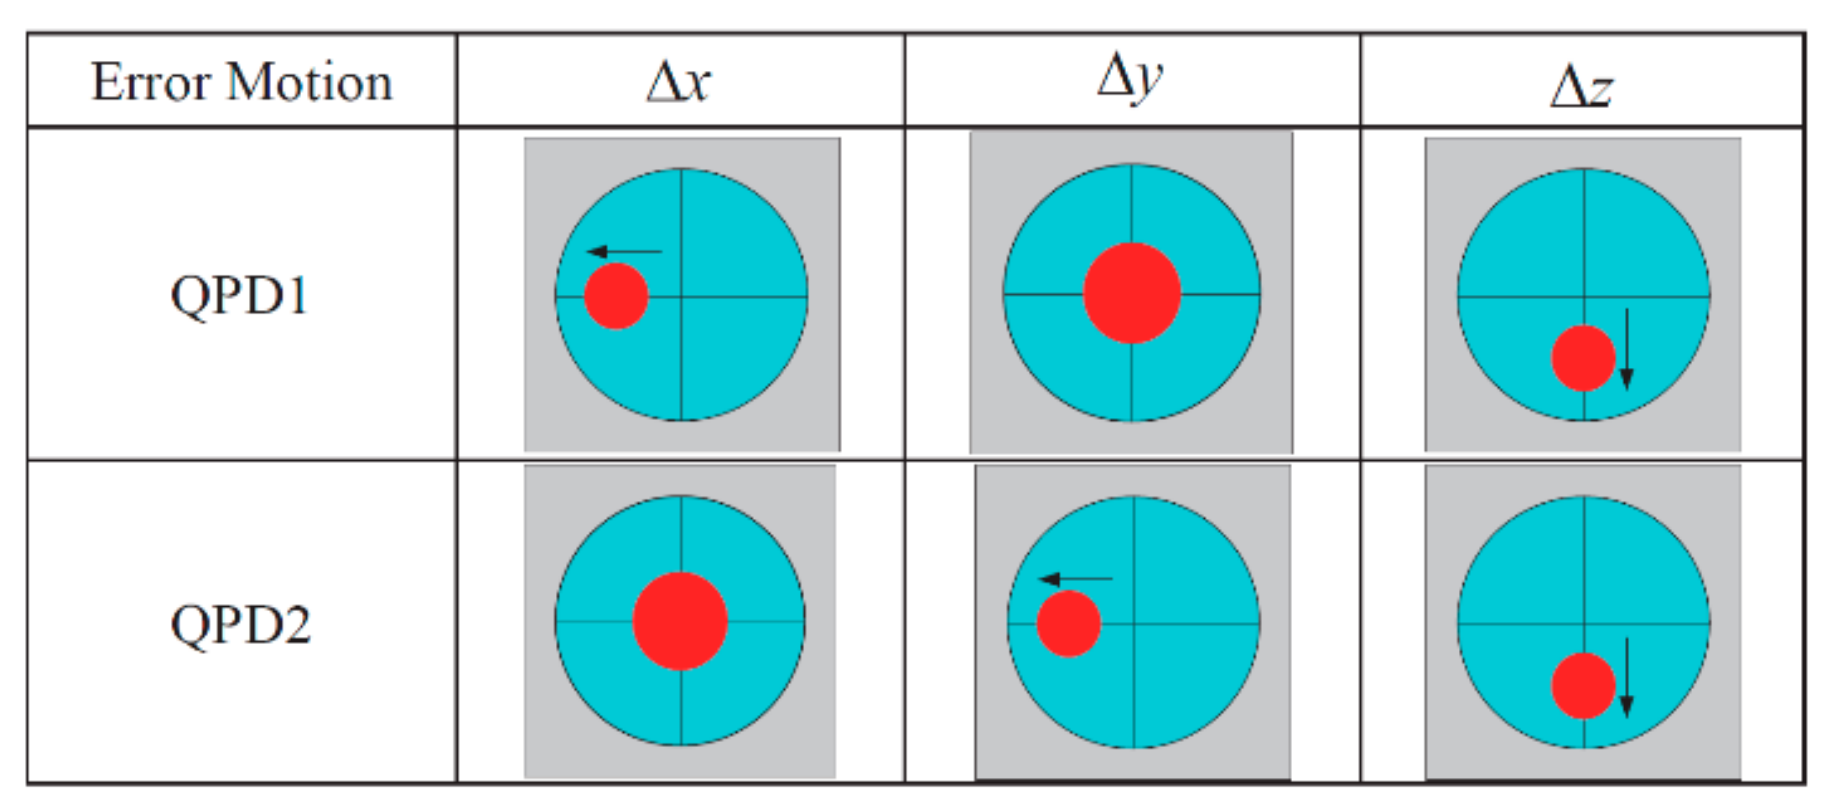
The principle of operation of the described device is based on the use of the autocollimation phenomenon. Displacement of the AS ball in any direction causes the corresponding displacement of the light beams emitted by the LD1 and LD2 diodes against the QPD1 and QPD2 photodetectors, as shown in
Figure 38 and
Figure 39.
The signals generated by these photodetectors through appropriately constructed apparatus (
Figure 40) go to a PC, where, using appropriate algorithms implemented in the measuring system, disturbances (noise) are filtered and then, on their basis, the values of spindle error movements are calculated.
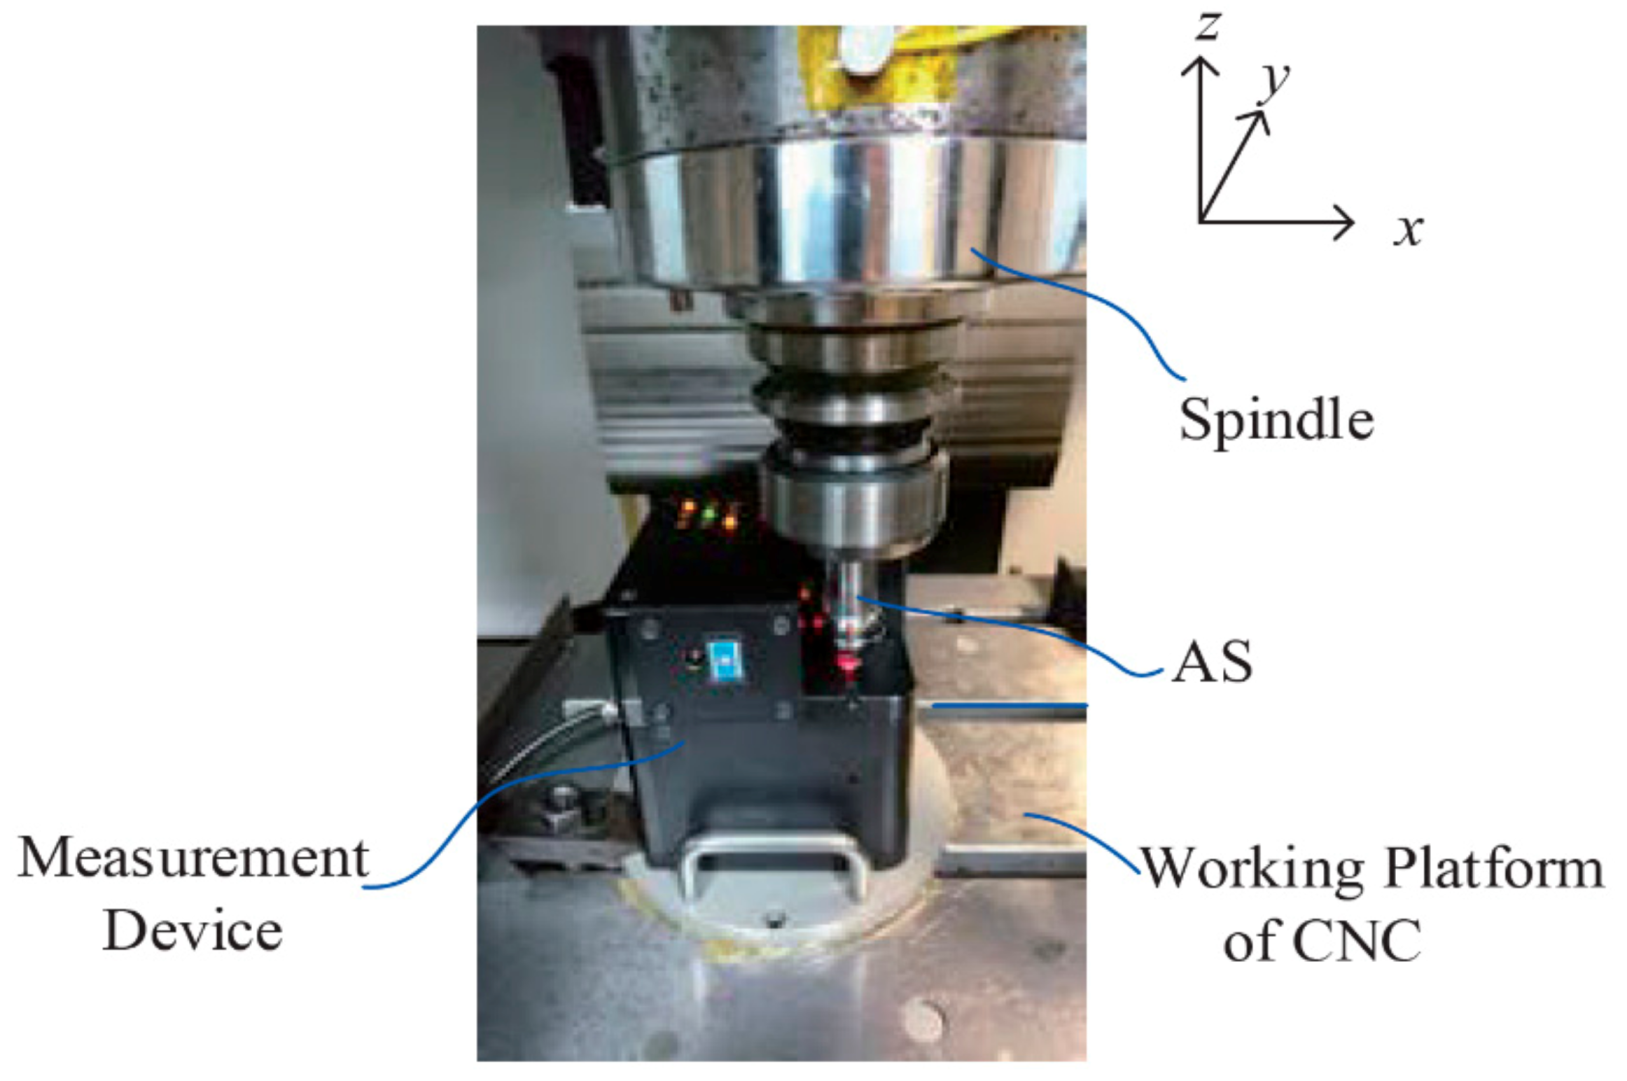
A series of tests for the spindle of a vertical CNC milling machine was carried out (
Figure 41) for several selected rotational speeds. During the research, high-frequency noise was observed, which the authors believe was caused by the inaccuracy of the sphere used.
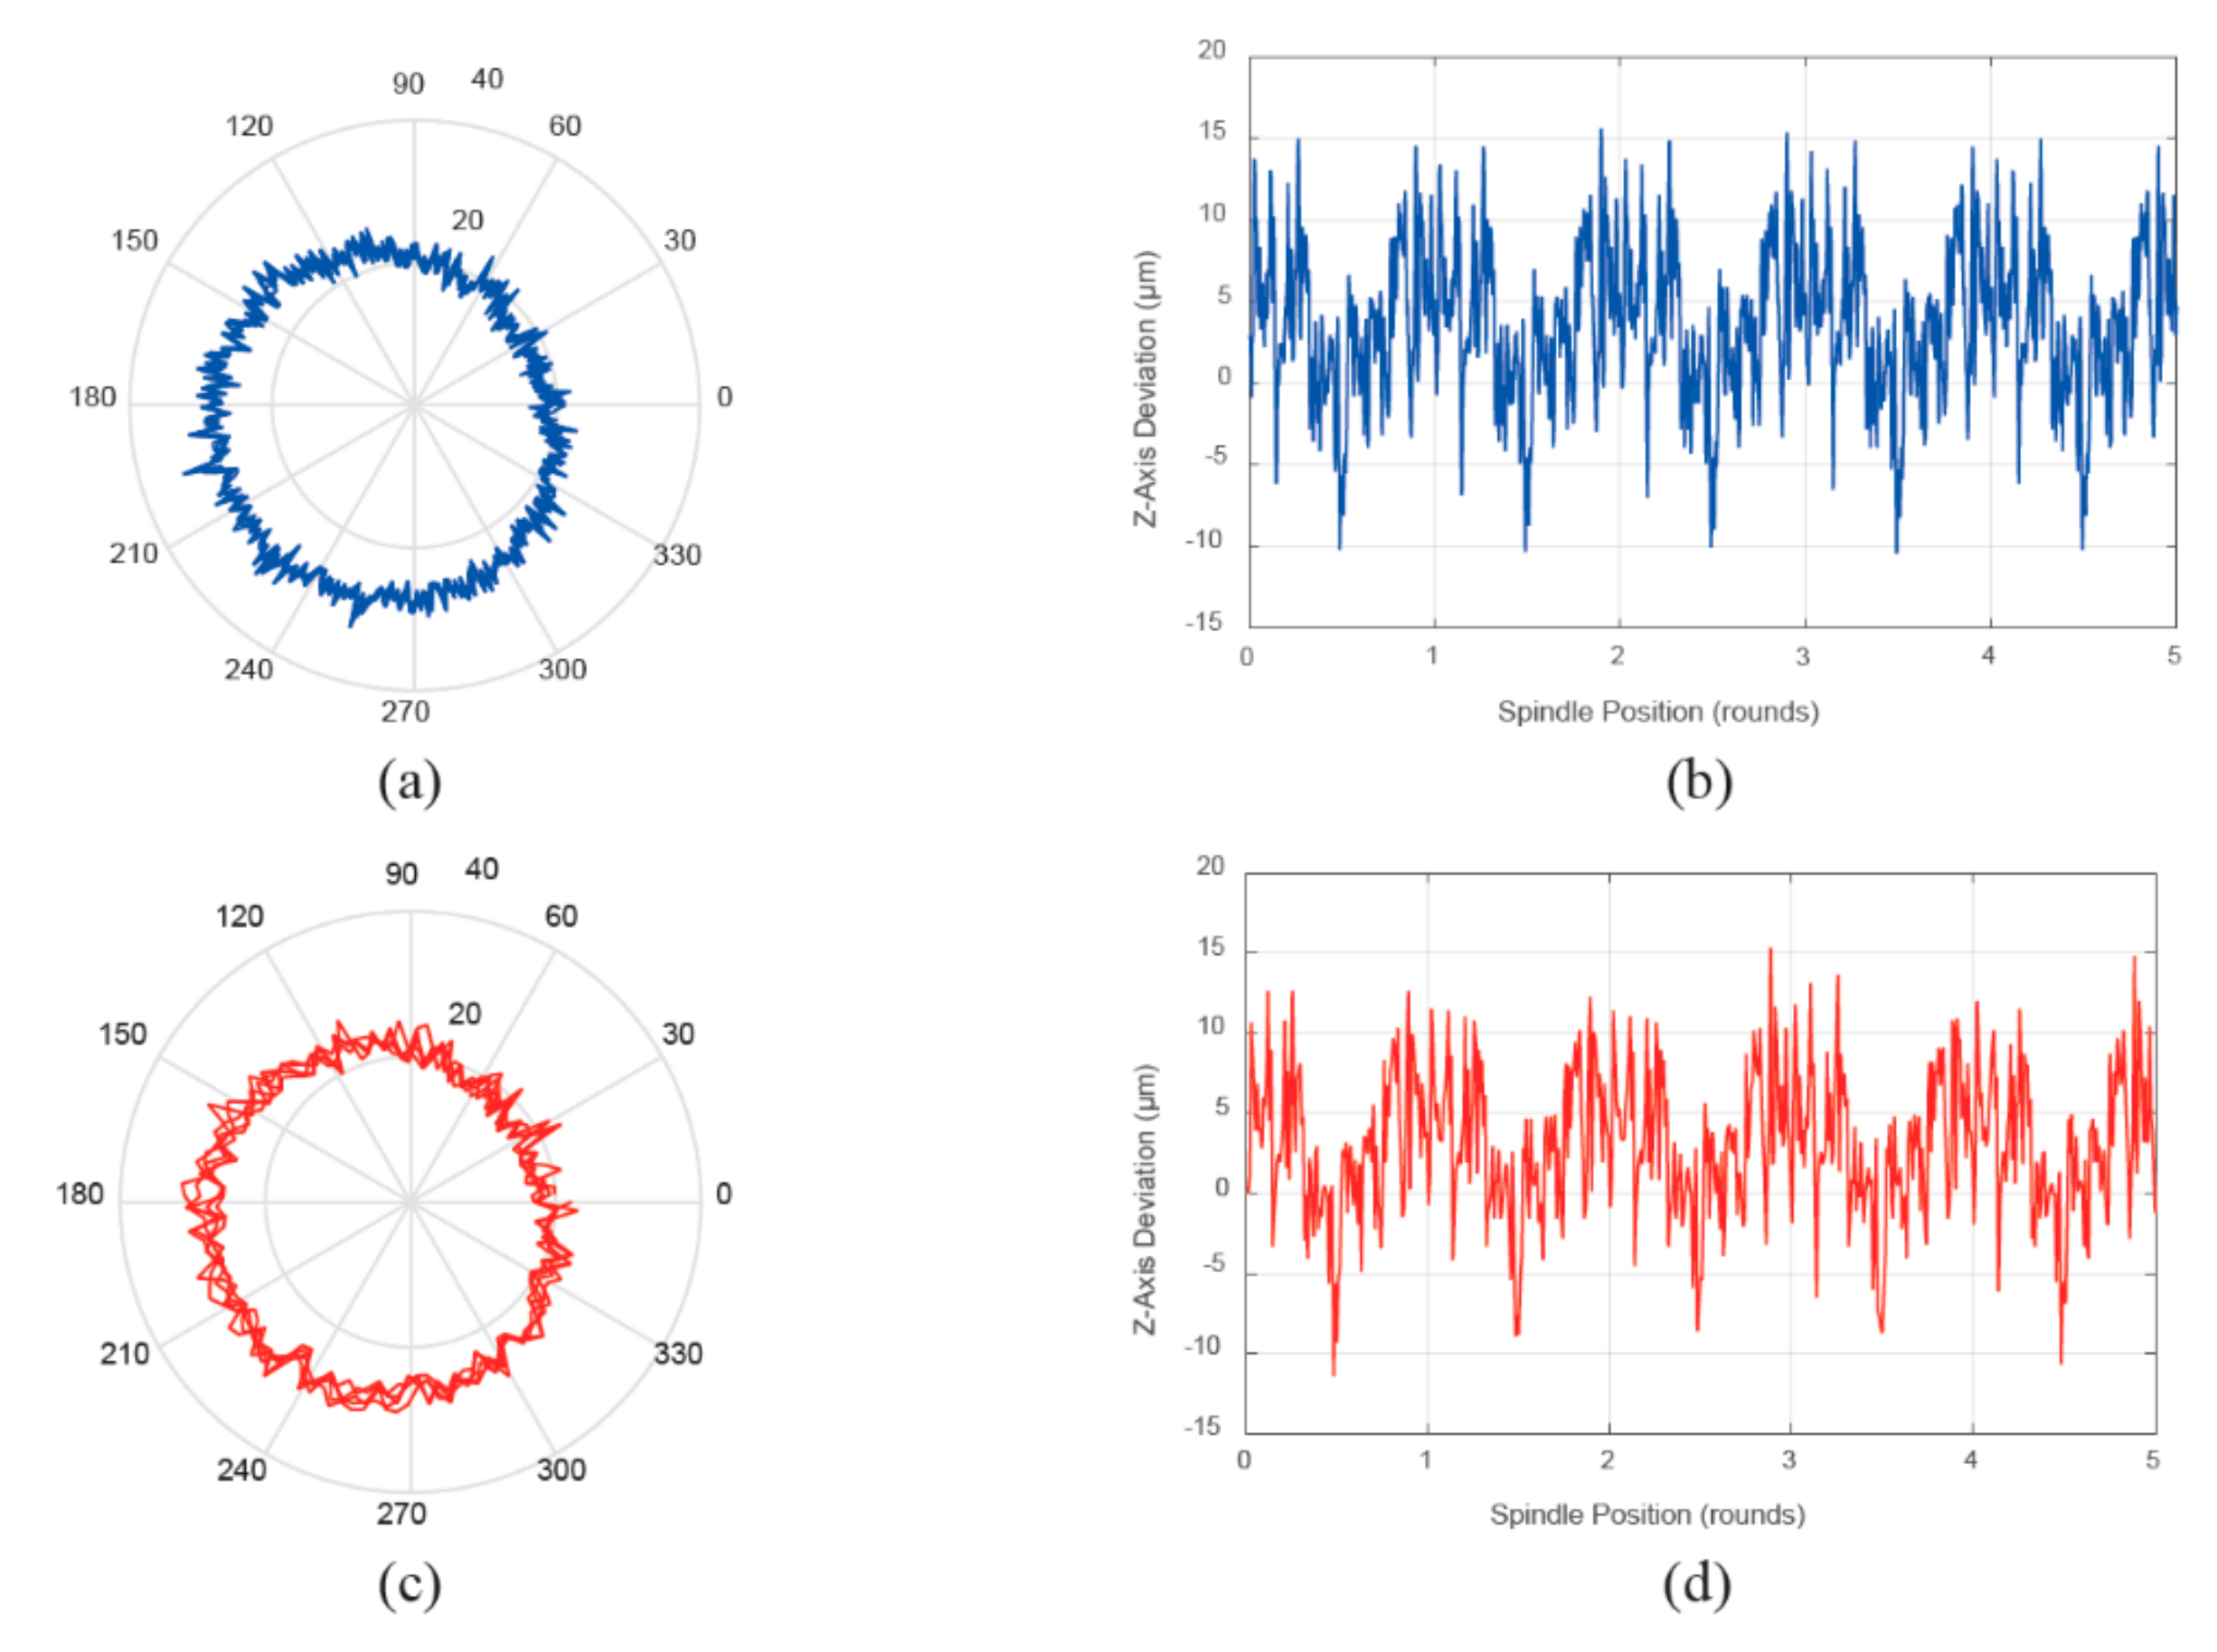
The results obtained as a result of the measurements (
Figure 42) were considered to be satisfactorily accurate and repeatable—especially in light of the relatively low financial outlays incurred for the construction of the test stand. According to the authors, the proposed methodology is suitable for wider use and the quality of the results can be improved by using better components in the measurement path.
5.4. Correlation of Spindle Errors and Workpiece Accuracy
Another method of measuring spindle errors during machining is described in [
34]. The measurement is similar to the traditional method. A disk attached to the tool holder was used as the target.
The concept of using the disk as a target waws previously developed and tested [
35]. The sensors are arranged differently than in the case of standard sets. In addition to the two sensors measuring the cylindrical surface, there are three flat sensors measuring the face of the disk.
As the authors wanted to measure movements in all five undesirable directions, five capacitive sensors (provided by Lion Precision) were used in the study. The sensors were attached to the headstock face, designing a special mounting plate. The system was checked by comparing the measurement results collected from the system during the rotation of an unloaded spindle with the results made with the SEA kit from Lion Precision. The results were assessed as reliable.
Subsequent measurements were to be made during machining, however, no description of further works by the authors was found in the literature.
5.5. Spindle Error Movement Measurements Taken during Machining
5.5.1. Measurements with Precise Displacement Sensors
The proposed method, using precise displacement sensors installed close to the front spindle bearing, allows for monitoring the effect of cutting forces on the spindle error movement. Knowing the amount of error movement, it can be compensated, which increases the accuracy of the workpiece. As described in the article of [
36], the sensors are arranged in the X and Y directions and measure small spindle movements caused by cutting forces.
The authors used cheap and small displacement sensors and built them into the headstock of the machine tool.
The measuring system was calibrated by entering information about the influence of the cutting force on the displacement value. However, the sensors measured not only the displacement value caused by cutting forces but also the value of the spindle error movement in the radial direction and the circularity error of the spindle’s cylindrical surface. All these errors affect the accuracy of the workpiece. Knowing the values of spindle error movements allows for their compensation. According to the authors, the system and the proposed algorithms can be implemented in adaptive control systems.
The article presents the data of the measuring station and the conditions for taking measurements. During machining, a shift of the measured profile and its return to the initial position after the completion of machining were observed.
The sensor measures not only the value of the gap between the face of the sensor and the cylindrical surface of the spindle but also the value of displacement caused by spindle error movements in the radial direction and spindle circularity errors. Their values are visible while the tool is not in contact with the material. In the proposed method, the signal value obtained when the tool is not machining is subtracted from the signal value obtained during machining.
In this work, the authors described the method of calculating the value of the signal that will be subtracted to determine the value of the cutting force.
The proposed formulas are correct as evidenced by the comparison of the calculated value of the cutting force with the control measurement made with a dynamometer.
5.5.2. Determination of Error Movement of the End Mill
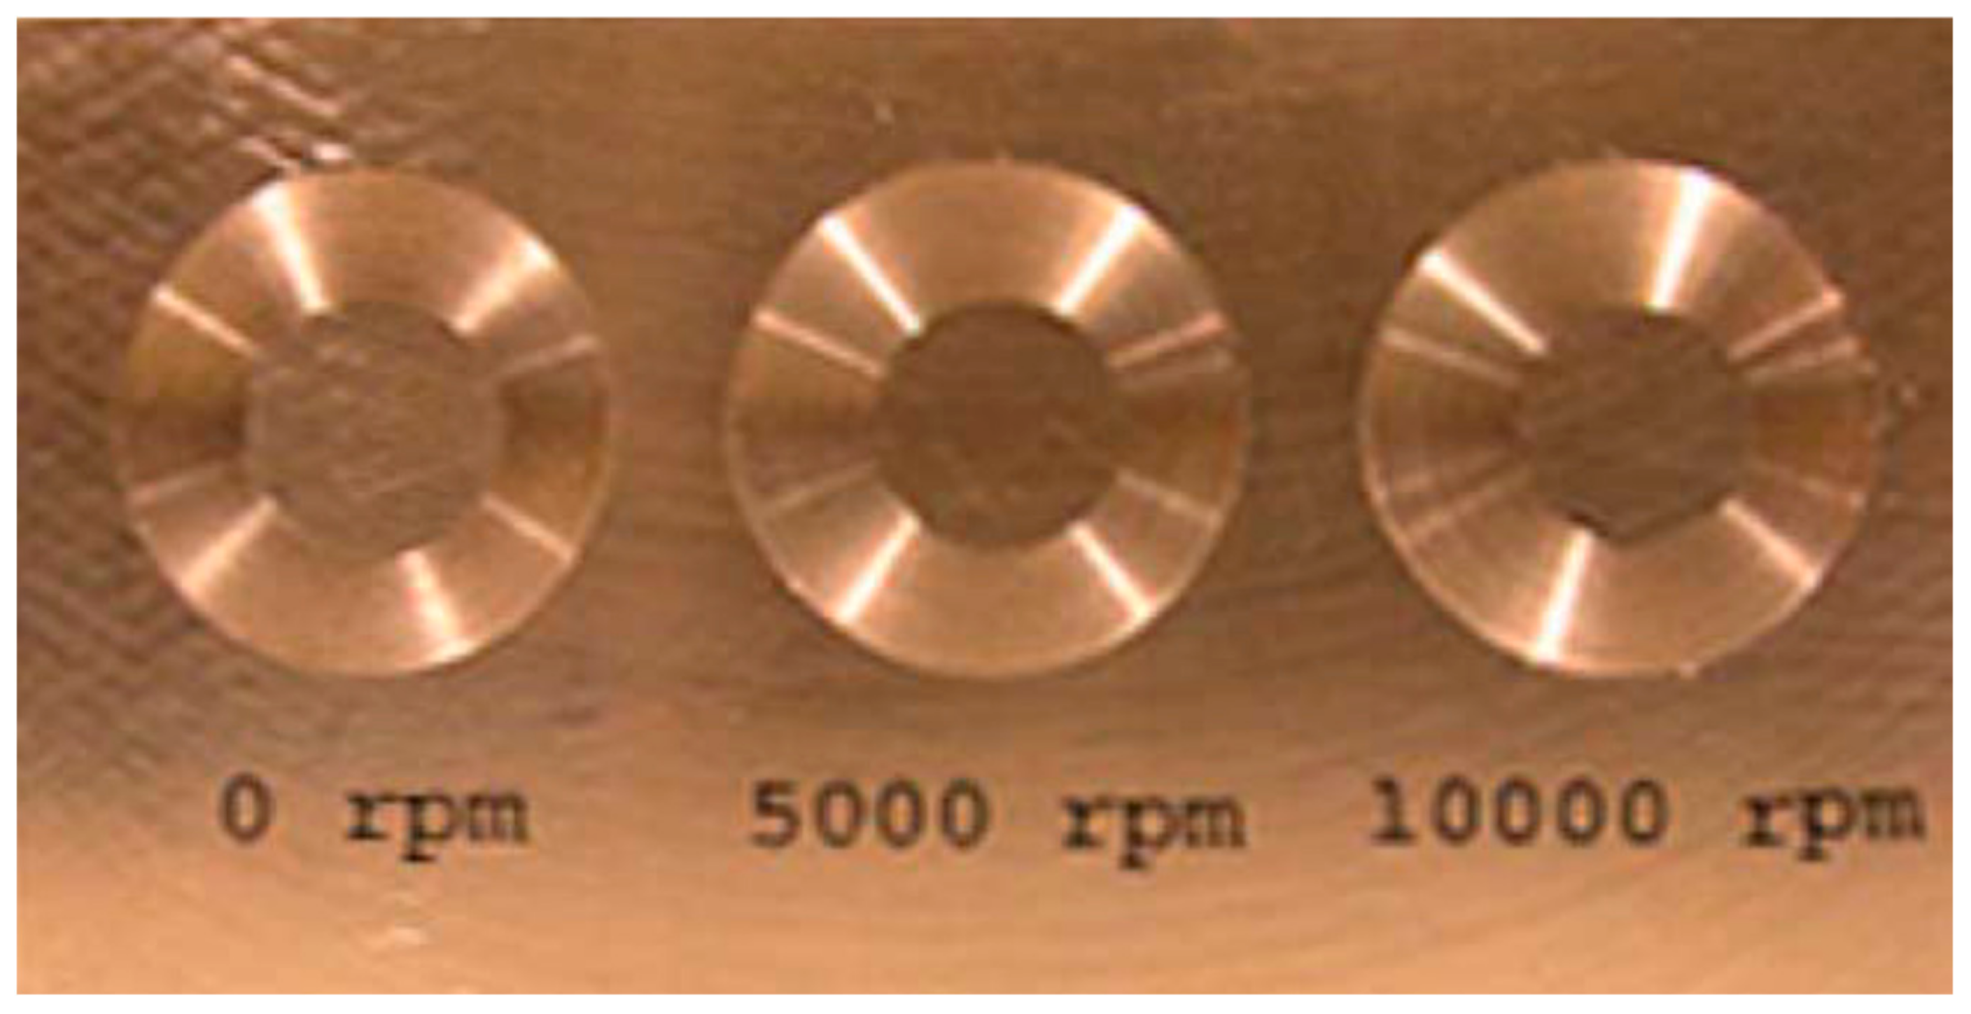
The method can be used at high spindle speeds. Contrary to the methods that use the pattern (target and sphere) to determine error movements at low rotational speeds, in the case of high spindle speeds, the tool, its mass, misalignment, and unbalance affect the size of error movement. The article of [
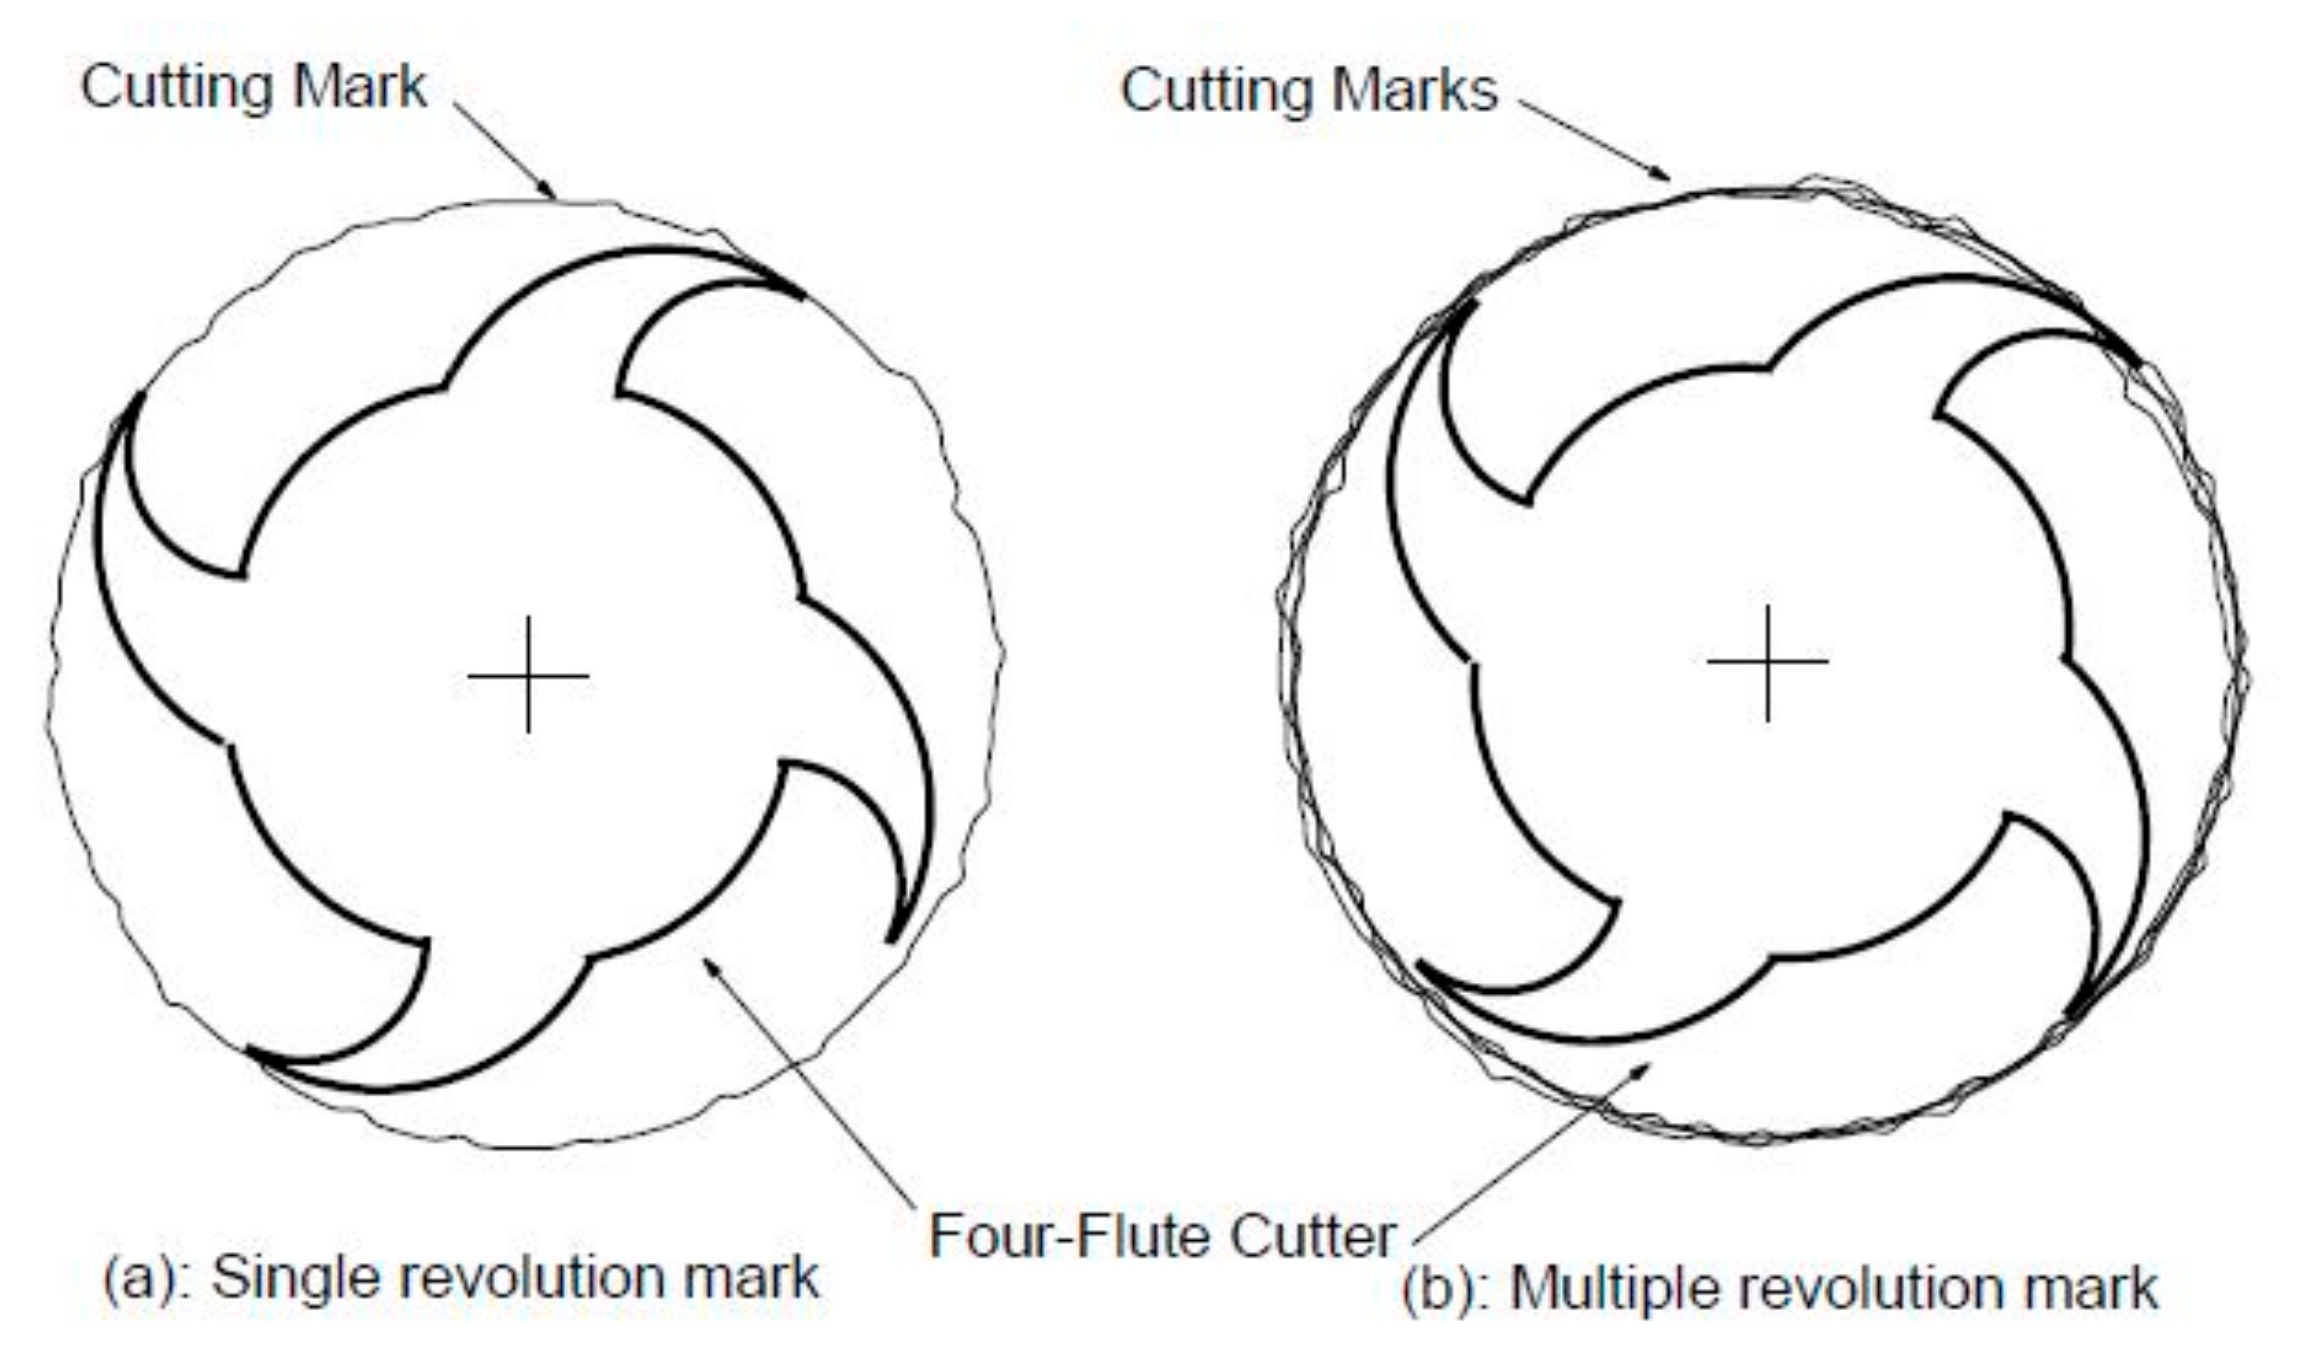
37] describes a practical method of measuring error movement for the spindle in the radial direction of the end mill at high rotational speeds, without the need to use a ball standard. This method is based on measuring the size of the machining marks left by the face of the end mill. The rotating cutter blades leave circular marks, and their diameter is associated with errors in the movement of the spindle/tool system. As shown in
Figure 43, the tip of the cutting blade forms a path on the workpiece.
Figure 43a shows a ¼ revolution of the cutter and
Figure 43b shows multiple revolutions.
In this method, the depth of cut is small (e.g., 0.012 mm) so that the cutting forces are small and the tool remains sharp. Marks left by the tool at different rotational speeds are shown in
Figure 44.
The authors prove that the marks left at different rotational speeds contain information about the radial error of the spindle/tool system for a given rotational speed. The conducted research proves that the measurements carried out with this method have the required accuracy, repeatability, and resolution. The proposed measurement and calculation technique can be used to determine the influence of the spindle’s rotational speed, the level of mass unbalance, and the spindle stiffness on the value of the error movement in the radial direction. However, the authors admit that the proposed method of measuring the machining marks cannot replace the conventional polar plot method because there is no information related to the angular position of the spindle and the time. It is recommended to perform both tests, e.g., with the Lion Precision set and the tool mark measurement, as it gives a better picture of the behaviour of the tool/spindle system at high rotational speeds.
5.6. Measurements Using the Master Axis Method
Measurement of error movements using the master axis method was proposed and described in [
38]. This method is considered more advanced than traditional methods. The advantage of this method is the measurement of error movements under both static and dynamic load.
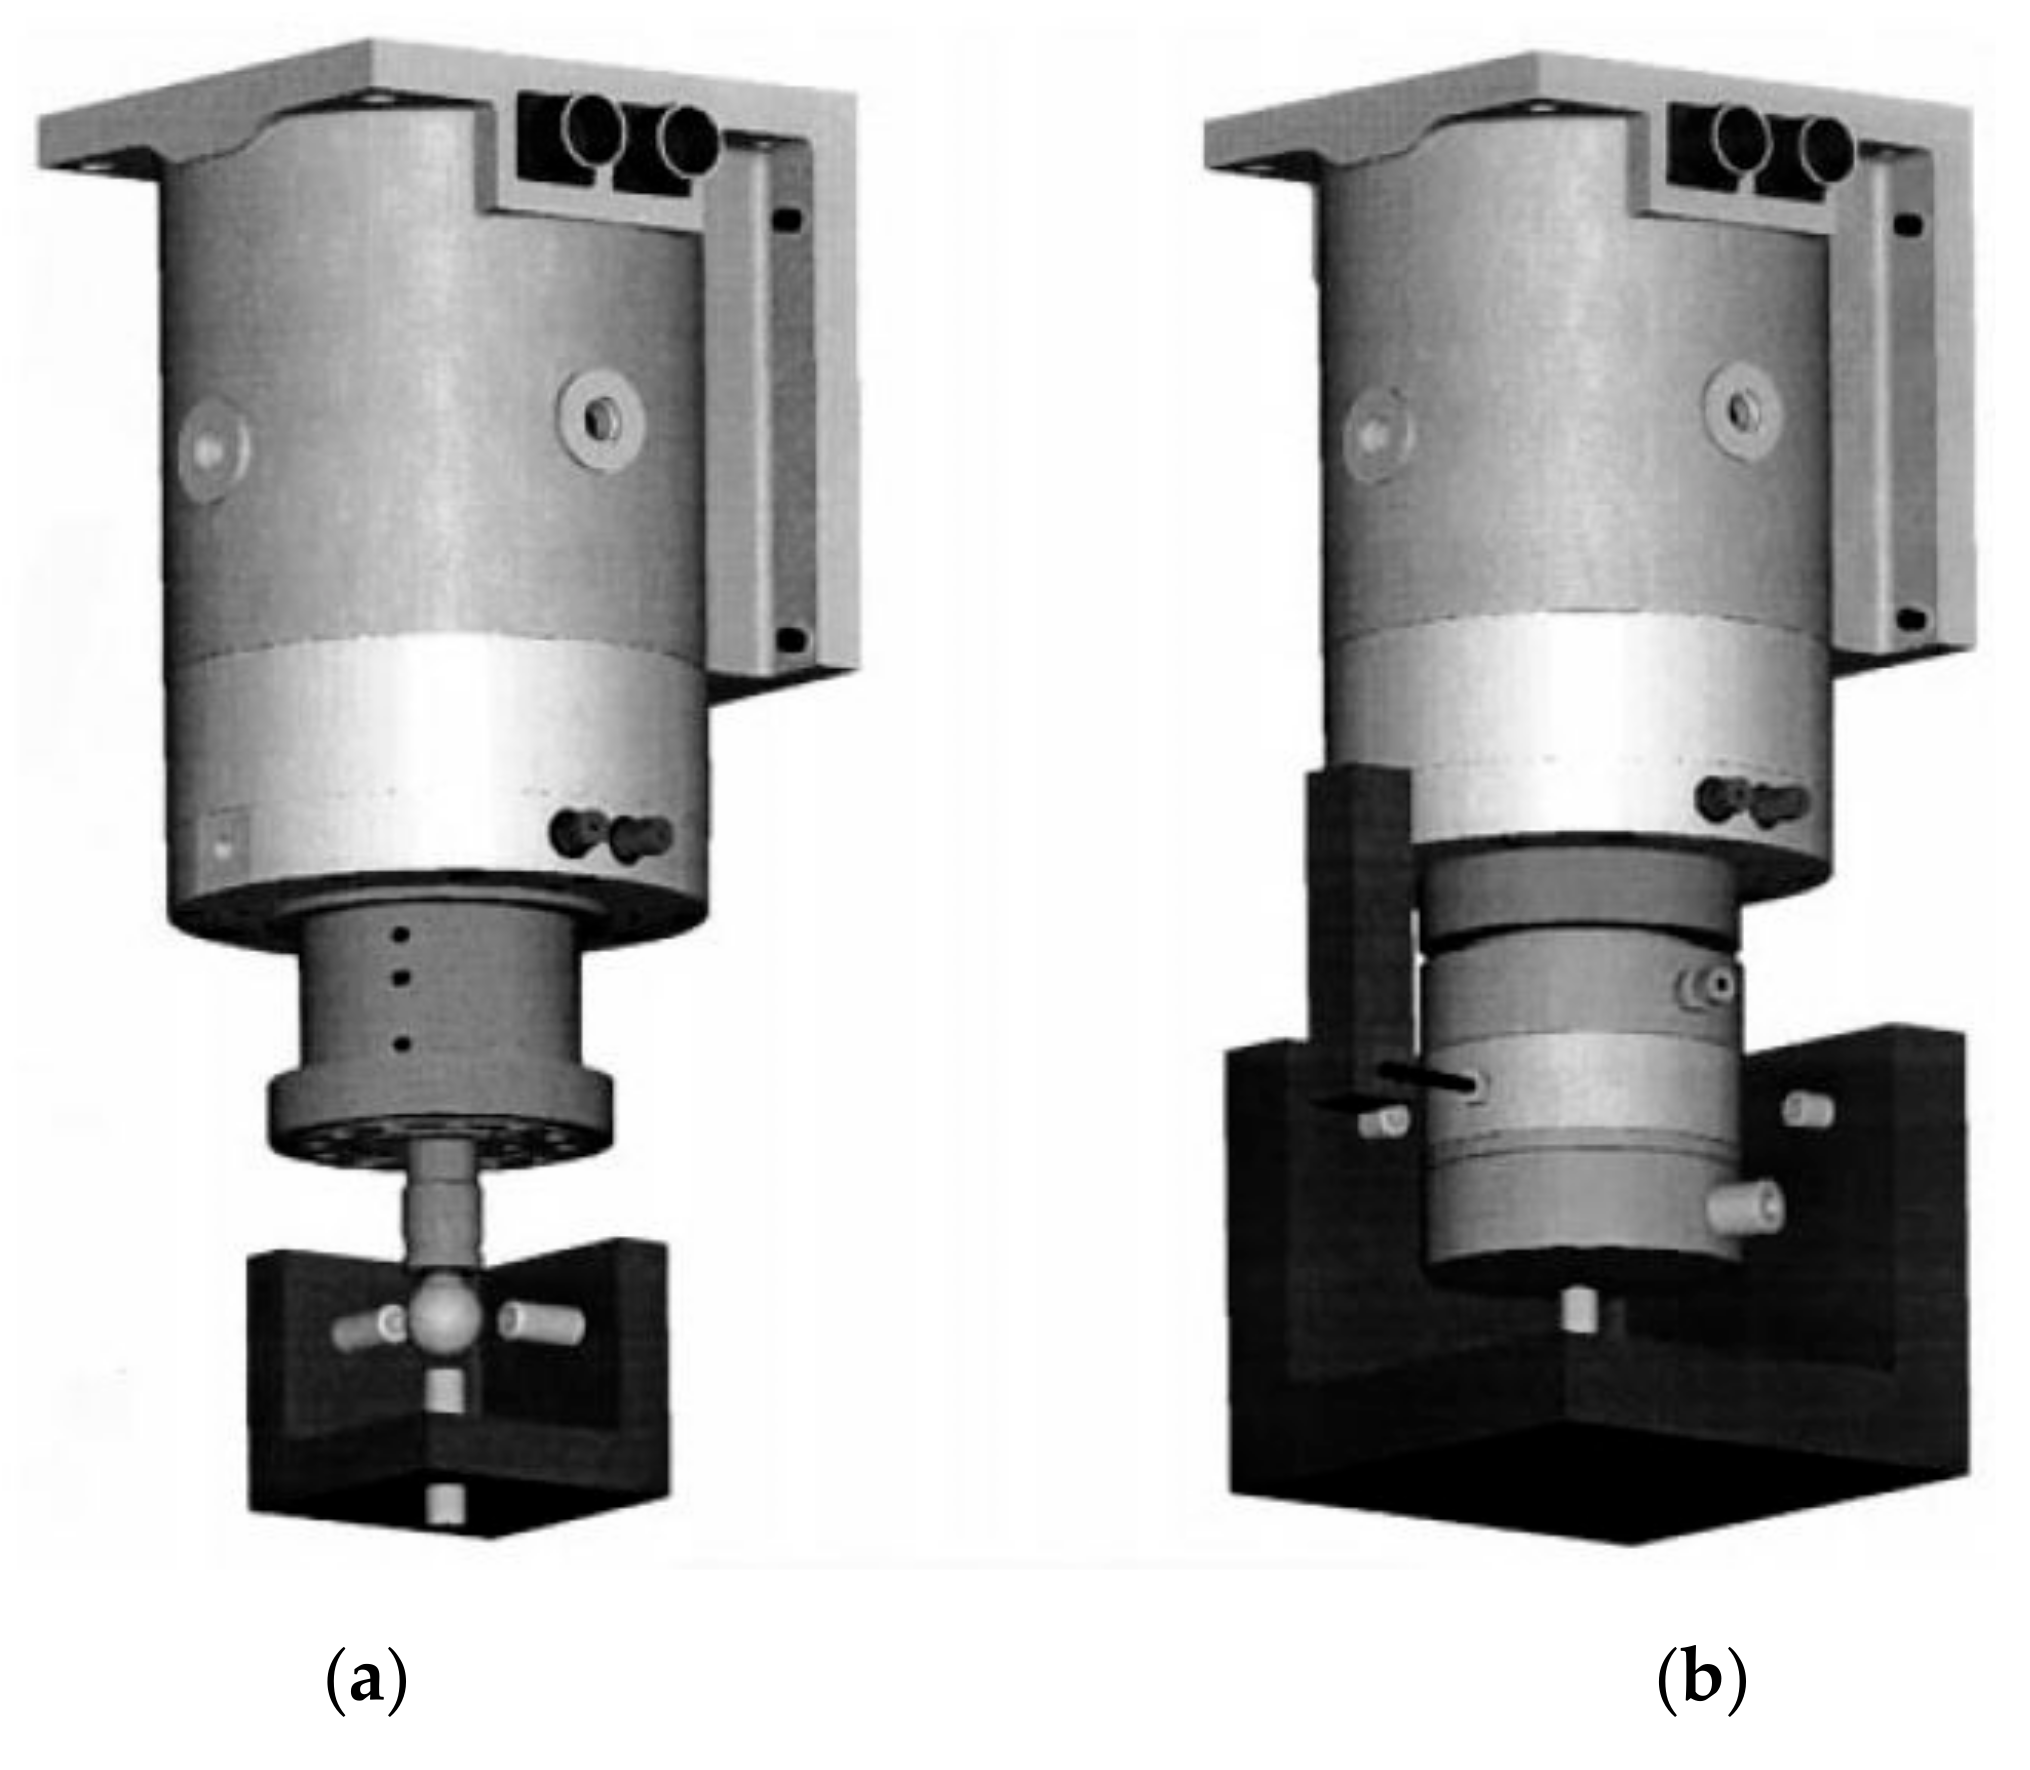
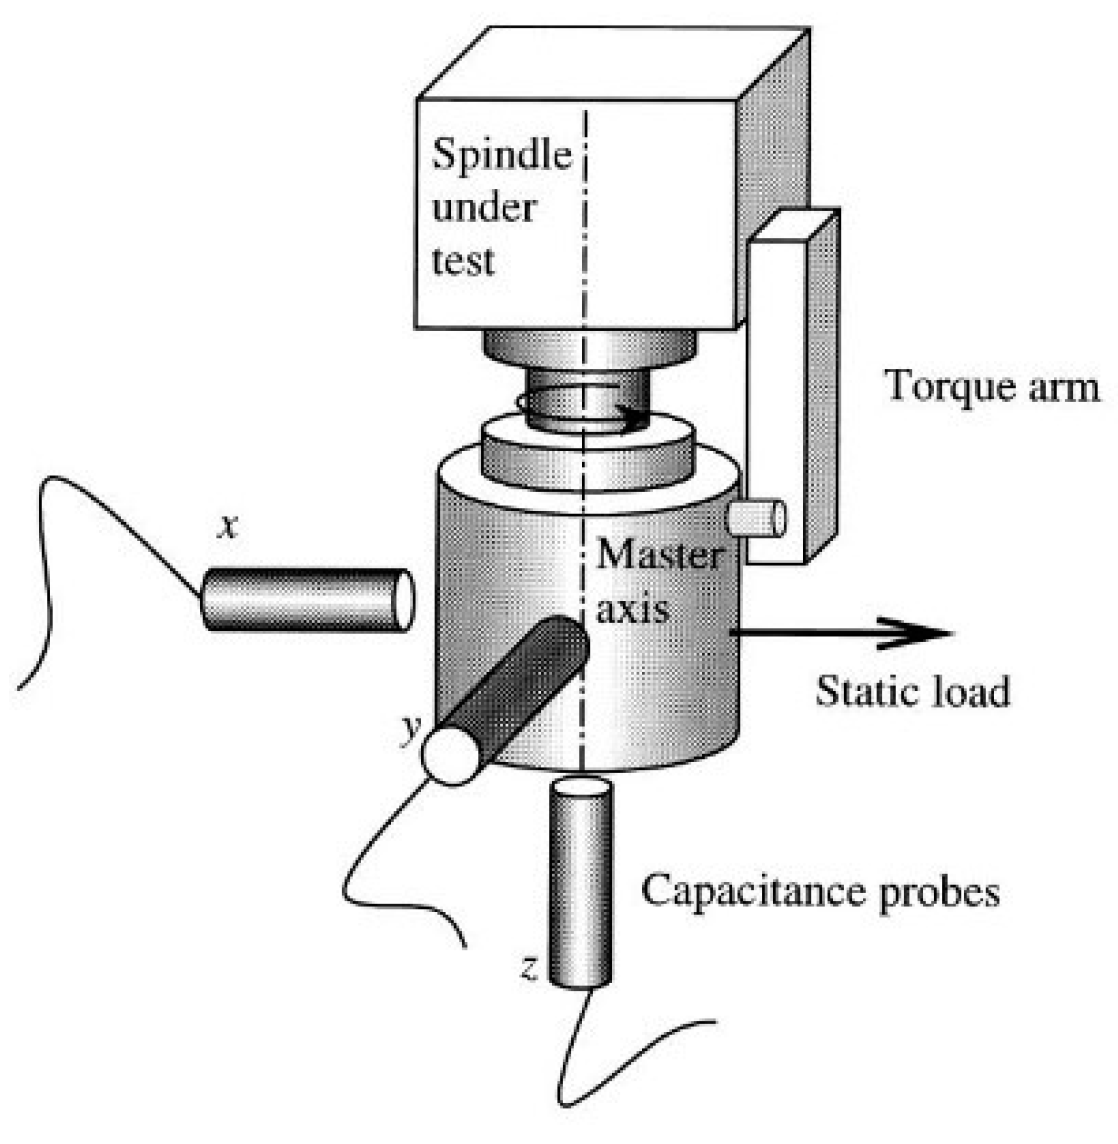
As shown in
Figure 45, this method uses a master axis in place of the ball standard.
The master axis, on aerodynamic bearings, is mounted directly in the machine tool spindle–
Figure 46. The master axis body is locked to prevent it from turning using a high stiffness master axis with low radial error.
The main study aim was to determine the radial error movement as a function of speed and load (
Figure 47).
The results of the tests carried out confirmed that the tests with the use of the master axis can be used in the measurement of spindle movements. They give a lower measurement uncertainty compared to traditional methods (standards). They are closer to the actual machining conditions thanks to the possibility of applying a load on the main spindle.
5.7. Measurement Only in the Plane Perpendicular to the Axis
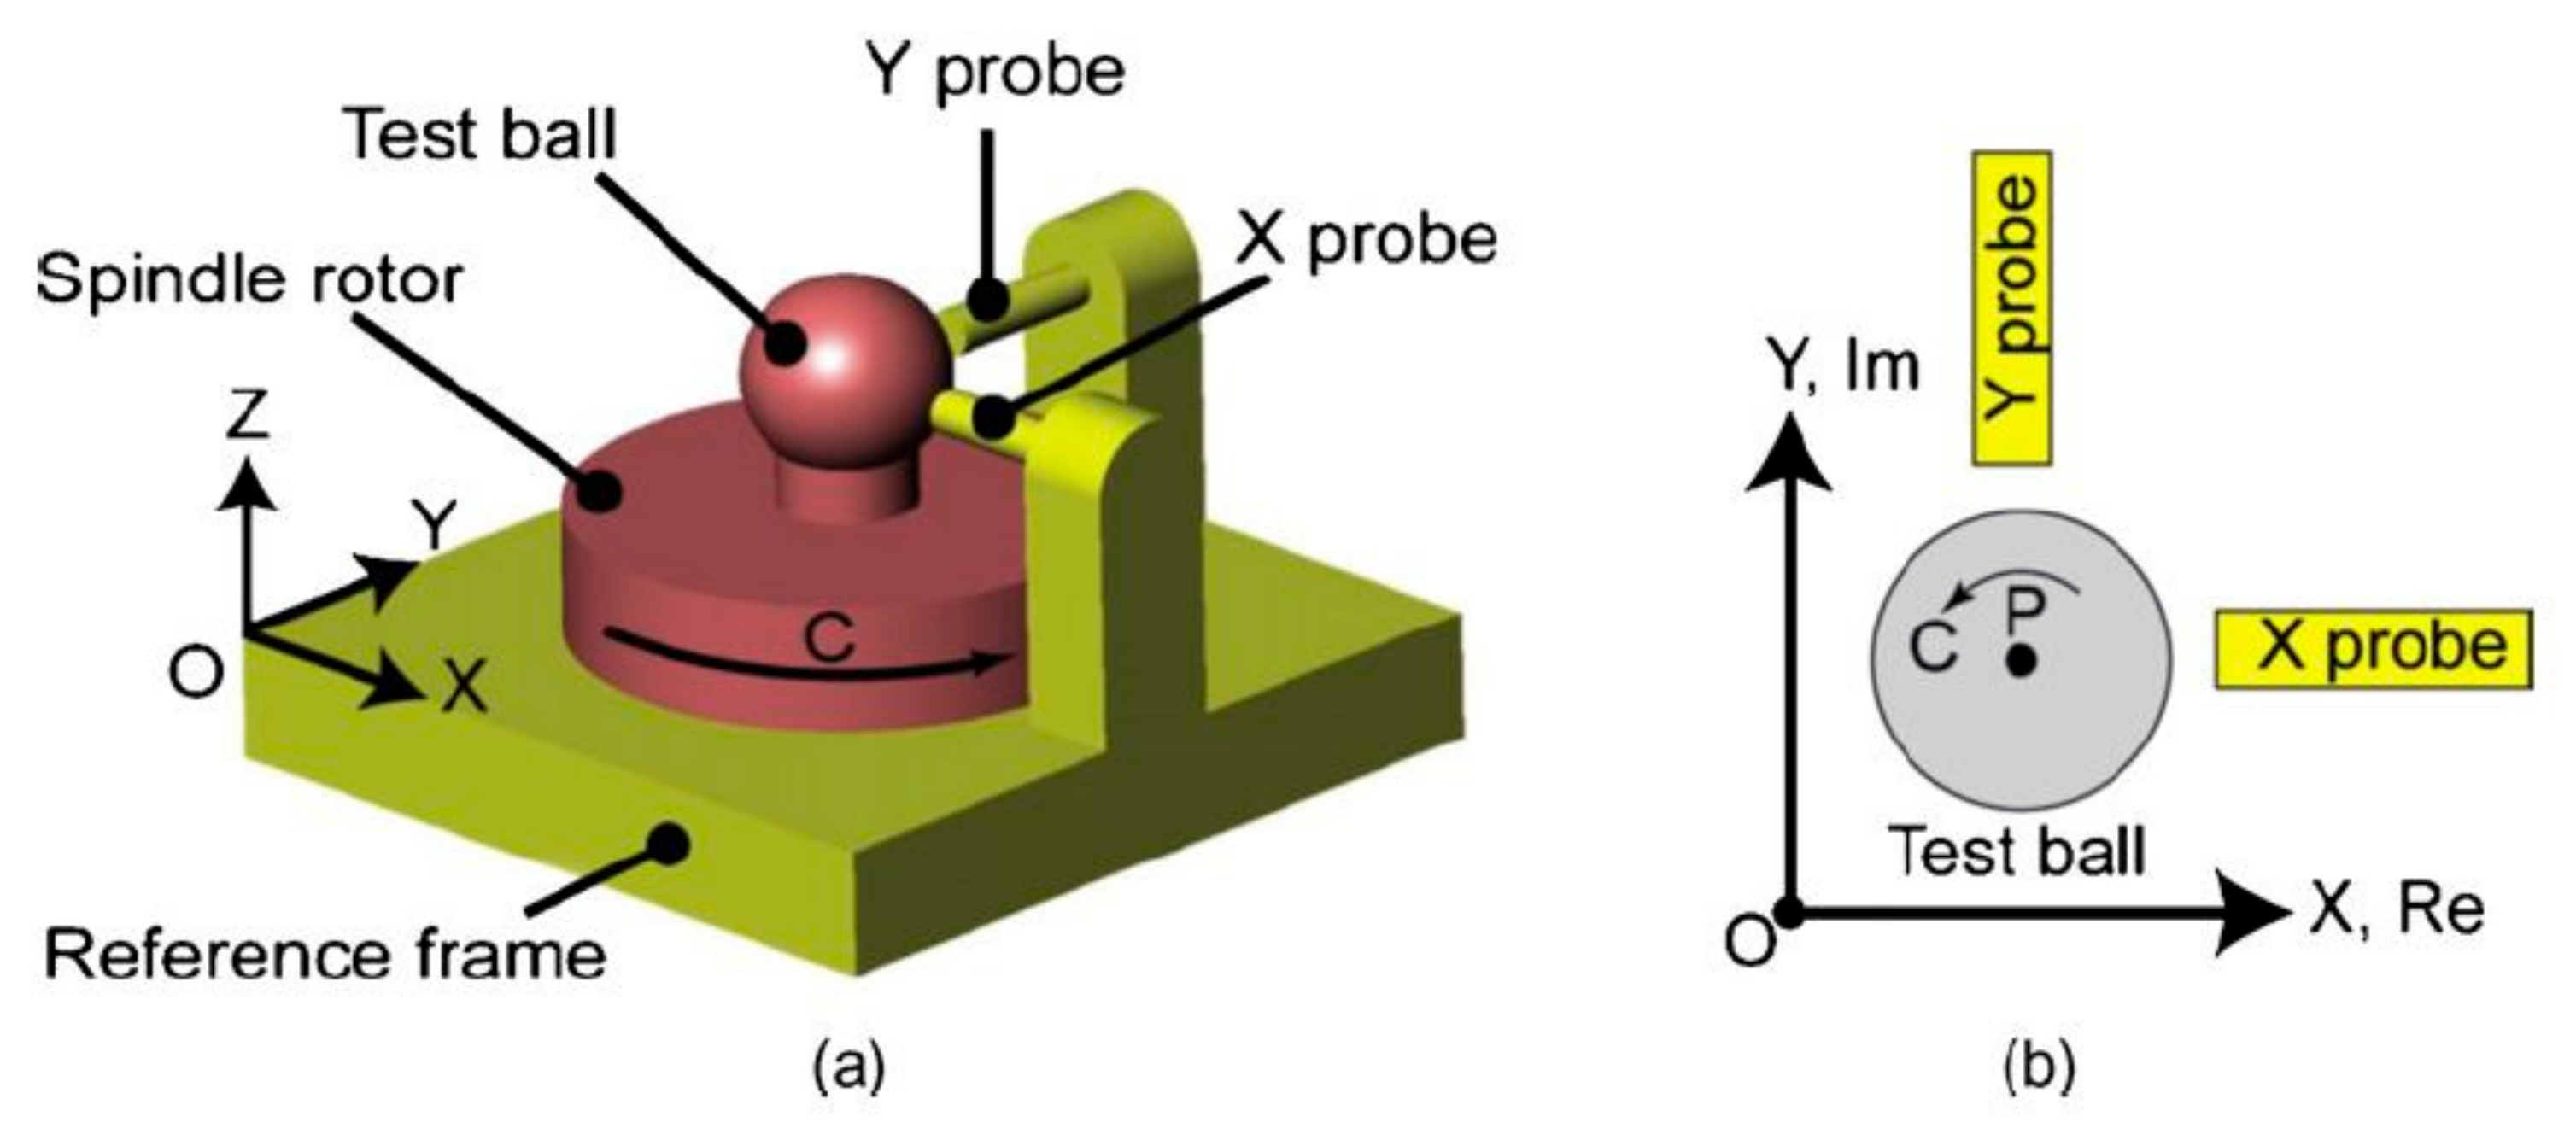
In a two-part study [
39,
40], the authors carried out a comprehensive analysis of issues related to the methods determining the error movement of the spindle in the radial direction (
Figure 48).
A novelty is the statement that, after eliminating the errors of circularity of the reference element (ball) from the data of taken measurements, movement of the centre of the sphere in the X-Y plane can be represented by a complex number dependent on rotation in the complex plane:
where
xp(
C)
i jyp(
C) are the motions of the point P in the X and Y directions, respectively, and
j is an imaginary unit.
As shown in
Figure 48b, the X axis is assigned to the real value (Re) of the complex plane and the Y axis is assigned to its imaginary part. Further, by operating on complex numbers, the authors break down motion in the
vp(
C) plane similarly to the standard for synchronous and asynchronous movements.
Then, by creating a numerical model of the spindle, they introduce the concepts of the axis of rotation and the axis average line (AVL) [
39] (
Figure 49).
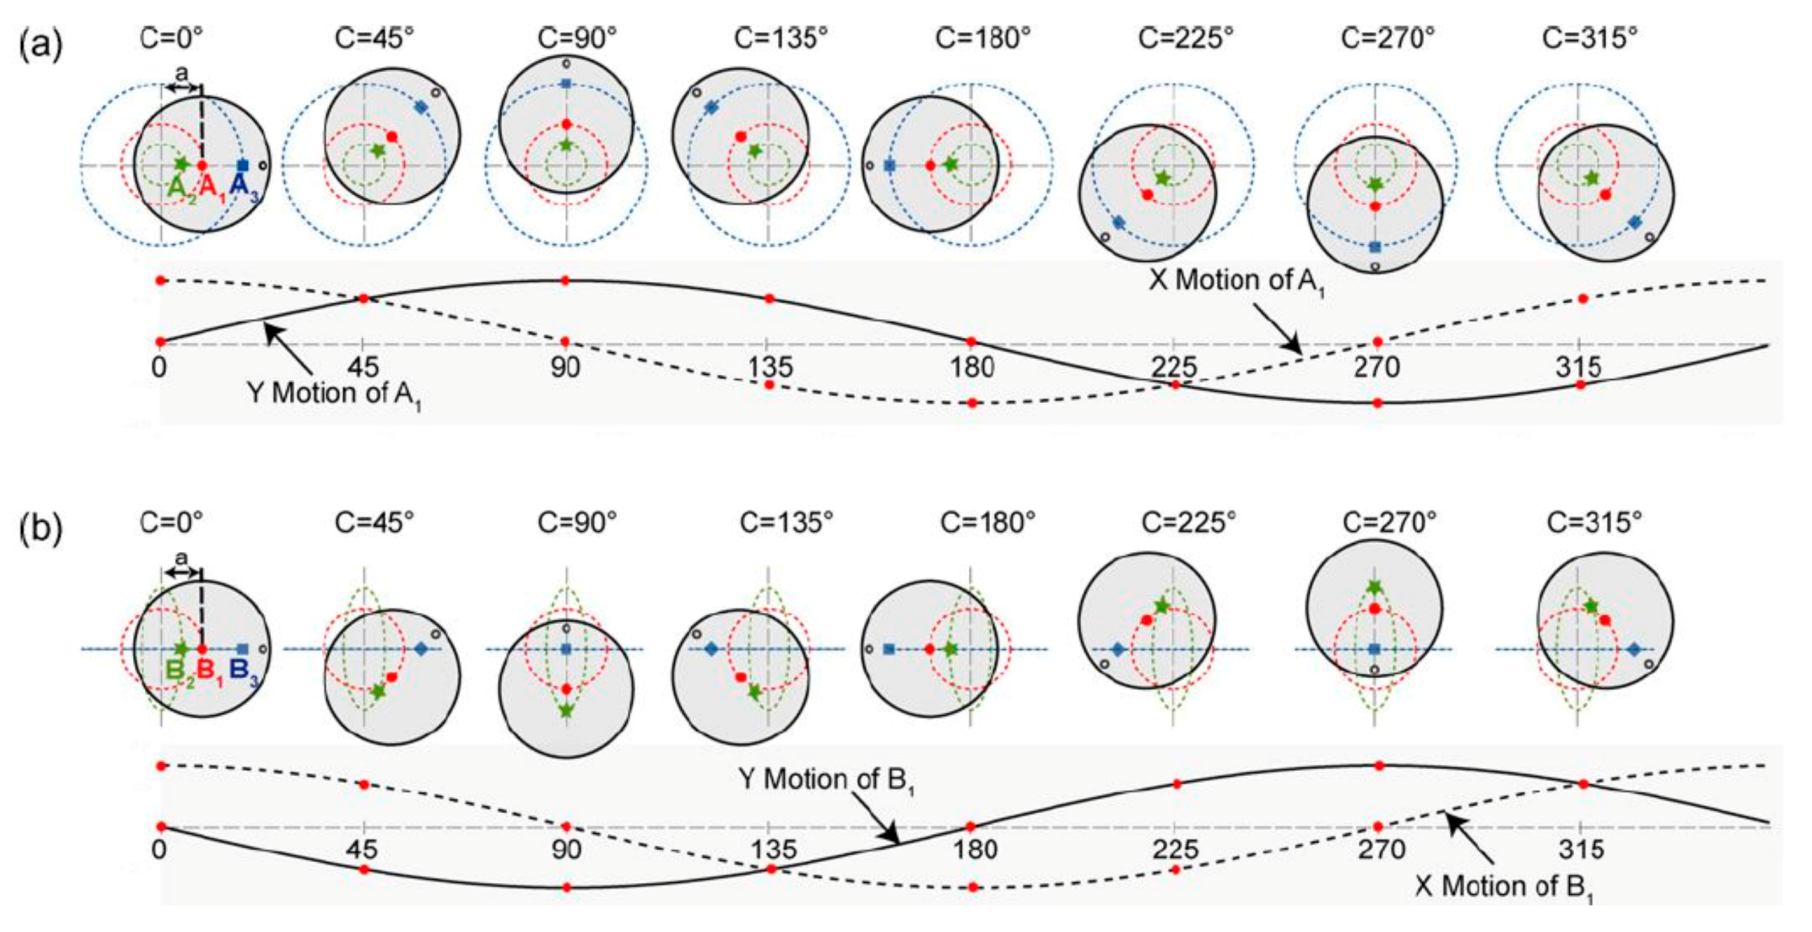
At a selected axial position (e.g., on the top surface of the spindle), as shown in
Figure 49, the spindle is represented by the outer surface contour, the axis of rotation by the center of rotation R
1, and AVL by the mean point A
1.Accordingly, in the plane, we distinguish that the centre of rotation R1 is the point of rotation of the spindle cross-section and that the centre of rotation of R1 moves around the static point A1. Thus, the radial error in the plane is the vector between points A1 and R1. After the above, from the positions of the rotation centres in two axial sections, e.g., R1 and R2, the tilt error can be calculated.
Figure 50a shows the trajectory of the three points of a perfect spindle during one complete revolution. You can see that the trajectories of all points are concentric circles. The spindle’s radial error movement is always 0, regardless of the eccentricity of the mounted ball standard.
Experimental tests were also carried out for two types of spindles: a spindle with ball bearings and a spindle with aerostatic bearings.
Calculations were carried out on the basis of the formulas in part 1 of the article. The test results showed that both types of spindles having a significant radial error was dominant. However, it was noticed that the radial error movement calculated according to the applicable standards is much smaller than that calculated with the described method. The authors argue that this is the result of not taking into account the essential (basic) component of error movement in the applicable standards.
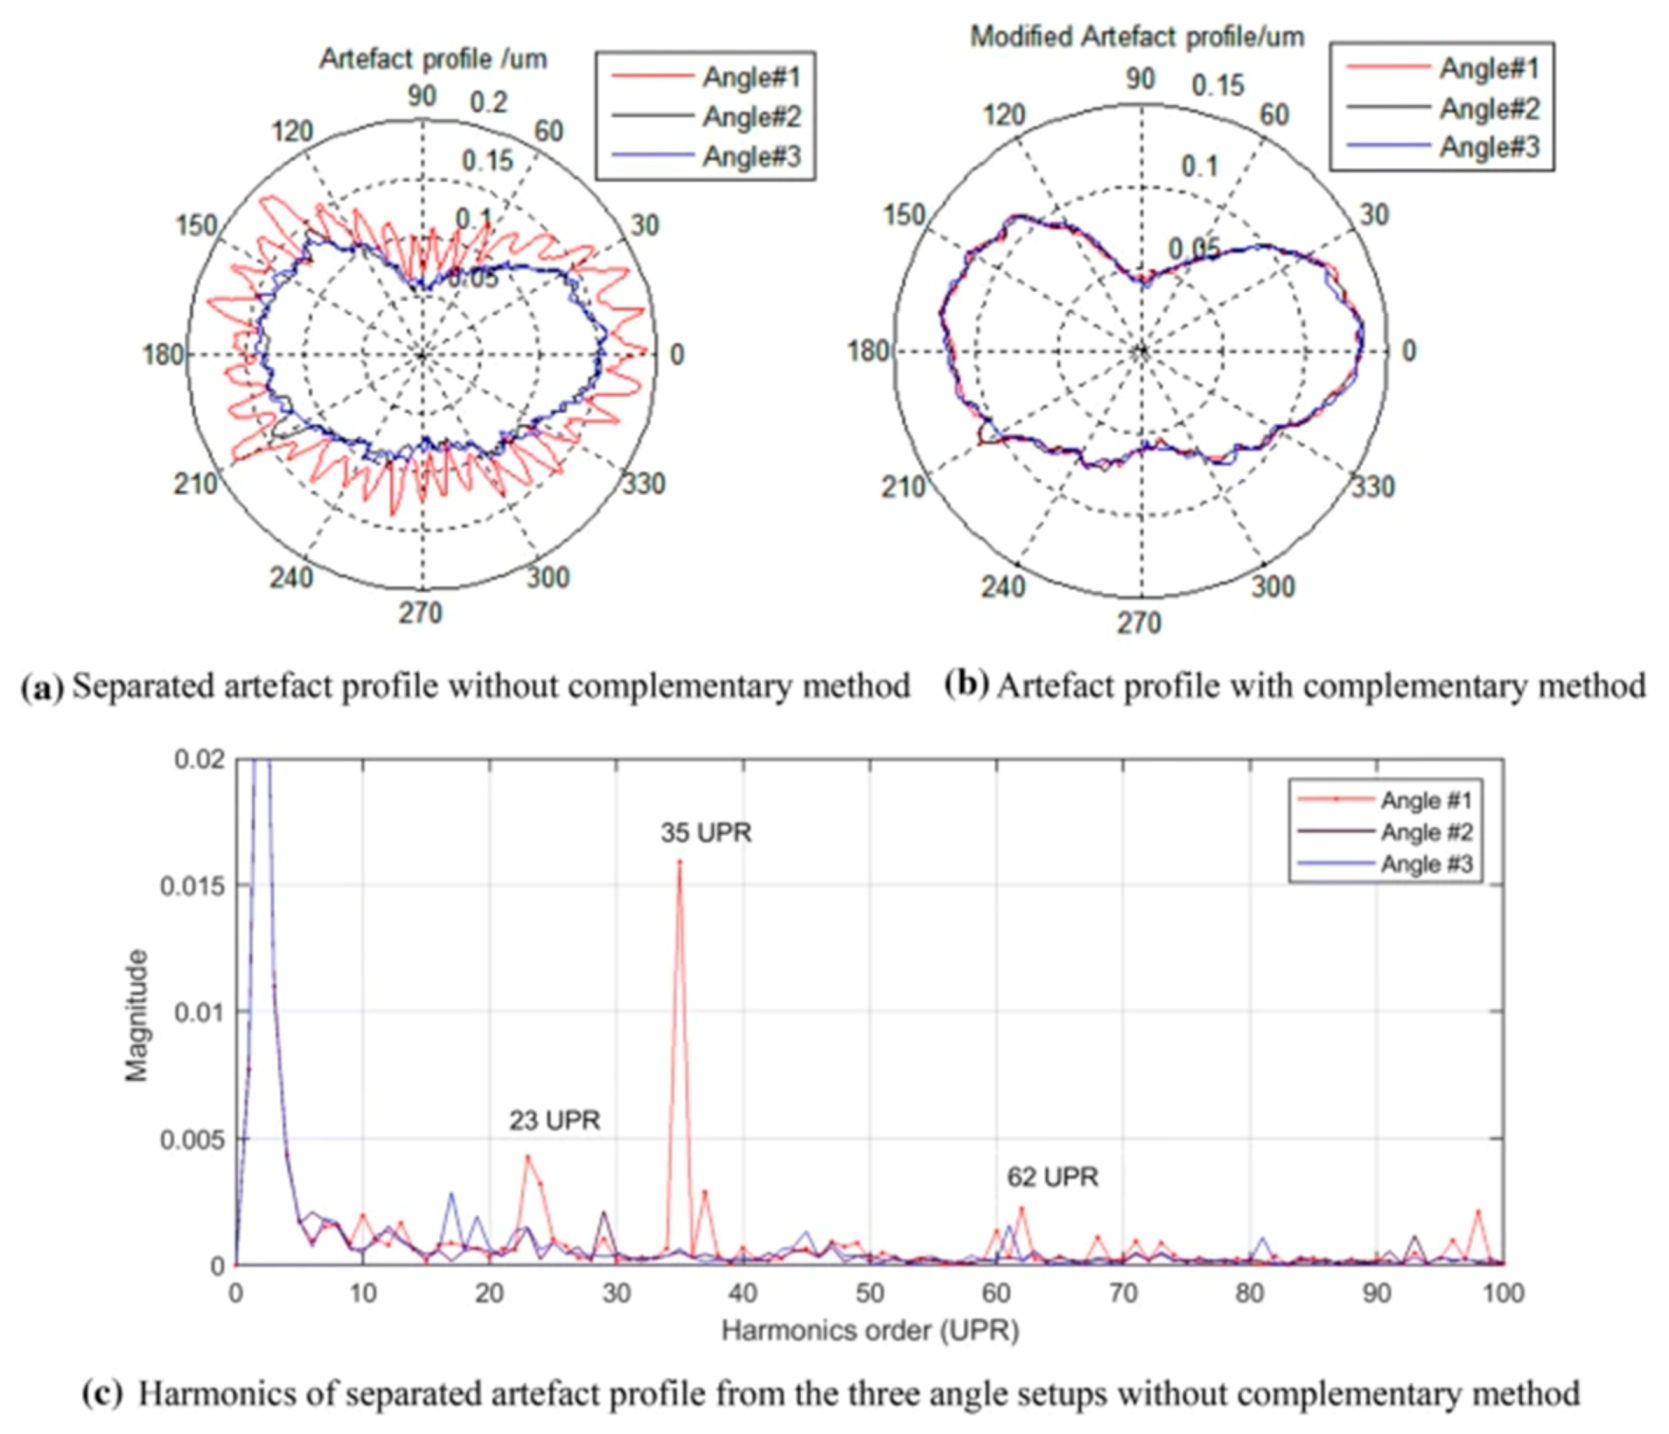
5.8. Measurement of Spindle Error Movements Using a Complementary Multi-Probe Method
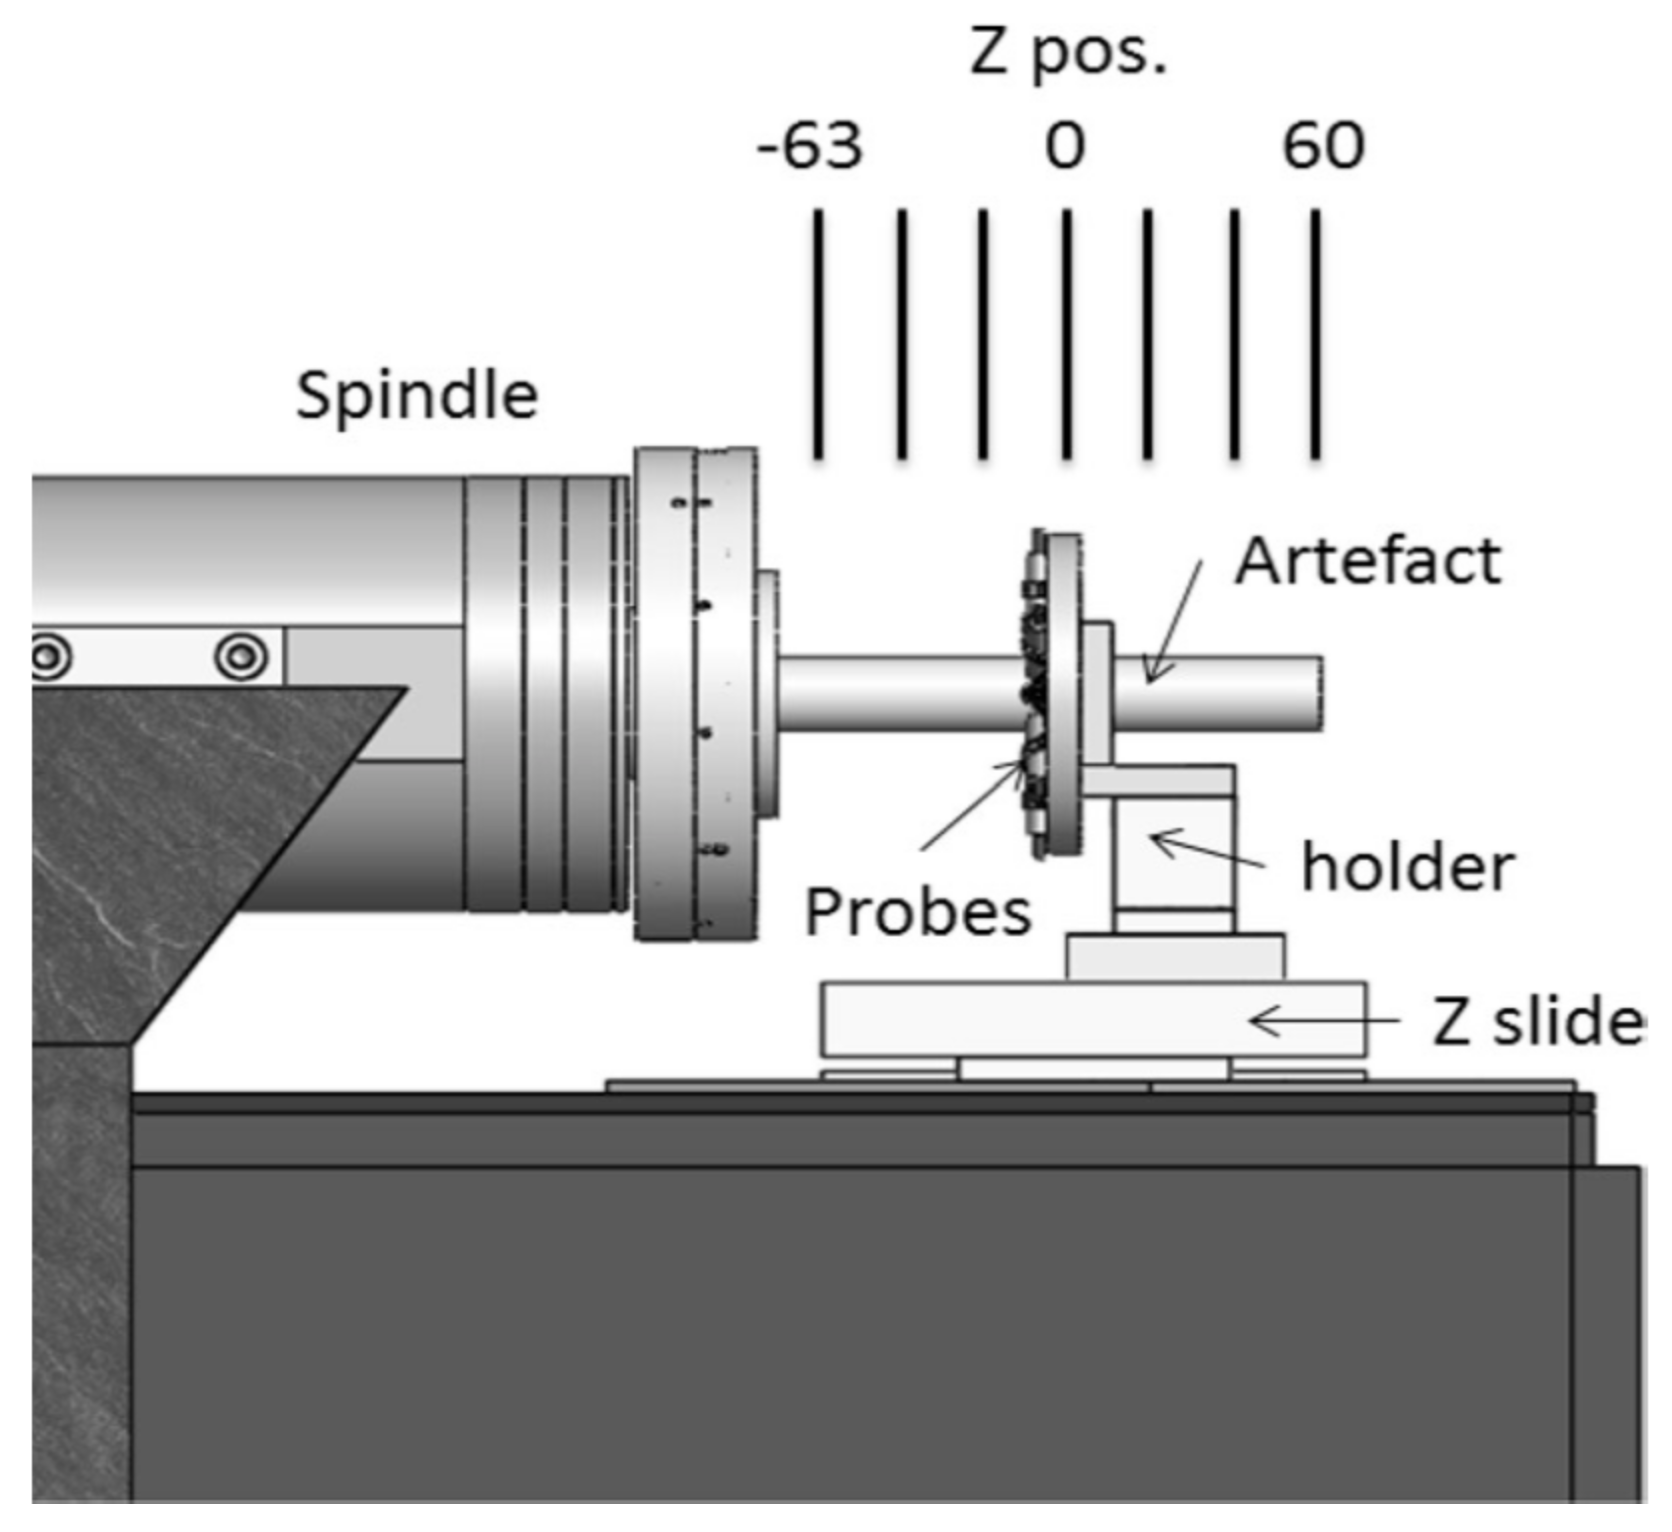
The disadvantage of the “original” multi-probe method is the need to perform measurements in two different strictly defined angular positions of the gauge plunger in relation to the spindle, which in the conditions of often limited access to the working space during measurements on a production machine tool may be a source of significant measurement errors. The work in [
41] presents the results of the tests obtained on the experimental measuring stand (
Figure 51), which, according to the authors, enables easy and precise shifts in the position of sensors between successive steps of the research procedure.
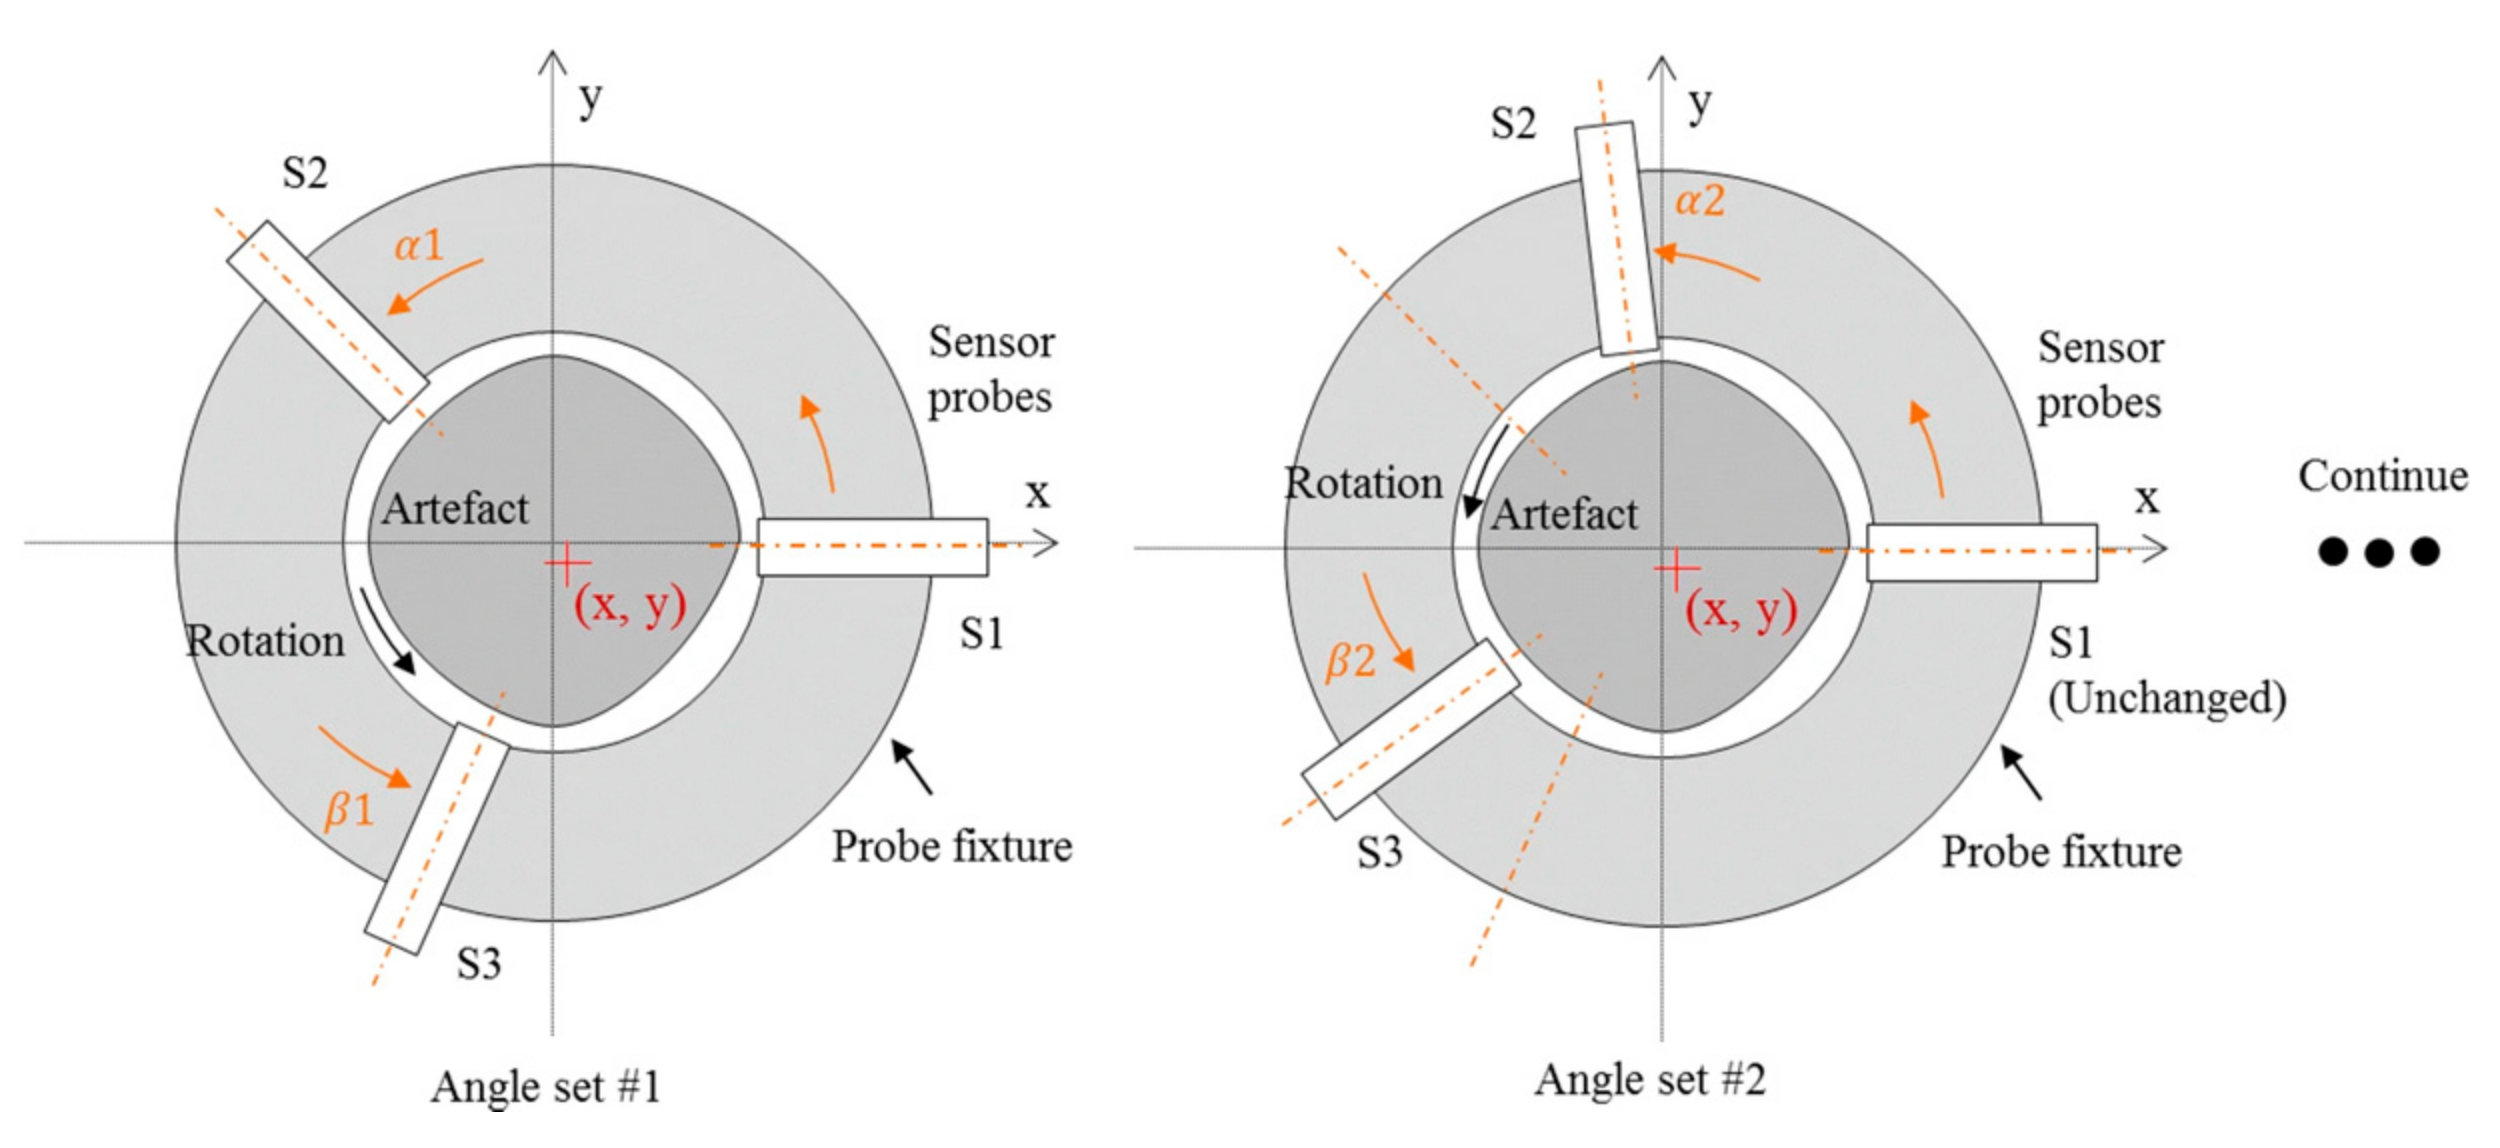
Analyses were performed to determine the optimal angular relationships between the position sensors (the layout scheme is presented in
Figure 52) depending on the stage of the study. The result of these analyses was the determination of three sets of angles α and β presented below, for which the negative influence of the harmonic component was reduced by 70%:
set of angles #1: α = 100.4000°, β = 230.0333°
set of angles #2: α = 141.0333°, β = 270.7050°
set of angles #3: α = 139.3667°, β = 239.1200°
Figure 53 shows a comparison of the data obtained with the traditional multi-probe method and the proposed complementary multi-sensor method with optimized sets of angles between the measurement sensors.
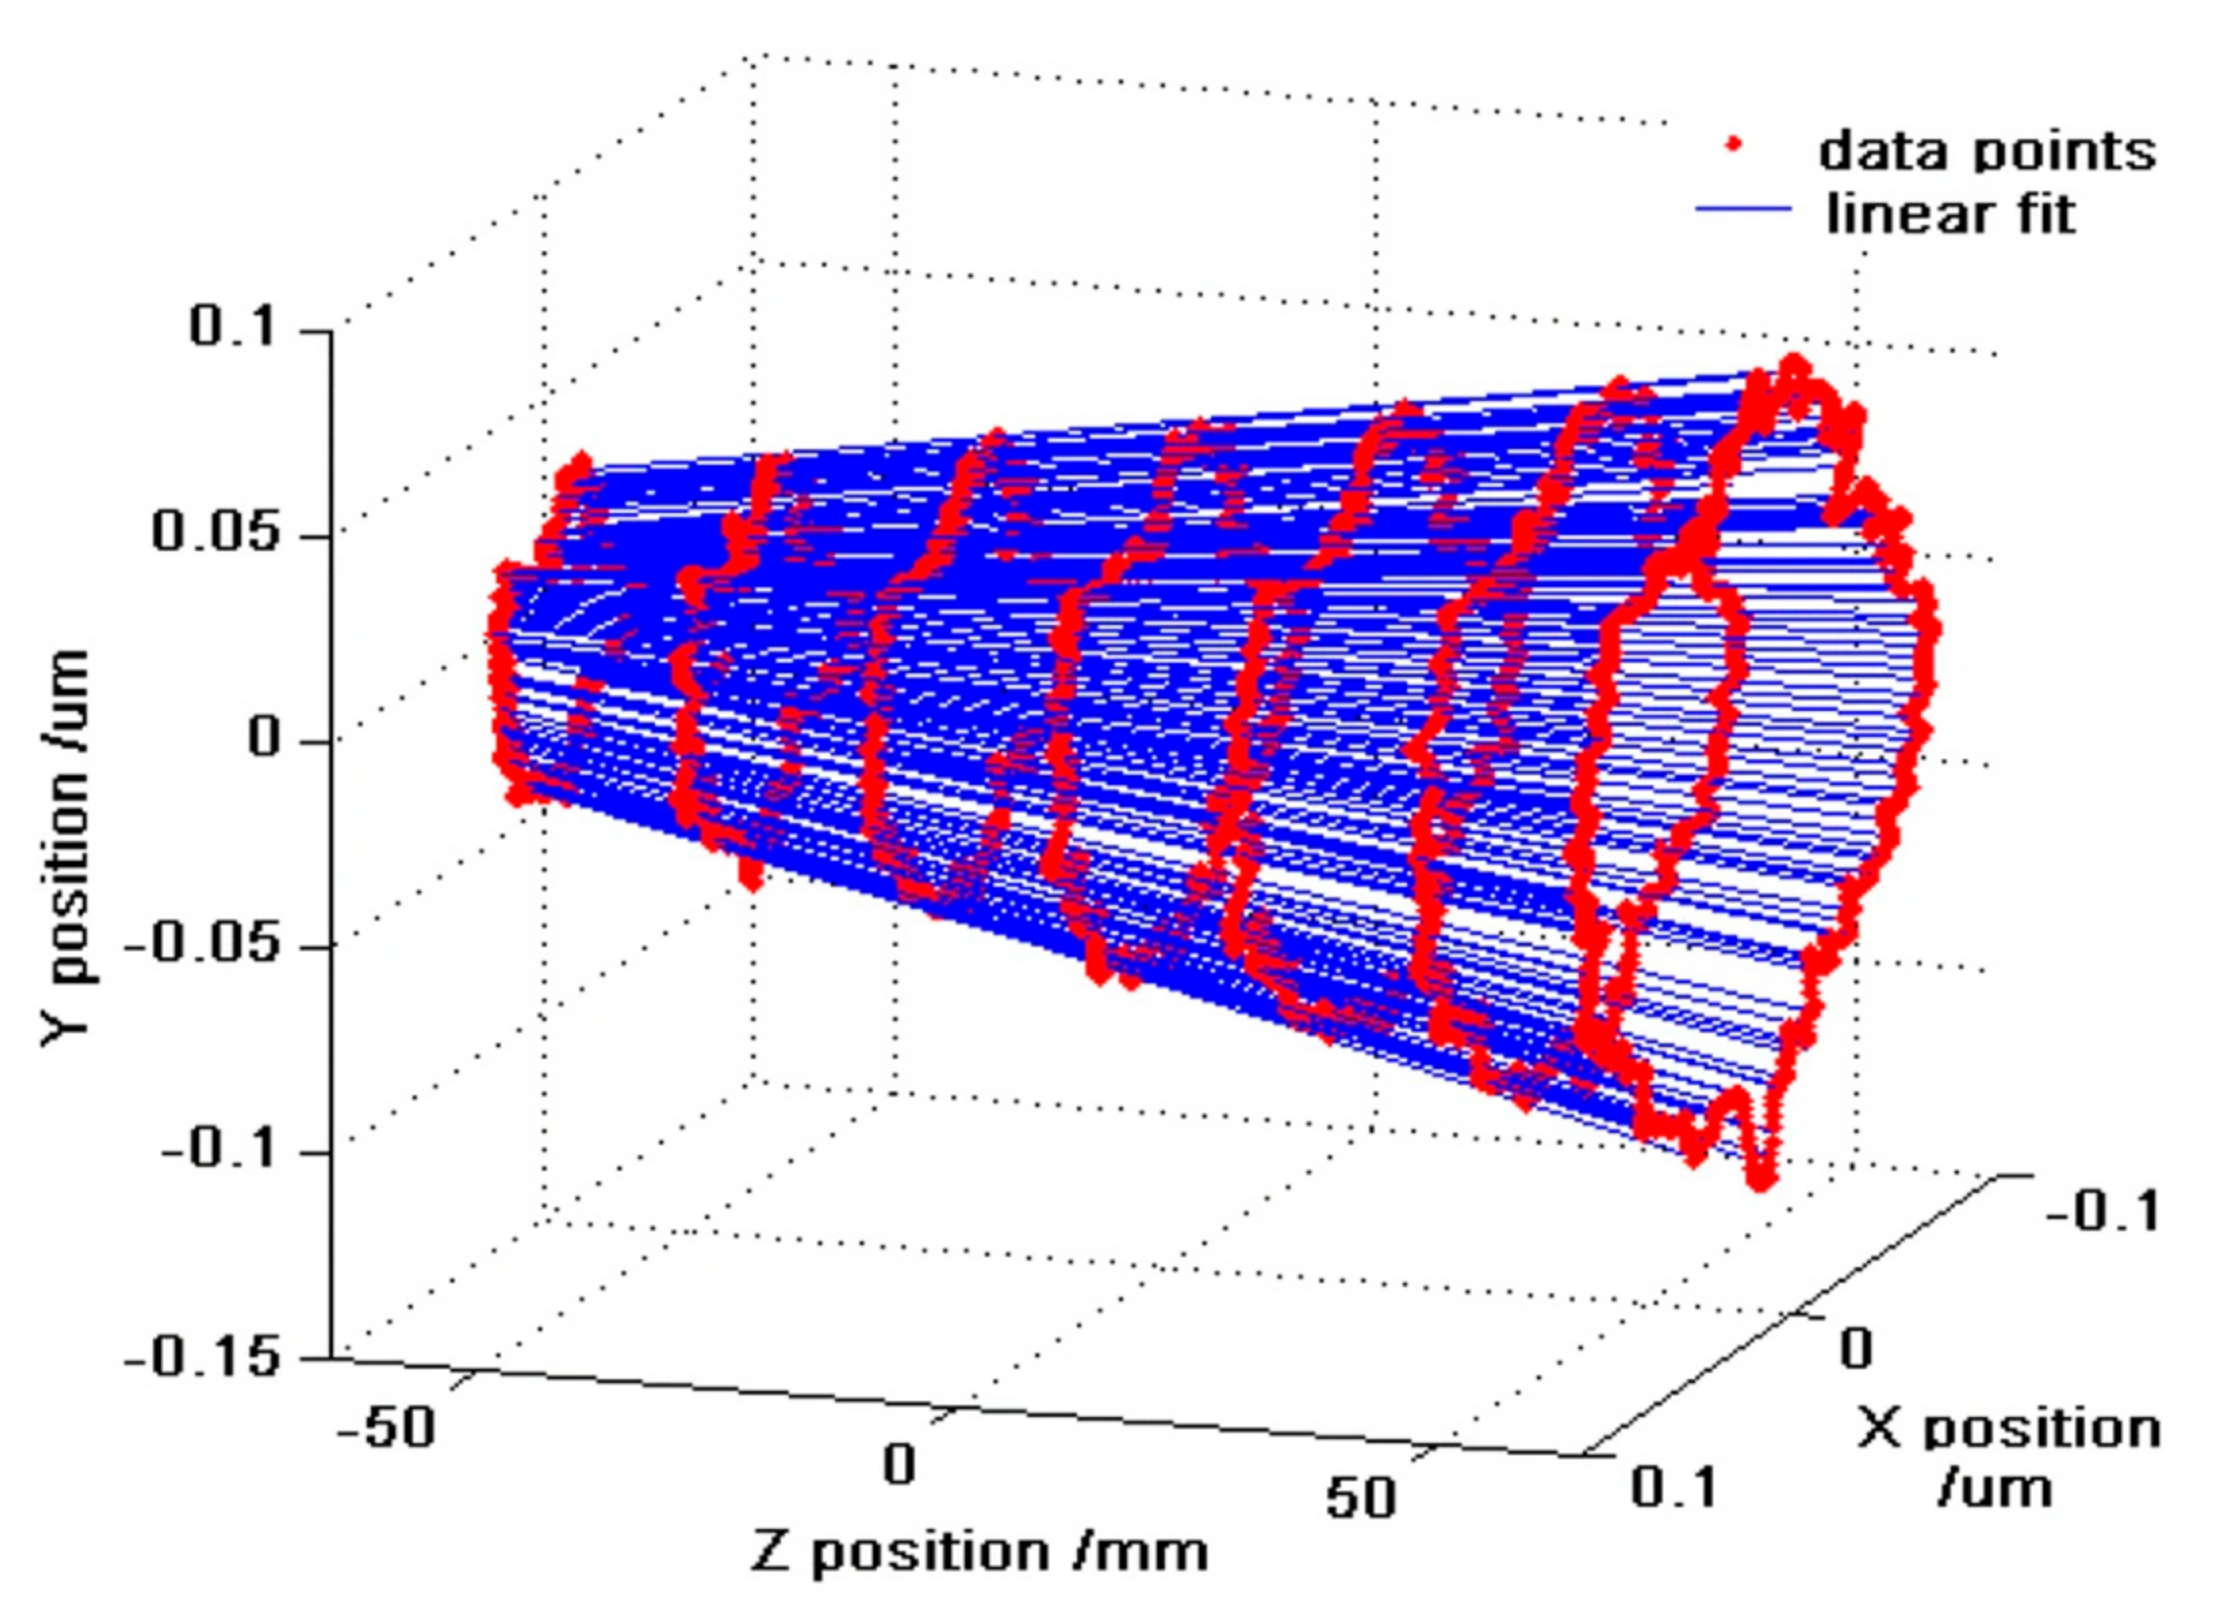
Figure 54 shows the results of seven measurements of error movements carried out at different distances from the spindle’s face. The clearly visible linear nature of the geometric relations between them can be considered proof that the proposed error separation technique gives repeatable results.
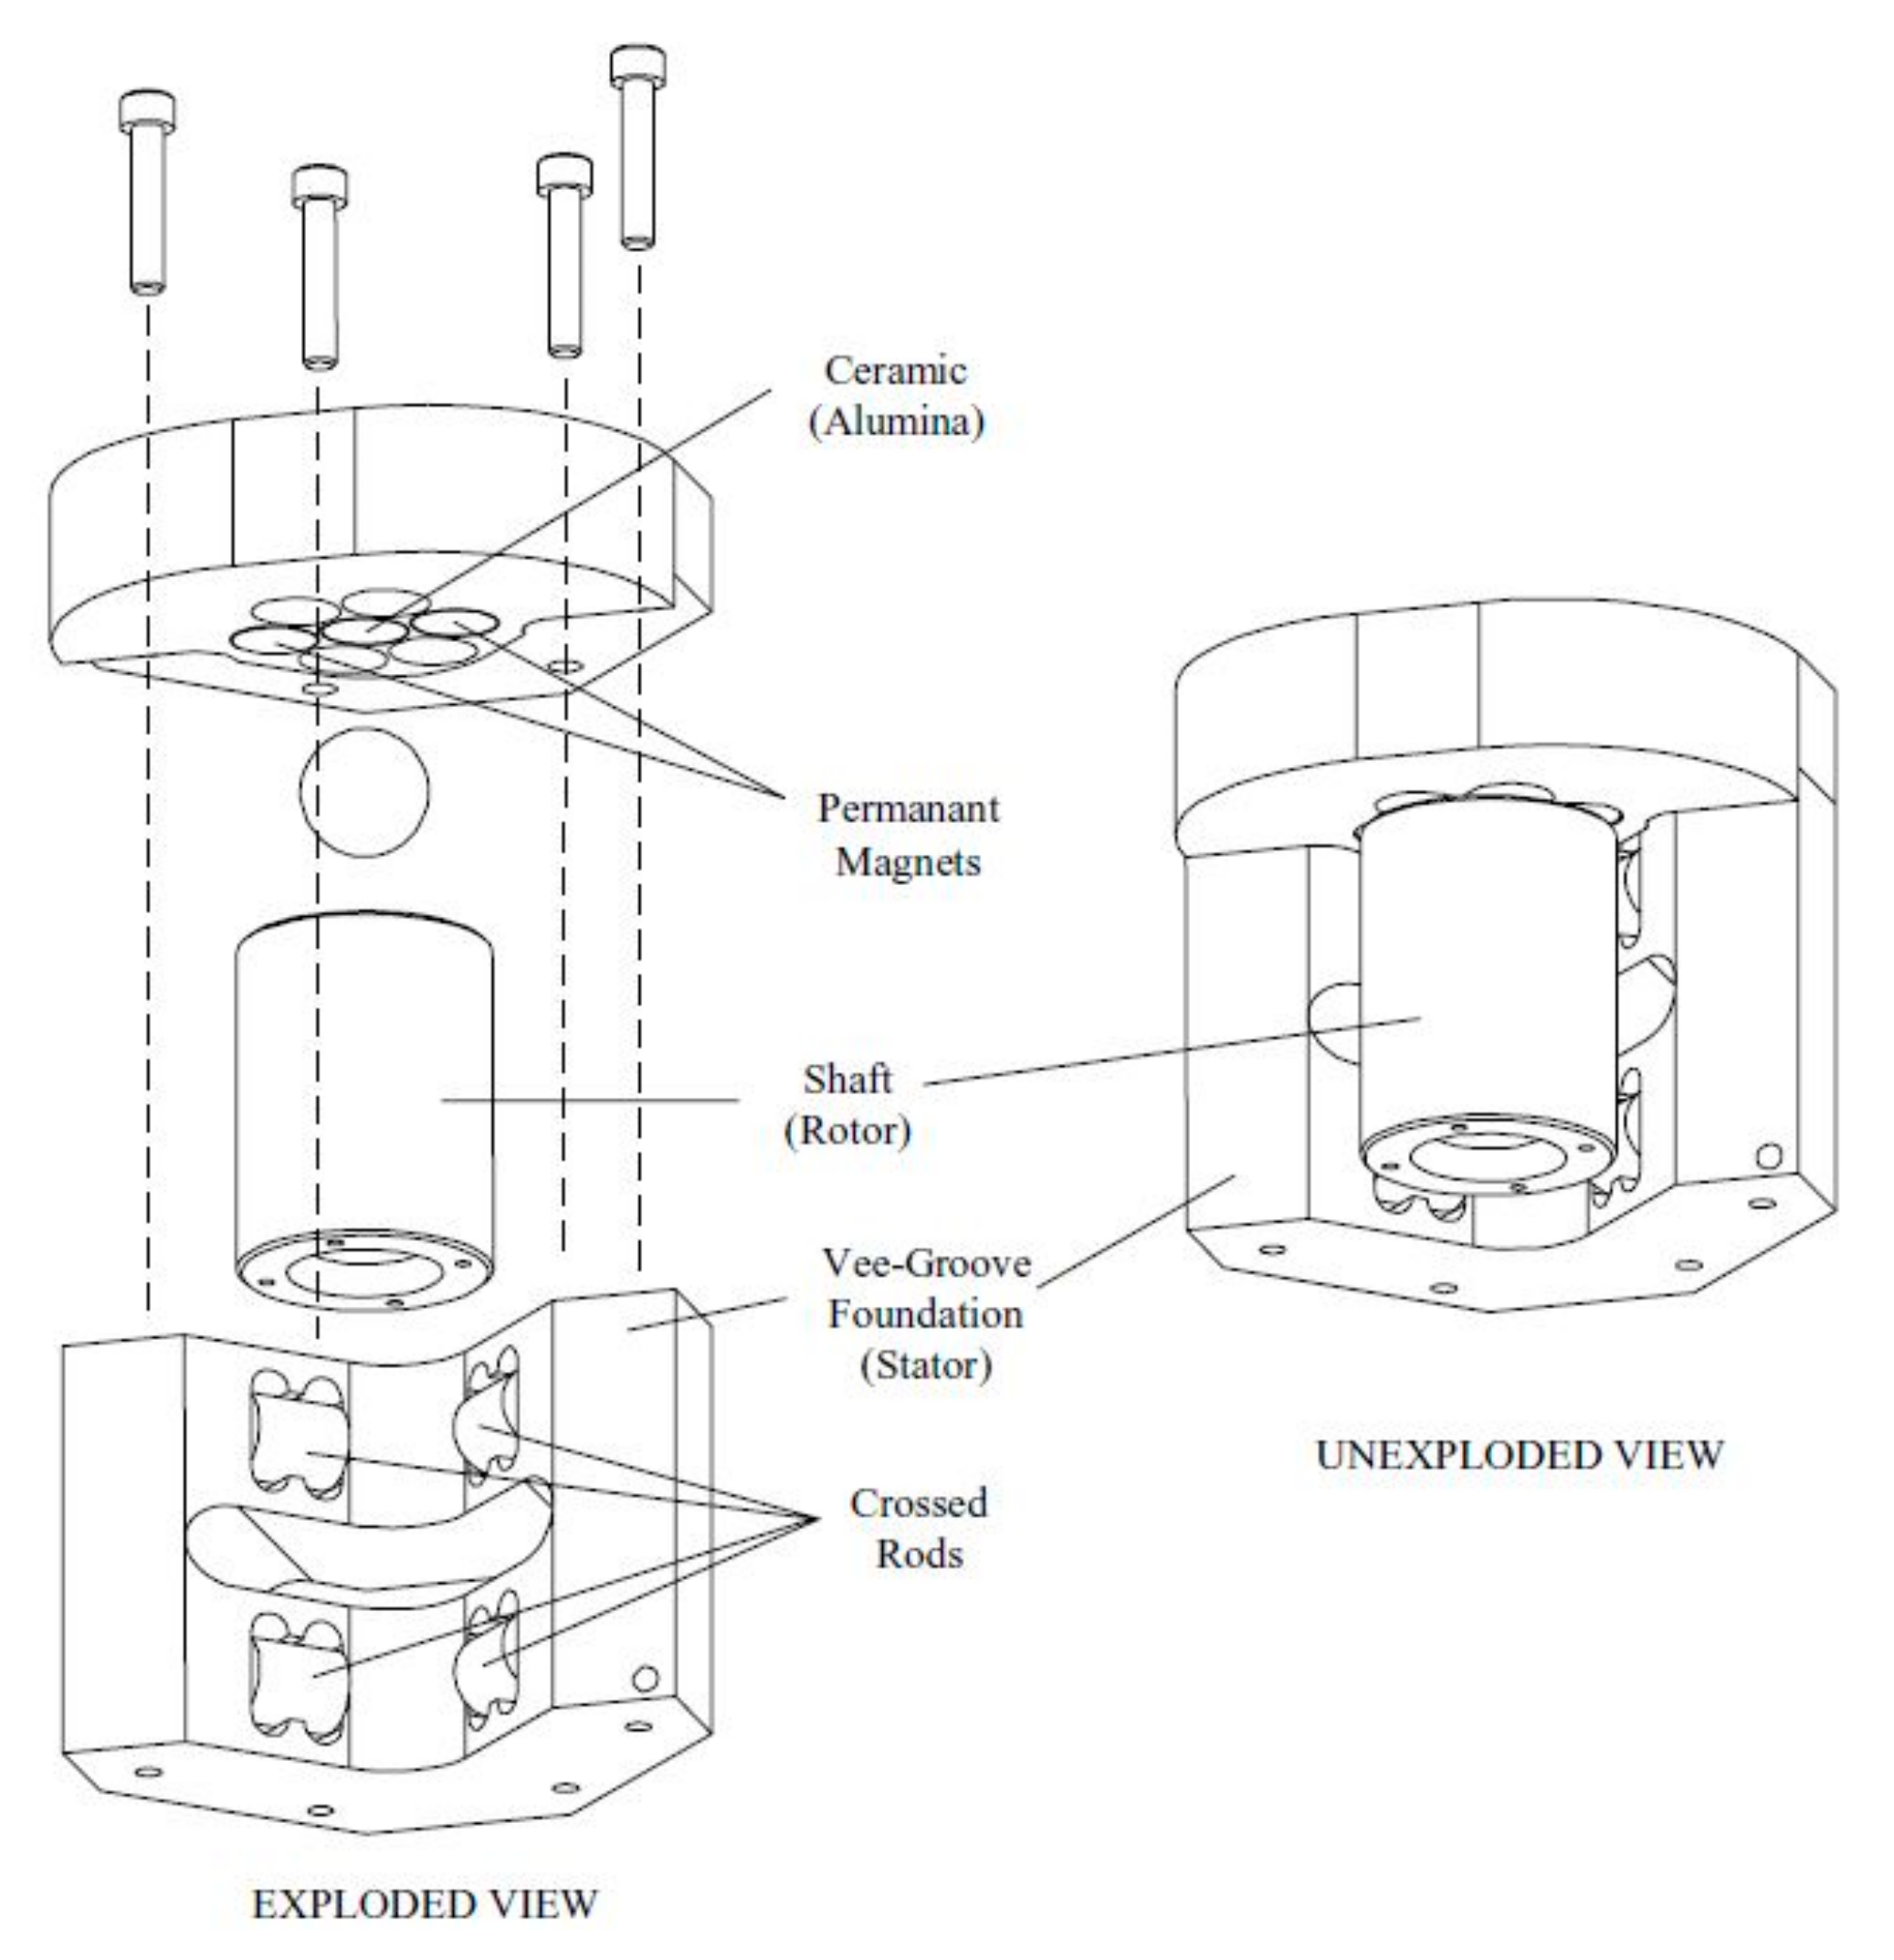
5.9. Kinematic Spindle
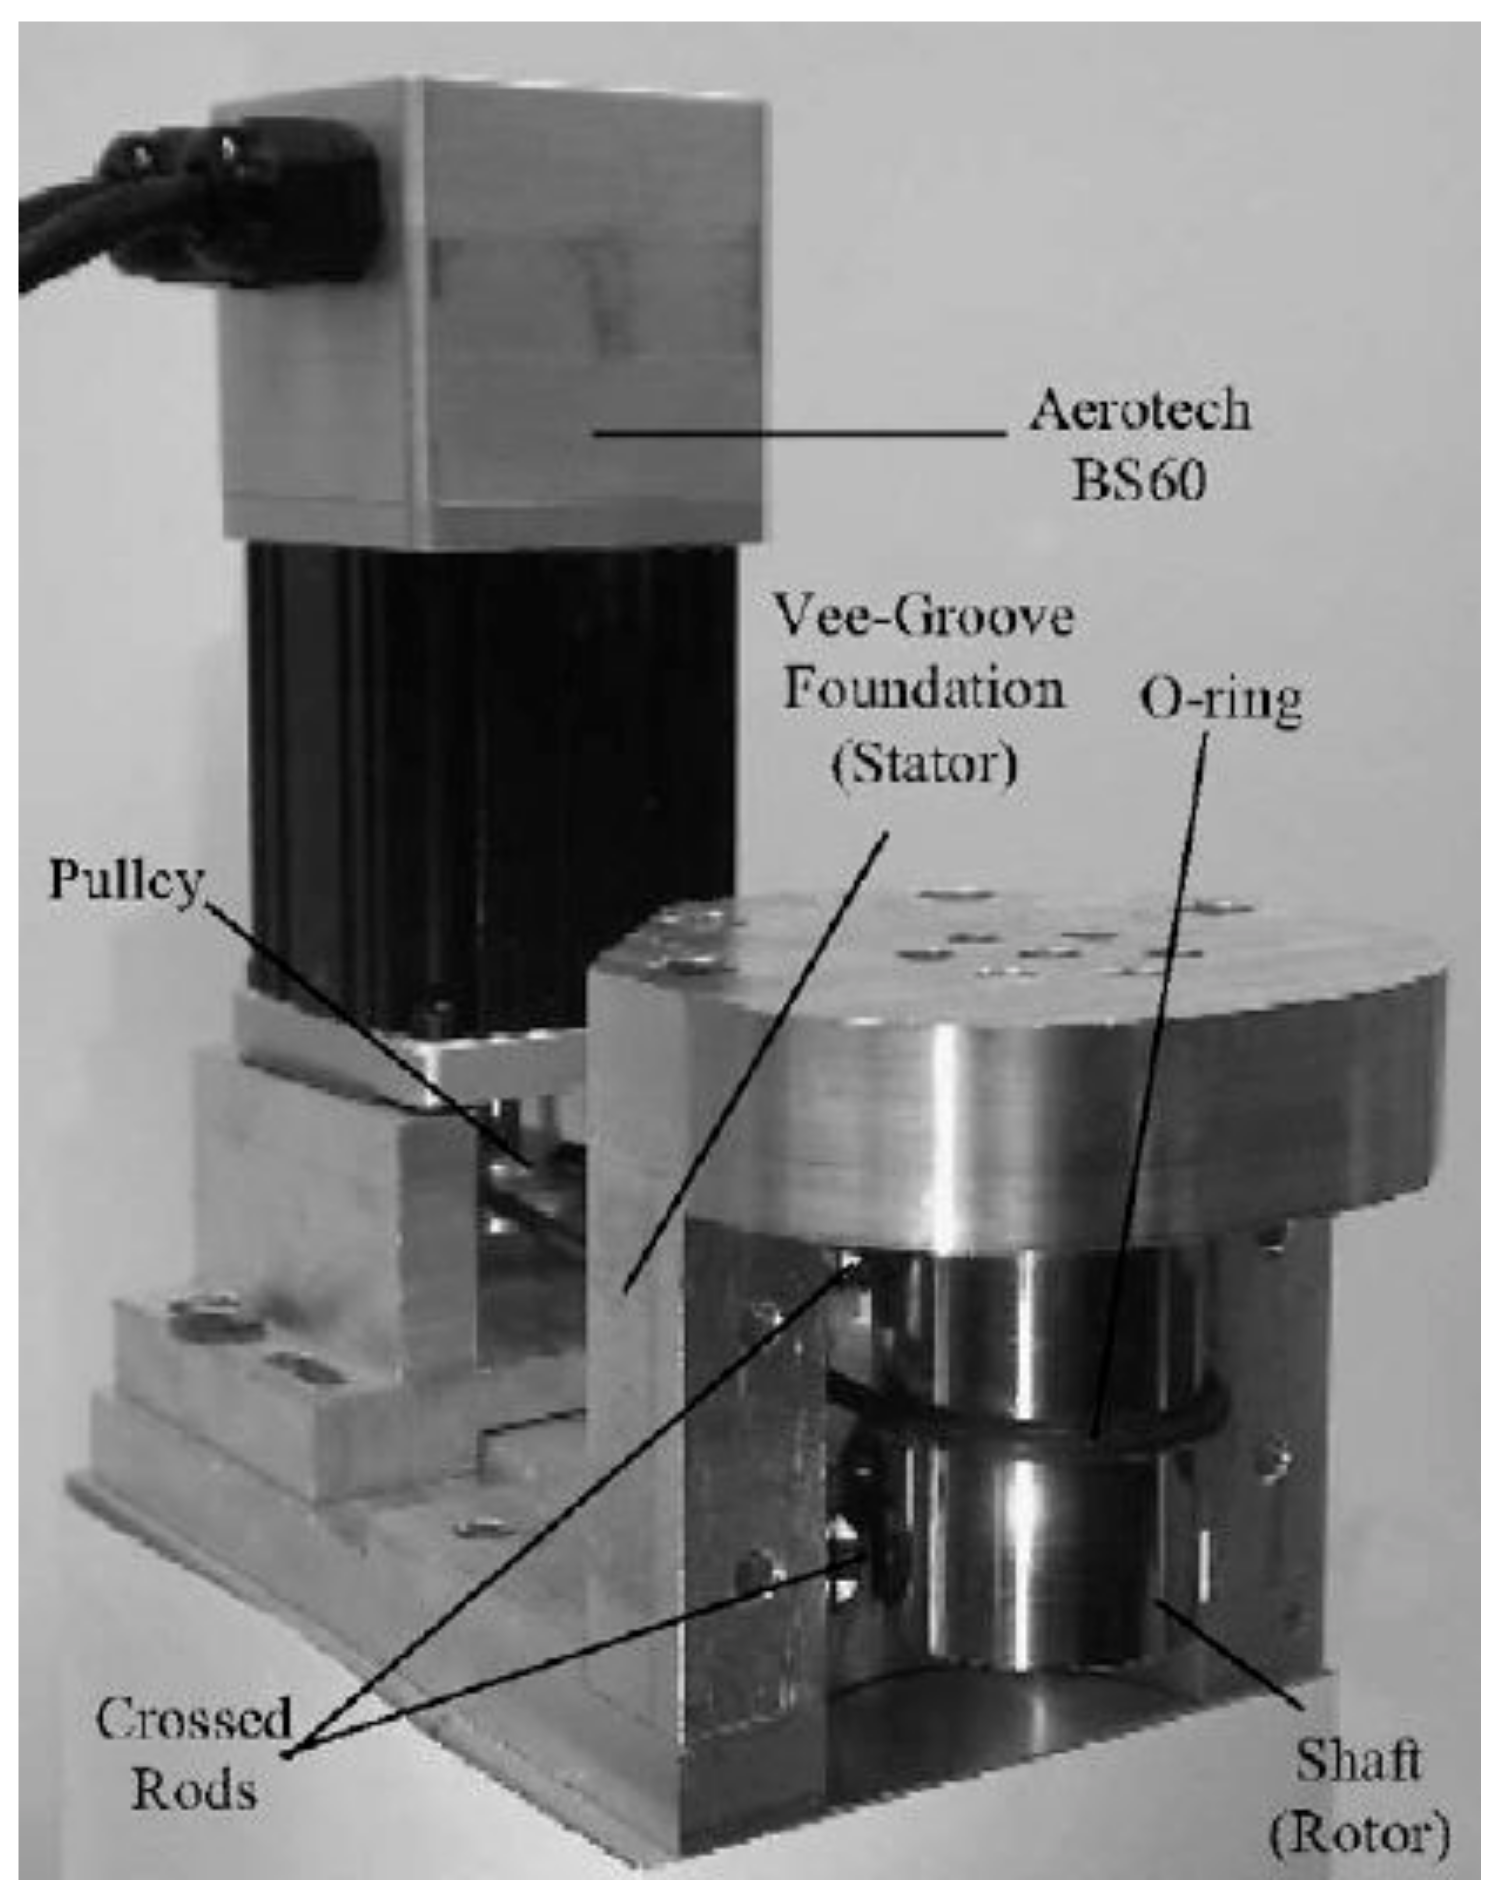
The article in [
20] shows the connection between the spindle outer surface circularity error and the synchronous error movement. This may allow the value of the synchronous error to be predicted depending on the measured circularity error. The idea of a kinematic spindle was presented on
Figure 55.
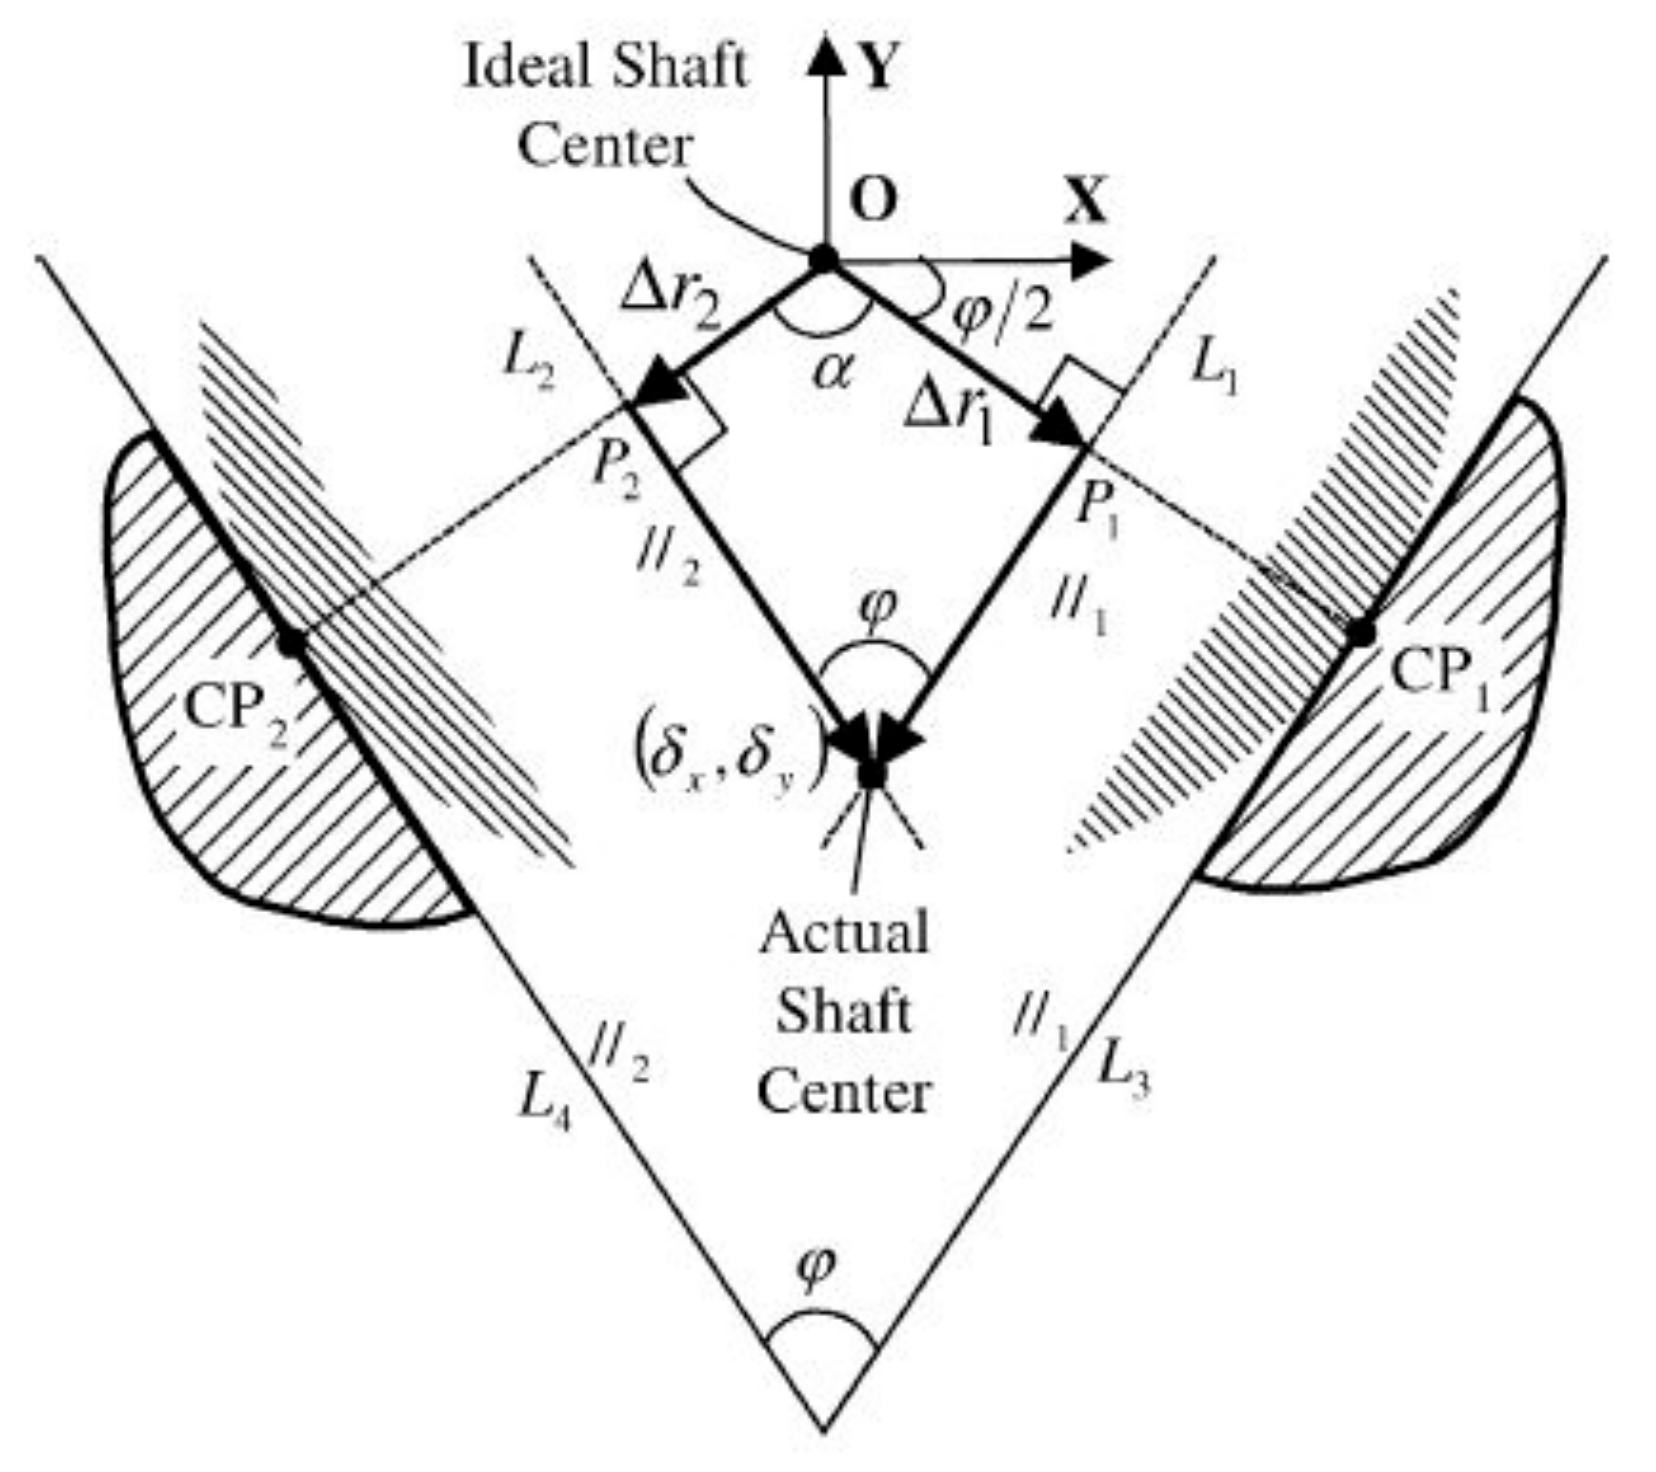
The geometric model for which the analysis was performed is shown in
Figure 55. The geometry in the plane of contact, where the rotating spindle contacts the rolling elements, in a V-groove. The surface of the cylinder meets at two points CP
1 and CP
2 (as shown in
Figure 56). The coordinate system is defined at the ideal (theoretical) centre of a perfectly circular spindle. Since the spindle’s cylindrical surface is not perfect, the spindle’s centre moves around the perfect centre, with its coordinates (δ δ
x, δ
y δ) changing with each angular position of the spindle, γ
i.
To confirm the theory experimentally, a prototype kinematic spindle station (
Figure 57) was built and tests were carried out. Three traditional capacitive sensors in each of the planes of contact were used for measurements.
As a result, it was confirmed that the synchronous error movement of the spindle standard depends mainly on circular profiles in cross sections, where the spindle’s side surface comes into contact with the rolling elements. The correctness of a simple analytical model and the possibility of a priori determination of the synchronous error, when the irregularity of the pattern profiles is known, has been proven.
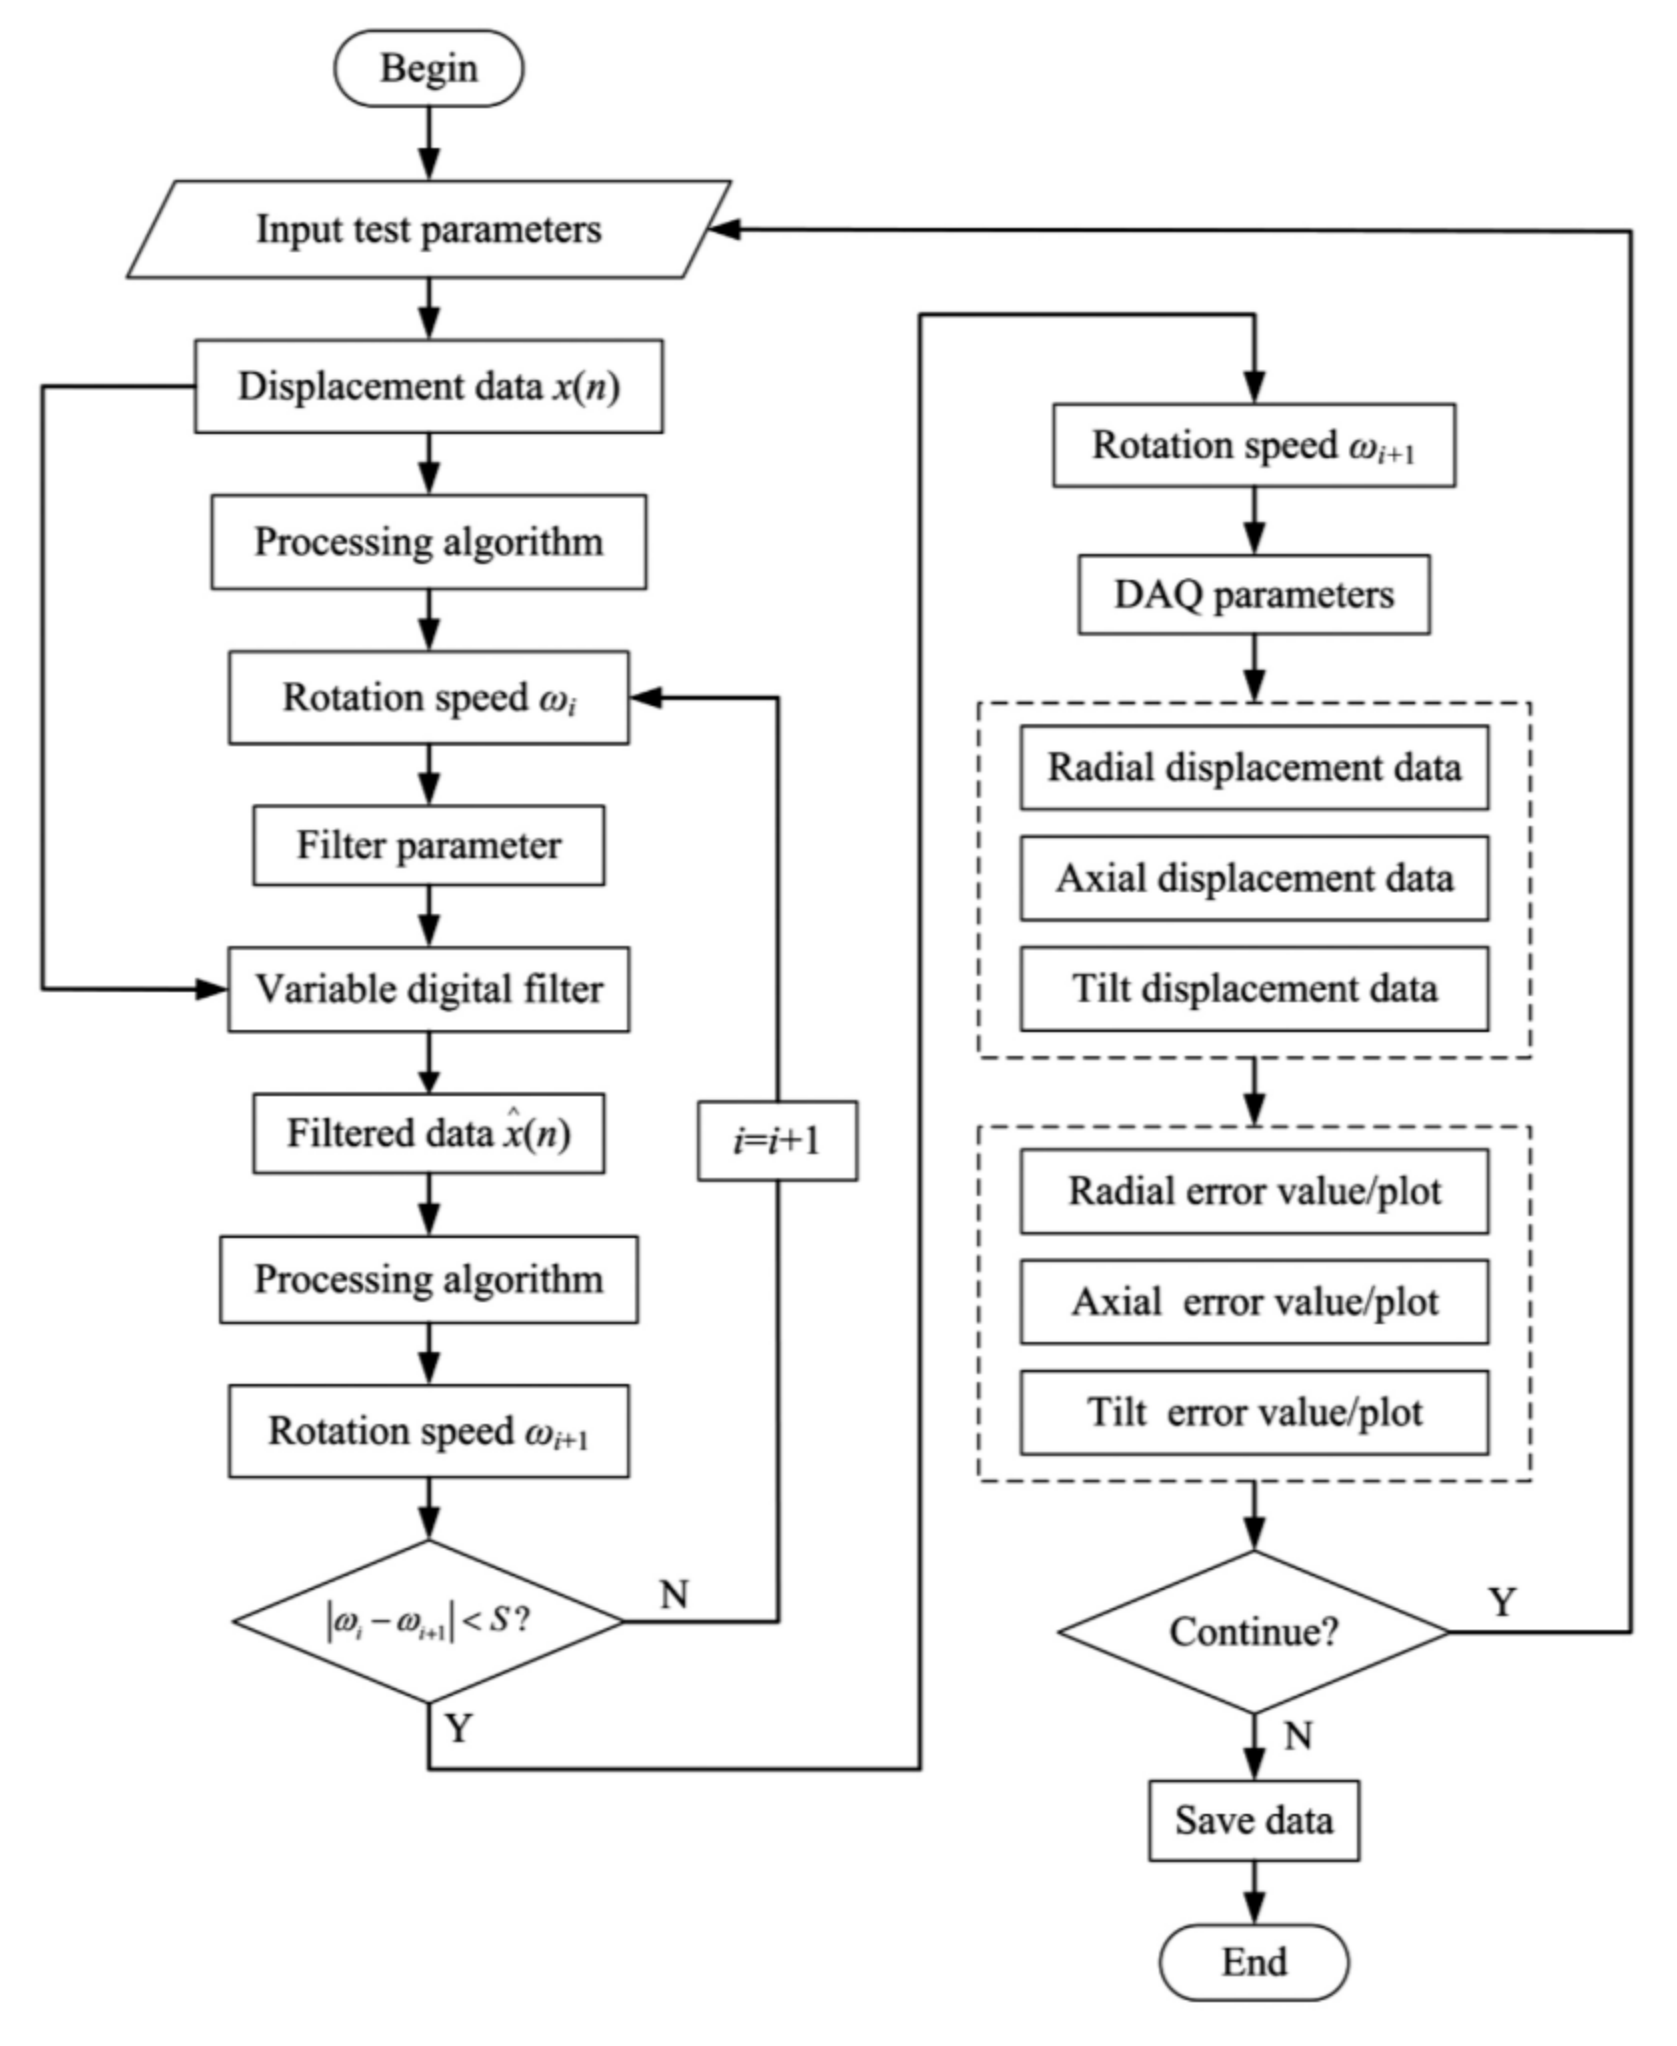
5.10. Algorithm Calculating the Angular Position of the Spindles during Tests in the Workshop
In the work of [
42], the implementation of the computational algorithm (shown in
Figure 58) was proposed, which enables determination of the rotational speed and angular position of the spindle without using an encoder. According to the authors, this solution allows for a reduction in the cost of research equipment, and the obtained results are comparable to those obtained using the commercial SEA solution by Lion Precision.
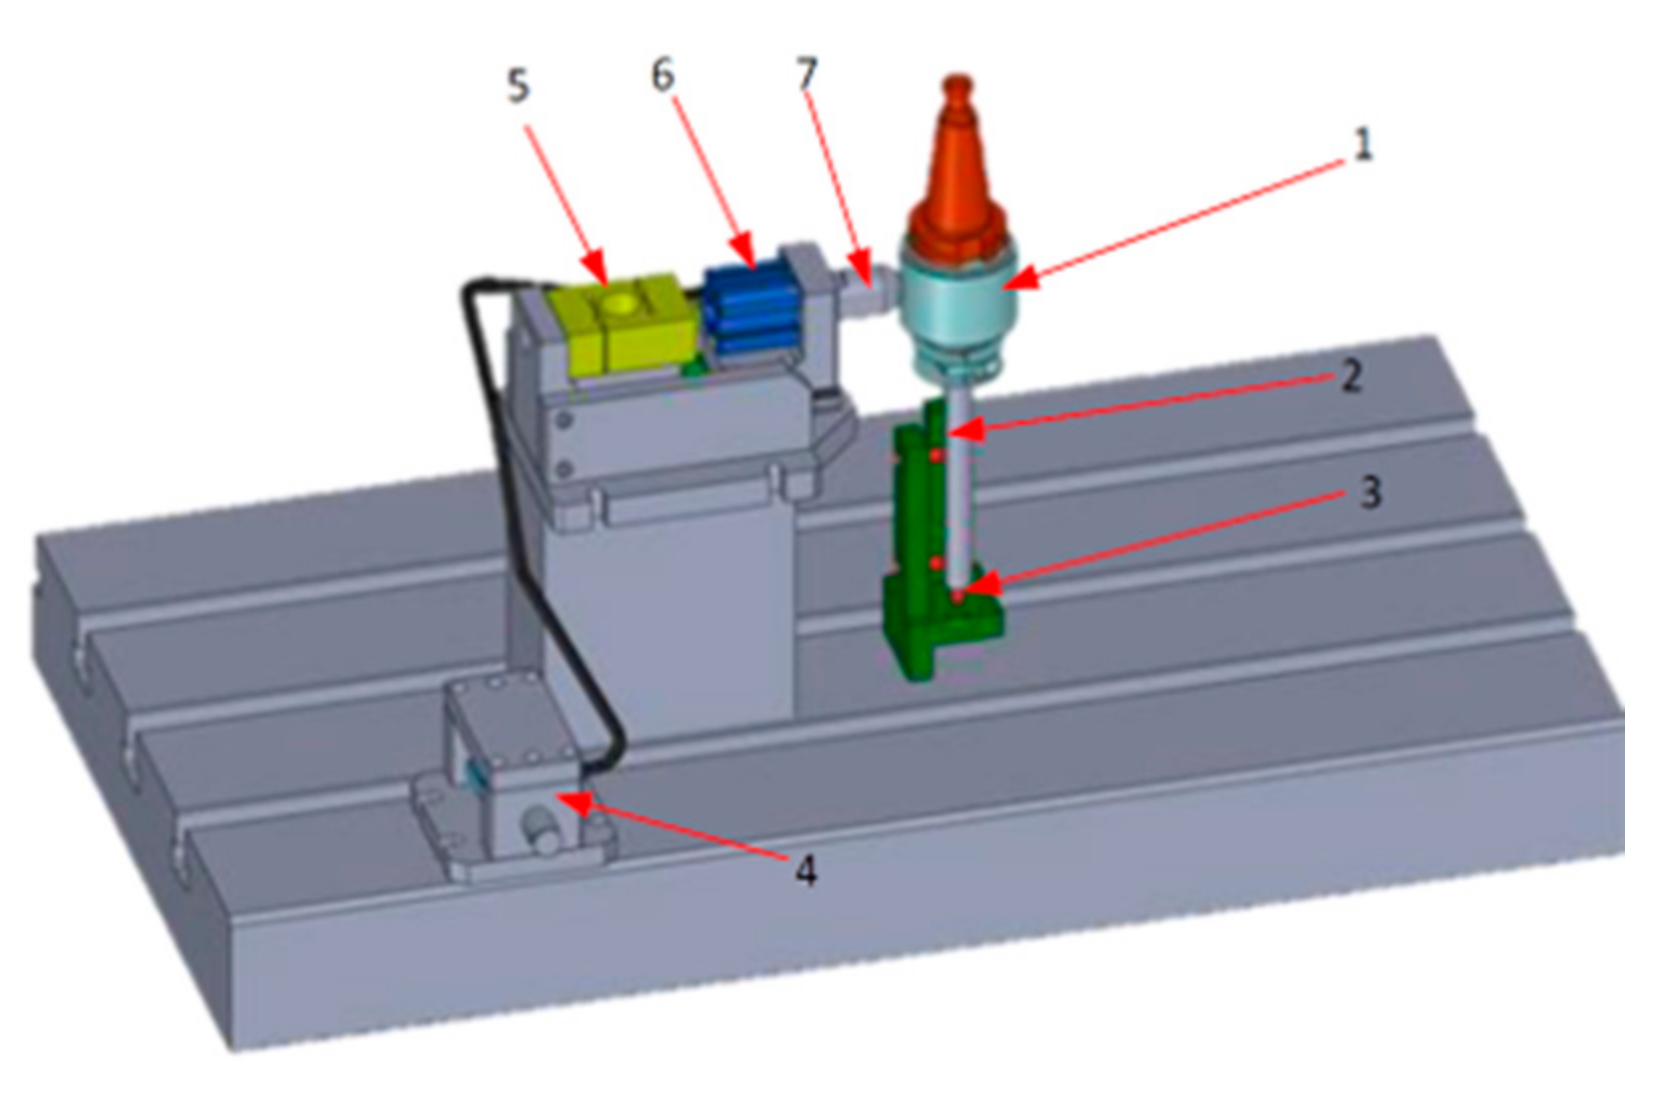
5.11. Measurement of the Spindle Error Movements under a Simulated Load
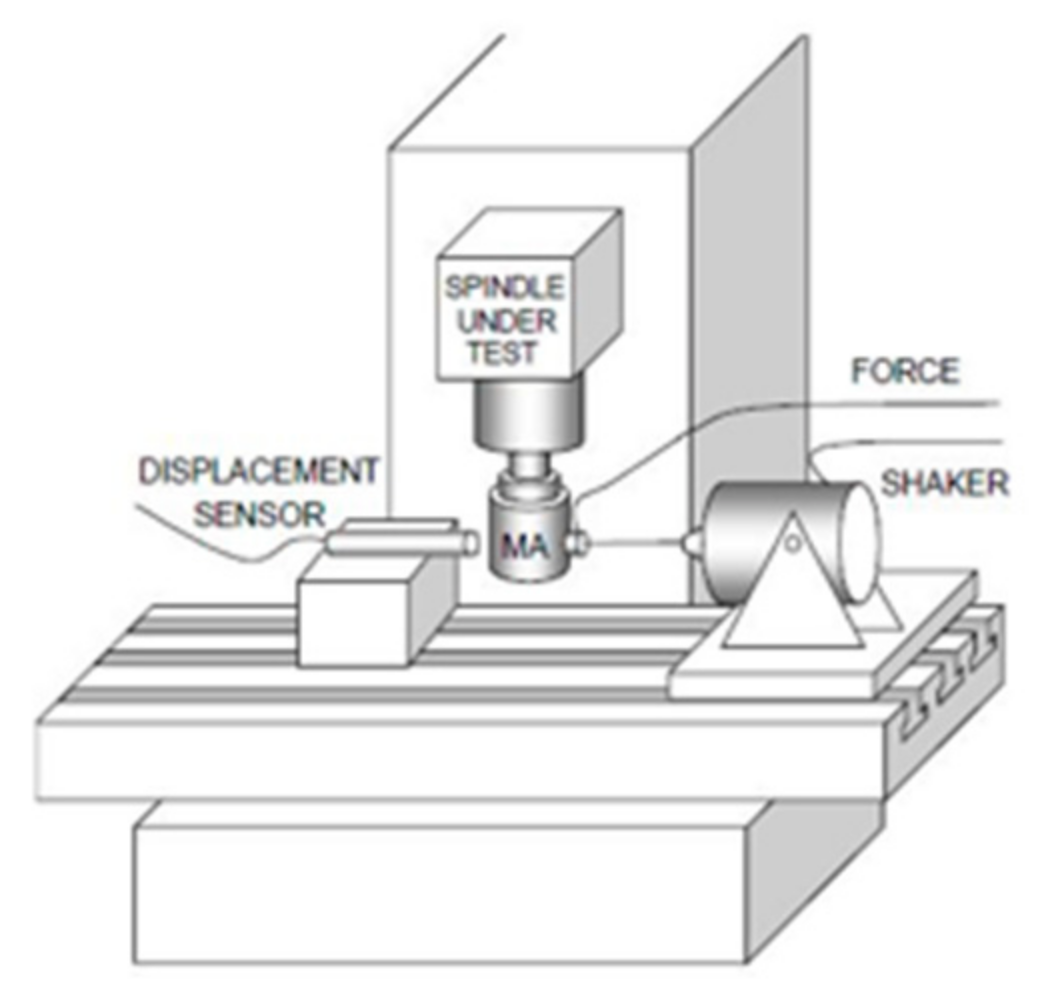
An interesting idea of the test stand that enables load simulation during dynamic spindle tests was described in [
43,
44]. The proposed test method assumes the use of a specially designed device that allows the hydraulic application of a load to a rotating spindle through a bearing mounted in a tool holder, as shown in
Figure 59.
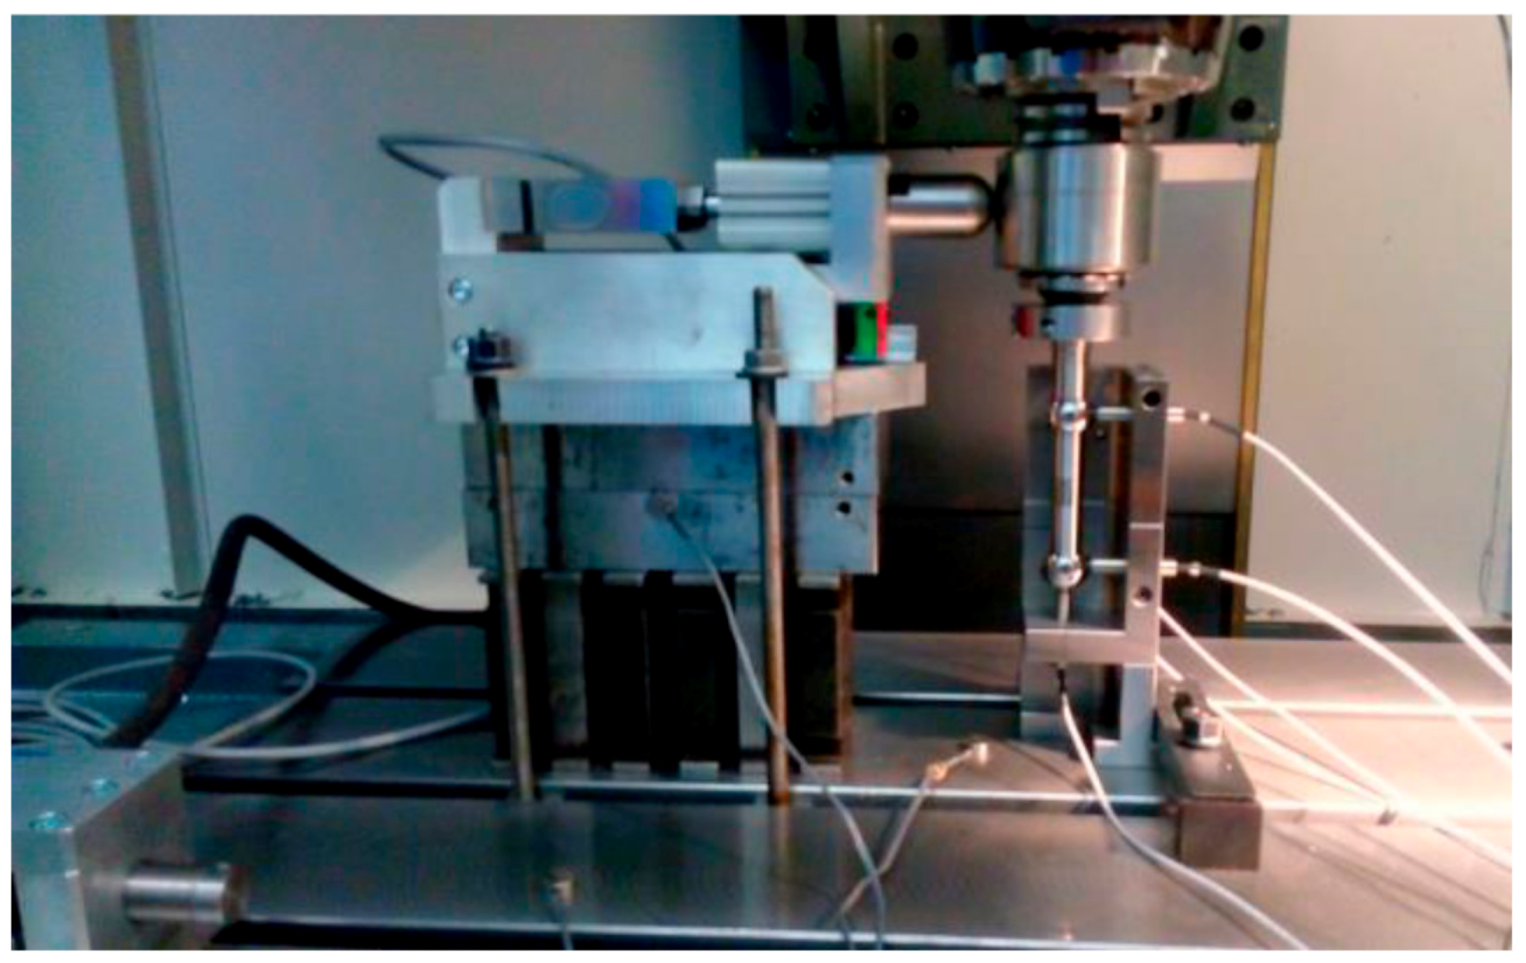
The test stand was assembled on a three-axis CNC milling machine, as shown in
Figure 60, and then a series of measurements of displacement of a spindle loaded with a force perpendicular to its axis (radial force) with a value in the range of 0–500 N started.
Before starting the actual tests, the influence of errors generated by the rotating bearing was first checked, which was assessed as small (which was probably influenced by the high accuracy class of the bearing used and the damping of some vibrations by the hydraulic system that applied the load).
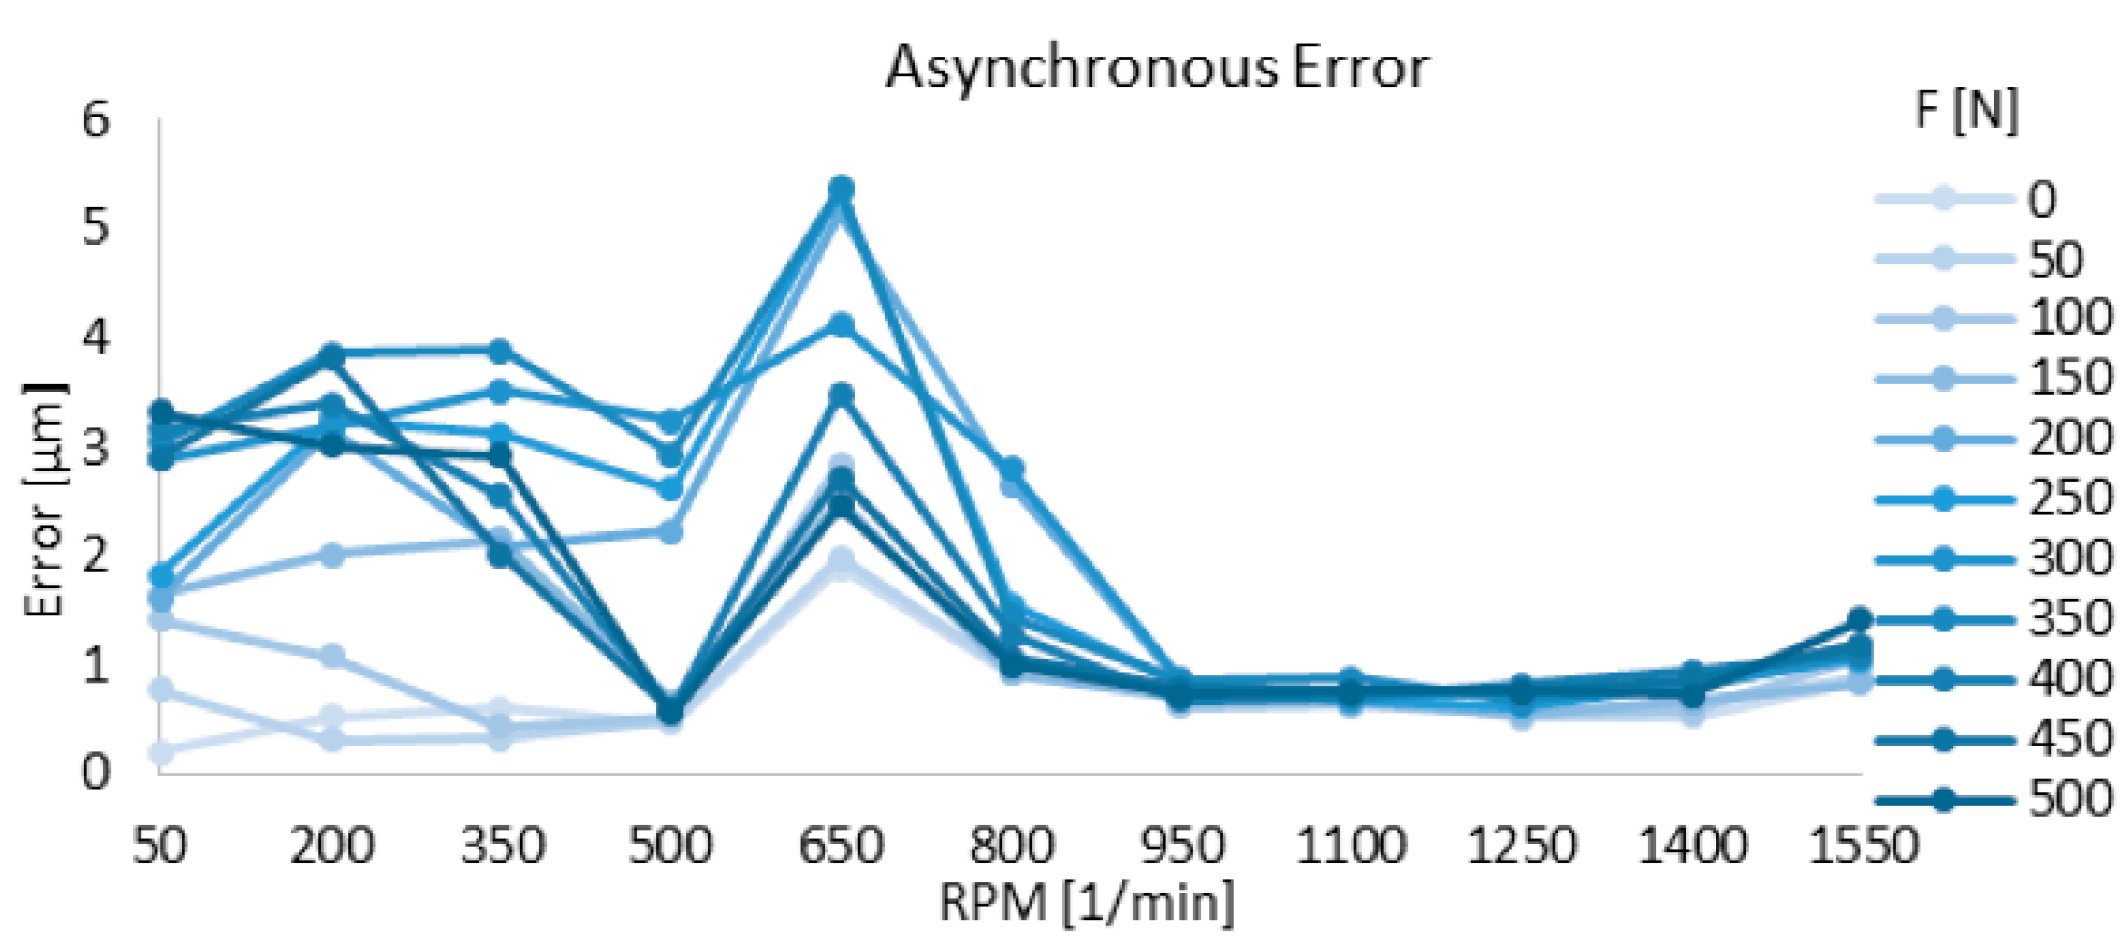
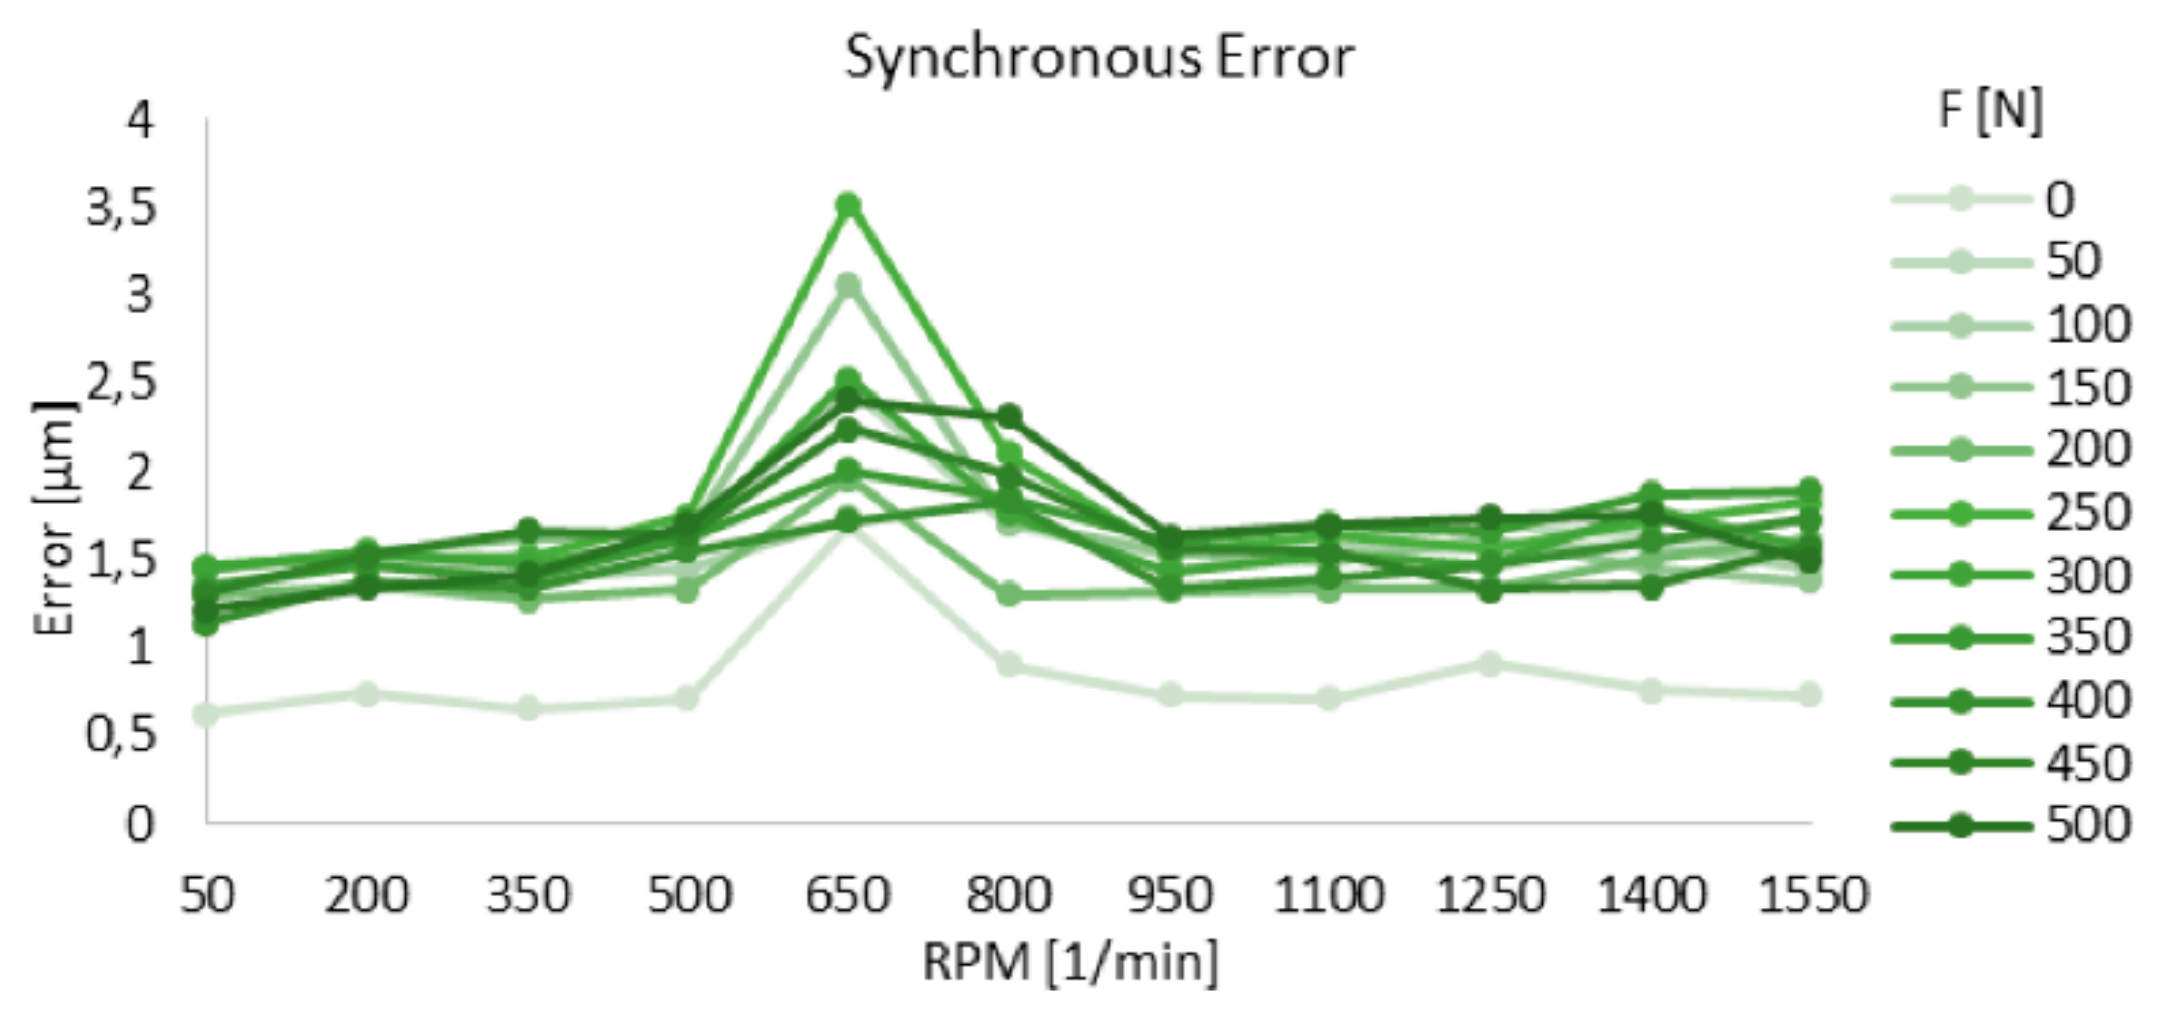
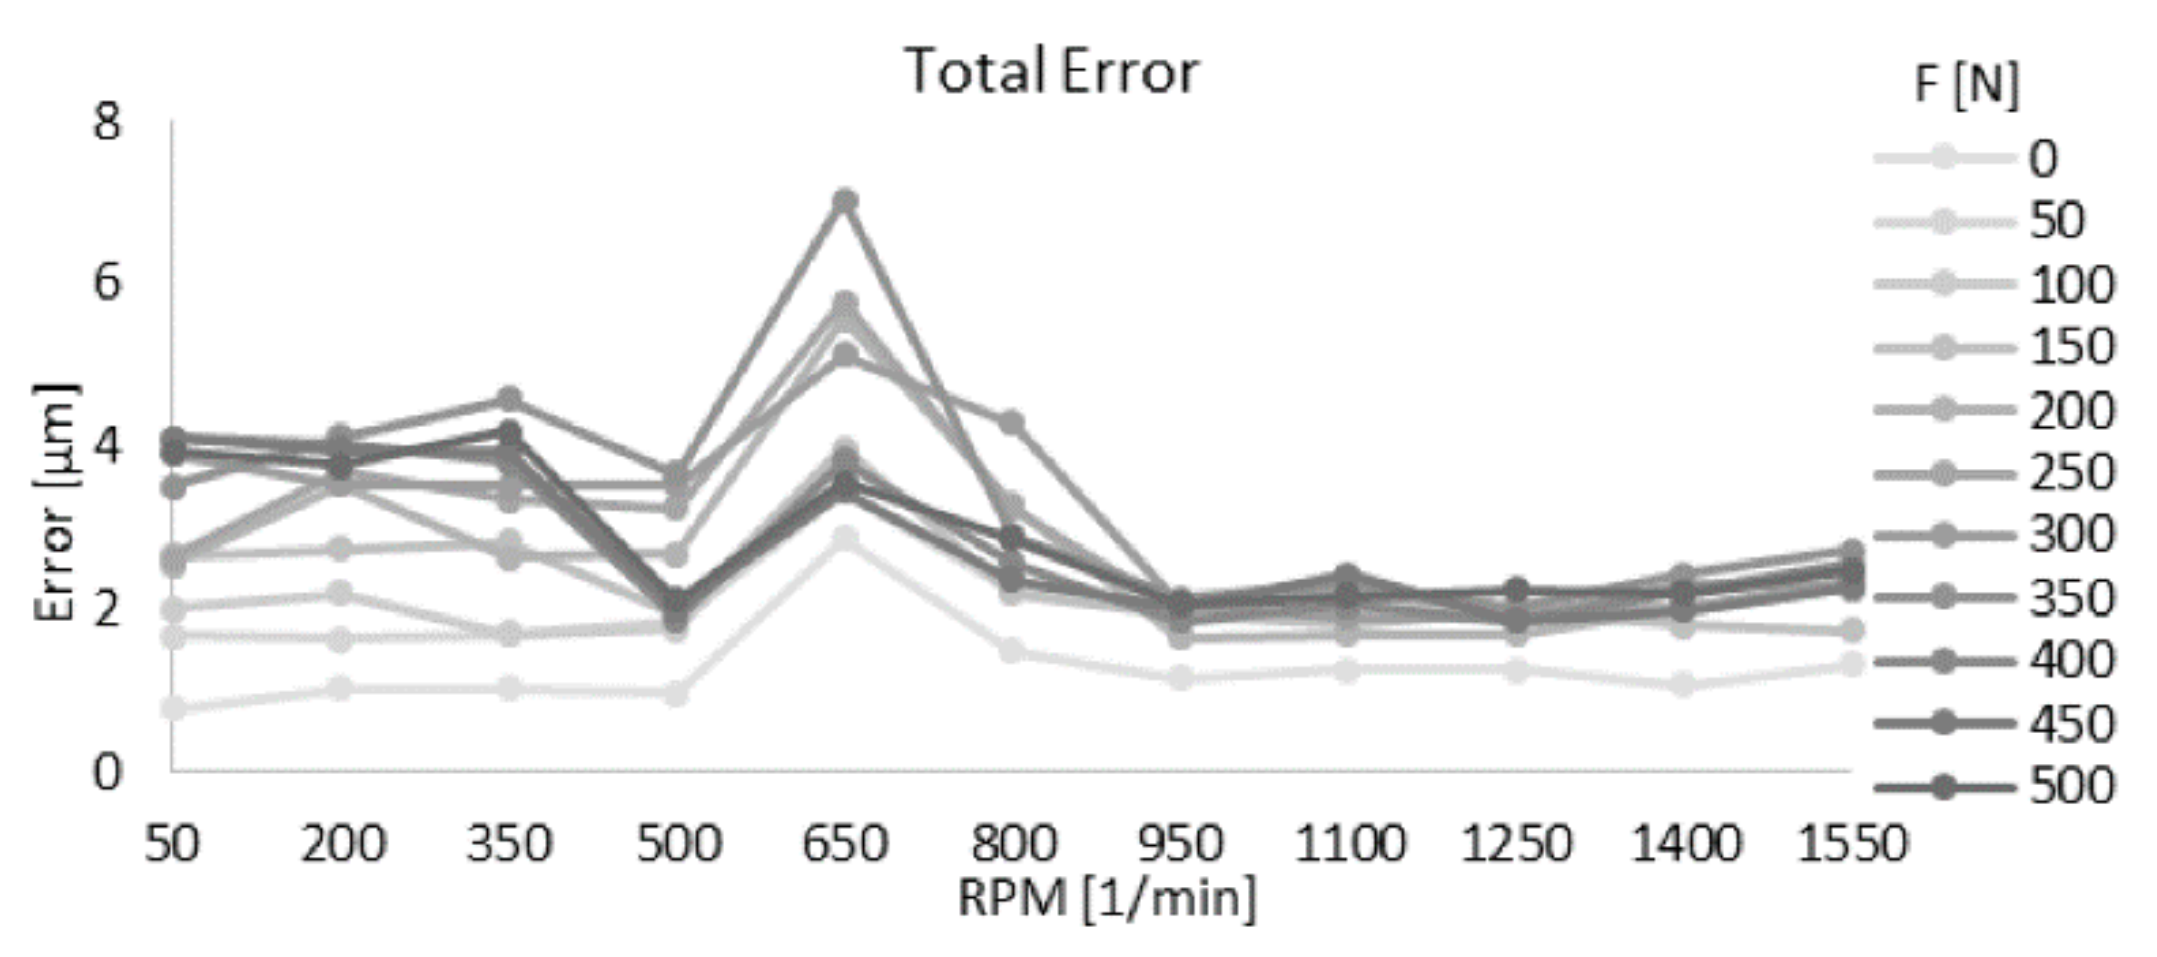
A series of measurements of the displacement of a spindle was carried out under a simulated load for various rotational speeds in the range of 50–1550 rpm. The obtained results were plotted on appropriate graphs showing changes in asynchronous error (
Figure 61), synchronous error (
Figure 62), and total error (
Figure 63) of the spindle position as a function of its load and rotation.
As a result of the research, the team of scientists came to the following conclusions:
The increase in the force loading the spindle had the greatest impact on the value of the total error movement up to 950 rpm.
In case of revolutions higher than 950 rpm, the value of error movement increased slightly with the given load.
The authors of this study do not agree with the interpretation given for the results. We believe that the presented graphs clearly show the influence of the load on the change in value of asynchronous, synchronous and total error, e.g., for the 650 rpm speed, the smallest measured total error is about 3 µm and the largest is about 7 µm, so it is over 2.3 times higher. Despite the differences in interpretation, the proposed research method is very interesting because it allows you to check the accuracy of the spindle’s work under load, i.e., in conditions simulating at least roughly real working conditions.
5.12. Propagation of Measurement Uncertainty in Spindle Error Separation Techniques—Research with the Stochastic Spectral Method
In the article of [
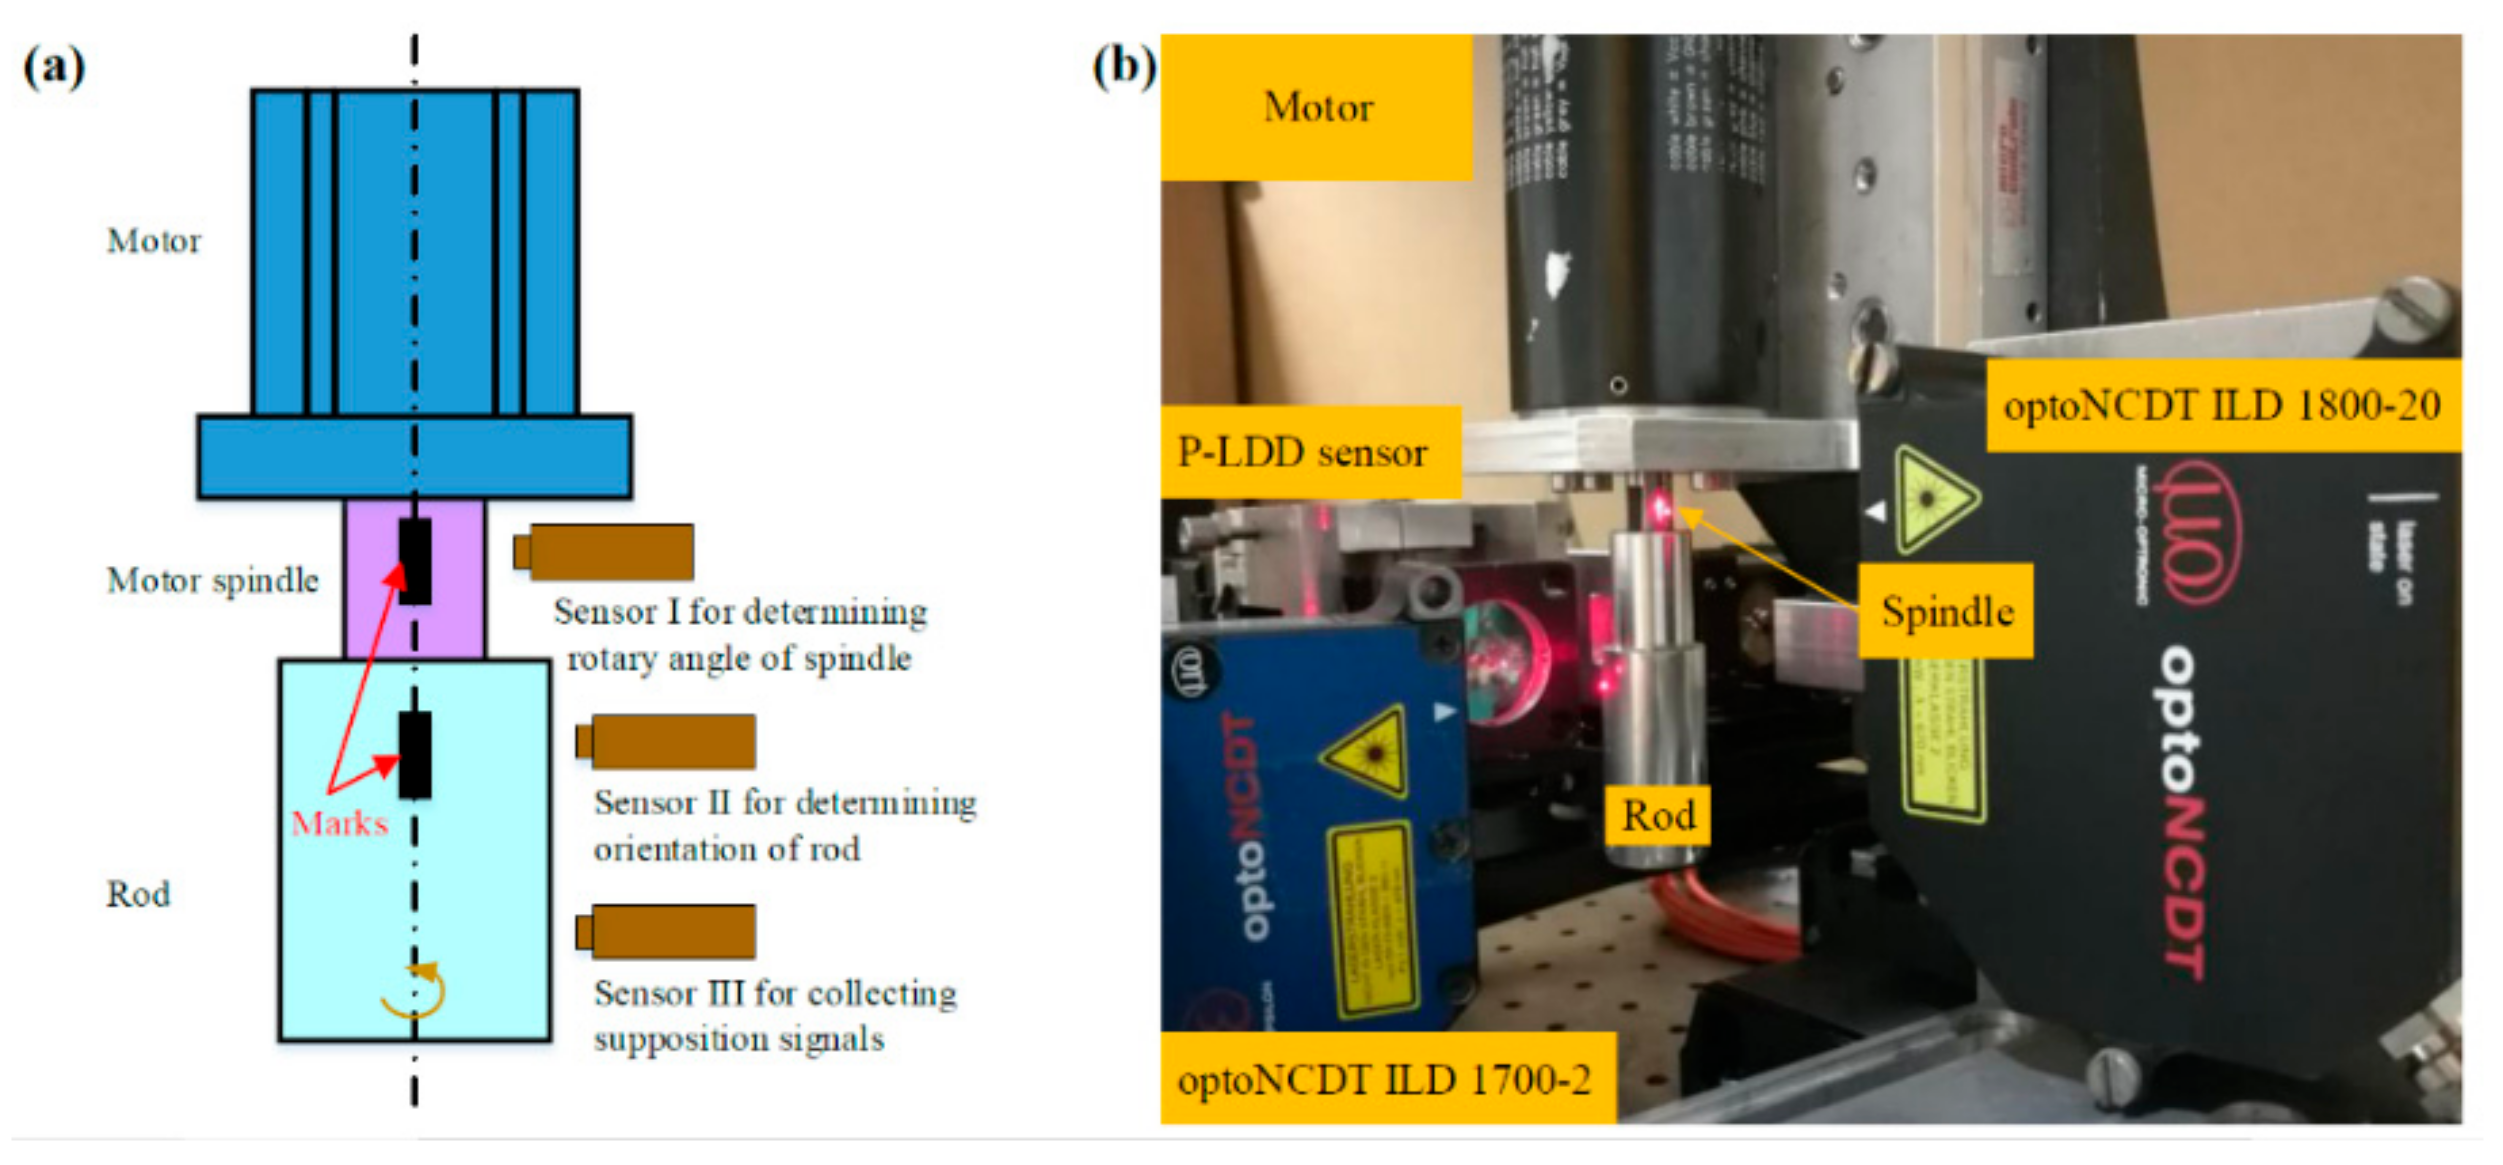
45], the authors described a method investigating the uncertainty propagation of error separation techniques during the measurement of error movements. In order to perform the study, the authors built a special test stand (shown in
Figure 64) consisting of a DC motor (Maxon DC motor 201018). A gauge plunger was attached to the motor spindle, the displacements of which were tested by three sensors I, II, and III, which were used to determine the spindle rotation angle and to collect the superposition signal consisting of spindle error, spindle roundness error, and noise generated by the probe.
The data collected by the measuring sensors were processed by a control system using algorithms based on the systems theory and the stochastic spectral method. Using a specially constructed test stand with the use of systems theory and the stochastic spectral method, the law of propagation of measurement uncertainty of the measuring probe was formulated.
5.13. Other Important Publications Related with Spindle Error Movements
The publications described above are, according to the authors, particularly significant for the development of this field of science. As shown, the problem of erroneous movements of machine tool spindles can be investigated in many different aspects, which may include searching for new technical solutions for research equipment, striving for ever higher accuracy of measurements, and creating new computational algorithms in control systems or detailed studies of the influence of selected factors on the final result measurement as well as the influence of erroneous movements on the quality of the treated surface [
46]. At the end of this section, it is worth mentioning the works devoted to the influence of geometrical errors in rolling bearings [
47] and hydrostatic bearings [
48] on the values of erroneous movements.
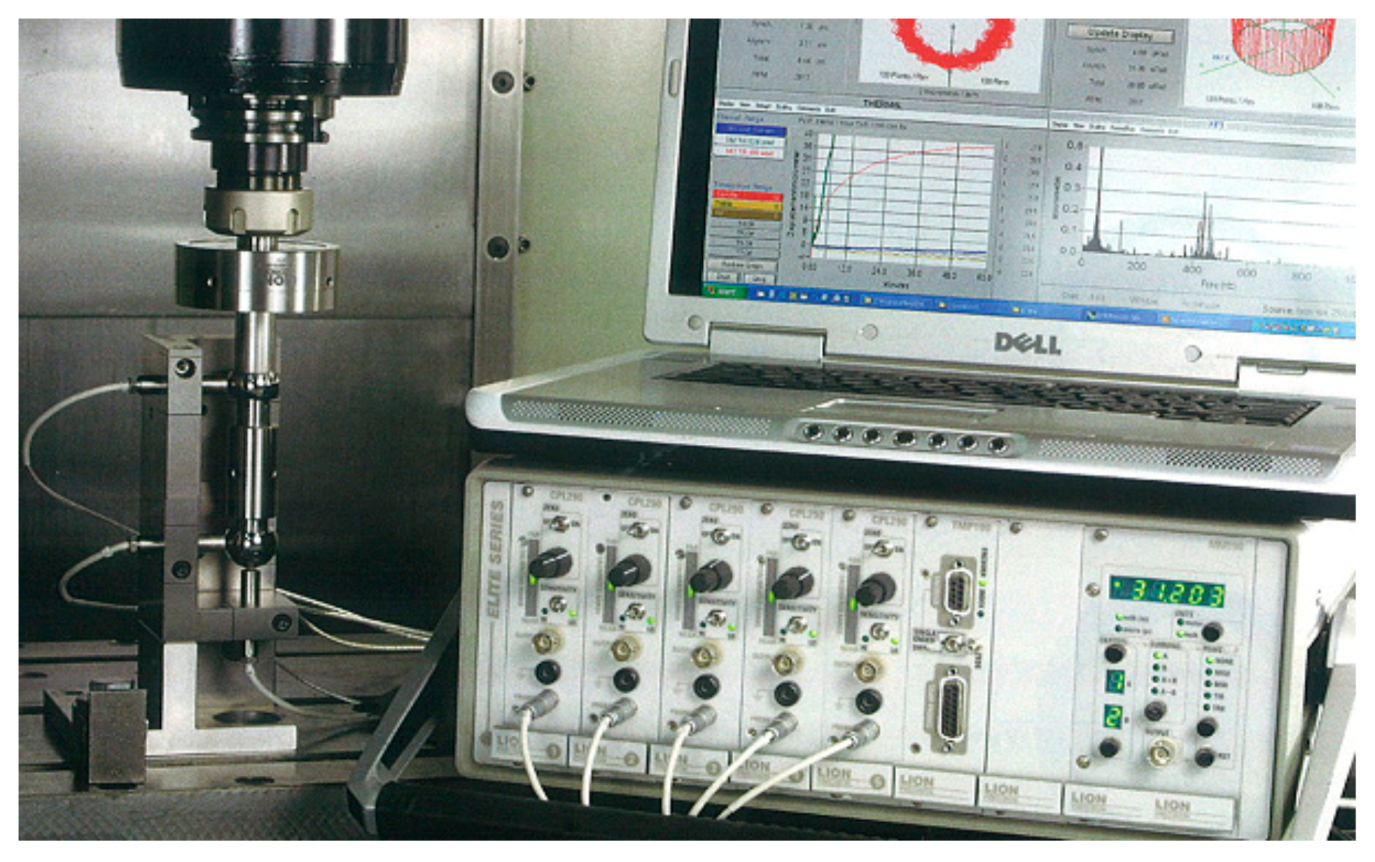
6. Own Research
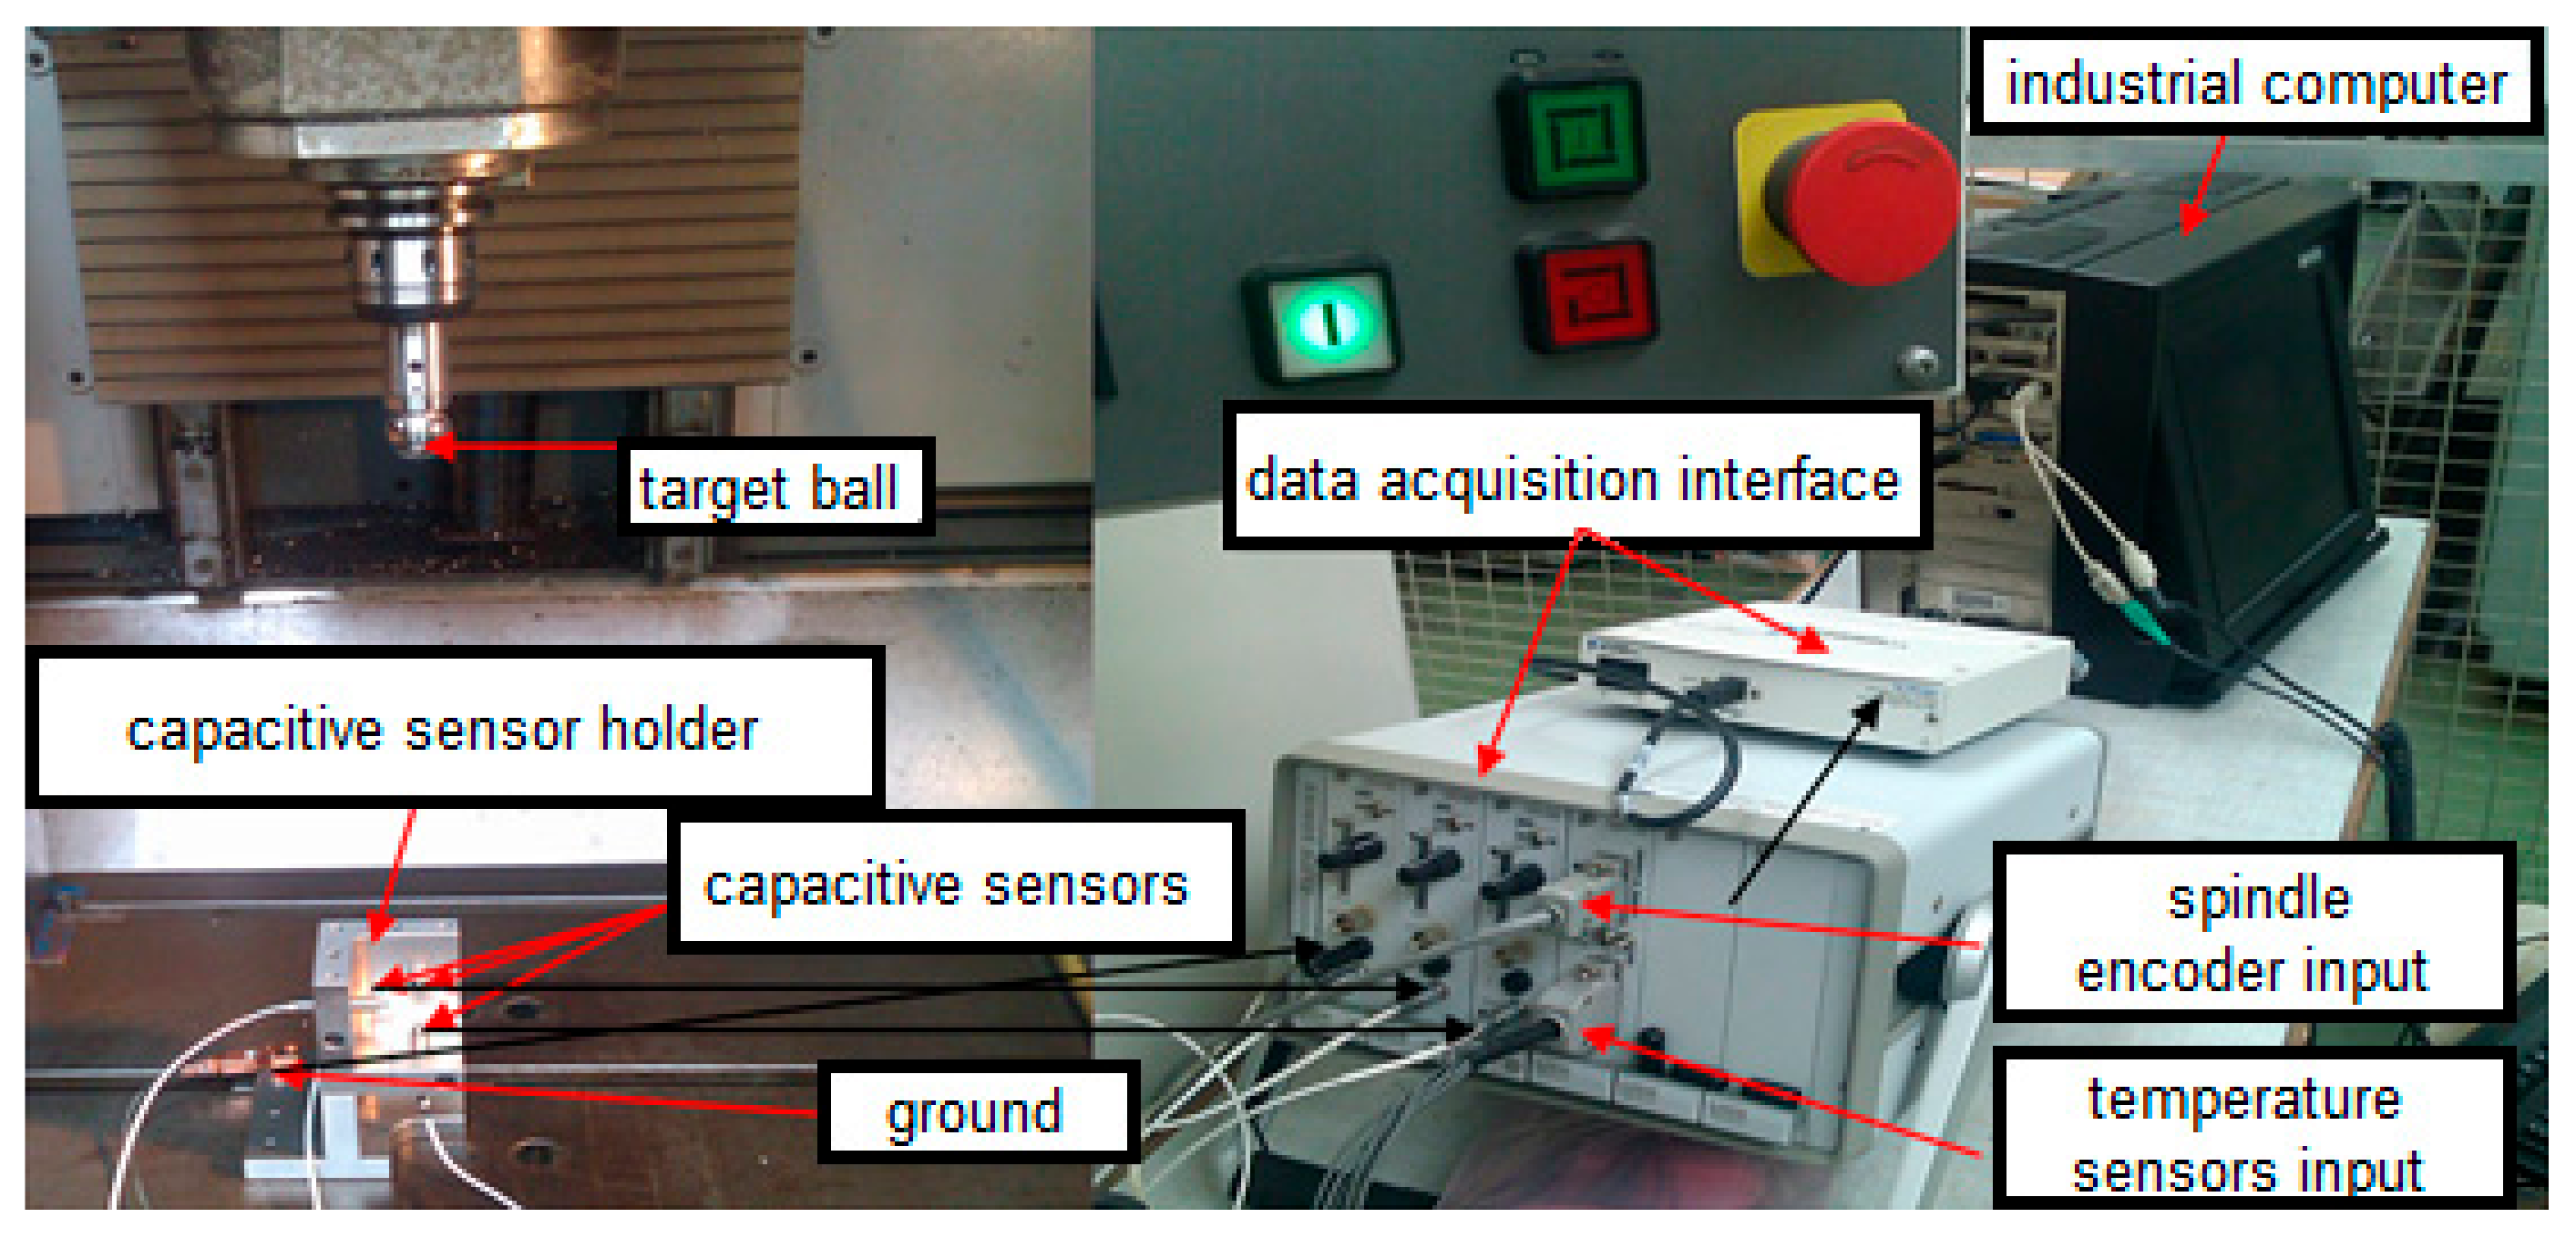
In the research and development work carried out, measurements of error movements of machine tool spindles in various technical conditions were carried out. The research used measurement equipment from a commercial set for the analysis of spindle error movements, commercial software purchased together with the hardware, and our own ABRWS (in Polish–Analizator Błędnych Ruchów Wrzecion Szybkoobrotowych; in Enlish–Error Movements Analyzer of high-speed Spindles) software—developed at the Faculty of Production Engineering at the Warsaw University of Technology. The hardware configuration is shown in
Figure 65.
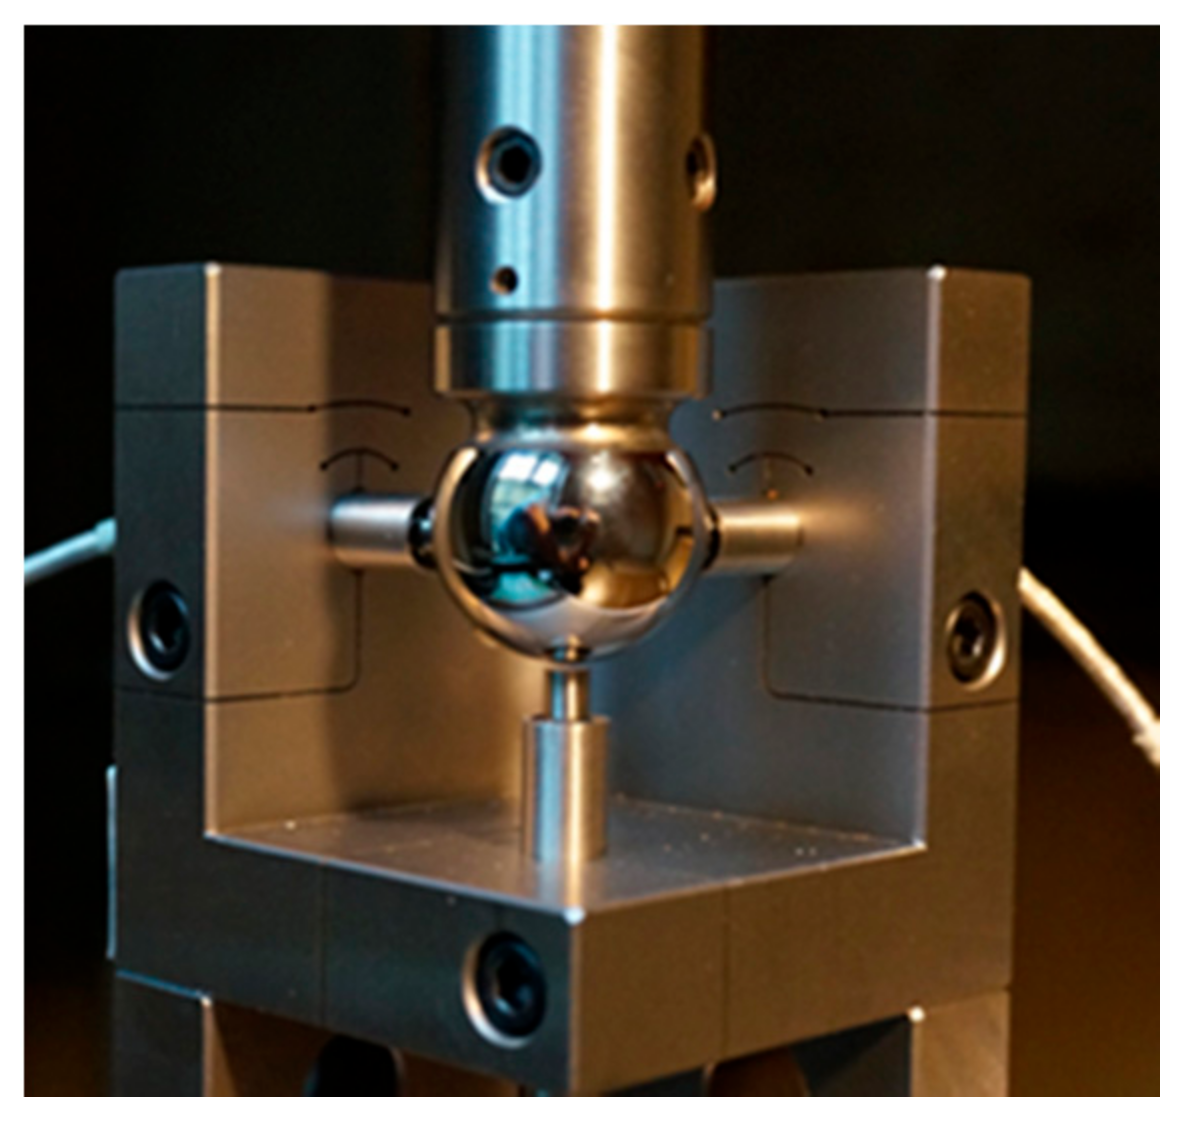
The purchased set was adapted to testing error movements of spindles of turning and milling centres at a maximum spindle speed of 30 K min
−1. The kit included a precise ball standard with shape errors negligible in relation to the tested error movements, three capacitive sensors, a preamplifier, a standard data acquisition card, and sensor mounting bases. A ball standard surrounded by sensors is shown in
Figure 66.
Setting up the measuring path, mounting and connecting the sensors, and preparing the test set were quite simple and quick. In the case of testing several machine tools, for the first one, preparation of the equipment took approximately 10 min and, then, the finished test stand was transported to the next machine tools.
Both commercial and proprietary software were used for data acquisition, analysis, and generation of results. This study describes the work with the ABRWS system. The ABRWS program was proprietary software developed for several years. Based on our own experience, operation of the program was simplified as much as possible and the measurement process was carried out automatically. According to the authors, training for a dozen or so minutes is enough to use the program. The interface is programmed so that only essential information is displayed on the computer desktop. The results of the performed measurements are displayed on the screen on an ongoing basis and simultaneously saved in a file. An example of the program start-up screen is shown in
Figure 67.
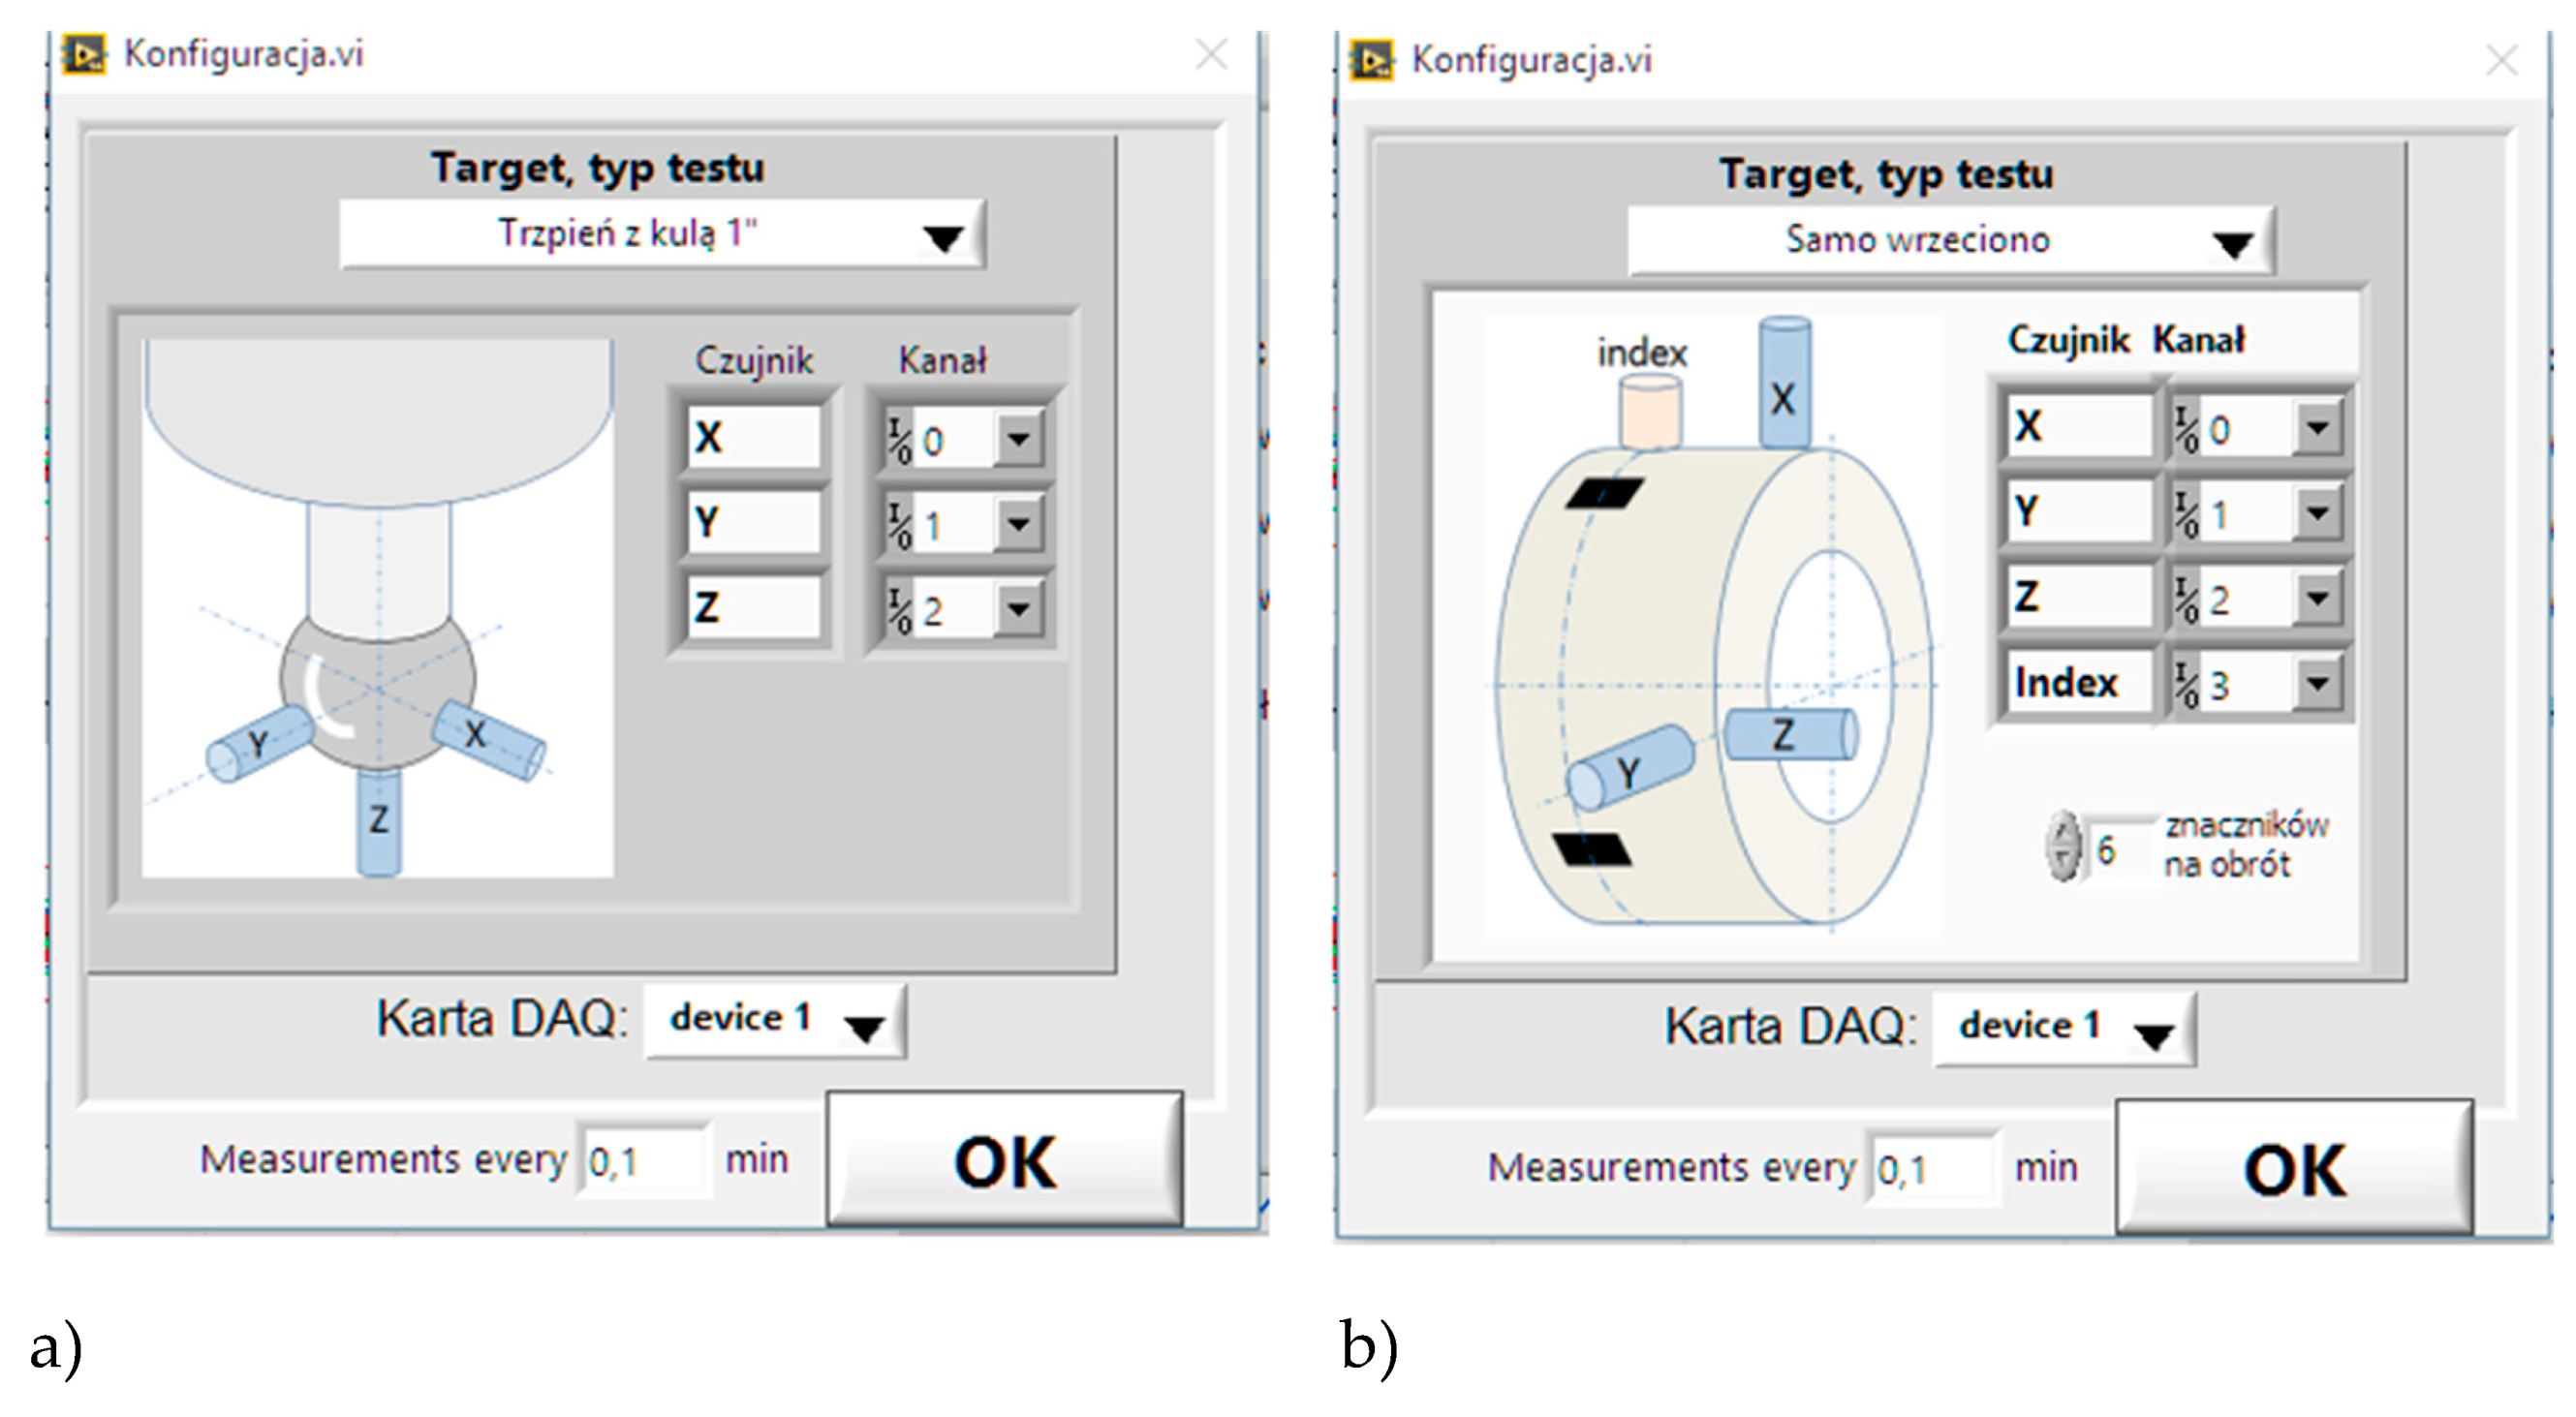
The software was written in LabView language and uses standard measurement card drivers. It is not tied to a specific hardware. It does not matter what card we have, provided that the drivers for LabView have been delivered to it (most of the available cards from different manufacturers have them) and the required parameters for testing are provided. In the configuration program option, the recognized measuring card is selected and input channels for sensors of individual axes and, optionally, a channel for an indexing sensor are set. The program includes measurements of error movements carried out without a precise reference [
49].
Figure 68 shows the configuration menu window in the basic option (
Figure 68a) and the indexing sensor used for measurements without an exact reference (
Figure 68b).
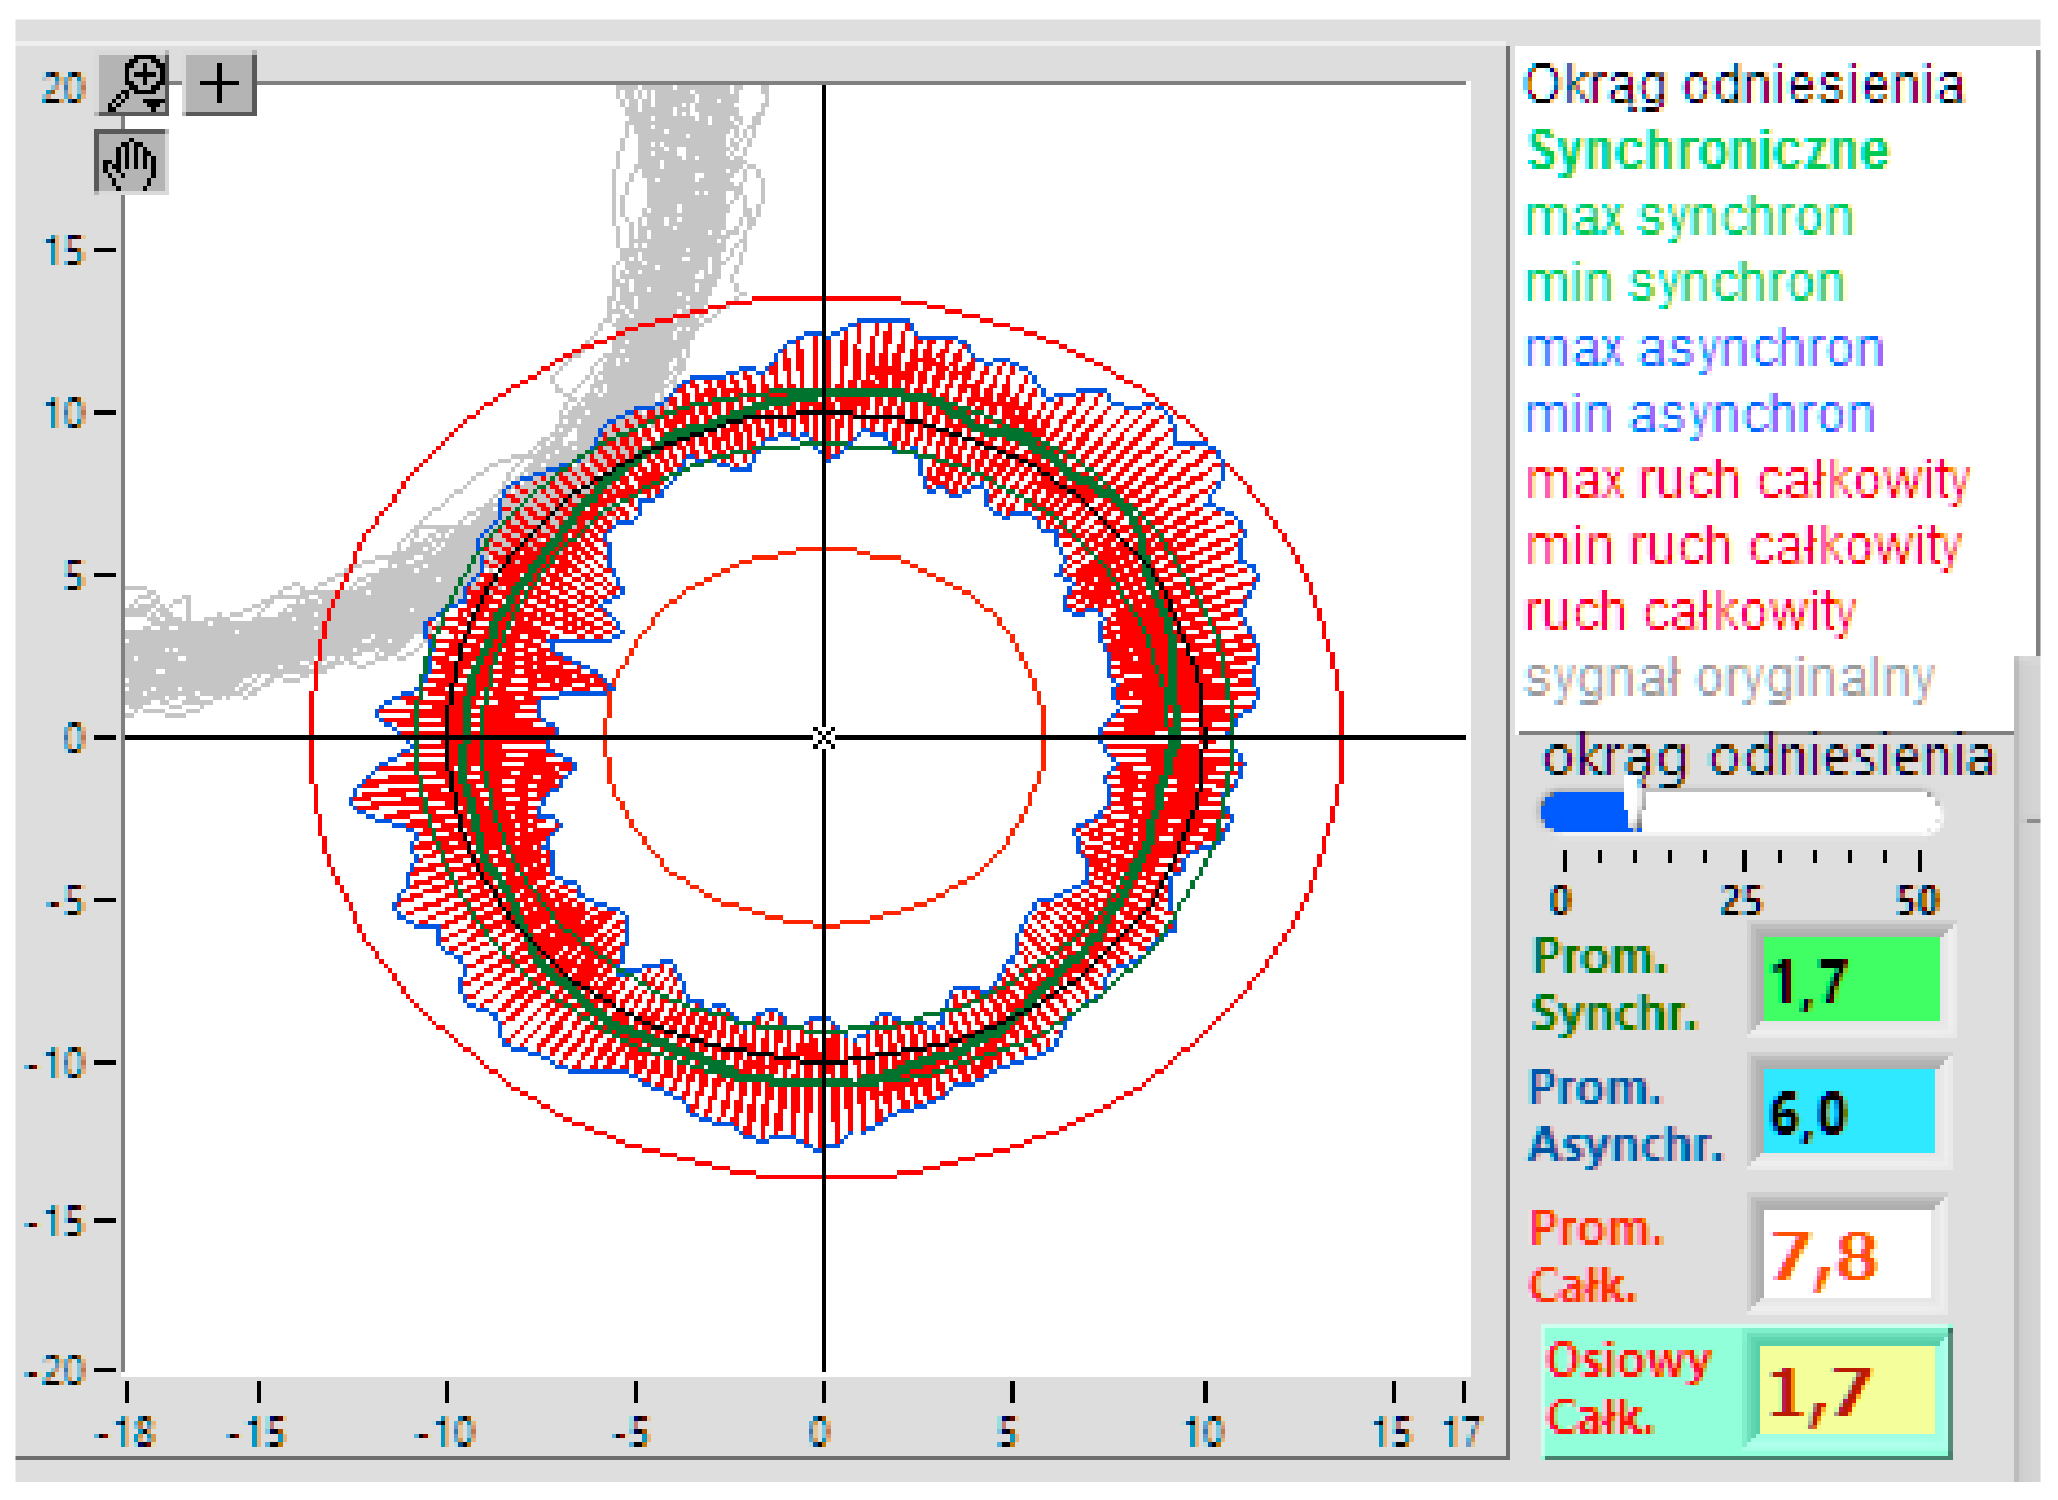
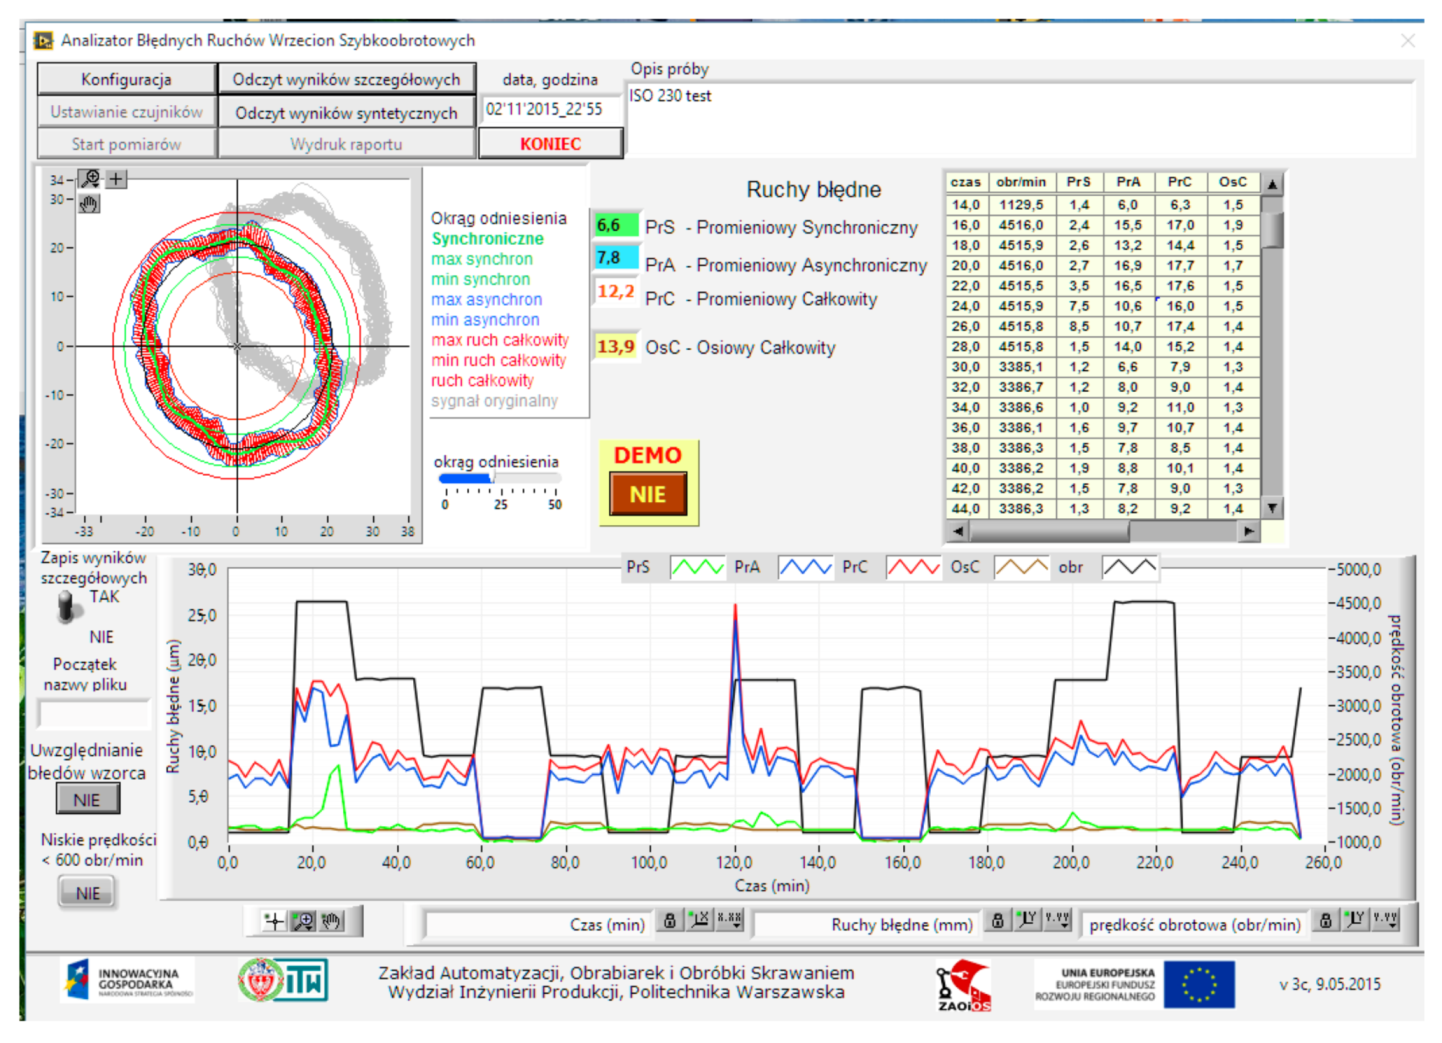
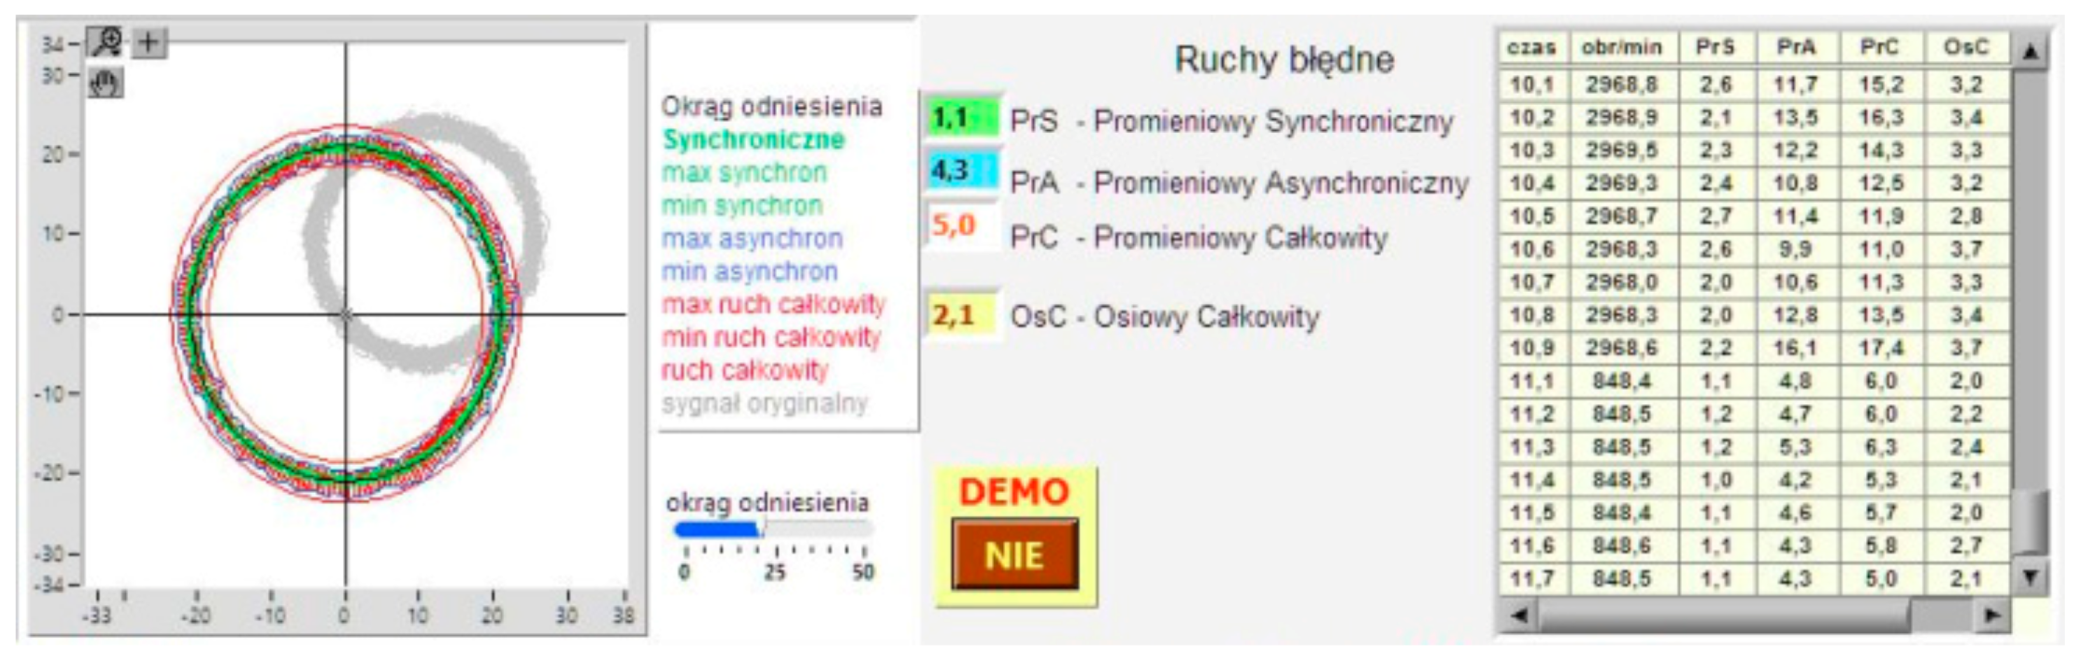
The software includes a sensor alignment routine to help the operator correctly align the sensors with the ball standard. Unlike commercial software, the DAQ card parameters are selected automatically in the background. No metrology or signal processing knowledge is required. The program automatically recognizes the spindle speed and adjusts the sample rate. The results of the current test are displayed on the screen below the main menu. An example of the polar plot, the calculated values of the individual error movements, and the table with the results of partial calculations are shown in
Figure 69.
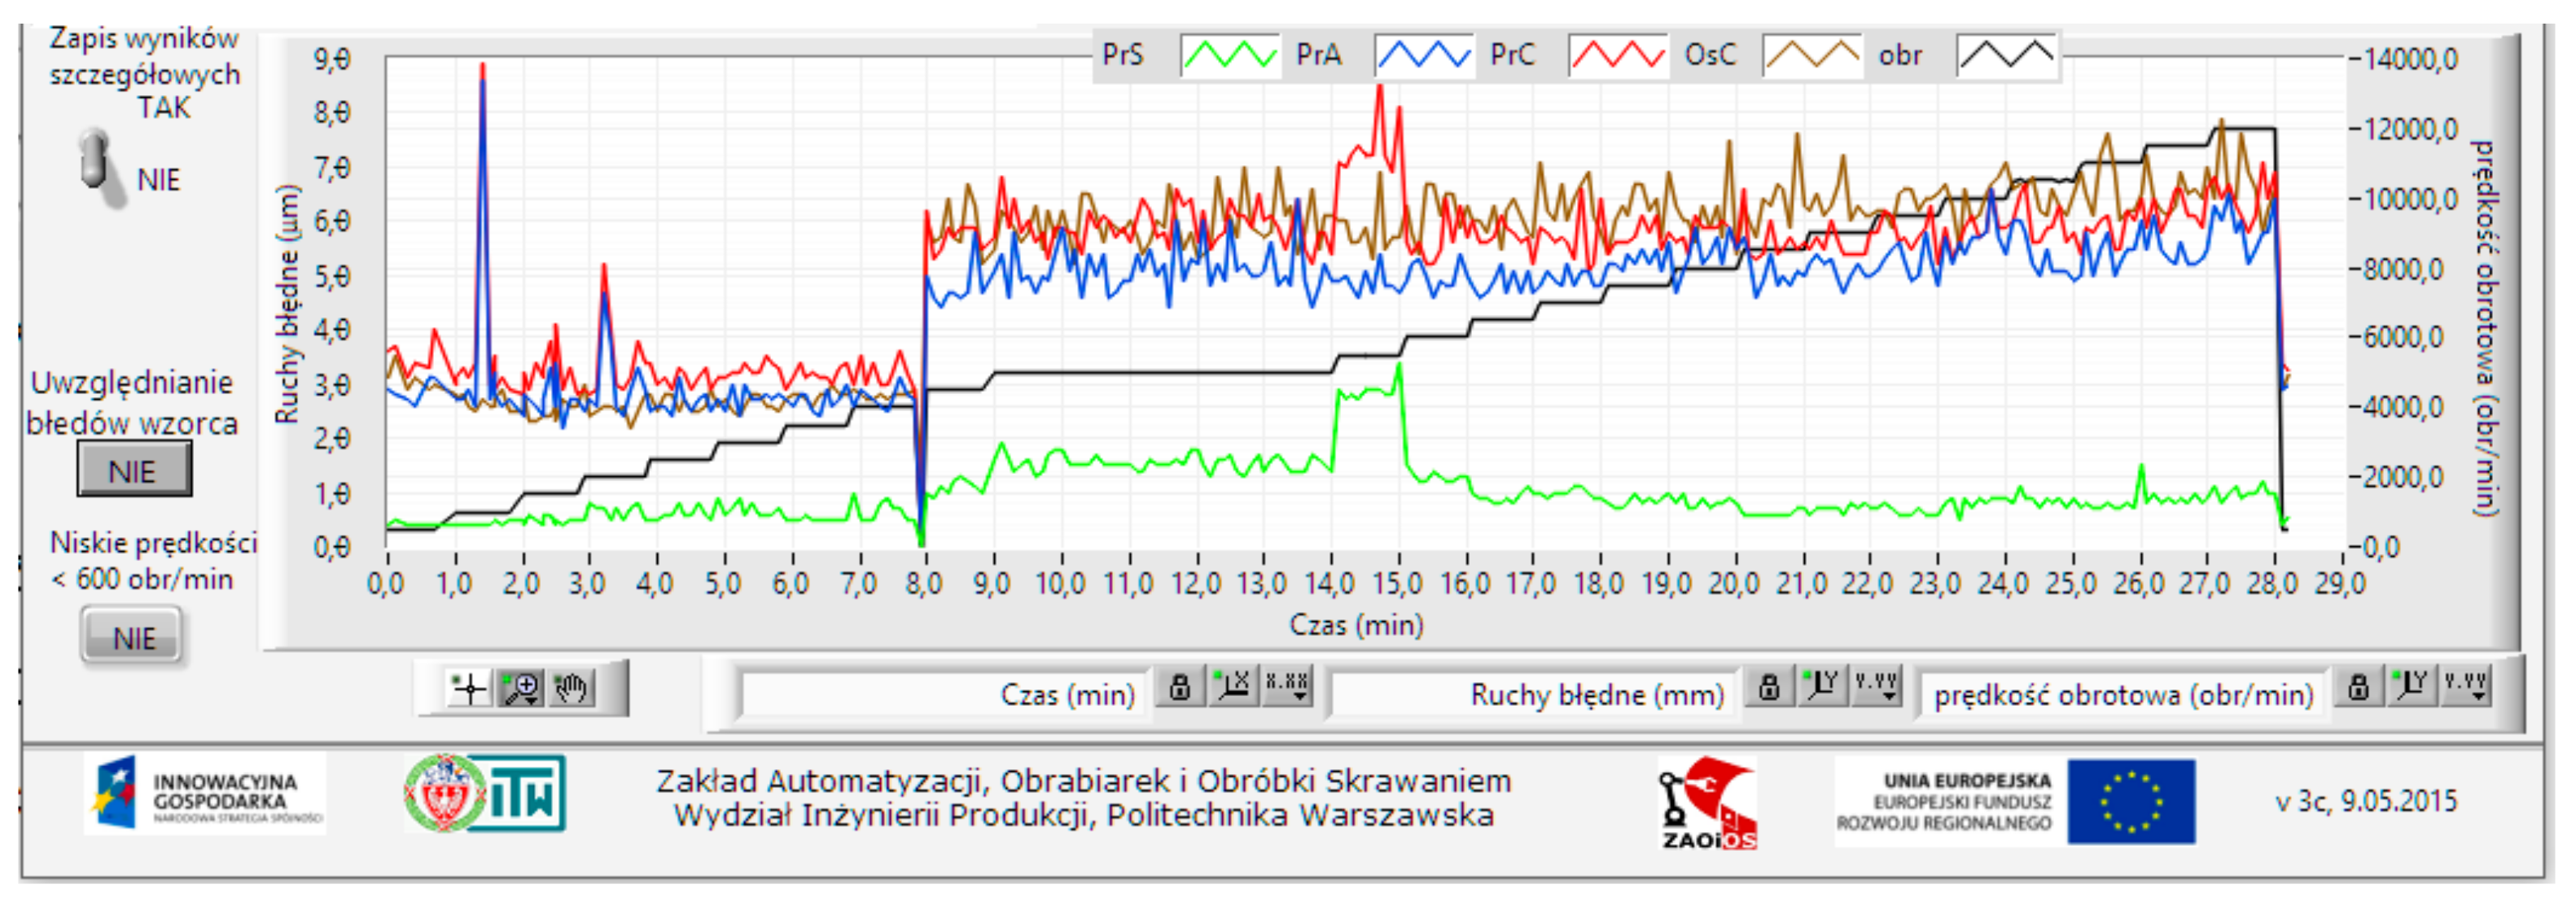
Figure 70 presents the values of the calculated individual error movements against the background of the spindle rotational speed (black line).
From the graph (
Figure 70) automatically generated during measurements at different spindle rotational speeds, it can be deduced, for example, what speeds should be avoided during machining or in what speed range we should “compact” the measurements.
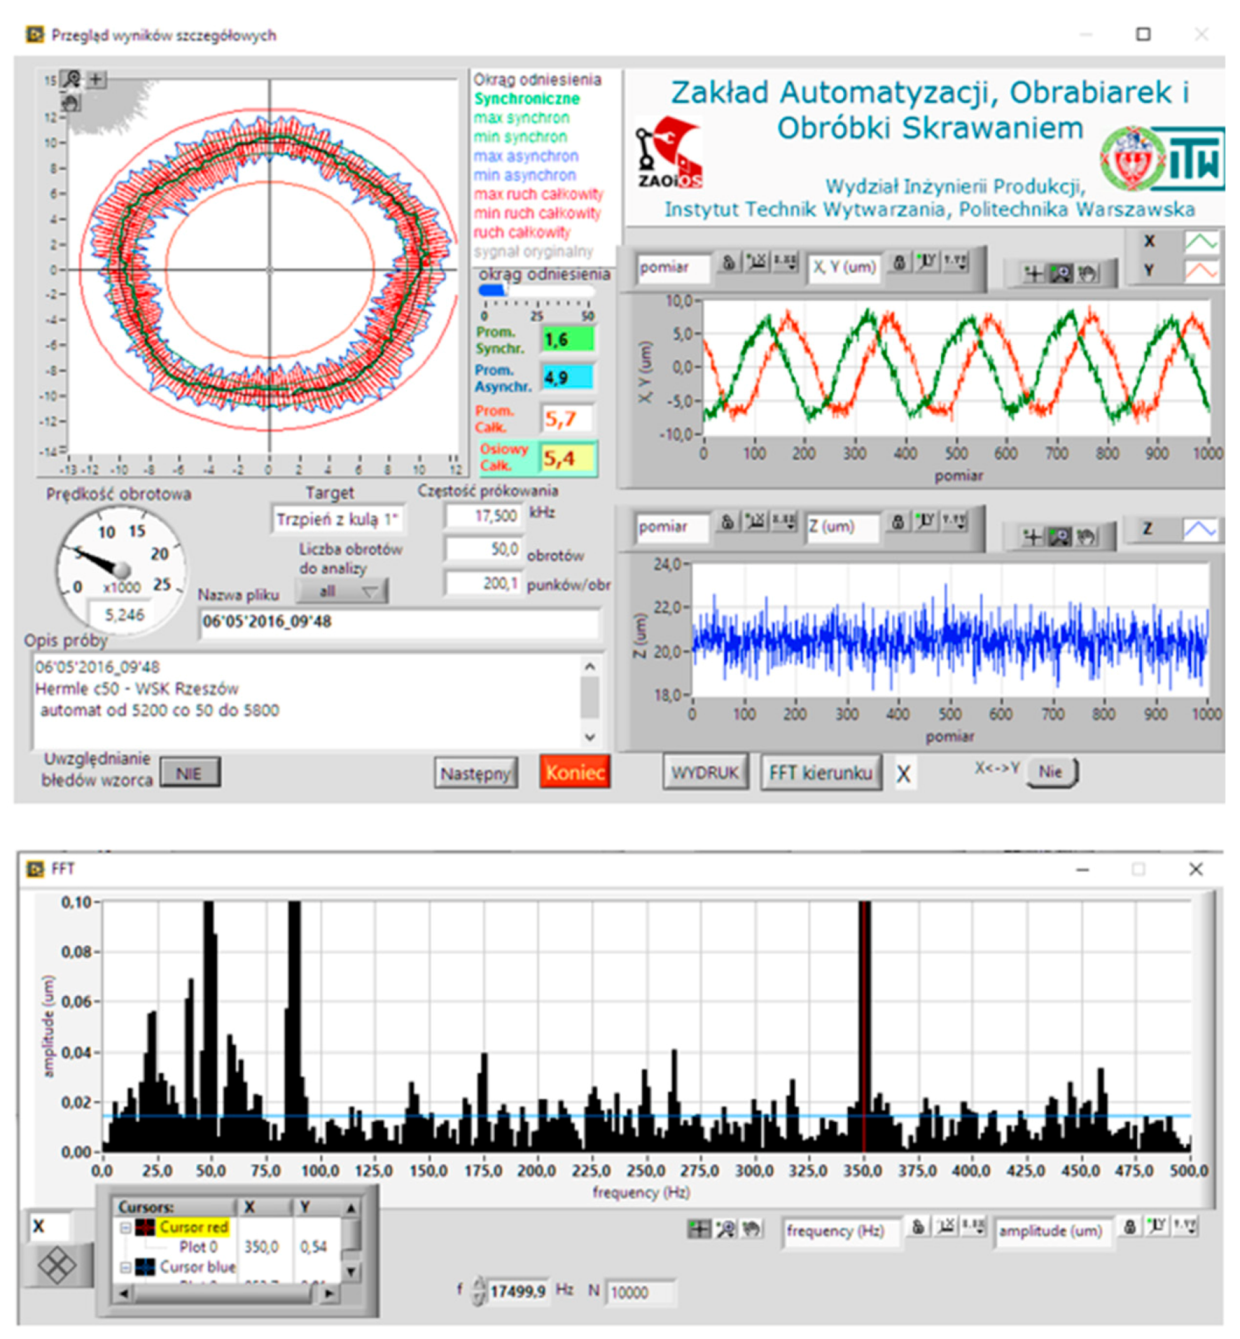
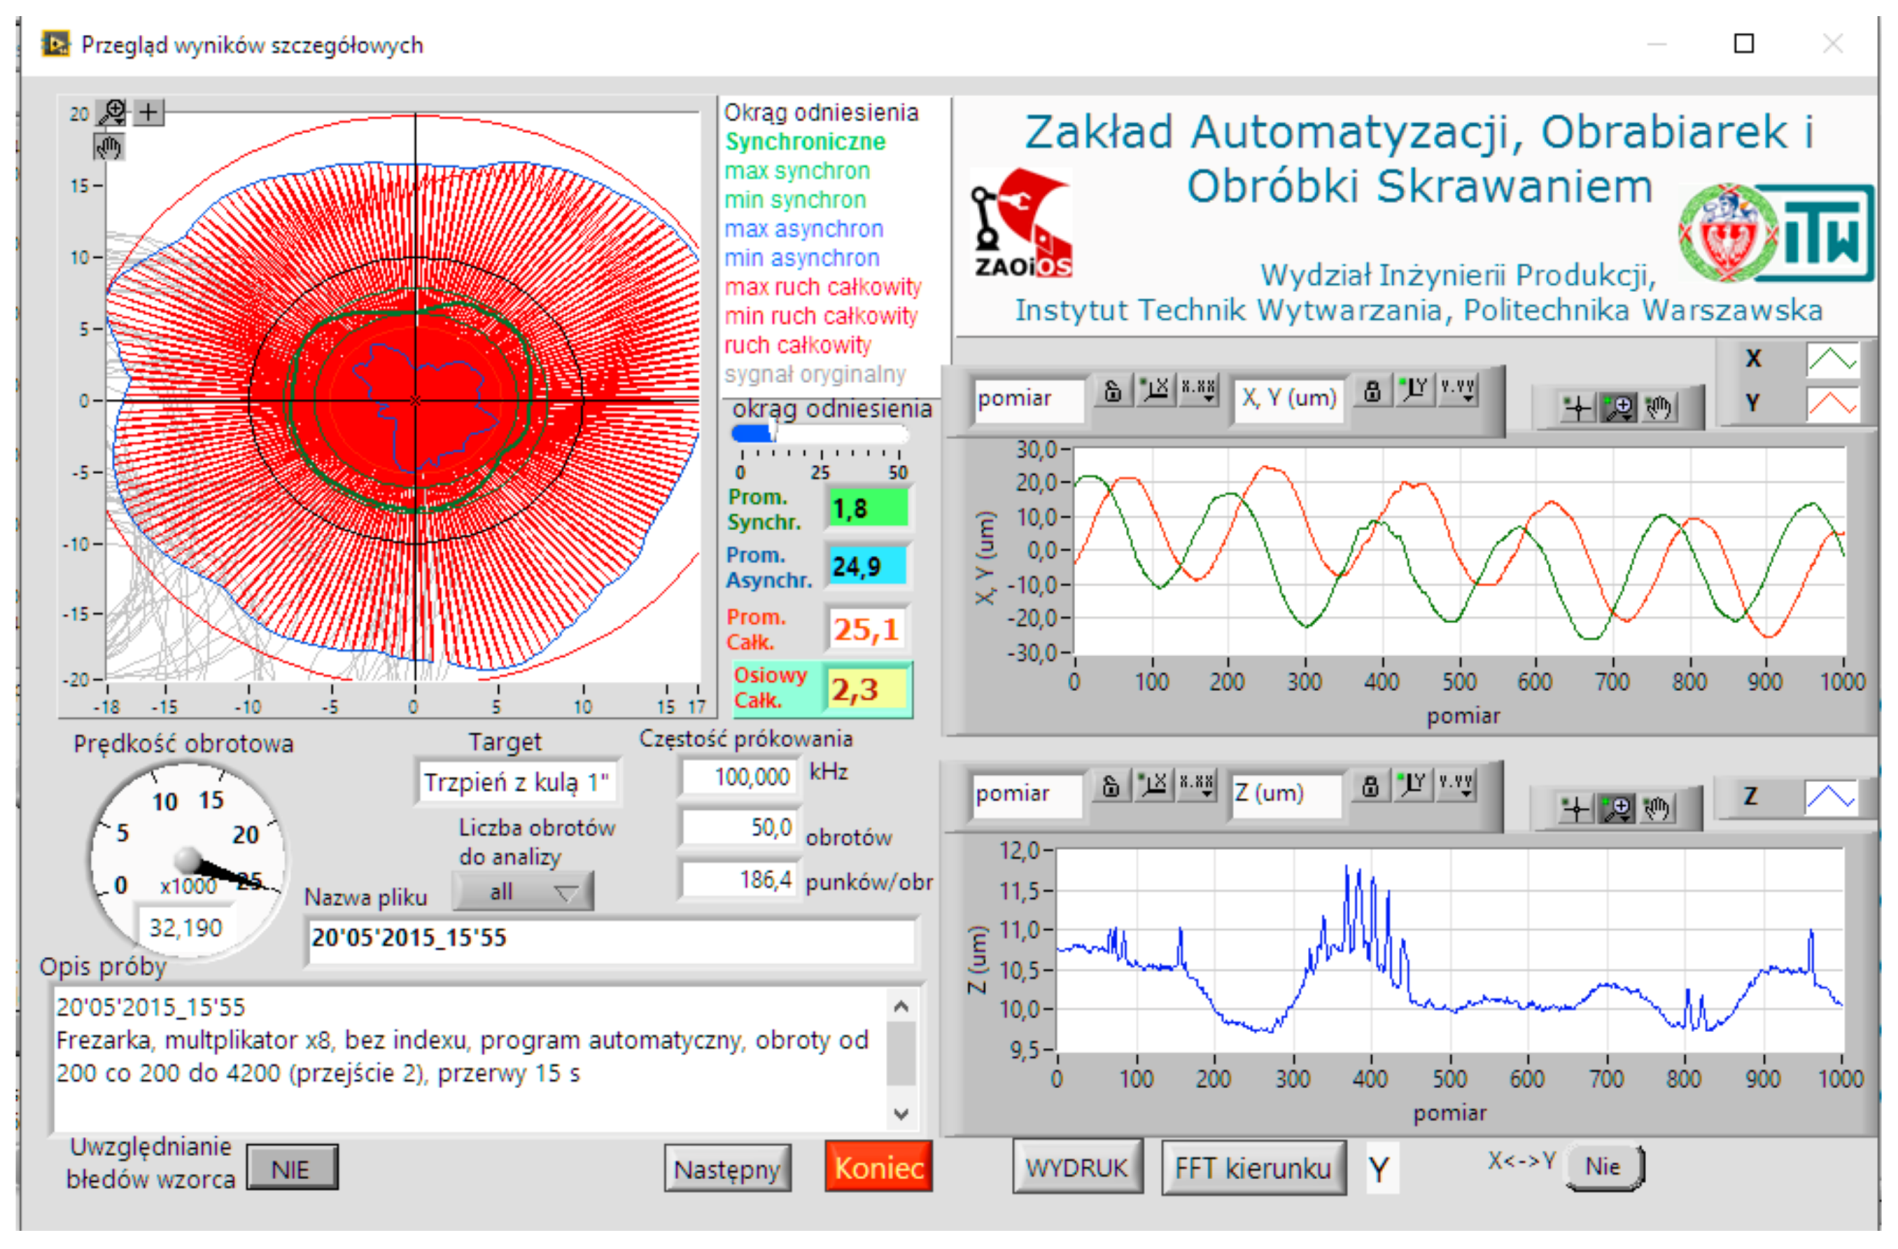
Information about the spindle condition and possible causes of problems can be inferred from analysis of the detailed results (
Figure 71).
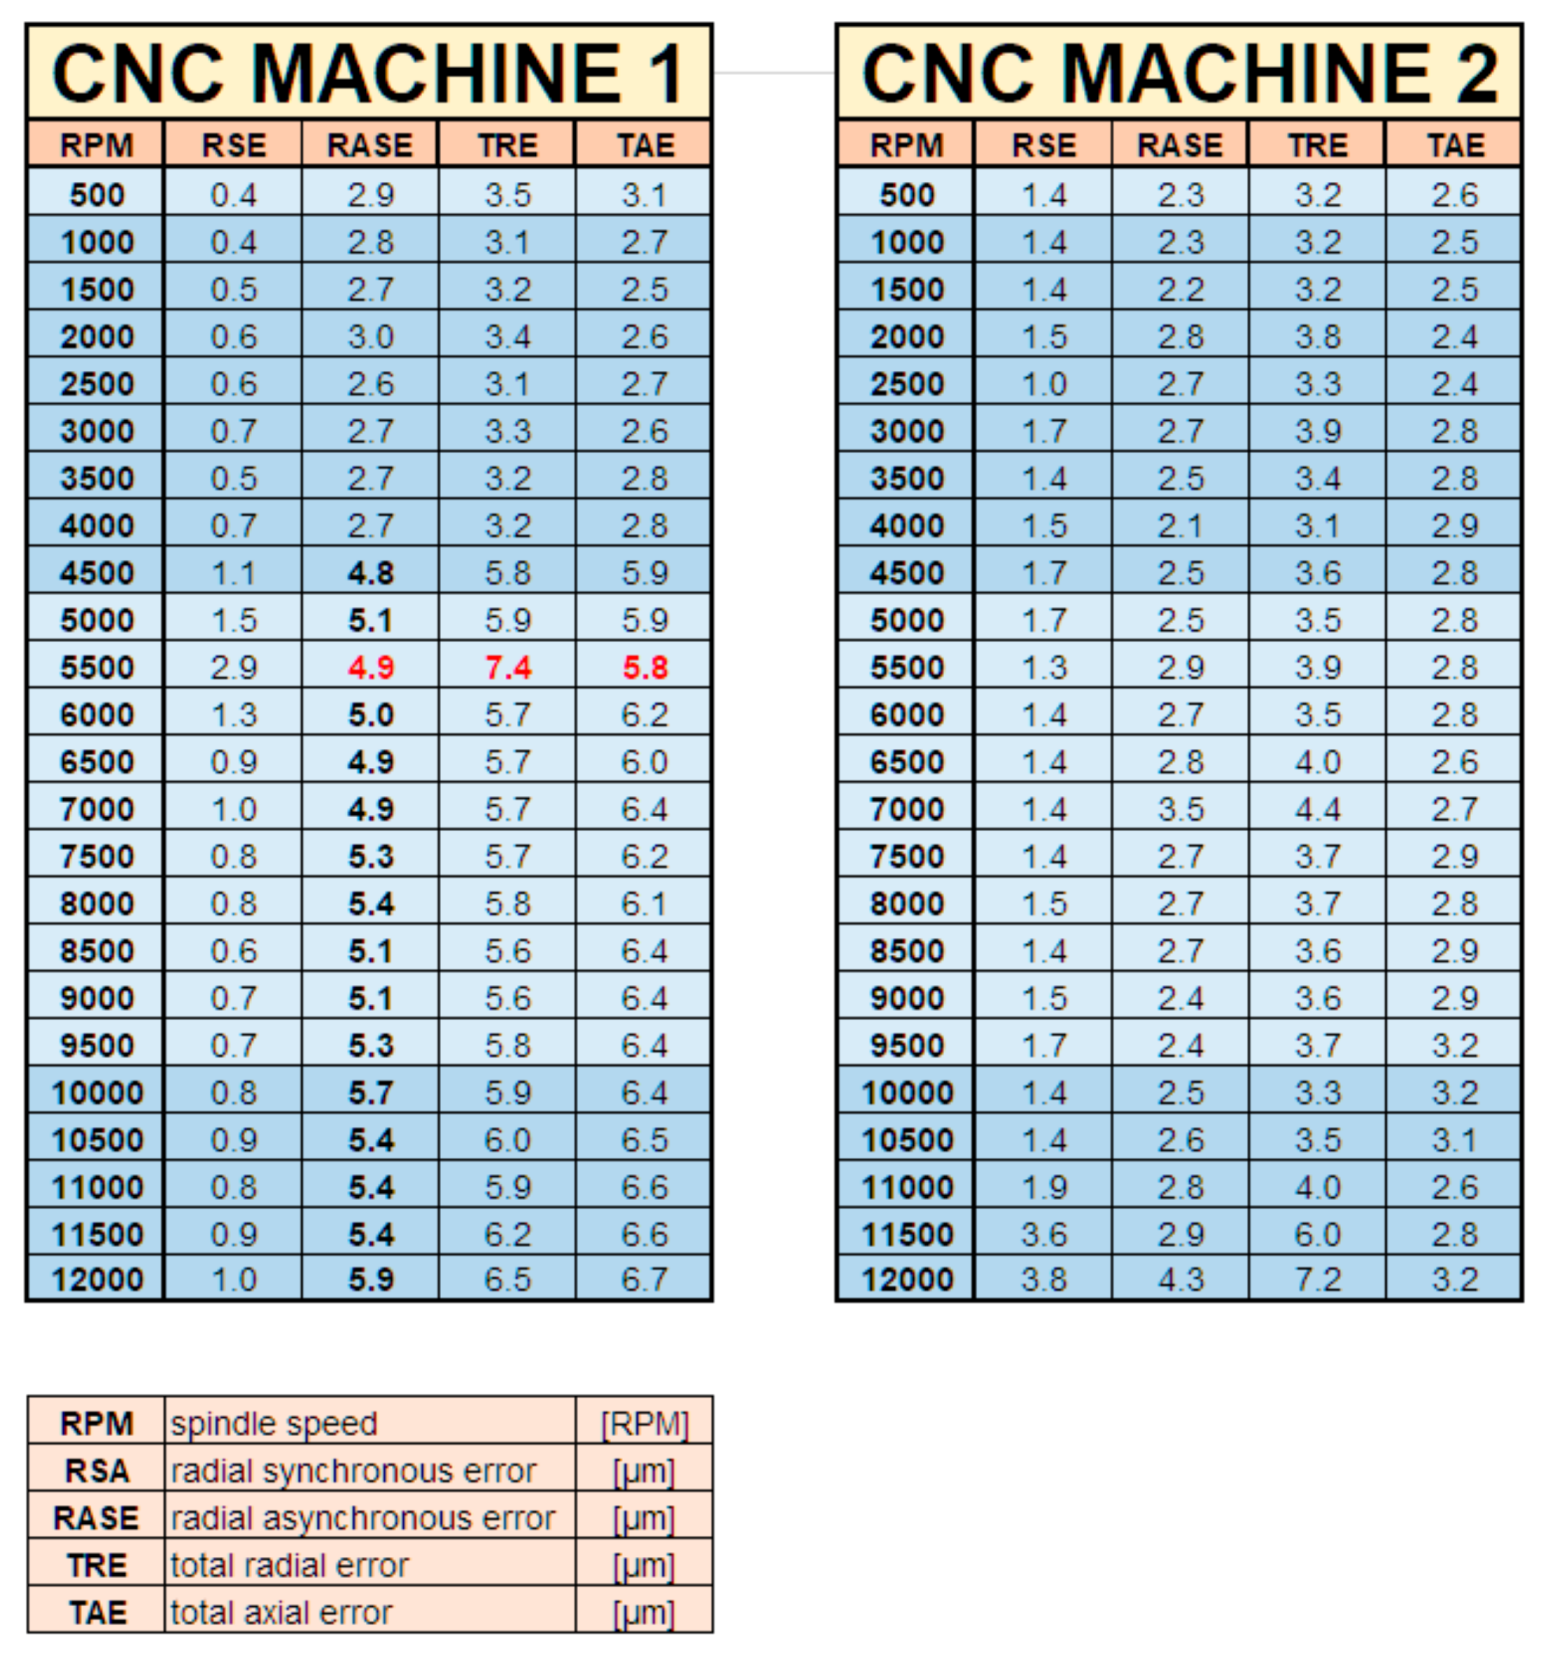
The examples presented below concern tests of several milling centres in various technical conditions.
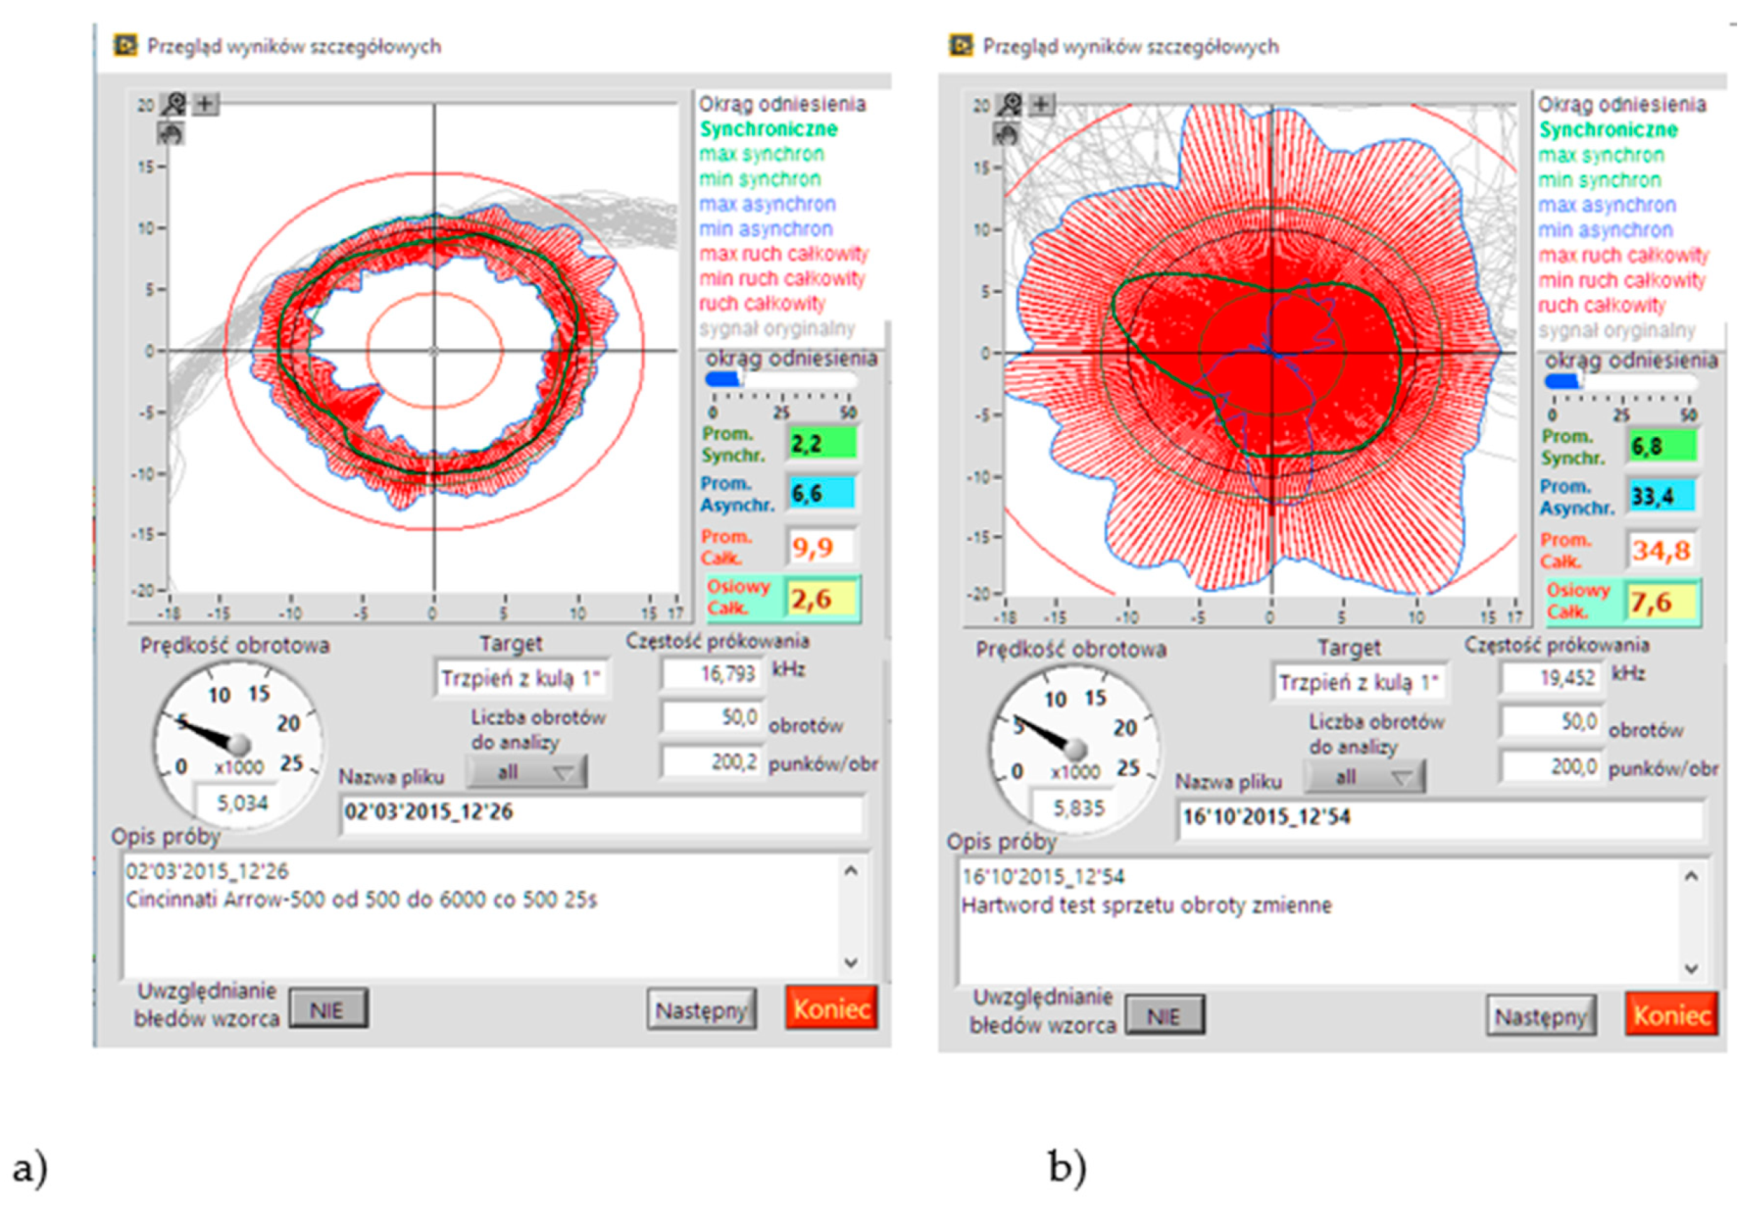
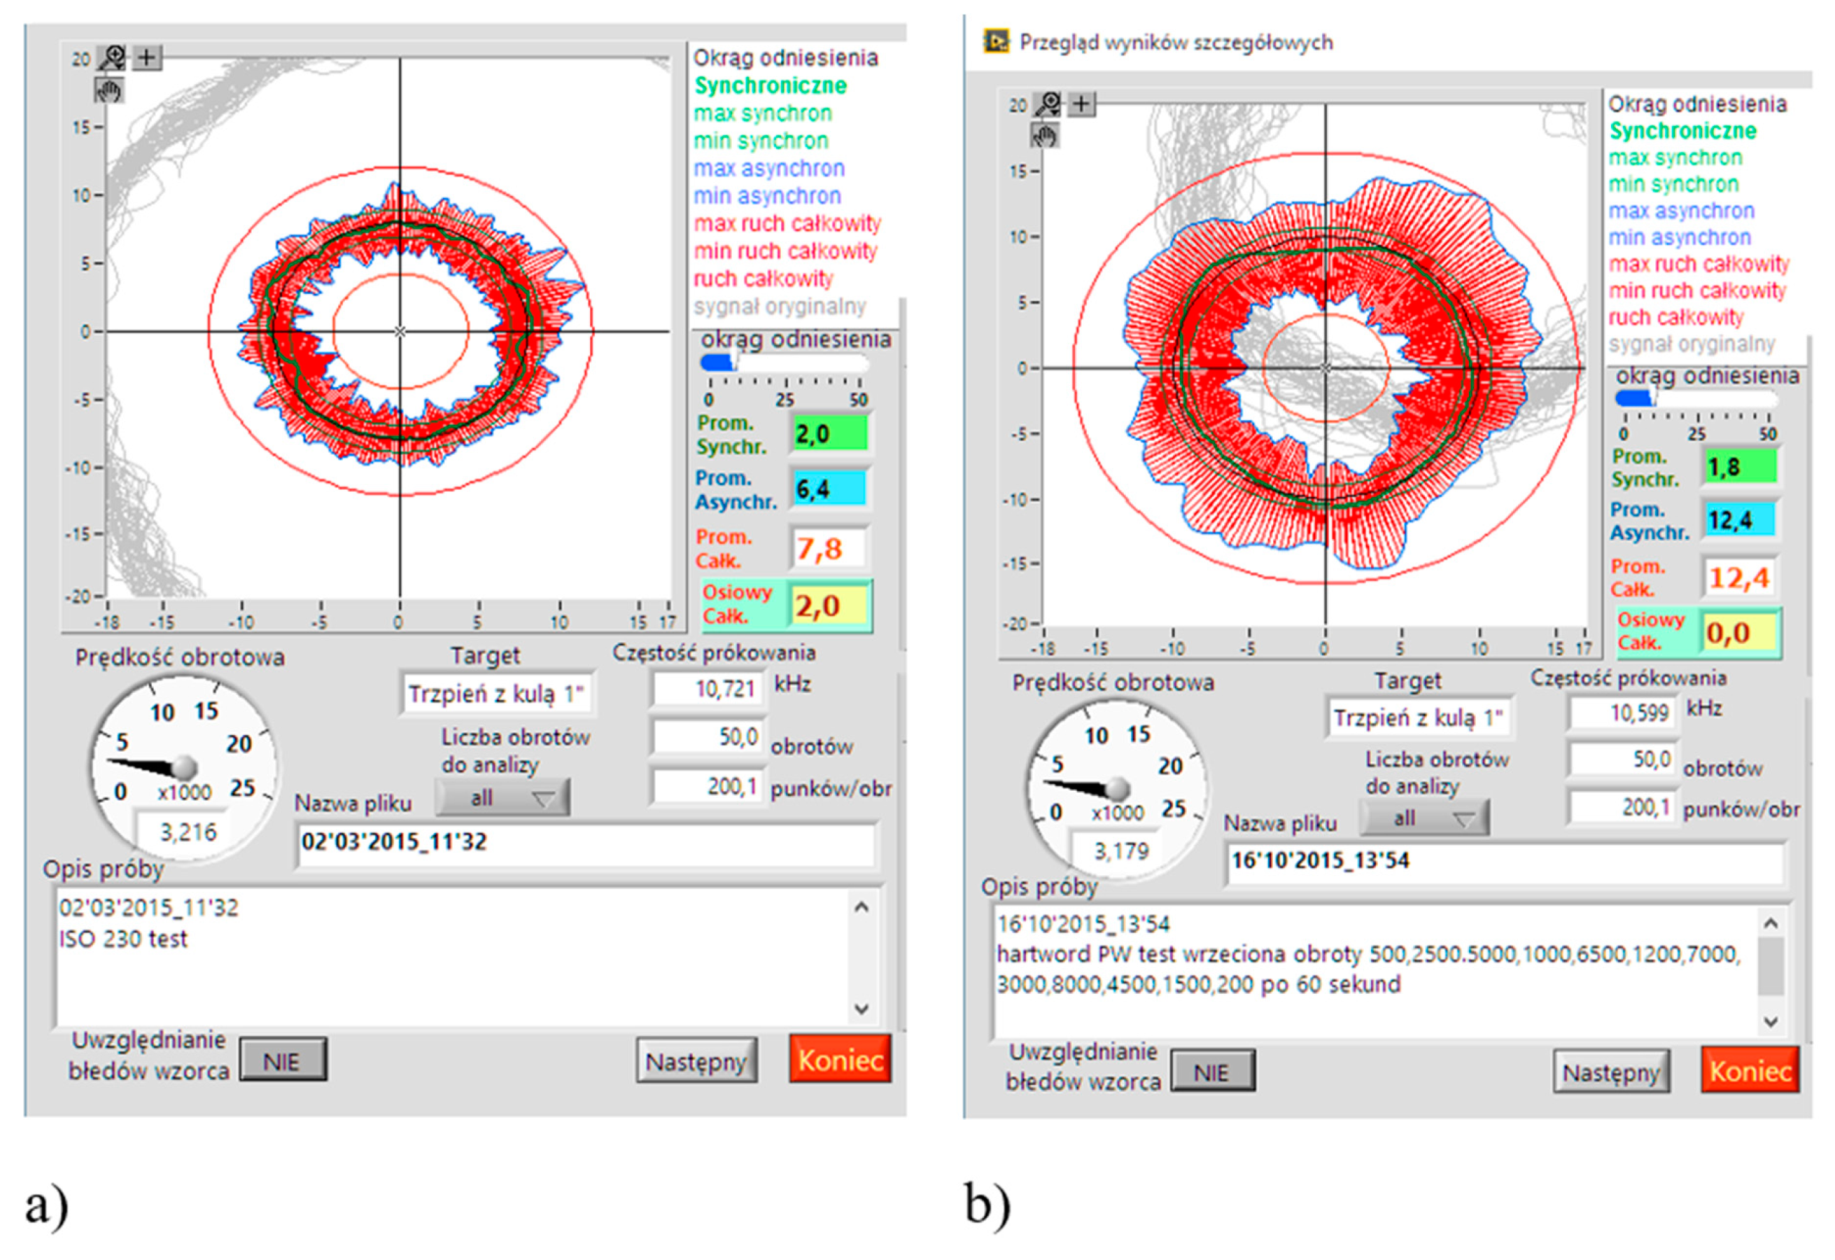
Figure 72 and
Figure 73 show the polar diagrams of the milling centre from 1998, which our institute is equipped with and which works sporadically at a rotational speed of 5000 min
−1 and 3200 min
−1. For comparison, the results of tests of a machine tool from the same year, bought from an industrial plant and working intensively for several years, were compared.
For comparison,
Figure 74 shows the results of automatic measurements of electrospindles of two similar milling centres.
The measurements of error movements of the speed multiplier mounted in the machine tool spindle were interesting. Due to the limitations of the diameter of the fixed tool, a standard with a cylindrical surface was prepared and fixed instead of a ball standard (
Figure 75).
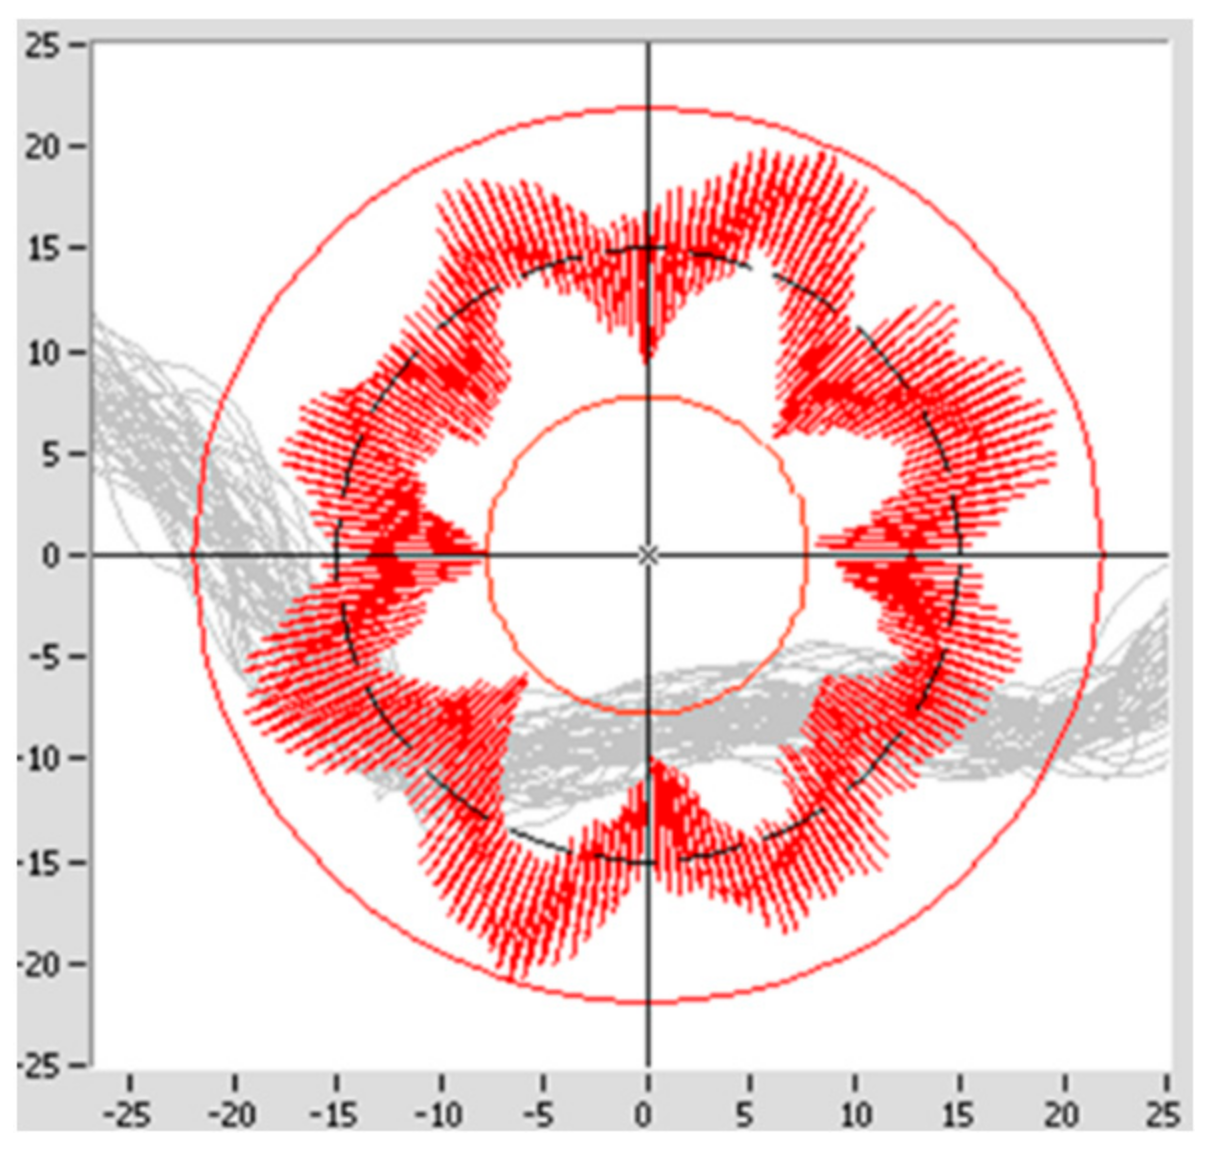
The main mechanism of the multiplier is a epicyclic gear, and as could be expected, asynchronous errors are dominant with small synchronous errors (
Figure 76).
The software was tested in industrial research. The program is being developed all the time; its possibilities are extended, for example, testing grinding spindles, where instead of a precise standard, sensors measure the inaccurate surface of the headstock [
49]. The software can perform measurements with the influence of temperature on the value of error movements. An option was prepared using a two-ball standard and 5 sensors. The authors of the program are sure that the applied algorithms and the methodology of the conducted measurements are correct. They are prepared to adapt the program to even unusual needs of a user. Reports from the program are tailored to the individual needs of the contracting company. There is a possibility of cooperation with the database.
7. Summary
The aim of this article was to present topics related to spindle error movements. Despite the fact that the spindle is an important machine tool, the condition of which affects the quality of the process (workpiece), the condition of the machine tool, and the tool’s lifespan, tests for spindle error movements, as one of the diagnostic tests of the machine tool’s condition, are not carried out as a standard. In the industry, there is a need for such tests only when there are problems maintaining the required quality of machining. Most maintenance engineers understand that it is better to prevent breakdowns by conducting periodic diagnostic tests than to remove the effects of machine tool malfunction later. However, not everyone knows that you can easily and quickly diagnose the current state of the spindle. There are ready-made kits for testing error movements on the market. The available research equipment is of very good quality and is well thought out in terms of design and ergonomics. However, commercial software requires a lot of knowledge and experience in the field of measurements as well as data acquisition and processing. The group of research centres dealing with dynamic testing of spindles is narrow, specialist knowledge is required, and measuring equipment are expensive, constituting the reasons for the monopoly of several companies on the global market. Undoubtedly, [
1] remains the basic literature in this area. A dozen or so literature from scientific journals—of which only those items which, according to the authors, were the most interesting were cited—allow to notice several trends in research. Most of the described tests are typically laboratory tests that are rarely used in industrial measurements.
By deciding on a commercial set, the user must trust the company that produced it. Our own research presented in this article aimed to check the concept developed at the Warsaw University of Technology and to compare the results of measurements carried out with a commercial set. It was noticed that the polar diagrams generated on the basis of calculations from commercial software were not correct. However, it does not change the fact that they are useful for diagnostics in machine tool spindles. A change in the spindle state will be reflected in an increase in the values calculated by the program.
Our own software developed has the advantage that it works in a fully automatic way, independently adjusting the measuring card settings to the actual spindle rotational speed. A moderately educated technician should be able to independently carry out the measurements.
It should also be emphasized that the tests of spindle error movements are performed on an unloaded machine tool—when there are no cutting forces. The test result does not take into account, e.g., machine tool stiffness, backlashes on guides, or longitudinal backlashes of a spindle. Work is underway for measuring spindle error movements under load, but so far, there is no commercial measurement set simulating the operation and value of forces during machining.


