
Effect of Micro Solidification Crack on Mechanical Performance of Remote Laser Welded AA6063-T6 Fillet Lap Joint in Automotive Battery Tray Construction


Abstract
:1. Introduction
2. Materials and Methods
2.1. Welding Procedures
2.2. Weld Morphology Characterisation
2.3. Mechanical Characterization
3. Results and Discussion
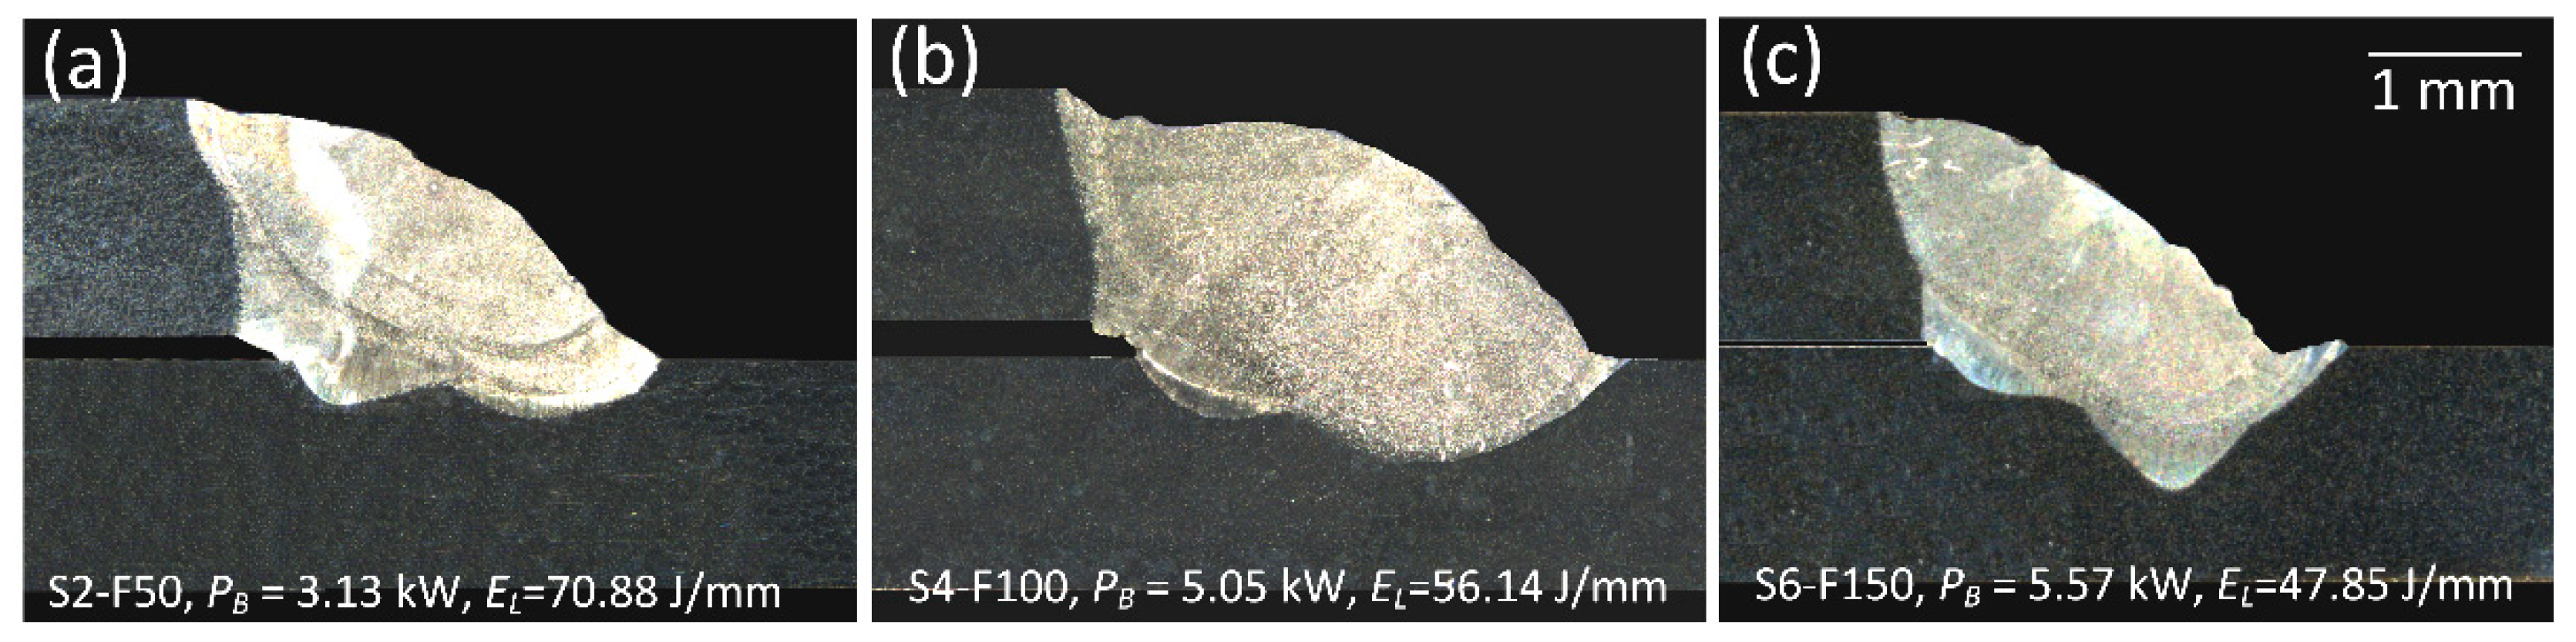
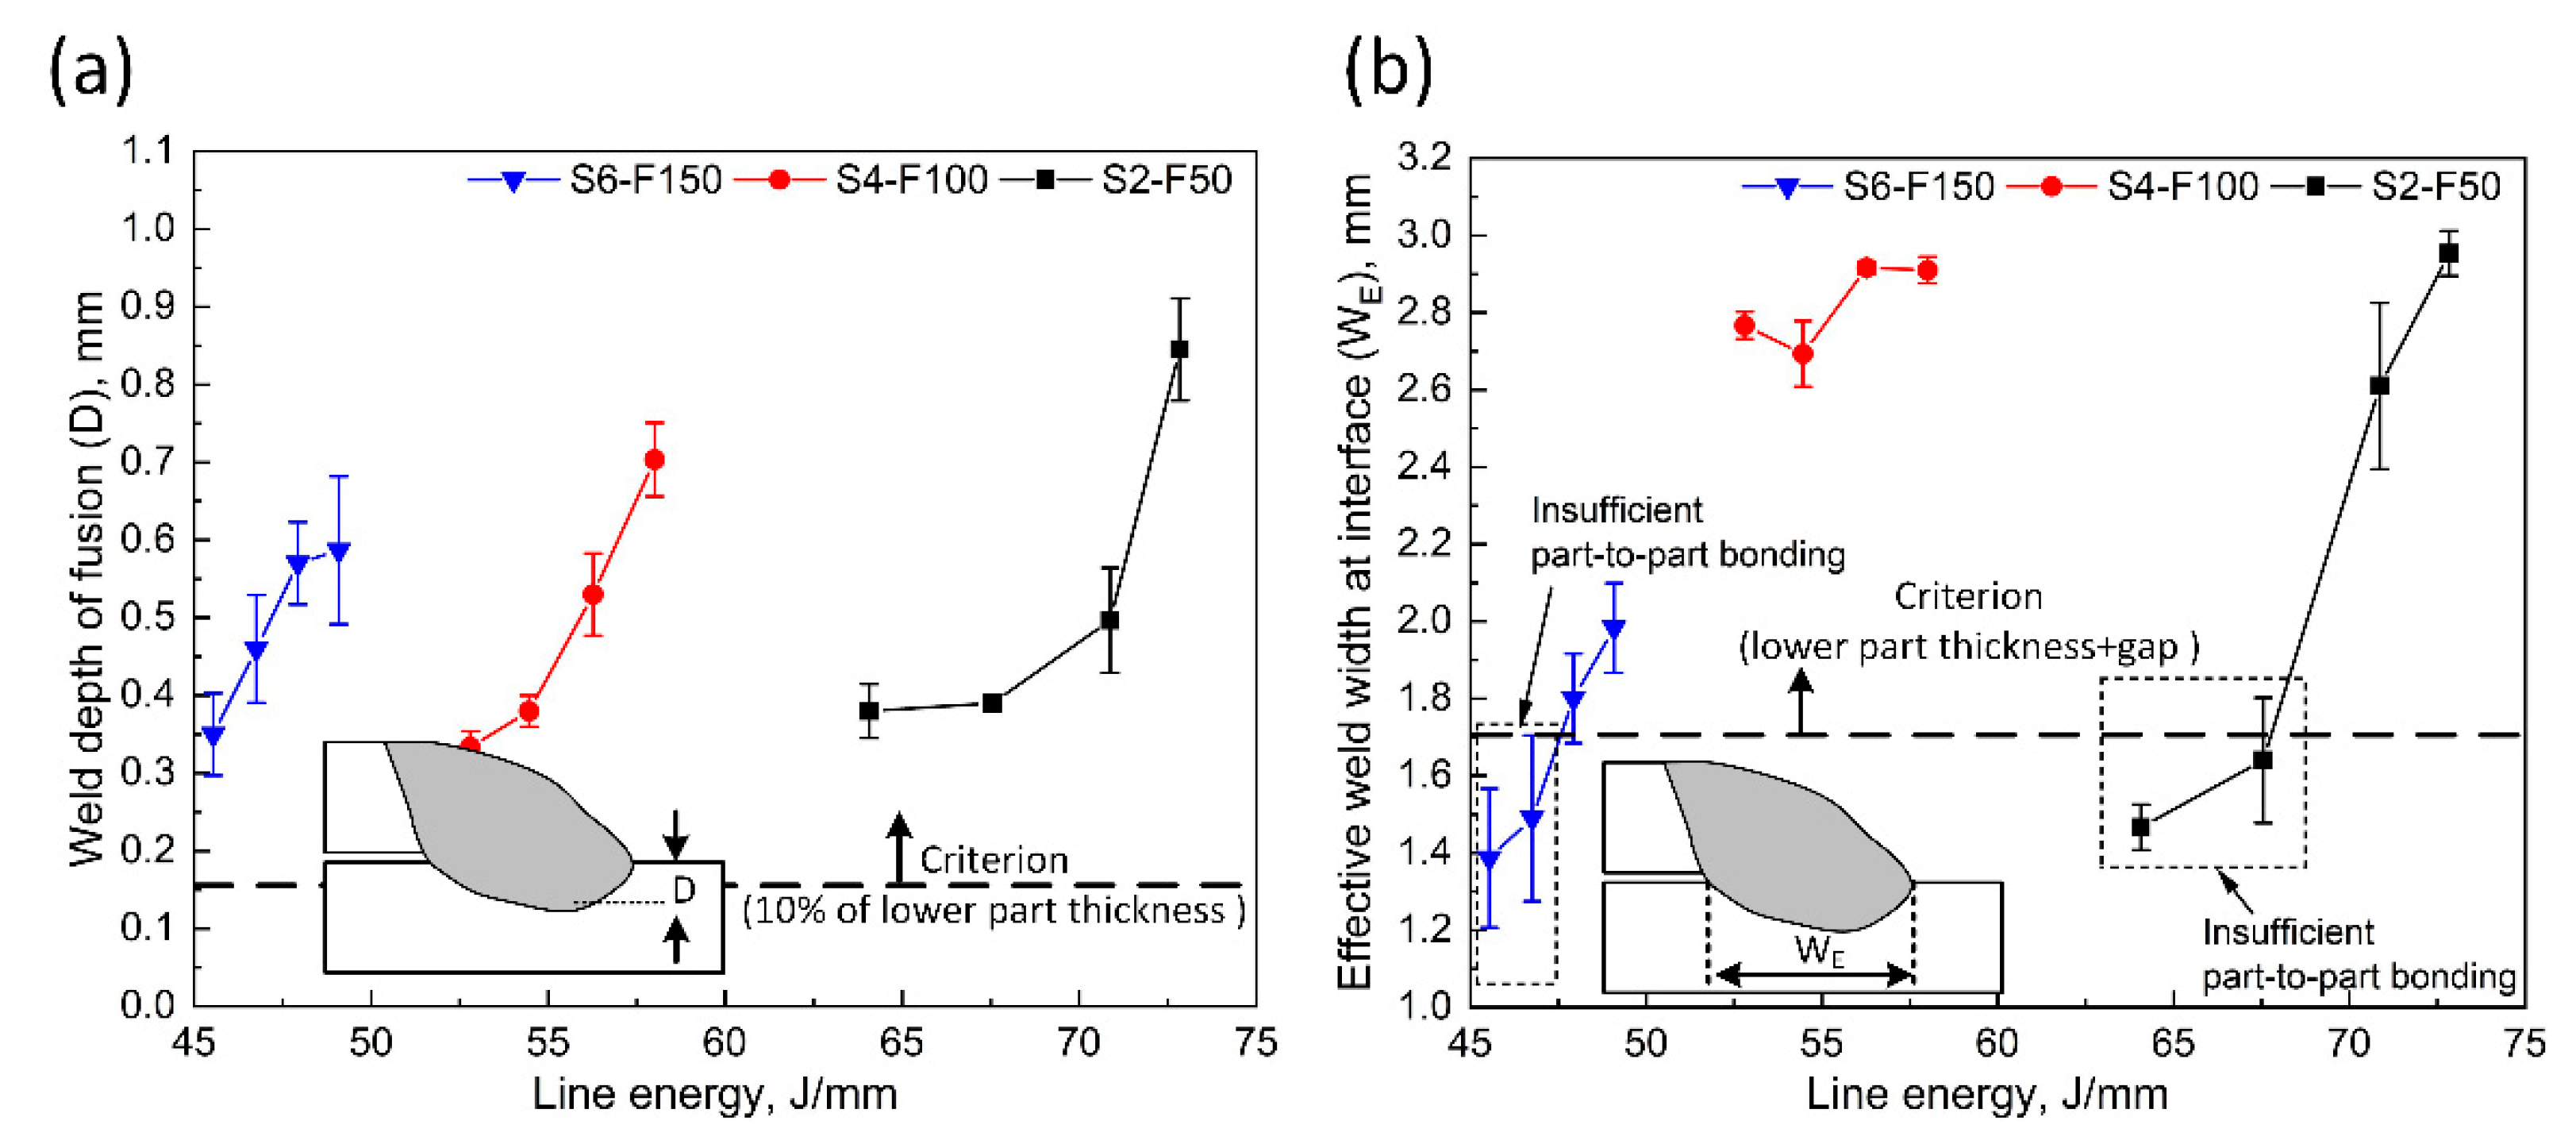
3.1. Weld Shape
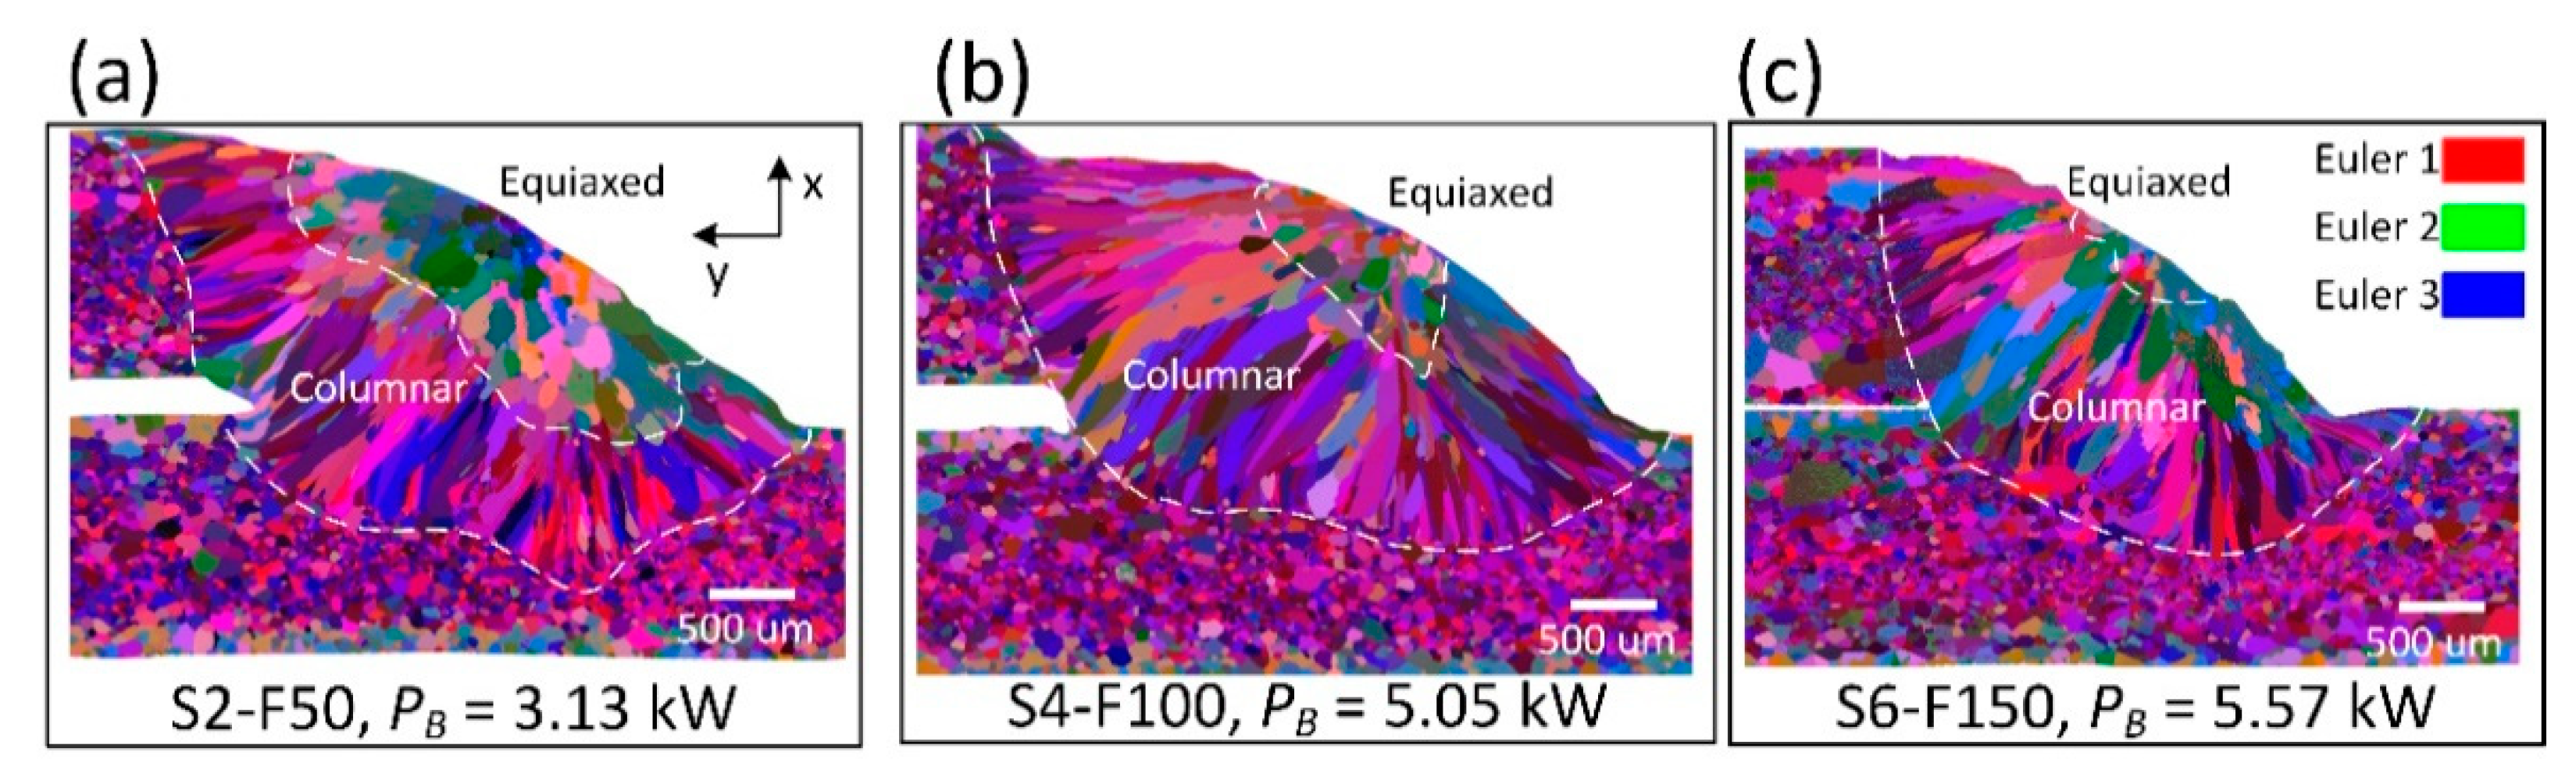
3.2. Weld Zone Grain Morphology
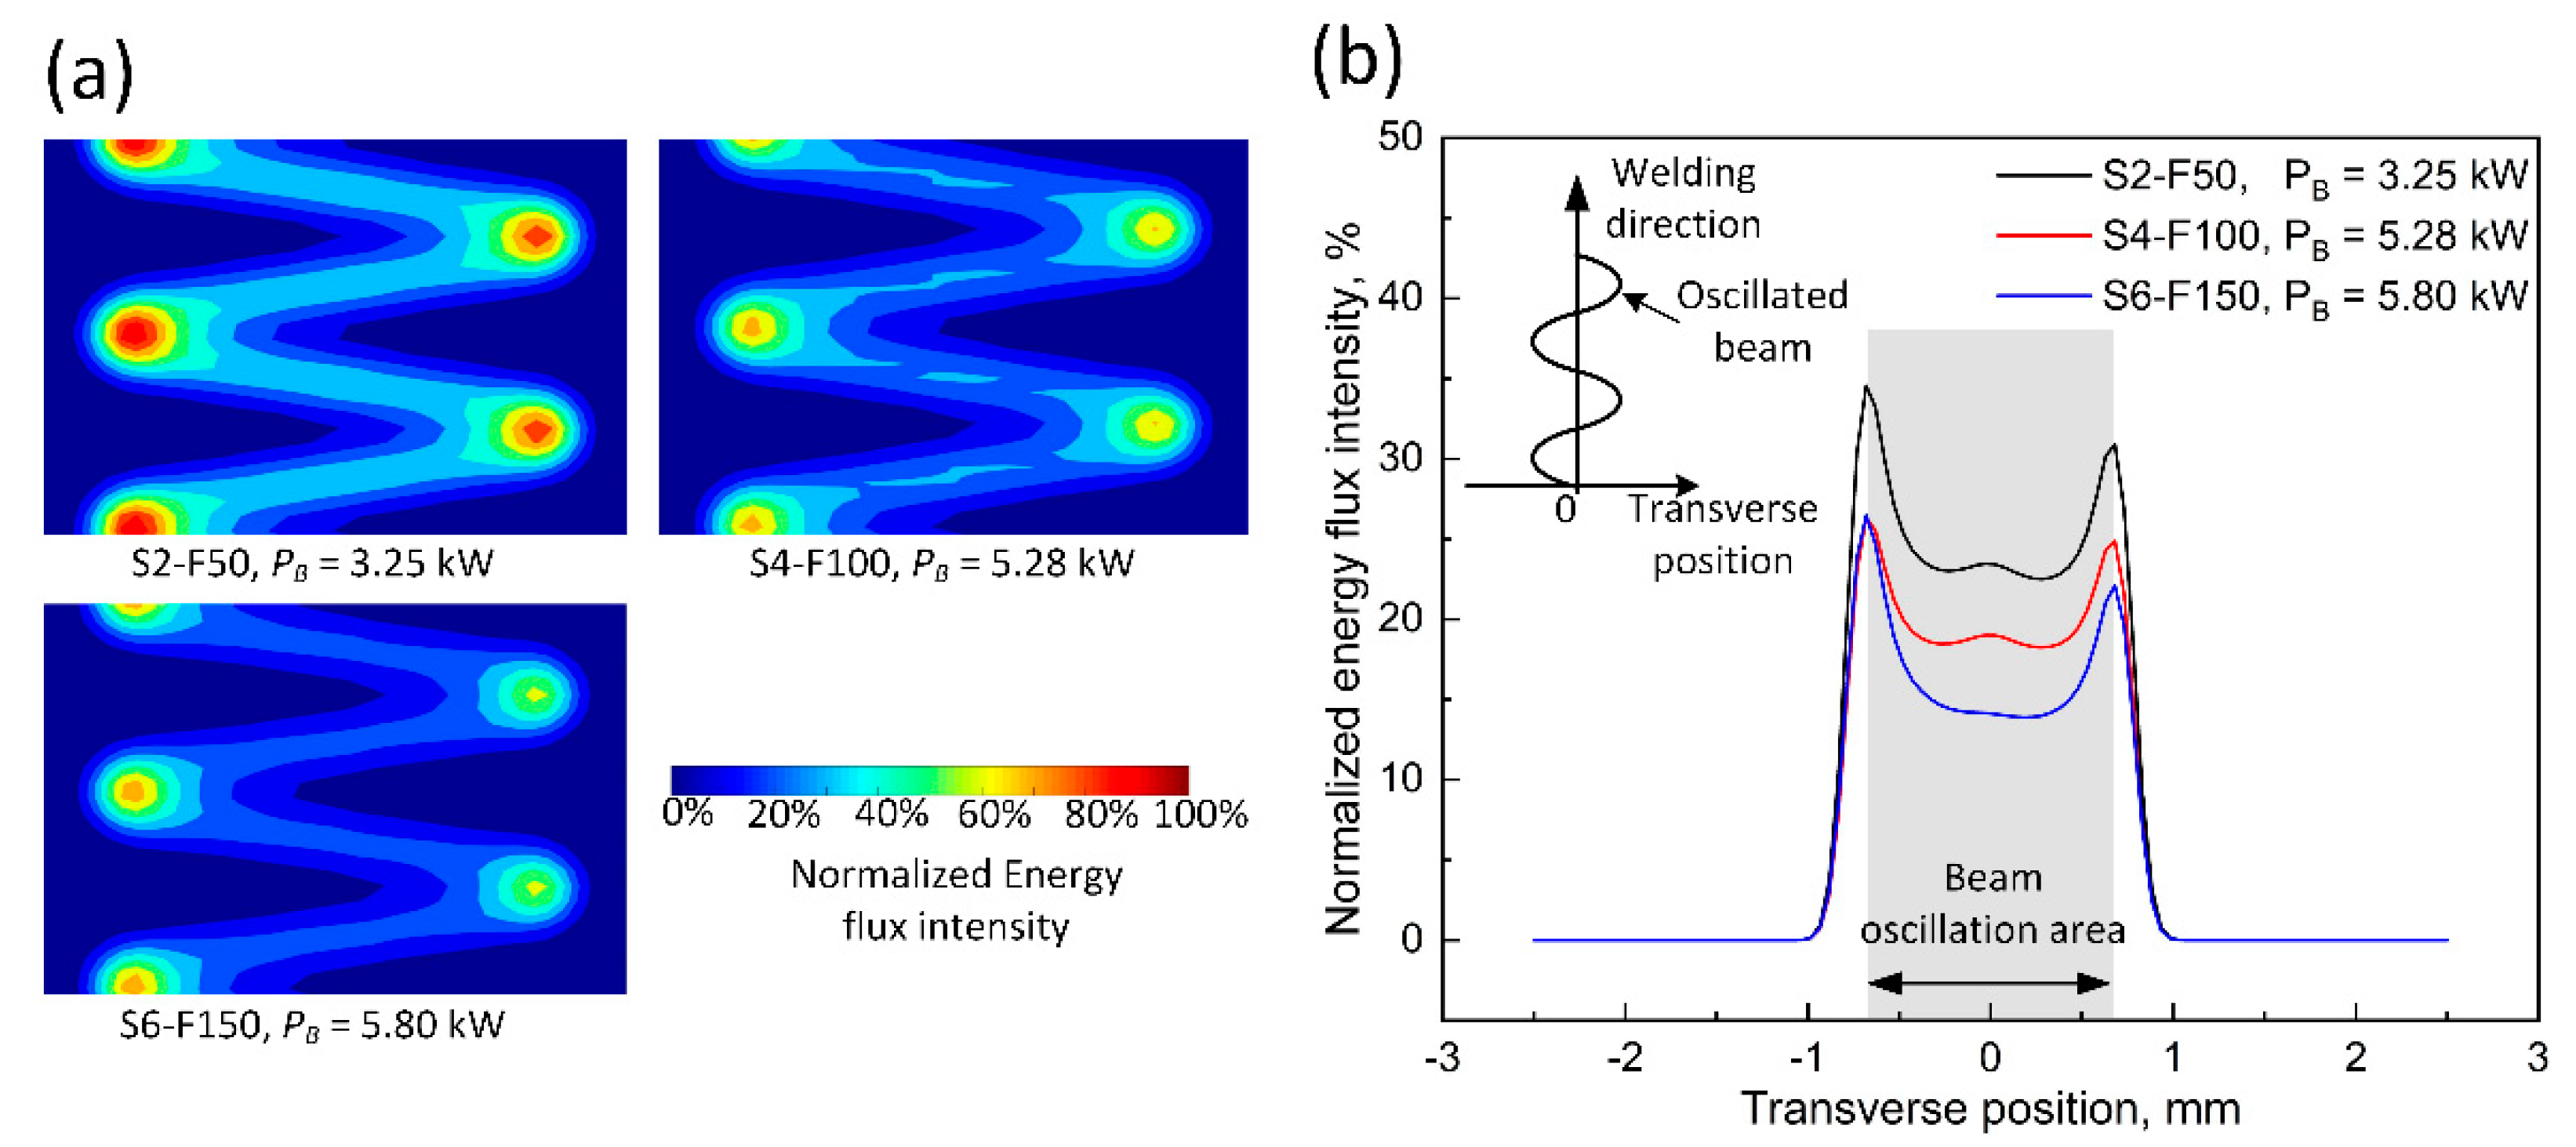
- (i)
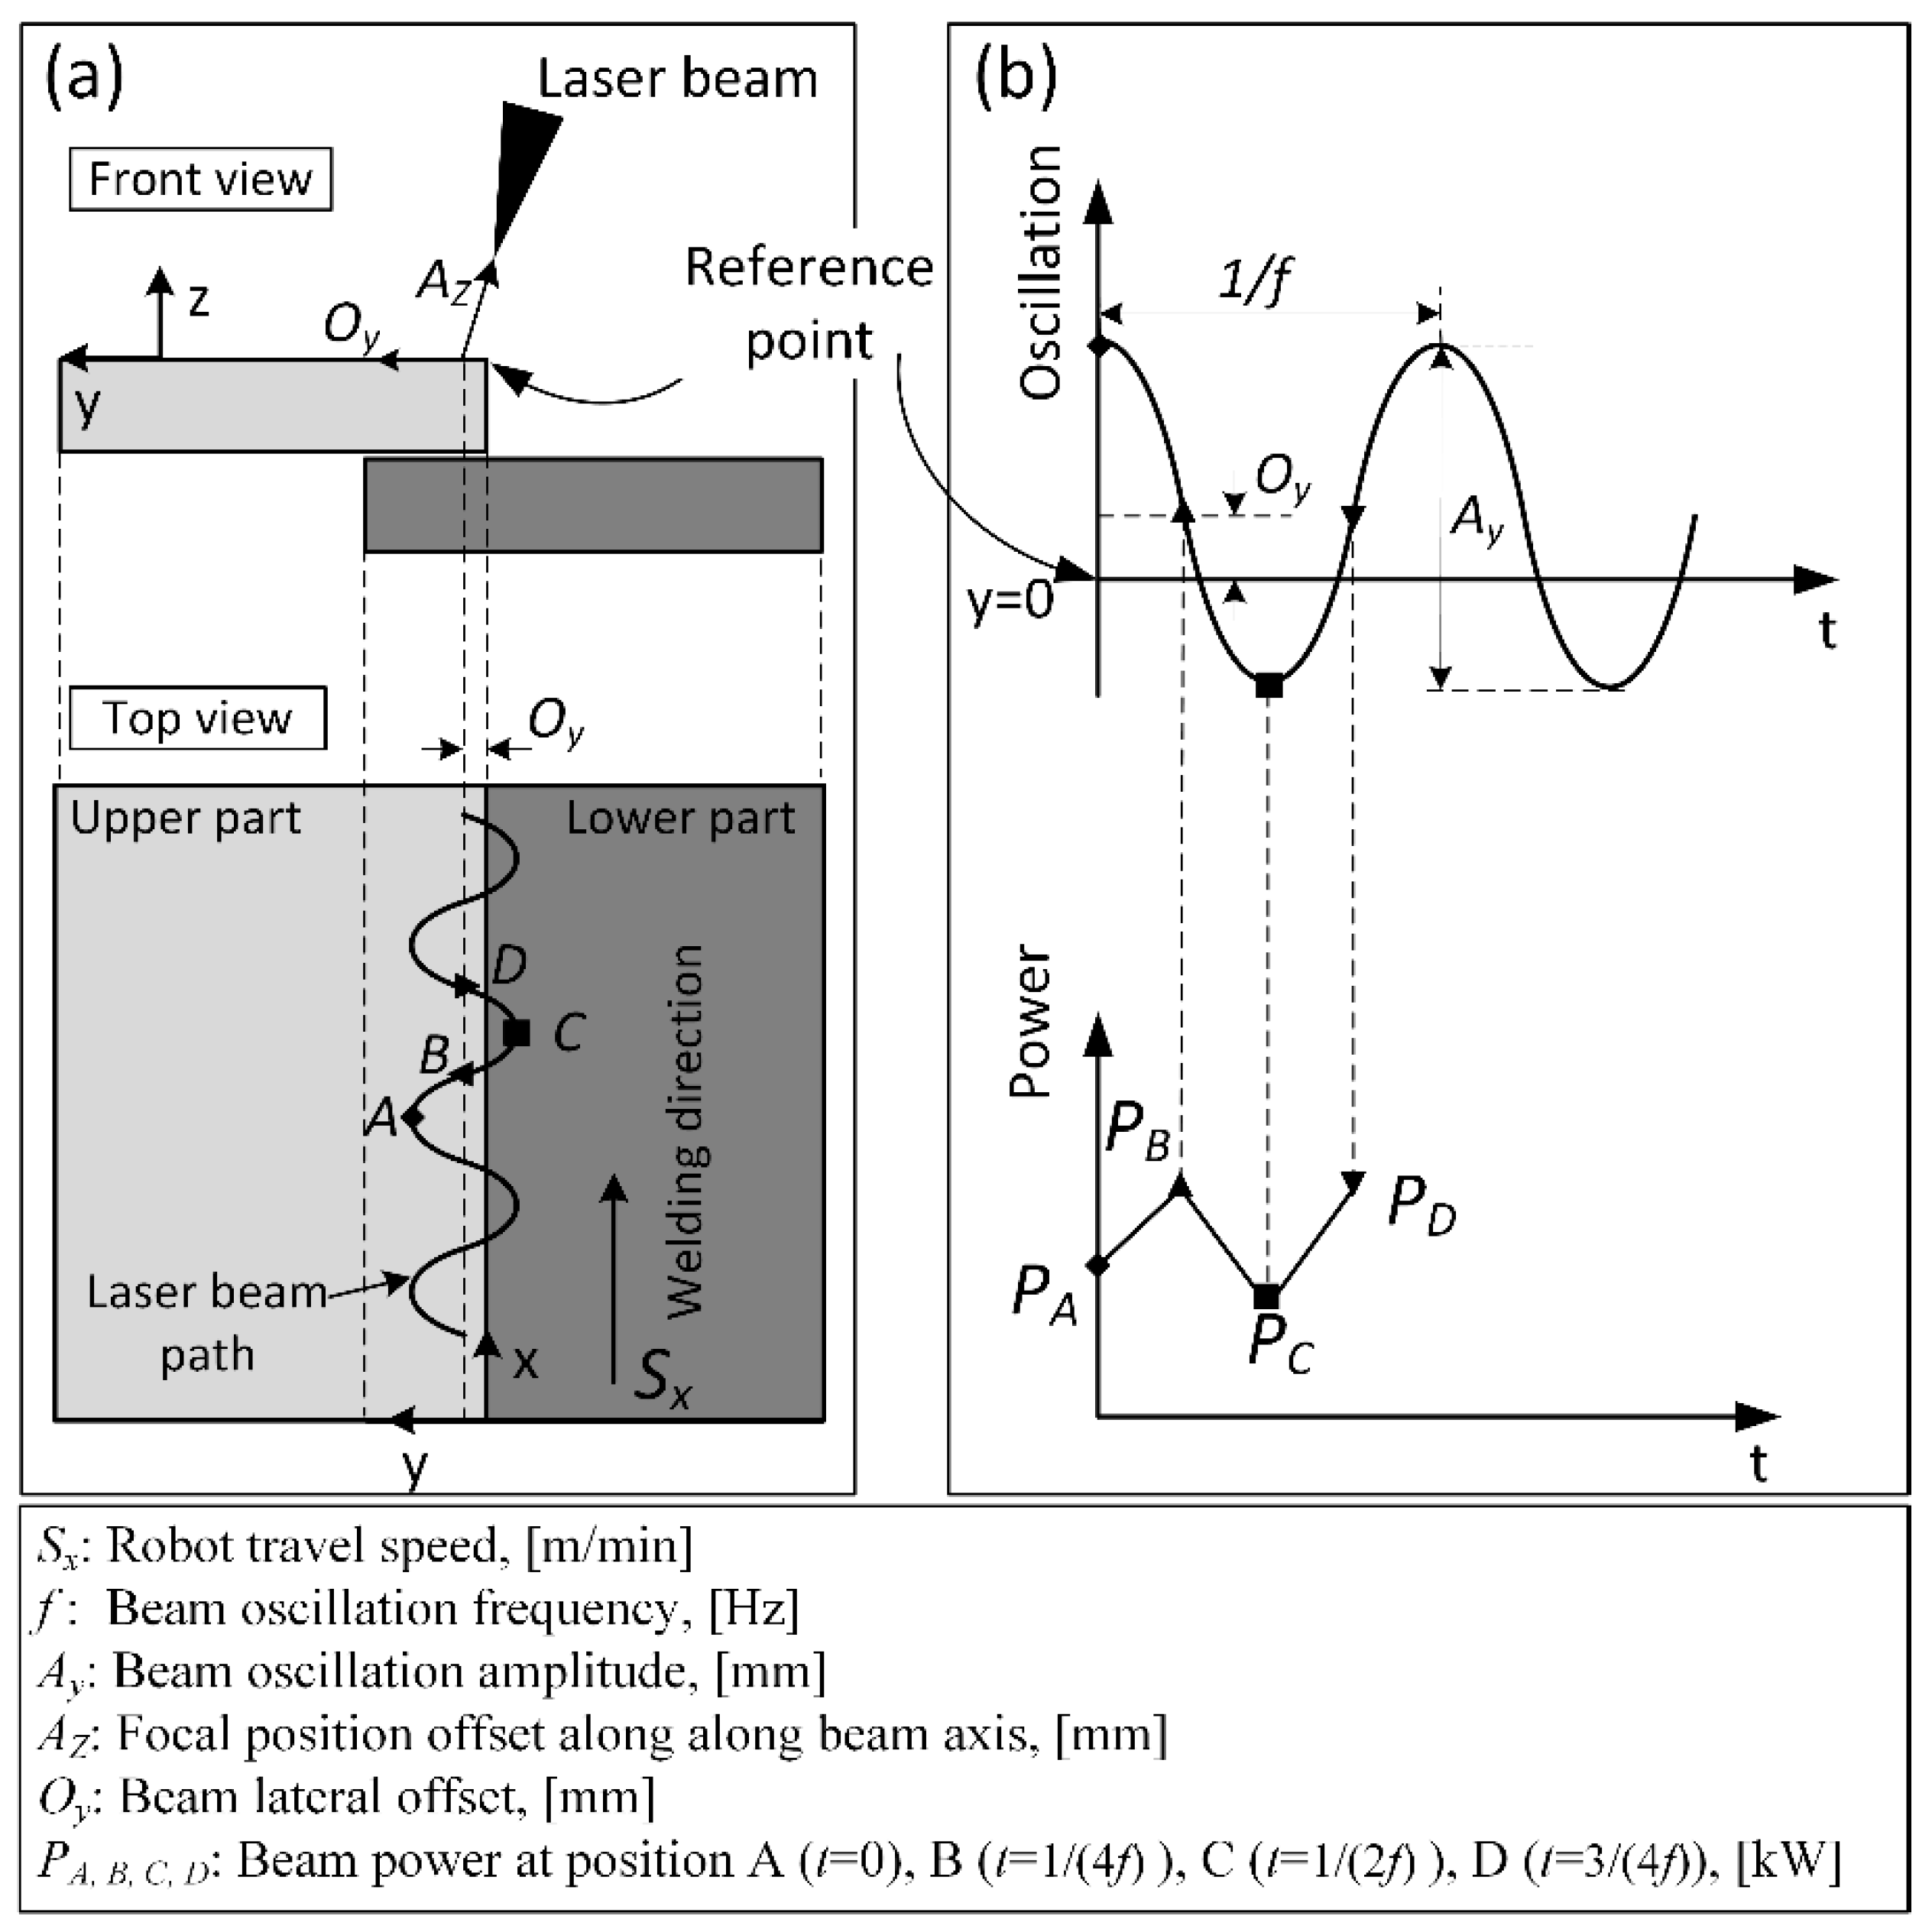
- the energy flux distribution of an oscillated laser beam (Figure 5), E(x, y), computed by Equation (2) [34] shows a ‘M’ shape in the transverse direction, with the peak energy deposition at two turning points of the oscillation path.where P(t) is the time-dependent instant power of laser beam expressed in Figure 1, r (r = 0.16 mm) is the radius of laser beam at Az = 2 mm. x(t) and y(t) are the moving track of oscillating beam and can be expressed by Equations (3) and (4), respectively.
- (ii)
- the turbulence of molten material in the rear of the molten pool which is induced by the beam oscillation, disturbs the growth of columnar grains in the mushy zone and promote the formation of equiaxed grains. However, this stirring effect induced by transverse beam oscillation is relatively weak as compared to longitudinal and circular oscillations because the oscillations occur only in front of the molten pool [34].
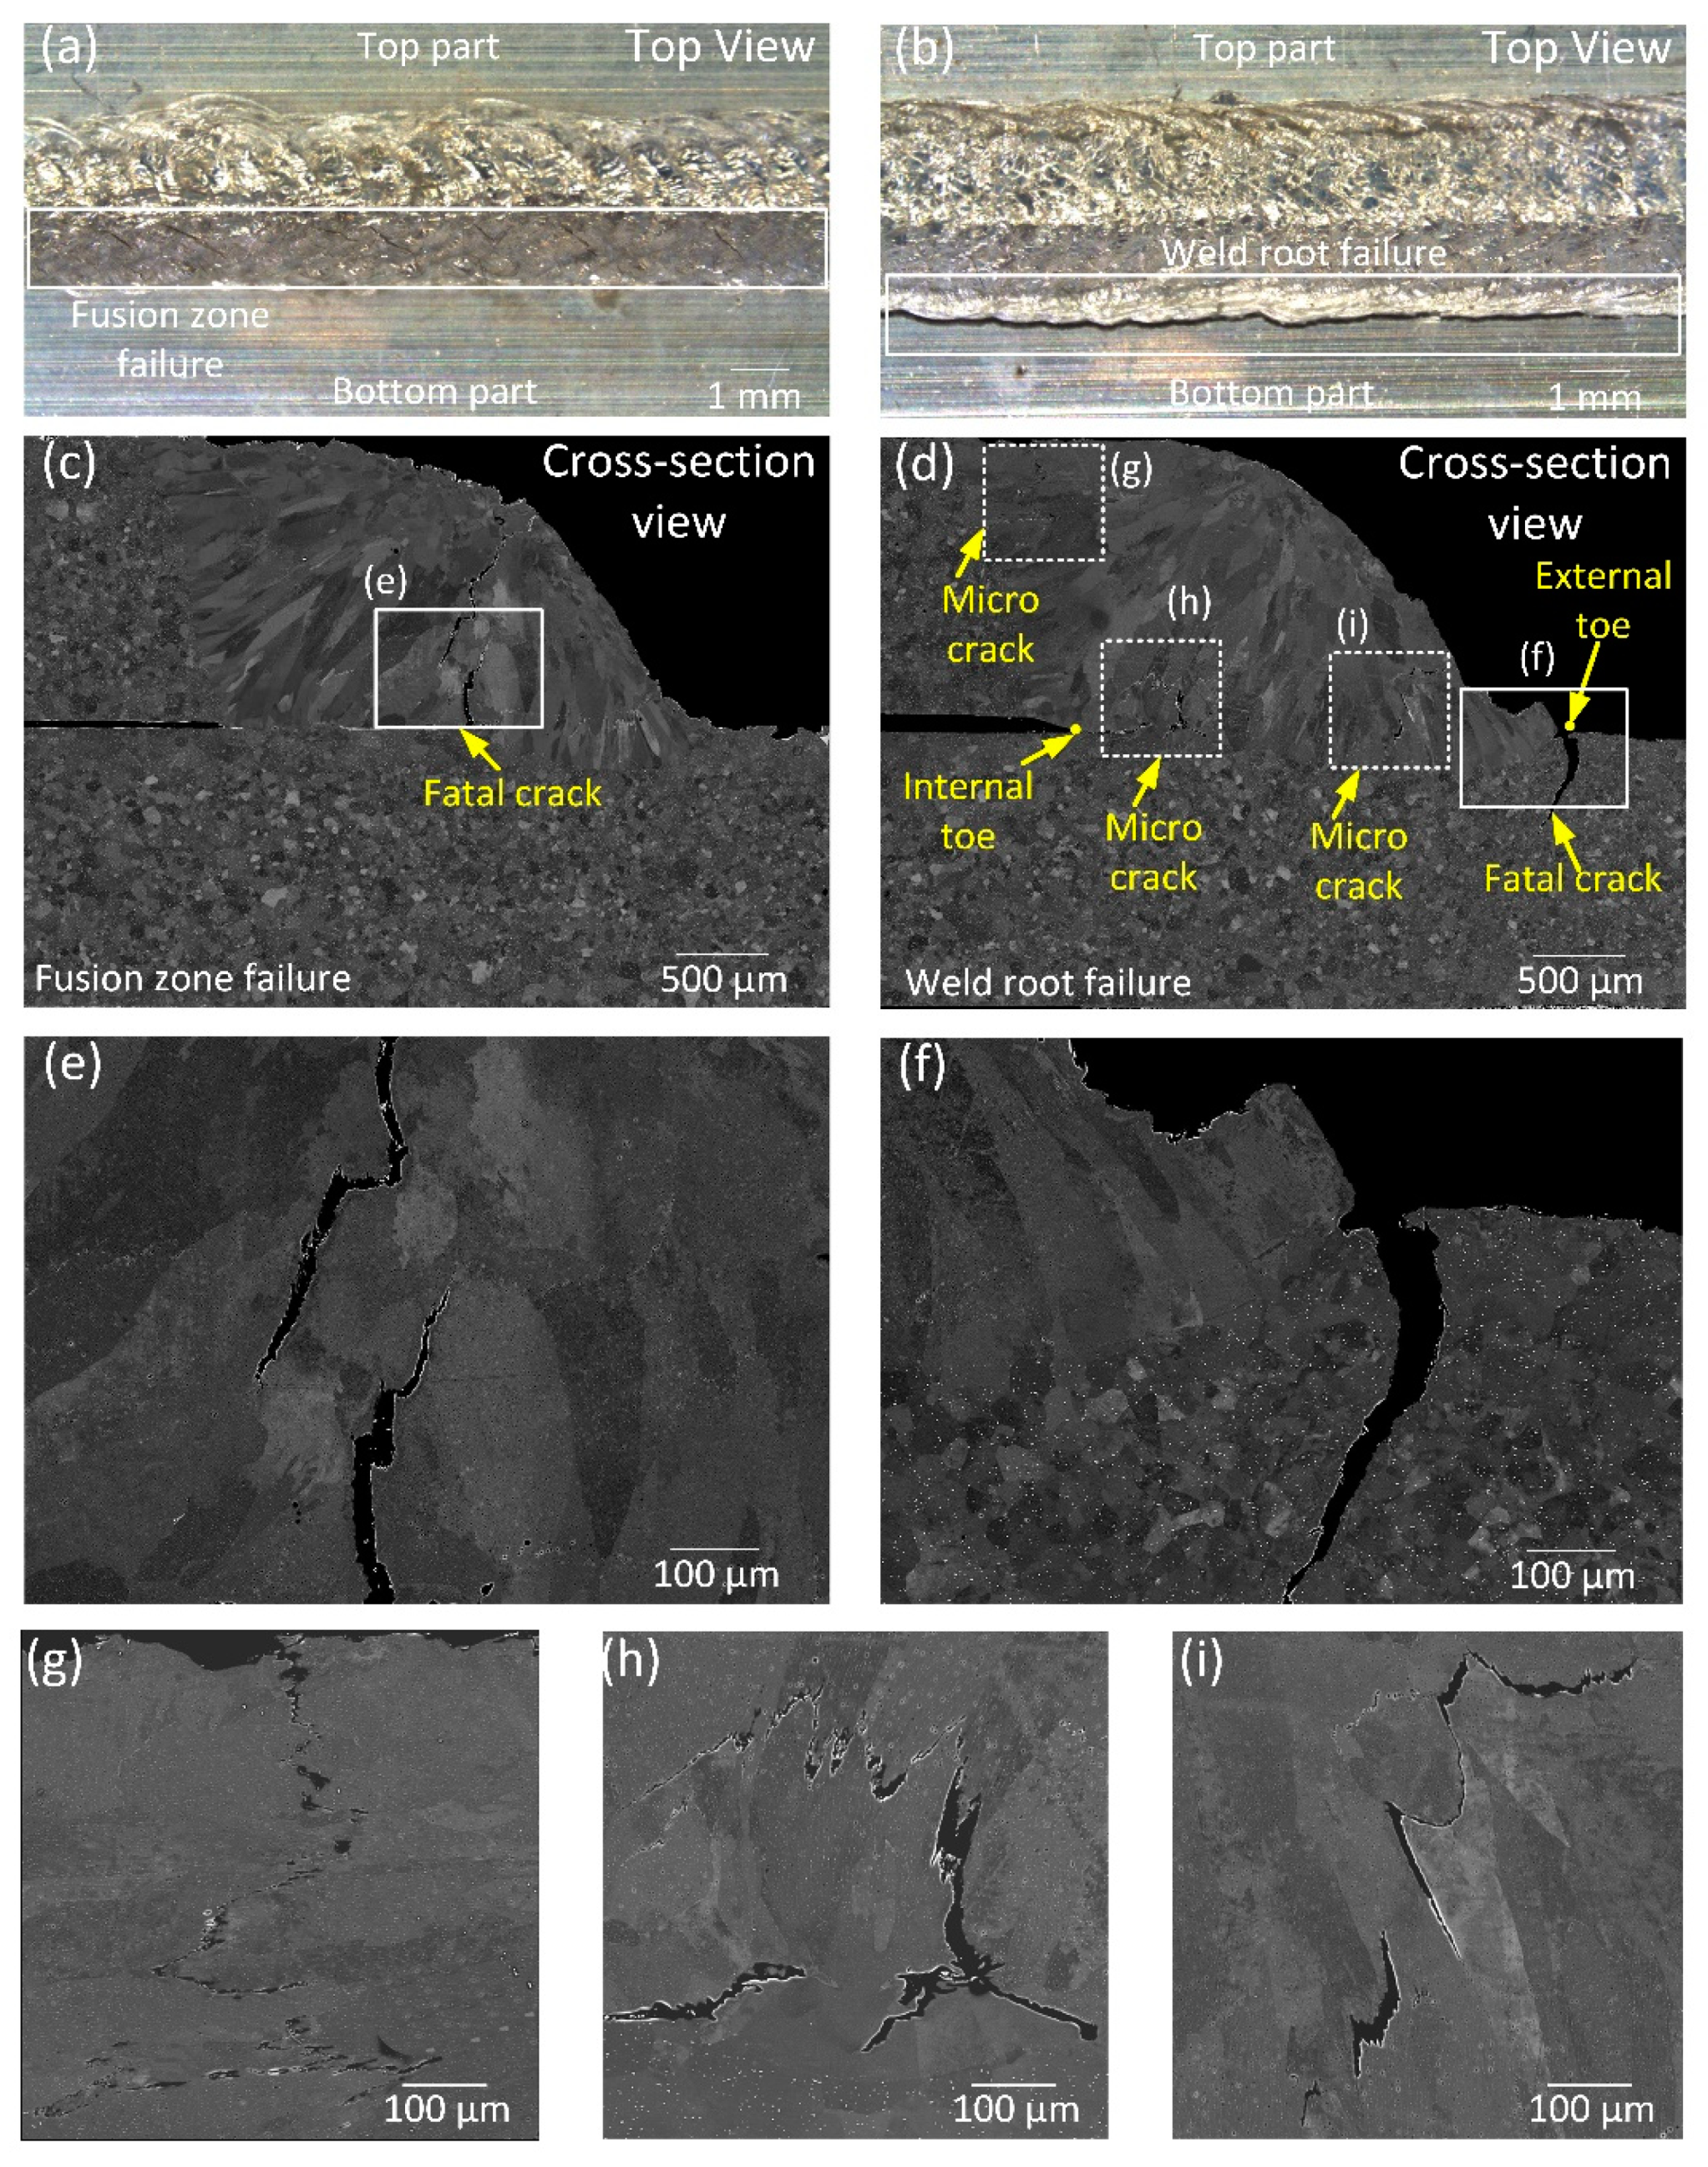
3.3. Crack Distribution
3.4. Weld Tensile Strength and Fatigue Durability
4. Conclusions
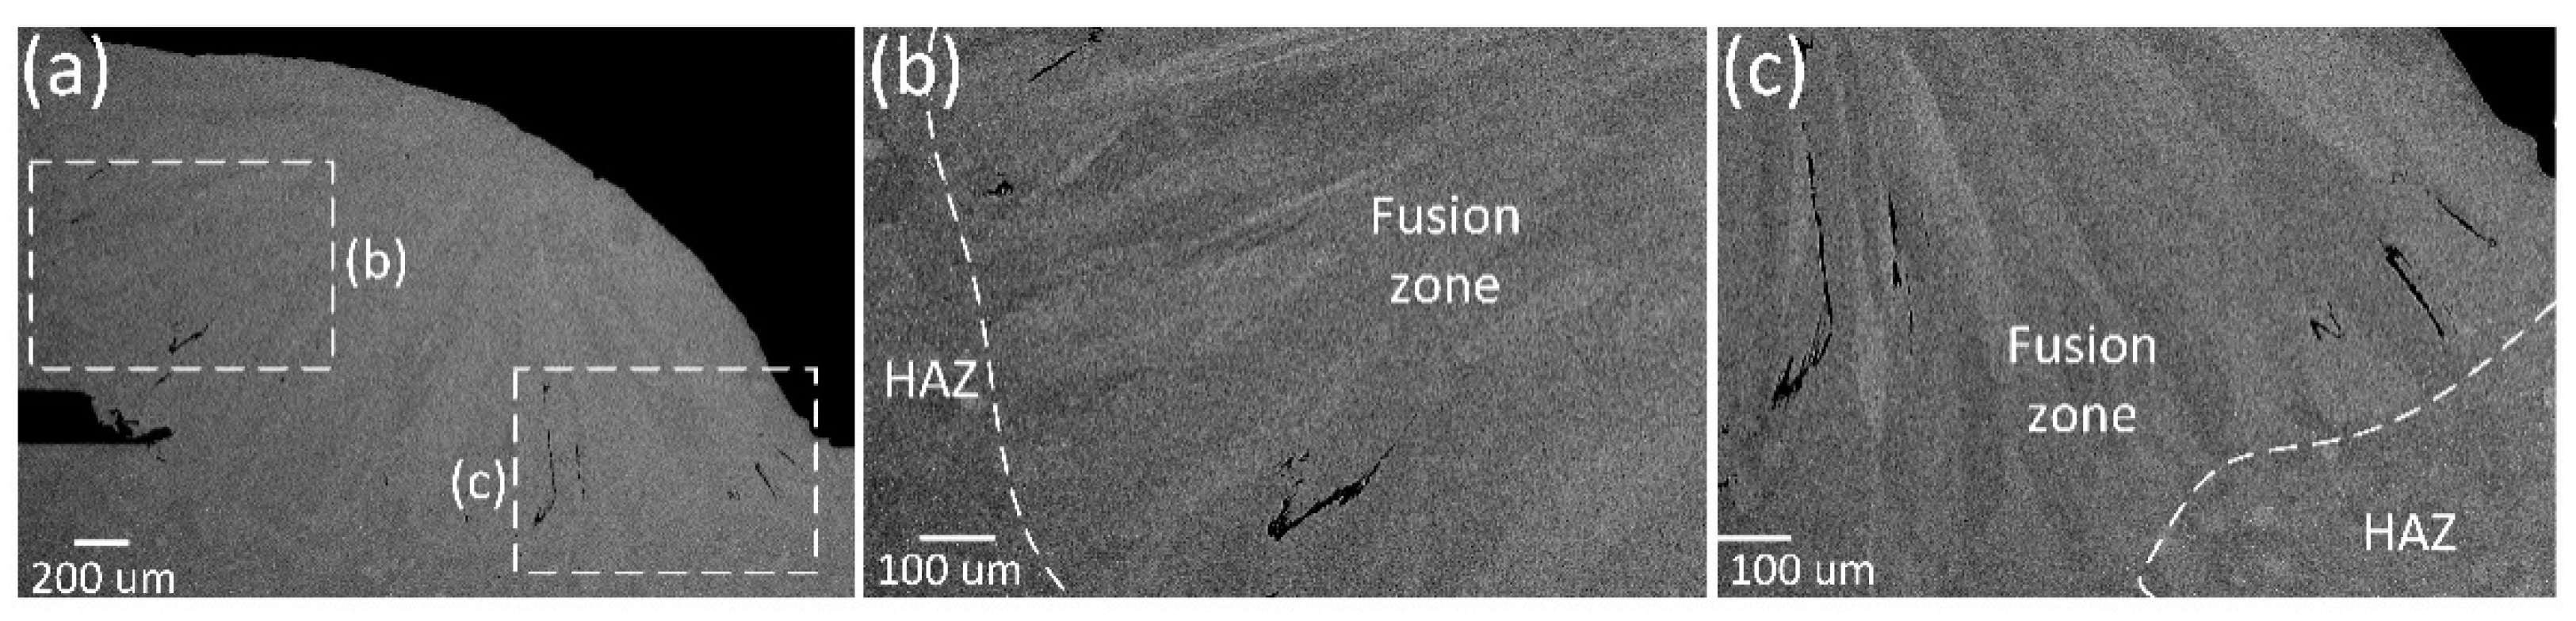
- (1)
- Transverse micro cracks occur along the columnar grain boundaries near fusion lines. Increasing welding speed from 2 m/min to 6 m/min, simultaneously with an increasing laser power for the purpose of good part-to-part gap bridging, did not show any risk of introducing additional transverse micro cracks.
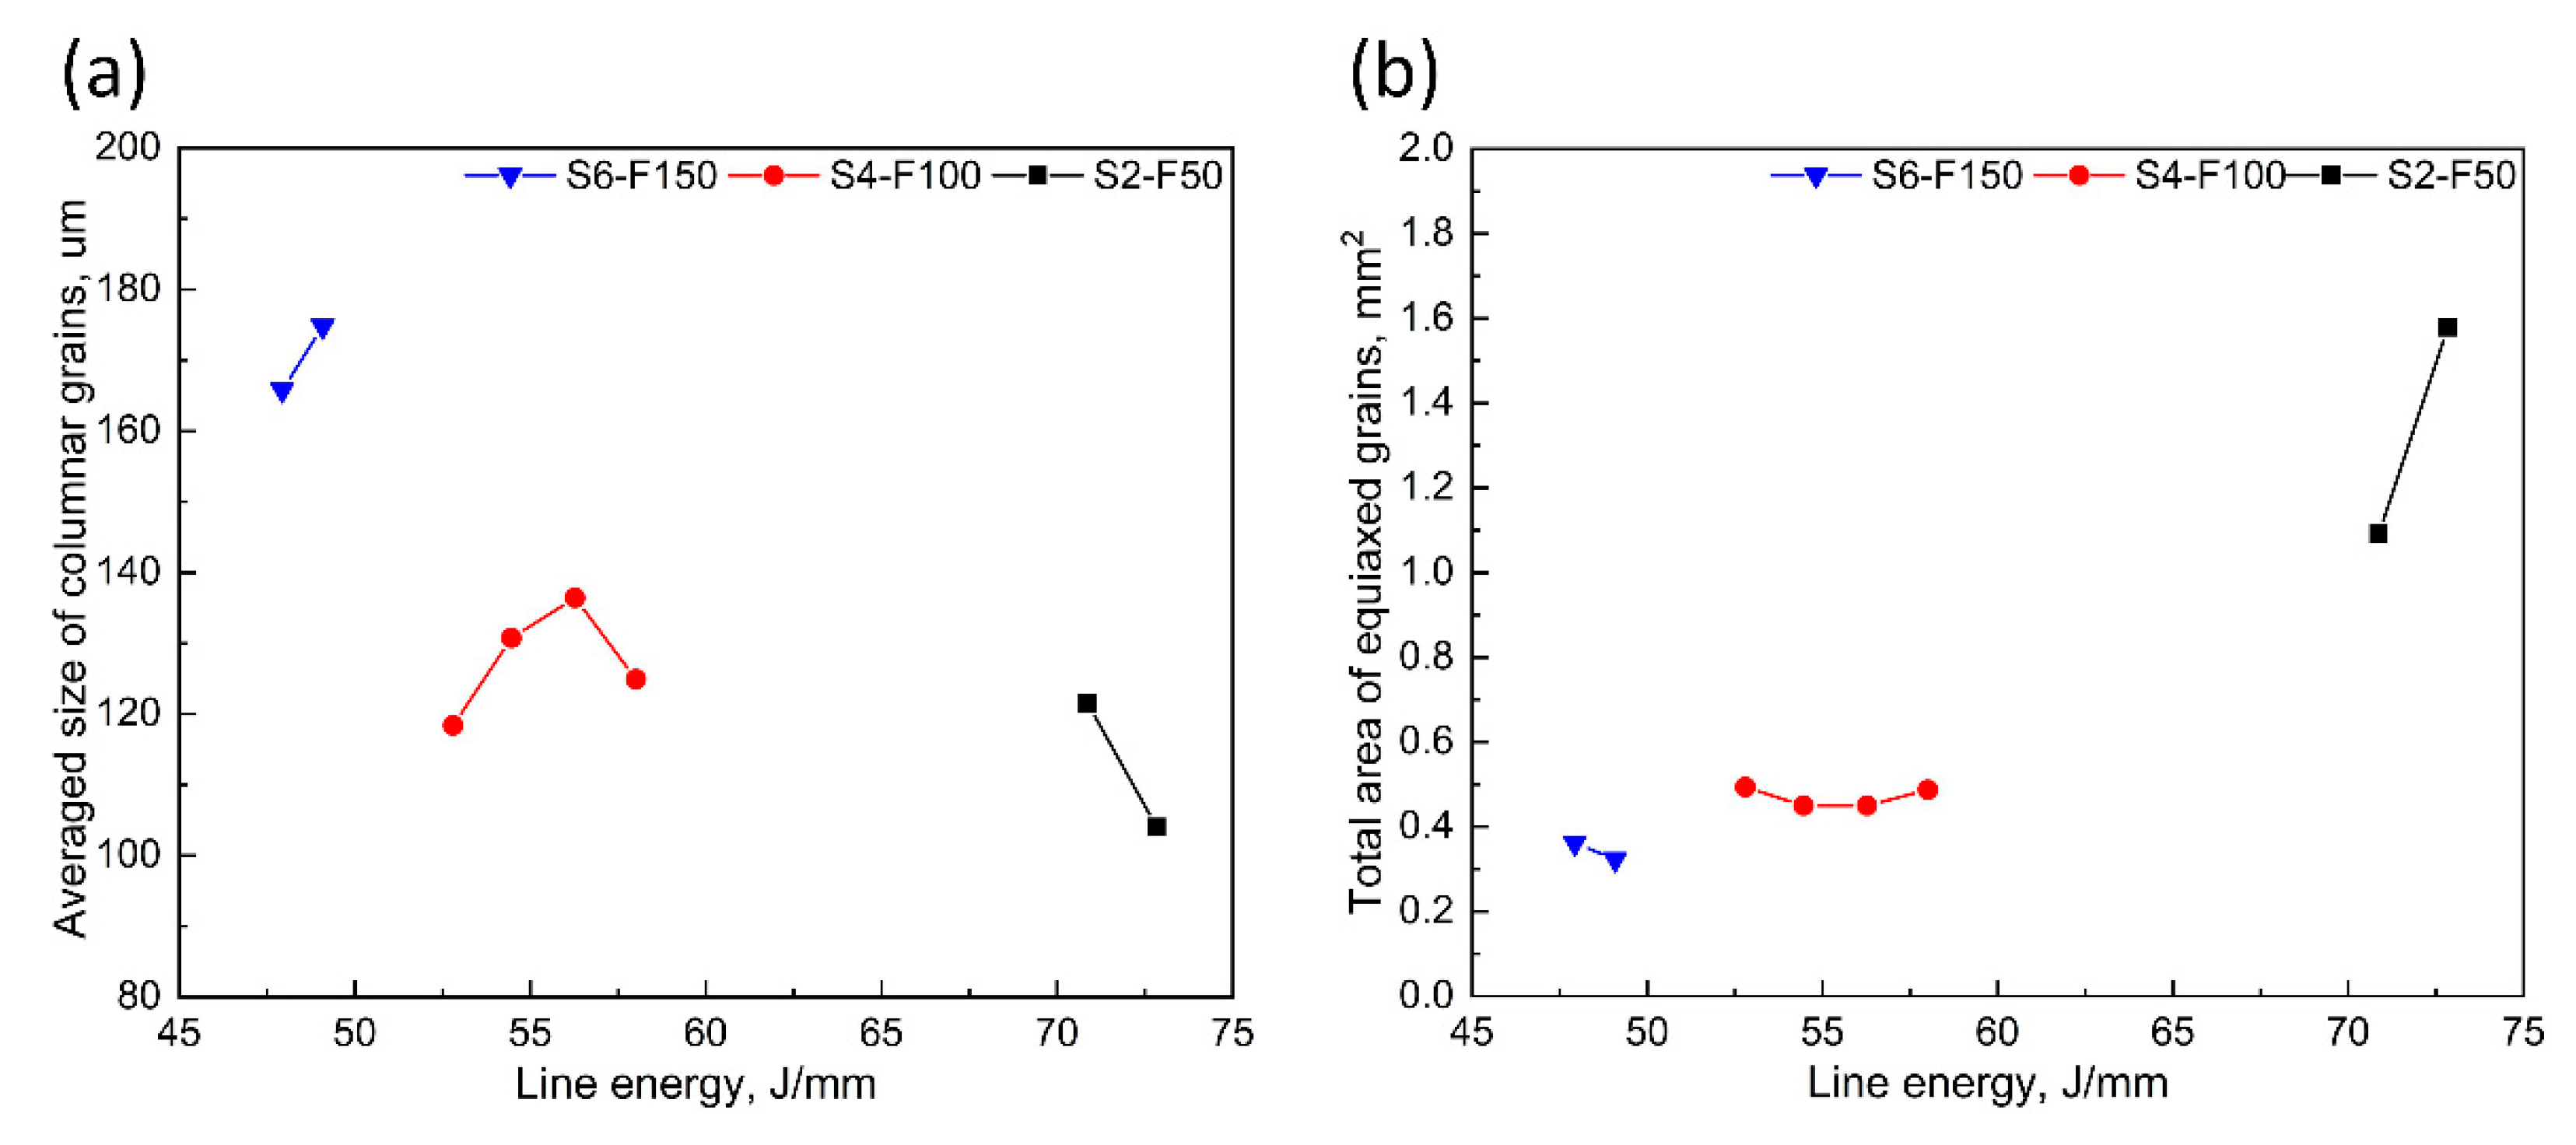
- (2)
- Equiaxed grains were observed in the centre of fusion zones while columnar grains were determined near fusion lines. A reduced welding speed facilitates the formation of equiaxed grains due to the greater deposition of beam energy at two turning points of the beam oscillation path, which results in a more uniform temperature distribution within the fusion zone during subsequent solidification.
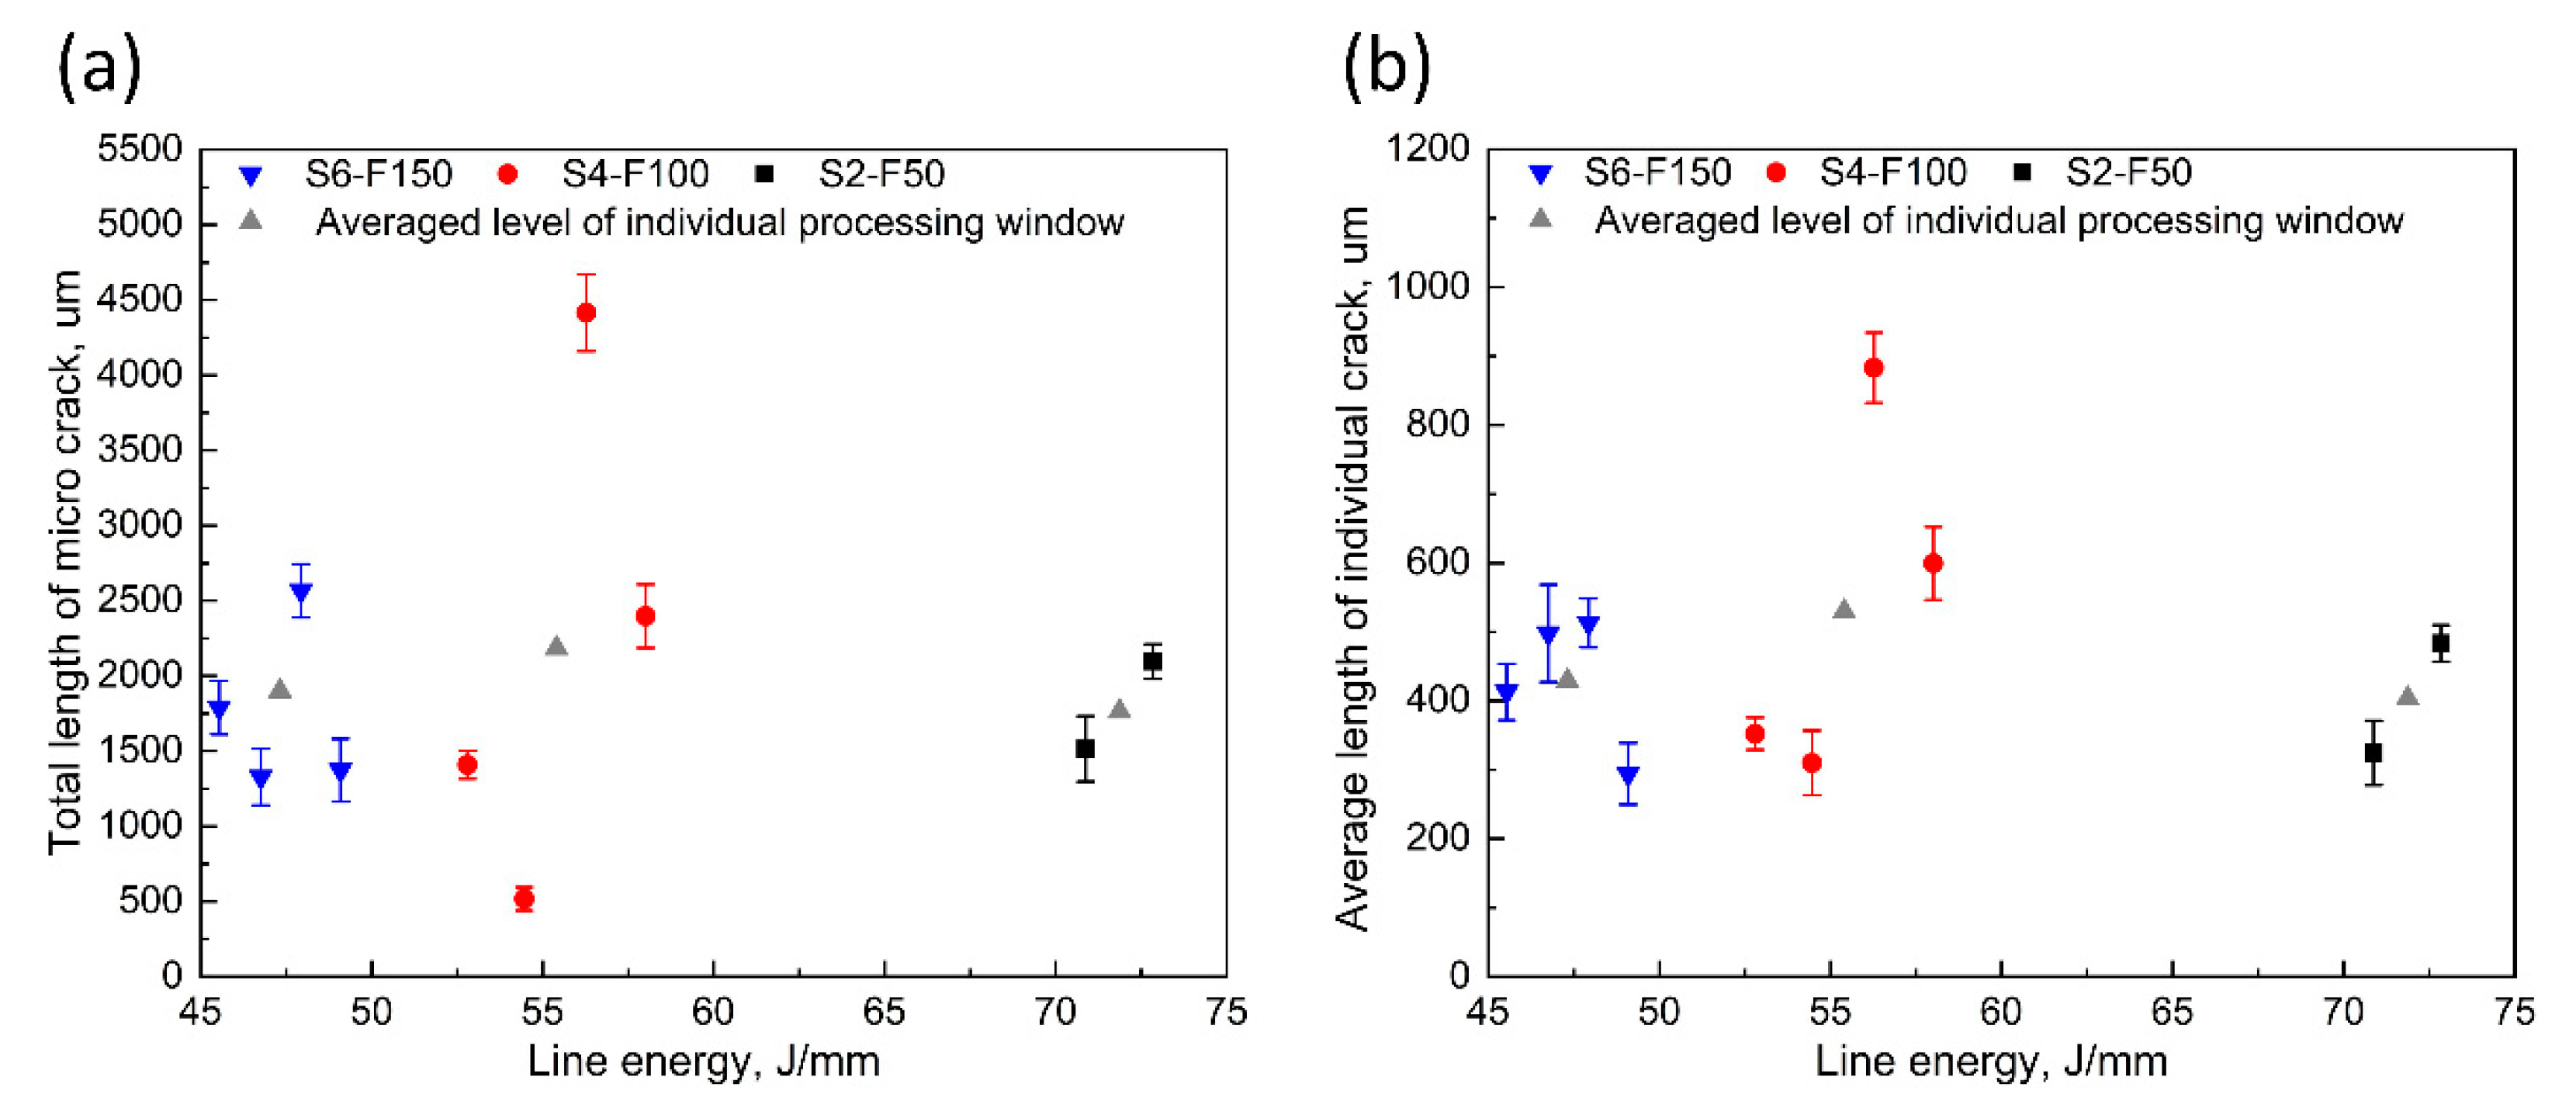
- (3)
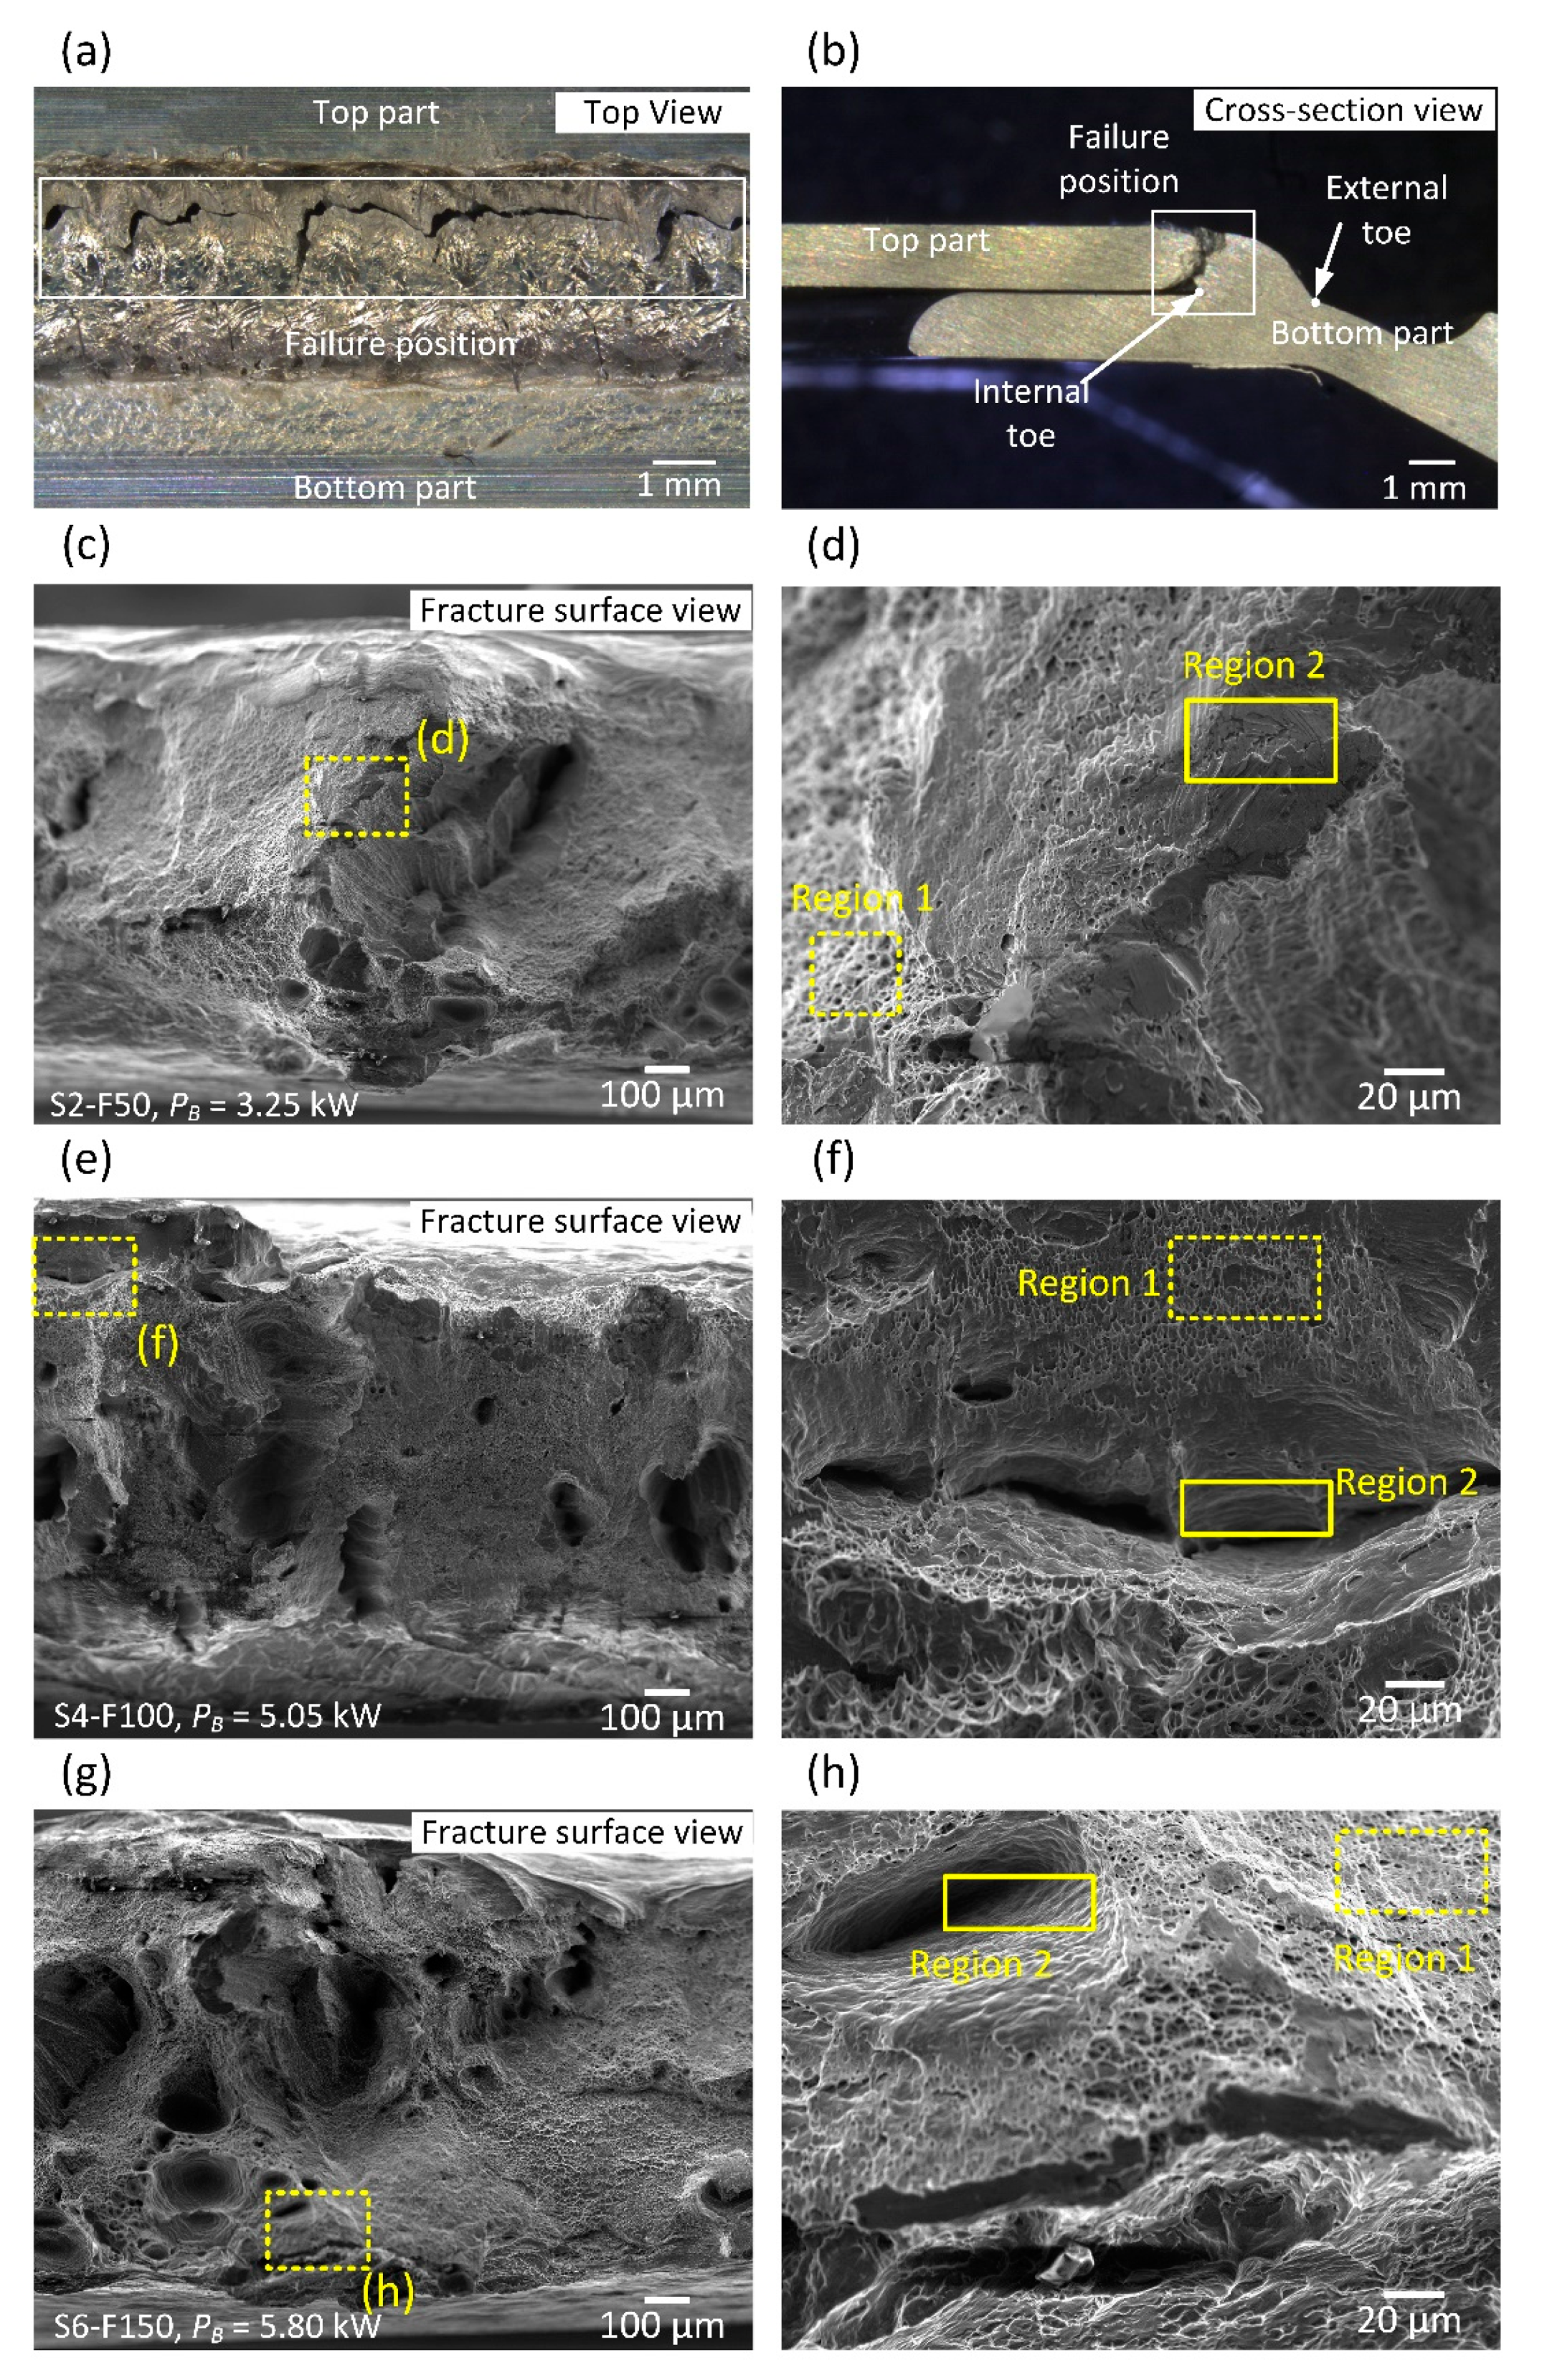
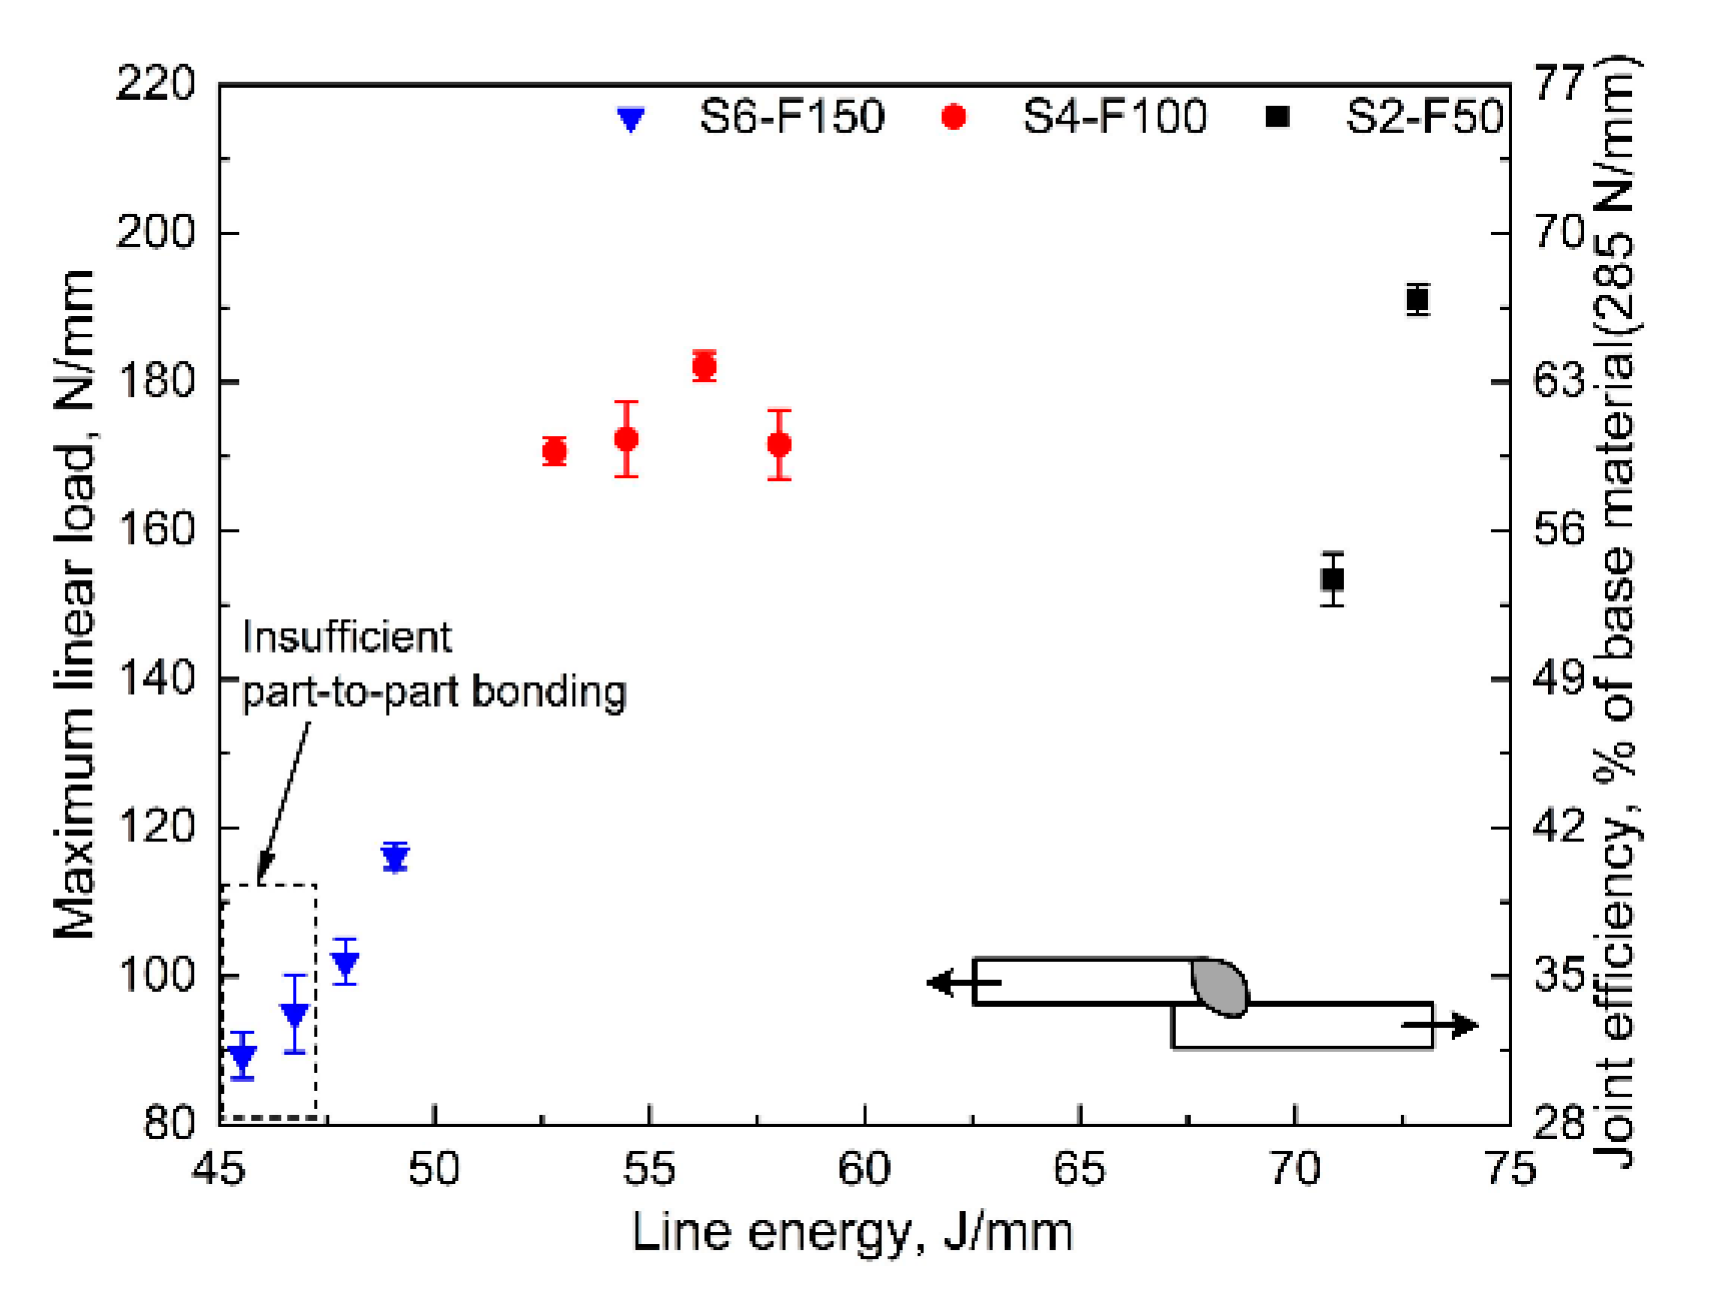
- Although transverse micro crack remains at similar level for welding speed between 2 m/min and 6 m/min, joint tensile strength can be improved by 30% by welding at 2 m/min compared to 6 m/min. This is attributed to expansion of fusion zone, measured by throat thickness and refinement of columnar grains near fusion lines.
- (4)
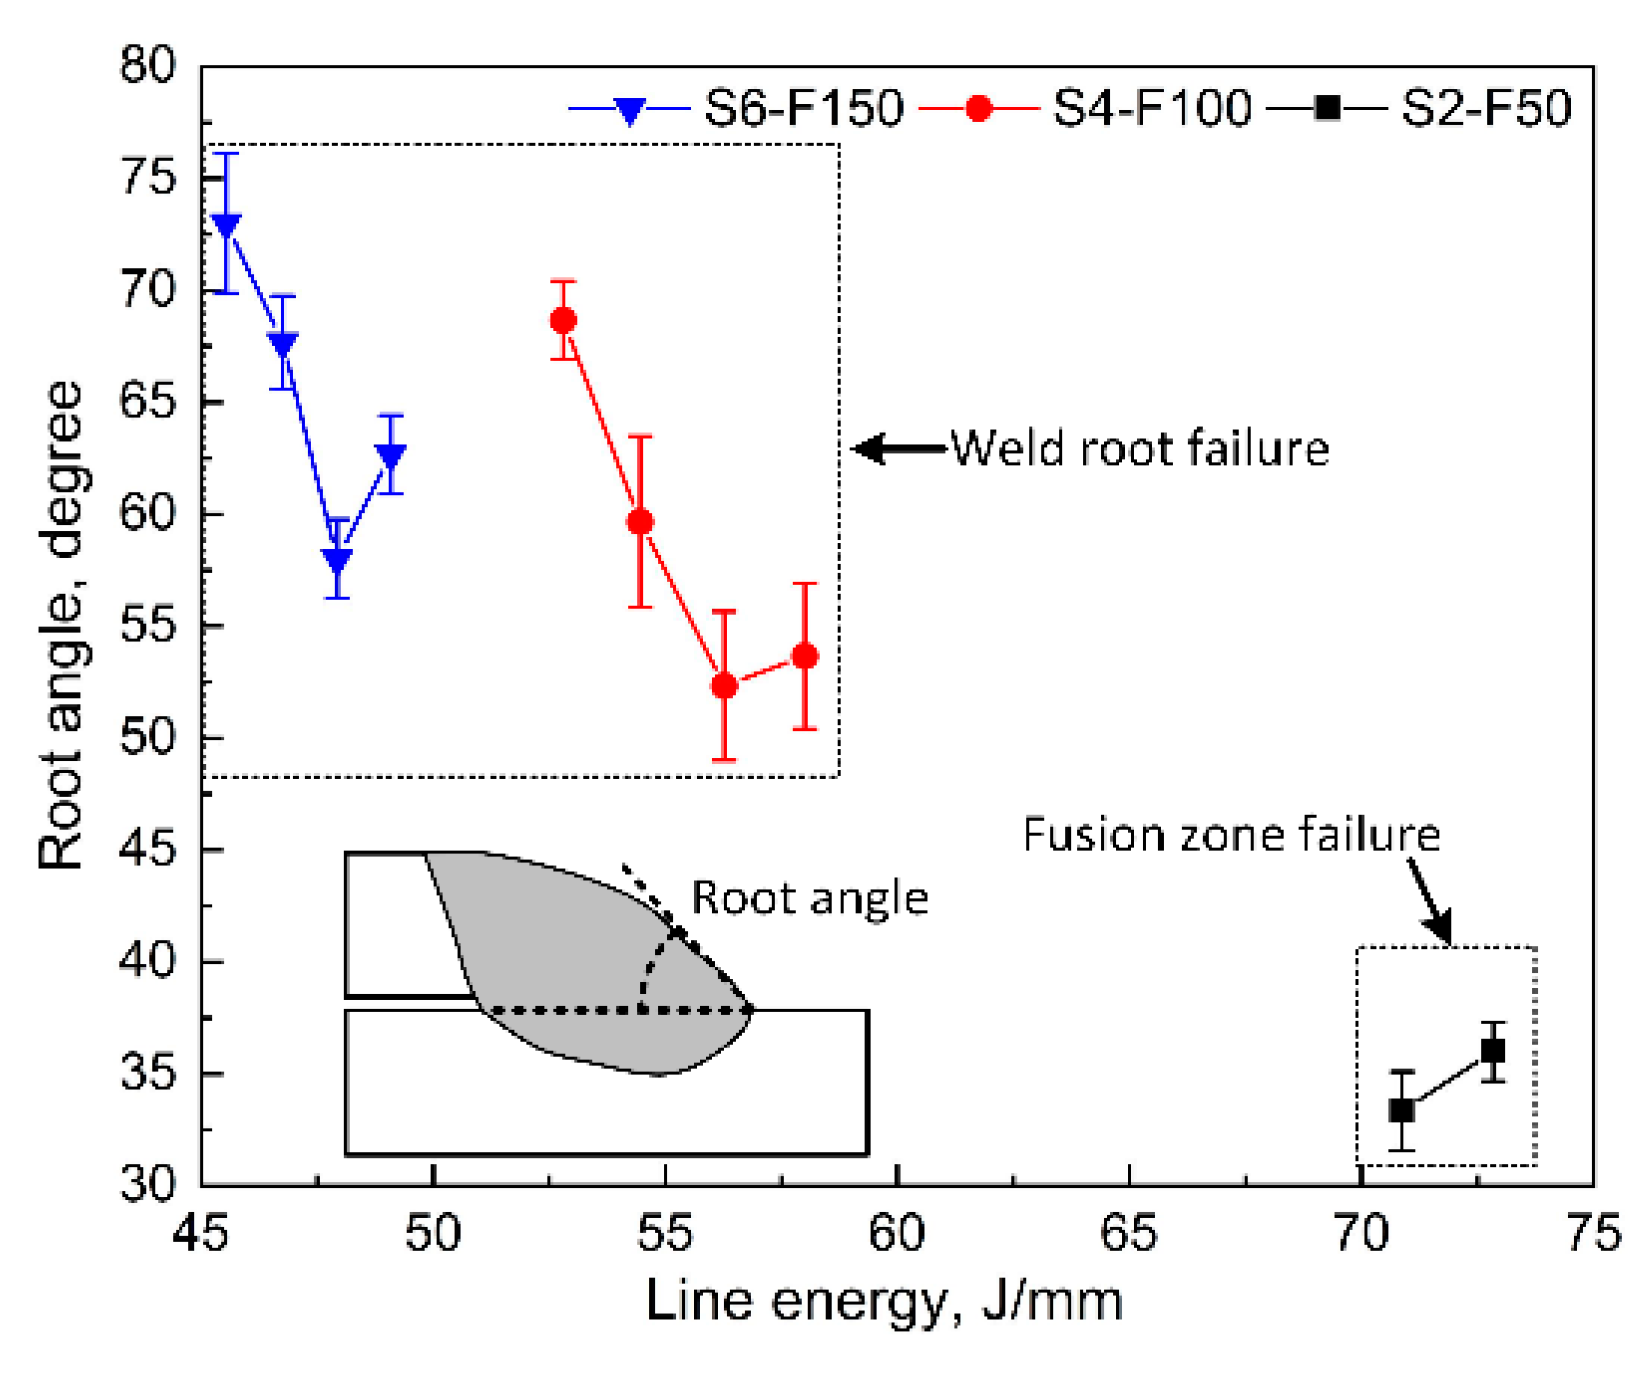
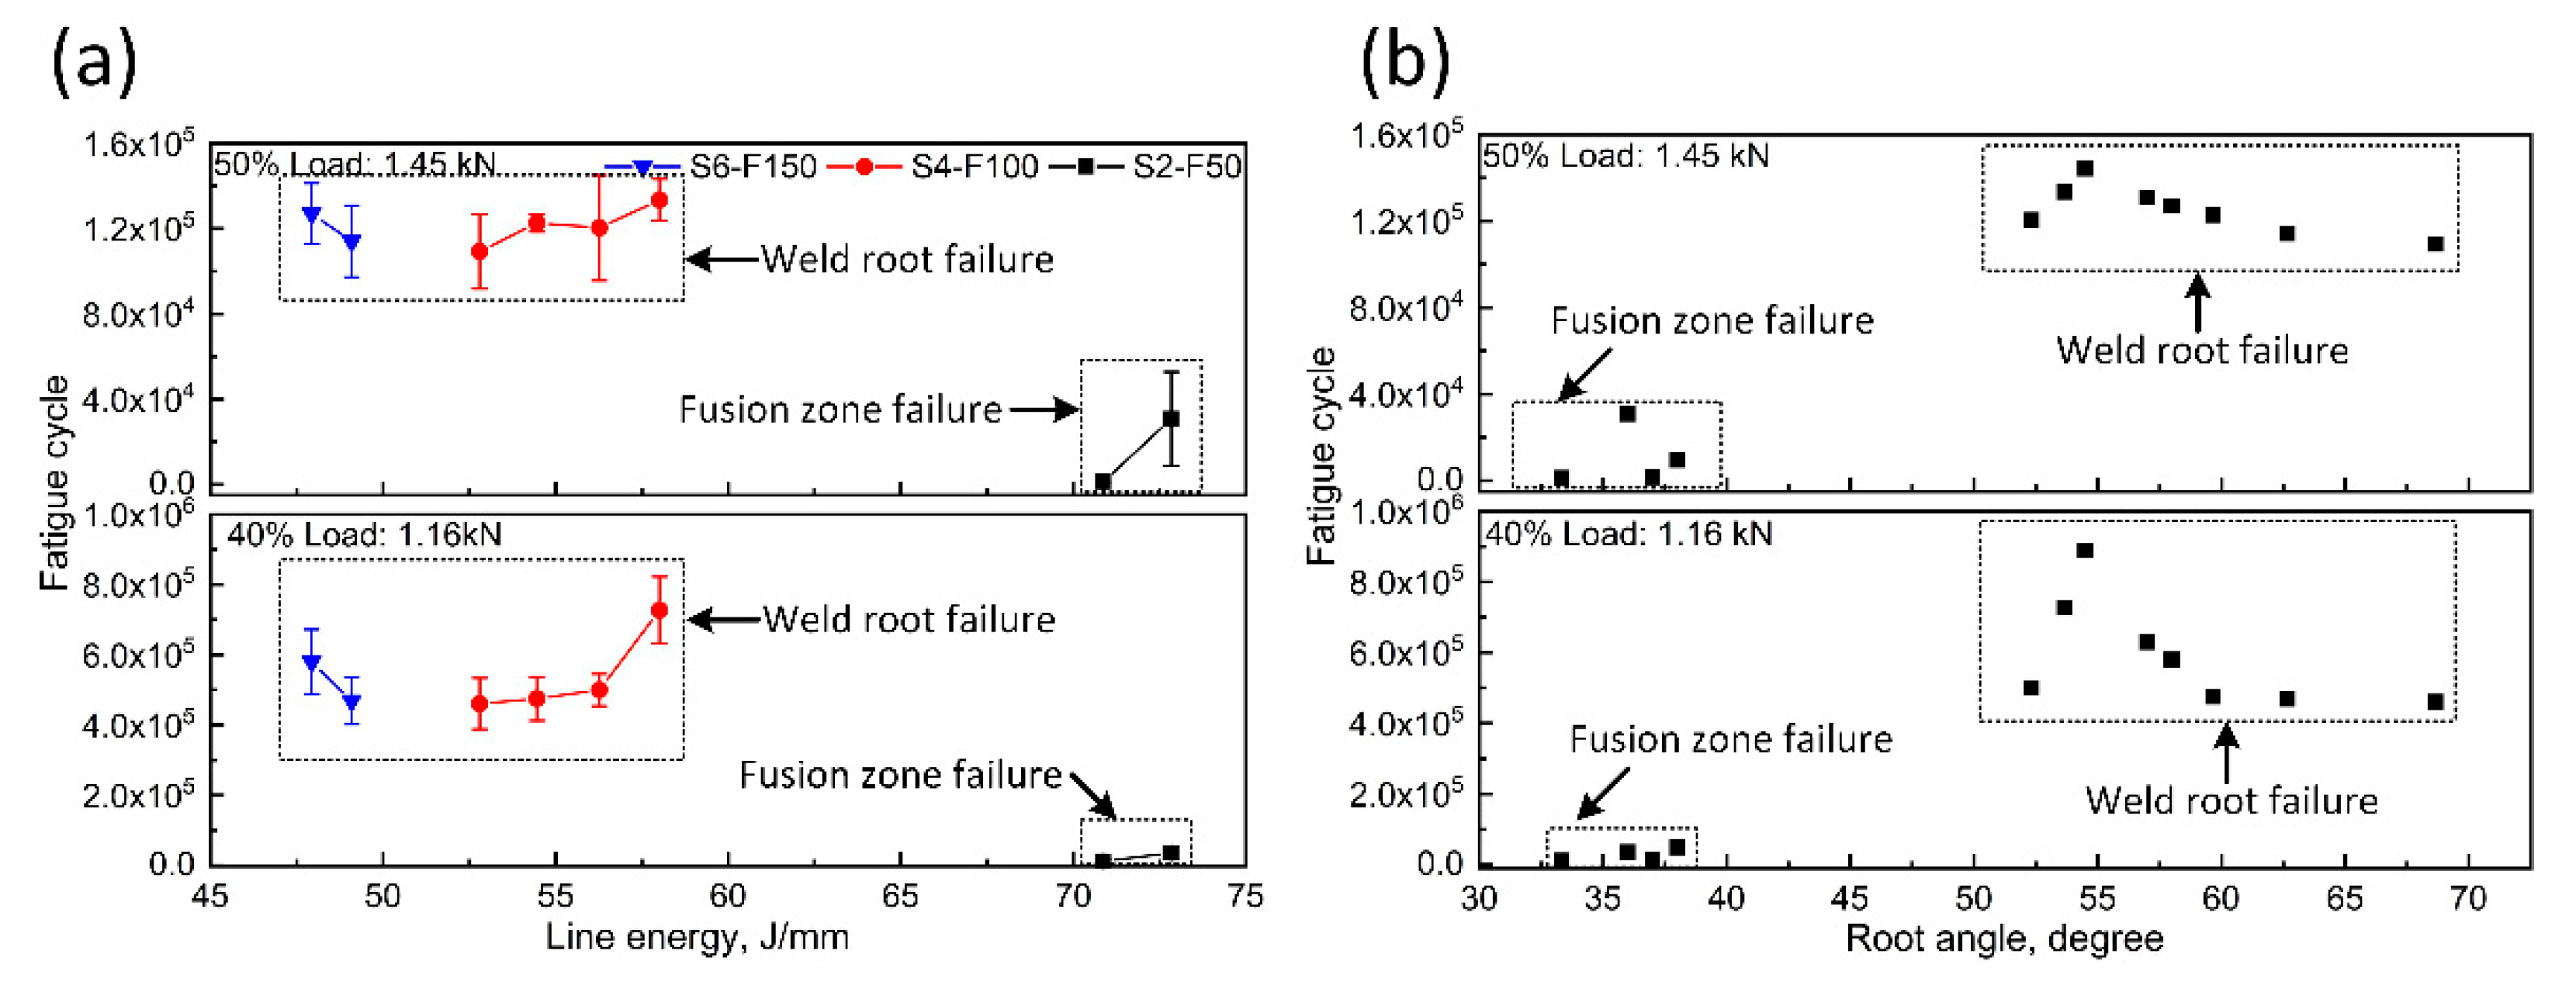
- Weld fatigue durability is higher when fatigue failure occurs in weld root instead of fusion zone due to the avoidance of transverse micro cracks. Weld fatigue failure position in this study is greatly influenced by weld shape, represented by weld root angle. A higher weld root angle leads to the transition of fatigue failure from the centre of fusion zone (fusion zone failure mode) to the interface between fusion zone and HAZ (weld root failure mode). The highest weld fatigue durability can be achieved by increasing weld root angle with optimum weld fatigue durability at weld root angle of around 55°.
Author Contributions
Funding
Institutional Review Board Statement
Informed Consent Statement
Data Availability Statement
Acknowledgments
Conflicts of Interest
References
- González Palencia, J.C.; Furubayashi, T.; Nakata, T. Energy use and CO2 emissions reduction potential in passenger car fleet using zero emission vehicles and lightweight materials. Energy 2012, 48, 548–565. [Google Scholar] [CrossRef]
- Blendl, W.; Cuppoletta, N. Trend Towards e-Mobility Accelerates Aluminium Use. 2020. Available online: https://www.aluminium-messe.com/en/ALUMINIUM-2020/Trend-towards-e-Mobility-accelerates-Aluminium-Use/879/ (accessed on 20 December 2020).
- Pedersen, K.O.; Lademo, O.G.; Berstad, T.; Furu, T.; Hopperstad, O.S. Influence of texture and grain structure on strain localisation and formability for AlMgSi alloys. J. Mater. Process. Technol. 2008, 200, 77–93. [Google Scholar] [CrossRef]
- Zhang, C.; Li, X.; Gao, M. Effects of circular oscillating beam on heat transfer and melt flow of laser melting pool. J. Mater. Res. Technol. 2020, 9, 9271–9282. [Google Scholar] [CrossRef]
- Bustillo, A.; Urbikain, G.; Perez, J.M.; Pereira, O.M.; Lopez de Lacalle, L.N. Smart optimization of a friction-drilling process based on boosting ensembles. J. Manuf. Syst. 2018, 48, 108–121. [Google Scholar] [CrossRef]
- Khosravani, M.R.; Anders, D.; Weinberg, K. Influence of strain rate on fracture behavior of sandwich composite T-joints. Eur. J. Mech. A Solid 2019, 78, 103821. [Google Scholar] [CrossRef]
- Khosravani, M.R.; Weinberg, K. Experimental investigations of the environmental effects on stability and integrity of composite sandwich T-joints. Materwiss. Werksttech. 2017, 48, 753–759. [Google Scholar] [CrossRef]
- Zhou, W.; Zhang, R.; Ai, S.; He, R.; Pei, Y.; Fang, D. Load distribution in threads of porous metal–ceramic functionally graded composite joints subjected to thermomechanical loading. Compos. Struct. 2015, 134, 680–688. [Google Scholar] [CrossRef] [Green Version]
- Zhou, W.; Ai, S.; Chen, M.; Zhang, R.; He, R.; Pei, Y.; Fang, D. Preparation and thermodynamic analysis of the porous ZrO2/(ZrO2+ Ni) functionally graded bolted joint. Compos. Part B Eng. 2015, 82, 13–22. [Google Scholar] [CrossRef]
- Ceglarek, D.; Colledani, M.; Váncza, J.; Kim, D.Y.; Marine, C.; Kogel-Hollacher, M. Rapid deployment of remote laser welding processes in automotive assembly systems. CIRP Ann. Manuf. Technol. 2015, 64, 389–394. [Google Scholar] [CrossRef]
- Tsoukantas, G.; Salonitis, K.; Stournaras, A.; Stavropoulos, P.; Chryssolouris, G. On optical design limitations of generalized two-mirror remote beam delivery laser systems: The case of remote welding. Int. J. Adv. Manuf. Technol. 2007, 32, 932–941. [Google Scholar] [CrossRef]
- Franciosa, P.; Serino, A.; Botros, R.A.; Ceglarek, D. Closed-loop gap bridging control for remote laser welding of aluminum components based on first principle energy and mass balance. J. Laser Appl. 2019, 31, 022416. [Google Scholar] [CrossRef] [Green Version]
- Li, L.; Gong, J.; Xia, H.; Peng, G.; Hao, Y.; Meng, S. Influence of Scan Paths on Flow Dynamics and Weld Formations during Oscillating Laser Welding of 5A06 Aluminum Alloy. J. Mater. Res. Technol. 2020, 11, 19–32. [Google Scholar] [CrossRef]
- Franciosa, P.; Sokolov, M.; Sinha, S.; Sun, T.; Ceglarek, D. Deep learning enhanced digital twin for Closed-Loop In-Process quality improvement. CIRP Ann. Manuf. Technol. 2020, 69, 369–372. [Google Scholar] [CrossRef]
- Das, A.; Butterworth, I.; Masters, I.; Williams, D. Evaluation of key geometrical and mechanical properties for remote laser welded AC-170PX aluminium joints. J. Laser Micro. Nanoeng. 2019, 14, 1–7. [Google Scholar] [CrossRef]
- ISO 20653:2013. Road Vehicles-Degrees of Protection (IP code)-Protection of Electrical Equipment against Foreign Objects, Water and Access; International Organization for Standardization: Geneva, Switzerland, 2013. [Google Scholar]
- Graf, A. Aluminum alloys for lightweight automotive structures. In Materials, Design and Manufacturing for Lightweight Vehicles; Woodhead Publishing: Cambridge, UK, 2021; pp. 97–123. [Google Scholar] [CrossRef]
- Ghaini, F.M.; Sheikhi, M.; Torkamany, M.J.; Sabbaghzadeh, J. The relation between liquation and solidification cracks in pulsed laser welding of 2024 aluminium alloy. Mater. Sci. Eng. A 2009, 519, 167–171. [Google Scholar] [CrossRef]
- Zhao, H.; White, D.R.; Debroy, T. Current issues and problems in laser welding of automotive aluminum alloys. Int. Mater. Rev. 1999, 44, 238–266. [Google Scholar] [CrossRef]
- Hagenlocher, C.; Weller, D.; Weber, R.; Graf, T. Analytical description of the influence of the welding parameters on the hot cracking susceptibility of laser beam welds in aluminum alloys. Metall. Mater. Trans. A Phys. Metall. Mater. Sci. 2019, 50, 5174–5180. [Google Scholar] [CrossRef]
- Dudas, H.J. Preventing weld cracks in high strength aluminum alloys. Weld. J. 1966, 45, 3. [Google Scholar]
- Sun, T.; Franciosa, P.; Sokolov, M.; Ceglarek, D. Challenges and opportunities in laser welding of 6xxx high strength aluminium extrusions in automotive battery tray construction. Procedia CIRP 2020, 94, 565–570. [Google Scholar] [CrossRef]
- Wang, X.; Lu, F.; Wang, H.P.; Qu, Z.; Xia, L. Micro-scale model based study of solidification cracking formation mechanism in Al fiber laser welds. J. Mater. Process. Technol. 2016, 231, 18–26. [Google Scholar] [CrossRef]
- Hagenlocher, C.; Weller, D.; Weber, R.; Graf, T. Reduction of the hot cracking susceptibility of laser beam welds in AlMgSi alloys by increasing the number of grain boundaries. Sci. Technol. Weld. Join. 2019, 24, 313–319. [Google Scholar] [CrossRef] [Green Version]
- Guitterez, L.A.; Neye, G.; Zschech, E. Microstructure, hardness profile and tensile strength in welds of AA6013 T6 extrusions. Weld. J. 1996, 75, 4. [Google Scholar]
- Alshaer, A.W.; Li, L.; Mistry, A. Effect of filler wire properties on porosity formation in laser welding of AC-170PX aluminium alloy for lightweight automotive component manufacture. Proc. Inst. Mech. Eng. Part B J. Eng. Manuf. 2017, 231, 994–1006. [Google Scholar] [CrossRef]
- Kang, M.; Han, H.; Kim, C. Microstructure and solidification crack susceptibility of al 6014 molten alloy subjected to a spatially oscillated laser beam. Materials (Basel) 2018, 11, 648. [Google Scholar] [CrossRef] [Green Version]
- Langrieger, H.; Krafft, F.; Mensinger, M.; Oefele, F. Fundamental analysis of hot cracks in remote laser welded aluminium fillet welds. In Proceedings of the Lasers in Manufacturing Conference (LiM), Munich, Germany, June 2015. [Google Scholar]
- Langrieger, H.; Krafft, F.; Mensinger, M.; Oefele, F. Thermomechanical analysis of the formation of hot cracks in remote laser welded aluminium fillet welds. J. Laser Appl. 2016, 28, 022414. [Google Scholar] [CrossRef]
- Gaisne, D.; Leclercq, J.-P. Battery Tray for Vehicle and Method for Producing the Battery Tray. U.S. Patent Appl. US13/509,453, 6 September 2012. [Google Scholar]
- ISO 6892-1:2019. Metallic Materials-Tensile Testing—Part 1: Method of Test at Room Temperature; International Organization for Standardization: Geneva, Switzerland, 2019. [Google Scholar]
- ISO 12106:2017. Metallic Materials-Fatigue Testing-Axial-Strain-Controlled Method; International Organization for Standardization: Geneva, Switzerland, 2017. [Google Scholar]
- ISO EN13919-2. Welding–Electron and Laser Beam Welded Joints—Guidance on Quality Levels for Imperfections–Part 2; International Organization for Standardization: Geneva, Switzerland, 2001. [Google Scholar]
- Wang, L.; Gao, M.; Zhang, C.; Zeng, X. Effect of beam oscillating pattern on weld characterization of laser welding of AA6061-T6 aluminum alloy. Mater. Des. 2016, 108, 707–717. [Google Scholar] [CrossRef]
- Jiang, Z.; Chen, X.; Li, H.; Lei, Z.; Chen, Y.; Wu, S. Grain refinement and laser energy distribution during laser oscillating welding of Invar alloy. Mater. Des. 2020, 186, 108195. [Google Scholar] [CrossRef]
- Kurz, W.; Fisher, D.J. Fundamentals of Solidification; Trans Tech Publications Ltd.: Aedermannsdorf, Switzerland, 1989. [Google Scholar]
- Zain-ul-Abdein, M.; Nelias, D.; Jullien, J.F.; Deloison, D. Prediction of laser beam welding-induced distortions and residual stresses by numerical simulation for aeronautic application. J. Mater. Process. Technol. 2009, 209, 2907–2917. [Google Scholar] [CrossRef]
- Sheikhi, M.; Malek Ghaini, F.; Torkamany, M.J.; Sabbaghzadeh, J. Characterisation of solidification cracking in pulsed Nd:YAG laser welding of 2024 aluminium alloy. Sci. Technol. Weld. Join. 2009, 14, 161–165. [Google Scholar] [CrossRef]
- Tang, Z.; Vollertsen, F. Influence of grain refinement on hot cracking in laser welding of aluminum. Weld. World 2014, 58, 355–366. [Google Scholar] [CrossRef]
- Zhan, Y.; Zhang, E.; Ge, Y.; Liu, C. Residual stress in laser welding of TC4 titanium alloy based on ultrasonic laser technology. Appl. Sci. 2018, 8, 1997. [Google Scholar] [CrossRef] [Green Version]
- Serino, A. Development of Closed-Loop Gap Bridging Architecture for Remote Laser Welding of 5xxx Series Aluminium Alloy. Master’s Thesis, University of Warwick, Coventry, UK, 2018. [Google Scholar]
- Riggs, B.; Benatar, A.; Alexandrov, B.T.; Xu, R. Experimental validation of damage zone models for Lap-Shear brazed joints using DIC. Weld. J. WRS 2017, 421–428. [Google Scholar]
- Hansen, N. Hall-petch relation and boundary strengthening. Scr. Mater. 2004, 51, 801–806. [Google Scholar] [CrossRef]
- Shiozaki, T.; Yamaguchi, N.; Tamai, Y.; Hiramoto, J.; Ogawa, K. Effect of weld toe geometry on fatigue life of lap fillet welded ultra-high strength steel joints. Int. J. Fatigue 2018, 116, 409–420. [Google Scholar] [CrossRef]
- Bergmann, J.P.; Herold, S. Influence of processing conditions on the mechanical properties of aluminium overlap joints: A case study. Weld. World 2006, 50, 55–64. [Google Scholar] [CrossRef]


| Chemical Composition Limits | |||||||||
|---|---|---|---|---|---|---|---|---|---|
| Weight % | Si | Fe | Cu | Mn | Mg | Zn | Ti | Cr | Al |
| Minimum | 0.2 | - | - | - | 0.45 | - | - | - | Balance |
| Maximum | 0.6 | 0.35 | 0.1 | 0.1 | 0.9 | 0.1 | 0.1 | 0.1 | Balance |
| Processing Window | Sx [m/min] | ƒ [Hz] | Oy [mm] | PA [kW] | PB [kW] | PC [kW] | Line Energy [J/mm] |
|---|---|---|---|---|---|---|---|
| S2-F50 | 2 | 50 | 0.4 | 1.74 | 3.25, 3.13, 2.90, 2.67 | 1.45 | 72.68, 70.88, 67.43, 64.07 |
| S4-F100 | 4 | 100 | 0.7 | 2.55 | 5.28, 5.05, 4.81, 4.59 | 2.32 | 57.86, 56.14, 54.34, 52.69 |
| S6-F150 | 6 | 150 | 0.3 | 4.52 | 5.80, 5.57, 5.34, 5.10 | 3.48 | 49.00, 47.85, 46.70, 45.50 |
Publisher’s Note: MDPI stays neutral with regard to jurisdictional claims in published maps and institutional affiliations. |
© 2021 by the authors. Licensee MDPI, Basel, Switzerland. This article is an open access article distributed under the terms and conditions of the Creative Commons Attribution (CC BY) license (https://creativecommons.org/licenses/by/4.0/).
Share and Cite
Sun, T.; Franciosa, P.; Liu, C.; Pierro, F.; Ceglarek, D. Effect of Micro Solidification Crack on Mechanical Performance of Remote Laser Welded AA6063-T6 Fillet Lap Joint in Automotive Battery Tray Construction. Appl. Sci. 2021, 11, 4522. https://doi.org/10.3390/app11104522
Sun T, Franciosa P, Liu C, Pierro F, Ceglarek D. Effect of Micro Solidification Crack on Mechanical Performance of Remote Laser Welded AA6063-T6 Fillet Lap Joint in Automotive Battery Tray Construction. Applied Sciences. 2021; 11(10):4522. https://doi.org/10.3390/app11104522
Chicago/Turabian StyleSun, Tianzhu, Pasquale Franciosa, Conghui Liu, Fabio Pierro, and Dariusz Ceglarek. 2021. "Effect of Micro Solidification Crack on Mechanical Performance of Remote Laser Welded AA6063-T6 Fillet Lap Joint in Automotive Battery Tray Construction" Applied Sciences 11, no. 10: 4522. https://doi.org/10.3390/app11104522
APA StyleSun, T., Franciosa, P., Liu, C., Pierro, F., & Ceglarek, D. (2021). Effect of Micro Solidification Crack on Mechanical Performance of Remote Laser Welded AA6063-T6 Fillet Lap Joint in Automotive Battery Tray Construction. Applied Sciences, 11(10), 4522. https://doi.org/10.3390/app11104522