Abstract
The use of high-tension bars to strengthen flexural members is gaining increasing interest. However, the applicability of current standards to such bars is uncertain, because there may not be a definite yield strength and it may be unclear whether the tensile or compressive failure mode dominates. Determining the balanced–destruction steel ratio is particularly difficult. We measure the bending behaviour of flexural members containing high-tension bars with different yield strengths and tensile steel ratios. We conclude that the maximum-steel-ratio regulation and nominal -strength equation in the current standard remain applicable.
1. Introduction
Employing high-tension bars in reinforced concrete structures can reduce steel usage and allow extra spacing for bar arrangement in members, thus improving workability, shortening construction time, and using joint details.
Currently, the Eurocode II permits a design yield strength of up to 600 MPa for longitudinal bars; Japan and the U.S. are also gradually permitting the use of high-tension bars. In South Korea, the current design standard for concrete structures (established by the Korea Concrete Institute) specifies 550 MPa as the upper limit of the design yield strength for longitudinal bars. However, according to the provision of Article 1.2.5 (5) [1], ‘This standard may not be applied when the design is performed by special research’. This appears to mean that longitudinal bars with a design yield strength of 600 MPa or higher could be used when their performance has been proven experimentally [2]. For the practical application of high-tension bars, the applicability of the standard equations for flexure, shear, adhesion, and axial force must be verified, and new standard equations should be proposed if necessary [3,4,5,6].
On the contrary, the high yield strain of Grade 690 MPa HS steel bars can make flexural members more susceptible to brittle flexural failures, where concrete fails by crushing in compression before steel yielding [7,8]. The use of high-strength fibre-reinforced concrete (HSFRC) is a practical solution to this problem, because it enhances compression toughness and tensile resistance. Indeed, Aldabagh et al. [8] have shown that increasing concrete strength and adopting fibres can improve the overall flexural behaviour and ductility of ASTM A1035-reinforced concrete beams. Daniel and Loukili [9], Lepage et al. [10], and Tavallali et al. [11] have also noted that the use of fibres is effective for increasing the energy-dissipation capacity of HS steel–reinforced concrete (HSS–RC) beams and columns subjected to cyclic load reversals.
Recently, several studies have demonstrated the ability of steel fibres to increase the dynamic resistance of high-strength concrete subjected to impact and blast loads. For example, Song et al. [12], Wang et al. [13], and Jin et al. [14] have shown that fibres enhance the cracking and failure response of HSC subjected to low- and high-velocity impact loads. Similarly, Luccioni et al. [15] noted that steel fibres were effective in increasing the damage tolerance and blast capacity of HSC slabs subjected to close-in explosions. Likewise, various researchers (including Ulzurrun and Zanuy [16], Min et al. [17], Jin et al. [18], Lee et al. [19], Lee et al. [20], Magnusson et al. [21], and Algassem et al. [22]) have shown that fibres can be used to increase the dynamic resistance, deflection control, and damage tolerance of conventional and high-strength concrete beams subjected to impact and blast. The enhanced dynamic resistance qualities of HSFRC also make it an ideal material to improve the blast resistance of HSS–RC structures.
When high-tension bars without distinct yield plateaux are used in a flexural design, it can become difficult to distinguish between tension-dominated and compression-dominated failure modes, and thus, to define the steel ratio for ‘balanced failure’. Moreover, the conventional ductility based on yield strain may lose its importance, because a large strain can be generated even when there is no yield. It is also known that ductile fracture behaviour with a sufficiently large strain without failure under nominal flexural strength is possible even when there is no yield [23]. The strain ratio for nominal-strength behaviour versus working-load behaviour thus becomes a more important design factor than ductility. However, this strain ratio increases similar to the gravity load [24]. It is only appropriate when it is not experienced more than once during the bar’s life span and cannot be a suitable parameter for cyclic loads such as earthquake loads.
Seliem et al. [25,26,27] reported that high-performance-steel reinforcing bars had a higher tensile strength than conventional steel bars, increasing their useful life when used in the construction of bridges; they predicted that, when integrated with concrete, steel bars could be bent up to 90° without damage to the ultimate strength. Mast et al. [28] suggested a flexural strength design method for flexural members using high-strength steel bars. According to existing studies, including Ansely et al. [29], when conventional Grade 60 steel bars are replaced with high-tension bars, a much larger flexural strength can be obtained while maintaining the ductile fracture characteristics. Ansely et al. [29] reported that a specimen reinforced with a high-tension bar had a higher toughness than the specimen reinforced with a conventional steel bar. Malhas [30], Vijay et al. [31], and Yotakhong [32] reported that ductile flexural failure behaviour could be induced from all specimens reinforced with high-tension bars; in their experiments, the stiffness of beams significantly decreased after cracking, more conspicuously at lower steel ratios. Sinha and Ferguson [33] conducted experiments with reinforced flexural members having the same tensile and compression steel ratios and found that the compressed steel bars reached the yield strain before the compression-side concrete failed. These bars endured a certain load even after the concrete failed, thus preventing the full failure of the members. In particular, strains of 0.005 to 0.006 were observed when the concrete failed; this was considered to be an effect of the compression-side high-tension bar [34,35]. This phenomenon only rarely occurred with general steel bars, which typically reach the yield strength during the failure of concrete.
The results of previous studies show the superiority of ultra-high-performance concrete (UHPC) over that of conventional or normal strength concrete in terms of higher compressive strength [36,37,38], higher tensile strength, more sustained post-cracking tensile strength [39,40], higher durability [41,42], and lower shrinkage and creep [43,44,45]. Over the past decade or two, UHPC has attracted the interest of the industry and research community due to its advanced mechanical and structural properties. UHPC has been adopted and used in several structural applications, particularly in highway and pedestrian bridges. UHPC can reduce the splice length of steel reinforcement [46,47,48]; it can be used for the connections between prefabricated bridge deck slabs [49,50,51]; it can even fill ducts for precast column-to-footing seismic connections [52].
The literature suggests that the design of flexural members using high-tension bars is possible; however, whether a reduction of steel amount (steel ratio) raises serviceability issues involving the reduction of the modulus of elasticity and an increase of cracks due to the reduced number of steel bars is yet to be established. The objective of flexural member design is ultimately to determine an appropriate range of load, member size, span, and support conditions that can reduce steel consumption while maintaining the same level of structural safety and satisfying serviceability conditions for deflection, cracking, and vibration of beams and slabs. This study performs static load experiments by applying high-tension bars to flexural members and examines the applicability of existing standard equations to the case of high-tension bars.
2. Materials and Methods
2.1. Planning and Fabrication of Specimens
To examine the flexural performance of high-tension bars, six specimens were planned, using as variables the yield strength and tensile steel ratio. The yield strengths of the bars were = 400 MPa or 600 MPa; their tensile steel ratios were 0.5, 0.75, and , where = 0.667 (Table 1) [53].
where is the concrete compressive strength. Equation (1) shows the ratio of rebar to yield stress when the concrete reaches the bending compression fracture strain ( = 0.003). Under the current standard, the yield strength of high-strength reinforcement is that when the strain of the reinforcement is 0.0035, at which point the reinforcement exists in the hardening range outside the elasticity.

Table 1.
Experimental variables of flexural members.
Each specimen was a rectangular beam with a width of 300 mm, a height of 400 mm (an effective depth of 339 mm), and a length of 4500 mm (Figure 1). The yield strength of the shear reinforced bar was specified as = 400 MPa and the shear-reinforced bars were arranged with D10@100. The compression steel bar was 2-D13 ( = 400 MPa), and the sheath thickness was 40 mm. When the outermost steel bar was D13, the central spacings of the steel bars were s = 93.5 mm for three tensile steel bars and s = 62.3 mm for four tensile steel bars.
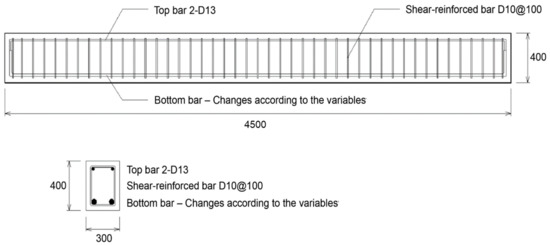
Figure 1.
Details of the flexural member specimen.
2.2. Experimental Materials
In this experiment, ready-mixed concrete was poured and naturally cured with a mixing strength of 21 MPa. The details of the concrete mix are summarised in Table 2.

Table 2.
Concrete mix.
Columnar specimens with a diameter of 100 mm and a height of 200 mm were fabricated simultaneously with the concrete placement according to KS F 2405. The compressive strength test result of the average 28-day concrete for the columnar specimens was 19.2 MPa, as listed in Table 3.

Table 3.
Compressive strength test results of the average 28-day concrete.
The steel bars used in specimen fabrication were high-tension bars (SD400) and ultra-high-tension bars (SD600). The strength measurement results of the ultra-high-tension bars according to the diameter were 653.3 MPa for average yield strength and 806.6 MPa for average tensile strength, as shown in Table 4.

Table 4.
Average yield strength and tensile strength of ultra-high-tension bar (SD600).
2.3. Experimental Method
Each specimen was installed in a universal testing machine with a maximum capacity of 3000 kN; the load had two simple support points (Figure 2 and Figure 3). To measure the displacement of the specimen, a linear variable differential transformer (LVDT) was installed on each side of the loading point at the centre, and the displacement of the specimen centre was measured. The strain of the tensile steel bars was measured by attaching the LVDTs to the steel bars at both ends when the type of steel bar specimen was the same or different.
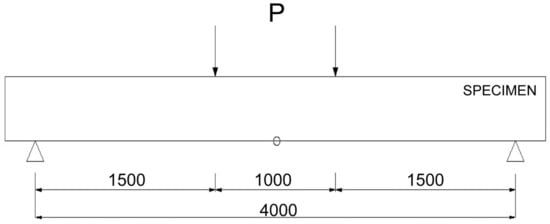
Figure 2.
Loading and displacement measurement positions on flexural member specimen.
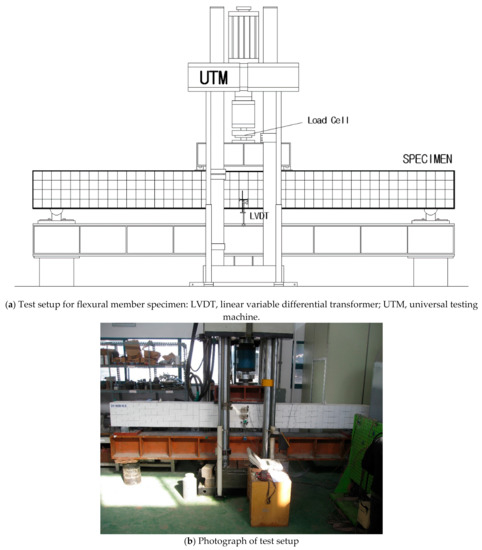
Figure 3.
Test setup for flexural member specimen.
The neutral axis of the concrete was identified using two LVDTs attached at 0, 50, 100, and 200 mm from the compressed edge. In addition, the widths of cracks at the loaded part of the specimen centre were measured for a displacement of 5 mm using a crack microscope (10 times).
The displacement was measured while changing the load. To check the initial cracks before the maximum load was reached, the load was applied at a relatively low speed of 0.03 mm/s. When it was determined that the maximum load had been reached, the loading speed was doubled to 0.06 mm/s.
3. Results
3.1. Flexural Member Experiment Results
The flexural member experiment was conducted with two simple points of support, and the displacement of the centre was measured. In addition, the widths of the cracks in the centre were measured for a displacement of 5 mm. The experiment was conducted considering the typical yield of rebar for all subjects. The initial crack occurred in the centre of the subject; further, as the load increased, the number of cracks in the centre and the crack width increased. After reaching the yield load, sinusoidal cracks occurred at both ends. Upon surpassing the yield load, the displacement increased rapidly, and the experiment was terminated. The fracture of the subject was bent in a destructive manner and occurred in the pure bending section of the subject for the first time, wherein cracks progress from the centre to the supporting point. The overall crack patterns in all subjects were similar. The initial crack generation, yield load, and maximum load for each member are listed in Table 5.

Table 5.
Flexural member experiment results.
3.2. Flexural Member Experiment Results
For the flexural member experiment, two-point loading was performed and the displacement at the centre was measured. In addition, the widths of the cracks at the centre were measured for a displacement of 5 mm, as shown in Figure 4.
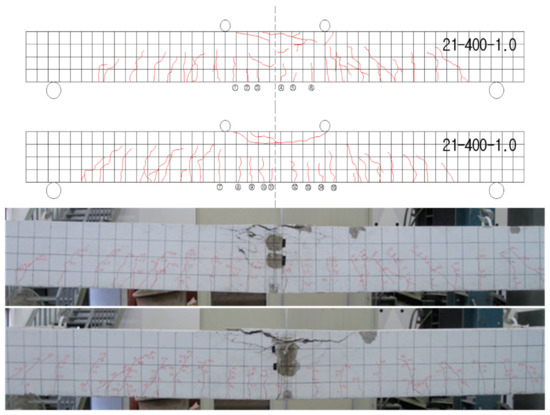
Figure 4.
Cracks after the end of the experiment on the 21-400-1.0 specimen.
The experiment was conducted considering the typical yield of steel bars for every specimen. The initial cracks were generated at the centre of the specimen. The number and width of the cracks at the centre increased with the load. Diagonal cracks were generated at both ends after reaching the yield load. Upon surpassing the yield load, the displacement increased sharply as the load gradually increased, and the experiment was terminated. The failure mode of the specimen was a flexural failure, and the cracking pattern also indicated the flexural failure, as a vertical crack occurred first in the pure bending section at the centre of the specimen, following which the crack progressed from the centre to the support point. All specimens showed similar overall cracking modes in general.
The load–displacement curves of each member and the load–strain curves of concrete and steel bars are shown in Figure 5, Figure 6 and Figure 7. The initial crack, yield load, and maximum load results are summarised in Table 6.
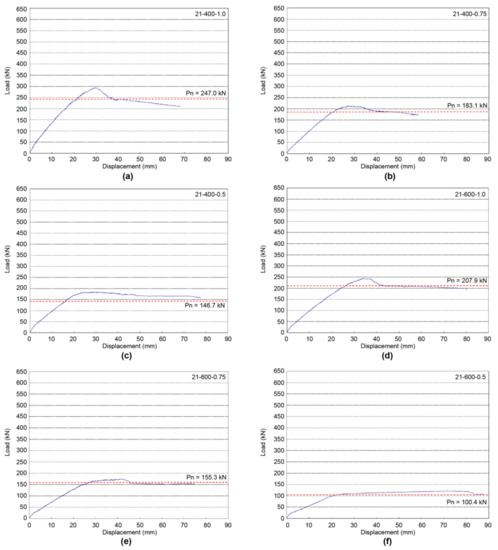
Figure 5.
Load–displacement curves of specimens: (a) 21-400-1.0 specimen; (b) 21-400-0.75 specimen; (c) 21-400-0.5 specimen; (d) 21-600-1.0 specimen; (e) 21-600-0.75 specimen; (f) 21-600-0.5 specimen.
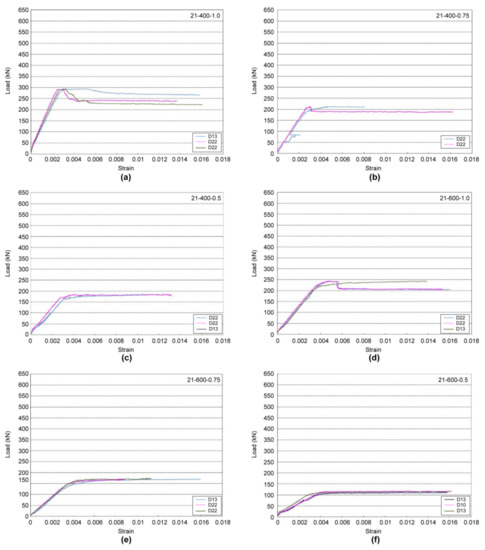
Figure 6.
Load–strain curves of specimens (concrete): (a) 21-400-1.0 specimen; (b) 21-400-0.75 specimen; (c) 21-400-0.5 specimen; (d) 21-600-1.0 specimen; (e) 21-600-0.75 specimen; (f) 21-600-0.5 specimen.
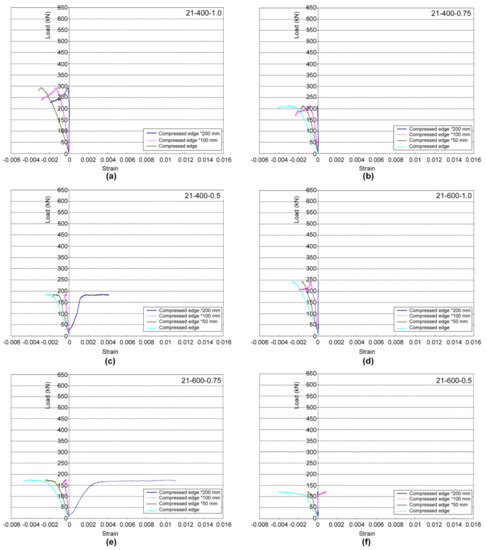
Figure 7.
Load–strain curves of specimens (steel bars): (a) 21-400-1.0 specimen; (b) 21-400-0.75 specimen; (c) 21-400-0.5 specimen; (d) 21-600-1.0 specimen; (e) 21-600-0.75 specimen; (f) 21-600-0.5 specimen.

Table 6.
Flexural member experiment results.
For the 21-400-1.0 experiment, compressive strength of 21 MPa of concrete, yield strength of 400 MPa of tensile rebar, and a tensile rebar ratio were considered. The load–displacement curves and the load–strain curves of rebar and concrete in the 21-400-1.0 specimen are shown in Figure 5a and Figure 6a. The initial crack in the 21-400-1.0 experiment resulted in an increase in the number of cracks and the crack width, along with an increase in the load. At the time of the initial crack, the load was 32.5 kN, with a displacement of 1.7 mm. The yield load was 287.3 kN, with a displacement of 27.7 mm, and the maximum load was 294.8 kN, with a displacement of 30.1 mm. After reaching the maximum load, the displacement rapidly increased as the load decreased, ending the experiment. Figure 7a shows the number of cracks and cracks after the end of the 21-400-1.0 experiment, along with the crack width between the weight points for each 5 mm displacement at the centre of the subject. Initial cracks appeared in the centre, and the allowable crack width was 0.3 mm in the wet environment; thus, if the average value was obtained via straight interpolation based on the measurement results of the crack width in the centre, the subject exceeded the allowable crack width by a minimum of 16.8 mm. In addition, the width of cracks in the centre of the subject exceeded the allowable crack width of 0.4 mm in dry environments by more than 22.5 mm in displacement. The load used was two-third of the nominal load, and the displacement was 12.4 mm, indicating that both the dry and wet environments are satisfied with the allowable crack width.
In the 21-400-0.75 experiment, the compressive strength of concrete was 21 MPa, the yield strength of tensile reinforcement was 400 MPa, and the tensile reinforcement ratio was considered. The load–displacement curve and the load–strain curve of rebar and concrete of 21-400-0.75 are shown in Figure 4b and Figure 5b. The initial crack in the 21-400-0.75 experiment resulted in an increase in the number of cracks and crack width, along with an increase in the load. The initial crack had a load of 18.8 kN, with a displacement of 1.1 mm. The yield load was 207.0 kN, with a displacement of 25.1 mm, and the maximum load was 213.0 kN, with a displacement of 27.7 mm. After reaching the maximum load, the displacement rapidly increased with the decrease in the load, and the experiment was ended. Figure 7b shows the number of cracks and cracks after the end of the 21-400-0.75 experiment, along with a measure of the crack width between the weight points of each 5 mm displacement of the centre of the 21-400-0.75 experiment. Initial cracks appeared in the centre, and the allowable crack width was 0.3 mm in the wet environment. Therefore, if the average value was obtained by straight interpolation based on the measurement results of the crack width of the centre, the subject exceeded the allowable crack width by more than 15.0 mm. In addition, the width of cracks in the centre of the subject exceeded the allowable crack width of 0.4 mm by 23.8 mm or higher in a dry environment. The load used was two-third of the nominal load, and the displacement was 122.1 kN, indicating that both the dry and wet environments are satisfied with the allowable crack width.
In the 21-400-0.5 experiment, the compressive strength of concrete was 21 MPa, the yield strength of tensile rebar was 400 MPa, and the tensile rebar ratio was considered. The load–displacement curve and the load–strain curve of rebar and concrete of the subject are shown in Figure 5c and Figure 6c. The initial crack in the 21-400-0.5 experiment resulted in an increase in the number of cracks and crack width, along with an increase in the load. The initial crack had a load of 21.8 kN, with a displacement of 1.2 mm. The yield load was 162.0 kN, with a displacement of 18.6 mm, and the maximum load was 185.3 kN, with a displacement of 28.4 mm. After reaching the maximum load, the displacement rapidly increased with the decrease in the load, and the experiment was ended. Figure 6c shows the number of cracks and fracture patterns after the end of the 21-400-0.5 experiment. Initial cracks appeared in the centre, and the allowable crack width was 0.3 mm in the wet environment. Therefore, if the average value was obtained by straight interpolation based on the measurement results of the crack width in the centre, the displacement exceeded the allowable crack width by 13.4 mm or higher. In addition, the width of cracks in the centre of the subject exceeded the allowable crack width of 0.4 mm by more than 18.5 mm with displacement in a dry environment. The load used was two-third of the nominal load, that is, 97.8 kN, and the displacement was 10.3 mm, indicating that both the dry and wet environments are satisfied with the allowable crack width.
In the 21-600-1.0 experiment, the compressive strength of concrete was 21 MPa, the yield strength of tensile reinforcement was 600 MPa, and a tensile reinforcement ratio was considered. The load–displacement curves and the load–strain curves of rebar and concrete of the subject are shown in Figure 5d and Figure 6d. The initial crack in the 21-600-1.0 experiment resulted in an increase in the number of cracks and crack width, along with an increase in the load. The initial crack had a load of 32.3 kN, with a displacement of 2.4 mm. The yield load was 220.5 kN, with a displacement of 27.7 mm, and the maximum load was 243.8 kN, with a displacement of 34.2 mm. After reaching the maximum load, the displacement rapidly increased with the decrease in the load, and the experiment was ended. Figure 6d shows the number of cracks and their appearance after the end of the experiment in the 21-600-1.0 experiment. Initial cracks appeared in the centre, and the allowable crack width was 0.3 mm in the wet environment. Therefore, if the average value was obtained based on the measurement results of the crack width in the centre, the subject exceeded the allowable crack width by more than 15.15 mm. In addition, the width of cracks in the centre of the subject exceeded the allowable crack width of 0.4 mm by more than 25 mm with displacement in a dry environment. The load used was two-third of the nominal load, which was 138 kN, and the displacement was 15.35 mm, which was not satisfied with the allowable crack width in the wet environment; however, the allowable crack width was satisfied in the dry environment.
In the 21-600-0.75 experiment, the compressive strength of concrete was 21 MPa, the yield strength of tensile reinforcement was 600 MPa, and the tensile reinforcement ratio was considered. The load–displacement curve and the load–strain curve of rebar and concrete of the subject are shown in Figure 5e and Figure 6e. The initial crack in the 21-600-0.75 experiment resulted in an increase in the number of cracks and crack width, along with an increase in the load. The initial crack had a load of 15.0 kN, with a displacement of 1.0 mm. The yield load was 157.5 kN, with a displacement of 26.4 mm, and the maximum load was 174.8 kN, with a displacement of 41.0 mm. After reaching the maximum load, the displacement rapidly increased with the decrease in the load, and the experiment was ended. Figure 6e shows the number of cracks and their appearance after the end of the experiment in the 21-600-0.75 experiment. Initial cracks appeared in the centre, and the allowable crack width was 0.3 mm in the wet environment. Therefore, if the average value was obtained by straight interpolation based on the measurement results of the crack width in the centre, the displacement exceeded the allowable crack width by 13.4 mm or higher. In addition, the width of cracks in the centre of the subject exceeded the allowable crack width of 0.4 mm by more than 16.5 mm with displacement in a dry environment. The load used was two-third of the nominal load, that is, 103 kN, and the displacement was 15.39 mm, which was not satisfied with the allowable crack width in the wet environment; however, the allowable crack width was satisfied in the dry environment.
In the 21-600-0.5 experiment, the compressive strength of concrete was 21 MPa, the yield strength of tensile reinforcement was 600 MPa, and a tensile reinforcement ratio was considered. The load–displacement curve and the load–strain curve of rebar and concrete of the subject are shown in Figure 5f and Figure 6f. The initial crack in the 21-600-0.5 experiment resulted in an increase in the number of cracks and crack width, along with an increase in the load. The initial crack had a load of 21.0 kN, with a displacement of 1.6 mm. The yield load was 105.8 kN, with a displacement of 22.6 mm, and until the maximum load reached the yield load, the load gradually increased, and the displacement significantly increased. The maximum load at this time was 122.3 kN, with a displacement of 74.7 mm. After reaching the maximum load, the displacement rapidly increased with the decrease in the load, and the experiment was ended. Figure 6f shows the number of cracks and their appearance after the end of the experiment in the 21-600-0.5 experiment. Initial cracks appeared in the centre, and the allowable crack width was 0.3 mm in the wet environment. Therefore, if the average value was obtained by straight interpolation based on the measurement results of the crack width in the centre, the subject exceeded the allowable crack width by 23.75 mm or higher. In addition, the width of cracks in the centre of the subject exceeded the allowable crack width of 0.4 mm by 35 mm or higher in a dry environment. The load used was two-third of the nominal load, that is, 67 kN, and the displacement at this time was 12.8 mm, indicating that both wet and dry environments satisfy the allowable crack width.
3.3. Comparison According to the Yield Strength of Tensile Steel Bars
To examine the effects of the yield strength of tensile steel bars, they were divided into two types (400 MPa, 600 MPa), and the experiment results are shown in Figure 8.
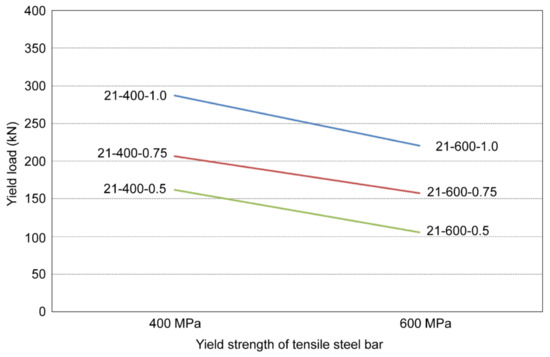
Figure 8.
Comparison of yield load according to the yield strength of tensile steel bars.
When the tensile steel ratio was 1.0, the tensile steel bar specimen with a yield strength of 600 MPa showed a nominal load, yield load, and maximum load 1.19, 1.3, and 1.21 times higher than those of the specimen with a yield strength of 400 MPa. When the tensile steel ratio was 0.75, the tensile steel bar specimen with a yield strength of 600 MPa showed a nominal load, yield load, and maximum load 1.18, 1.31, and 1.22 times higher than those of the specimen with a yield strength of 400 MPa. Furthermore, when the tensile steel ratio was 0.5, the tensile steel bar specimen with a yield strength of 600 MPa showed a nominal load, yield load, and maximum load 1.46, 1.53, and 1.52 times higher than those of the specimen with a yield strength of 400 MPa.
3.4. Comparison According to the Tensile Steel Ratio
To examine the effects of tensile steel ratio, three types of specimens (1.0, 0.75, and 0.5) were used in the experiment, and the results are shown in Figure 9.
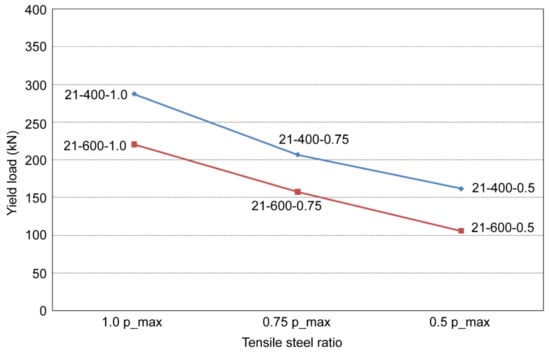
Figure 9.
Comparison of yield load according to the tensile steel ratio.
When the yield strength of the tensile steel bar was 400 MPa, the nominal loads, yield loads, and maximum loads of the specimens with tensile steel ratios of 0.75 and 1.0 were 1.25 and 1.68 times higher, 1.28 and 1.77 times higher, and 1.15 and 1.59 times higher than those of the specimen with a tensile steel ratio of 0.5, respectively. When the yield strength of the tensile steel bar was 600 MPa, the nominal loads, yield loads, and maximum loads of the specimens with tensile steel ratios of 0.75 and 1.0 were 1.55 and 2.07 times higher, 1.49 and 2.08 times higher, and 1.43 and 1.99 times higher than those of the specimen with a tensile steel ratio of 0.5, respectively.
4. Conclusions
To evaluate the applicability of the regulations presented in the current standards for the design of flexural members using the SD600 steel bar, the flexural performance of six beam members was measured using the yield strength ( = 400 MPa, = 600 MPa) and tensile steel ratio (1.0, 0.75, 0.5) of tensile steel bars as variables.
The conclusions from the experiment are as follows:
- (1)
- When the maximum-steel-ratio equation was tested, every specimen failed according to the typical flexural failure mode of beams preceded by the yield of tensile steel bars. As the load increased, the number and width of cracks at the centre increased. Diagonal cracks were generated at both ends after the yield load was reached. Thereafter, the displacement increased sharply with gradual increases of the load, and the specimen failed. When the SD600 steel bar was used up to the maximum steel ratio, the specimen showed a typical ductile flexural failure mode regardless of the concrete strength. When the maximum strength was reached, the steel bar had a strain of = 0.006, which is the minimum allowable strain for steel bars presented in the standard. This result suggests that the maximum-steel-ratio regulation in the current standard is applicable even when high-tension bars are used in flexural members.
- (2)
- When the nominal-flexural-strength equation was tested, the results for flexural members showed that on average the yield load and maximum load of every specimen were higher by 7.3% and 21.8% than the nominal load, respectively. Comparing steel bars of different strengths, it was found that when the SD400 bar was used, the yield load and maximum load were higher by approximately 10% and 24% than the nominal load, respectively. When the SD600 bar was used, the yield load and maximum load were higher by approximately 4% and 20% than the nominal load, respectively. The specimens showed the ductile fracture mode even with the SD600 steel bar, and the yield load of every specimen was higher than the nominal strength given by the equation presented in the standard [53]. In view of this, it is believed that the nominal flexural strength of members using the SD600 can be determined by applying the nominal-strength equation presented in the current standard [53].
Author Contributions
Conceptualisation, M.L.; methodology, M.L.; investigation, M.L.; data curation, M.L.; writing—original draft preparation, C.L.; writing—review and editing, C.L. Both authors have read and agreed to the published version of the manuscript.
Funding
This work was supported by a National Research Foundation of Korea (NRF) grant funded by the Korean government (NRF-2018R1D1A1B07049390).
Institutional Review Board Statement
Not applicable.
Informed Consent Statement
Not applicable.
Data Availability Statement
Not applicable.
Conflicts of Interest
The authors declare no conflict of interest.
References
- Korea Concrete Institute (KCI). Concrete Structural Design Standards Handbook; Korea Concrete Institute (KCI): Seoul, Korea, 2008; pp. 73–126. [Google Scholar]
- A Study on the Applicability of High Tension Bars to Concrete Structures; Korea Concrete Institute: Seoul, Korea, 2010.
- Yoo, S.-H.; Hallgren, M. A Study on the Behaviour of Reinforced High-Strength-Concrete Beams Subjected to Flexure. Arch. Inst. Korea Conf. Proc. 1995, 15, 553–558. [Google Scholar]
- Yoon, D.-Y. A Study on Applicability of High Strength Steel Bars. In Proceedings of the Korean Society of Civil Engineering Conference Proceedings, Pyungchang, Korea, 2004; pp. 1966–1971. [Google Scholar]
- Kang, S.-H. An experimental study on the flexural behaviour of reinforced high-strength concrete members with high-tension bars. Korean Soc. Civil. Eng. J. 1995, 15, 107–117. [Google Scholar]
- Park, M.-Y.; Kim, S.-S.; Lee, S.-B.; Kim, C.-H.; Kim, G.-S. Analysis on the influence of moment distribution shape on the effective moment of inertia of simply supported reinforced concrete beams. Korea Concr. Inst. J. 2009, 21, 93–103. [Google Scholar] [CrossRef]
- Baran, E.; Arsava, T. Flexural Strength Design Criteria for Concrete Beams Reinforced with High-Strength Steel Strands. Adv. Struct. Eng. 2012, 15, 1781–1792. [Google Scholar] [CrossRef]
- Aldabagh, S.; Abed, F.; Yehia, S. Effect of types of concrete on flexural behavior of beams reinforced with high-strength steel bars. ACI Struct. J. 2018, 115, 351–364. [Google Scholar] [CrossRef]
- Daniel, L.; Loukili, A. Behavior of high strength fiber-reinforced concrete beams under cyclic loading. ACI Struct. J. 2002, 99, 248–256. [Google Scholar]
- Lepage, A.; Tavallali, H.; Pujol, S.; Rautenberg, J.M. High-performance steel bars and fibers as concrete reinforcement for seismic-resistant frames. Adv. Civil. Eng. 2012, 2012, 450981. [Google Scholar] [CrossRef]
- Tavallali, H.; Lepage, A.; Rautenberg, J.M.; Pujol, S. Concrete beams reinforced with high-strength steel subjected to displacement reversals. ACI Struct. J. 2014, 111, 1037–1047. [Google Scholar] [CrossRef]
- Song, P.S.; Wu, J.C.; Hwang, S.; Sheu, B.C. Assessment of statistical variations in impact resistance of high-strength concrete and high-strength steel fiber-reinforced concrete. Cem. Concr. Res. 2005, 35, 393–399. [Google Scholar] [CrossRef]
- Wang, S.; Zhang, M.-H.; Quek, S.T. Effect of high strain rate loading on compressive behaviour of fibre-reinforced high-strength concrete. Mag. Concr. Res. 2011, 63, 813–827. [Google Scholar] [CrossRef]
- Jin, L.; Zhang, R.B.; Tian, Y.D.; Dou, G.Q.; Du, X.L. Experimental investigation on static and dynamic mechanical properties of steel fiber reinforced ultra-high-strength concretes. Constr. Build. Mater. 2018, 178, 102–111. [Google Scholar] [CrossRef]
- Luccioni, B.; Isla, F.; Codina, R.; Ambrosini, D.; Zerbino, R.; Giaccio, G.; Torrijos, M.C. Effect of steel fibers on static and blast response of high strength concrete. Int. J. Impact Eng. 2017, 107, 23–37. [Google Scholar] [CrossRef]
- Ulzurrun, G.S.D.; Zanuy, C. Enhancement of impact performance of reinforced concrete beams without stirrups by adding steel fibers. Constr. Build. Mater. 2017, 145, 166–182. [Google Scholar] [CrossRef]
- Min, K.-H.; Kwon, K.Y.; Lee, J.-Y.; Yoon, Y.-S. Effects of steel fibre and shear reinforcement on static and impact load resistances of concrete beams. Mag. Concr. Res. 2014, 66, 998–1006. [Google Scholar] [CrossRef]
- Jin, L.; Zhang, R.; Dou, G.; Xu, J.; Du, X. Experimental and numerical study of reinforced concrete beams with steel fibers subjected to impact loading. Int. J. Damage Mech. 2017, 27, 1058–1083. [Google Scholar] [CrossRef]
- Lee, J.-Y.; Shin, H.-O.; Yoo, D.-Y.; Yoon, Y.-S. Structural response of steel-fiber-reinforced concrete beams under various loading rates. Eng. Struct. 2018, 156, 271–283. [Google Scholar] [CrossRef]
- Lee, J.-Y.; Shin, H.-O.; Min, K.-H.; Yoon, Y.-S. Flexural assessment of blast-damaged RC beams retrofitted with CFRP sheet and steel fiber. Int. J. Polym. Sci. 2018, 2018, 1–9. [Google Scholar] [CrossRef]
- Magnusson, J.; Hallgren, M.; Ansell, A. Air-blast-loaded, high-strength concrete beams. Part I: Experimental investigation. Mag. Concr. Res. 2010, 62, 127–136. [Google Scholar] [CrossRef]
- Algassem, O.; Li, Y.; Aoude, H. Ability of steel fibers to enhance the shear and flexural behavior of high-strength concrete beams subjected to blast loads. Eng. Struct. 2019, 199, 109611. [Google Scholar] [CrossRef]
- Thusoo, S.; Obara, T.; Kono, S.; Miyahara, K. Design models for steel encased high-strength precast concrete piles under axial-flexural loads. Eng. Struct. 2021, 228, 111465. [Google Scholar] [CrossRef]
- Denavit, M.D.; Hajjar, J.F. Nonlinear Seismic Analysis of Circular Concrete-Filled Steel Tube Members and Frames. J. Struct. Eng. ASCE 2011, 138, 1089–1098. [Google Scholar] [CrossRef]
- Seliem, H.M.A. Behavior of Concrete Bridges Reinforced with High-Performance Steel Reinforcing Bars. Ph.D. Thesis, North Carolina State University, Raleigh, NA, USA, 2007. [Google Scholar]
- Seliem, H.M.; Hosny, A.; Rizkalla, S.; Zia, P.; Briggs, M.; Miller, S.; Darwin, D.; Browning, J.; Glass, G.M.; Hoyt, K.; et al. Bond Characteristics of ASTM A1035 steel reinforcing bars. ACI Struct. J. 2009, 106, 530–539. [Google Scholar]
- Hosny, A.; Seliem, H.M.; Rizkalla, S.; Zia, P. Development length of unconfined conventional and high-strength steel reinforcing bars. ACI Struct. J. 2011, 109, 655–664. [Google Scholar]
- Bing, L.; Park, R.; Tanaka, H. Stress-strain behavior of high-strength concrete confined by ultra-high- and normal-strength transverse reinforcements. ACI Struct. J. 2001, 98, 395–406. [Google Scholar] [CrossRef]
- Ansley, M.H. Investigation into the Structural Performance of MMFX Reinforcing. In Structures Research Report; Florida Department of Transportation: Tallahassee, FL, USA, 2002. [Google Scholar]
- Malhas, F.A. Preliminary Experimental Investigation of the Flexural Behavior of Reinforced Concrete Beams using MMFX Steel. In Final Report for MMFX Technologies Corporation; University of North Florida: Jacksonville, FL, USA, 2002. [Google Scholar]
- Vijay, P.V.; GangaRao, H.V.S.; Prachasaree, W. Bending Behavior of Concrete Beams Reinforced with MMFX Steel Bars; West Virginia University: Morgantown, WV, USA, 2002. [Google Scholar]
- Yotakhong, P. Flexural Performance of MMFX Reinforcing Rebars in Concrete Structures. Master’s Thesis, North Carolina State University, Raleigh, NA, USA, 2003. [Google Scholar]
- Sinha, N.C.; Ferguson, P.M. Ultimate Strength with High Strength Reinforcing Steel with an Indefinite Point. Proc. Am. Concr. Inst. 1964, 61, 399–418. [Google Scholar]
- Rangan, B.V.; Sarker, P.K. Bending Stiffness of Concrete Flexural Members Reinforced with High Strength Steel. ACI Spec. Publ. 2001, 203, 143–156. [Google Scholar]
- El-Hacha, R.; El-Agroudy, H.; Rizkalla, S.H. Bond characteristic of high-strength steel reinforcement. ACI Struct. J. 2006, 103, 771–781. [Google Scholar]
- Graybeal, B.A. Compressive behavior of ultra-high-performance fibre-reinforced concrete. ACI Mater. J. 2007, 104, 146–152. [Google Scholar]
- Wille, K.; Naaman, A.E.; Parra-Montesinos, G.J. Ultra-high performance concrete with compressive strength exceeding 150 MPa (22 ksi): A simpler way. ACI Mater. J. 2011, 108. [Google Scholar]
- Shafieifar, M.; Farzad, M.; Azizinamini, A. Experimental and numerical study on mechanical properties of Ultra High Performance Concrete (UHPC). Constr. Build. Mater. 2017, 156, 402–411. [Google Scholar] [CrossRef]
- Graybeal, B.A.; Baby, F. Development of direct tension test method for ultra-high-performance fiber-reinforced concrete. ACI Mater. J. 2013, 110, 177–186. [Google Scholar]
- Voit, K.; Kirnbauer, J. Tensile characteristics and fracture energy of fiber reinforced and non-reinforced ultra high performance concrete (UHPC). Int. J. Fract. 2014, 188, 147–157. [Google Scholar] [CrossRef]
- Graybeal, B.; Tanesi, J. Durability of an ultrahigh-performance concrete. J. Mater. Civ. Eng. 2007, 19, 848–854. [Google Scholar] [CrossRef]
- Abbas, S.M.L.N.; Nehdi, M.L.; Saleem, M.A. Ultra-high performance concrete: Mechanical performance, durability, sustainability and implementation challenges. Int. J. Concr. Struct. Mater. 2016, 10, 271–295. [Google Scholar] [CrossRef]
- Burkart, I.; Müller, H.S. Creep and shrinkage characteristics of ultra high strength concrete (UHPC). In Proceedings of the Second International Symposium on Ultra High Performance Concrete, Kassel, German, 5–7 March 2008; pp. 469–476. [Google Scholar]
- Graybeal, B.A. Material Property Characterization of Ultra-High. Performance Concrete (No. FHWA-HRT-06-103); U.S. Federal Highway Administration, Office of Infrastructure Research and Development: McLean, VA, USA, 2006.
- Xu, Y.; Liu, J.; Liu, J.; Zhang, P.; Zhang, Q.; Jiang, L. Experimental studies and modeling of creep of UHPC. Constr. Build. Mater. 2018, 175, 643–652. [Google Scholar] [CrossRef]
- Marchand, P.; Baby, F.; Khadour, A.; Battesti, T.; Rivillon, P.; Quiertant, M.; Nguyen, H.; Genereux, G.; Deveaud, J.; Simon, A.; et al. Bond behaviour of reinforcing bars in UHPFRC. Mater. Struct. 2016, 49, 1979–1995. [Google Scholar] [CrossRef]
- Saleem, M.A.; Mirmiran, A.; Xia, J.; Mackie, K. Development length of high-strength steel rebar in ultrahigh performance concrete. J. Mater. Civil. Eng. 2012, 25, 991–998. [Google Scholar] [CrossRef]
- Yuan, J.; Graybeal, B. Bond of reinforcement in ultra-high-performance concrete. ACI Struct. J. 2015, 112, 851–860. [Google Scholar] [CrossRef]
- El-Tawil, S.; Alkaysi, M.; Naaman, A.E.; Hansen, W.; Liu, Z. Development, Characterization and Applications of a Non-Proprietary Ultra-High. Performance Concrete for Highway Bridges (No. RC-1637); Department of Civil and Environmental Engineering, University of Michigan: Ann Arbor, MI, USA, 2016. [Google Scholar]
- Graybeal, B.A. Behaviour of Field-Cast Ultra-High Performance Concrete Bridge Deck Connections under Cyclic and Static Structural Loading (No. FHWA-HRT-11-023); U.S. Federal Highway Administration: McLean, VA, USA, 2010.
- Verger-Leboeuf, S.; Charron, J.P.; Massicotte, B. Design and behavior of UHPFRC field-cast transverse connections between precast bridge deck elements. J. Bridge Eng. 2017, 22, 04017031. [Google Scholar] [CrossRef]
- Tazarv, M.; Saiid Saiidi, M. Next generation of bridge columns for accelerated bridge construction in high seismic zones. In Technical Report No. CA14-2176; University of Nevada: Reno, NV, USA, 2014. [Google Scholar]
- Robert, F.; Mast, M.D.; Sami, H.R.; Paul, Z. Flexural Strength Design of Concrete Beams Reinforced with High-Strength Steel Bars. ACI Struct. J. 2008, 105, 570–577. [Google Scholar]
Publisher’s Note: MDPI stays neutral with regard to jurisdictional claims in published maps and institutional affiliations. |
© 2021 by the authors. Licensee MDPI, Basel, Switzerland. This article is an open access article distributed under the terms and conditions of the Creative Commons Attribution (CC BY) license (https://creativecommons.org/licenses/by/4.0/).