1. Introduction
In modern society, with the increasing number of indoor activity hours of residents, the attention towards the necessity to manage indoor air quality and ventilation is also rising. In addition, in East Asian countries including South Korea, rapid economic development and industrialization have led to a high concentration of air pollutants, regardless of the season [
1,
2]. To improve the indoor environment without relying upon natural ventilation, the application of a mechanical ventilation system [
3], a forced ventilation method, has rapidly increased.
In South Korea, the installation of mechanical ventilation systems in new apartment buildings with more than 100 households has been mandatory since 2016, such that the ventilation of 0.5 room volumes per h can supply fresh external air to indoor spaces and the indoor air quality can be guaranteed up to a certain level [
4]. As such, the mechanical ventilation system has become an essential, not an optional, component for the management of indoor air quality and is mandatory in new or remodeled houses, as well as facilities for the children and elderly.
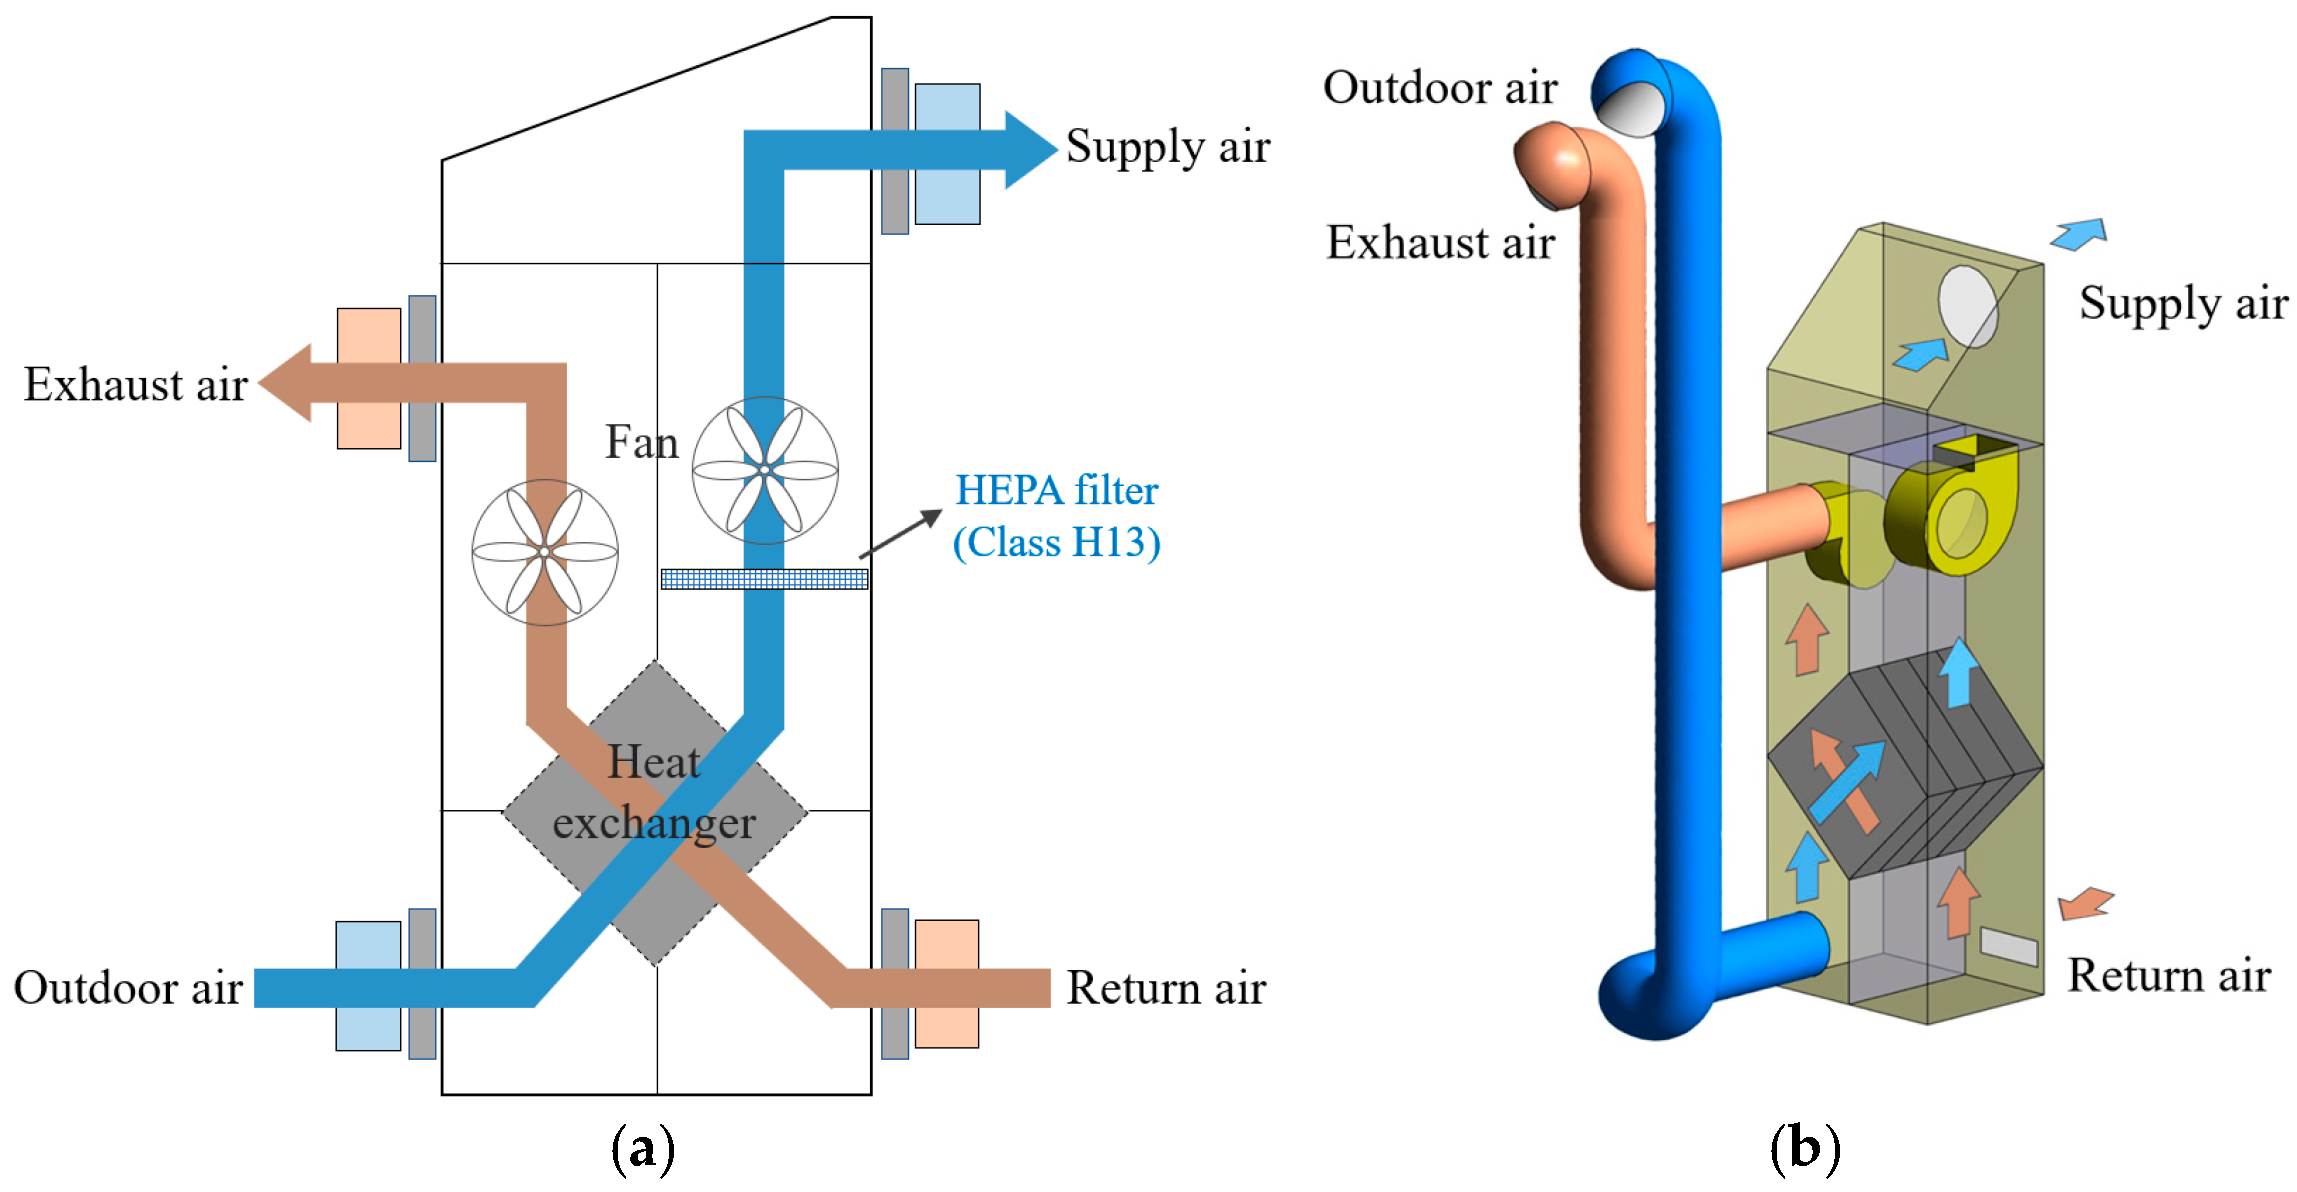
In contrast, no considerations are being taken regarding the surrounding environment and architectural conditions while deploying the intake and exhaust vents that significantly affect the performance of a ventilation system, and only the minimum distance between the intake and exhaust vents is used to arrange the ports uniformly. If the appropriate arrangement of intake and exhaust vents is not considered, the pollutants emitted from the building can be recirculated into the indoor environment via external air movement, as shown in
Figure 1, which can degrade the ventilation system’s performance. Until recently, most studies have focused on the ventilation rate and performance of the ventilation system [
5,
6,
7,
8,
9,
10], but only a few have considered the recirculation of exhaust air.
The methods for predicting the exhaust air recirculation rate in multistory buildings can generally be divided into the evaluation method through testing or actual measurement using a small-size model, or the computational fluid dynamics (CFD) analysis method via computer simulations [
11,
12,
13]. The former offers high reliability in the results because testing equipment is installed on site or in a wind tunnel lab to directly measure the recirculation rate. However, building a wind tunnel test is expensive, and the conditions of various parameters that can occur in reality may not be applied easily [
14]. In contrast, CFD analysis evaluates the recirculation rate of exhaust air by simulating an actual situation and applying a suitable physical model. While the measurement equipment in a test or actual measurement process can offer physical data at a specific point at which the equipment was installed, the CFD analysis can offer the data in the whole space. Furthermore, the recirculation rate of exhaust air on each floor can be quantitatively evaluated [
15,
16,
17].
Considering such benefits, this study aimed to analyze the recirculation rate of exhaust air in an actual kindergarten building with a mechanical ventilation system via CFD analysis and use the results as the basic data for designing a ventilation system.
2. Materials and Methods
2.1. The Cases and Boundary Condition of CFD Analysis
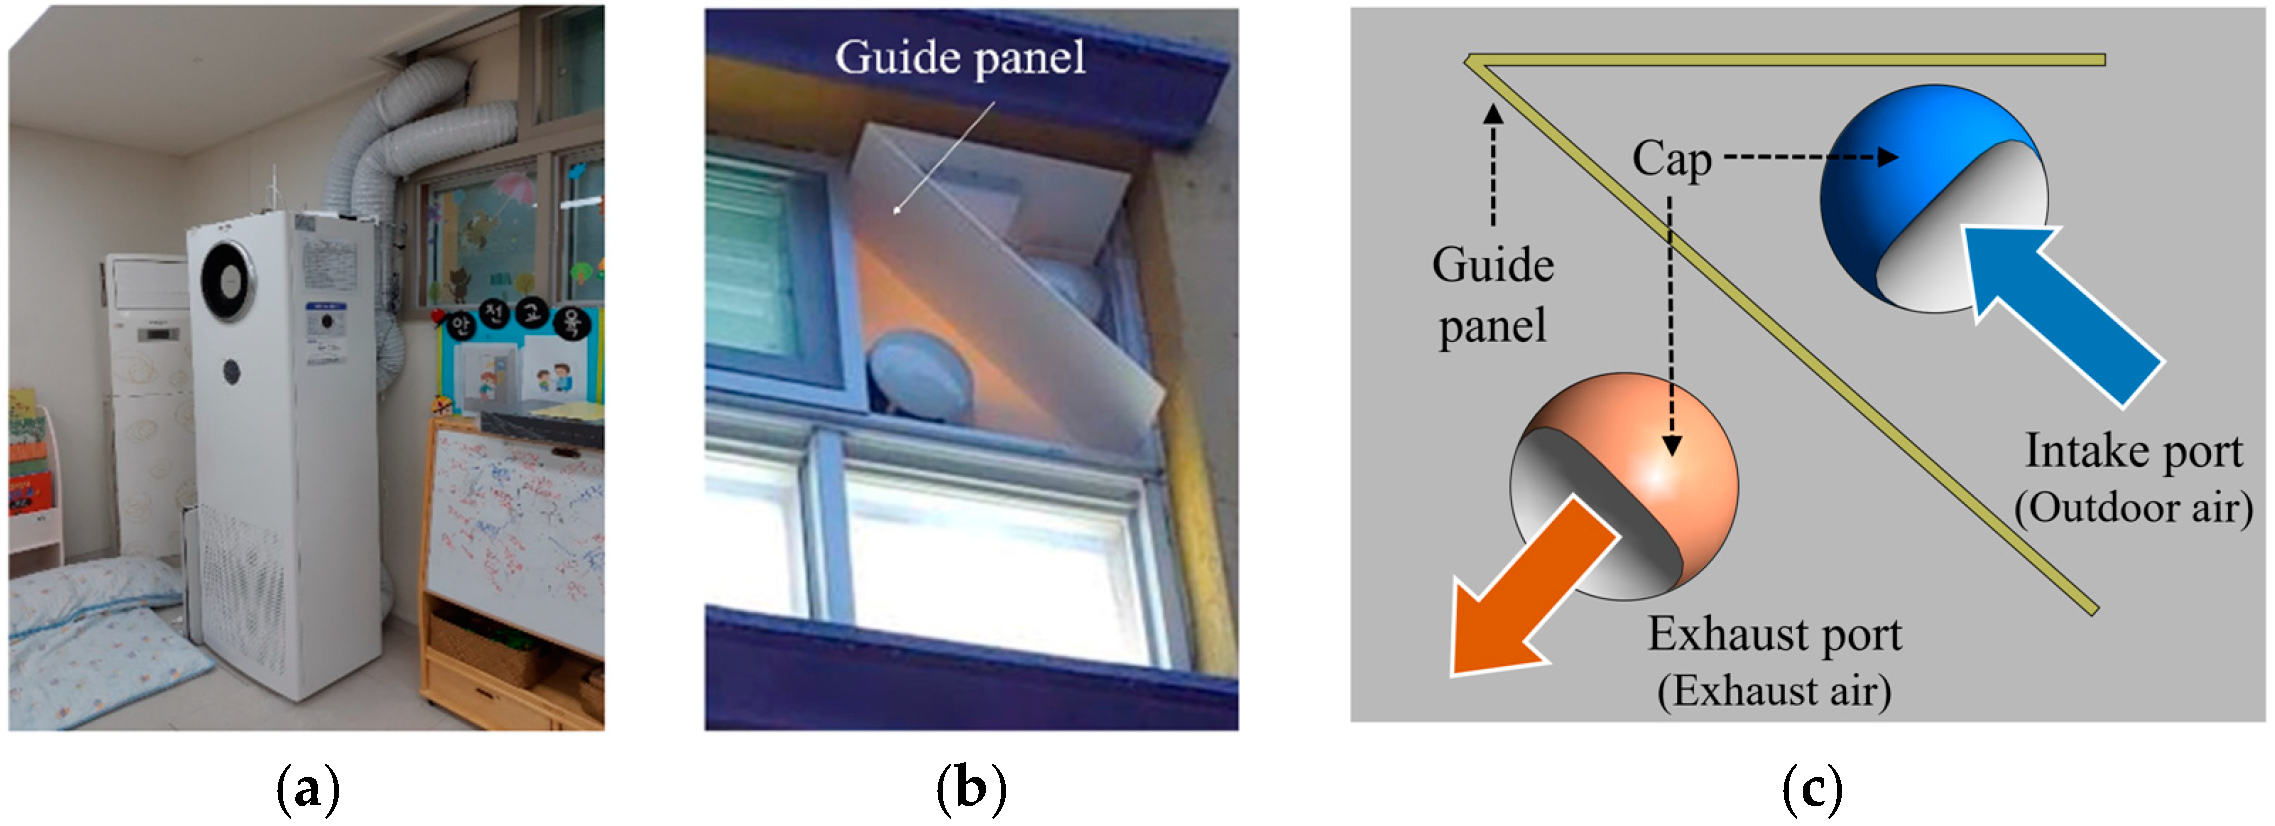
Targeting a kindergarten building with a mechanical ventilation system located in Seoul, this study evaluated the recirculation rate of exhaust air of the ventilation system, and
Figure 2 and
Figure 3 show the installation of the ventilation system and the geometry for CFD analysis. It is a five-story building with ventilation caps installed on the outer walls of each floor. For evaluating the recirculation rate of the exhaust air of the ventilation system via CFD analysis, the study used a commercial software called FLUENT 19.2 by ANSYS.
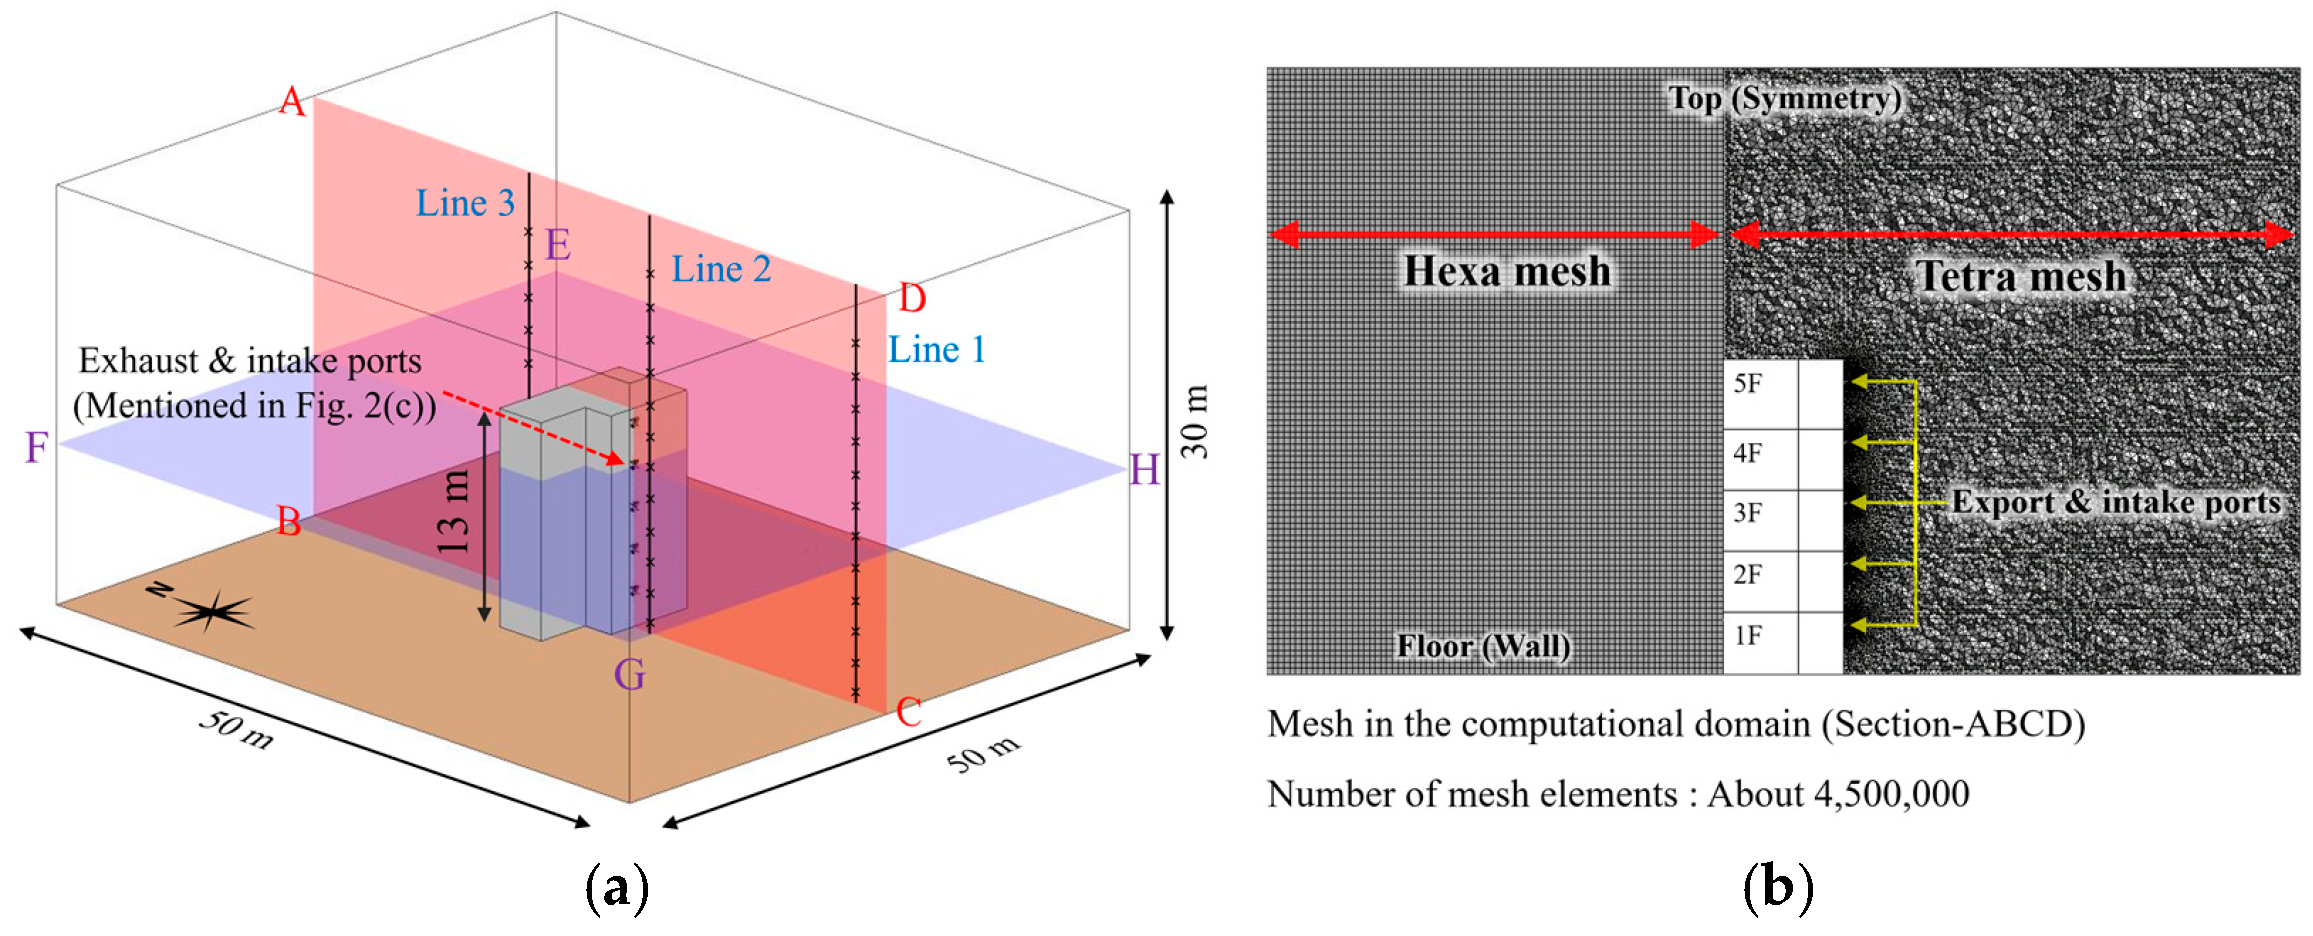
Table 1 shows CFD boundary conditions and CFD case conditions based on the external environment. The boundary conditions for CFD analysis are as follows: the turbulence analysis used the RNG k-ɛ turbulence model [
17,
18,
19,
20], the grid of the target space was tetra and hexa mesh, and the number of elements are about 4,500,000 [
21,
22]. Through the analysis performed before CFD analysis, the study determined that the effect of the CO
2 diffusion coefficient on the recirculation rate would be negligible, so that the exhaust air emitted from the ventilation unit in each floor was considered to exhibit identical properties to that of external air, through which the study could quantitatively analyze the effect of exhaust air emitted from each floor on the recirculation rate in each floor. Wind speed was based on the average wind speed in Seoul in August 2020, and three different wind directions were used, i.e., the front of the building (southerly wind θ = 180°), 45° from the building’s front (southwesterly wind θ = 225°), and the back of the building (northerly wind θ = 360°). VR refers to the average wind speed at the reference height. The ventilation rate in each floor at the boundary condition was 150, 250, and 400 m
3/h, respectively. The exhaust unit was assumed to operate at the same time and same way, and the ventilation system on each floor was set to run altogether. In addition, to determine the reduction in the recirculation rate of exhaust air via the guide panel installed between the intake and exhaust vents, Case 10 was set to the conditions of maximum recirculation in the absence of the guide panel.
2.2. Method of Evaluating the Recirculation Rate of Exhaust Air
A mass fraction boundary condition was applied to the CFD analysis. Thus, it is necessary to calculate the amount of air from each floor exhaust port to determine the recirculation rate of the exhaust air. Each component gas was given an ID, and the partial differential transport equations of each gas that passed through the control volume (CV) of the 3D space are as shown in Equation (1) [
23].
where
Yi is the mass fraction of the
i-th air constituent. Due to the reasonably low thermal parameters (pressure and temperature) of air, it can be treated as a rarified mixture.
In the experimental method, carbon dioxide (CO
2) or sulfur hexafluoride (SF6) is used as a tracer gas, and the concentration is monitored to analyze the recirculation rate of exhaust air [
24]. It has the advantage of being able to easily calculate the recirculation rate through the concentration detected by the measuring device. However, it is difficult to separately analyze the sources that affect the recirculation rate when several sources exist. Additionally, its molar mass is heavier than air. Therefore, the sum of the mass fraction of air at the intake port of each floor when calculating the exhaust recirculation rate is always one. The mass fraction ID gas value through an outdoor air channel can be subtracted from one and expressed as a percentage, and the recirculation rate of exhaust air can be calculated.
where
j is the floor, and
qjo is the mass fraction of outdoor air at
j.
2.3. Velocity Profile and Grid Independence Test for CFD Analysis
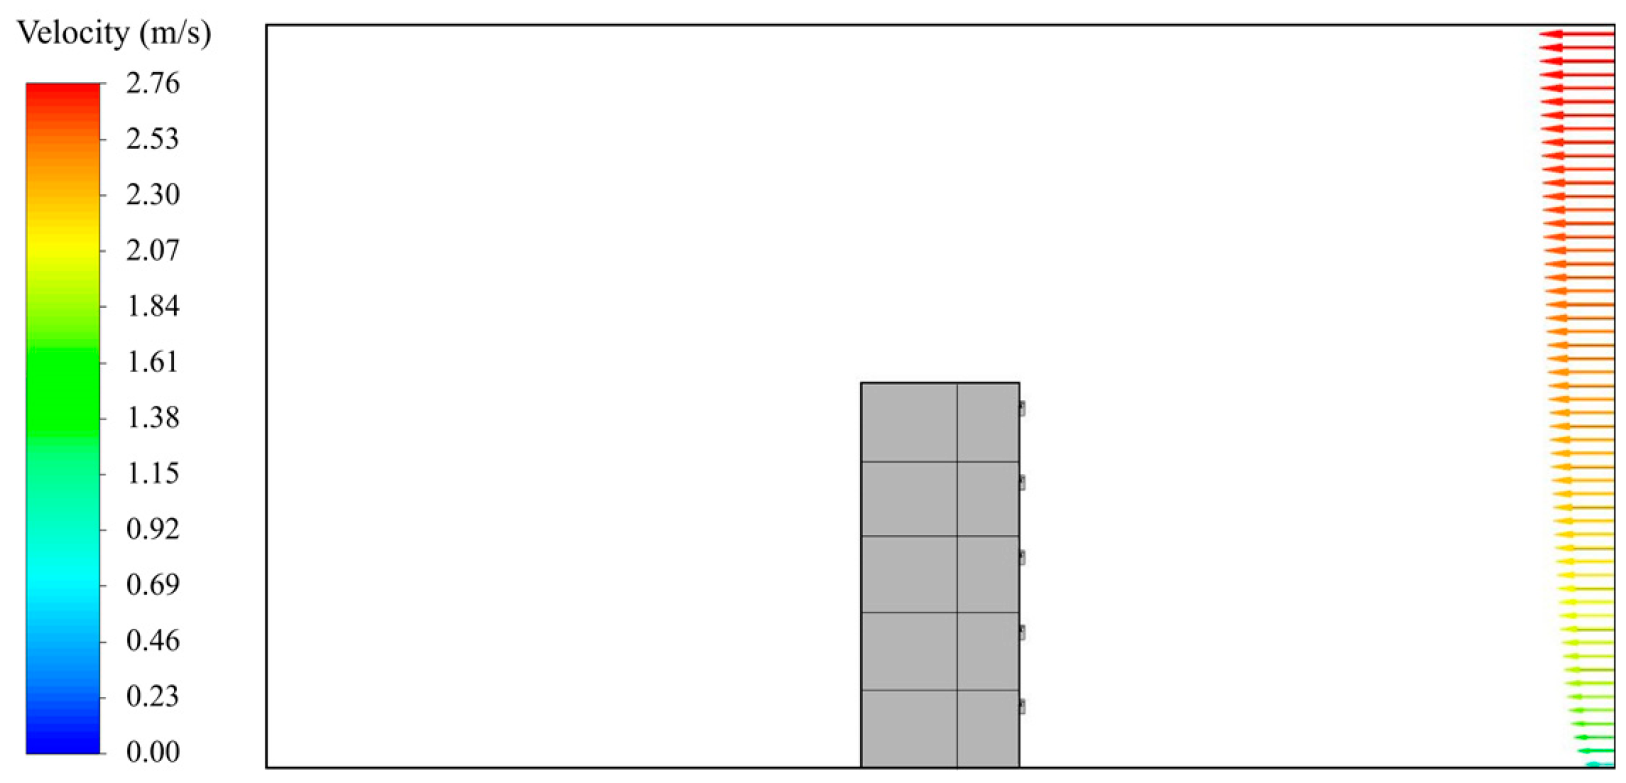
Vertical velocity profile shows the distribution of wind speed on the ground based on elevation; wind speed depends on elevation. To establish the boundary conditions for the external wind, the study considered a vertical velocity profile and created the user defined file (UDF). The velocity profile used the mathematical distribution model expressed in the law of exponent, as shown in Equation (3). In case of an urban downtown area where ground roughness is huge and uneven, the law of exponent shown in Equation (3) is usually used [
25].
where
V (
Z) refers to the average wind speed at elevation
Z,
VR refers to the average wind speed at reference height
ZR, and exponent α refers to vertical velocity profile exponent.
The velocity profile by elevation, and based on the shape of vertical velocity profile, a different α value (vertical velocity profile exponent) can be produced. Once α is determined, the wind speed at an arbitrary elevation can be determined. KBC 2016, the structural design criteria in South Korea, uses the law of exponent as the velocity profile, and by considering this, the index α was set to 0.22 based on the ground surface conditions and the intensity of illumination in the surrounding area [
26,
27].
Figure 4 shows the CFD analysis result after applying the UDF file to realize a vertical wind profile based on the surrounding environment.
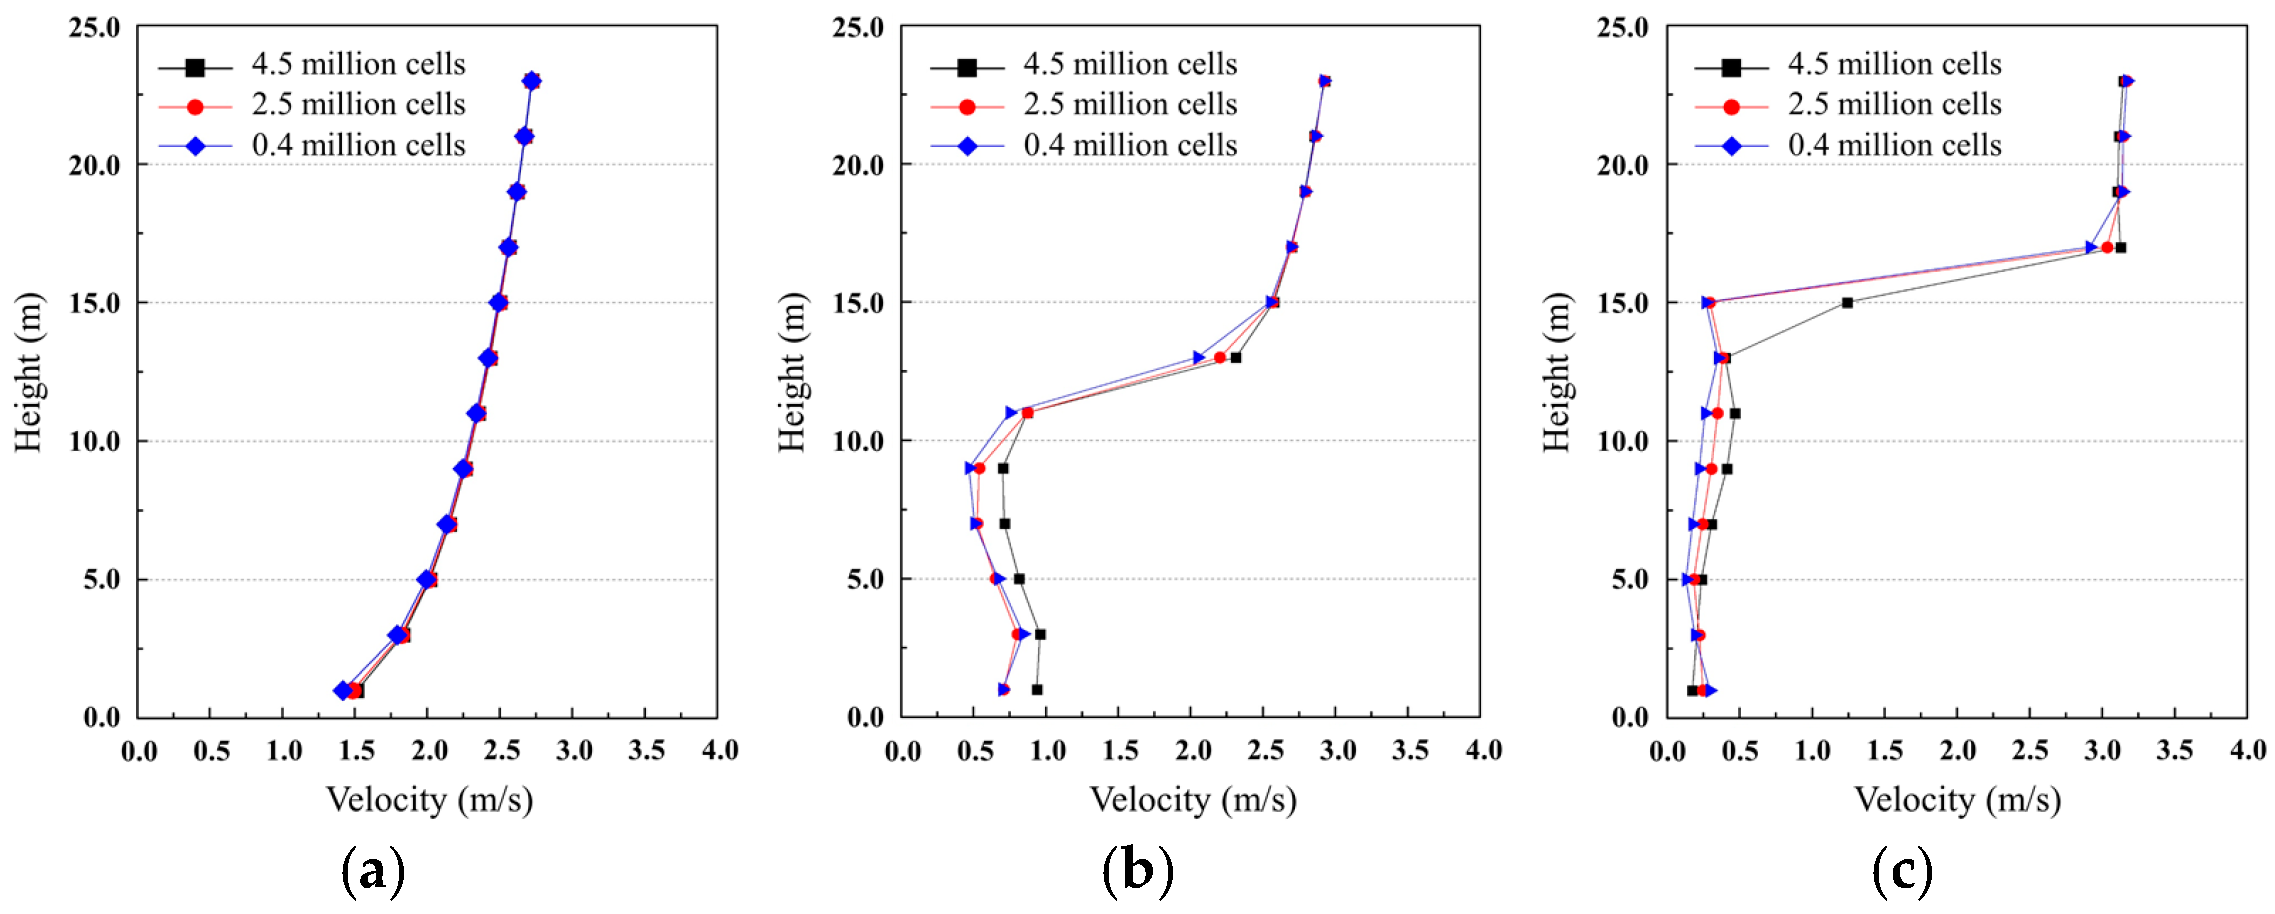
In this study, since the recirculation rate of exhaust air was evaluated by CFD analysis, a grid independence test was performed to increase the reliability of the analysis results. The grid independence test was performed with three different mesh element quantities, including 0.4, 2.5, and 4.5 million elements.
Figure 5 establishes that the 2.5 and 4.5 million element simulations have approximately the same velocity profile at Line 1, 2, and 3. The CFD analysis is conducted with 4.5 million elements, since the root-mean-square error (RMSE) values for the 4.5, and 2.5 million element simulations were 0.022, 0.062, and 0.058 for Lines 1, 2, and 3, respectively.
3. Results of CFD Analysis
3.1. Countour and Vector of Velocity Magnitude
The study first examined the CFD analysis of the external wind direction corresponding to the case.
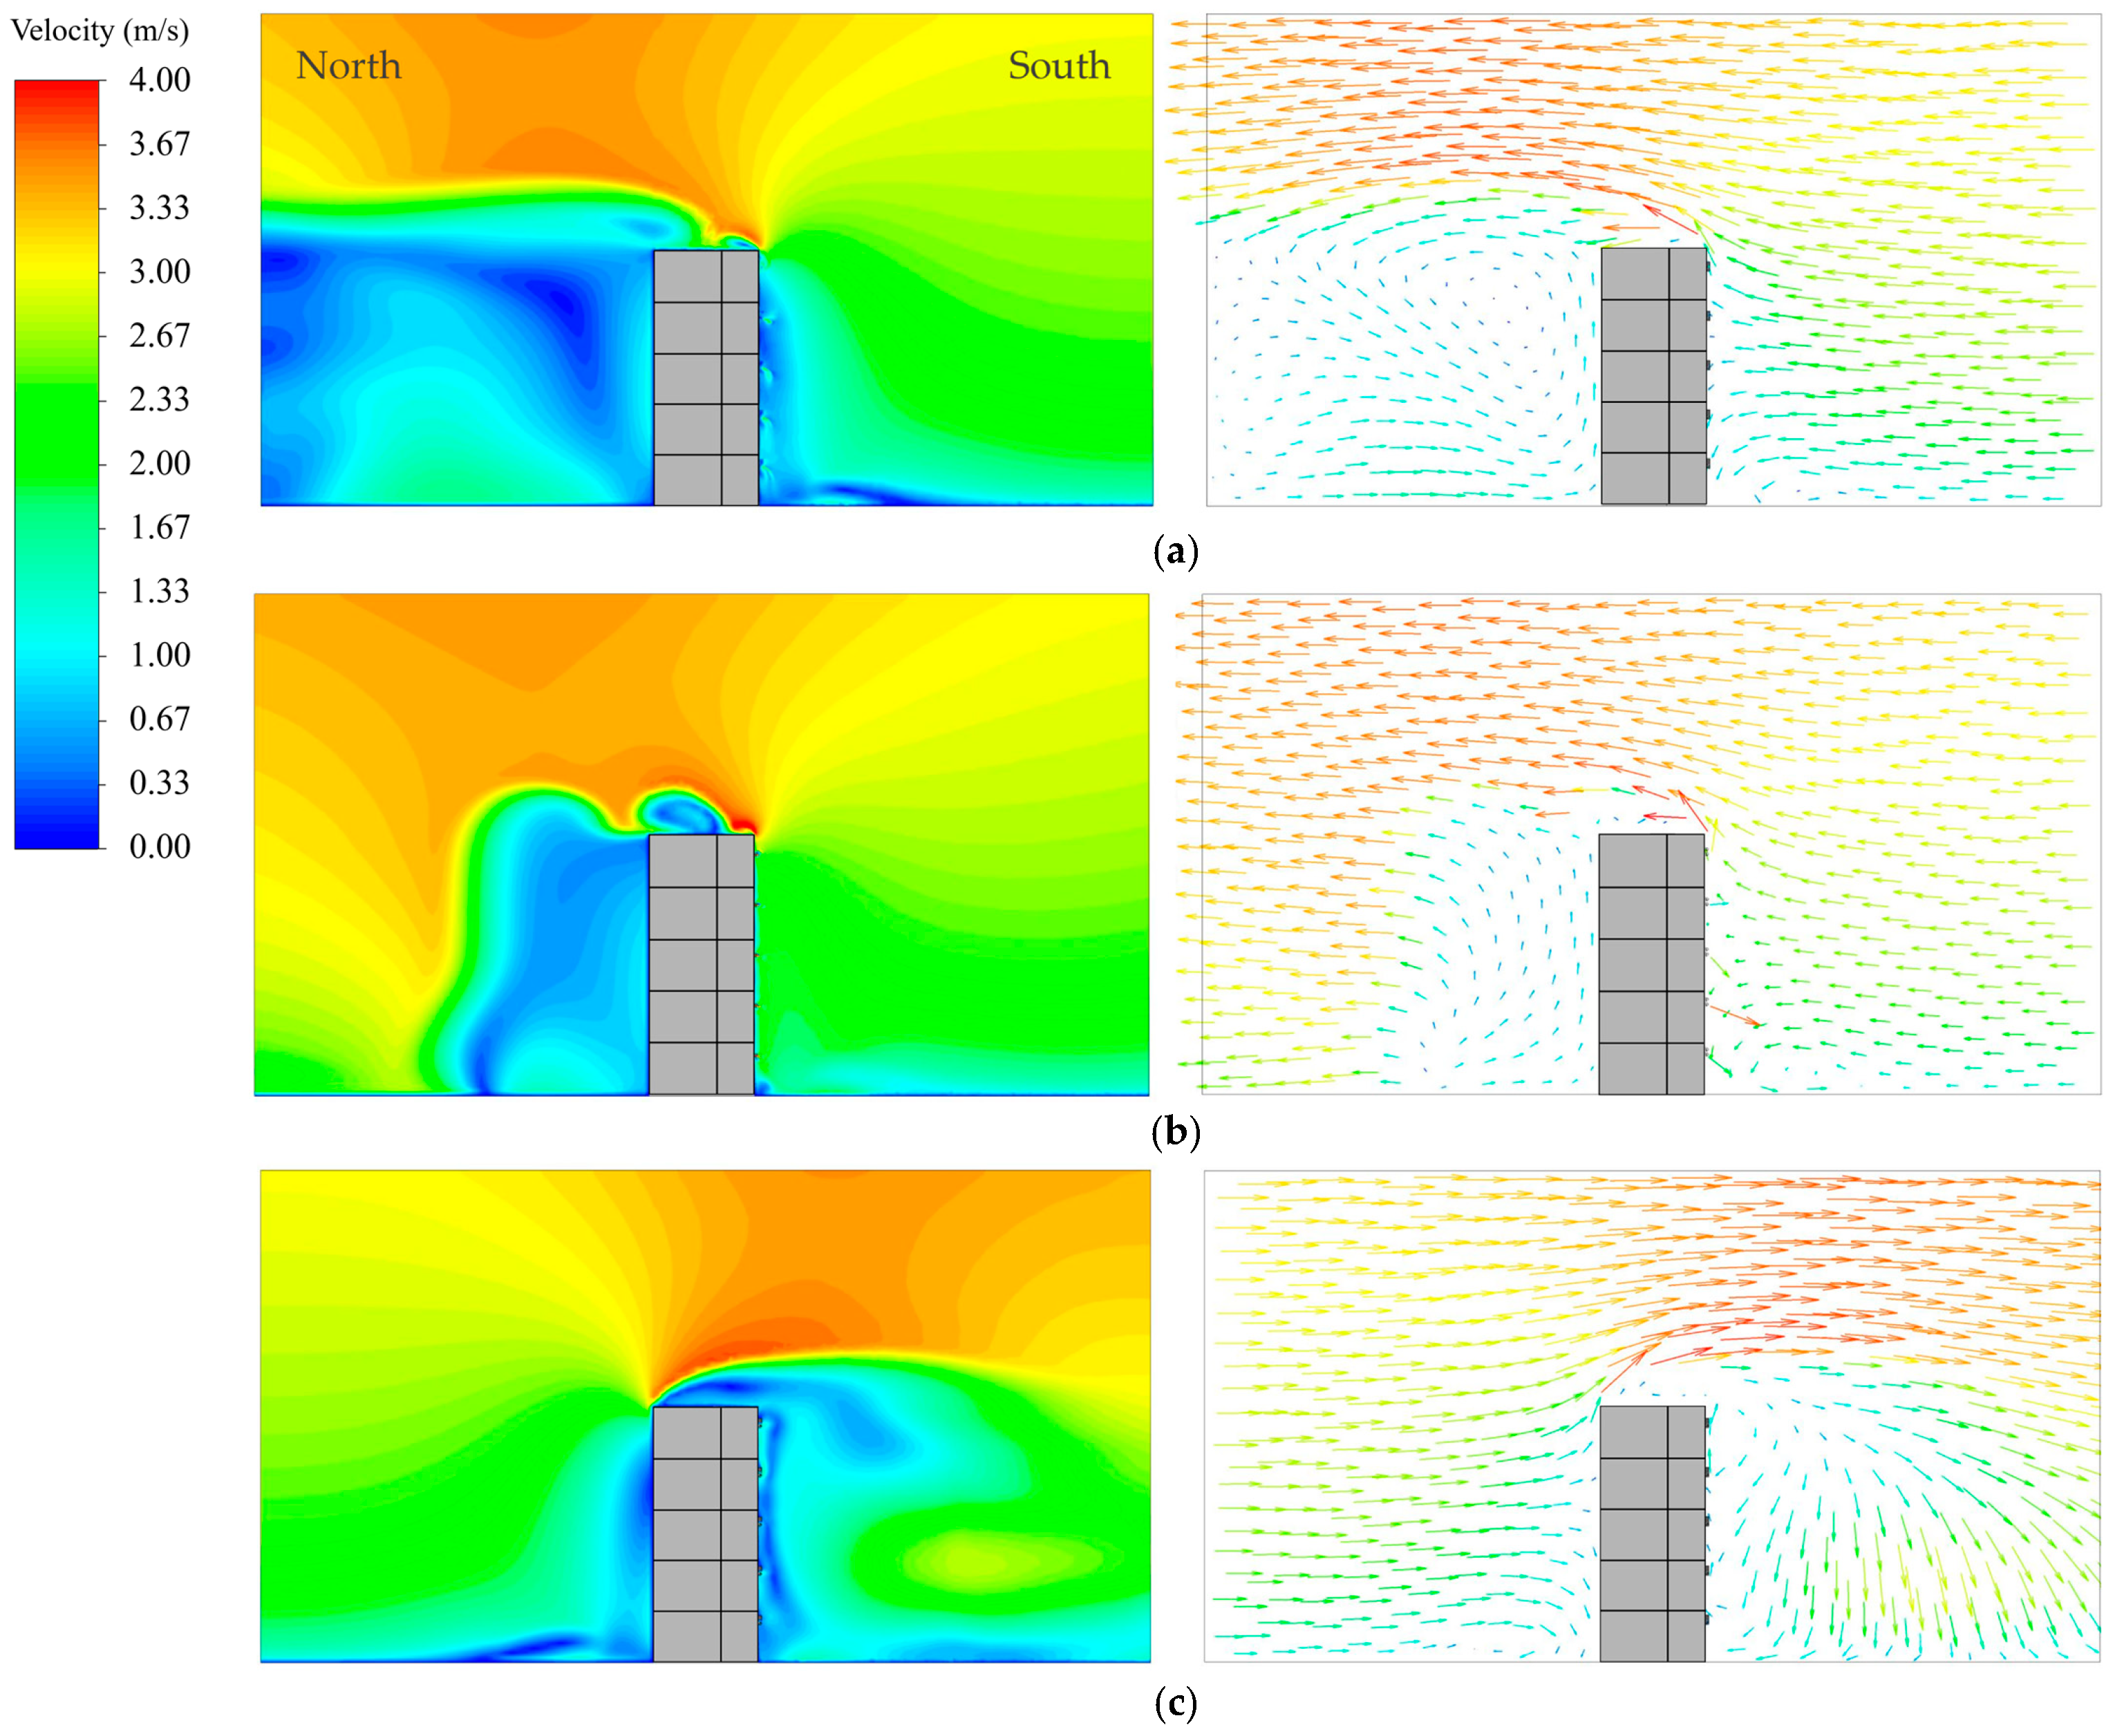
Figure 6 shows the CFD analysis results from Cases 1, 4, and 7, which are the contour of velocity magnitude and velocity vector at Section-ABCD. The surface on which the intake and exhaust vents were installed was set to the front of the building. In Case 1 with the southerly wind (θ = 180°) toward the front of the building, there was a downdraft on the first and second floors based on the third floor as the center and updraft on the fourth and fifth floors. In Cases 2 and 3, the velocity contour and vector were similar to those in Case 1. In Case 4, with the southwesterly wind (θ = 225°) at 45° from the front of the building, there was also the downdraft on the first and second floors based on the third floor as the center and updraft on the fourth and fifth floors. In Case 7, with northerly wind (θ = 360°) toward the back of the building, drastically low airflow because of the negative pressure from the front of the building caused a stagnant area.
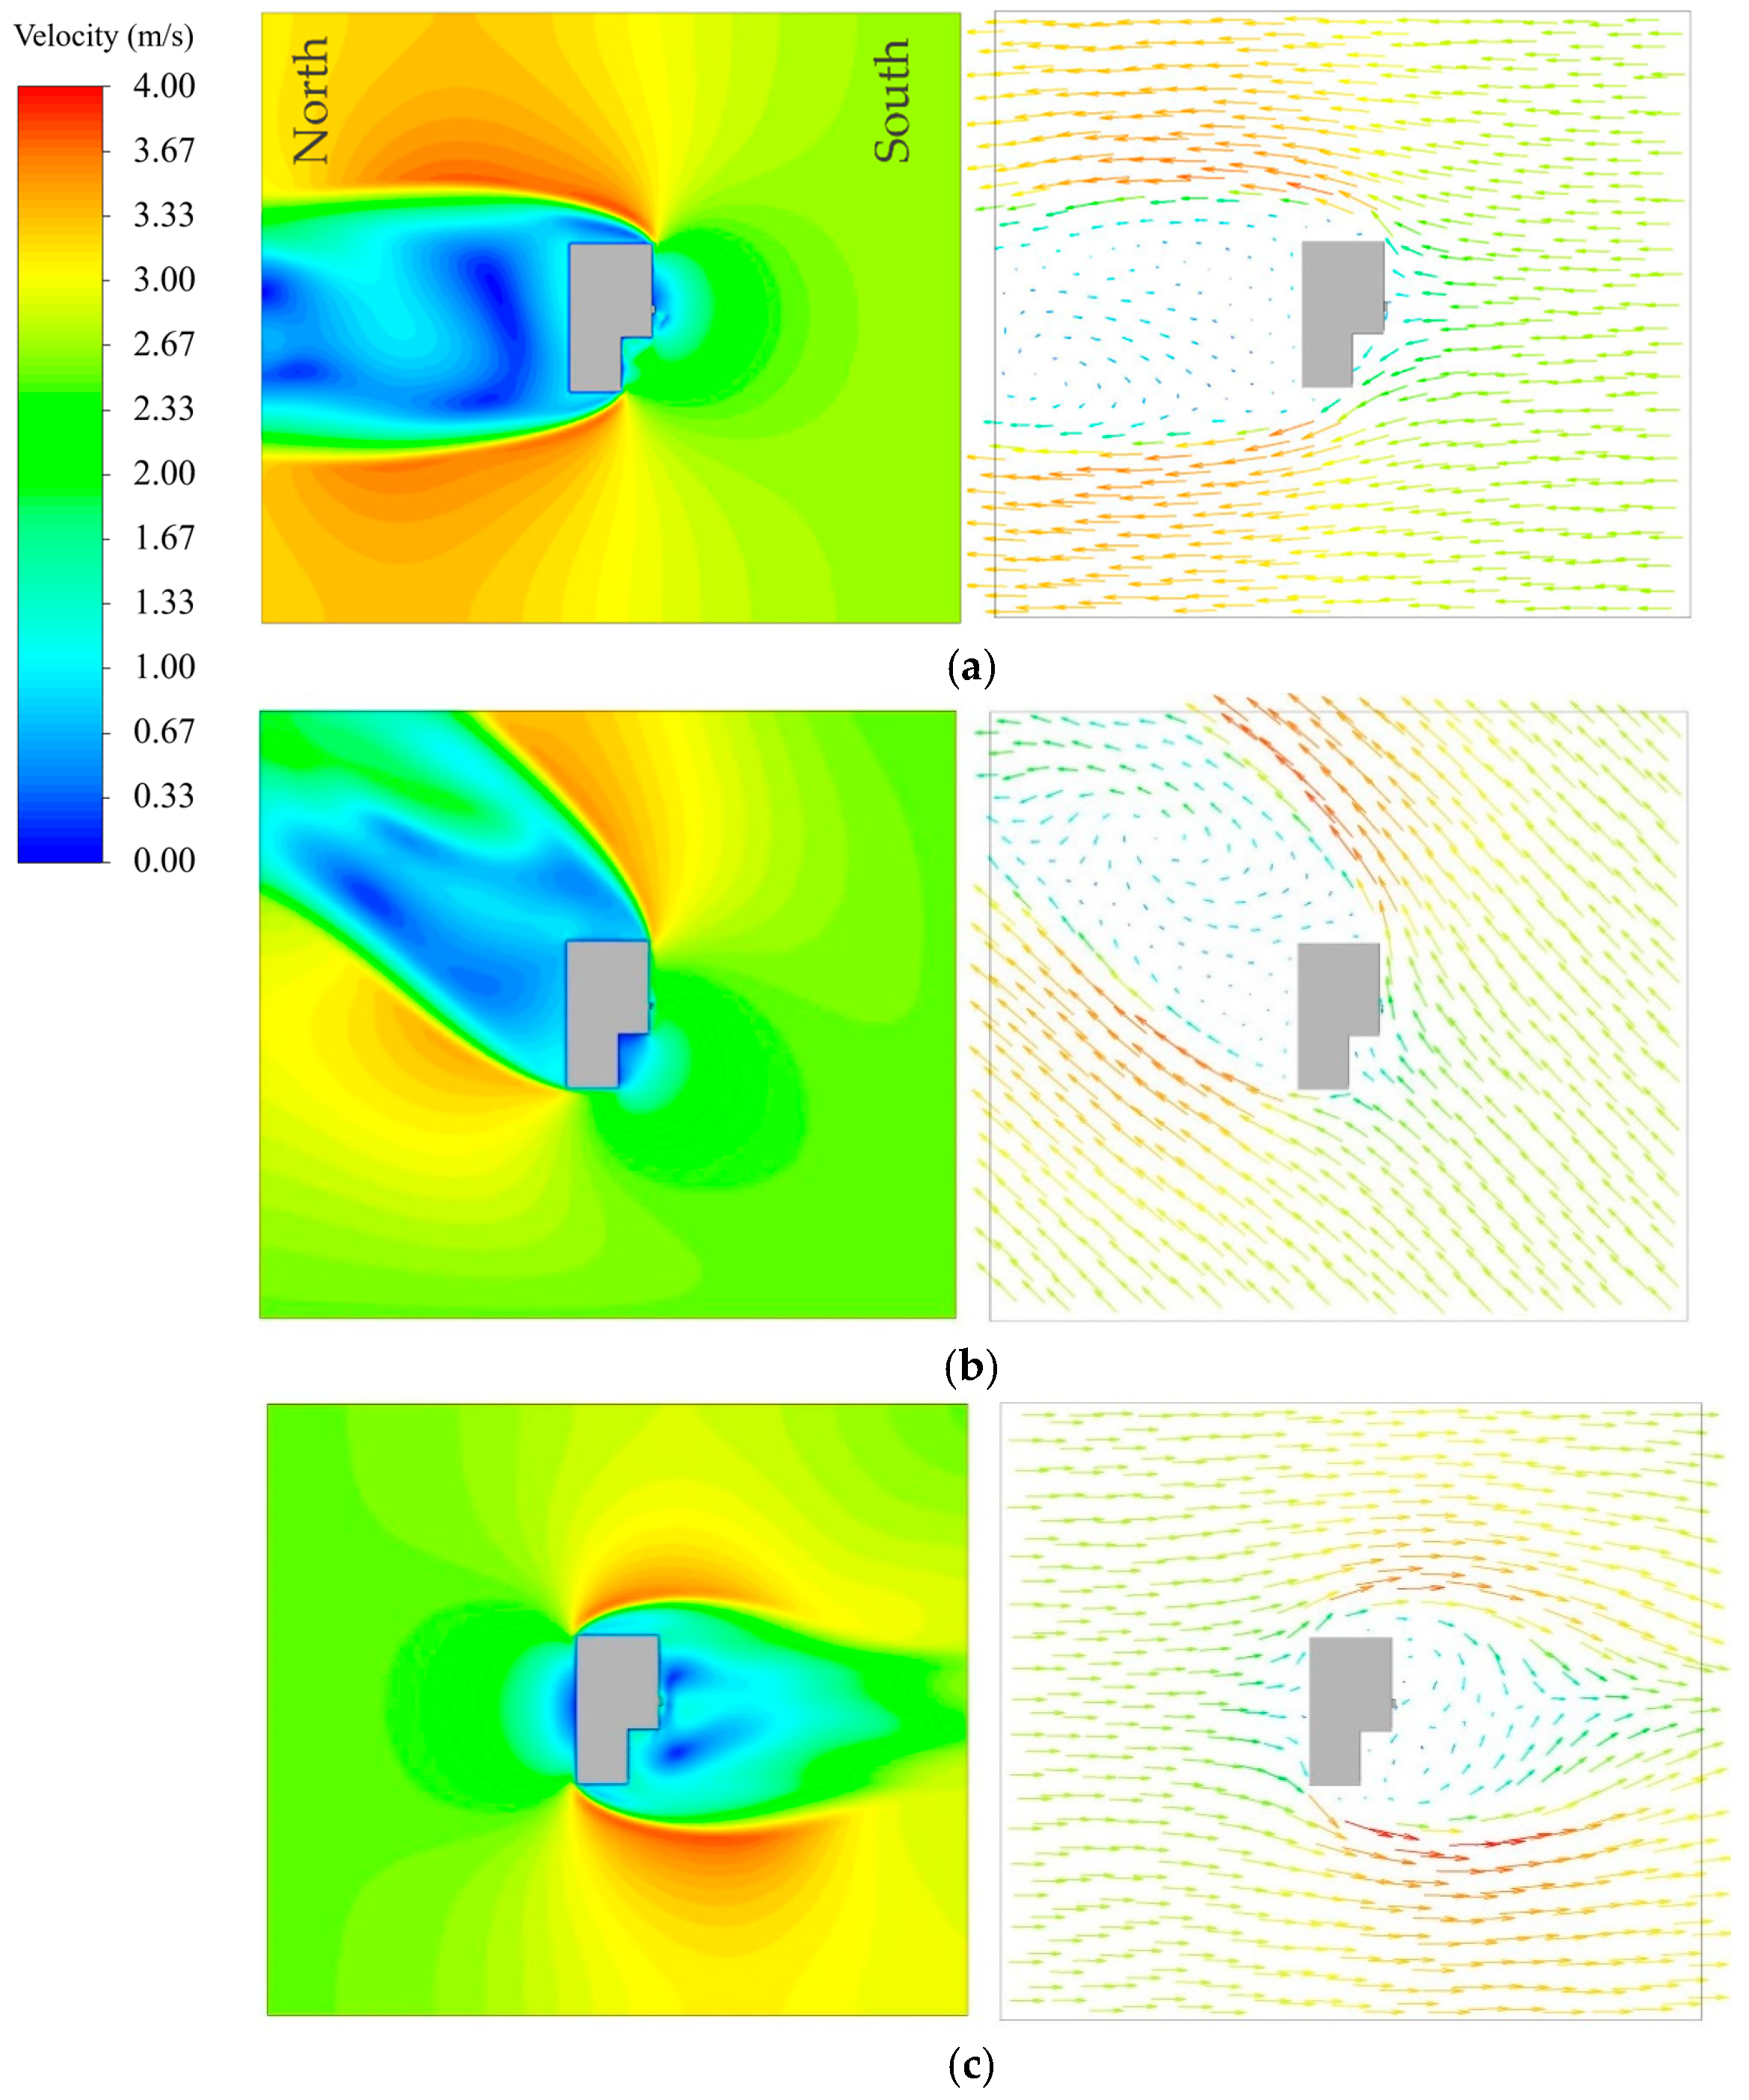
Figure 7 displays the velocity magnitude and velocity vector contour for Cases 1, 4, and 7 at Plan-EFGH. In Case 1, the air draft is divided in half at the center of the intake and exhaust ports with the southerly wind (θ = 180°) coming from the front of the building. In Cases 2 and 3, the velocity contour and vector trend were similar to Case 1. In Case 4, airflow is formed from the exhaust to the intake port due to the southwesterly wind (θ = 225°) coming from the front of the building. In Cases 5 and 6, the velocity contour and vector trends were similar to Case 4. In Case 7, the airflow decreases because of the negative pressure at the front of the building due to the external wind direction with a northerly wind (θ = 360°) coming from the back of the building. However, the velocity contour was considerably lower than in Case 1. The velocity contour and vector in Case 10, in which the guide panel was removed from Case 4, were similar to those in Case 4.
3.2. Distribution of Exhaust Air Region
As mentioned in
Section 2.2 of this study, the recirculation of exhaust air was calculated using the mass fraction boundary condition. Each ID is assigned to the air exhausted from the five floors and the outdoor air to evaluate the effect of exhaust air individually. By assigning one to the mass fraction value of the outdoor and exhausted air from the exhaust port of each floor, the proportion of exhaust air in the intake air can be calculated using CFD analysis. In other words, since the mass fraction value of the exhaust air stays between zero and one, it is possible to visualize the region’s distribution affected by the exhaust air through CFD post-processing. Additionally, since the sum of the mass fraction values of the air entering the intake port is always one, it is possible to calculate the recirculation rate by subtracting the mass fraction of the outdoor air from one. Since the mass fraction value of the exhaust air is set to one, the normalized concentration (NC) and the mass fraction value are the same.
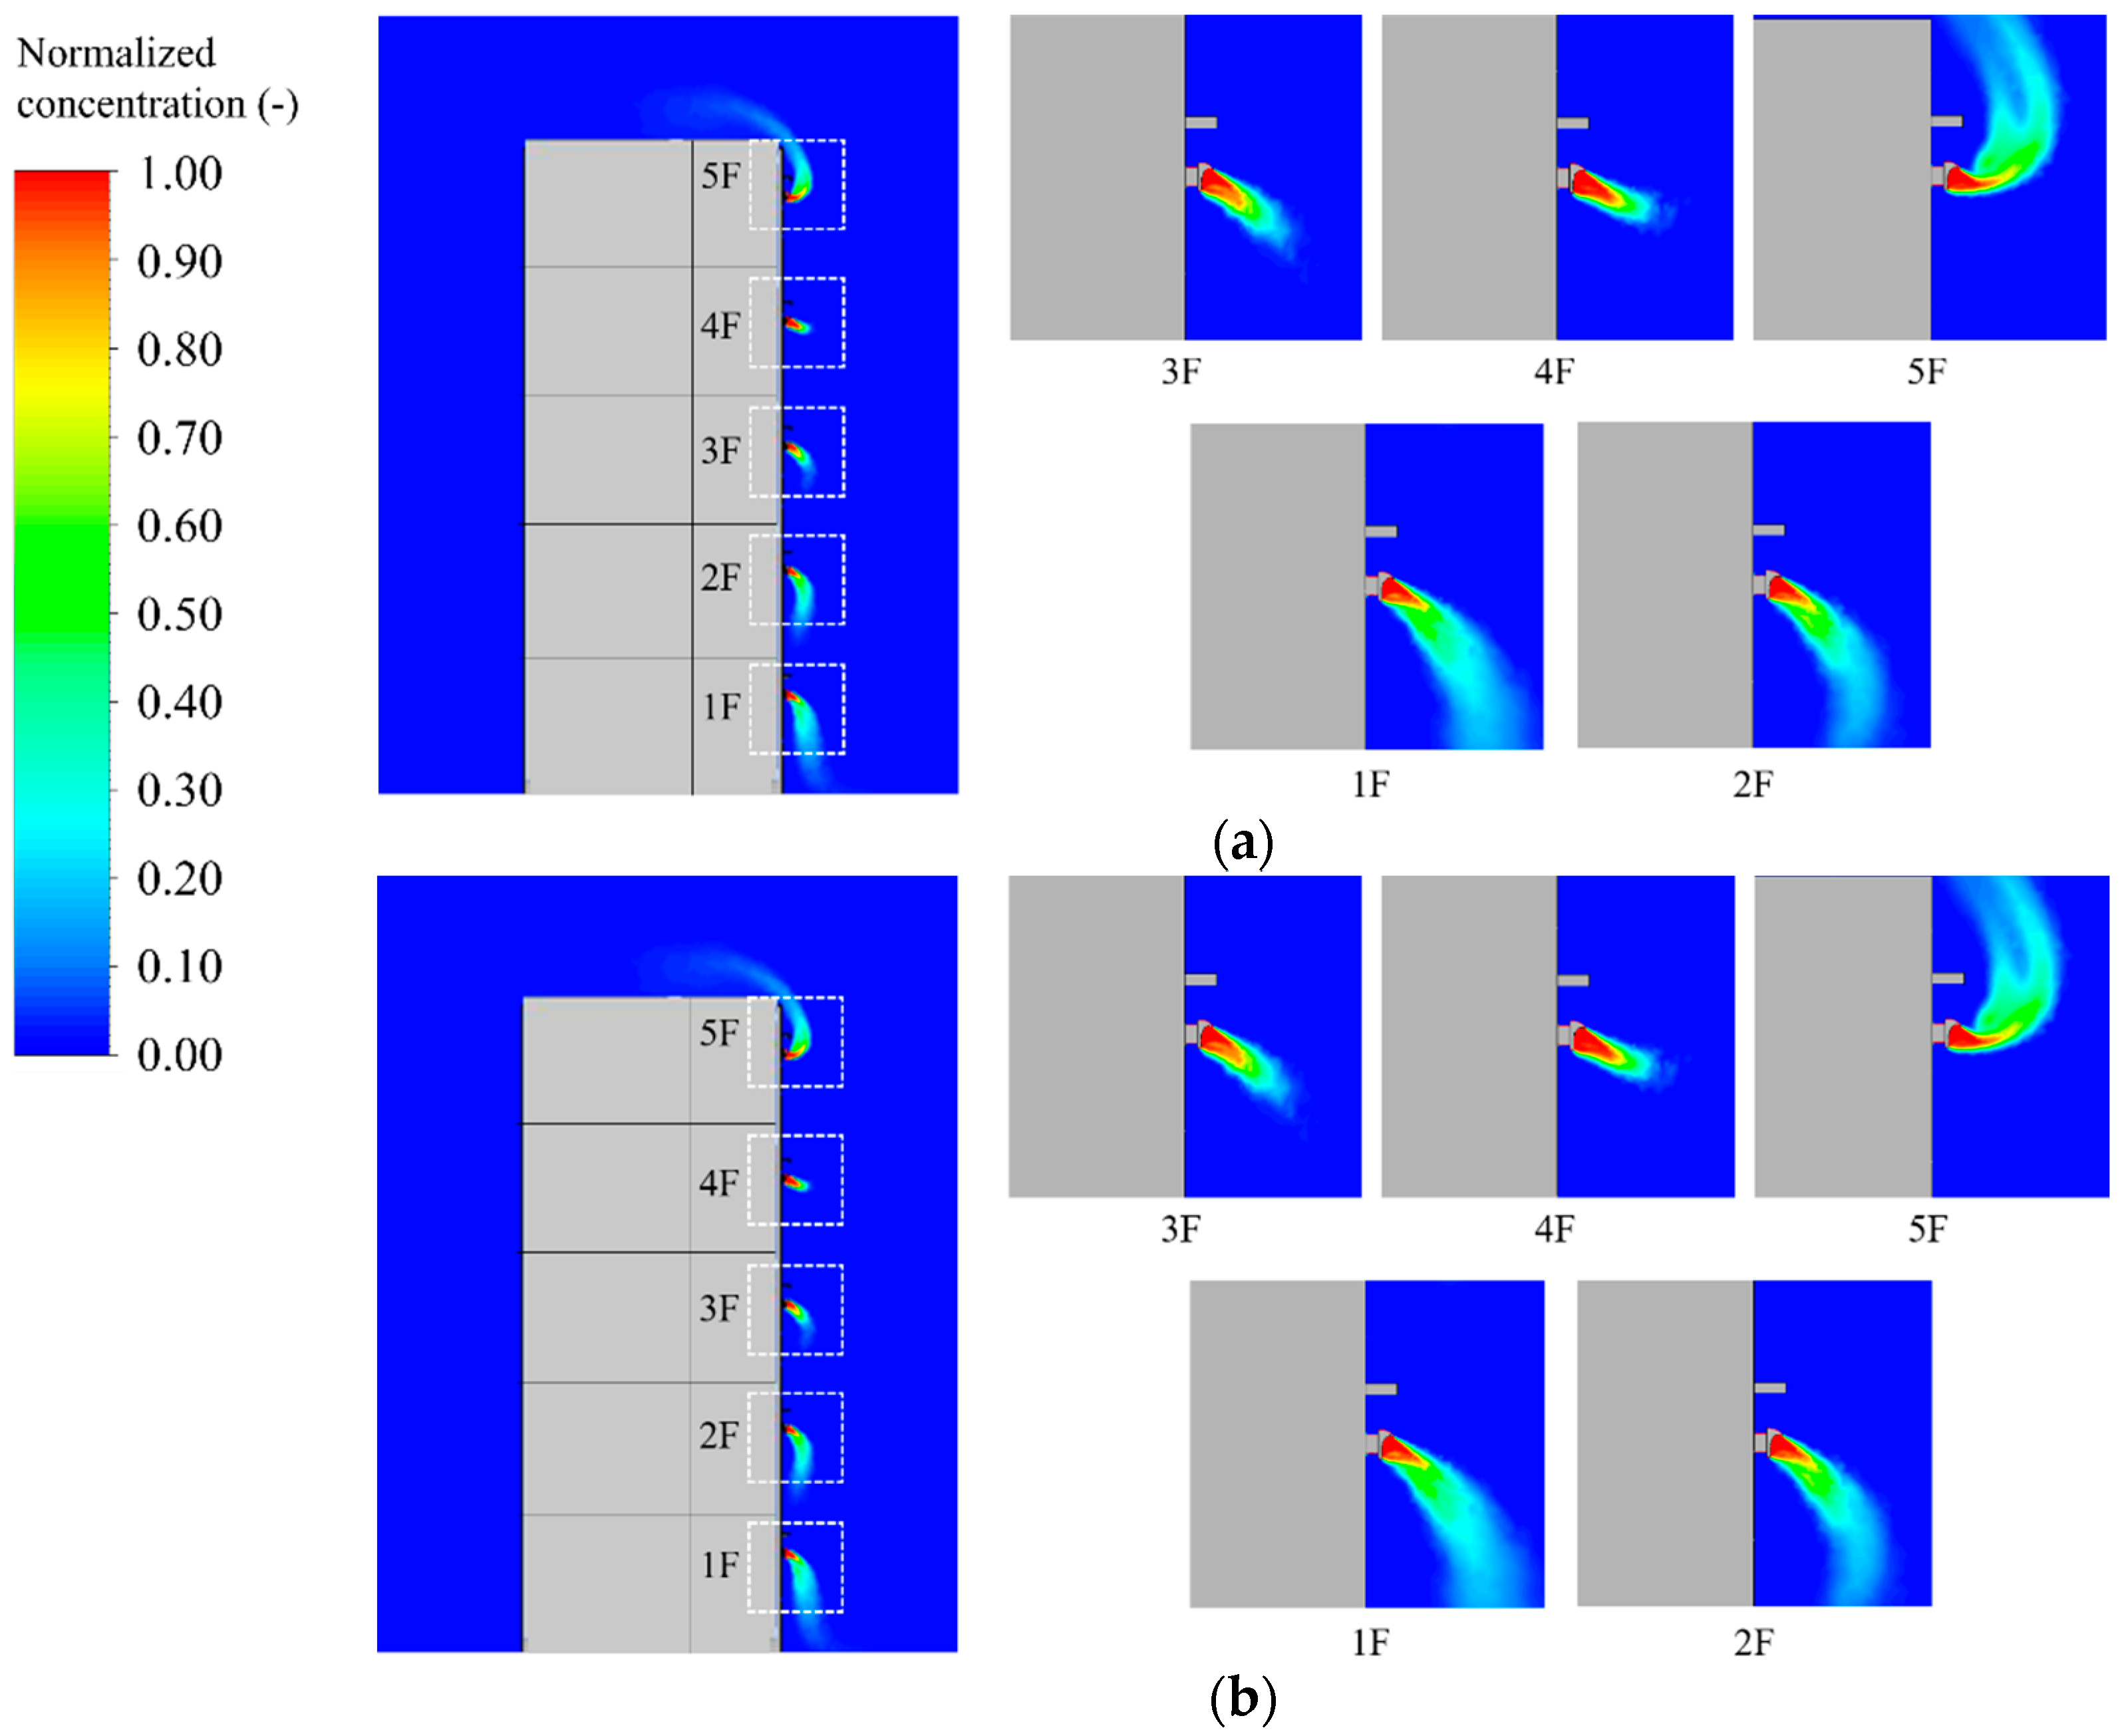
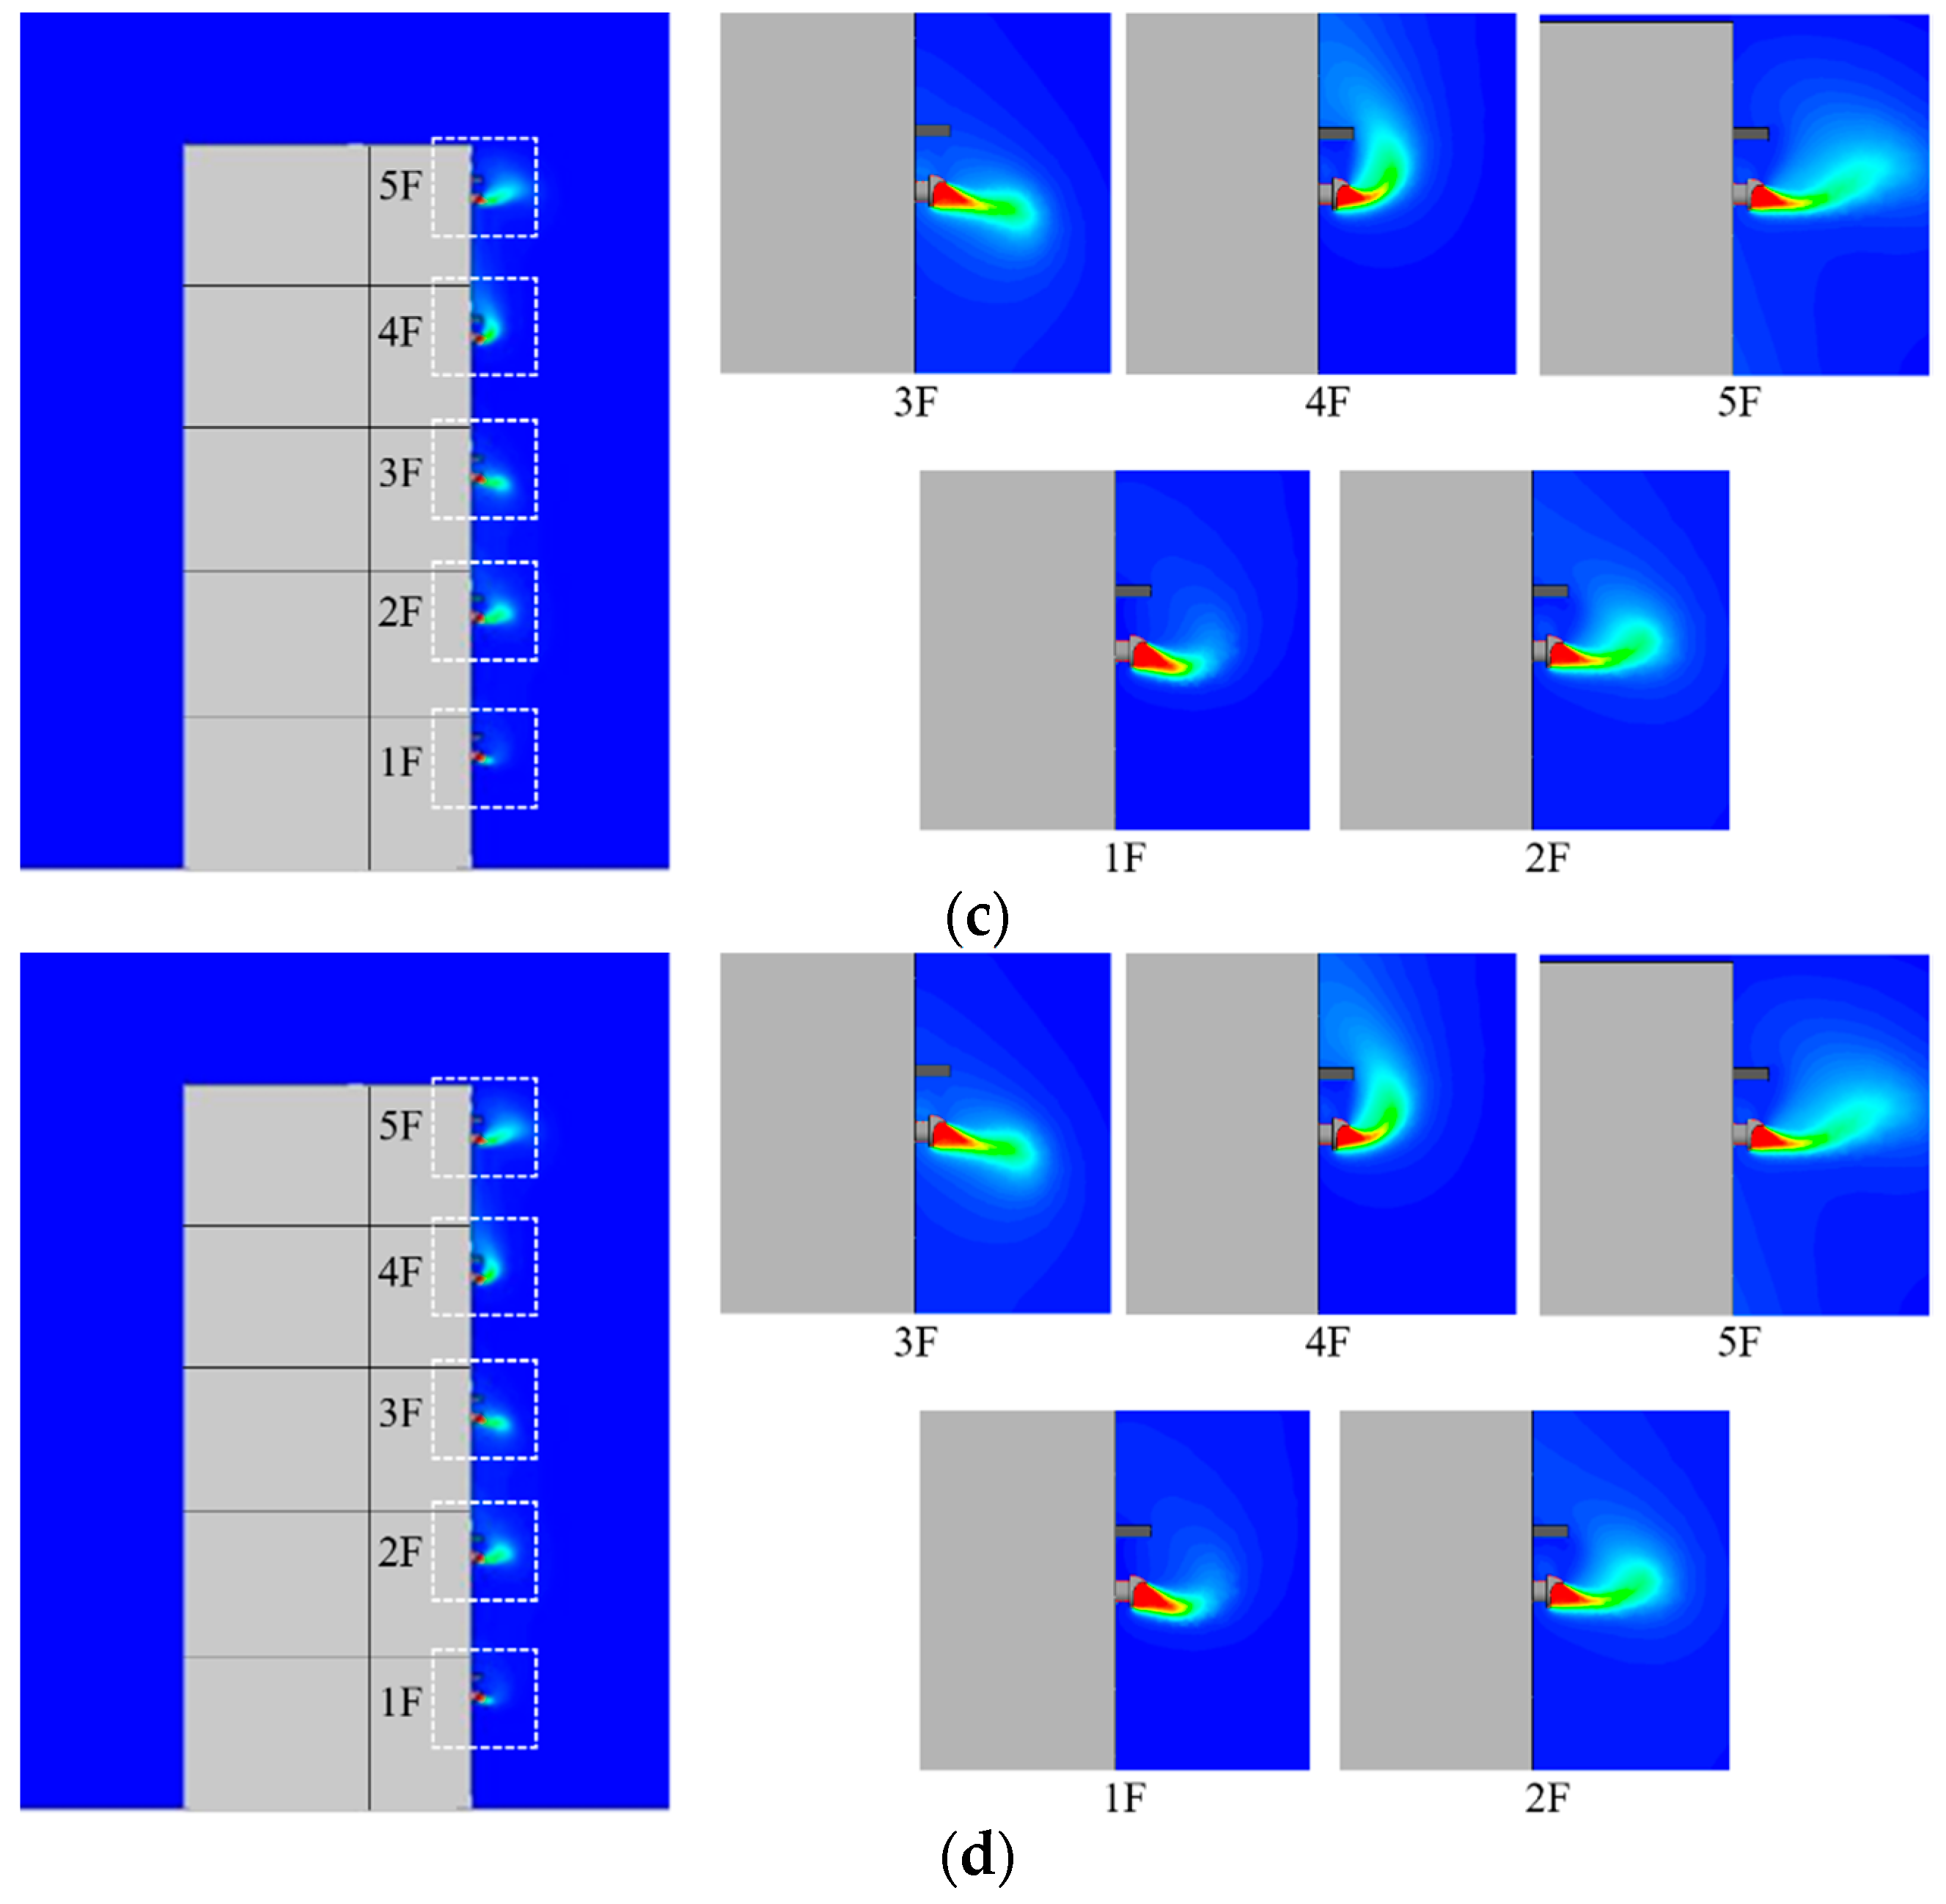
Figure 8 presents the NC distribution of Cases 1, 4, and 7, meaning that the closer the value is to one, the greater the effect of exhaust air. The NC of exhaust air in Case 1 shows that the emission direction of the exhaust air faces downward because of the exhaust cap; therefore, on the first and second floors, it flows more strongly downward against external airflow, and on the third and fourth floors, the downdraft is formed near the exhaust cap because of the stronger effect of the emission direction.
On the fifth floor, because of the external strong updraft, the exhaust air near the exhaust cap moves upward. However, the direction of external wind direction does not push the exhaust air to the intake port. In Case 4, because of the direction of external air, the exhaust air was shown to move toward the intake port. Centered on the third floor, upper floors form updraft and lower floors form downdraft, and the external wind pushes the air from the exhaust port to the intake port. As the exhaust port on the same floor is located lower than the intake port, the exhaust air from the ventilation system on the fourth and fifth floors move closer to the intake port. In Case 7, an updraft forms on the exhaust and intake ports on all floors, but the power of the updraft is so small that, compared to the other cases, the air becomes more stagnant, and the exhaust air stays near the exhaust port. In Case 10, the exhaust air could flow closer to the wall compared with Case 4 as there was no guide panel, and similarly, based on the third floor, upper floors formed an updraft and lower floors formed a downdraft.
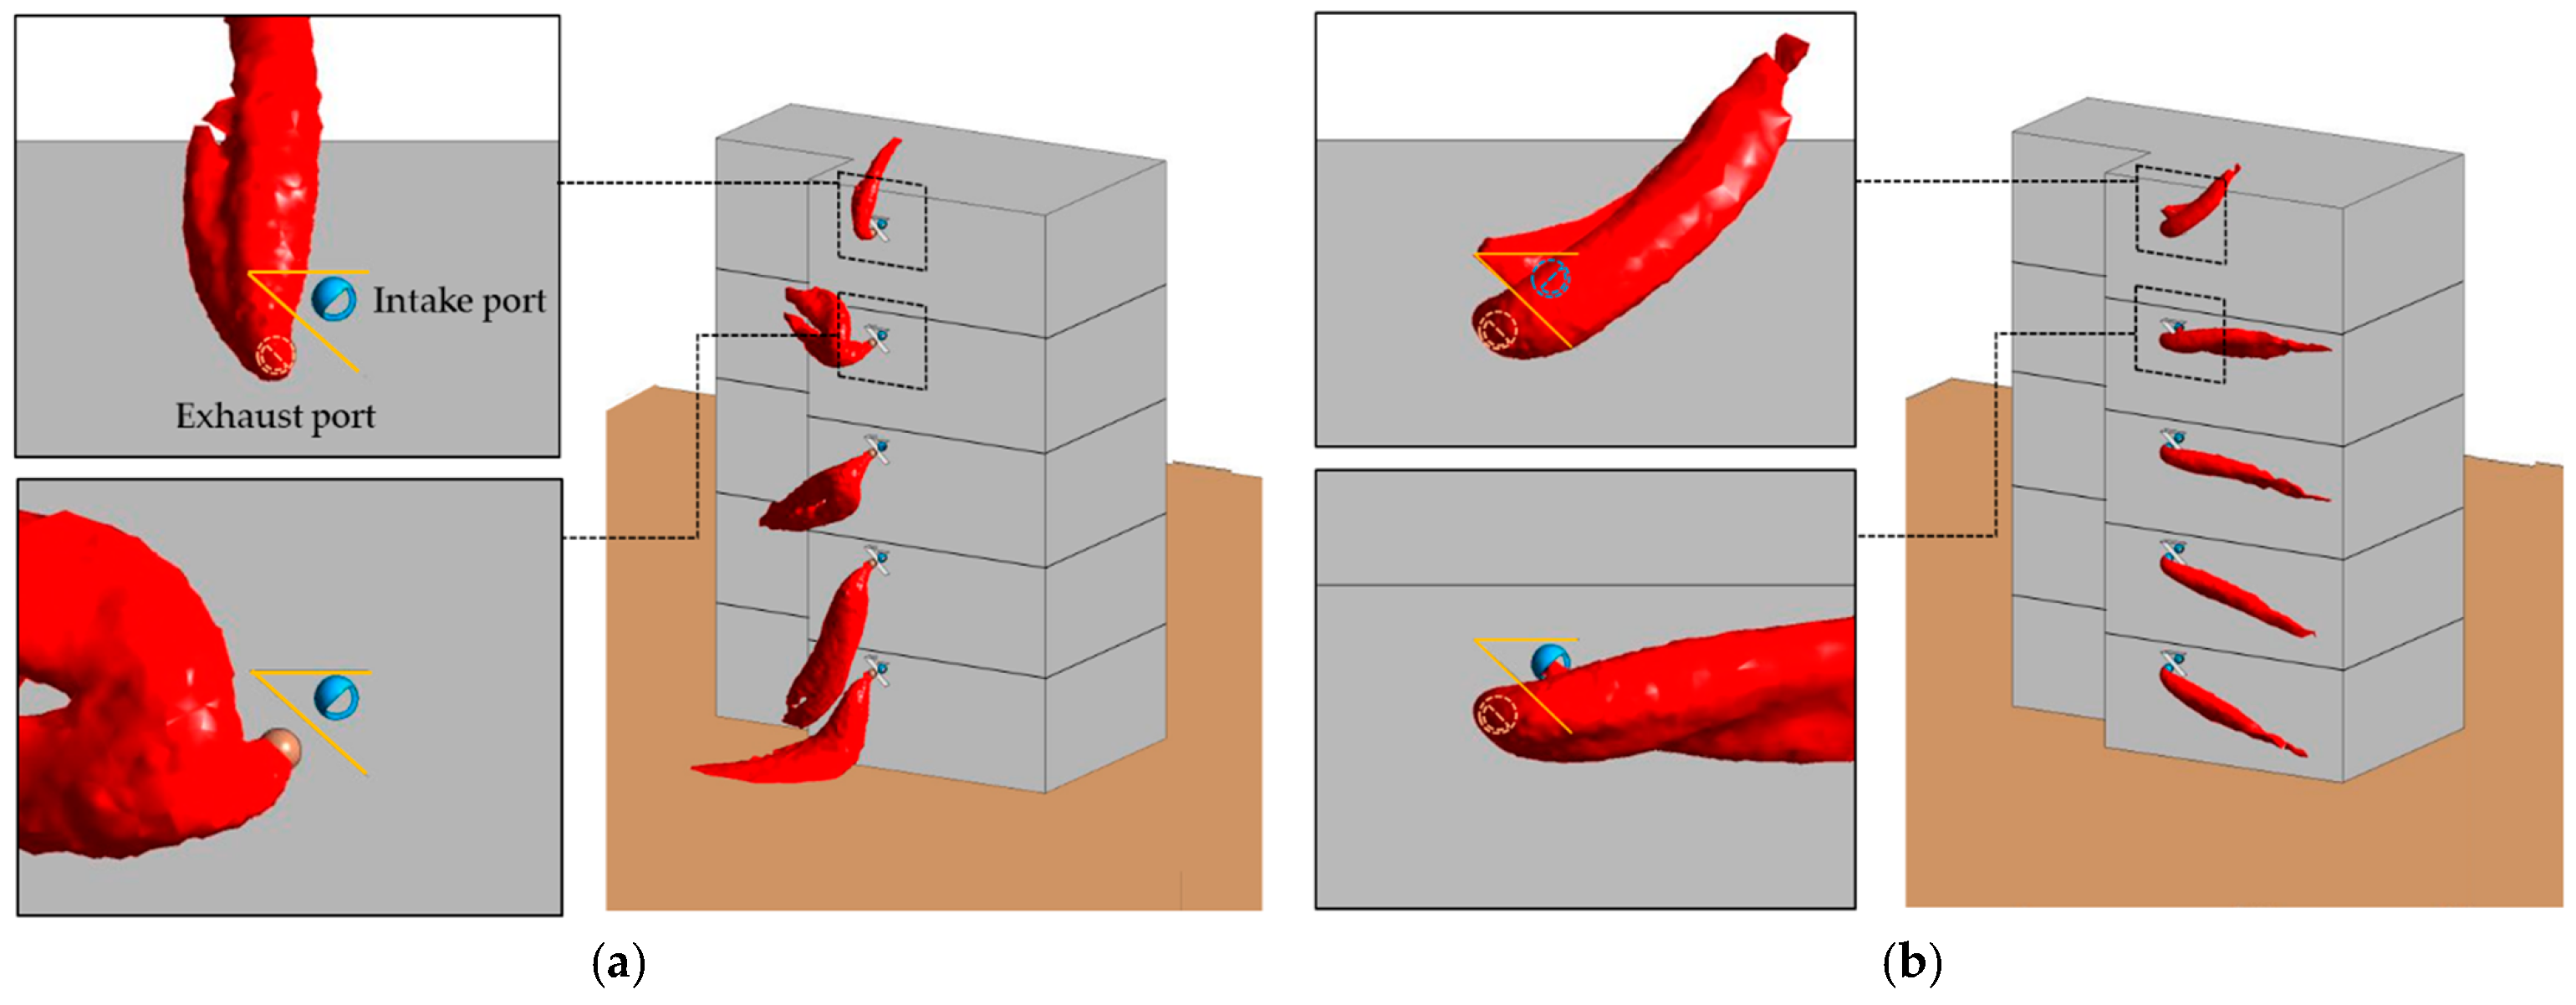
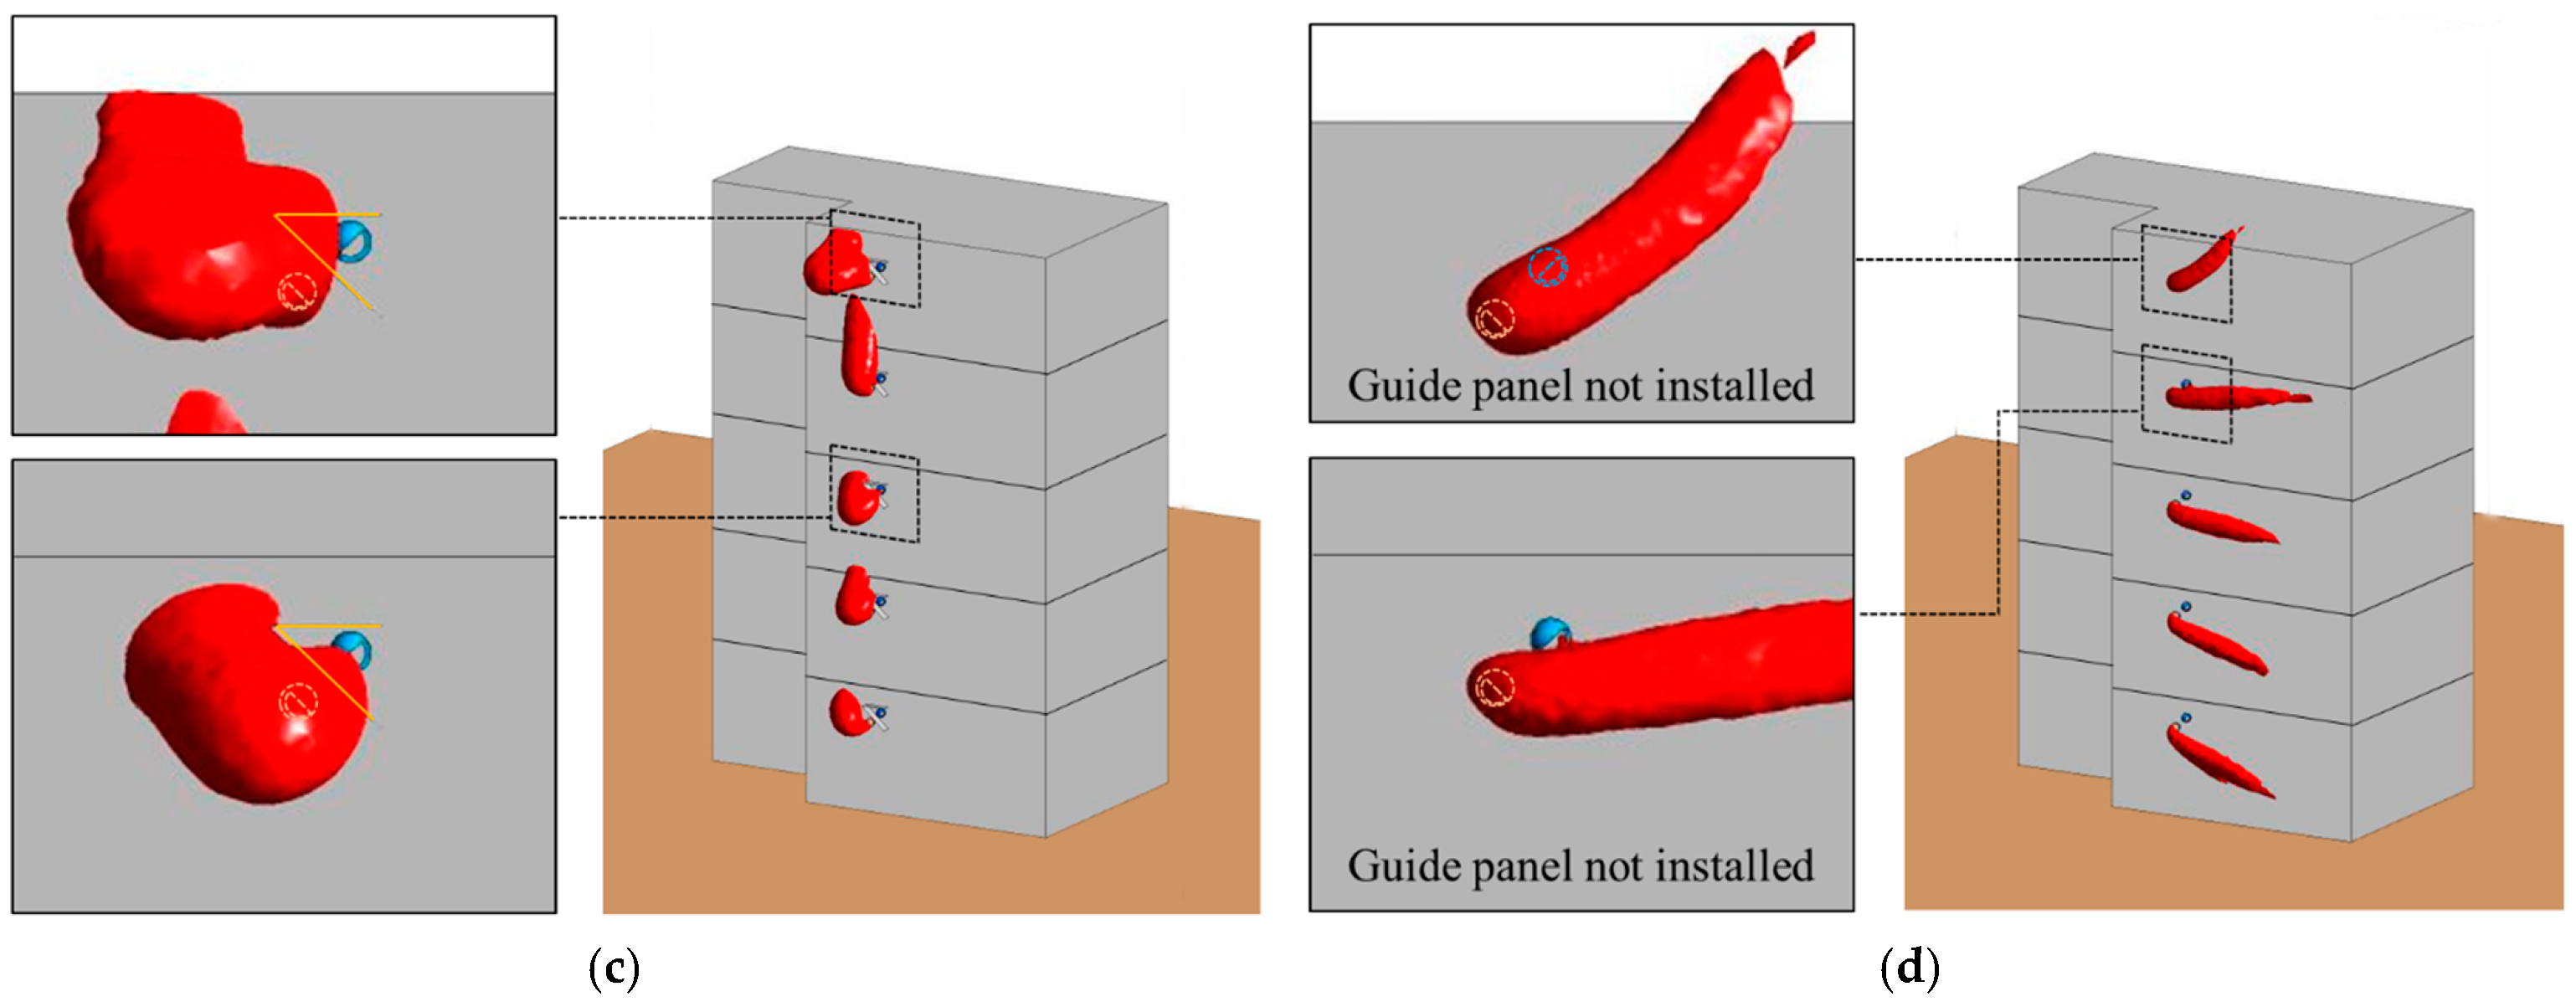
Figure 9 shows an iso-surface in which the NC value of the exhaust air is less than 0.05, and the diffusion area of the exhaust air can be confirmed in 3D. Consequently, there was no case where the exhaust air of each floor is recirculated through the intake ports of the other floors. Thus, when the exhaust and intake ports are placed vertically on the outer wall of the building, cross-contamination between floors can be prevented by simply changing the direction of the exhaust and intake ports.
3.3. The Result of the Recirculation Rate Analysis
Table 2 presents the recirculation rates of exhaust air emitted from the ventilation system on each floor by case. In Cases 1–3, where the external wind direction with the installation of a guide panel was toward the front of the building, the recirculation rate of exhaust air was less than 0.1%. In Cases 4–6, where the external wind direction was southwesterly (θ = 225°) at 45° from the front of the building, the recirculation rate of exhaust air on the first and second floors with downdraft was less than 0.1%, and that on the fourth and fifth floors with updraft was relatively higher compared with the first and second floors. Regarding the change in ventilation rate, it was determined that when the external airflow velocity blowing in the direction opposite to the exhaust port is equal to or smaller than the airflow velocity of the exhaust air, the amount of recirculation increases due to the neutral zone formed near the building’s outer wall. In Cases 7–9, where the external wind direction was toward the back of the building, exhaust air was recirculated on all floors, and the recirculation rate was at its highest on the third floor. This is because negative pressure is formed on the front of the building where the exhaust and intake ports are located, and the airflow is considerably reduced so that a stagnant area is created. In Cases 1–9, with the installation of a guide panel to prevent the recirculation of exhaust air, the maximum recirculation rate was 7.7% on the fifth floor in Case 4. The maximum recirculation rate of a case which is identical to the case that experienced the maximum recirculation rate in terms of external velocity, direction, and ventilation rate from the ventilation system that did not have a guide panel, was 20.0%. Conversely, it was found that the amount of exhaust air recirculation can be reduced by 62% due to the installation of the guide panel, but it was confirmed that the effect was insufficient in the lower floors. Therefore, installing the guide panel only on the upper floors of the target building can be an economical alternative for preventing the recirculation of exhaust air.
4. Discussion
This study conducted CFD analysis based on wind directions to quantitatively analyze the recirculation rate of pollutants from a mechanical ventilation system, which was installed in an actual kindergarten building located in Seoul, and analyze the effect of the installed guide panel on the prevention of recirculation of exhaust air. It produced the following results.
The recirculation rate of exhaust air was 7.7% at its maximum, and the recirculation rate was highest with the southwesterly wind (7.7%), followed by the northerly (4.6%) and southerly wind (<0.1%). The diffusion of pollutants is identical to the air draft pattern, formed by the external wind tunnel conditions and characteristics of the building shape, and recirculation rate is in inverse proportion to the external wind speed, i.e., with increasing wind speed, the recirculation rate becomes lower. In addition, the recirculation rate on each floor differed by the direction of wind. The analysis results in this study show that there was a high recirculation rate on the upper floors in case of the southwesterly wind, and the recirculation rate on the middle floor was higher with a northerly external wind because of the stagnant area with a lower wind speed on the middle floor. As the characteristics of the recirculation rate of exhaust air can differ due to the deviation of the recirculation rate based on the vertical height as well as the direction of the exhaust cap and the height difference between intake and exhaust caps, these factors should be considered in designing a ventilation system.
The analysis results on the recirculation rate based on the existence of a guide panel, which is installed between the intake and exhaust ports, along with the exhaust cap to prevent recirculation of exhaust air, show that the maximum recirculation rate in the case with the installation of a guide panel was 7.7%. On the contrary, in the case with the identical conditions except with the guide panel removed, the maximum recirculation rate on the same floor increased up to 20.0%, and it decreased by some degree on the other four floors. Therefore, it is determined that the installation of a guide panel has a huge impact on the recirculation of exhaust air.
This study analyzed the recirculation rate of exhaust air from a ventilation system in a kindergarten building, which had not been considered in the design stage, by the change in the external wind tunnel conditions and proposed solutions to prevent the recirculation of exhaust air. The analysis of the recirculation rate of exhaust air from a ventilation system should be conducted in the planning stage of a construction project, and the results of the study can be used as important information for designers in the planning stage. The results of the study are significant as they propose information that needs to be considered for improving the ventilation performance of buildings in architectural and mechanical design.
In this study, CFD analysis was conducted on an actual building with a ventilation system, but further tests based on a small-scale model shall be performed to acquire additional basic data, and therefore, to consider the recirculation rate of exhaust air in the building planning stage.
Author Contributions
Conceptualization, H.P.; Methodology, S.P. and H.P.; Writing—Original draft preparation, H.P.; Writing—Review and editing, S.P. and J.S.; Supervision, J.S. All authors have read and agreed to the published version of the manuscript.
Funding
This work was supported by the National Research Foundation of Korea (NRF) grant funded by the Korea government (MSIT) (No. 2021R1A2B5B02001469) (No. 2021R1C1C2003596).
Institutional Review Board Statement
Not applicable.
Informed Consent Statement
Not applicable.
Data Availability Statement
Not applicable.
Conflicts of Interest
The authors declare no conflict of interest.
References
- Donkery, D.W. Health effects of particulate air pollutioin. Ann. Epidemiol 2009, 19, 257–263. [Google Scholar] [CrossRef] [PubMed]
- Yamaguchi, N.; Ichijo, T.; Sakotani, A.; Baba, T.; Nasu, M. Global dispersion of bacterial cells on Asian dust. Sci. Rep. 2012, 2, 525–529. [Google Scholar] [CrossRef]
- Cuce, E.; Harjunowibowo, D.; Cuce, P.M. Renewable and sustainable energy saving strategies for greenhouse systems: A comprehensive review. Renew. Sustain. Energy Rev. 2016, 64, 34–59. [Google Scholar] [CrossRef]
- National Law Information Center, Law and Administration Regulations for Guidelines and Suggestions on Facilities for Buildings in Korea. 2015. Available online: http://www.law.go.kr (accessed on 13 March 2021).
- Jin, M.; Memarzadeh, F.; Lee, K.; Chen, Q. Experimental study of ventilation performance in laboratories with chemical spills. Build. Environ. 2012, 57, 327–335. [Google Scholar] [CrossRef]
- Faulkner, W.B.; Memarzadeh, F.; Riskowski, G.; Hamilton, K.; Chang, C.Z.; Chang, J.R. Particulate concentrations within a reduced-scale room operated at various air exchange rates. Build. Environ. 2013, 65, 71–80. [Google Scholar] [CrossRef]
- Jiao, Z.; Yuan, S.; Ji, C.; Mannan, M.S.; Wang, Q. Optimization of dilution ventilation layout design in confined environments using Computational Fluid Dynamics (CFD). J. Loss Prev. Process. Ind. 2019, 60, 195–202. [Google Scholar] [CrossRef]
- Kravchenko, I.; Kosonen, R.; Kilpeläinen, S. Performance Analysis of the Demand-Based Ventilation in a Nordic Apartment Building. Appl. Sci. 2021, 11, 176. [Google Scholar] [CrossRef]
- Sheng, Y.; Fang, L.; Nie, J. Experimental analysis of indoor air quality improvement achieved by using a Clean-Air Heat Pump (CAHP) air-cleaner in a ventilation system. Build. Environ. 2017, 122, 343–353. [Google Scholar] [CrossRef]
- Mikola, A.; Kalamees, T.; Kõiv, T. Performance of ventilation in Estonian apartment buildings. Energy Proced. 2017, 132, 963–968. [Google Scholar] [CrossRef]
- Joshi, P.; Bikkina, P.; Wang, Q. Consequence analysis of accidental release of supercritical carbon dioxide from high pressure pipelines. Int. J. Greenh. Gas Control. 2016, 55, 166–176. [Google Scholar] [CrossRef]
- Wang, Z.; Wang, W.; Wang, Q. Optimization of water mist droplet size by using CFD modeling for fire suppressions. J. Loss Prev. Process. Ind. 2016, 44, 626–632. [Google Scholar] [CrossRef]
- Cen, K.; Song, B.; Shen, R.; Zhang, Y.; Yu, W.; Wang, Q. Dynamic characteristics of gas explosion and its mitigation measures inside residential buildings. Math. Probl. Eng. 2019. [Google Scholar] [CrossRef]
- Dong, L.; Zuo, H.; Hu, L.; Yang, B.; Li, L.; Wu, L. Simulation of heavy gas dispersion in a large indoor space using CFD model. J. Loss Prev. Process. Ind. 2017, 46, 1–12. [Google Scholar] [CrossRef]
- Cao, G.; Awbi, H.; Yao, R.; Fan, Y.; Sirén, K.; Kosonen, R.; Zhang, J.J. A review of the performance of different ventilation and airflow distribution systems in buildings. Build. Environ. 2014, 73, 171–186. [Google Scholar] [CrossRef]
- Wang, H.; Zhai, Z.J. Advances in building simulation and computational techniques: A review between 1987 and 2014. Energy Build. 2016, 128, 319–335. [Google Scholar] [CrossRef]
- Ramponi, R.; Blocken, B.; Laura, B.; Janssen, W.D. CFD simulation of outdoor ventilation of generic urban configurations with different urban densities and equal and unequal street widths. Build. Environ. 2015, 92, 152–166. [Google Scholar] [CrossRef]
- Choi, D.S.; Hong, B.J. A Study on Analysis of Recirculation Rate of Pollutant (CO2) in the Ventilation System of Apartment Houses by CFD Simulation. J. Archit. Inst. Korea JAIK 2010, 26, 293–302. [Google Scholar]
- Antoniou, N.; Montazeri, H.; Wigo, H.; Neophytou, M.; Blocken, B.; Sandberg, M. CFD and wind-tunnel analysis of outdoor ventilation in a real compact heterogeneous urban area: Evaluation using “air delay”. Build. Environ. 2017, 126, 355–372. [Google Scholar] [CrossRef]
- ANSYS, Ltd. ANSYS Academic Research Fluent, Release 19.2, Help System, Theory Guide; Ansys Inc.: Canonsburg, PA, USA, 2019. [Google Scholar]
- Liu, S.; Pan, W.; Zhao, X.; Zhang, H.; Cheng, X.; Long, Z.; Chen, Q. CFD simulations of wind distribution in an urban community with a full-scale geometrical model. Build. Environ. 2017, 117, 11–23. [Google Scholar] [CrossRef]
- Liu, S.; Pan, W.; Zhang, H.; Cheng, X.; Long, Z.; Chen, Q. Influence of surrounding buildings on wind flow around a building predicted by CFD simulations. Build. Environ. 2018, 140, 1–10. [Google Scholar] [CrossRef]
- Park, S.; Seo, J. Optimum installation of sorptive building materials using contribution ratio of pollution source for improvement of indoor air quality. Int. J. Environ. Res. Public Health 2016, 13, 396. [Google Scholar] [CrossRef] [PubMed]
- Zender-Świercz, E. Review of IAQ in Premises Equipped with Façade–Ventilation Systems. Atmosphere 2021, 12, 220. [Google Scholar] [CrossRef]
- Kent, C.W.; Grimmond, C.S.B.; Gatey, D.; Barlow, J.F. Assessing methods to extrapolate the vertical wind-speed profile from surface observations in a city centre during strong winds. J. Wind. Eng. Ind. Aerodyn. 2018, 173, 100–111. [Google Scholar] [CrossRef]
- Lim, J.; Ooka, R.; Kikumoto, H. Effect of diurnal variation in wind velocity profiles on ventilation performance estimates. Energy Build. 2016, 130, 397–407. [Google Scholar] [CrossRef]
- AIK. Korean Building Code. 2016, Architectural Institute of Korea. c2016. Available online: https://www.law.go.kr/LSW//flDownload.do?flSeq=83070997 (accessed on 13 May 2021).
| Publisher’s Note: MDPI stays neutral with regard to jurisdictional claims in published maps and institutional affiliations. |
© 2021 by the authors. Licensee MDPI, Basel, Switzerland. This article is an open access article distributed under the terms and conditions of the Creative Commons Attribution (CC BY) license (https://creativecommons.org/licenses/by/4.0/).


