
Application of Geological Mapping Using Airborne-Based LiDAR DEM to Tunnel Engineering: Example of Dongao Tunnel in Northeastern Taiwan


Abstract
1. Introduction
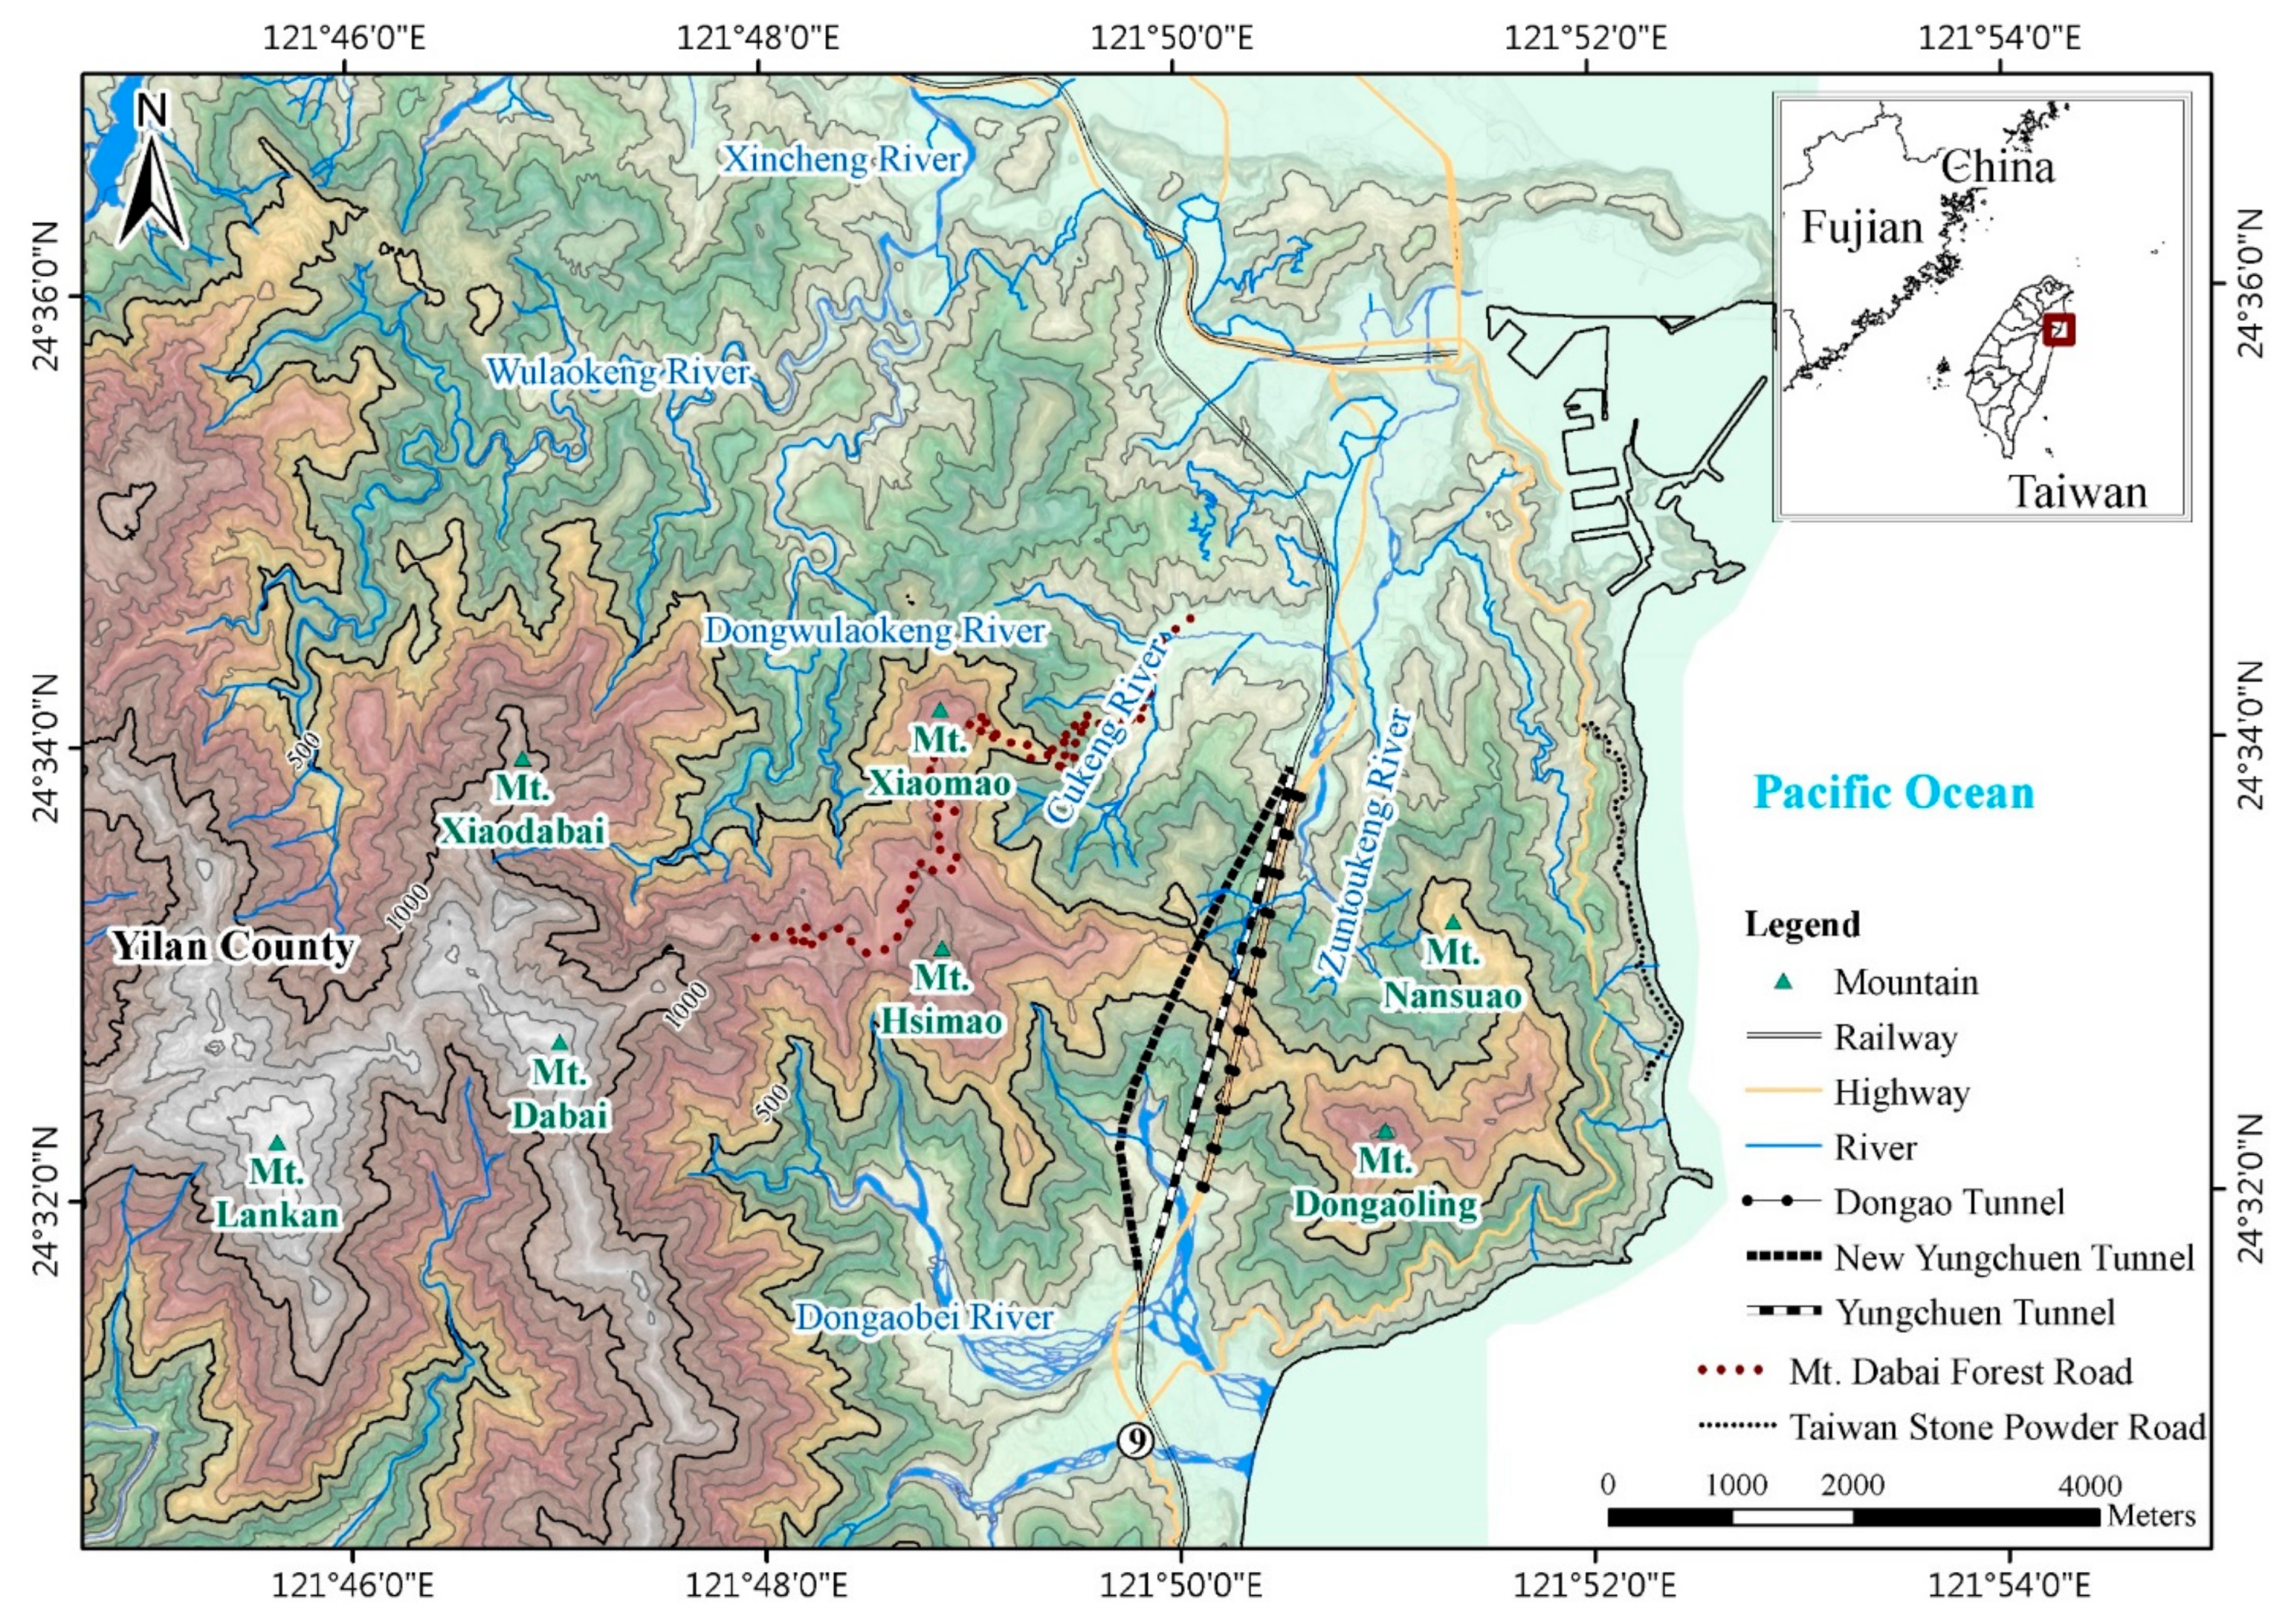
2. Study Area
2.1. Topography
2.2. Regional Geology
2.3. Traffic and Tunnel
3. Methods
4. Results
4.1. Lithology
4.2. Fault-Related
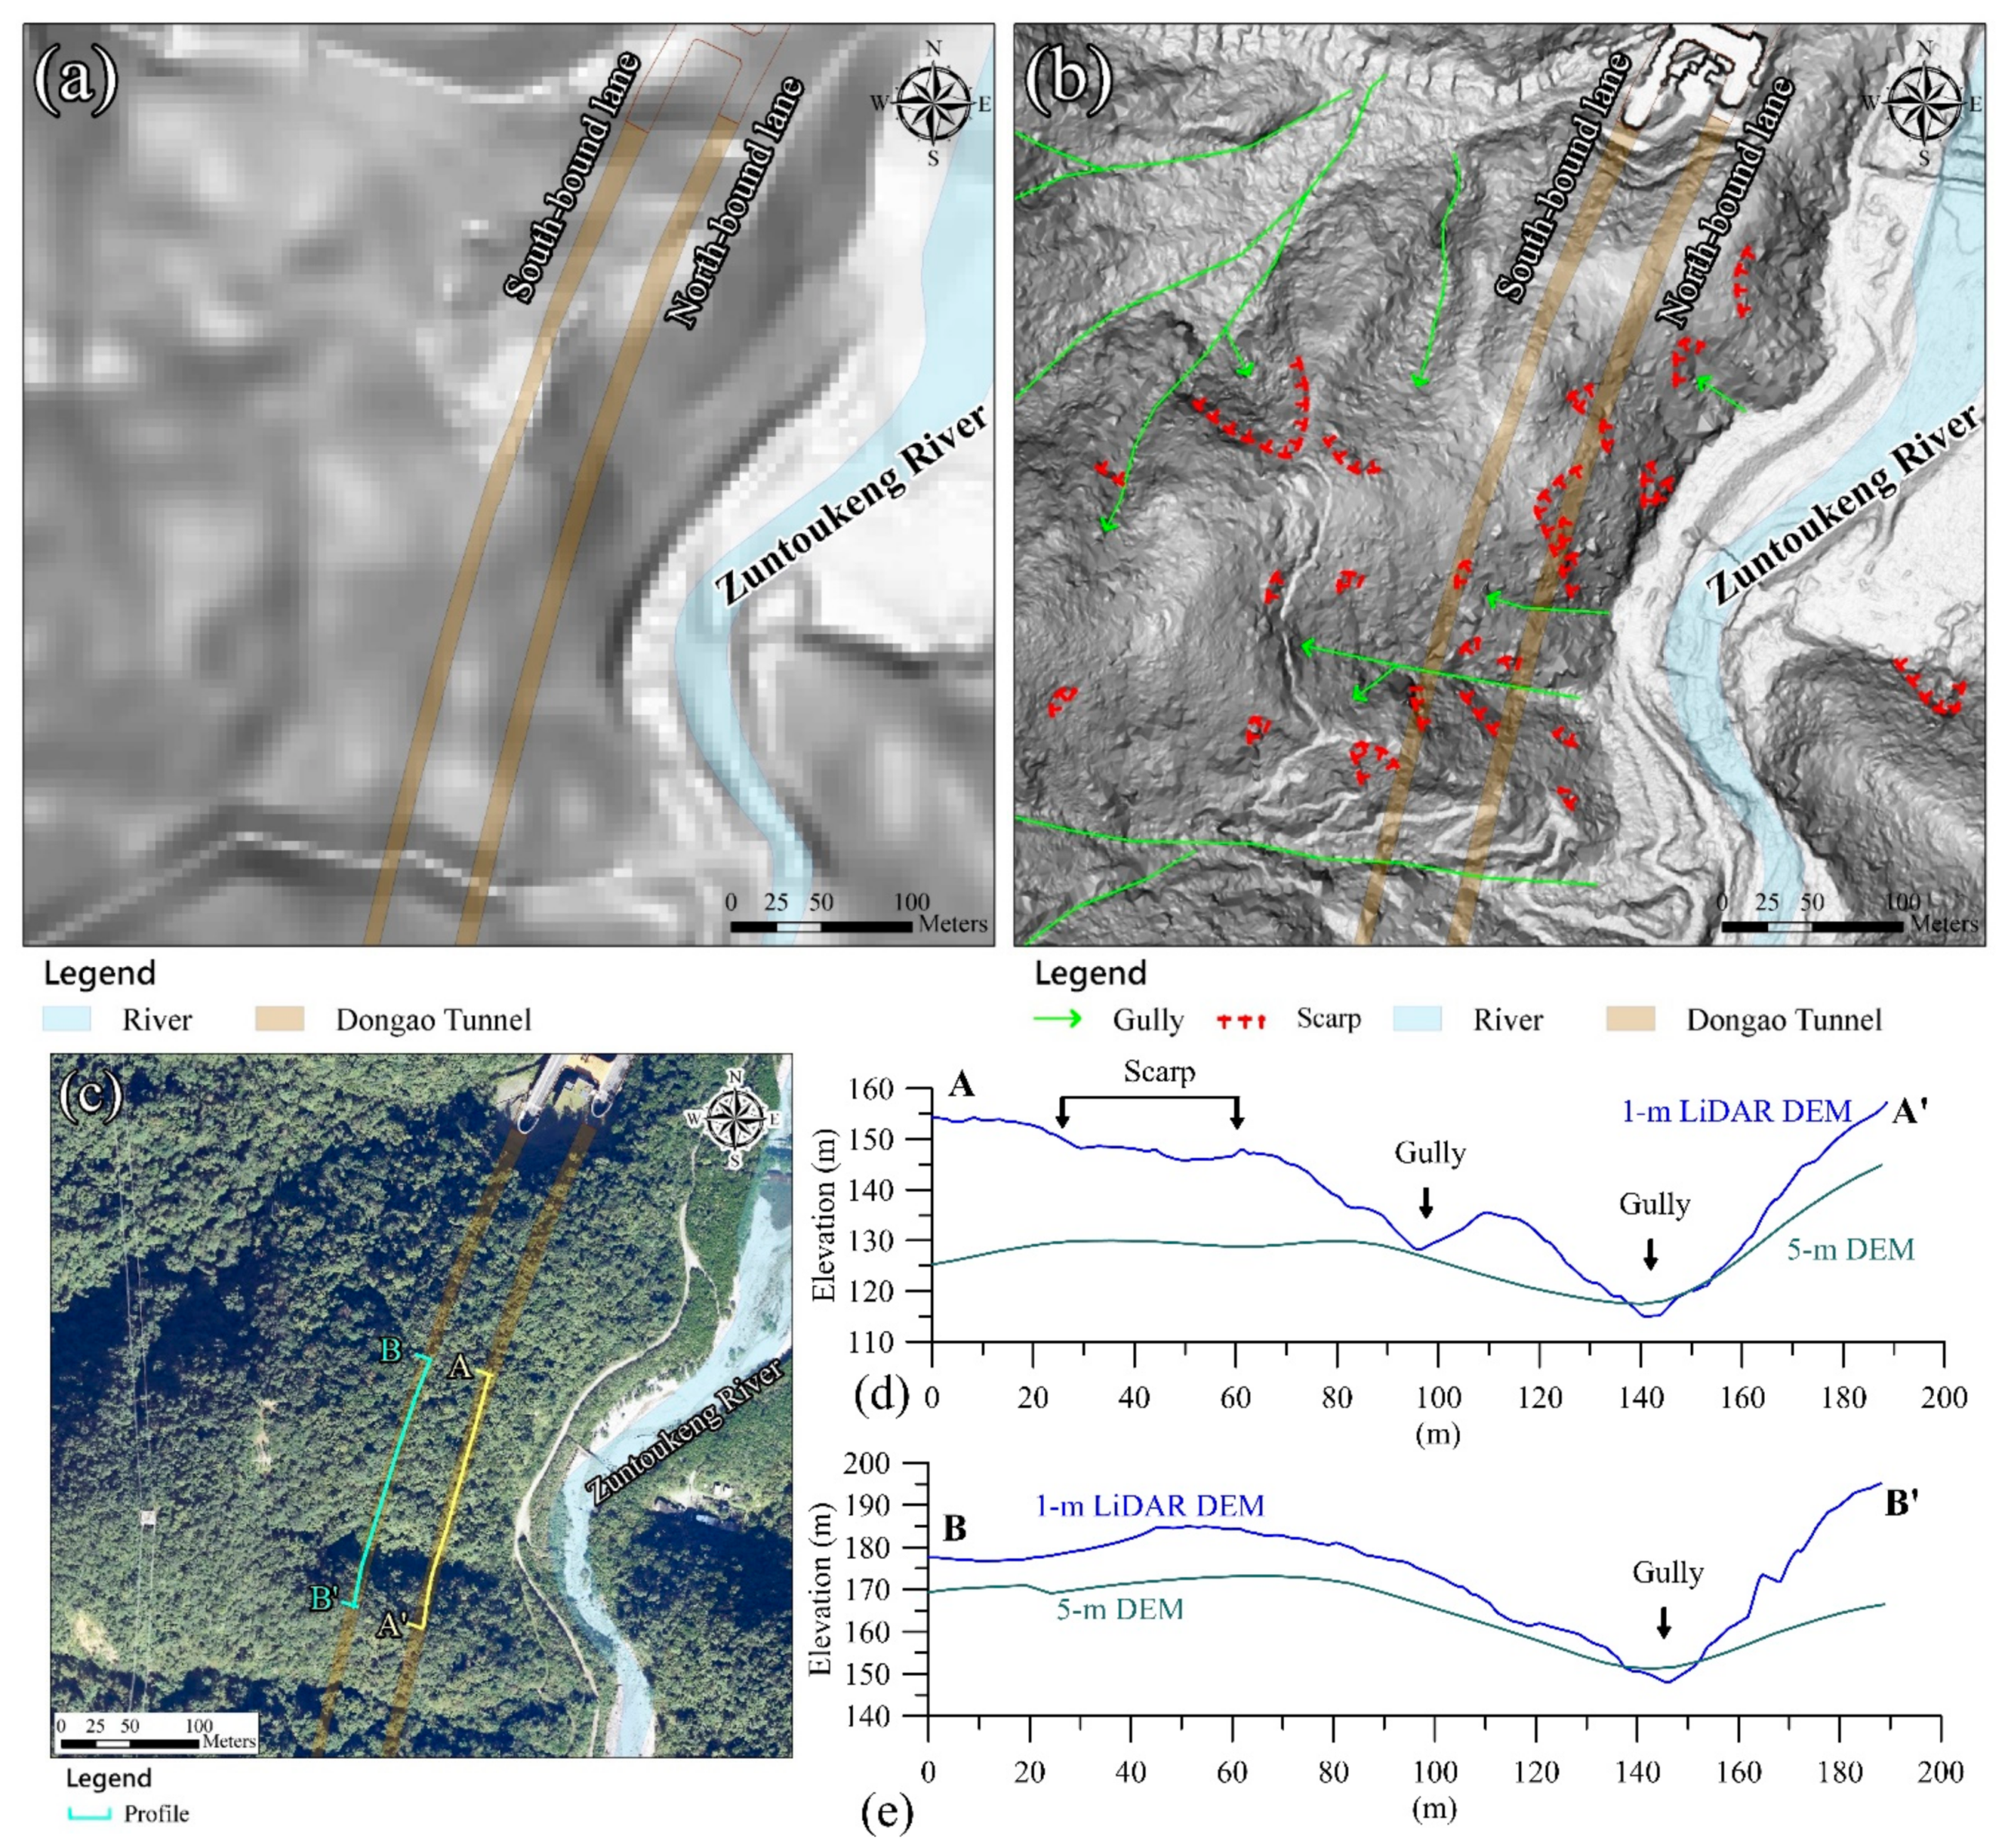
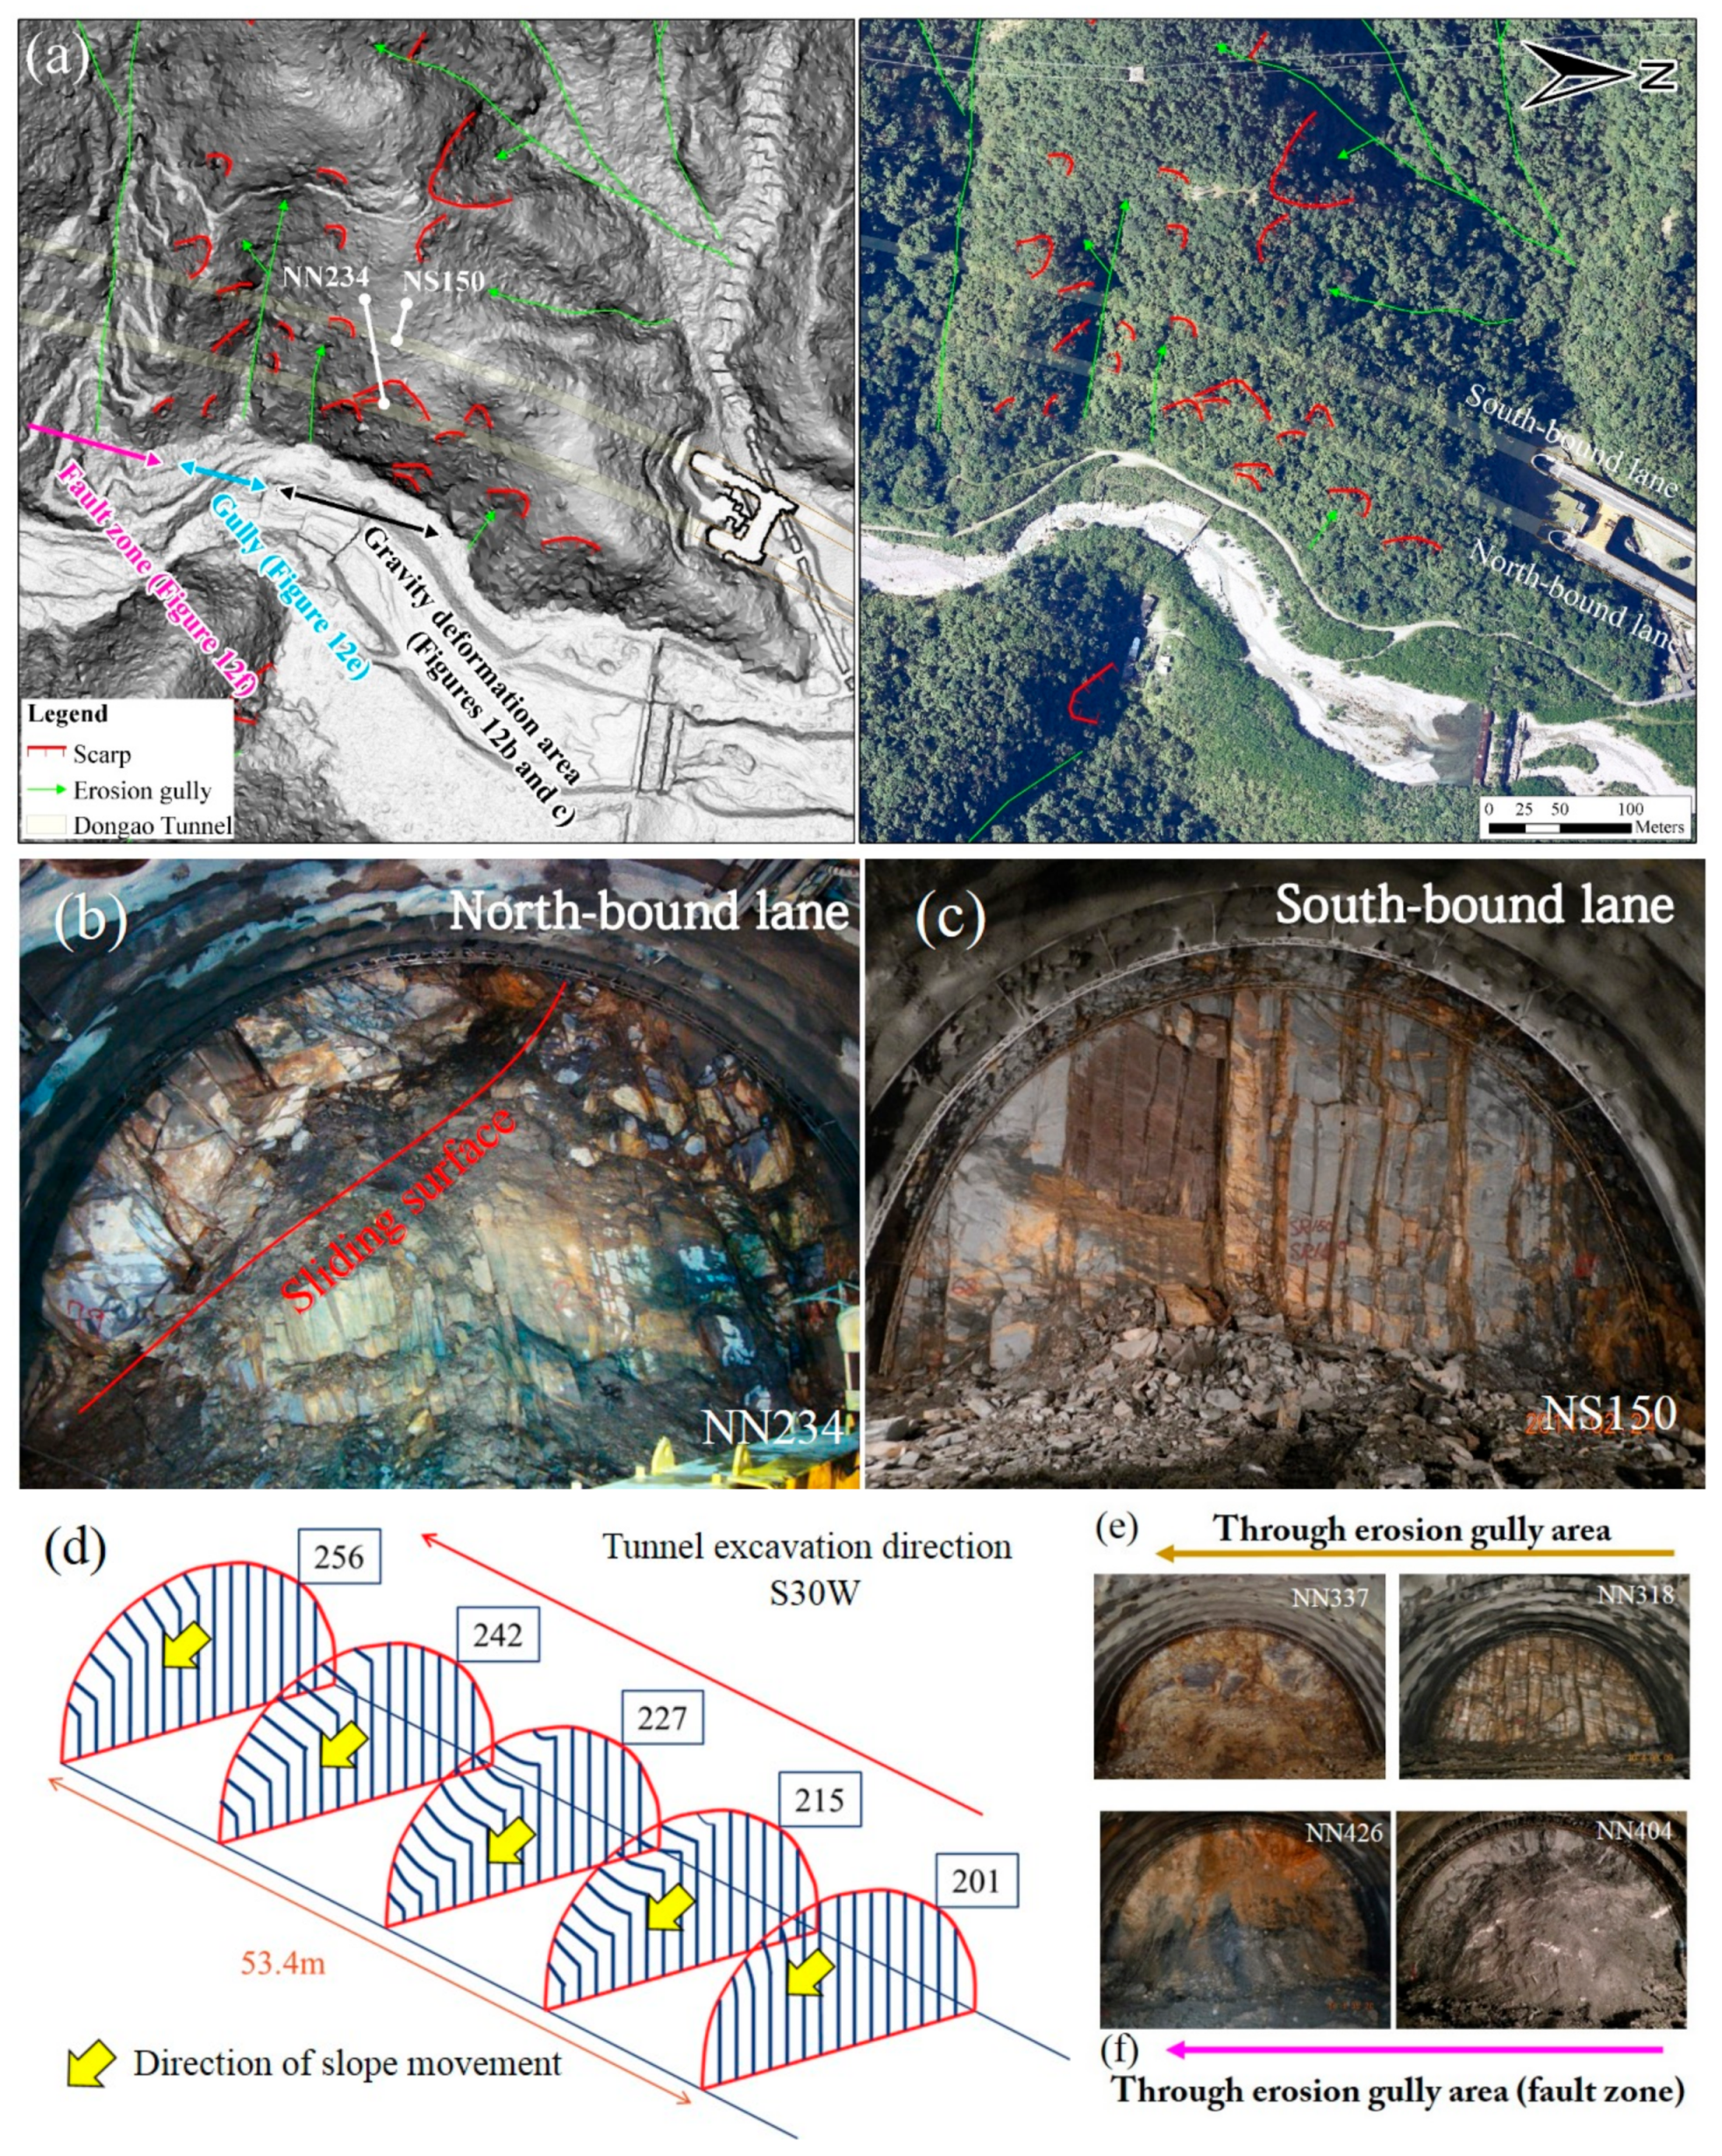
4.3. Scarp and Slope Deformation
5. Discussion
5.1. Lithology
5.2. Fault Zone
5.3. Scarp and Slope Deformation
6. Conclusions
- The airborne-based LiDAR DEM captures more precisely the topographic and geomorphic features of strata of the study area than do topographic maps produced using traditional aerial photogrammetry. The precise locations of geological structures, such as faults and lineaments, as well as the drainage system, can be identified accordingly. On clinometric and hillshade maps, different lithologies are distinct, as is the drainage system. Such maps therefore help in the finding of outcrops for conventional surface geological investigation.
- High-resolution airborne-based LiDAR DEM for identifying lithological boundaries, geological structures such as faults and lineament, and drainage systems, can be combined with on-site and underground excavation-based verification, to refine geological surveying and mapping.
- A scarp on the surface of a slope is an evidence of the deformation of the underground rock mass. However, the scope in which the rock mass has a high degree of weathering and the attitude of the tilted discontinuity may exceed the scope in which scarps on a slope are identified in a clinometric map.
- A field investigation by a professional geologist is still the most reliable method of geological surveying and mapping for the purpose of determining the engineering significance of geological features, their quantitative characteristics and corresponding parameters. Combining information thus obtained with that inferred from a high-resolution DEM can provide a more comprehensive understanding of the geological survey, including lithological distribution, geological structure, and locations of potential instabilities of a slope, favoring the assessment of tunnel engineering risks, especially in the initial stages of engineering projects, such as a feasibility study, planning, and design.
Author Contributions
Funding
Institutional Review Board Statement
Informed Consent Statement
Data Availability Statement
Acknowledgments
Conflicts of Interest
References
- Geach, M.; Stokes, M.; Hart, A. The application of geomorphic indices in terrain analysis for ground engineering practice. Eng. Geol. 2017, 217, 122–140. [Google Scholar] [CrossRef]
- Zangerl, C.; Eberhardt, E.; Perzlmaier, S. Kinematic behaviour and velocity characteristics of a complex deep-seated crystalline rockslide system in relation to its interaction with a dam reservoir. Eng. Geol. 2010, 112, 53–67. [Google Scholar] [CrossRef]
- Ambrosi, C.; Crosta, G. Large sackung along major tectonic features in the Central Italian Alps. Eng. Geol. 2006, 83, 183–200. [Google Scholar] [CrossRef]
- Tang, H.; Li, C.; Hu, X.; Su, A.; Wang, L.; Wu, Y.; Criss, R.; Xiong, C.; Li, Y. Evolution characteristics of the Huangtupo landslide based on in situ tunneling and monitoring. Landslides 2014, 12, 511–521. [Google Scholar] [CrossRef]
- Burbank, D.W.; Anderson, R.S. Tectonic Geomorphology, 2rd ed.; Wiley-Blackwell: Hoboken, NJ, USA, 2011; p. 460. [Google Scholar]
- Radaideh, O.M.; Grasemann, B.; Melichar, R.; Mosar, J. Detection and analysis of morphotectonic features utilizing satellite remote sensing and GIS: An example in SW Jordan. Geomorphology 2016, 275, 58–79. [Google Scholar] [CrossRef]
- Dong, P.; Chen, Q. Book Review–LiDAR Remote Sensing and Applications. Photogramm. Eng. Remote Sens. 2020, 86, 13–14. [Google Scholar] [CrossRef]
- Wang, G.; Joyce, J.; Phillips, D.; Shrestha, R.; Carter, W. Delineating and defining the boundaries of an active landslide in the rainforest of Puerto Rico using a combination of airborne and terrestrial LIDAR data. Landslides 2013, 10, 503–513. [Google Scholar] [CrossRef]
- Zhang, W.; Qi, J.; Wan, P.; Wang, H.; Xie, D.; Wang, X.; Yan, G. An Easy-to-Use Airborne LiDAR Data Filtering Method Based on Cloth Simulation. Remote Sens. 2016, 8, 501. [Google Scholar] [CrossRef]
- Langridge, R.M.; Ries, W.F.; Farrier, T.; Barth, N.C.; Khajavi, N.; De Pascale, G.P. Developing sub 5-m LiDAR DEMs for for-ested sections of the Alpine and Hope faults, South Island, New Zealand: Implications for structural interpretations. J. Struct. Geol. 2014, 64, 53–66. [Google Scholar] [CrossRef]
- Zielke, O.; Klinger, Y.; Arrowsmith, J.R. Fault slip and earthquake recurrence along strike-slip faults—Contributions of high-resolution geomorphic data. Tectonophysics 2015, 638, 43–62. [Google Scholar] [CrossRef]
- Thomas, I.; Jordan, P.; Shine, O.; Fenton, O.; Mellander, P.-E.; Dunlop, P.; Murphy, P. Defining optimal DEM resolutions and point densities for modelling hydrologically sensitive areas in agricultural catchments dominated by microtopography. Int. J. Appl. Earth Obs. Geoinf. 2017, 54, 38–52. [Google Scholar] [CrossRef]
- Tsao, M.-C.; Lo, W.; Chen, W.-L.; Wang, T.-T. Landslide-related maintenance issues around mountain road in Dasha River section of Central Cross Island Highway, Taiwan. Bull. Int. Assoc. Eng. Geol. 2021, 80, 813–834. [Google Scholar] [CrossRef]
- Sofia, G. Combining geomorphometry, feature extraction techniques and Earth-surface processes research: The way forward. Geomorphology 2020, 355, 107055. [Google Scholar] [CrossRef]
- Arrowsmith, J.R.; Zielke, O. Tectonic geomorphology of the San Andreas Fault zone from high resolution topography: An example from the Cholame segment. Geomorphology 2009, 113, 70–81. [Google Scholar] [CrossRef]
- Khajavi, N.; Quigley, M.; Langridge, R.M. Influence of topography and basement depth on surface rupture morphology revealed from LiDAR and field mapping, Hope Fault, New Zealand. Tectonophysics 2014, 630, 265–284. [Google Scholar] [CrossRef]
- Barth, N.C.; Toy, V.G.; Langridge, R.M.; Norris, R.J. Scale dependence of oblique plate-boundary partitioning: New insights from LiDAR, central Alpine fault, New Zealand. Lithosphere 2012, 4, 435–448. [Google Scholar] [CrossRef]
- Lin, Z.; Kaneda, H.; Mukoyama, S.; Asada, N.; Chiba, T. Detection of subtle tectonic–geomorphic features in densely forested mountains by very high-resolution airborne LiDAR survey. Geomorphology 2013, 182, 104–115. [Google Scholar] [CrossRef]
- Lin, C.-W.; Tseng, C.-M.; Tseng, Y.-H.; Fei, L.-Y.; Hsieh, Y.-C.; Tarolli, P. Recognition of large scale deep-seated landslides in forest areas of Taiwan using high resolution topography. J. Asian Earth Sci. 2013, 62, 389–400. [Google Scholar] [CrossRef]
- Hsieh, Y.-C.; Chan, Y.-C.; Hu, J.-C.; Chen, Y.-Z.; Chen, R.-F.; Chen, M.-M. Direct Measurements of Bedrock Incision Rates on the Surface of a Large Dip-slope Landslide by Multi-Period Airborne Laser Scanning DEMs. Remote Sens. 2016, 8, 900. [Google Scholar] [CrossRef]
- Hsieh, Y.-C.; Chan, Y.-C.; Hu, J.-C. Digital Elevation Model Differencing and Error Estimation from Multiple Sources: A Case Study from the Meiyuan Shan Landslide in Taiwan. Remote Sens. 2016, 8, 199. [Google Scholar] [CrossRef]
- Pánek, T.; Břežný, M.; Kapustová, V.; Lenart, J.; Chalupa, V. Large landslides and deep-seated gravitational slope deformations in the Czech Flysch Carpathians: New LiDAR-based inventory. Geomorphology 2019, 346, 106852. [Google Scholar] [CrossRef]
- Görüm, T. Landslide recognition and mapping in a mixed forest environment from airborne LiDAR data. Eng. Geol. 2019, 258, 105155. [Google Scholar] [CrossRef]
- Lo, P.C.; Lo, W.; Chiu, Y.C.; Wang, T.T. Characteristics of movement of a creeping slope in southeastern Taiwan influenced by river erosion and aggradation 2021. Eng. Geol. 2021. (submitted May 2021). [Google Scholar]
- Yeh, C.-H.; Chan, Y.-C.; Chang, K.-J.; Lin, M.-L.; Hsieh, Y.-C. Derivation of Strike and Dip in Sedimentary Terrain Using 3D Image Interpretation Based on Airborne LiDAR Data. Terr. Atmos. Ocean. Sci. 2014, 25, 775. [Google Scholar] [CrossRef][Green Version]
- Yeh, C.-H.; Lin, M.-L.; Chan, Y.-C.; Chang, K.-J.; Hsieh, Y.-C. Dip-slope mapping of sedimentary terrain using polygon auto-tracing and airborne LiDAR topographic data. Eng. Geol. 2017, 222, 236–249. [Google Scholar] [CrossRef]
- Chang, S.-H.; Chen, C.-S.; Wang, T.-T. Sediment Sluice Tunnel of Zengwen Reservoir and construction of section with huge underground excavation adjacent to neighboring slope. Eng. Geol. 2019, 260, 105227. [Google Scholar] [CrossRef]
- Chang, K.-J.; Chan, Y.-C.; Chen, R.-F.; Hsieh, Y.-C. Evaluation of Tectonic Activities Using LiDAR Topographic Data: The Nankan Lineament in Northern Taiwan. Terr. Atmos. Ocean. Sci. 2010, 21, 463. [Google Scholar] [CrossRef]
- McCalpin, J.; Gutierrez, F.; Bruhn, R.; Guerrero, J.; Pavlis, T.; Lucha, P. Tectonic geomorphology and late Quaternary deformation on the Ragged Mountain fault, Yakutat microplate, south coastal Alaska. Geomorphology 2020, 351, 106875. [Google Scholar] [CrossRef]
- Chen, R.-F.; Lin, C.-W.; Chen, Y.-H.; He, T.-C.; Fei, L.-Y. Detecting and Characterizing Active Thrust Fault and Deep-Seated Landslides in Dense Forest Areas of Southern Taiwan Using Airborne LiDAR DEM. Remote Sens. 2015, 7, 15443–15466. [Google Scholar] [CrossRef]
- Kania, M.; Szczęch, M. Geometry and topology of tectonolineaments in the Gorce Mts. (Outer Carpathians) in Poland. J. Struct. Geol. 2020, 141, 104186. [Google Scholar] [CrossRef]
- Pánek, T.; Minár, J.; Vitovič, L.; Břežný, M. Post-LGM faulting in Central Europe: LiDAR detection of the >50 km-long Sub-Tatra fault, Western Carpathians. Geomorphology 2020, 364, 107248. [Google Scholar] [CrossRef]
- Lin, C.W. Explanatory Text of the Geological Map of Taiwan-Suao Sheet, 1st ed.; Central Geological Survey: Taiwan, 1997. [Google Scholar]
- Lin, C.W. Explanatory Text of the Geological Map of Taiwan-Suao Sheet, 2nd ed.; Central Geological Survey: Taiwan, 2009. [Google Scholar]
- Lin, Y.C.; Shen, T.Y.; Hsian, S.C.; Shau, H.J. Case study on the geological characteristics and collapse of the weak intercalation of schist at the Dongao Tunnel in the Suhua Improvement Engineering Project. Sino-Geotech. 2017, 151, 35–44. [Google Scholar]
- Lo, P.C.; Lo, W.; Wang, T.T.; Chiu, Y.C. Geological Characteristics of Tunnel Surrounding Rocks in Heavily Deformed Ground: Case Study of Dongao Tunnel, Taiwan. In Proceedings of the 5th ISRM Young Scholars’ Symposium on Rock Mechanics and International Symposium on Rock Engineering for Innovative Future, Okinawa, Japan, 1–4 December 2019; ISRM-YSRM-2019-114. [Google Scholar]
- Wang, T.-T.; Jeng, F.-S.; Lo, W. Mitigating large water ingresses into the New Yungchuen Tunnel, Taiwan. Bull. Int. Assoc. Eng. Geol. 2011, 70, 173–186. [Google Scholar] [CrossRef]
- Lin, C.S.; Shao, H.J.; Chen, Y.P.; Wang, T.T. Response of tunnel surrounding rocks in heavily deformed ground: Case study of Dongao Tunnel, Taiwan 2019. In Proceedings of the 2019 World Tunnel Congress, Naples, Italy, 3–9 May 2019. [Google Scholar]


Publisher’s Note: MDPI stays neutral with regard to jurisdictional claims in published maps and institutional affiliations. |
© 2021 by the authors. Licensee MDPI, Basel, Switzerland. This article is an open access article distributed under the terms and conditions of the Creative Commons Attribution (CC BY) license (https://creativecommons.org/licenses/by/4.0/).
Share and Cite
Lo, P.-C.; Lo, W.; Wang, T.-T.; Hsieh, Y.-C. Application of Geological Mapping Using Airborne-Based LiDAR DEM to Tunnel Engineering: Example of Dongao Tunnel in Northeastern Taiwan. Appl. Sci. 2021, 11, 4404. https://doi.org/10.3390/app11104404
Lo P-C, Lo W, Wang T-T, Hsieh Y-C. Application of Geological Mapping Using Airborne-Based LiDAR DEM to Tunnel Engineering: Example of Dongao Tunnel in Northeastern Taiwan. Applied Sciences. 2021; 11(10):4404. https://doi.org/10.3390/app11104404
Chicago/Turabian StyleLo, Pai-Chiao, Wei Lo, Tai-Tien Wang, and Yu-Chung Hsieh. 2021. "Application of Geological Mapping Using Airborne-Based LiDAR DEM to Tunnel Engineering: Example of Dongao Tunnel in Northeastern Taiwan" Applied Sciences 11, no. 10: 4404. https://doi.org/10.3390/app11104404
APA StyleLo, P.-C., Lo, W., Wang, T.-T., & Hsieh, Y.-C. (2021). Application of Geological Mapping Using Airborne-Based LiDAR DEM to Tunnel Engineering: Example of Dongao Tunnel in Northeastern Taiwan. Applied Sciences, 11(10), 4404. https://doi.org/10.3390/app11104404