1. Introduction
As a typical mining layout form that saves coal resources, improves the resource recovery rate, and simplifies mining and excavation replacement, gob (after the coal is mined, the original working face position is called the gob)-side entry (GSE) has been used extensively in Chinese coal mining roadways [
1,
2]. The development of the surrounding rock joints and fissures of the GSE is affected by factors such as multiple mining at the working face, advanced support pressure and other factors, and is often accompanied by engineering disasters, such as the collapse of slabs of coal pillars on the side of the goaf [
3,
4]. The small coal pillar is an important part of the surrounding rock of GSE, and its stability affects the roadway stability directly.
Extensive research has been conducted on coal damage and destruction and related mechanical properties. To reproduce the force process of coal pillars in underground engineering, cyclic loading is usually used to test the long-term mechanical properties of coal. Eberhardt et al. [
5] analyzed the mechanical characteristics of fracture damage during the uniaxial cyclic loading and unloading of rocks and studied the propagation conditions and fracture criteria of microcracks through experimental results. Zhou et al. [
6] conducted uniaxial cyclic loading and unloading tests on sandstone and proposed that the macroscopic fatigue failure mode of rock under uniaxial cyclic loading and unloading conditions depends on the fracture propagation form of internal microcracks. The impact of mechanical performance is more obvious. Xiao et al. [
7] carried out uniaxial loading and unloading tests on coal samples, proposed that the plastic properties of each cycle are the dissipation energy of new cracks, and fitted the elastic energy index correction formula. Ge et al. [
8] proposed that the main factors that affect the rock fatigue life are the upper limit stress and amplitude of the cyclic load. Geranmayeh et al. [
9] studied the deformation and strength response of sandstone and granodiorite under multi-stage uniaxial cyclic compression loads. It is believed that the different deformation and failure modes of these two rocks under cyclic loading are mainly due to the difference in their microstructures. Zhou et al. [
10] conducted a permeability test on the sawtooth fractured rock subjected to periodic axial loads. The results show that the increase in axial displacement roughly contributed to the permeability reduction, and excessive amplitude of cyclic load posed a limited boost to the permeability enhancement. However, few people discuss the applicability of the cyclic load loading method.
The difference in mine development layout yields a certain time interval between multiple mining disturbances, so the coal pillar is not in an ideal continuous cycle loading and unloading state. Different from general sedimentary rock, multi-level fissures in coal develop visibly [
11,
12]. The long-term continuous force expands the internal fissures of the coal fully, and its mechanical properties and pore characteristics are changed [
13], which affects the bearing capacity strength of the coal pillar. Therefore, the influence of the continuous load-holding time interval in discontinuous cyclic loading on coal damage was the focus of this work.
Nuclear magnetic resonance (NMR) is a new type of non-destructive testing technology that utilizes quantum magnetism at the atomic scale [
14]. It has been used extensively in tests and research in the fields of crack identification, pore distribution, rock meso-structure damage, and rock physical and mechanical characteristics under different conditions, and has become an important rock physical test analysis method [
15,
16]. By analyzing changes in the number of pores with different diameters in coal-rock masses after microwave treatment by NMR, Li et al. [
17] obtained the evolution of the pore diameter in coal-rock masses after microwave-induced fracturing. Sun et al. [
18] used nuclear magnetic resonance equipment to study the changes in the pore structure of the granite in the high-level radioactive waste repository after high-temperature treatment, and described the relationship between the peak value and area of the
T2 curve and the pore structure of the rock mass. Sun et al. [
19] used nuclear magnetic resonance equipment to study the meso-damage evolution characteristics of granite in cold regions after undergoing freeze-thaw cycles.
Previous engineering experience has shown that under the action of extended multiple mining disturbances, internal primary fissures continue to expand and converge, and eventually induce coal pillar instability and destruction [
20,
21]. However, few studies exist on the evolution of pores of different diameters, the degree of crack development, and strength attenuation in coal for long-term engineering disturbances, and most occur at the macro level. Therefore, this work proposes an unconfined uniaxial compression experiment under discontinuous cyclic loading. NMR analysis was used to test the damaged coal for different holding times, and the pore evolution and internal fissure development of different damaged coal bodies was obtained. According to the coal failure test, the damage and strength attenuation mechanism of the coal body were studied.
2. Experimental Work
2.1. Experimental Samples
Fresh coal was from an 810-m depth in a coal mine in Shaanxi, China.
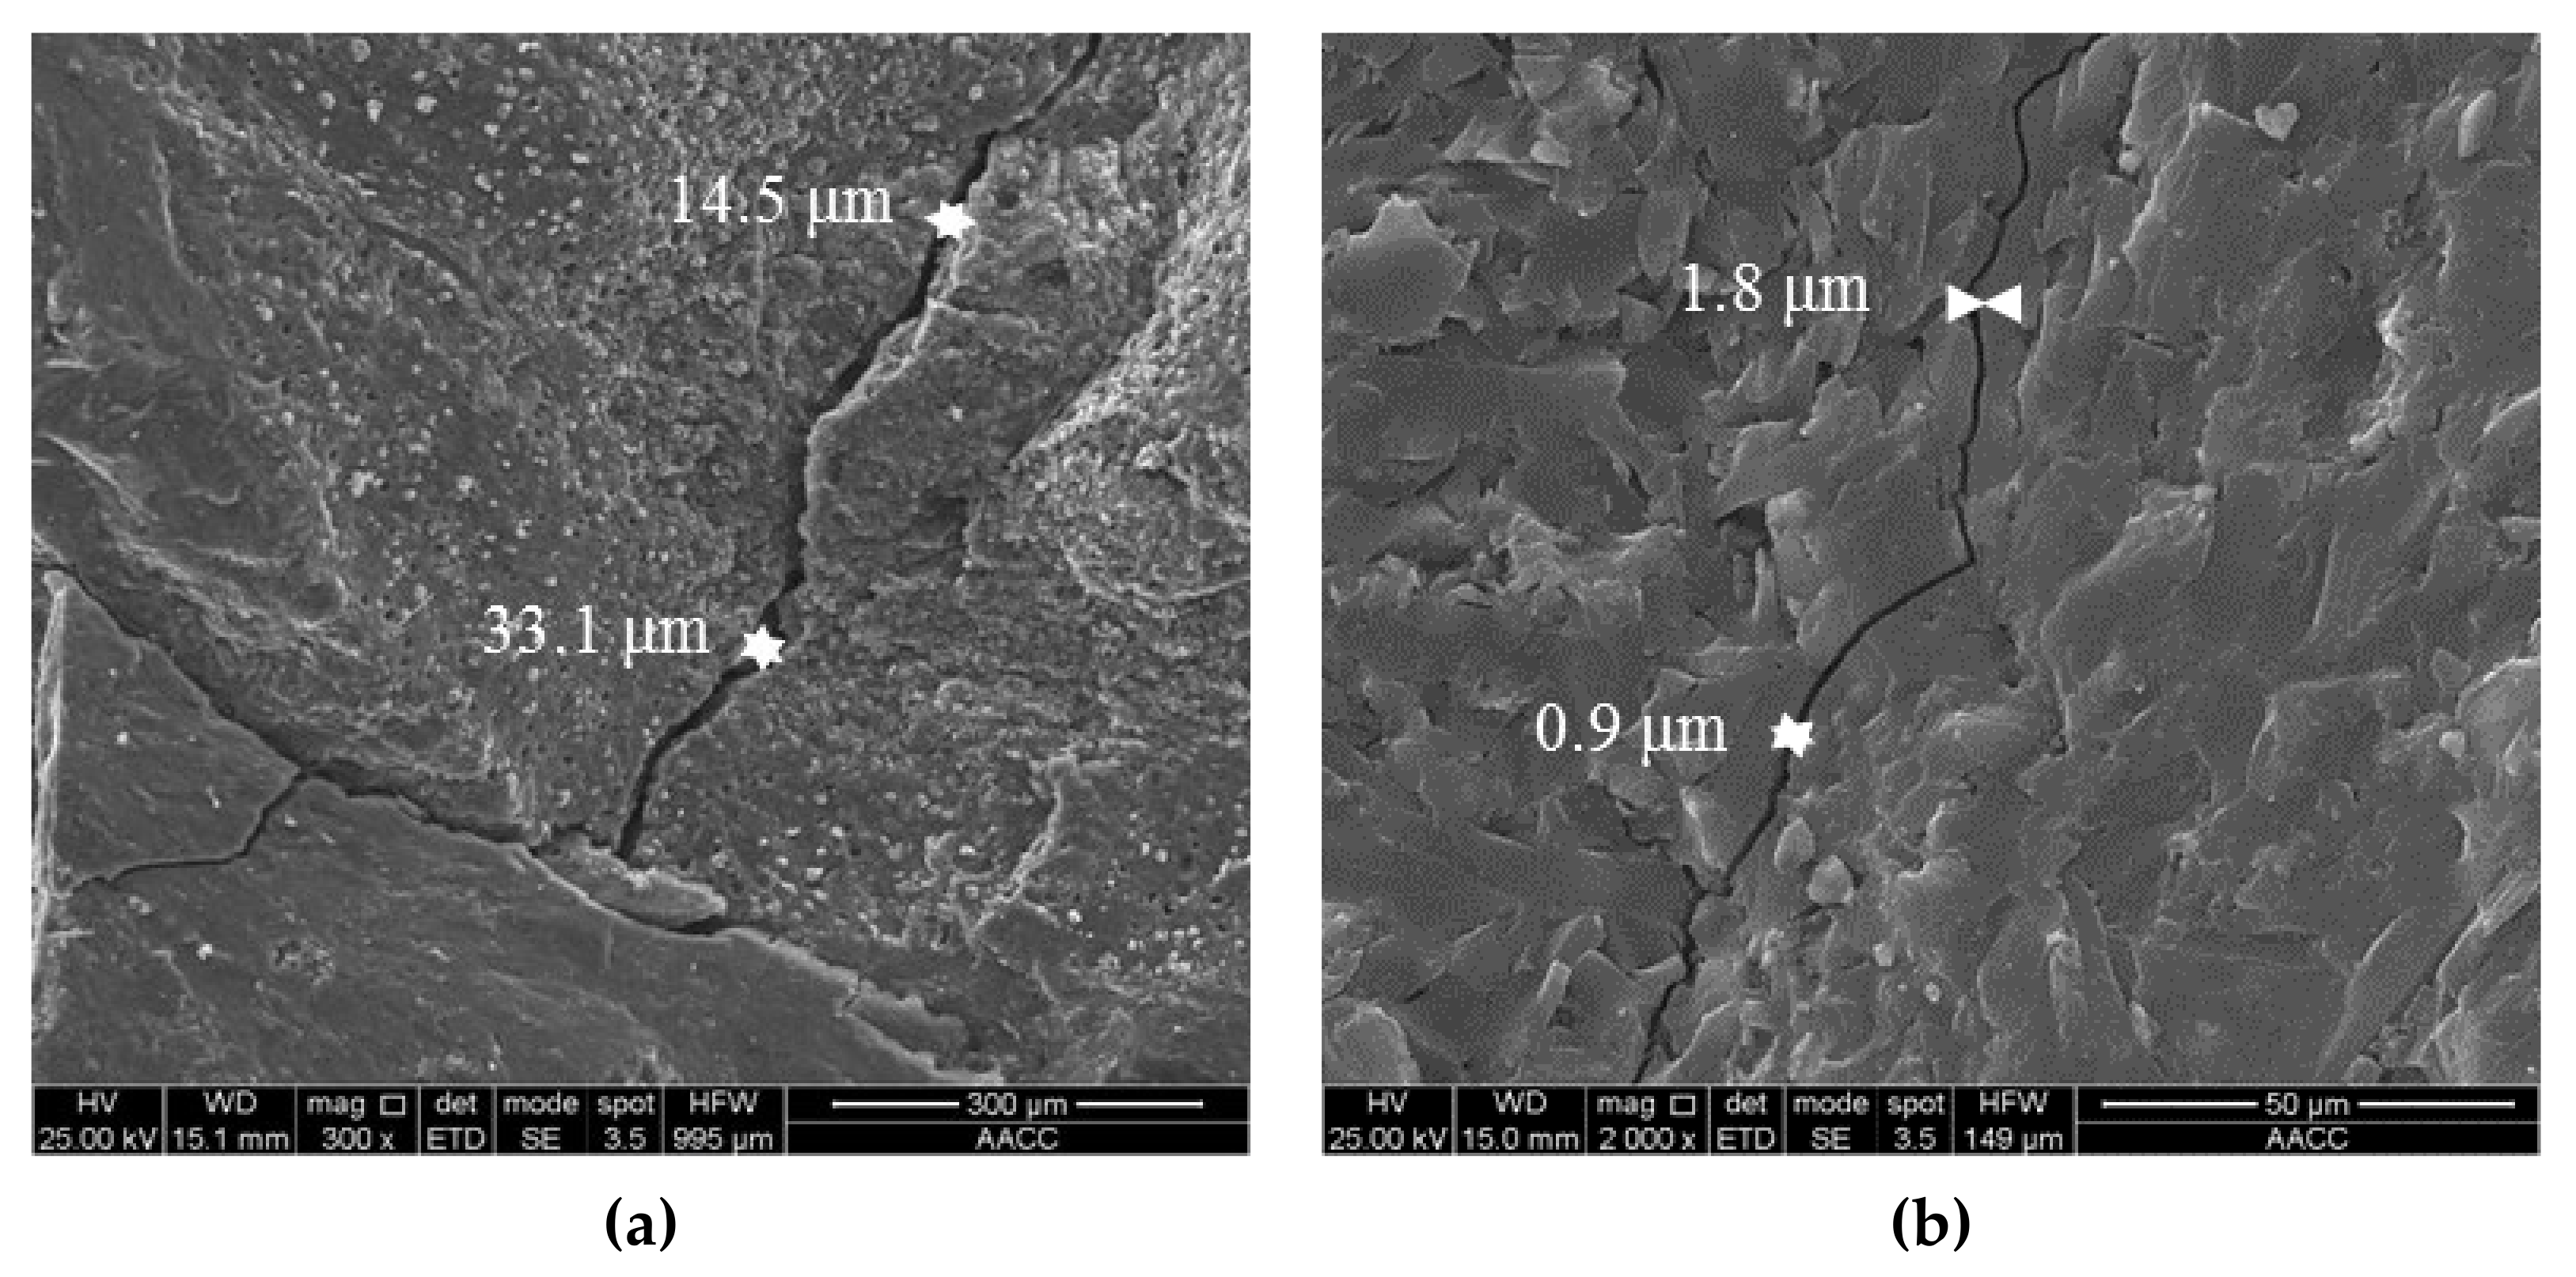
Figure 1 provides an image of the coal sample that was scanned with a scanning electron microscope (SEM), and the coal sample was enlarged 300 times to show obvious cross-crack development, in which the gap width varied from 14.5 μm to 33.1 μm. The different areas were enlarged 2000 times and showed obvious micro–nano cracks of ~0.9–1.8 μm. Microcracks exist in the coal at the sampling point. To reduce the influence of coal sample discreteness on the test results, the samples were drilled from the same large coal body. The coal sample was processed into a 50-mm-diameter cylinder with a 100-mm height. Both ends were ground flat according to International Society for Rock Mechanics (ISRM) requirements. Samples with a larger dispersion were eliminated by sonic testing, and 12 standard samples were obtained.
2.2. Experimental Platform
To study the characteristics of the coal microstructural deterioration, a laboratory hydraulic press–NMR experimental platform was established (see
Figure 2), which included:
- (1)
Hydraulic servo testing machine
The compression experiment used a hydraulic servo-controlled material testing machine C64.106 (MTS) (MTS Industrial Systems Co., Ltd., Shenzhen, China) with a maximum load capacity of 1000 kN, a test force measurement accuracy of ±0.5%, an adjustable sampling frequency of 1000 Hz, and a displacement measurement accuracy of ±0.5.
- (2)
NMR analysis equipment
The MacroMR12-150H-I low-field NMR core microscopic non-destructive testing and analysis system (Suzhou Niumag Electronic Technology Co., Ltd., Suzhou, China) was used to test the internal crack expansion of coal. The NMR instrument has a 0.3 T magnetic field. All the experiments were performed at a constant temperature of 32.0 ± 0.02 °C. The NMR Carr–Purcell–Meiboom–Gill (CPMG) sampling sequence is shown in
Table 1.
- (3)
Experimental auxiliary equipment
Test auxiliary equipment included a dryer and vacuum-saturated water device. A desktop DHG-9003 electric heating convection drying oven (CDO) (Shanghai Jinghong Experimental Equipment Co., Ltd., Shanghai, China) was used to remove internal moisture from the coal sample. The temperature control range of the drying oven was room temperature +10–200 °C. To reduce the temperature damage to the coal sample as much as possible, the working temperature of the CDO is set to 50 °C. A ZYB-II vacuum-saturation device (VSD) (Shanghai Jinghong Experimental Equipment Co., Ltd., Shanghai, China) was used to vacuum-saturate the sample. During the vacuum saturation process, the vacuum pressure value is 0.01 MPa and the air is pumped for 1 h. Then the coal is soaked in water for 8 h.
2.3. Experimental Method
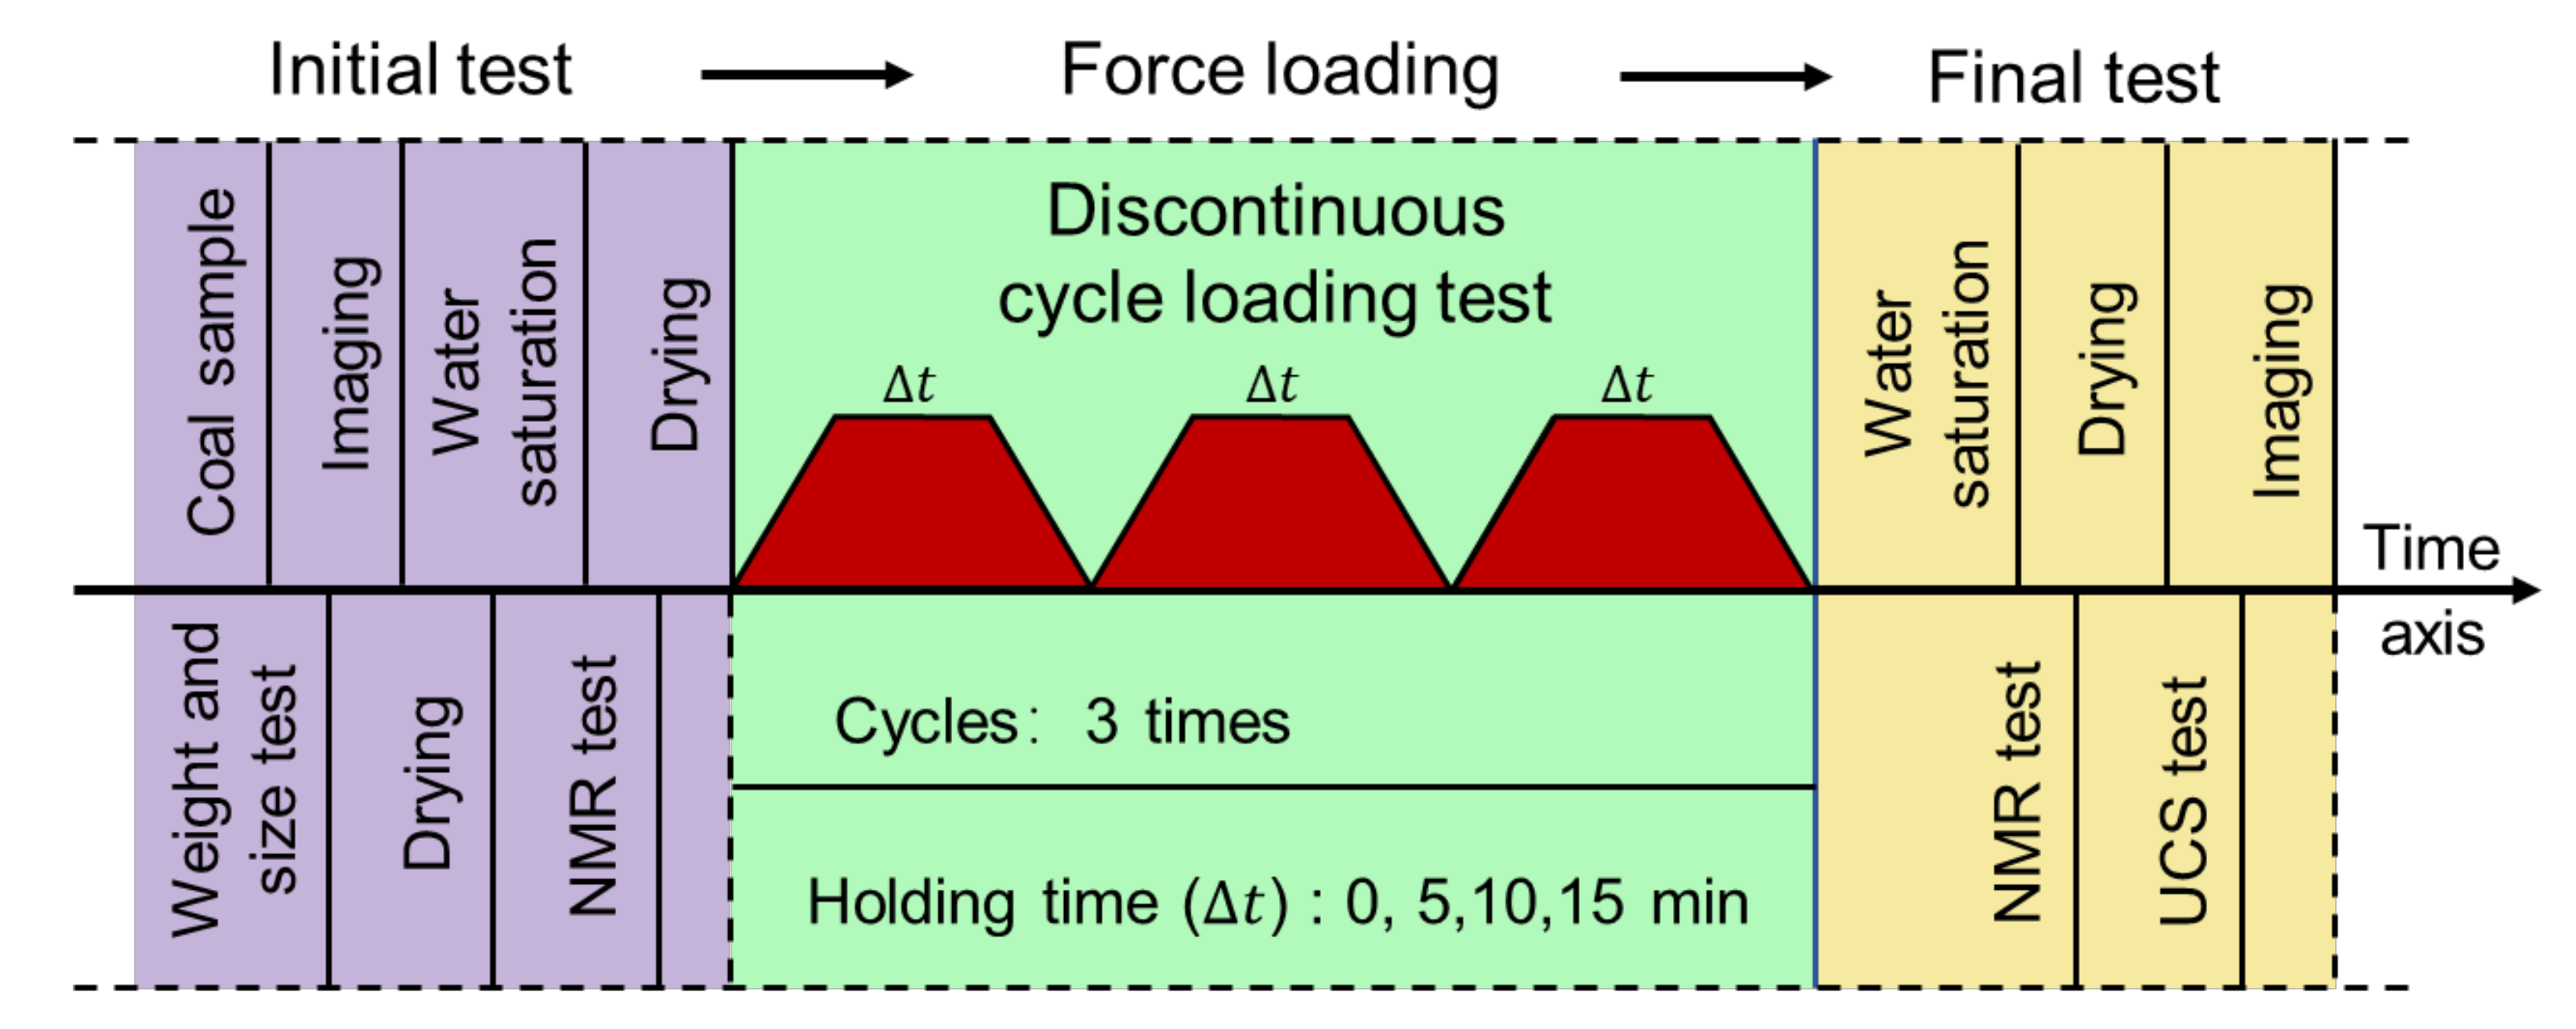
(1) Initial test. An unconfined uniaxial compression experiment under a discontinuous cyclic load was designed, as shown in
Figure 3. The twelve coal samples were divided into four groups of three samples each. The measured size and mass of the coal samples are presented in
Table 2. All samples were dried continuously for 8 h at 50 °C in the dryer. The coal sample was treated with saturated water (vacuum pressure of 0.01 MPa, pumping for 1 h), and soaked in water for 8 h. The NMR analyzer was used to collect the initial pore and crack distribution information of the coal to obtain the initial
curve.
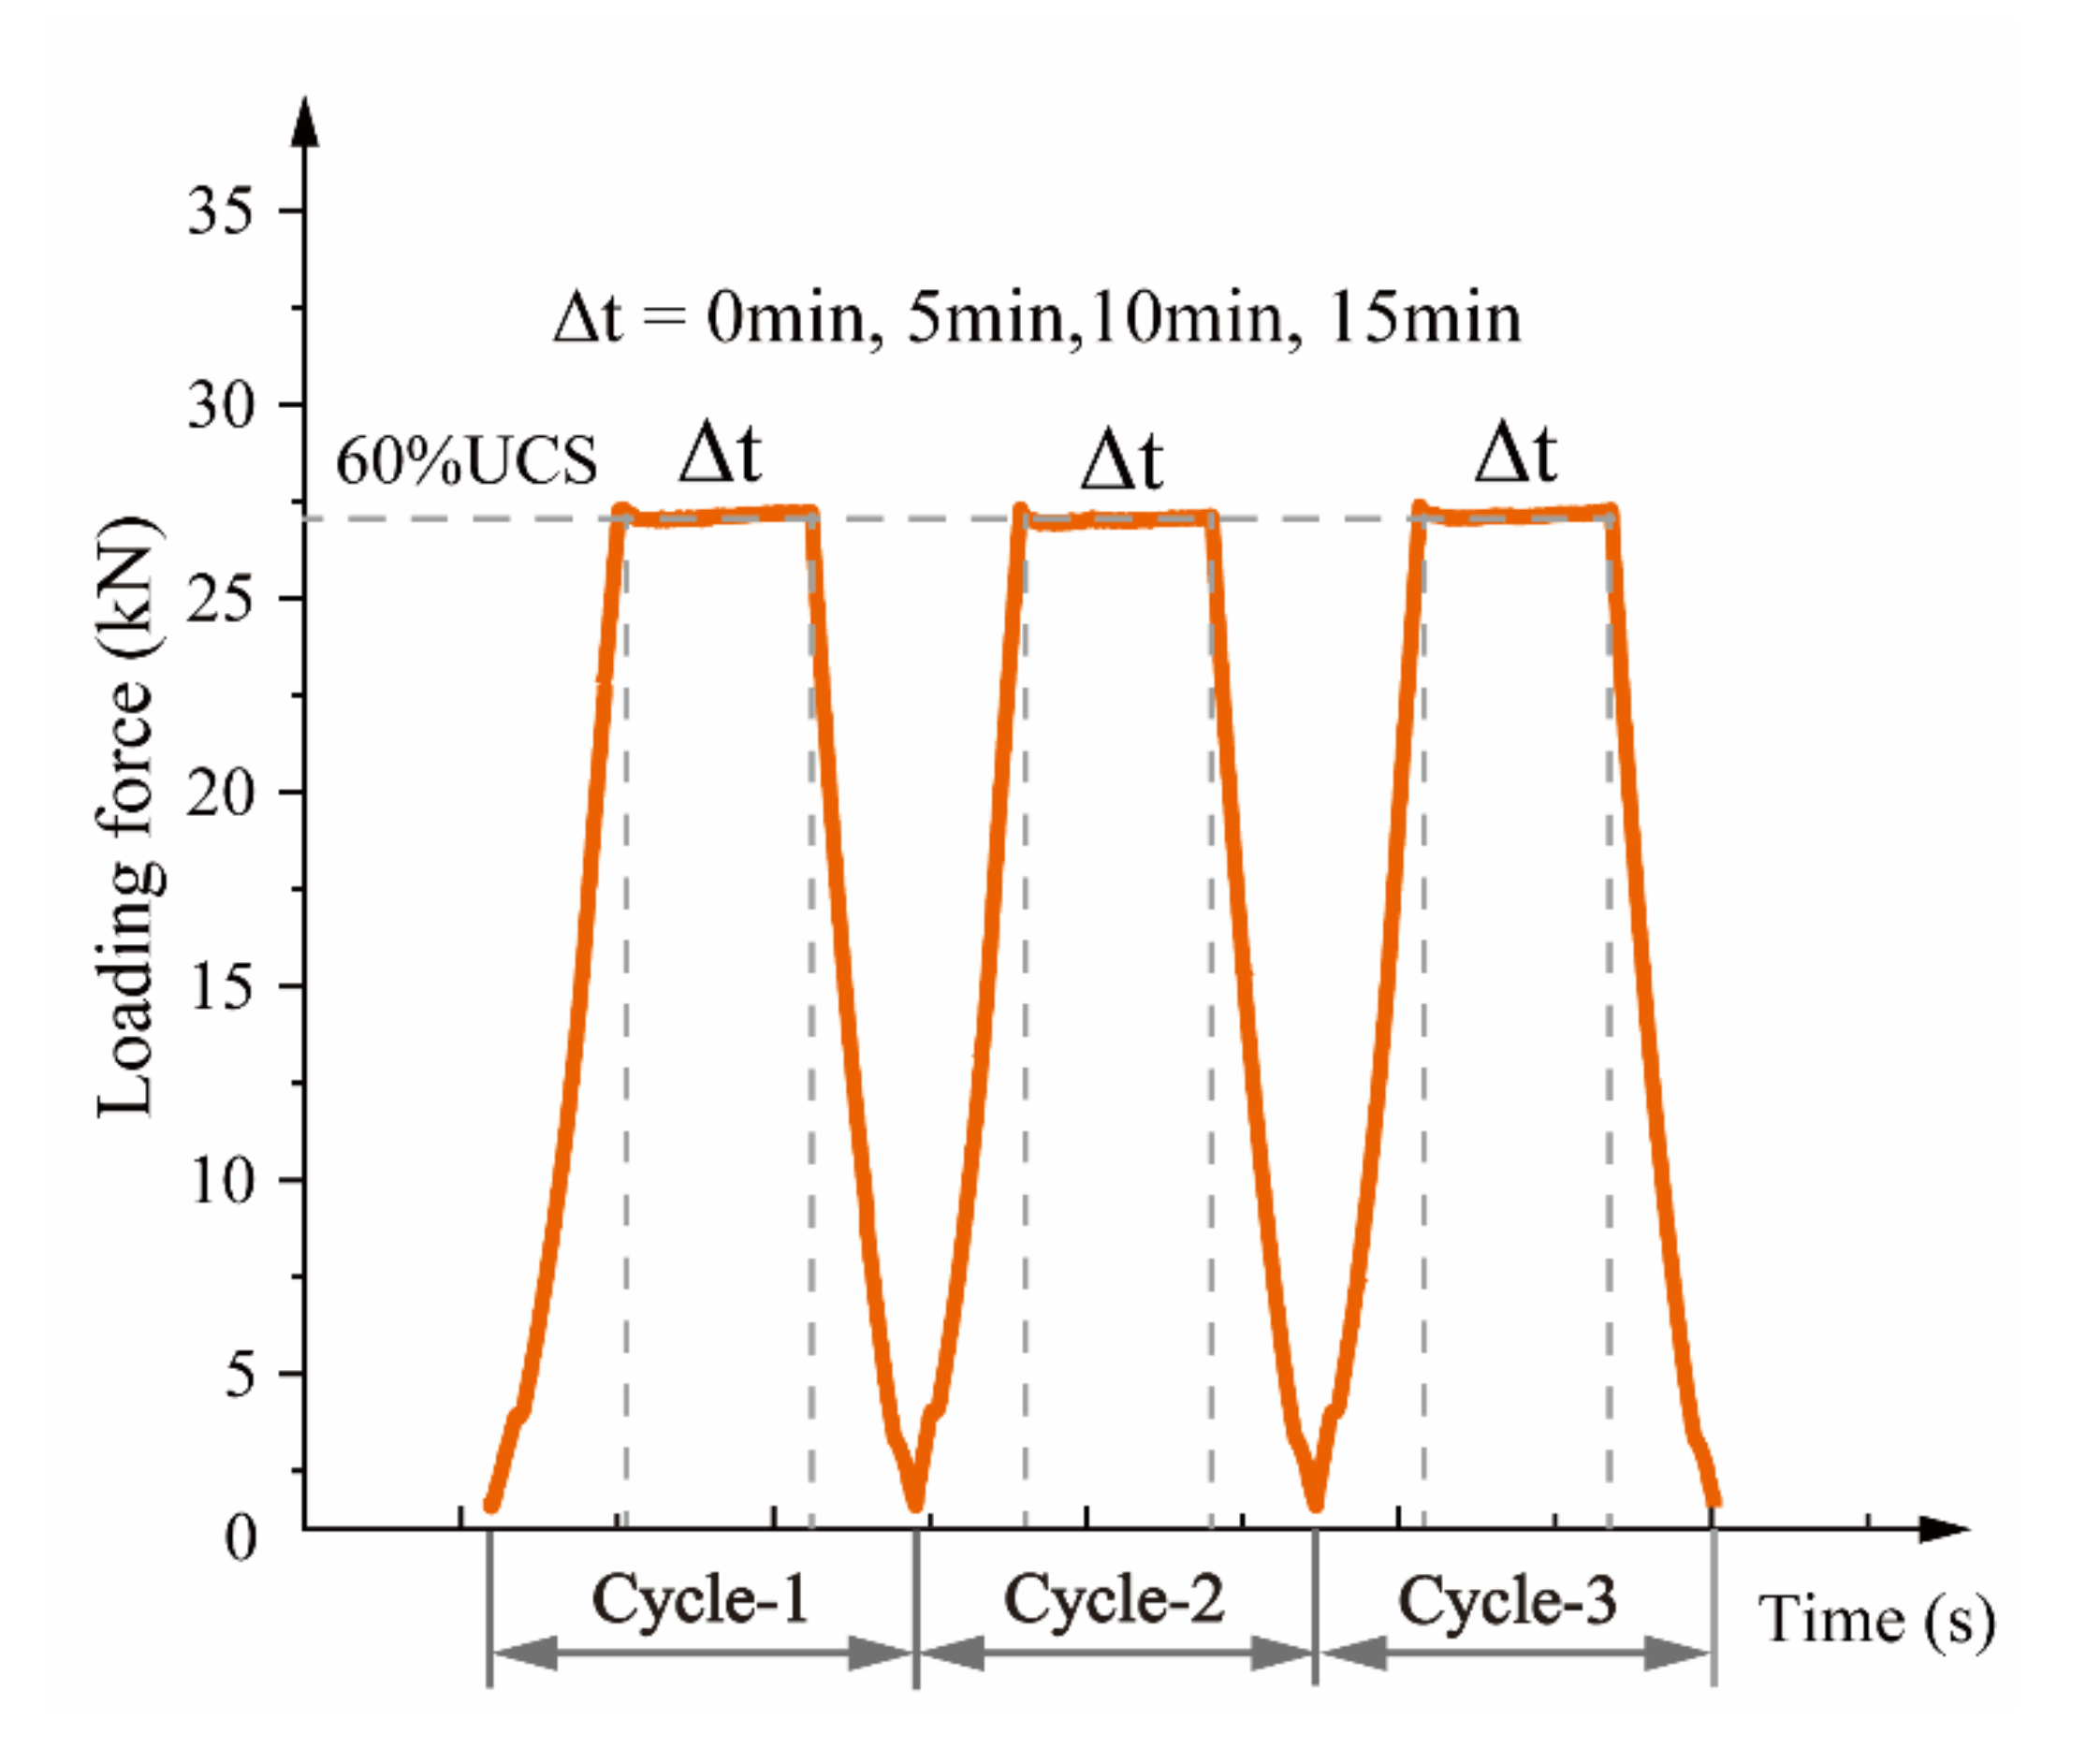
(2) Force loading. The coal sample was dried and the rock testing machine was used to impose different discontinuous cyclic loads on the coal sample to destroy the coal body structure. The force loading curve is shown in
Figure 4. Three cycles were used with a holding force of 27 kN (60% unconfined uniaxial compressive strength, (UCS)) [
22], and a holding time of 0, 5, 10, and 15 min. The loading method was deformation control at a loading rate of 0.02 mm/s.
(3) Final test. The samples after being subjected to the force was treated with vacuum-saturated water (the method is same as the initial test), and NMR analysis equipment was used to collect the final pore and fracture information of the coal sample to obtain the final curve. The sample was dried, the final uniaxial compression test was performed with a press until the sample failed, and the uniaxial compression stress–strain curve and final UCS of the rock under different force loading modes was obtained.
3. Results and Discussion
3.1. Pore Structure Alterations Characterized by NMR Response
One of the meanings of the low-field NMR
distribution in fluid physics is the pore size distribution of the core. The
distribution provides pore-size-distribution information [
23]. In rock pores, the
relaxation time of fluid can be expressed as [
24,
25]:
where:
is the total relaxation time;
is the fluid transverse relaxation time caused by surface relaxation;
is the fluid transverse relaxation time caused by diffusion relaxation under a gradient magnetic field;
is the transverse relaxation time of the fluid in a free state.
An important feature of the rock surface relaxation is related to the specific surface of the rock. A larger specific surface area of the rock (which refers to the ratio of pore surface area to pore volume in the rock) yields a smaller
relaxation time, and vice versa. Therefore, the rock surface relaxation can be expressed as [
26]:
where
is the relaxation rate of the rock surface and
S/V is the ratio of the pore surface area to fluid volume.
If we assume that the pore radius is related positively to the throat radius, Equation (2) becomes [
27]:
where
is the geometric factor and
r is the aperture. Based on Equations (1)–(3), the lateral relaxation time is proportional to the pore radius r of the core. Therefore, the
distribution can reflect the pore radius distribution. A longer relaxation time has a larger corresponding hole radius, and vice versa.
3.2. Quantification of Coal Porosity with NMR Measurements
Figure 5 shows the initial
distribution curves of the four groups of coal samples and the final
distribution curves after different discontinuous cyclic loads. According to the NMR relaxation mechanism, the width of the peak of the
distribution curve reflects the sorting of certain pore types, and the number of peaks reflects the continuity of pores at various levels [
28,
29]. A continuous bimodal distribution is usually observed in the
curve of the test coal. This distribution indicates that the pore structure of coal is complex. Pores and cracks of various sizes in coal are pre-existing, and the connectivity between different pores is better. The first peak on the left of the
distribution accounts for a large proportion of total pores, which indicates that many micropores exist in the coal sample. An increase in holding time in the discontinuous cycle load increases the amplitude of the
distribution curve of all coal samples gradually. When the holding time was 0 min, the average maximum amplitude of the first peak of the
distribution was 215. When the holding time increased to 15 min, the average maximum amplitude of the first peak was 320, which is an increase of 48.5%. Therefore, as the holding time increased, the degree of damage inside the specimen increased gradually. These results are similar to the results of Wang [
30].
The changes in size and number of pores in the rock can be reflected by the
distribution area, where the area is correlated positively with the size and number of the corresponding pores [
31].
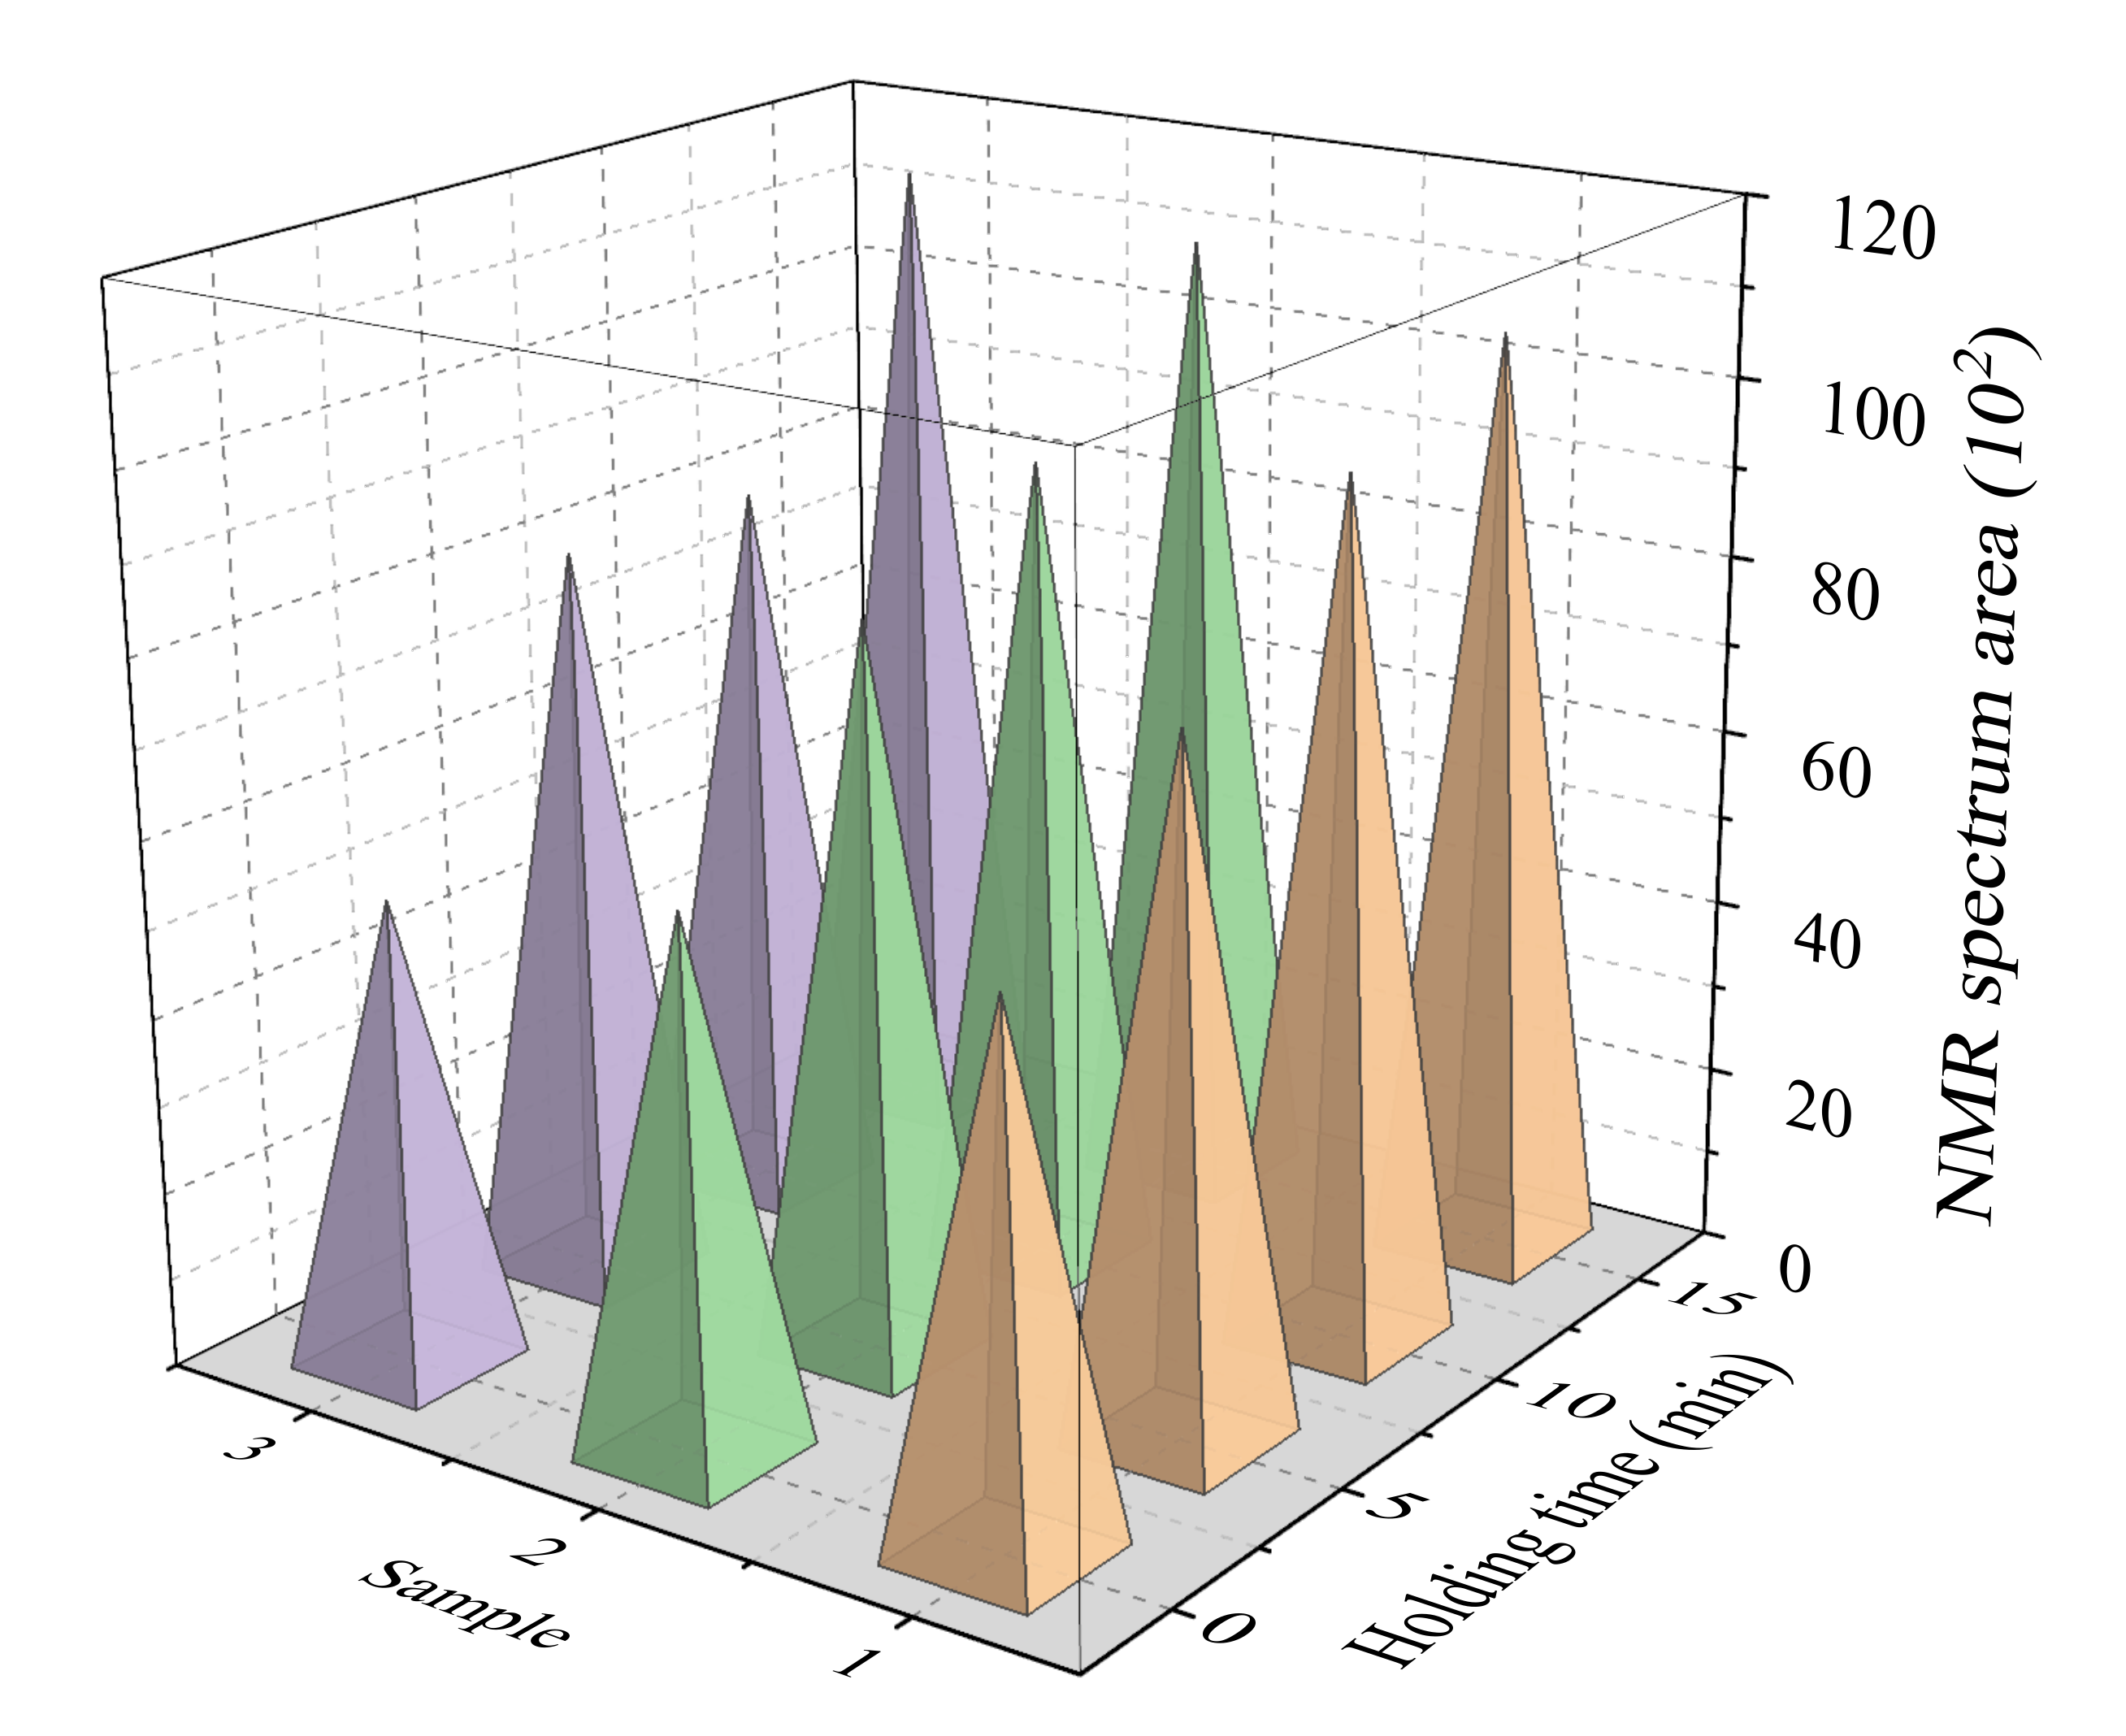
Figure 6 shows the spectral area changes before and after all samples were destroyed. As the holding time increased, the spectral area increased gradually. When the holding time was 0 min, the average spectral area was 5770. When the holding time was 15 min, the average spectral area increased to 11,000, and the growth rate was 90.9%. As the holding time increased, the size, number, and porosity of the internal pores in the coal sample increased gradually.
Yao [
32] showed that different relaxation time ranges of
distribution curves represent different pore sizes of rock masses. For coal masses,
< 10 ms corresponds to micropores;
from 10 to 100 ms corresponds to mesopores and
> 100 ms corresponds to macropores (cracks), as shown in
Figure 7.
According to the above pore classification method, changes in the proportion of pores of different sizes in the sample under different discontinuous cyclic loads are shown in
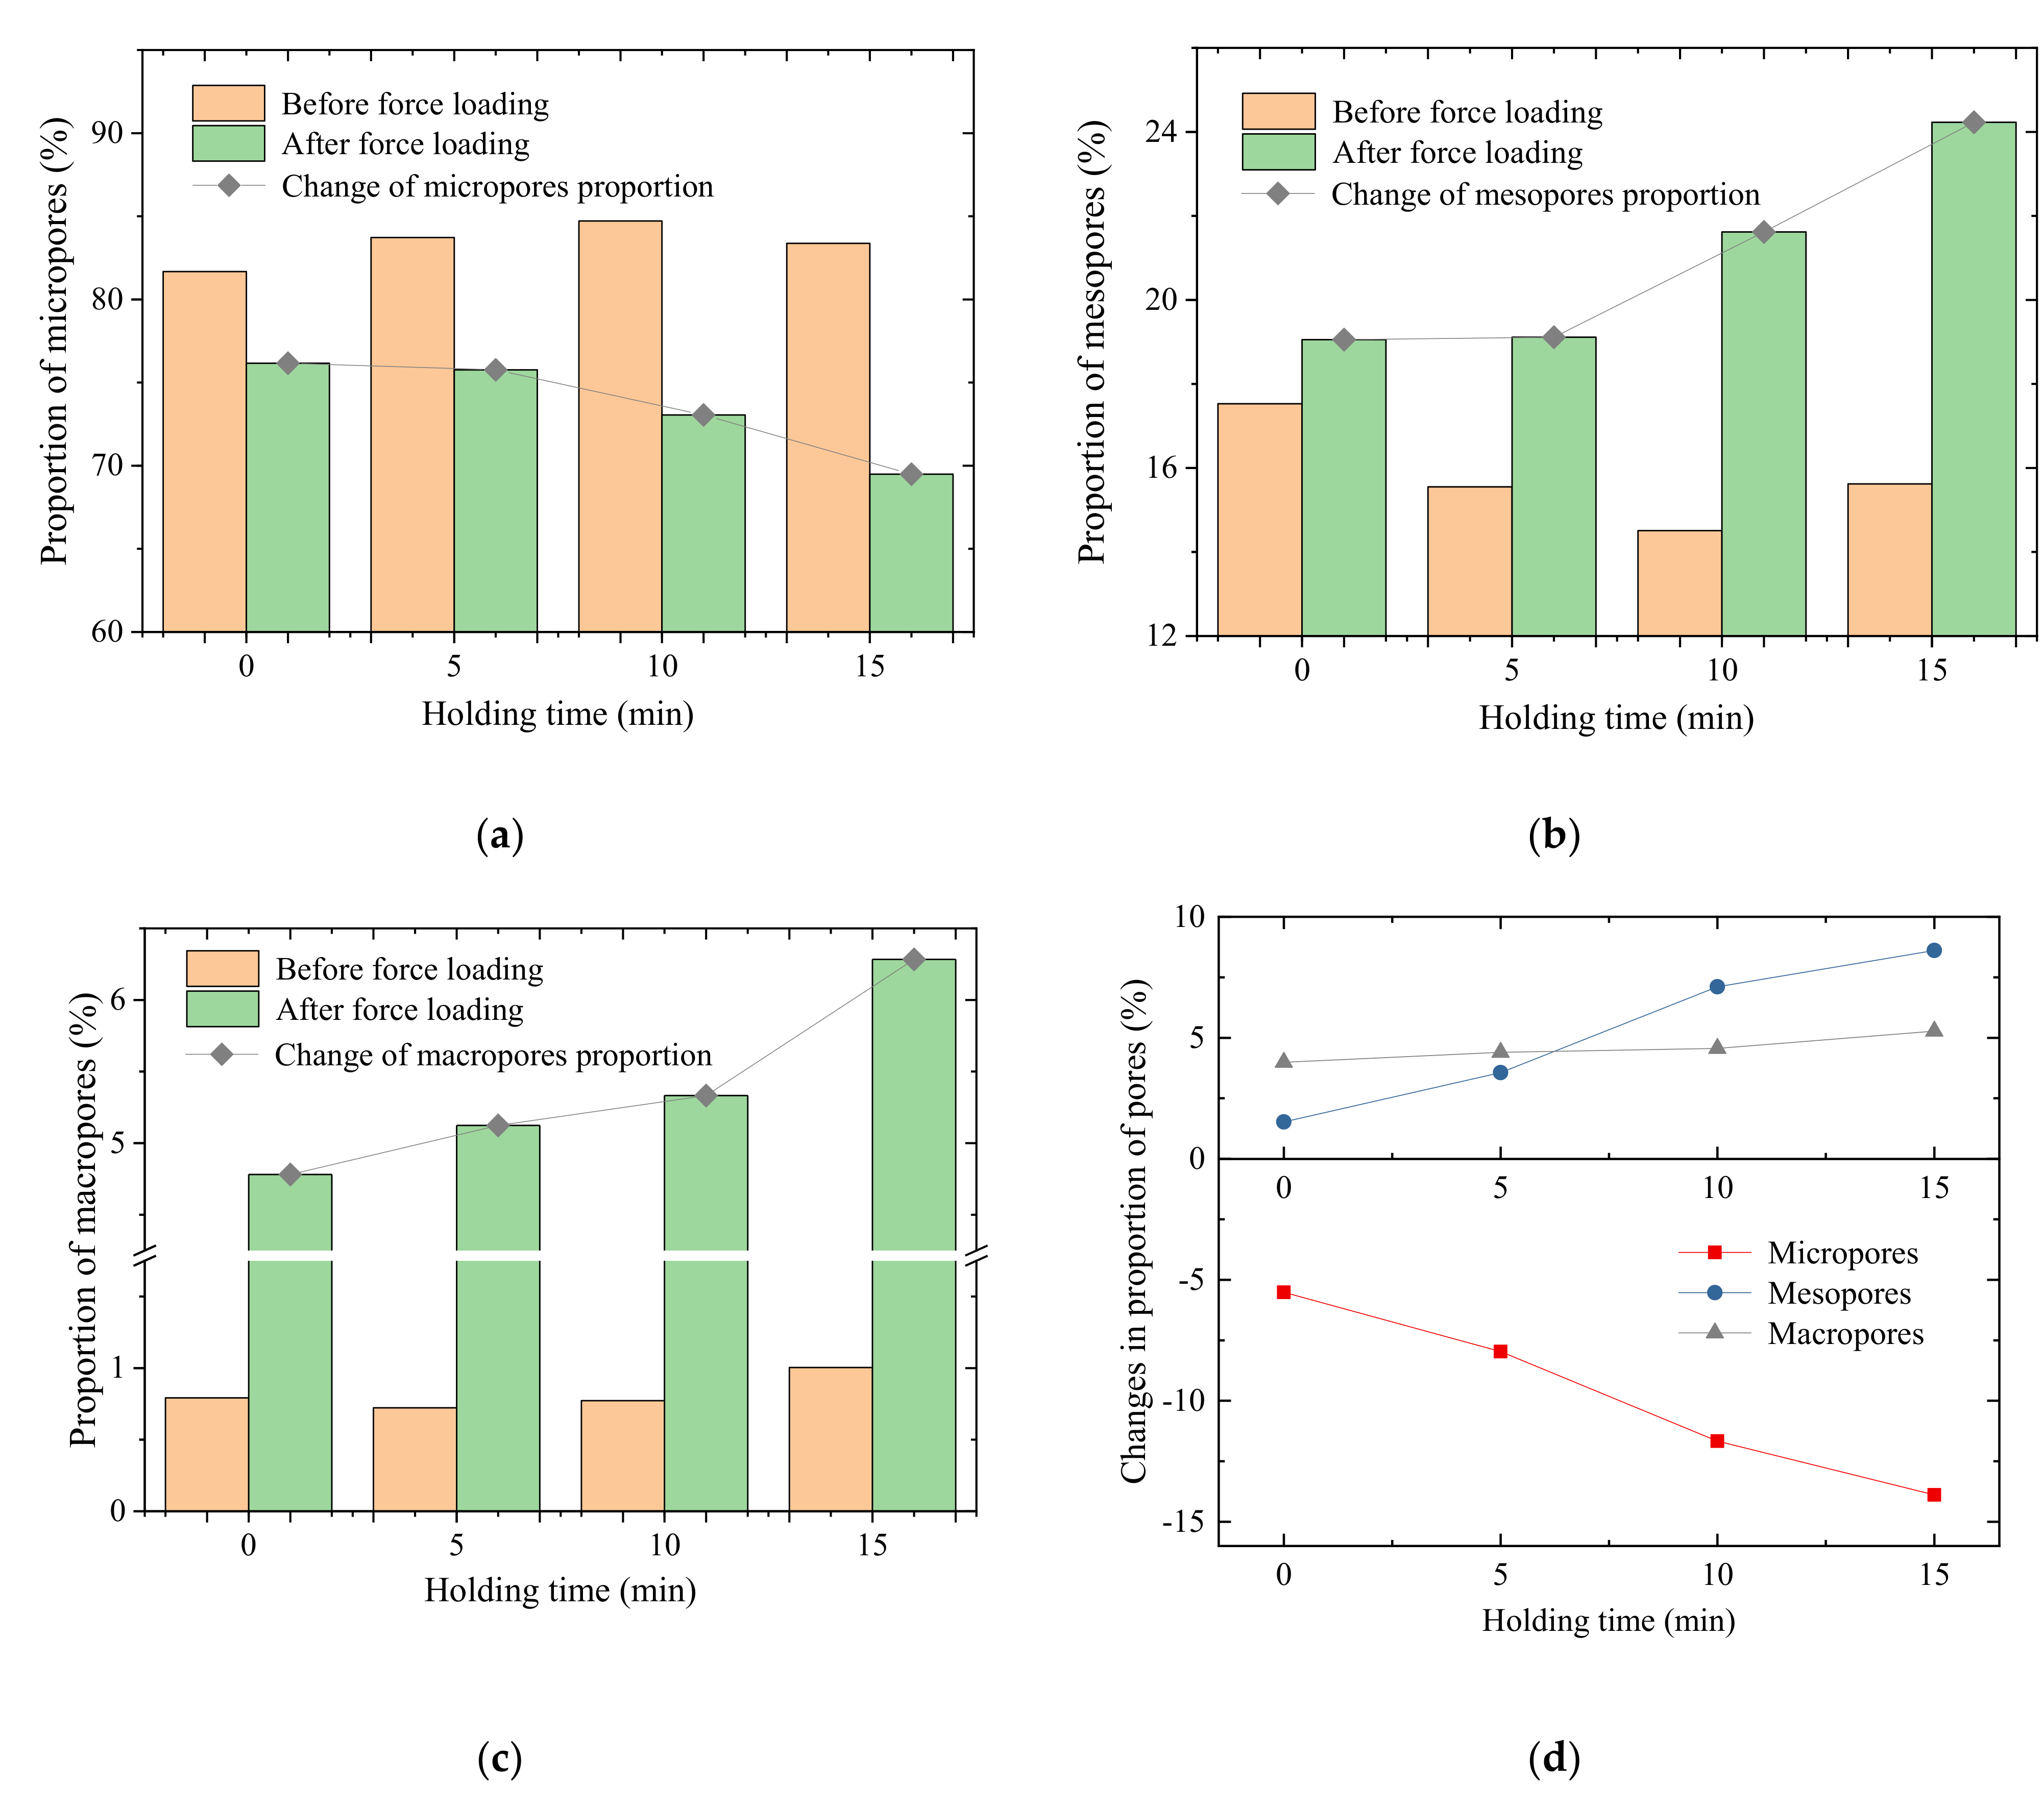
Table 3. The averages of the pore proportions of coal samples before and after the experiment for different holding times reflect the change in absolute ratio of different pore sizes in the sample with holding time, as shown in
Figure 8a–c. As the holding time increased, the absolute ratio of micropores decreased from 76.2% (0 min) to 69.5% (15 min), the absolute ratio of mesopores increased from 17.1% (0 min) to 24.2% (15 min), and the absolute ratio of large holes increased from 4.78% (0 min) to 6.28% (15 min). As the holding time increased, the distribution of micropores, mesopores, and macropores (cracks) within the sample changed. The absolute proportion of micropores decreased constantly, whereas the absolute proportion of mesopores and macropores (cracks) increased constantly.
The difference between the average pore proportion of the coal sample before and after the force is loaded can reflect the increase and decrease in relative pore proportion for different holding times, as shown in
Figure 8d. An increase in holding time increased the decrease in relative proportion of micropores from 5.51% (0 min) to 13.9% (15 min), and the increase in relative proportion of mesopores increased from 1.52% (0 min) to 8.61% (15 min). The relative proportion of macropores (cracks) increased from 3.99% (0 min) to 5.28% (15 min). As the holding time increased, the relative proportion of micropores decreased, and the relative proportion of mesopores and macropores (cracks) increased.
According to
Figure 5,
Figure 6 and
Figure 7, as the holding time increased, the maximum signal amplitude, total spectral area, and amplitude of pores of various sizes of the sample
distribution curve increased to varying degrees. The degree of damage inside the sample increased gradually. The proportion of micropores (including the absolute proportion between different samples, and the relative ratio before and after loading of different samples) decreased as the holding time increased, and the proportion of mesopores and macropores (cracks) increased. Therefore, many microcracks inside the sample aggregated into medium and large cracks under the action of three discontinuous cycles of force loading and a continuous load-holding force, which aggravated the internal damage of the rock mass.
3.3. Attenuation of Coal Strength under Discontinuous Cyclic Loading
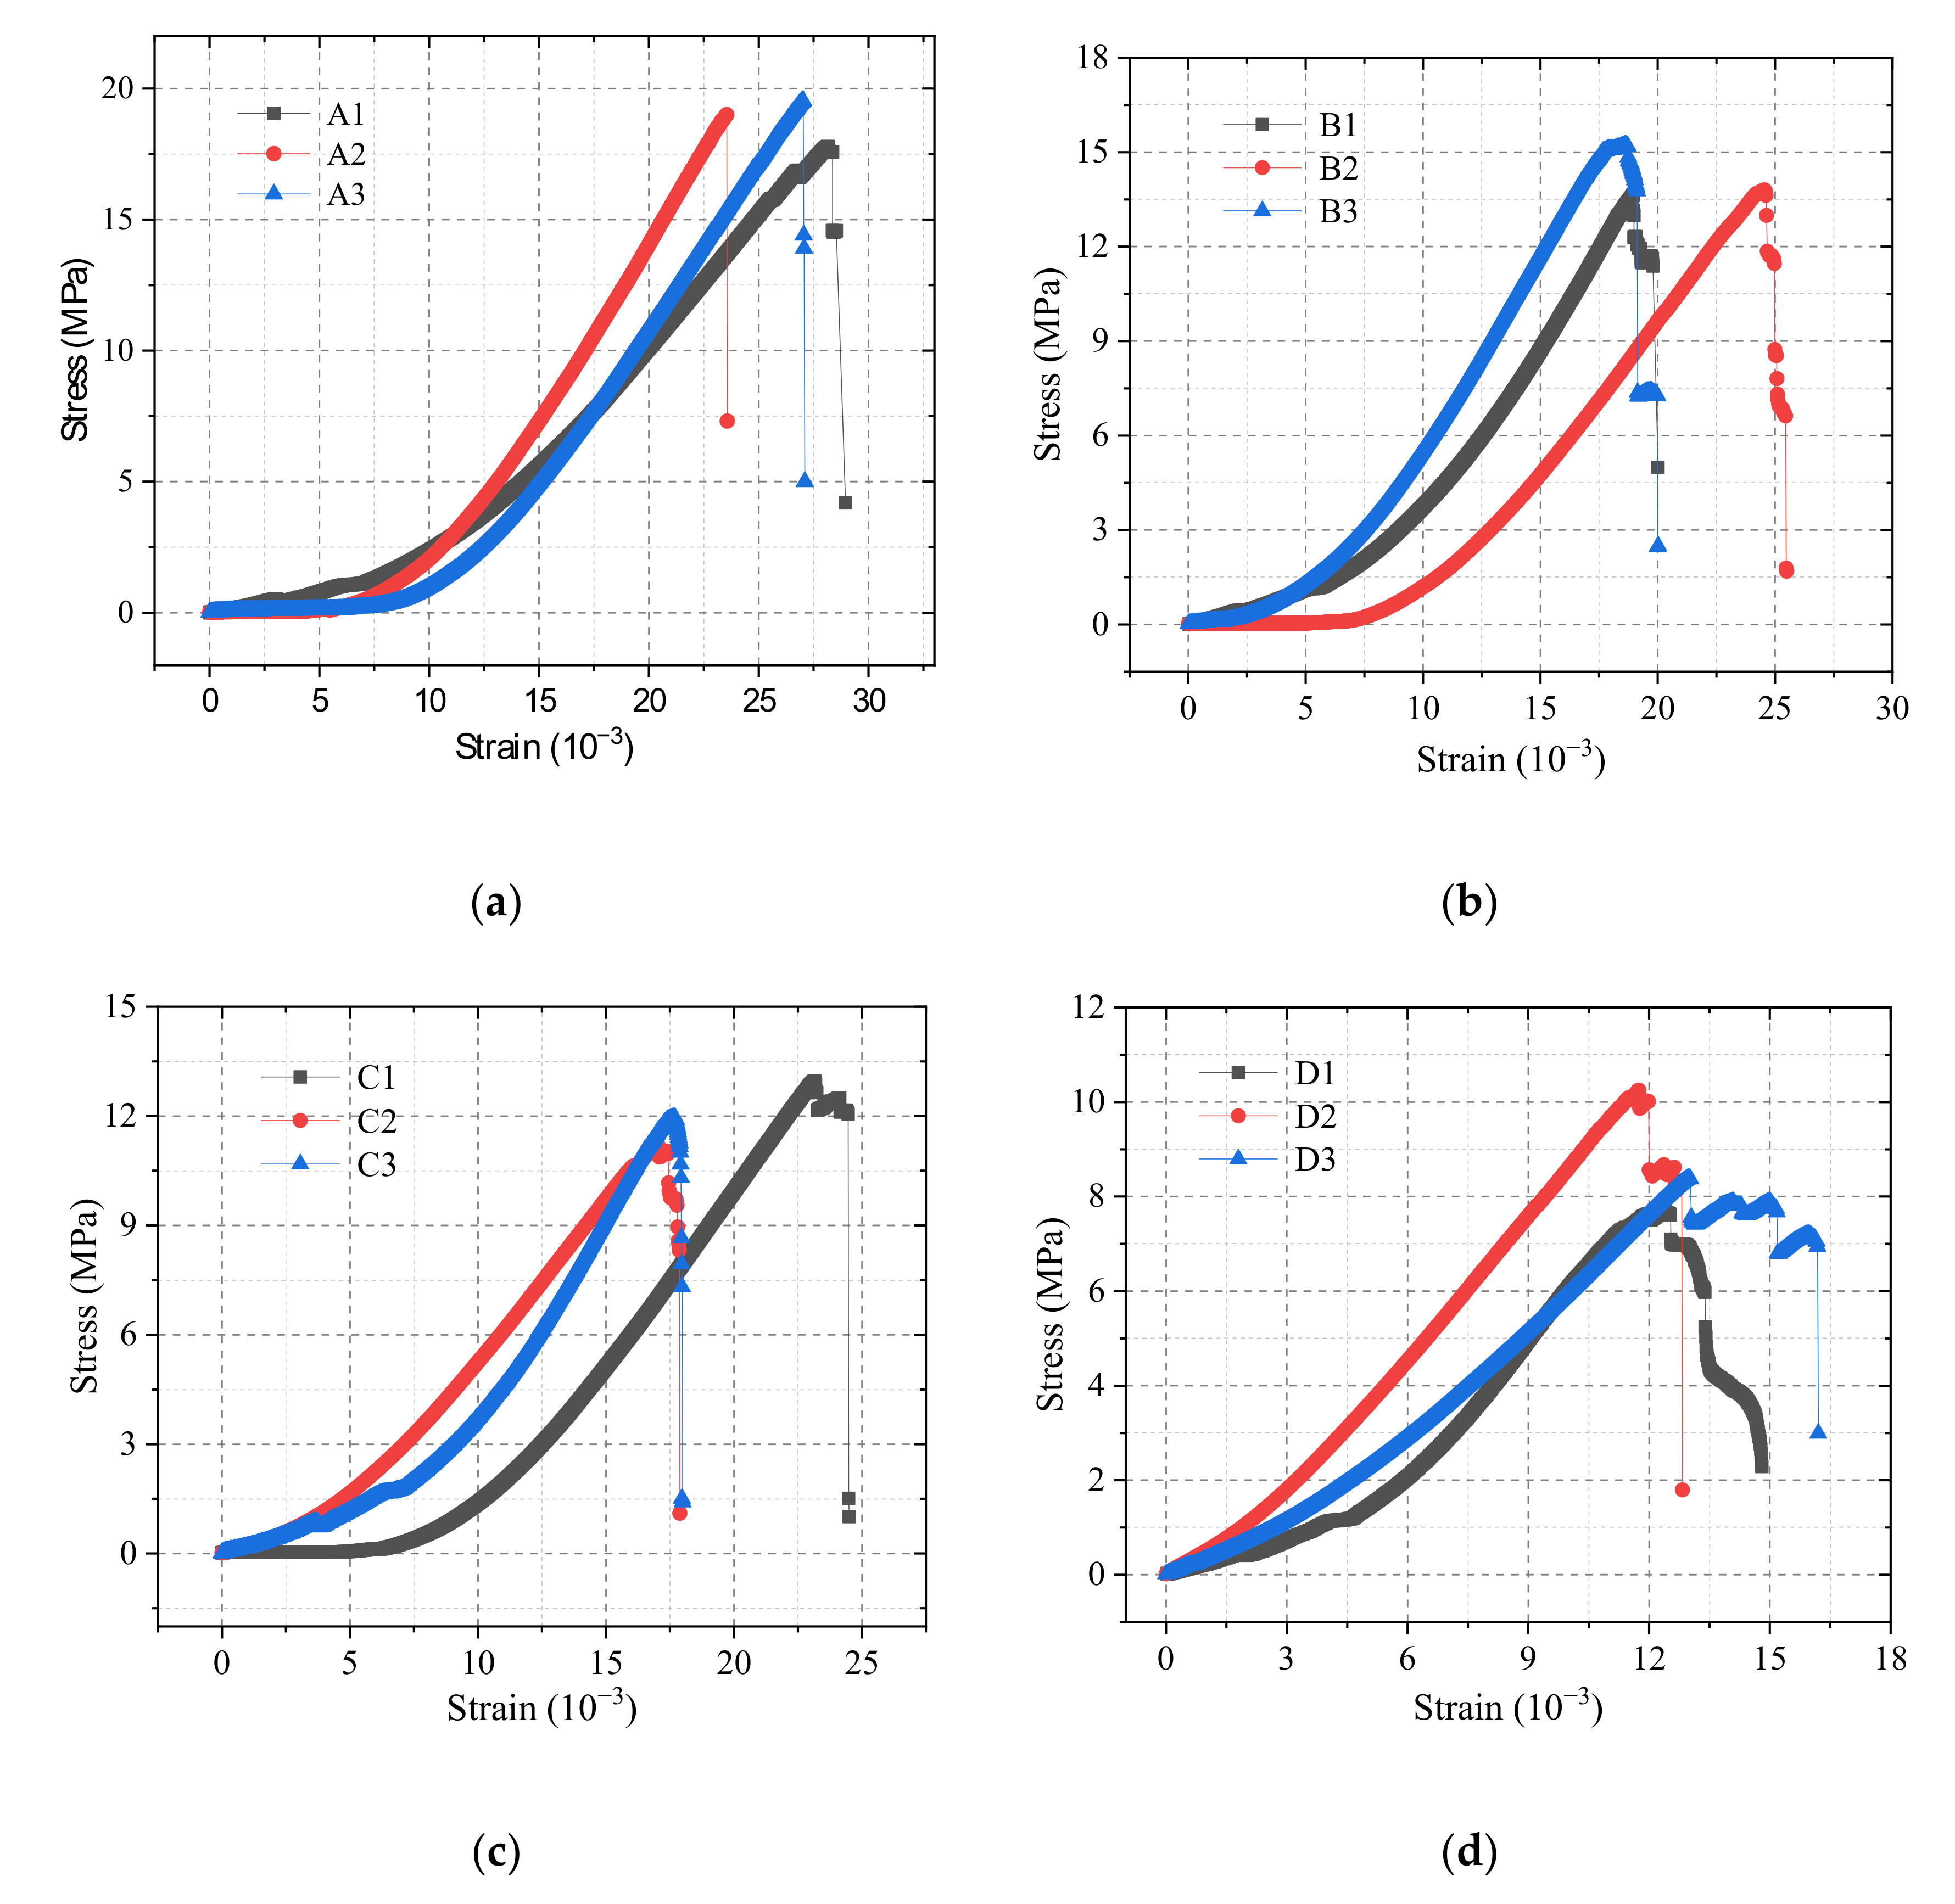
The final uniaxial compression test was performed on all damaged samples that were subjected to a force loading, and the stress–strain curve is shown in
Figure 9. The UCS of all curves is extracted to
Table 4.
After the sample underwent discontinuous cyclic loading, the load-bearing capacity of the sample decreased significantly, and the UCS decreased with an increase in holding time. When the holding time was 0 min, the average UCS was 18.7 MPa, and the strength attenuation rate was 18.7%. When the holding time was 15 min, the average UCS was 8.79 MPa, and the strength attenuation rate was 61.8%.
The increase in holding time increased the total pore volume in the rock mass, especially the increase in volume of macropores (cracks) and mesopores, which aggravated internal damage of the rock mass and gradually reduced the UCS. These results indicate that the destructive effect of stress on coal was reflected in the size and duration of the force action. The rock mass produced a mechanical behavior that was similar to metal material creep. It is embodied in the initiation–expansion-assembly of cracks of various sizes inside the rock mass. The number and size of microcracks accumulated to a certain extent and large cracks formed. The accumulation of large cracks eventually caused macroscopic cracks in the rock mass and macroscopic damage to the coal mass.
As shown in
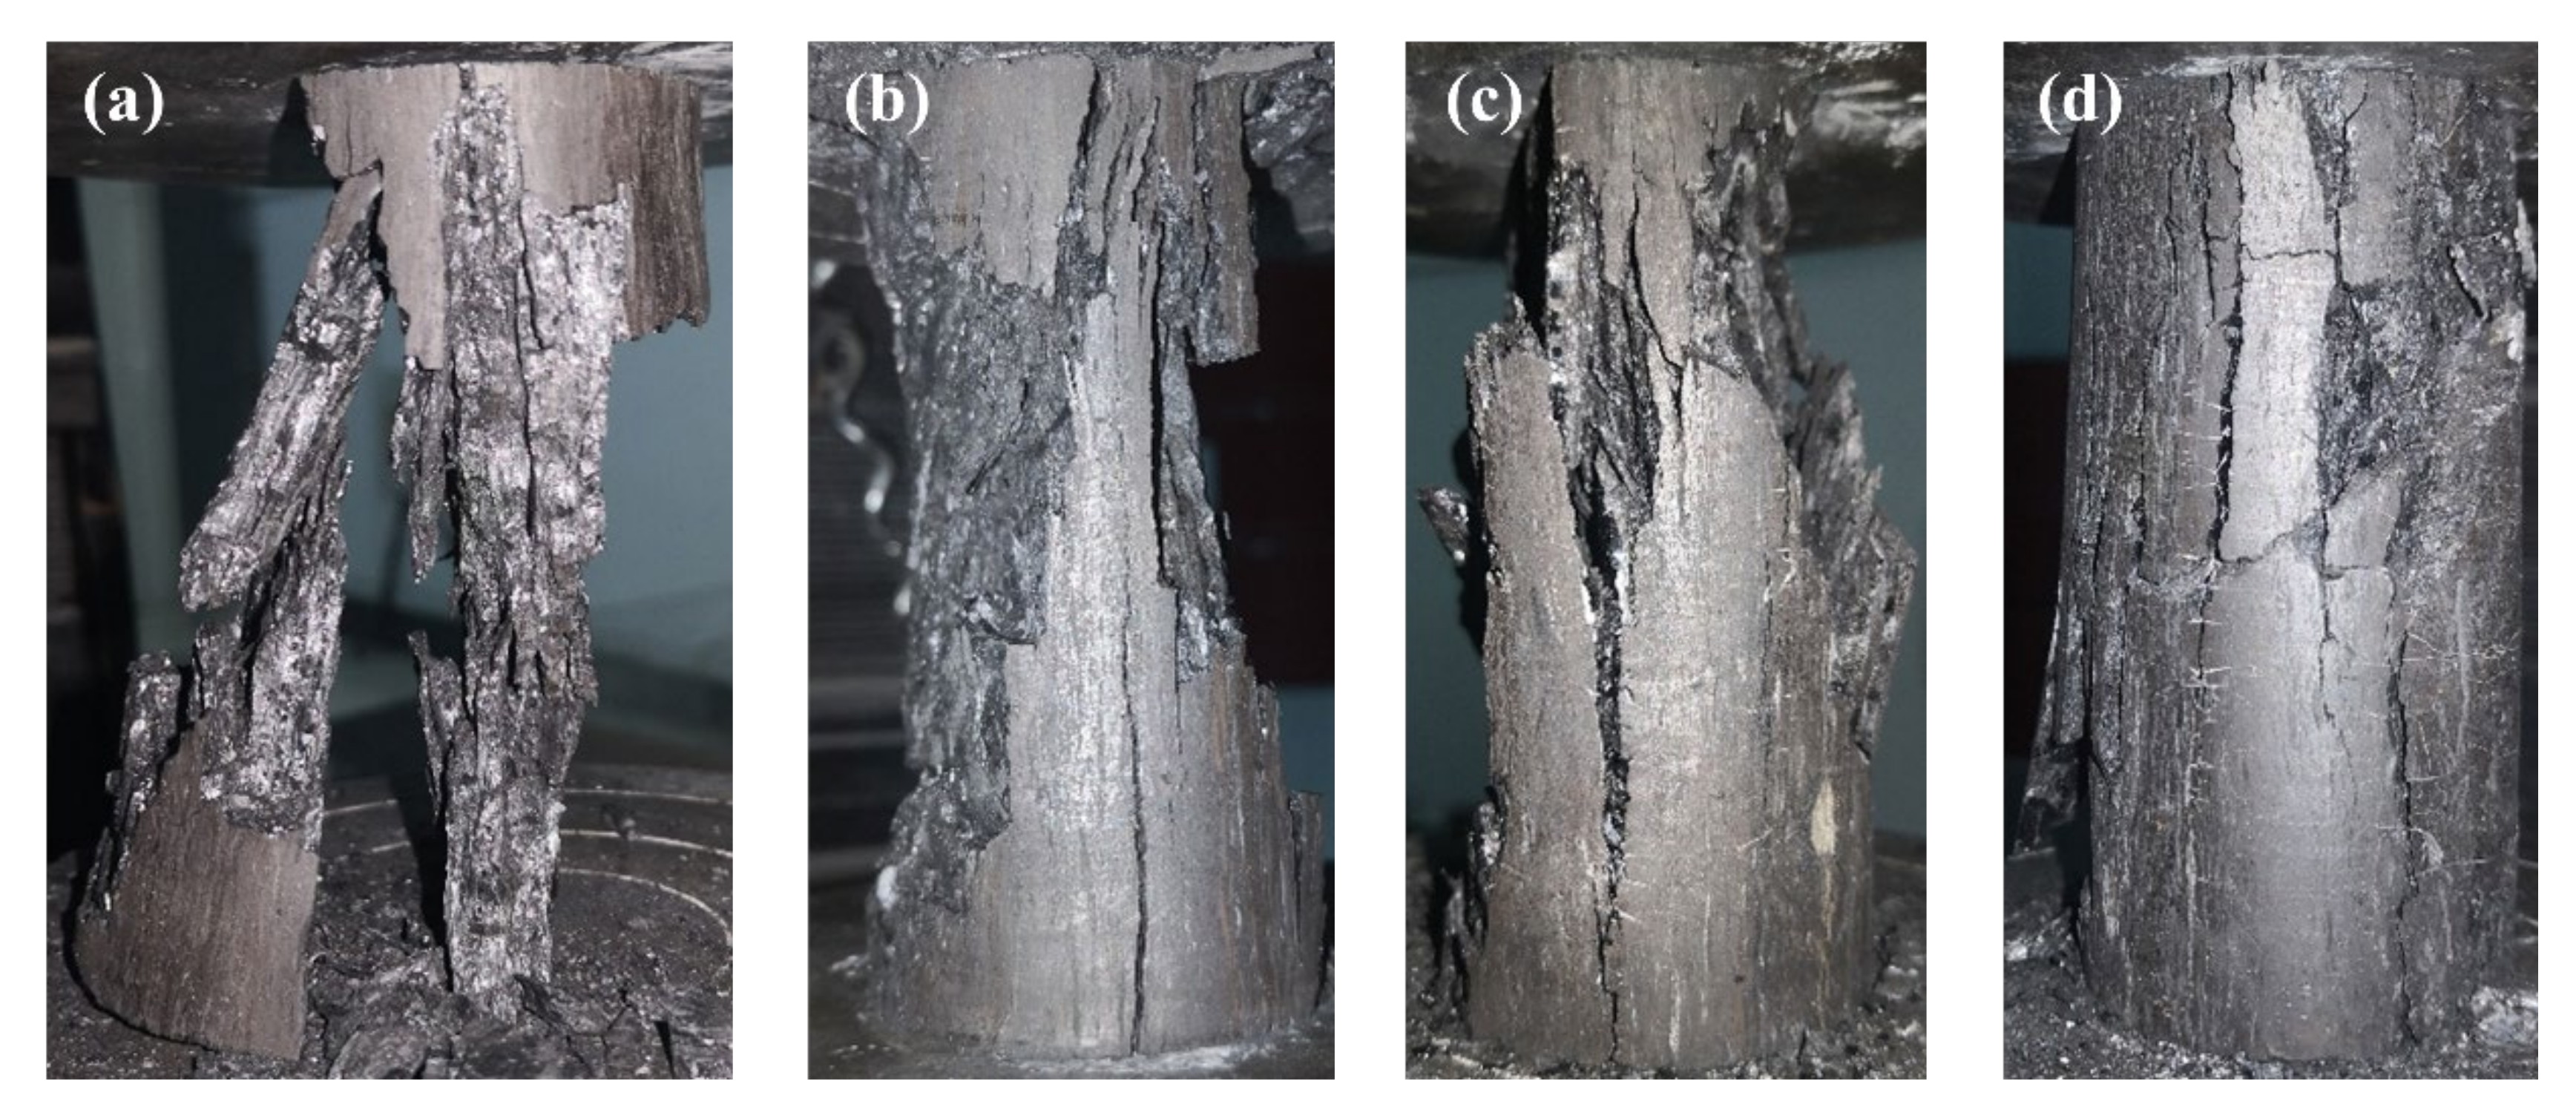
Figure 8, with an increase in holding time, the post-peak characteristics of the stress–strain curve of the sample gradually became apparent, and the post-peak load-bearing capacity increased gradually. This characteristic can also be reflected in the failure form of coal. As shown in
Figure 10, when the holding time was 0 min, the coal showed brittle failure. When the coal was destroyed, it burst instantly with a loud noise. When the holding time increased gradually, the form of damage eased gradually. Even when the holding time was 15 min, the coal maintained its basic integrity after it was destroyed. A longer holding time yielded a more relaxed coal body damage mode. The holding time had an important influence on the crack initiation-expansion process and changed the coal failure mode.
3.4. Implications for Engineering Applications
According to the above research results, an increase in holding time in the discontinuous cyclic load increased the degree of damage inside the coal body. For small coal pillars of the gob-side entry, the expansion of internal fissures reduced the supporting strength of the coal pillars and reduced their bearing performance significantly under long-term ground stress. The increase in mesopores and macropores (cracks) inside the coal pillar increased the coal permeability and reduced the tightness of the coal pillar. The probability of gas and water in the goaf that flowed into the working face increased significantly. Therefore, it is necessary to grout the coal pillars to improve the bearing capacity of the coal pillars and reduce the coal permeability.
The most widely used cement slurry (superfine cement) has a minimum pourable width of only ~0.1 mm [
33]. The microcracks in the coal were relatively developed, and the average pore diameter and dominant pore diameter of the matrix system were at the nanometer level. The cement slurry had little effect on the sealing of a micro-matrix system, and could only close the macrocrack. Silica sol is a nanoscale grouting material with a particle size of 8–12 nm, a D
95 of 62 nm [
34], an ultra-low viscosity (the fluidity is equivalent to water), an ultra-strong permeability (permeable to 0.02 μm gaps) and is the best permeability grouting material. However, the silica sol strength is low, and the UCS after curing for 500 days is only 320 kPa (A:B = 4:1) [
35].
Therefore, a multi-component and multi-granularity coal pillar grouting reinforcement method based on “silica sol-cement slurry” was proposed. The construction process is as follows: (1) Select a suitable position to drill several vertical holes in the coal pillar before mining. (2) Use the grouting pipeline to inject PO 425 cement slurry to cement the broken coal and fill the macrocracks. Improve the strength of the broken coal. (3) After the cement slurry has solidified, use drilling equipment to sweep the hole at the original drilling position and re-insert the grouting pipeline. (4) Inject silica sol at a low pressure and keep it at low pressure for an extended time. The silica sol diffuses fully under the action of a capillary adsorption force to fill the fine cracks in the coal body, which can improve the coal pillar tightness.
The method uses cement as the main binding material, improves the overall strength of the crushed coal body, and can improve the bearing performance of the coal pillar. Silica sol was used to seal the microcracks in coal and cement, which reduces the coal permeability, and isolates water and gas infiltration in the goaf. The materials used were non-toxic and non-heating, and have good application prospects.
4. Conclusions
Coal damage and deterioration under discontinuous cyclic loading was examined quantitatively and critically. A low-field NMR analysis system was used to monitor the internal micropore expansion law and strength weakening mechanism of coal under different discontinuous cyclic loads. The conclusions can be summarized as:
An increase of holding time in the discontinuous cyclic loading increased the amplitude of the distribution curve and the area of the distribution curve gradually. As the holding time increased, the size, number, and porosity of the internal pores in the coal sample increased gradually. The proportion of pores in the coal changed. The proportion of micropores decreased gradually, whereas the proportion of mesopores and macropores (cracks) increased gradually. The increase of mesopores and macropores (cracks) improved the coal body permeability.
The increase in holding time aggravated internal damage of the rock mass, resulting in a gradual decrease in the final UCS. Moreover, a longer holding time yielded a more relaxed coal body damage mode. With an increase in holding time, the post-peak characteristics of the stress–strain curve of the sample gradually became apparent, and the post-peak load-bearing capacity increased gradually.
For the prevention of the failure of small coal pillar, it is necessary to reconstruct the coal strength and seal the fine cracks through grouting under the action of long-term in-situ stress. A multi-component and multi-granular coal pillar grouting reinforcement method based on “silica sol-cement slurry” was proposed, which can improve the load-bearing performance of coal pillars and reduce the coal permeability.


