Article

An Application of BOTDR to the Measurement of the Curing of a Bored Pile

Key Laboratory of Ministry of Education for Geomechanics and Embankment Engineering, Hohai University, Nanjing 210024, China
*
Author to whom correspondence should be addressed.
Appl. Sci. 2021, 11(1), 418; https://doi.org/10.3390/app11010418
Submission received: 19 November 2020 / Revised: 22 December 2020 / Accepted: 27 December 2020 / Published: 4 January 2021
(This article belongs to the Section Civil Engineering)

Abstract

:
In order to study the deformation of a bored pile during concrete curing, it is necessary to monitor the strain of the pile. In this paper, Brillouin optical time domain reflectometer (BOTDR) technology is used to monitor the pile strain during concrete curing, and reliable monitoring data are obtained. These data provide a basis for the study of pile deformation and pile–soil interaction during curing of bored cast-in-place piles. Compared with the traditional point strain sensor, the distributed fiber optic sensor is simple in layout and highly accurate; it can fully reflect the strain changes of the pile; the experiment also shows the advantages of distributed fiber optic sensing technology over the traditional point monitoring method.

1. Introduction

In the pile foundation engineering, the heat generated by the concrete curing of a bored pile is released, which obviously leads to the deformation of a bored pile. A large amount of heat is released in the hydration of cement, which causes the volume of concrete to change. The strain of pile will increase; it can affect the quality of the pile. Due to the constraint effect of surrounding soil, it causes the generation of constraint stress. The occurrence of pile tension seriously affects the bearing performance of the bored pile. Some experiments have yielded some interesting results. Wei et al. used a vibrating string strain gauge to monitor the temperature and stress of the bored pile in a backfill project. It is found that the temperature and strain of the pile at the hydration stage of concrete cannot be neglected [1]. Fang et al. conducted an on-site monitoring test of the dissipation process of hydration heat after pouring concrete of the pile; the temperature change and constrained stress distribution law of the concrete bored pile are obtained, and the study shows that the maximum residual stress of the pile cannot be neglected [2]. Chen et al. conducted the monitoring tests on bored cast-in-place piles of an extra-large bridge, and the study preliminarily showed the distribution of strain and temperature of the pile along the depth direction caused by concrete hydration [3]. Tang et al. studied the influence of hydration heat on the bored pile and permafrost in Hoh Xil area; the influence of hydration heat on the freezing stability of permafrost was studied [4].
To sum up, a large number of studies have shown that the hydration heat of the cast-in-place pile has a non-negligible influence on the deformation; the stress and temperature of the pile are particularly prominent [5,6,7,8,9,10]. However, the research on the hydration of concrete bored piles mostly uses the traditional temperature or strain point sensor, which is complicated in laying out and less accurate. In particular, the point monitoring method can only measure a little data of the pile; it is difficult to learn the temperature and strain change of the pile. The Brillouin Optical Time Domain Reflectometer (BOTDR) technology has the characteristics of being distributed, long-distance, real-time, high precision, and having more durability [11,12,13]; it can be used to measure the strain of the pile.
In this paper, the field test experiment is carried out to monitor the strain of the pile during concrete curing; the project is a large business office building in Suzhou city, China, and the BOTDR distributed optical fiber sensing technology is used. The results will provide the references for further research on the hydration effect of the pile during concrete curing.

2. Principle of BOTDR

Brillouin optical time domain reflectometry can be used as BOTDR technology; the wavelength of Brillouin scattering depends on the temperature and strain of optical fiber sensor. Its working principle is that a beam light of the specific frequency is injected into the fiber, and the light inside the fiber interacts with the elastic sound waves to produce Brillouin backscattered light. Temperature and stress variation of the fiber affect the wavelength of Brillouin scattering. Through the measurement of Brillouin frequency shift, the influence of external factors on the fiber can be obtained by using its relationship with strain and temperature [14,15].
There is a linear relationship between the frequency shift of Brillouin scattered light and the strain or temperature of the optical fiber; the strain and temperature of the object can be monitored by BOTDR technology. Equation (1) gives the relationship between Brillouin frequency shift with the strain and temperature [16,17,18,19]:
υ B T , ε = υ B ε , T υ B 0 , T 0 = C T · T T 0 + C ε · ε ε 0
Among them:
  • υ B T , ε —the amount of change in Brillouin frequency shift.
  • υ B ε , T —the Brillouin frequency shift corresponding to the ambient temperature T and the strain ε.
  • υ B 0 , T 0 —the Brillouin frequency shift corresponding to the initial temperature T0 and the strain is 0.
  • C T —the temperature coefficient, C T = υ B T T
  • C ε —the strain coefficient, C T = υ B ε ε
  • T 0 —the initial temperature.
  • ε —the actual amount strain of optical fiber.
  • ε 0 —the initial strain of optical fiber.
According to Equation (1), it can be seen that the strain and temperature caused by the external forces and temperature can be obtained through distributed real-time monitoring on the measured object [20,21].

3. Field Test

3.1. Project Overview and Geological Conditions

The project is a large commercial office building, located in Suzhou city, Jiangsu province, China. It is on the alluvial and lacustrine plain at the southern edge of Yangtze River delta. According to the regional geological data, the crustal movement since the local quaternary has been dominated by subsidence. The maximum exploration depth of the project site is 60.45 m from the natural surface. Except for the surface fill, all the deposits are shoreline-shallow marine sediment since the mid-quaternary, which is mainly composed of cohesive soil, silt, and silty sand. The physical and mechanical properties of soil are shown in Table 1.

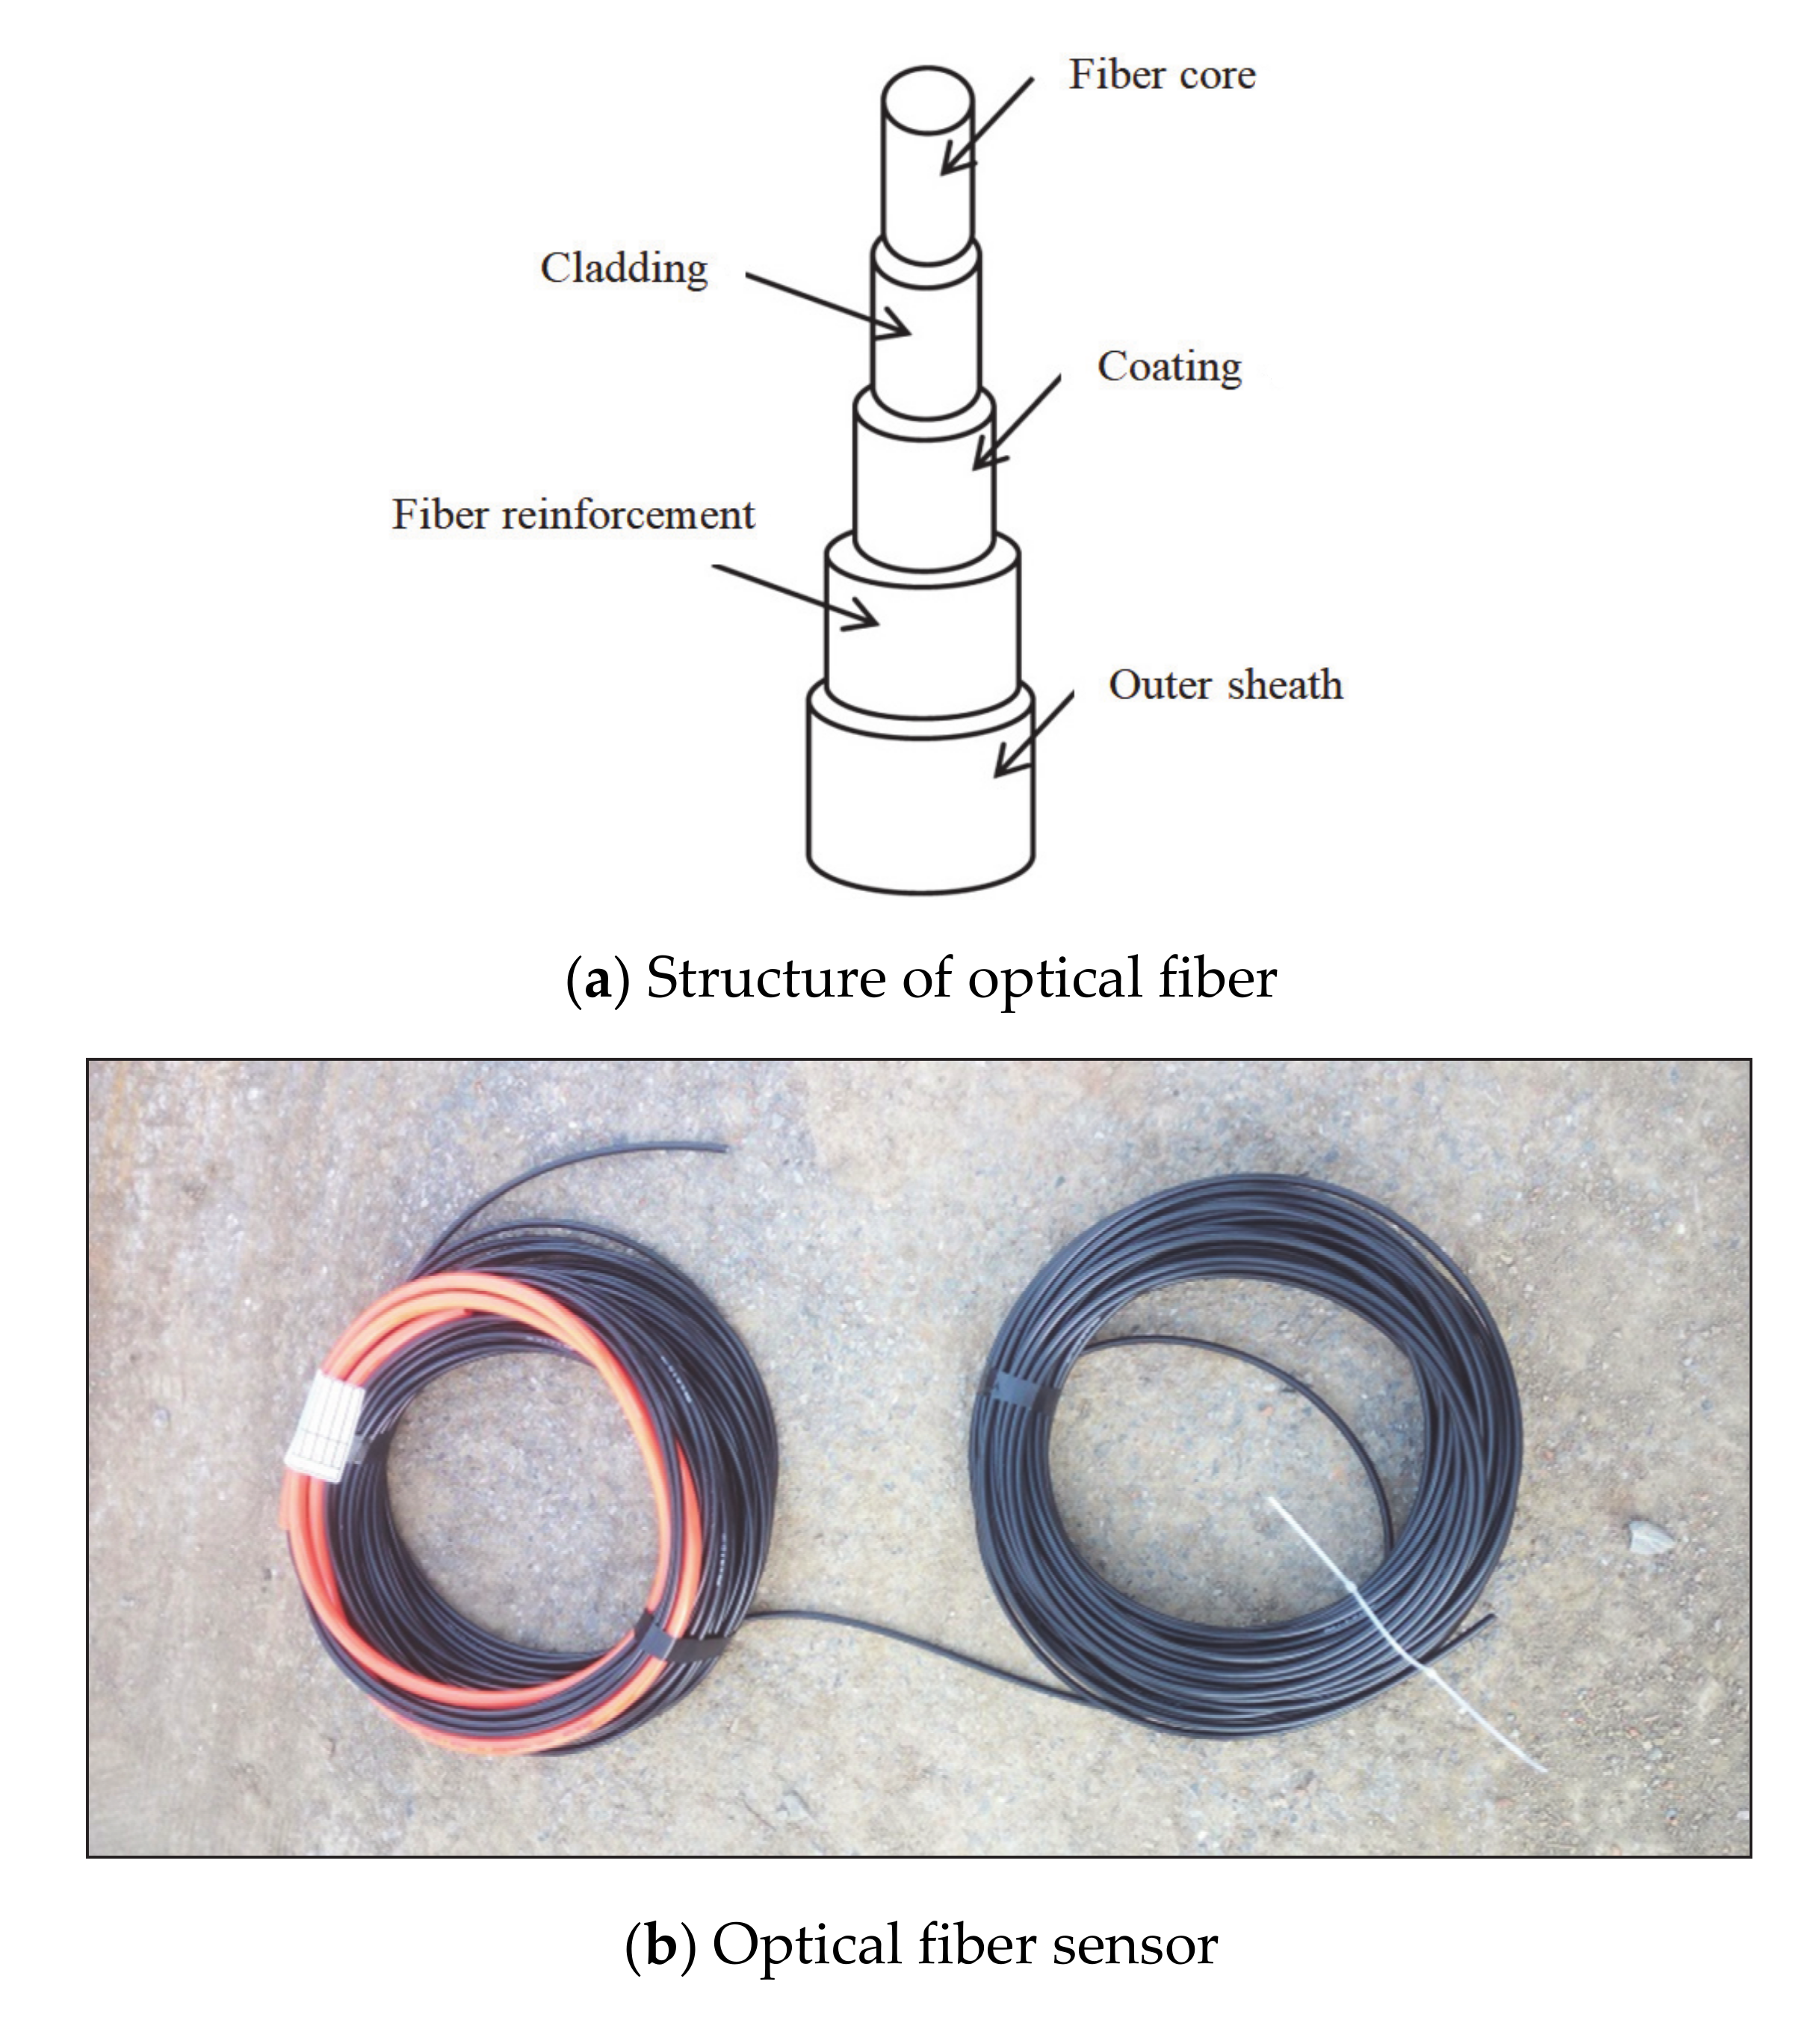
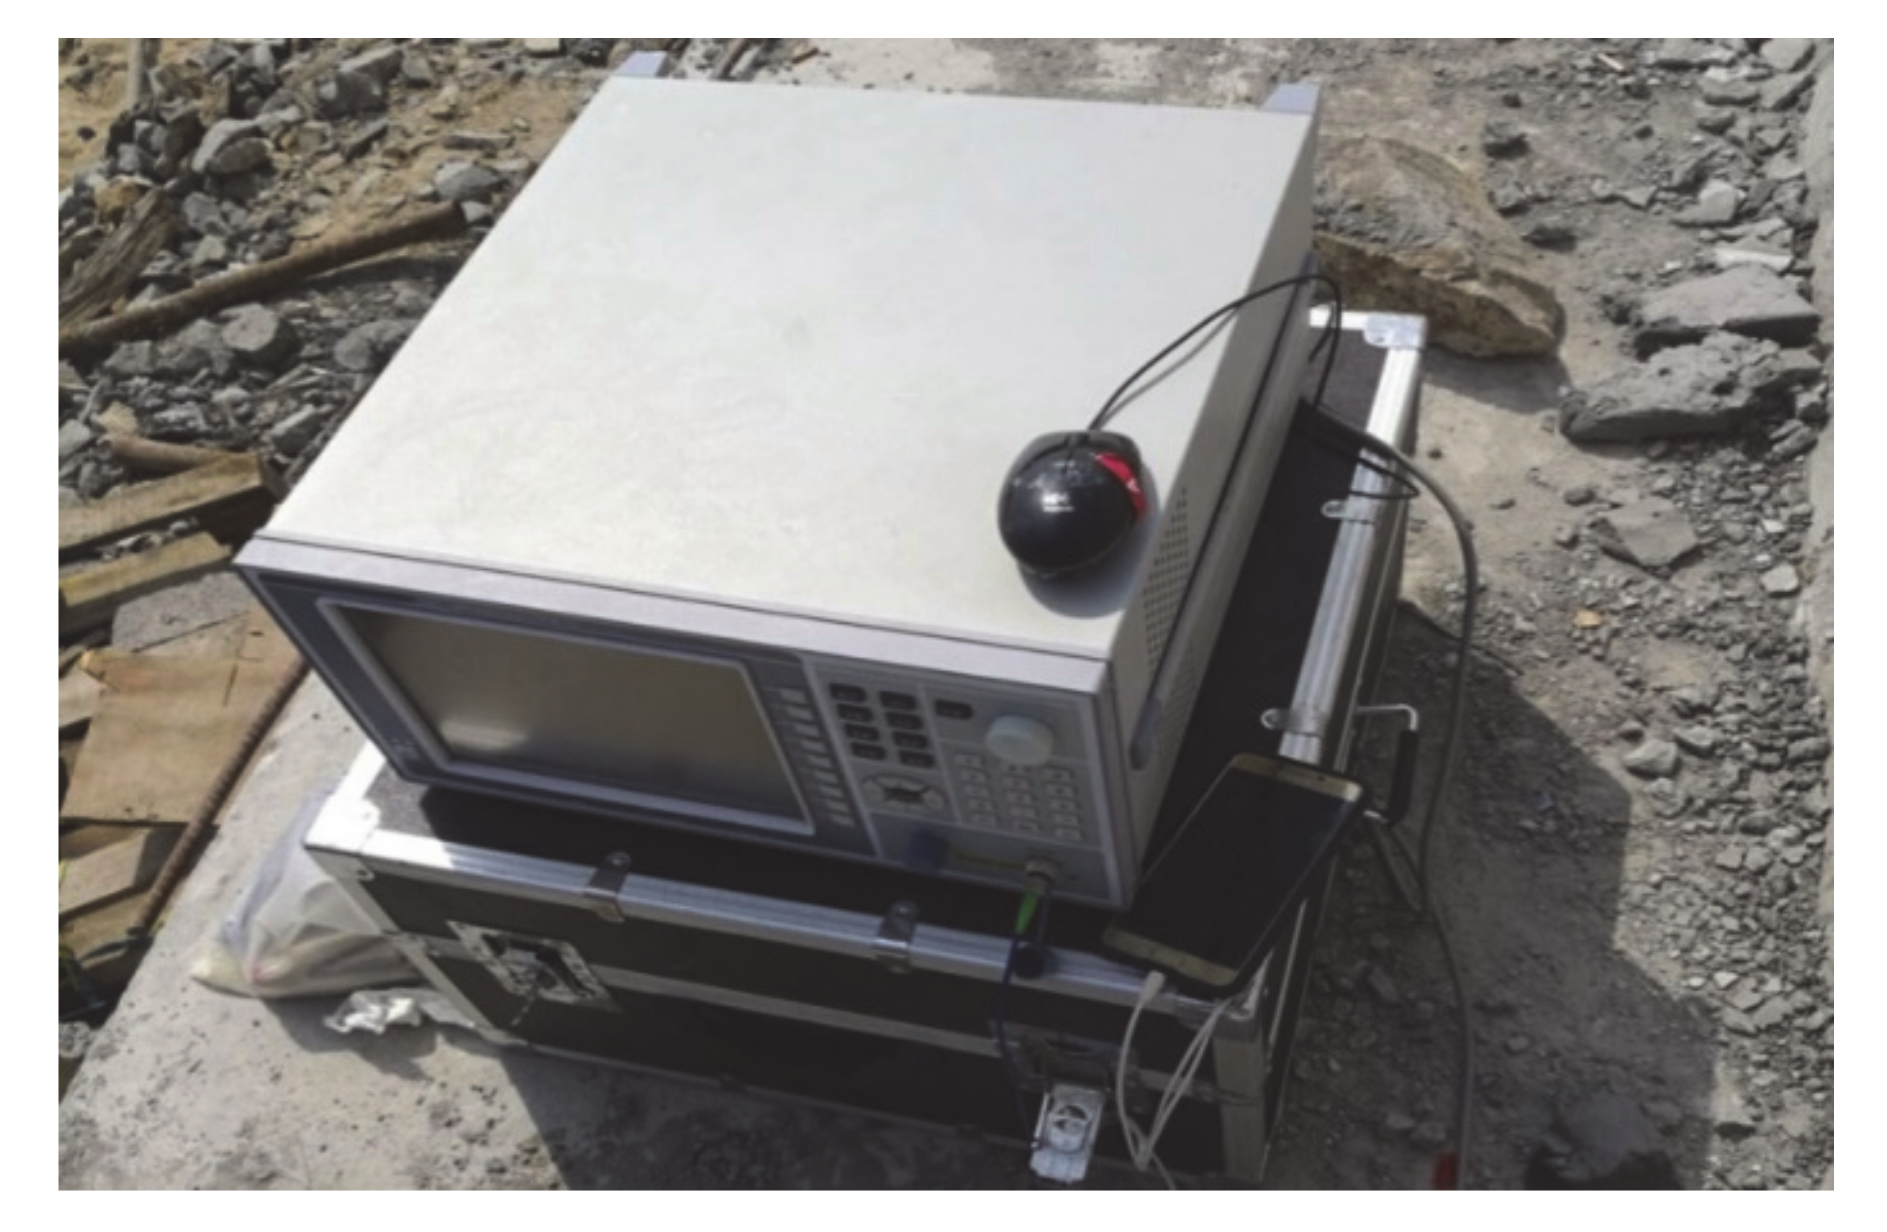
3.2. Optical Fiber Sensor and BOTDR Demodulator

In this experiment, the armored optical fiber sensor is used for strain sensing. The structure of this metallic sensor is a coaxial cylinder covered with multi-layer materials. From outside to the inside, there are the outer sheath, reinforcement fiber, coating, cladding, and fiber core [22]. The optical fiber in this experiment uses the steel wire as fiber reinforcement and plastic sleeve as an outer sheath. The core has a high refractive index and is mainly responsible for transmitting light waves. The cladding is made of material with a low refractive index, which mainly acts as a restraint of light waves in the fiber core. The protective cover and coating mainly protect the fiber core; they enhance the overall strength of optical fiber, isolate the damaging of fiber structure, and reduce light loss. The structure of optical fiber can be seen in Figure 1a and the sensor are shown in Figure 1b.
This metallic armored sensing optical fiber sensor is manufactured by Nanzhi sensing technology company, Suzhou, China. The diameter of sensor is 5 mm, and the core diameter of optical fiber is 0.9 mm. The optical sensing fiber sensor has a relatively rough surface in good combining with the concrete, and the deformation of optical fiber sensor is consistent with concrete deformation. The strain coefficient is 0.04998 MHz/με and the temperature coefficient is 1.775 MHz/°C.
The data demodulator of BOTDR is AV6419 single-terminal distributed optical fiber demodulator, the measuring range is 0.5 km~80 km, the maximum sampling interval is 0.05 m, the range of strain is −15,000 με~15,000 με, and its performance index meets the requirement of this experiment. Figure 2 shows BOTDR demodulator.

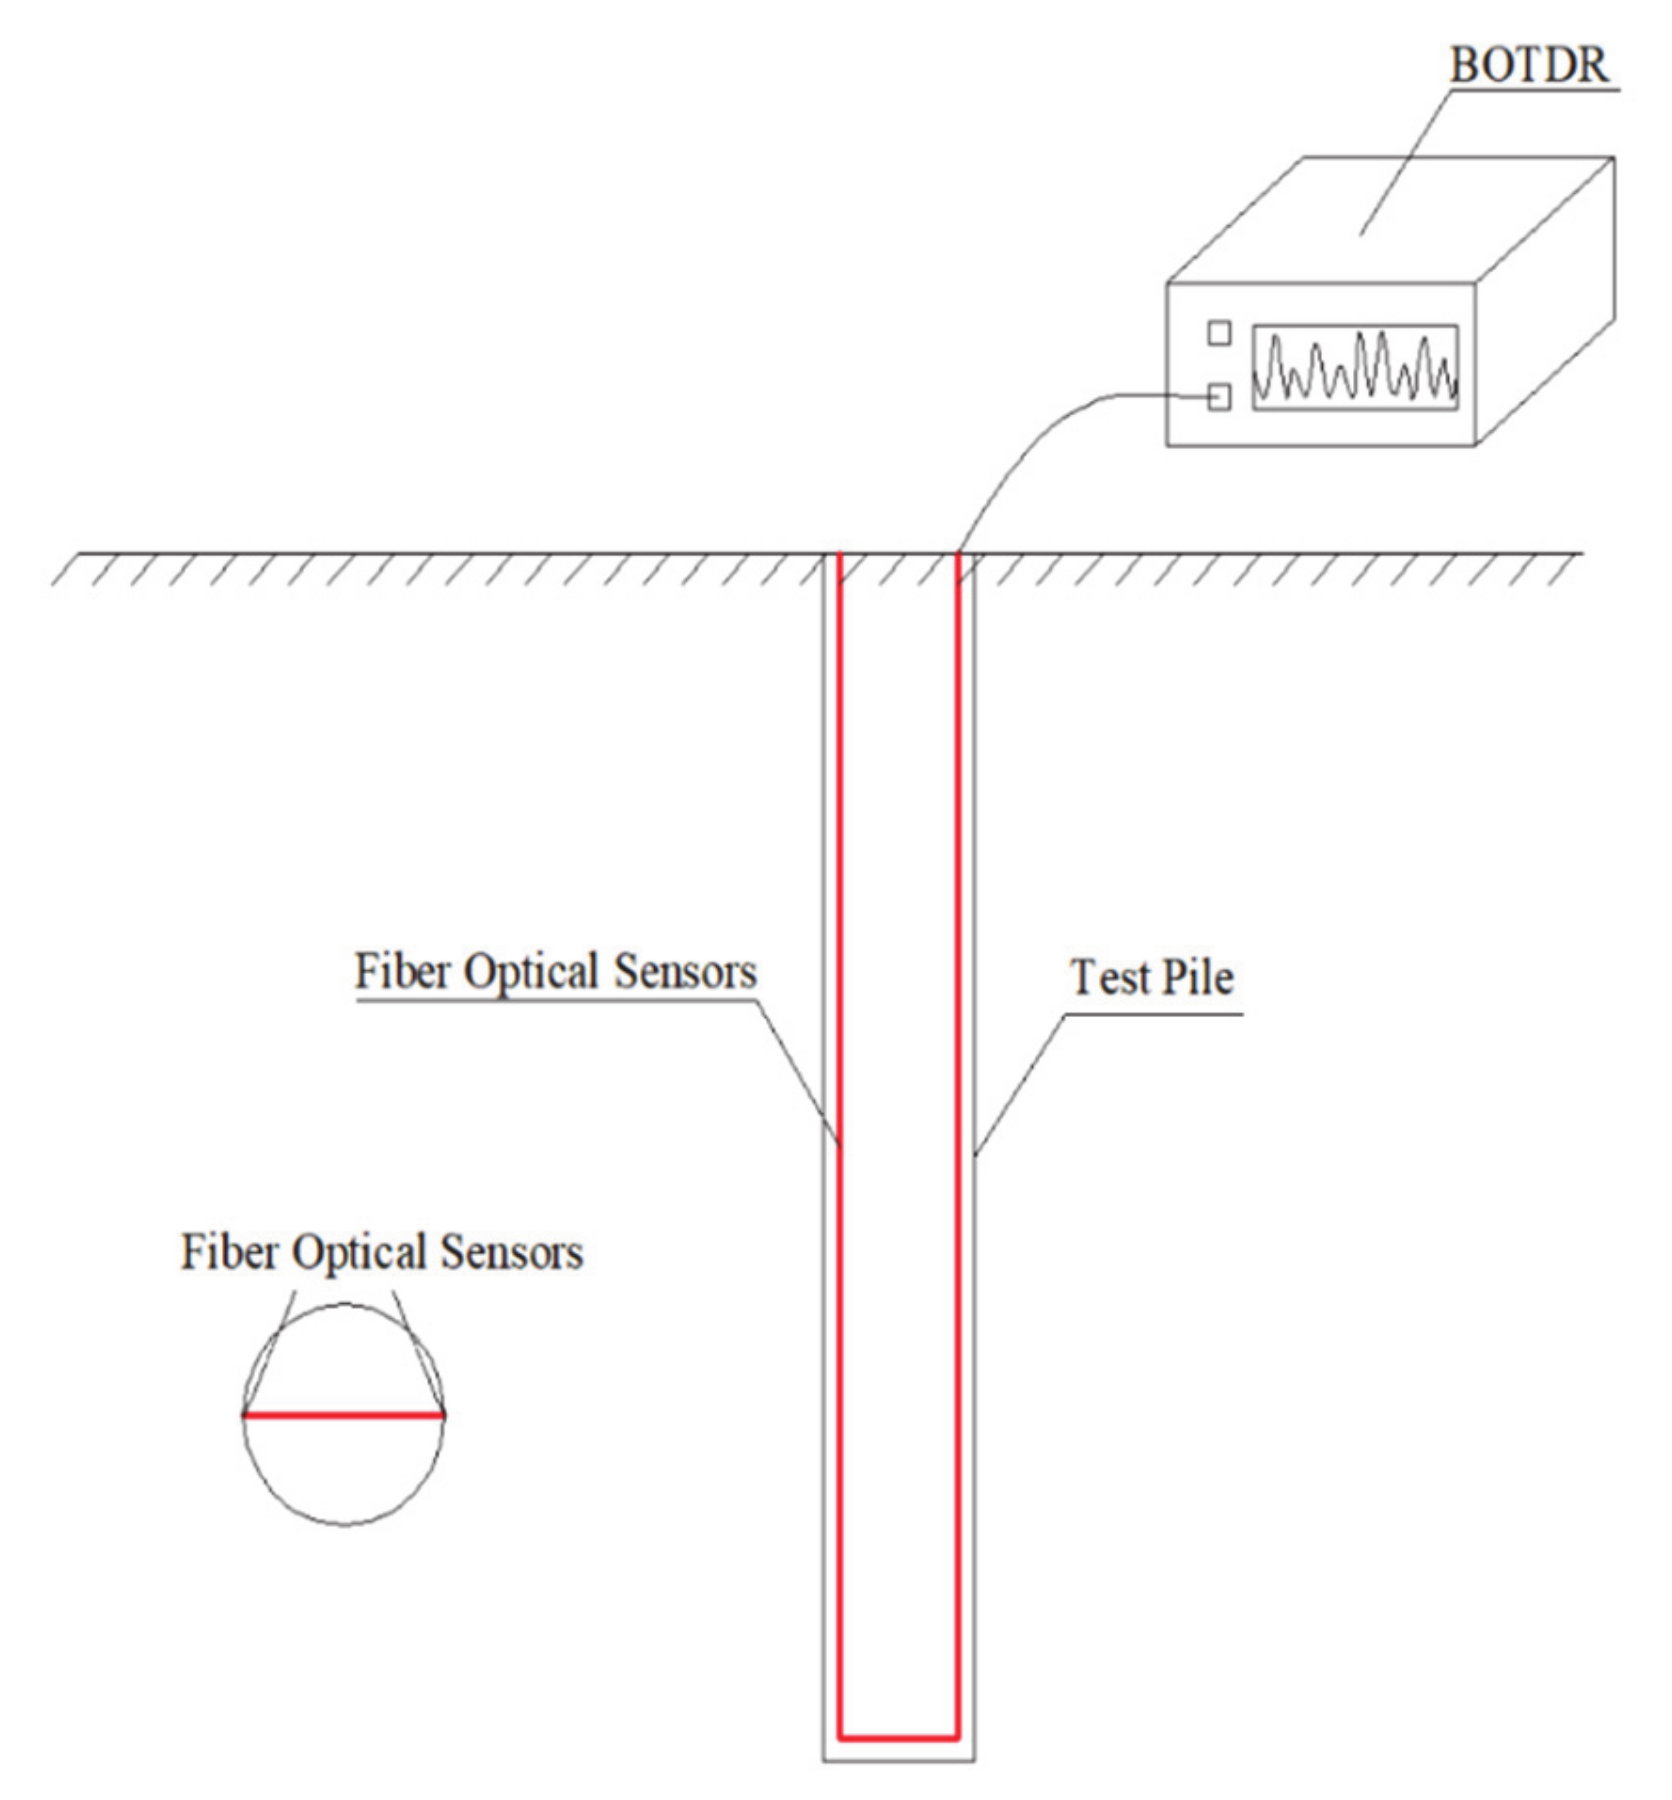
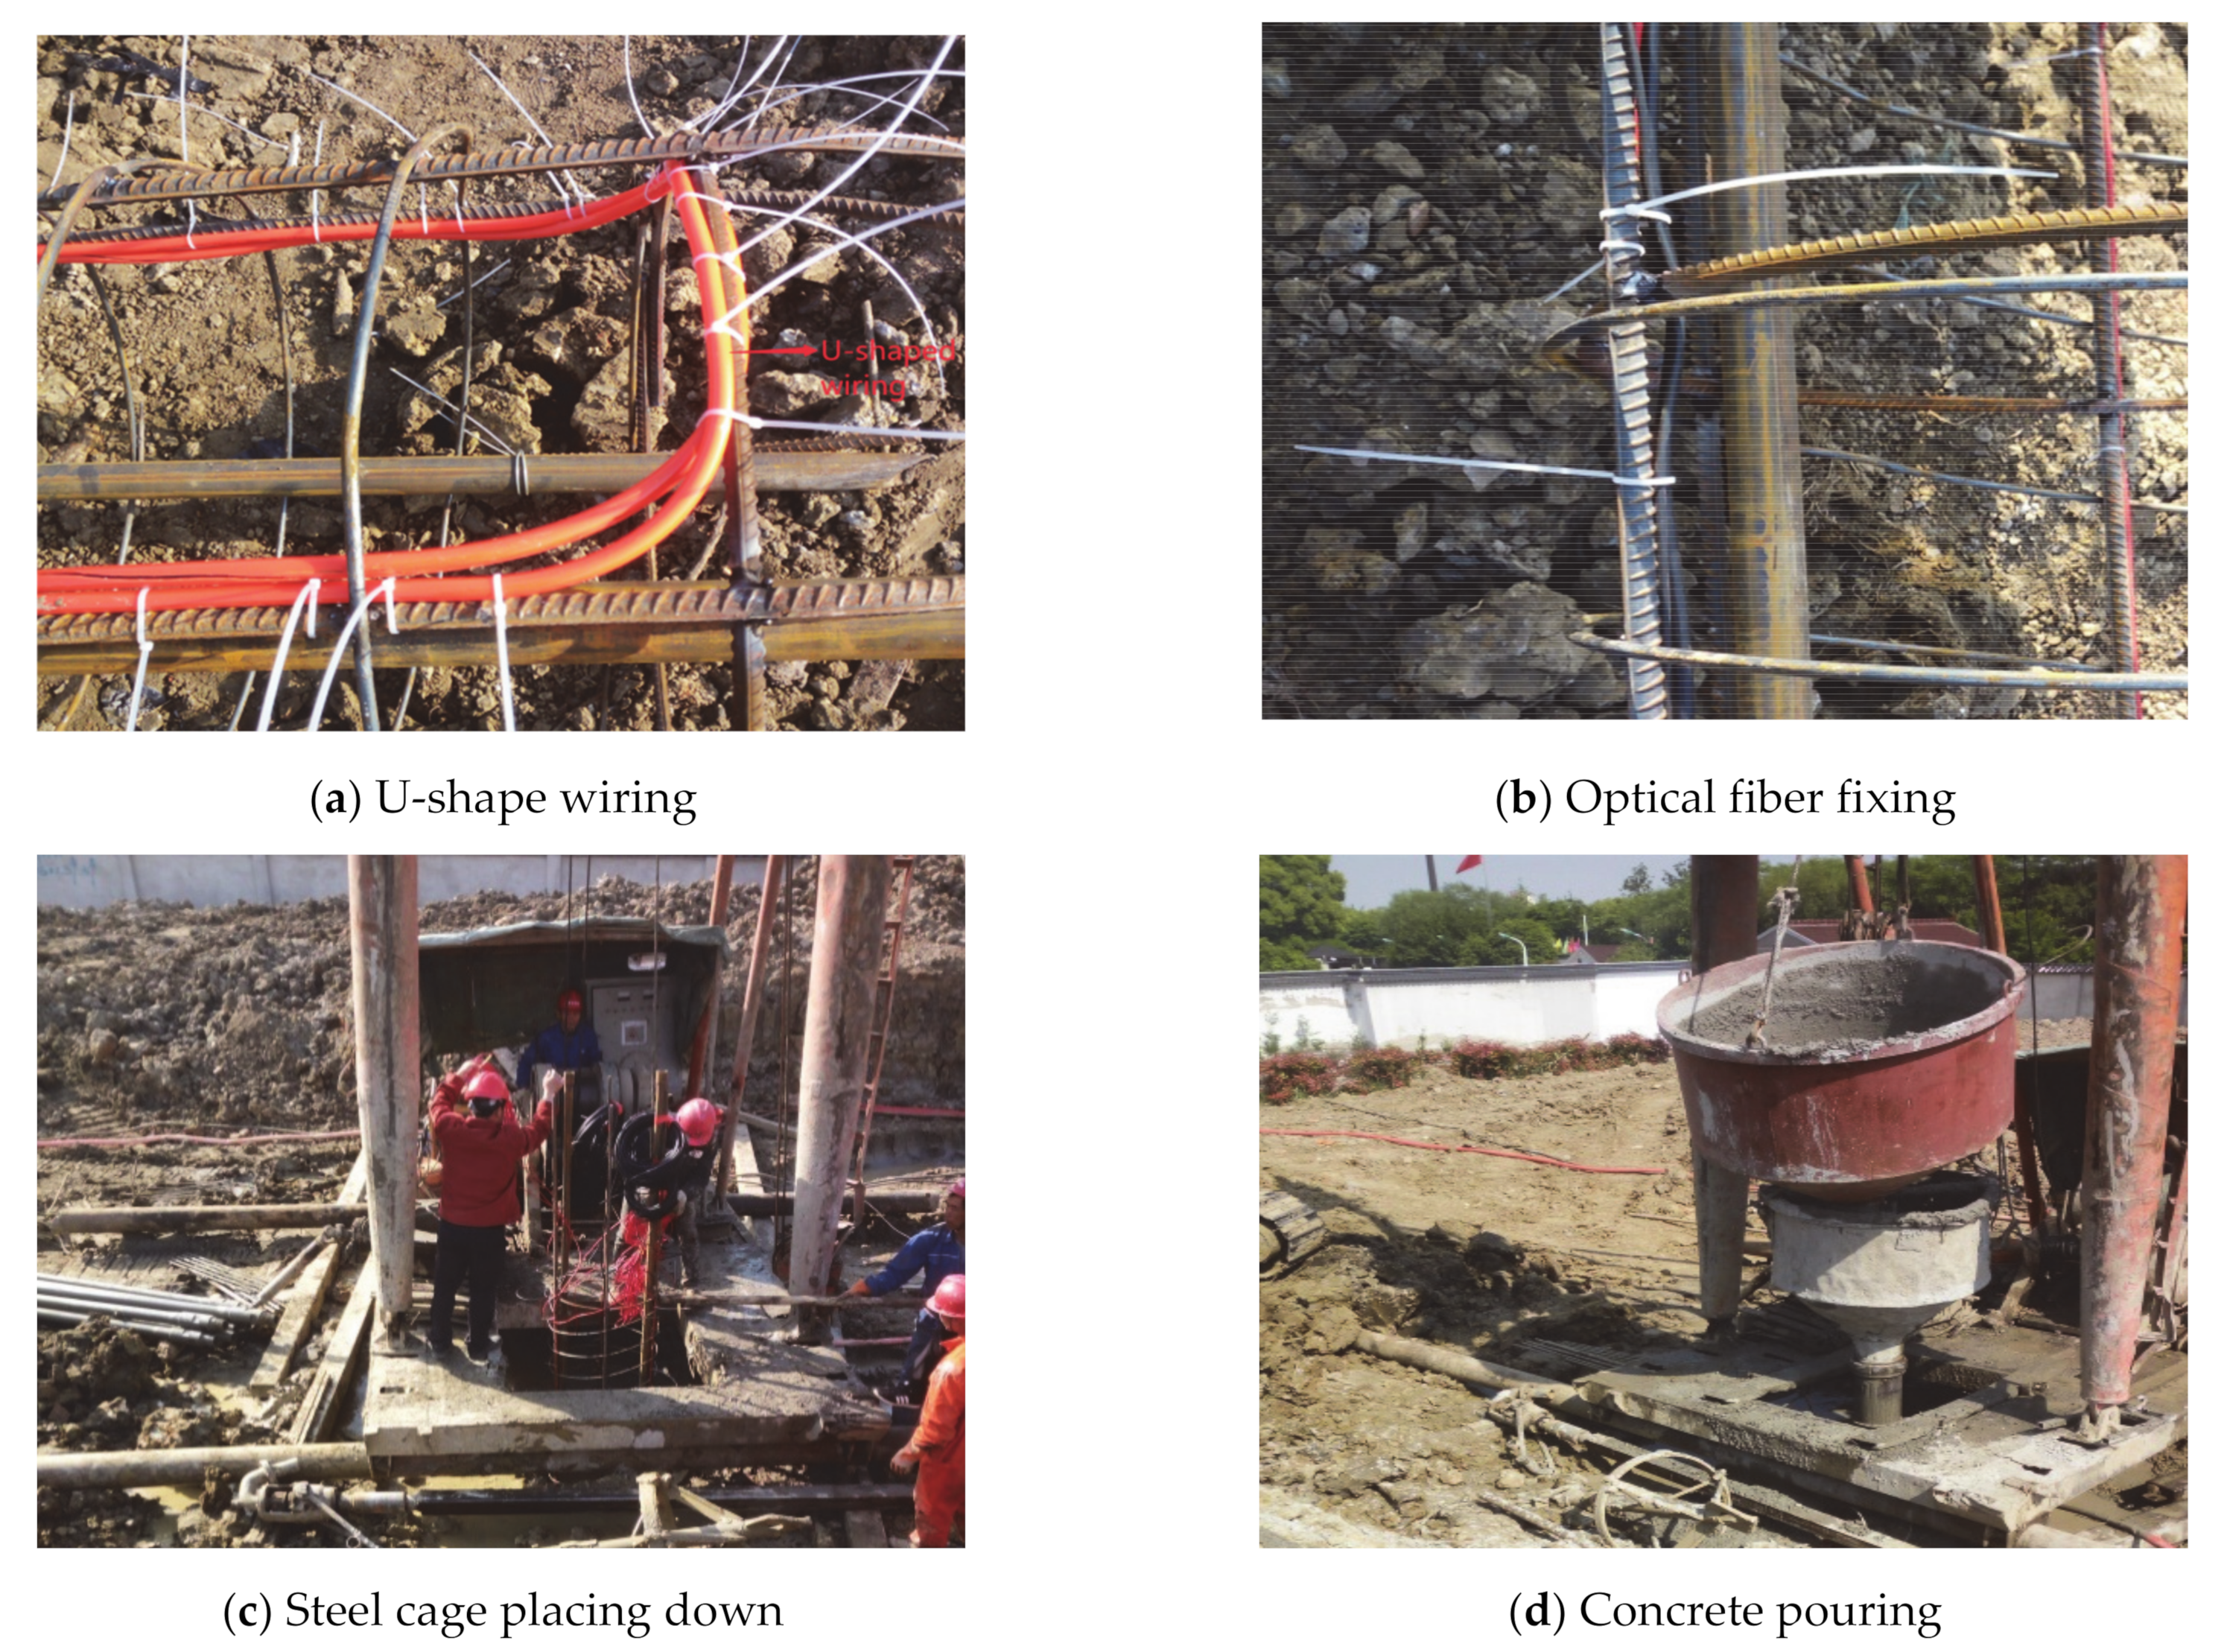
3.3. Monitoring Scheme

For the arrangement of optical fiber sensor, the symmetrical U-shape is used. In view of the construction technology and process of the bored pile, the optical fiber sensor can be laid on the main reinforcement of steel cage, and the optical fiber sensor and the bored pile can be connected as a whole through the pouring of concrete. The arrangement scheme is shown in Figure 3.
The optical fiber sensor layout and construction of the bored pile are shown in Figure 4. It shows the installation procedure of the sensor; the optical fiber sensor is laid on the base of steel reinforcement cage with the shape of U before placing the reinforcement cage (Figure 4a). The optical fiber sensor is fixed along the steel bar by fixing a point every 30–50 cm, and it can ensure that the optical fiber sensor and steel bar are bonded together (Figure 4b). Then, the steel reinforcement cage is placed down, and the redundant optical fiber sensor is drawn out for protection (Figure 4c). Finally, the concrete is poured, and the optical fiber sensor and the pile are connected as a whole (Figure 4d). In this way, under the action of concrete condensation, the optical fiber and concrete can be considered to coordinate deformation together.
After the concrete curing is completed, the joint deformation of the main reinforcement of steel cage, concrete, and fiber can be achieved, and the optical fiber sensor is used to monitor the deformation of the pile during concrete curing. When the pile deforms under the influence of load or temperature, the reinforcement and concrete deform incoordination due to the bonding effect of concrete. BOTDR data demodulator is used to collect the Brillouin frequency shift of the optical fiber, and then Formula (1) is used to calculate the pile strain. The test aims to assess the deformation of the pile during the curing stage just after the completion of concrete casting; the initial data of optical fiber sensor is obtained by the first measurement after concrete casting. Then the data is recorded every 24 h to evaluate the deformation of the pile during concrete curing. The main parameters set by the data acquisition instrument during the test are shown in Table 2.

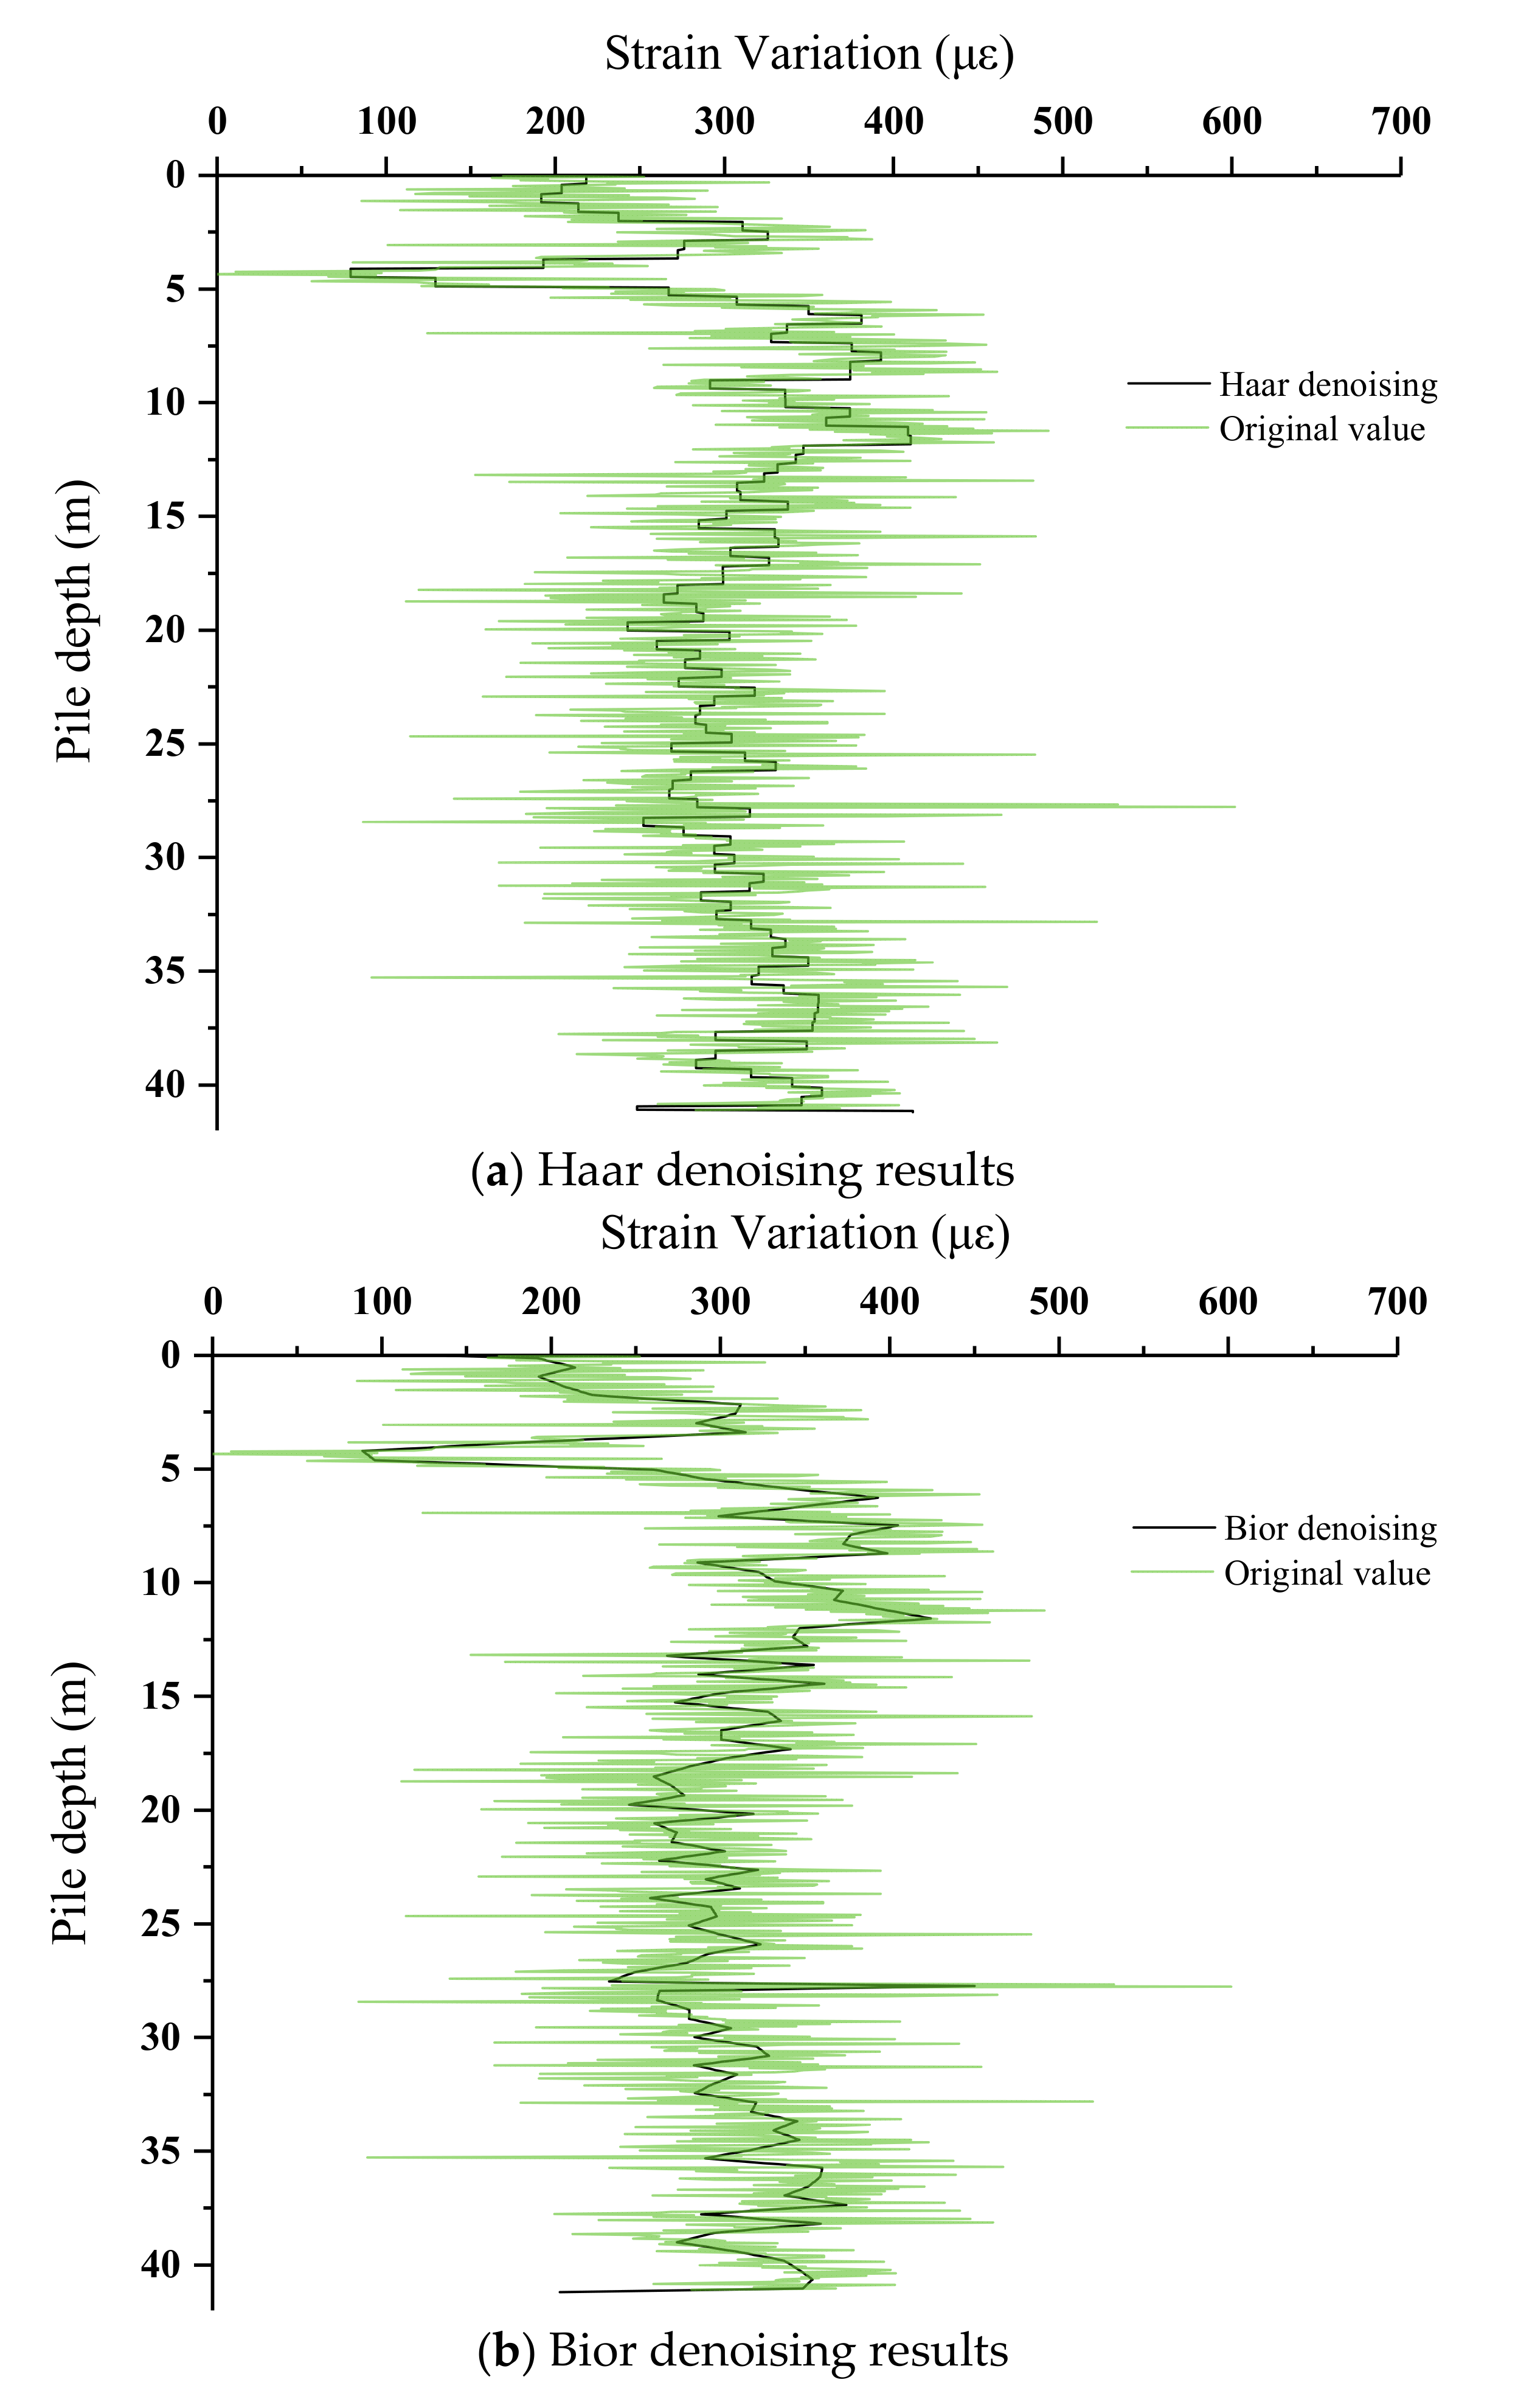
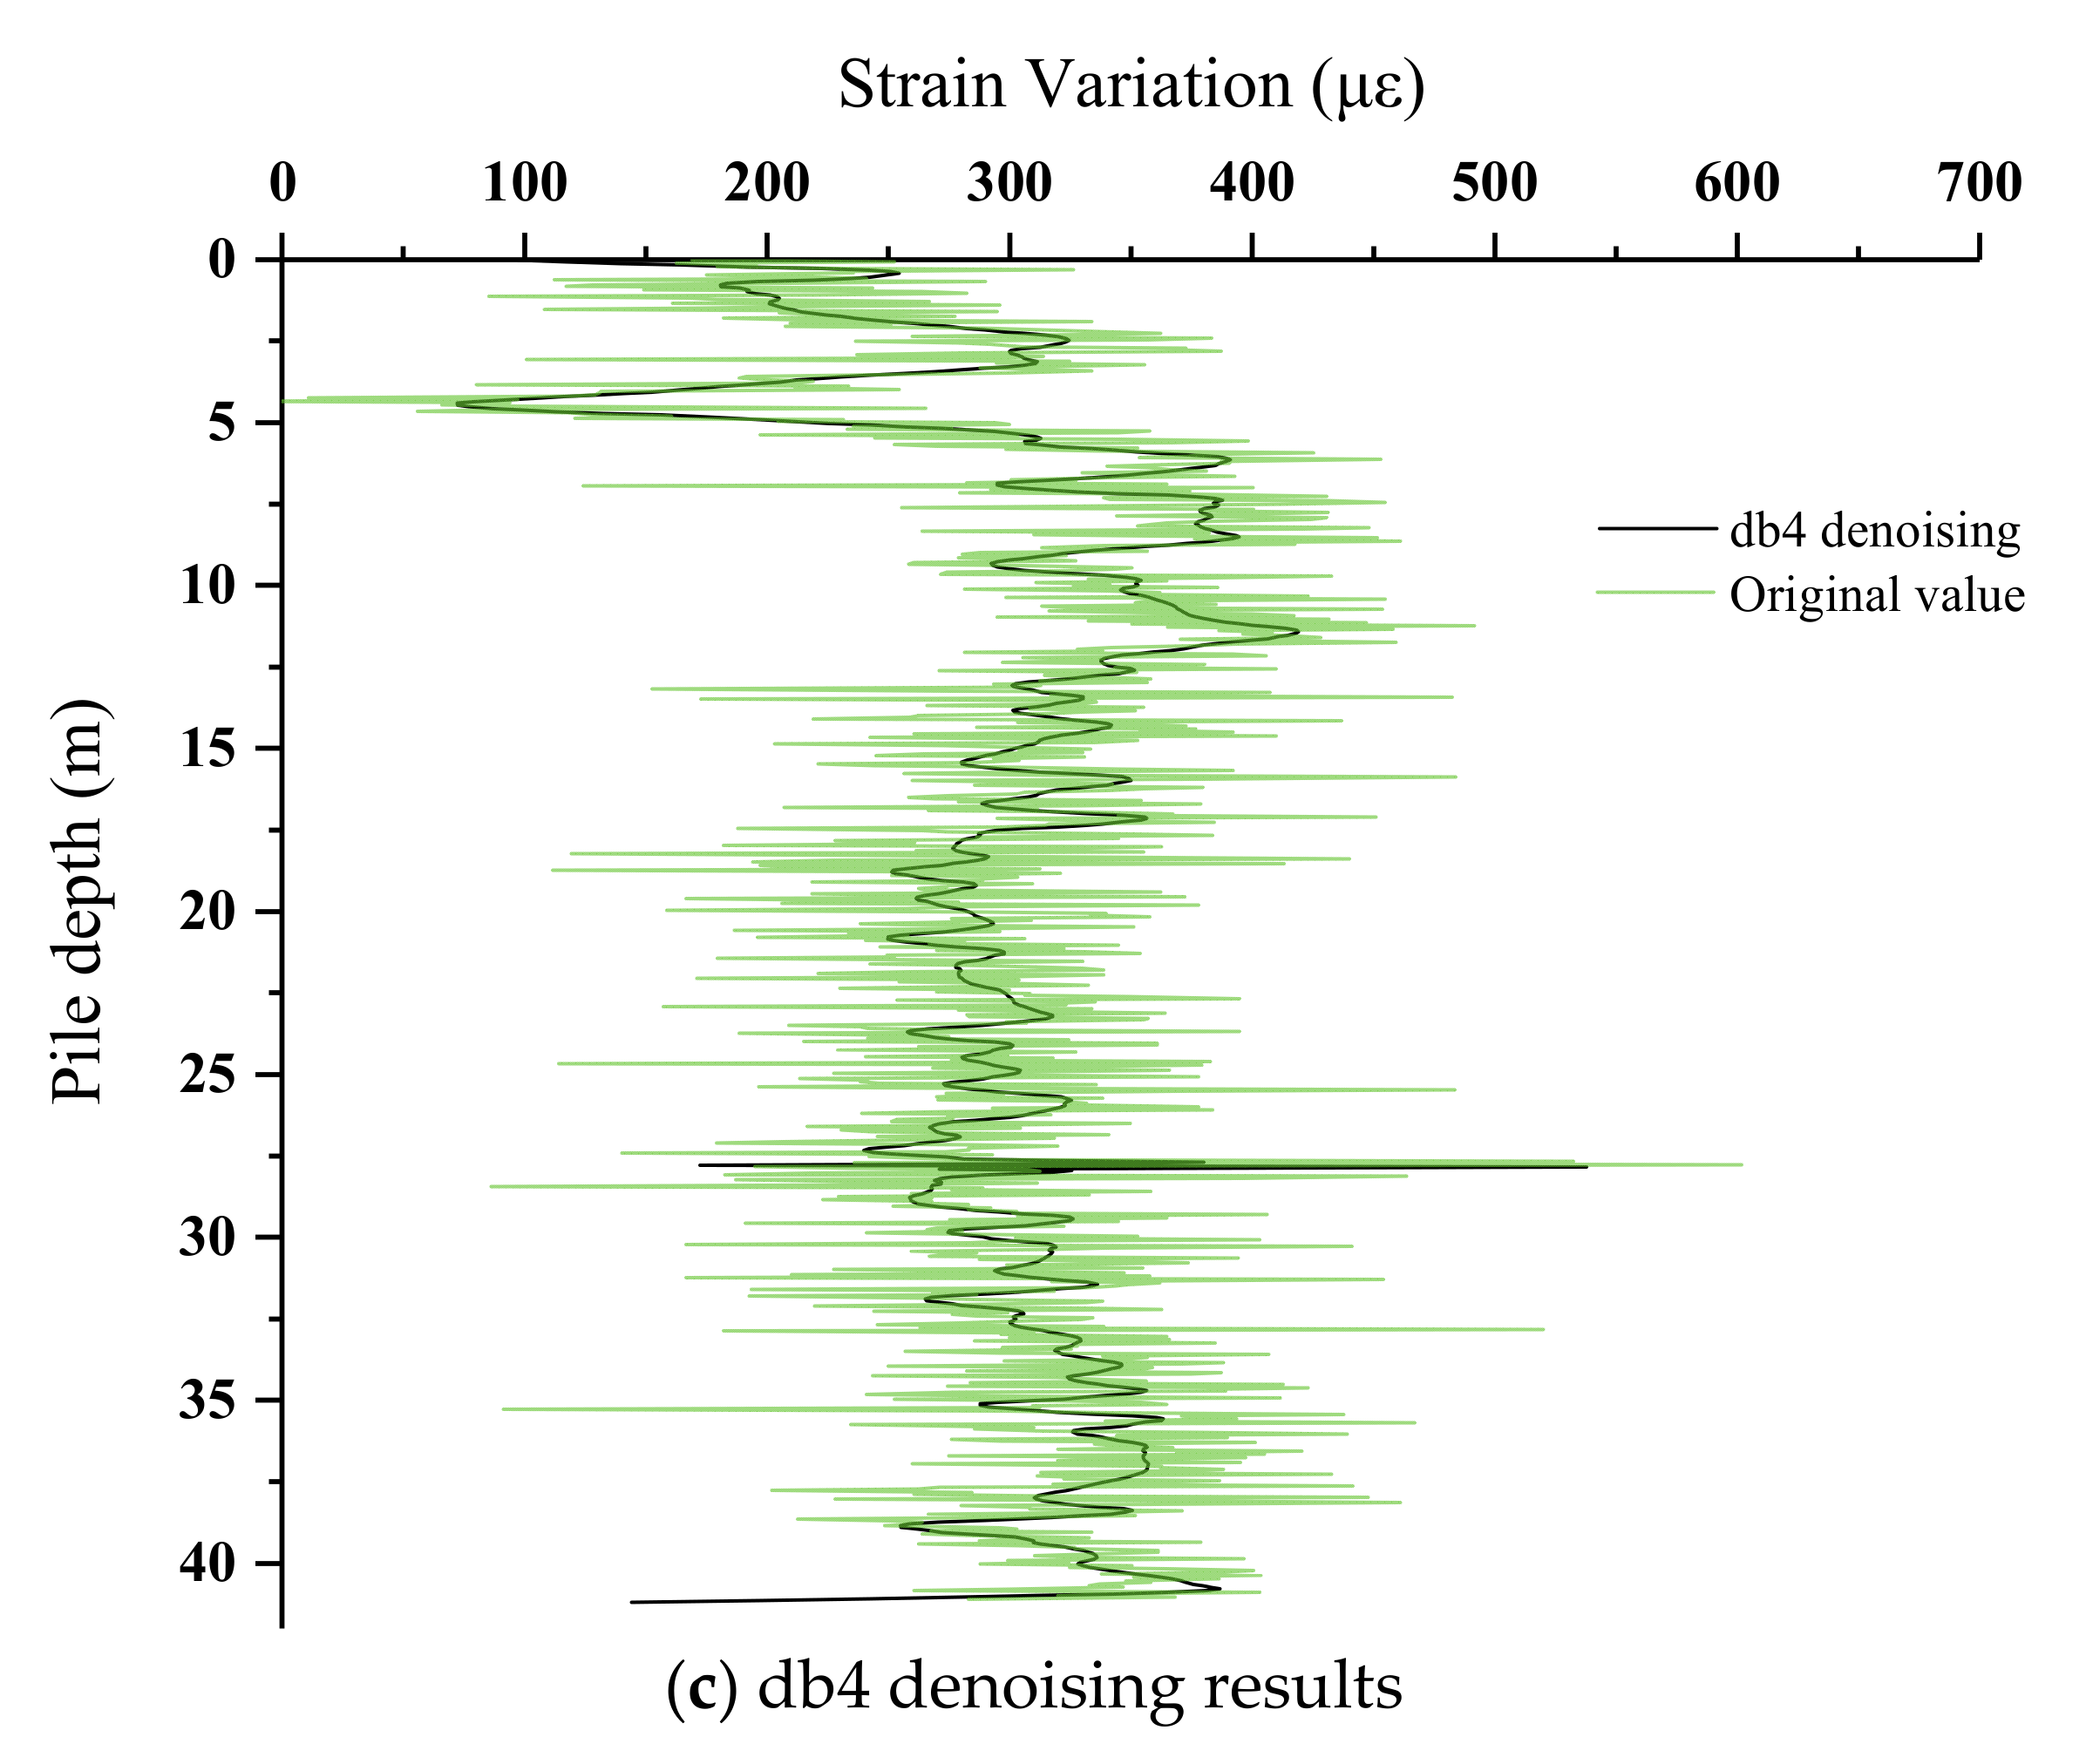
3.4. Data Processing

In this test, the first measurement time is after concrete pouring, and then every 24 h, the outdoor temperature is recorded. The test time is early May, the temperature is stable, the weather is clear, and the temperature difference between day and night is small. The measurement interval and ambient temperature are shown in Table 3.
The first measurement data is taken as the initial value, the subsequent measurement data are compared, the Brillouin frequency shift is obtained and the strain information is calculated, and the pile deformation during concrete curing is evaluated. Using the monitoring data, the strain with distance curve of optical fiber sensor during concrete curing is drawn, and three distinct turning points are identified in Figure 5; they are at 19, 61, and 102 m. The two turning points are at 19 and 102 m, which are the positions of optical fiber sensor outlet at the top of the pile. The central turning point at 61 m is the transition section for the bottom of the pile. The curve is symmetrical at the bottom of the pile, which is consistent with the symmetrical arrangement of optical fiber sensor on the steel cage.
The data of the pile are selected from Figure 6, the first data are taken as the benchmark. The subsequent data are subtracted from it to calculate the strain variation, but the data still need to be further processed. This is mainly due to the engineering practice, the instrument system error, and the surrounding environment agents, such as atmosphere, temperature, pressure, etc. As well as the influence of various factors such as artificial observation, the monitoring data obtained are mixed with useless noise signal, and the noise effect can lead to a wrong conclusion. The wavelet function is used to denoise the data, and the moving average method is used to smooth the data curve.
The wavelet threshold de-noising is to achieve the approximate optimal under the minimum mean square error. This denoising method has the advantages of less calculation, easy implementation, and reducing most of the noise signals [23]. The commonly used denoising methods are Harr wavelet denoising, bior wavelet denoising, and DB wavelet denoising. Table 4 shows the characteristics of the above three wavelet basis functions.
In order to observe the denoising effect of the three wavelet basis functions more intuitively, the appropriate denoising method is selected. The threshold level is set to 3, and the Haar wavelet function, bior2.2 wavelet function, and DB4 wavelet function are used to denoise, and the denoising results are compared. The denoising results are shown in Figure 6. It can be seen that the denoising result of Haar wavelet function presents a step shape, which is different from the real situation (Figure 6a). The denoising results of Bior2.2 wavelet function and DB4 wavelet function are similar, which eliminates the influence of noise and avoids the distortion of data. The denoising result of Bior2.2 wavelet function is sharper at the turning point, while the denoising result of DB4 wavelet function is smoother (Figure 6b). Considering the comprehensive comparison, the DB4 wavelet function is selected as the denoising method of this experiment (Figure 6c).
The db4 wavelet function is used. Through further selection, the threshold level is set as 4 to conduct denoising processing on the data. The processed results of one side of the pile are shown in Figure 7.

4. Analysis of Monitoring Data

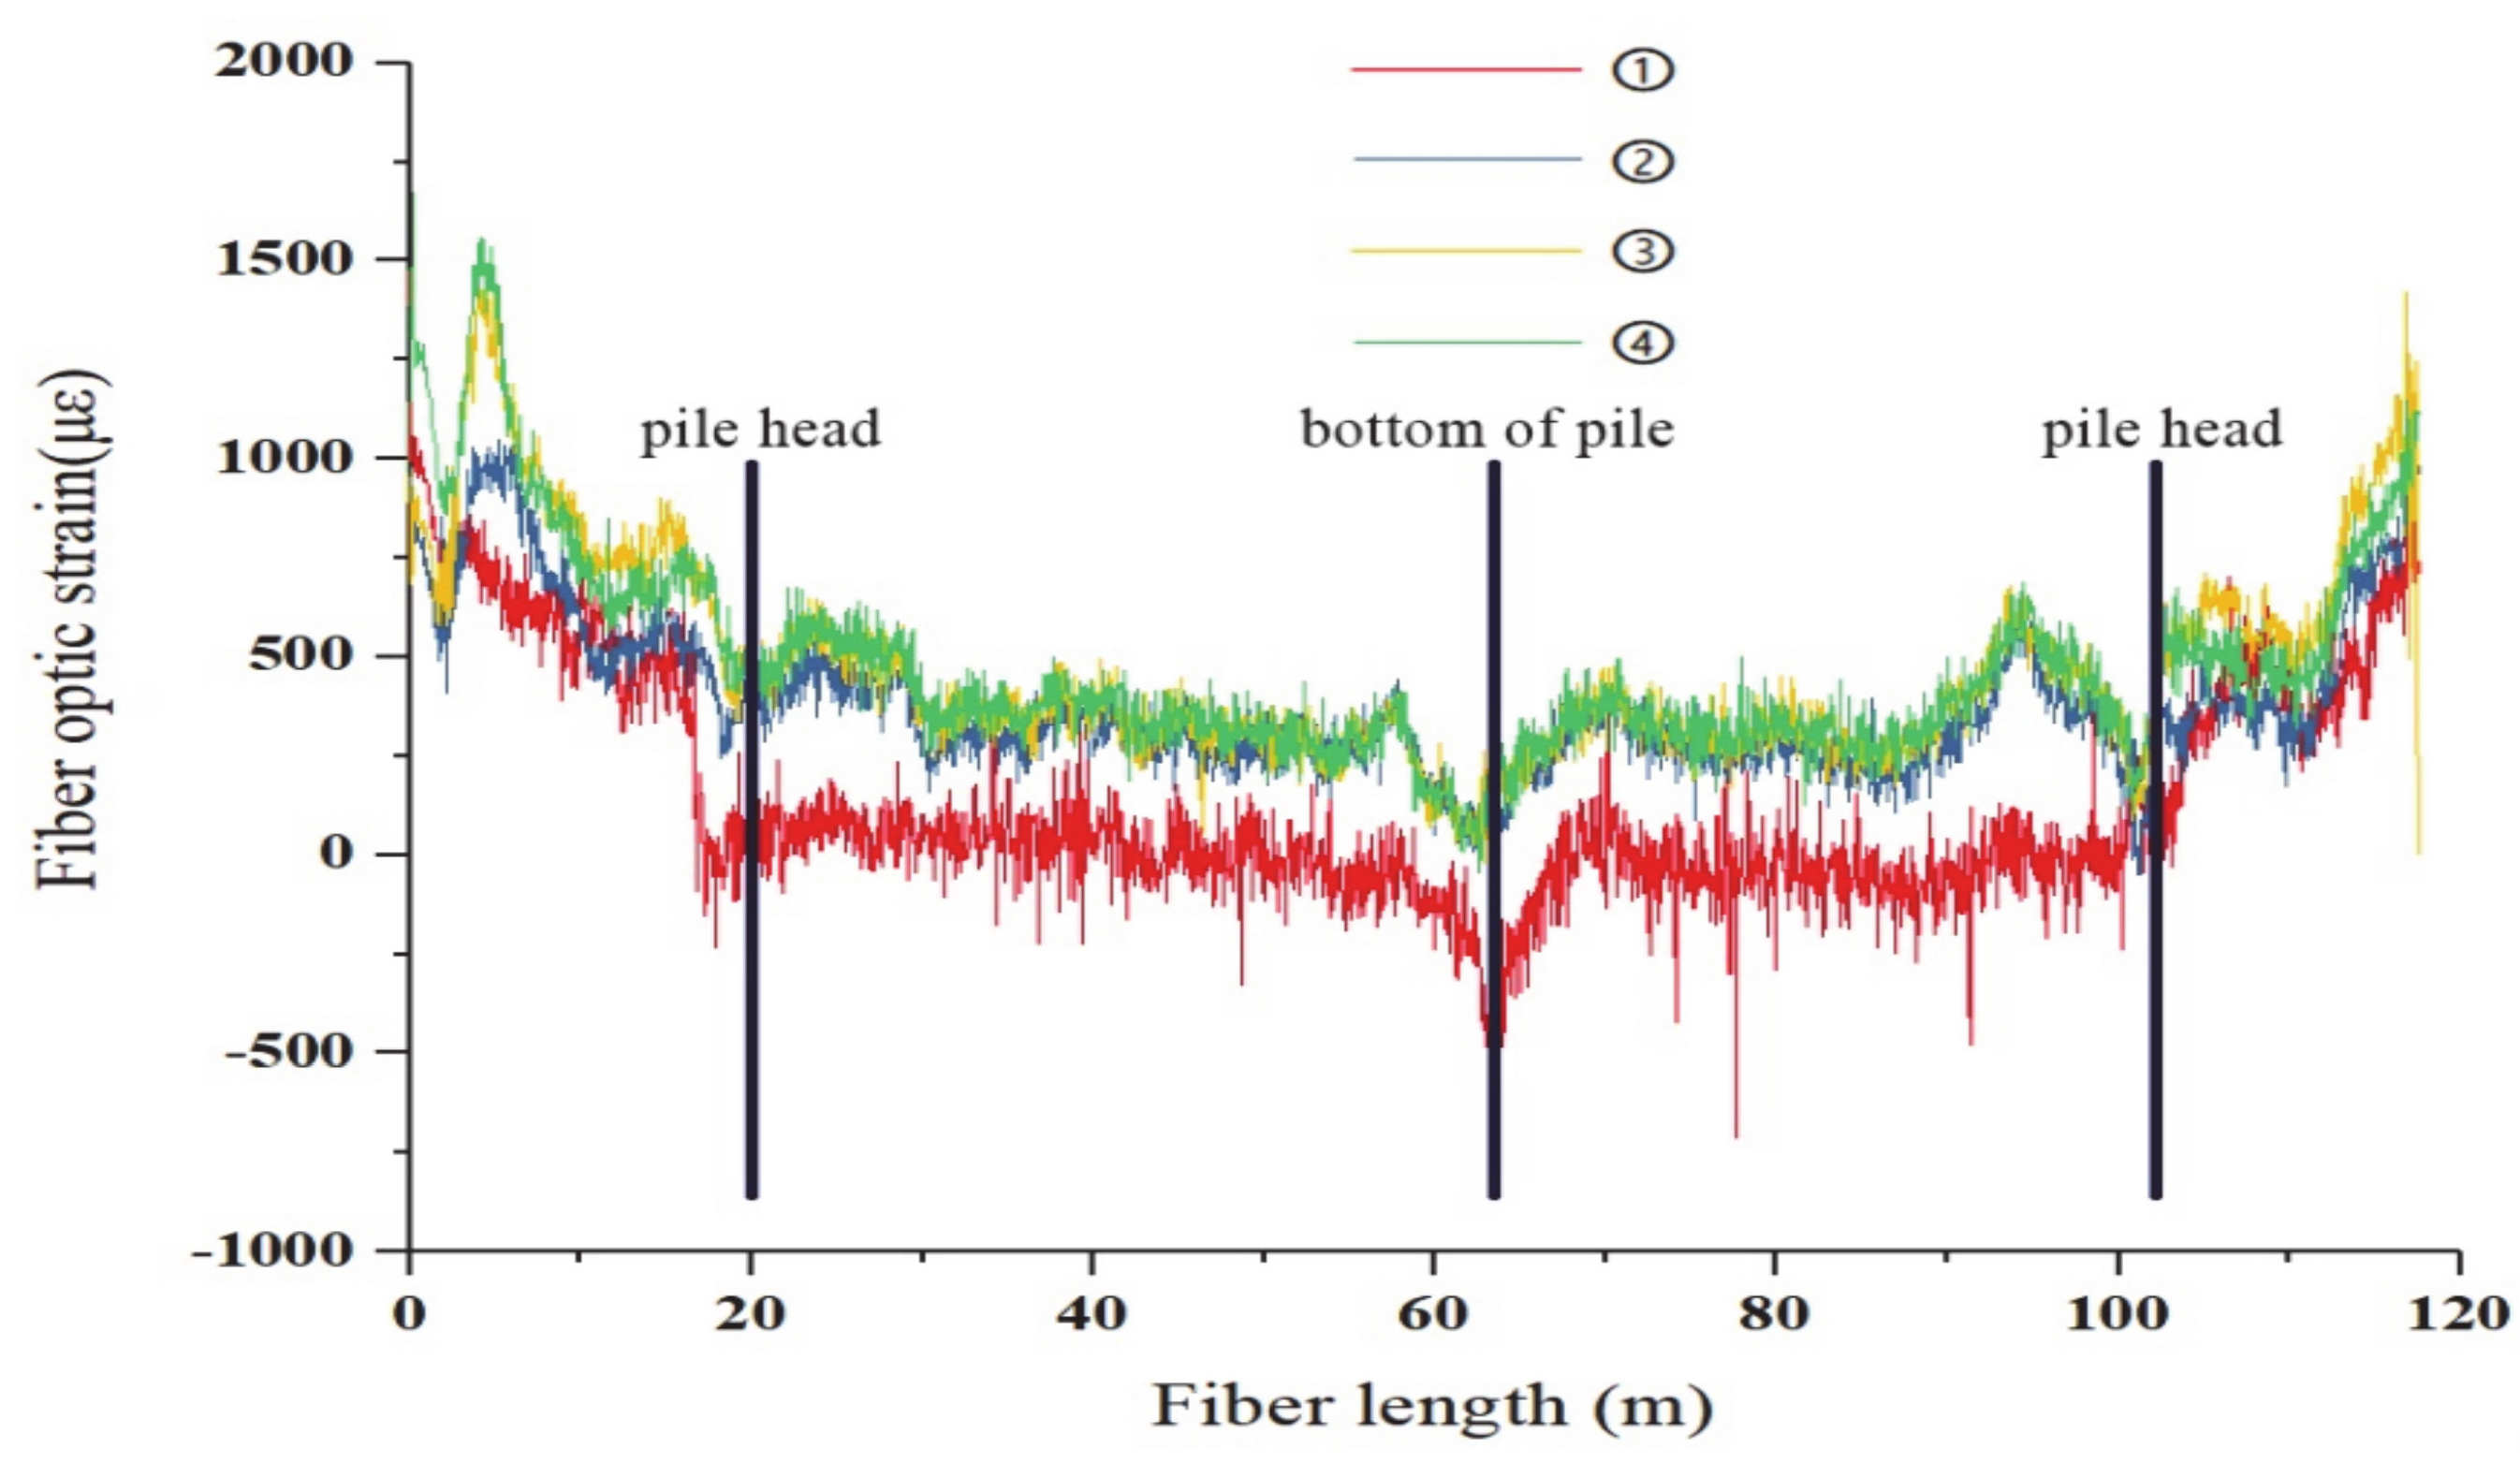
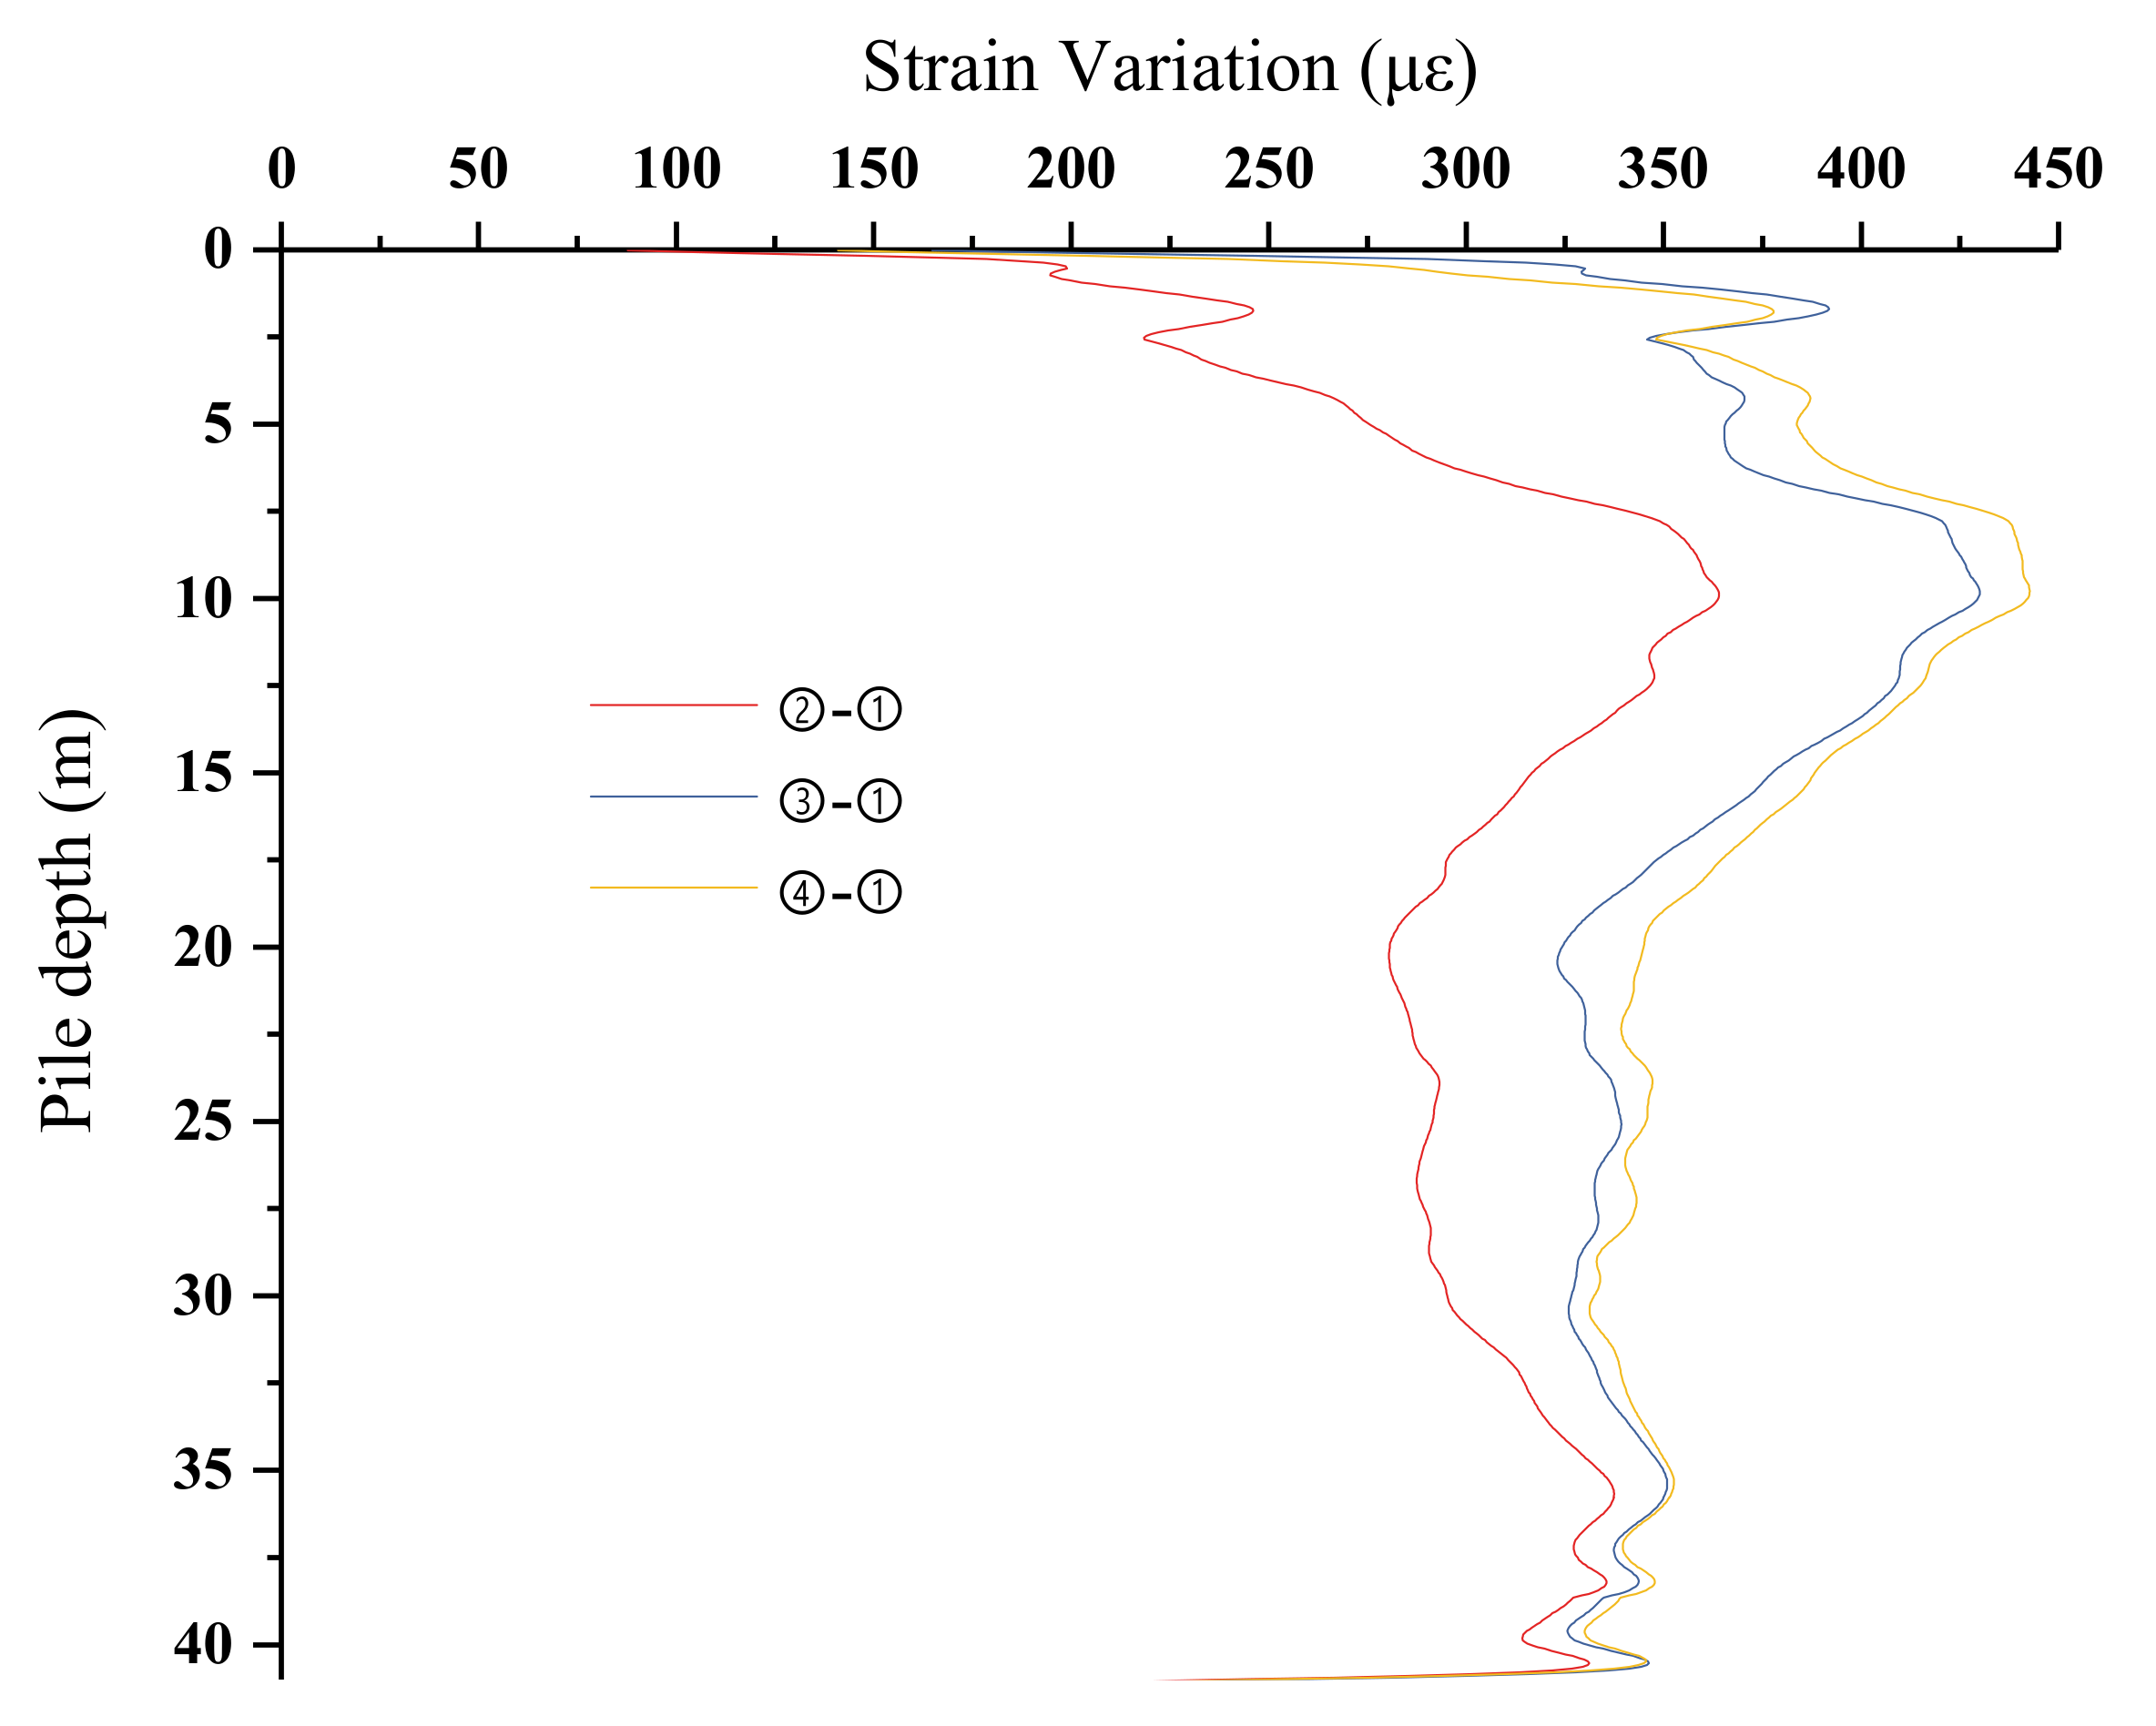
4.1. Analysis of Pile Strain Data

The average strain values of both sides of the pile are taken to draw the strain variation with pile depth curve (Figure 8). It can be seen that the strain of the pile keeps increasing; the result of concrete expansion is caused by the temperature rise of the pile due to the heat released from the hydration of concrete. It is also observed that the strain of the pile head is small, because the heat generated by the concrete hydration of the pile head can be easily released into the air. The change of strain tends to be obvious with the increasing pile depth; the constant temperature of underground layer restricts the emission of hydration heat, and the influence of hydration heat on pile deformation tends to be noticeable. However, with the increasing pile depth, the strain changes show a tendency of increasing first and then decreasing; these changes might be related to temperature variation in different soil layers, and they affect the hydration heat emission and the pile deformation. The first day after concrete pouring, the deformation of the fiber sensor (②–①) is significantly higher than the deformation of the second and third day (③–①, ④–①). The main reason for this phenomenon is that after the completion of concrete casting on the first day, the concrete has a more significant impact on the deformation of optical fiber sensor; the deformation on the first day is greater than that of the second and third days.
This experiment uses the distributed fiber optic sensing technology for the monitoring of pile deformation. When BOTDR technology is used to monitor the strain change information of bored pile in the loading test, it can obtain the strain change of pile accurately. Compared with the traditional monitoring results such as axial force meter, it confirmed the reliability of the data [24,25,26]. The monitoring data of the static load test on the pile have high accuracy [11], which also strengthens the reliability of the test data.

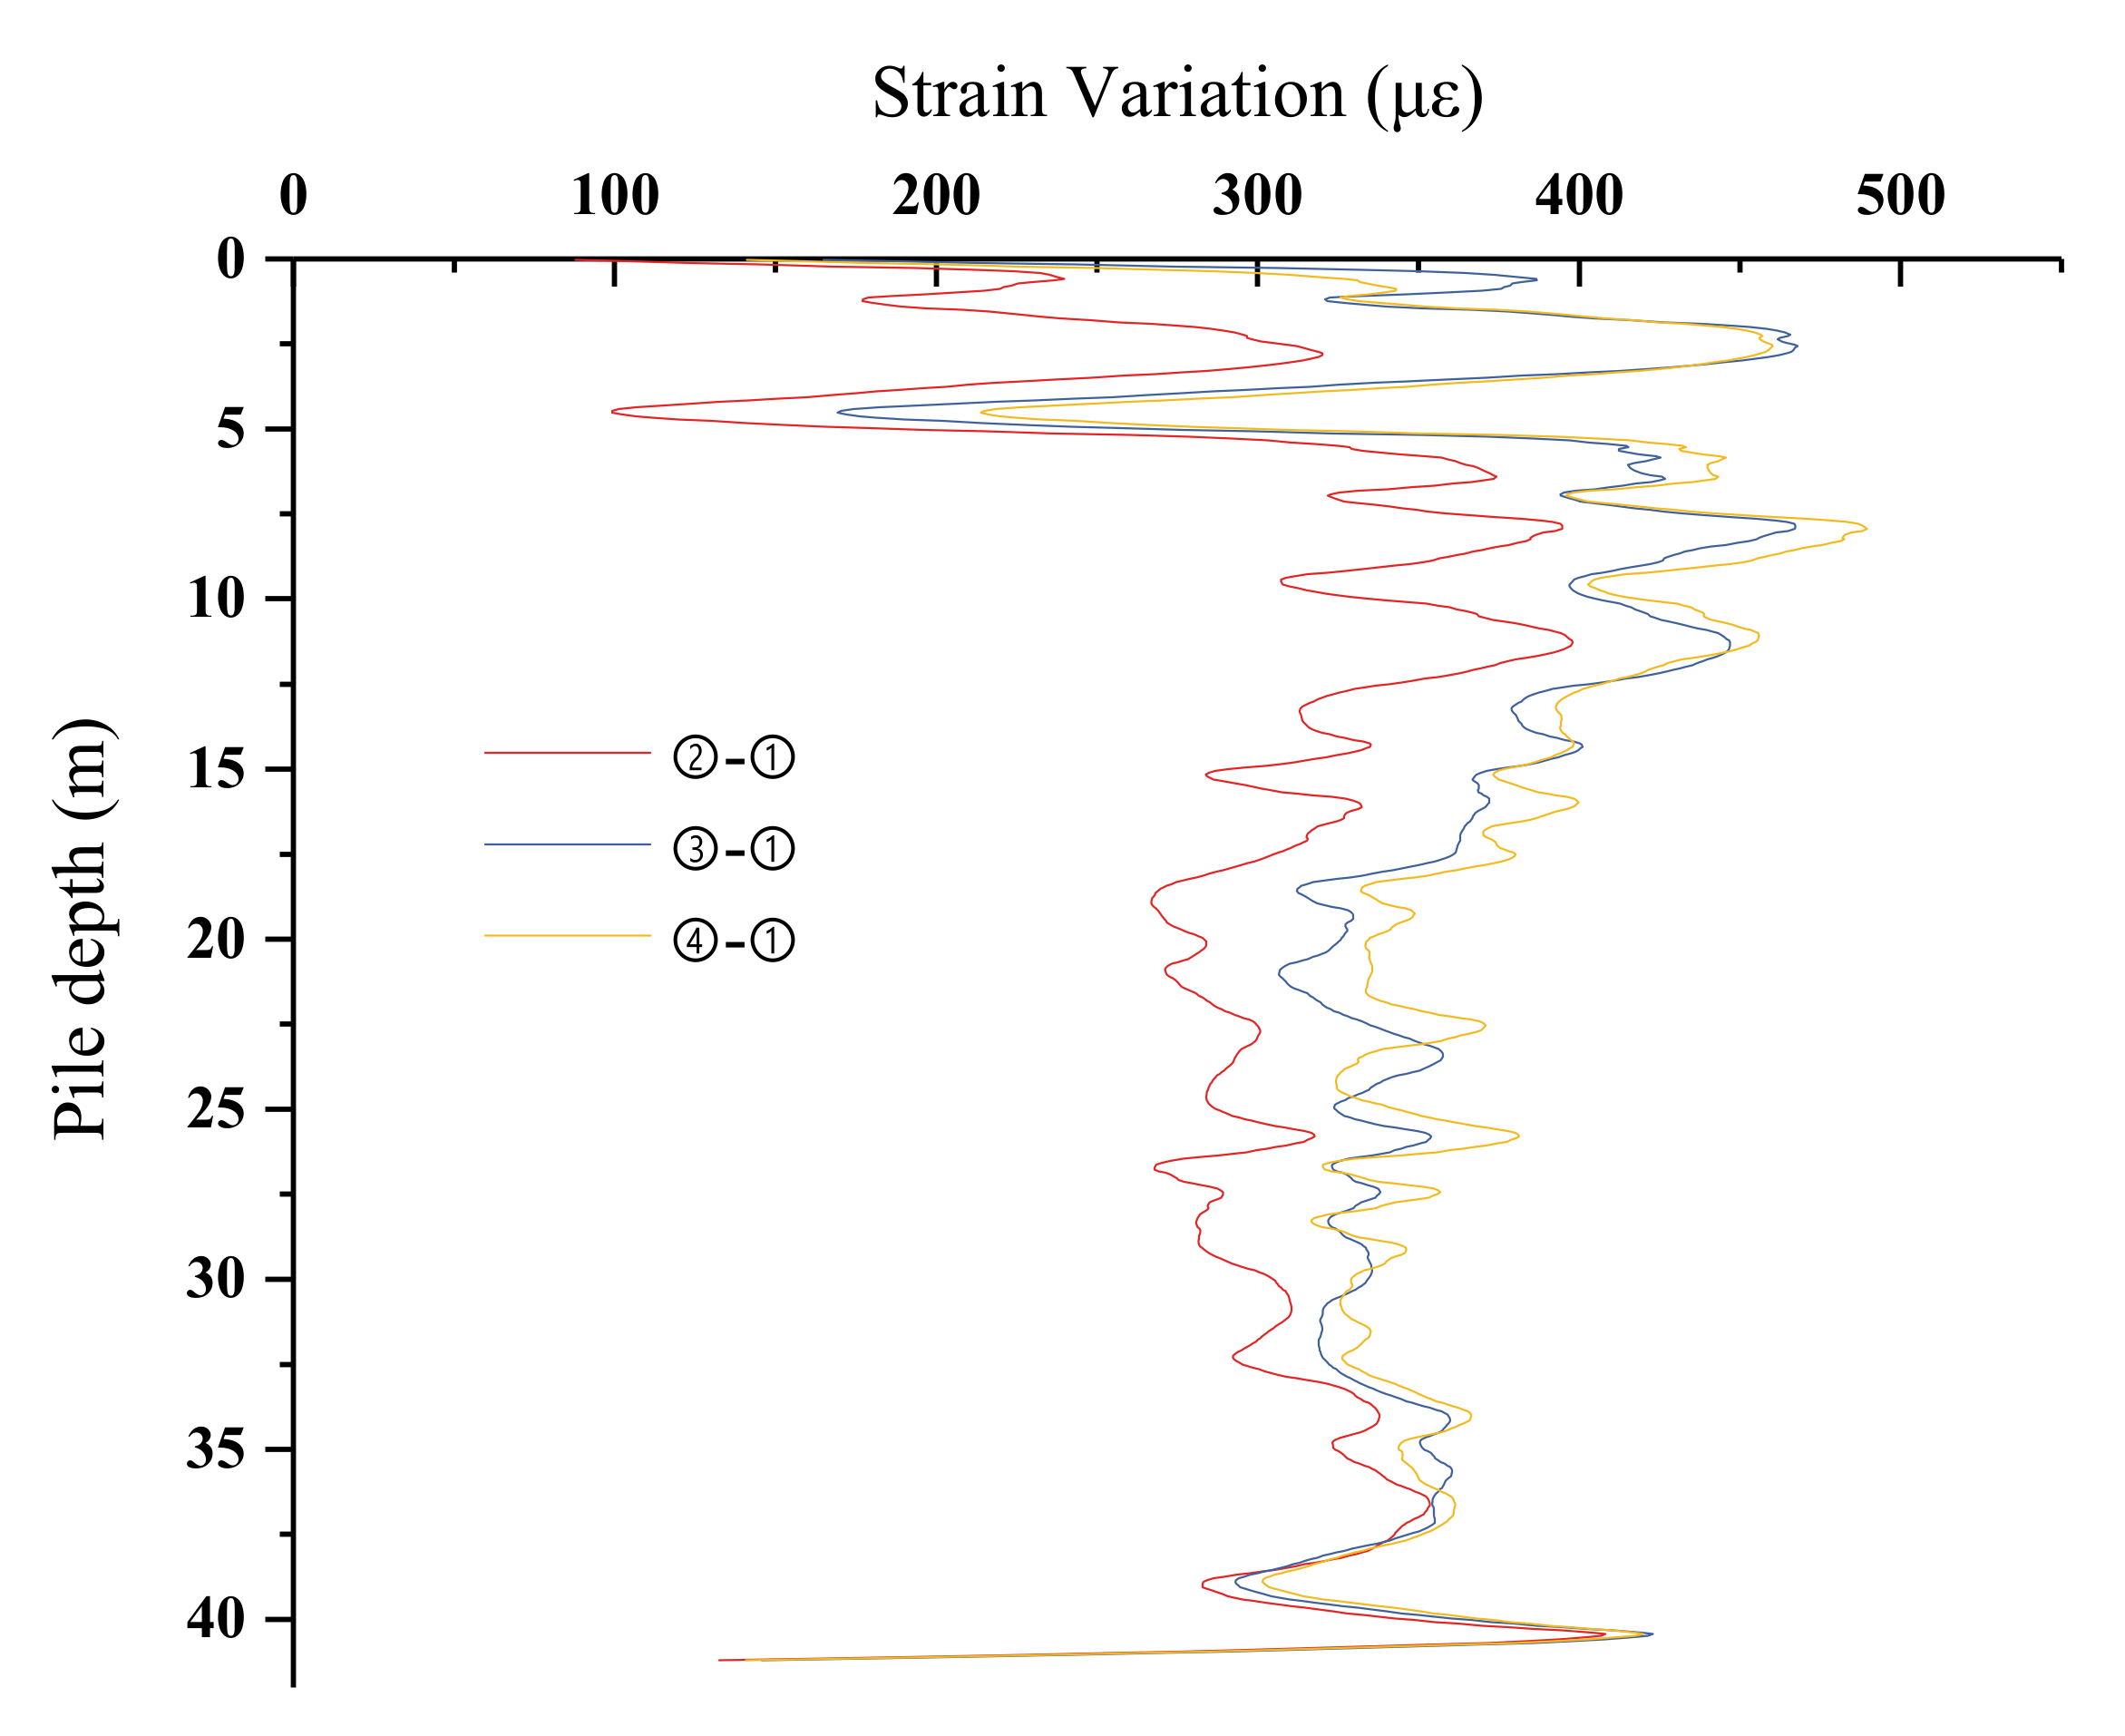
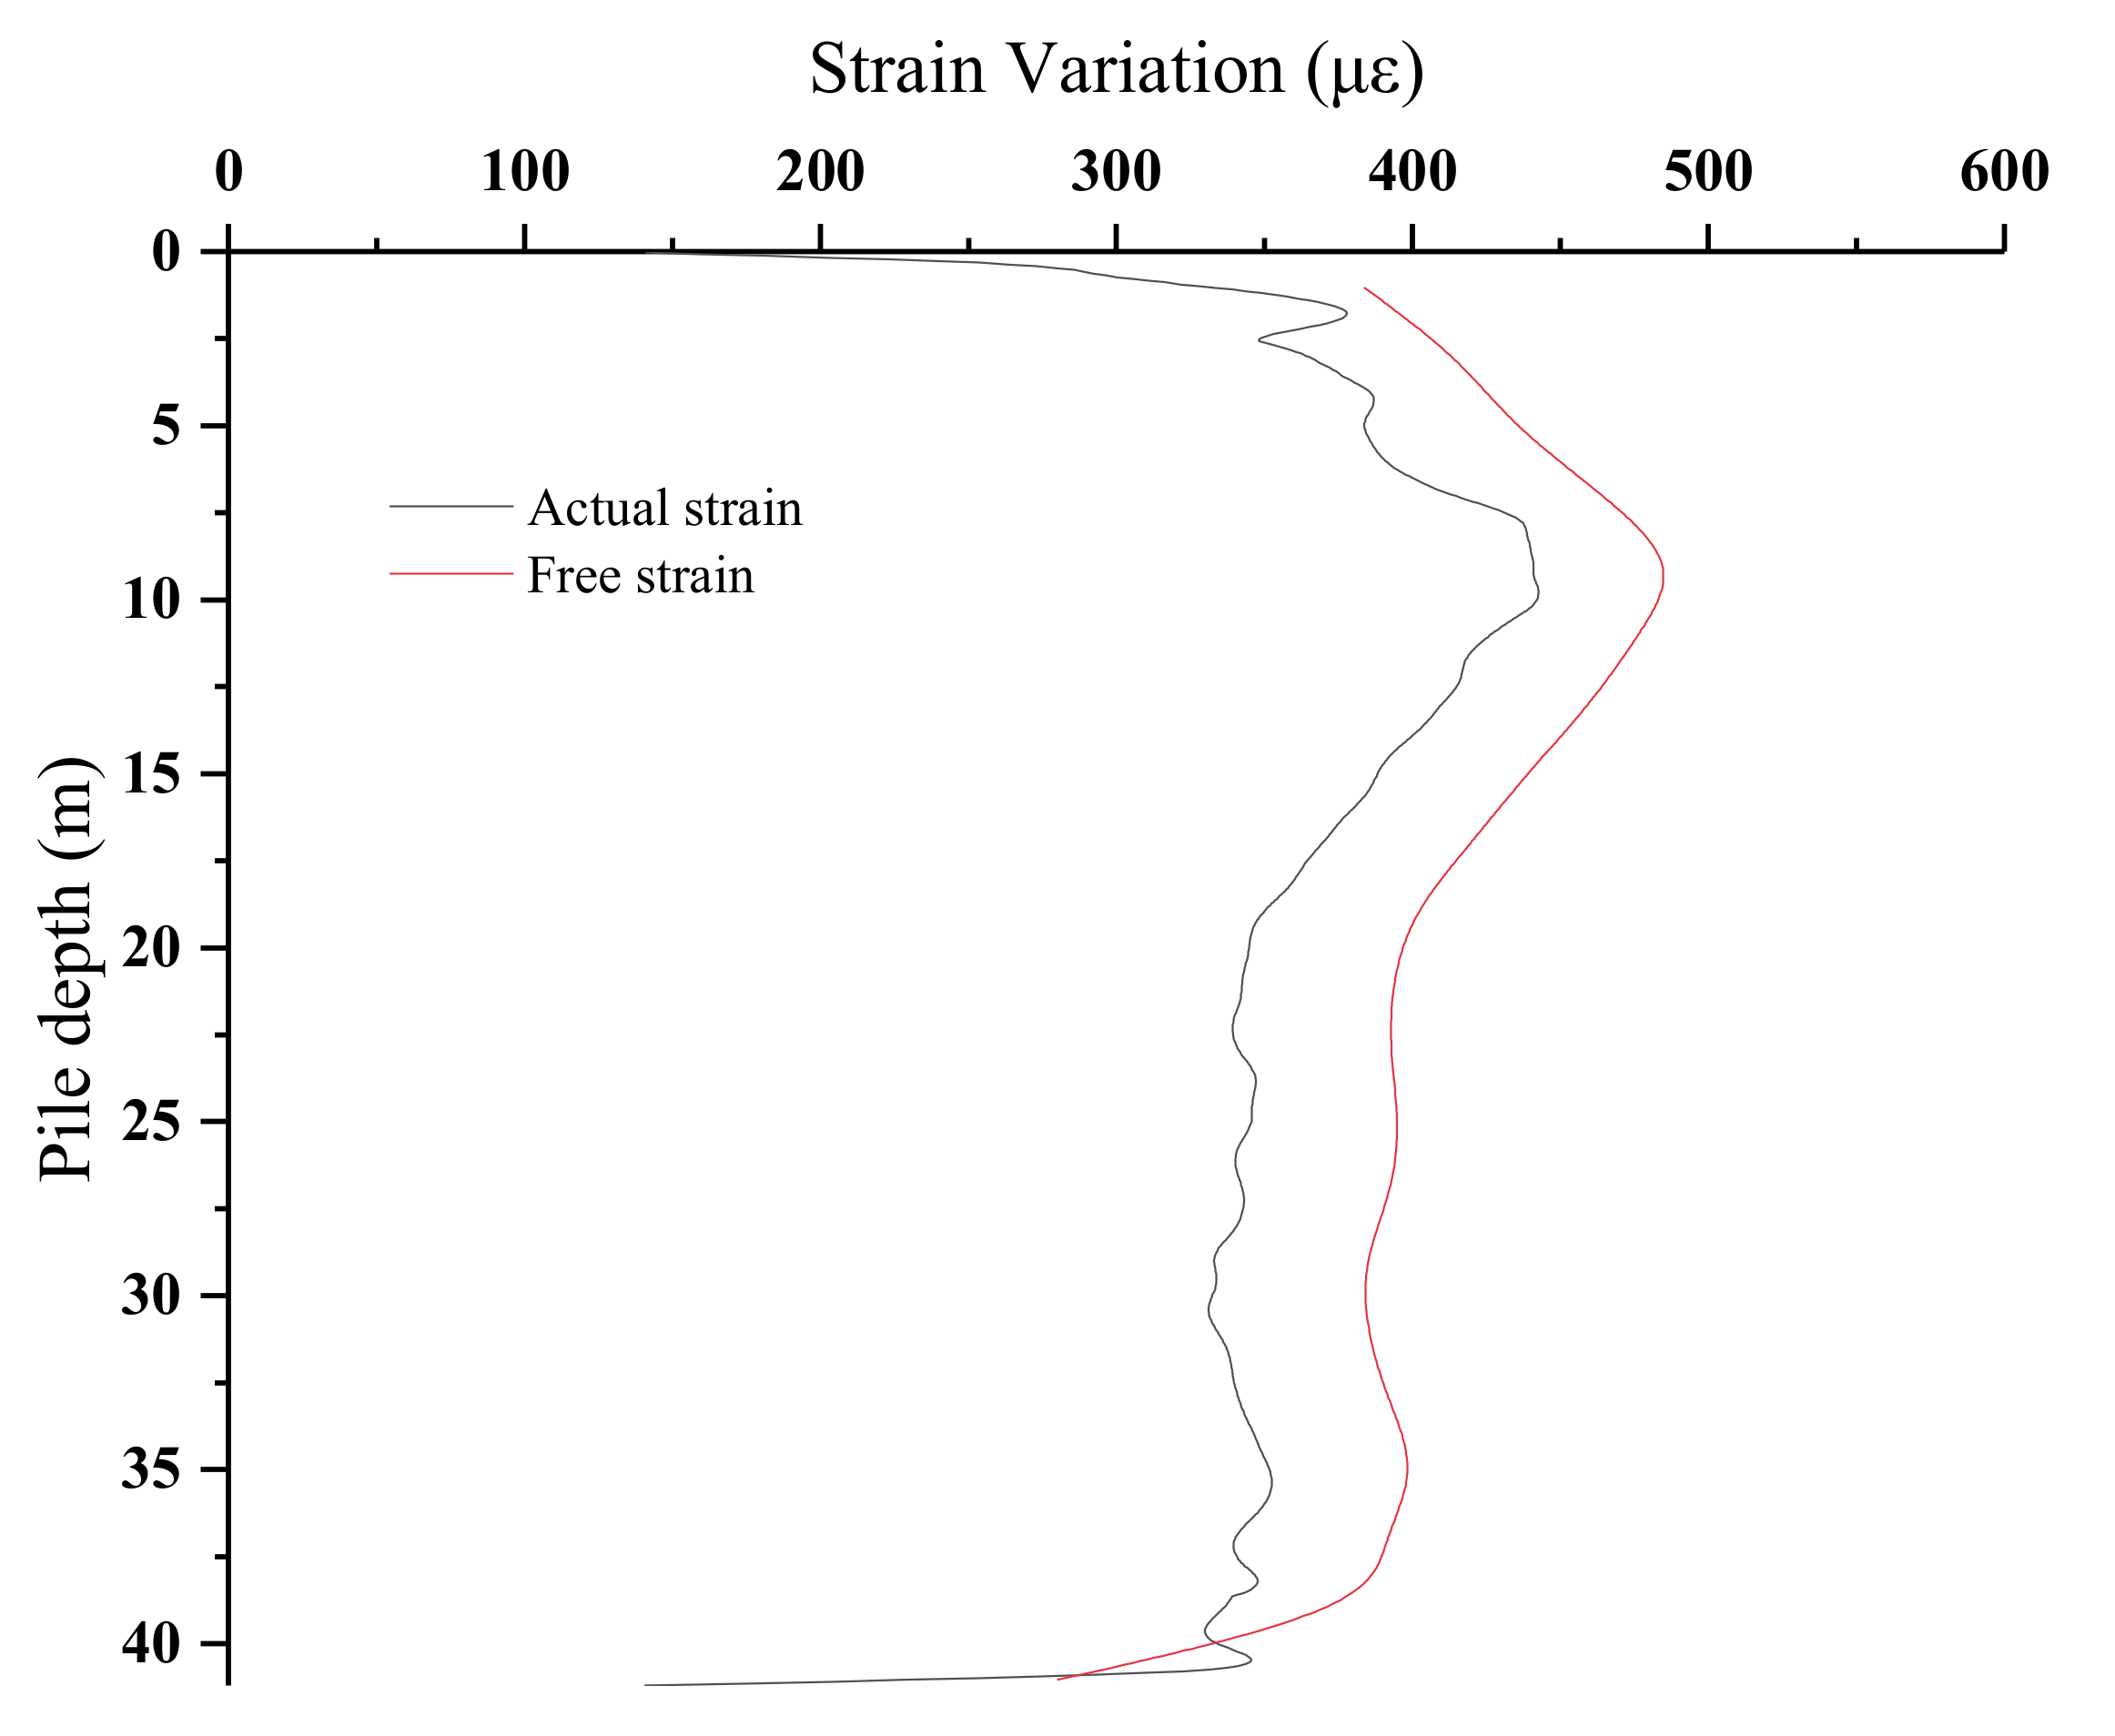
4.2. Compare of Strain Distribution of the Pile

The deformation of concrete during curing can be divided into self-shrinkage, temperature deformation, drying shrinkage, etc. [27,28,29]. In this paper, the deformation caused by hydration of the bored concrete pile is mainly self-shrinkage and temperature deformation.
Under the condition of no constraint, the free deformation of concrete is:
ε = ε T + ε C
Among them:
  • ε —free deformation of concrete;
  • ε T —deformation of concrete produced by temperature;
  • ε C —the self-shrinkage of concrete.
According to the results of Fang Jincheng et al. [2], the temperature deformation and self-shrinkage of concrete under unconstrained conditions can be calculated by the following formula:
ε T = α r t T
Among them:
  • T —the temperature change, °C;
  • α r t —expansion coefficient of early concrete.
Further:
α r t = α k 1 + 41 t m
  • α k —thermal expansion coefficient of concrete at 28 d; in this paper, the value is 10−5/°C;
  • m—age correlation coefficient, m = 2.0;
  • t—age of concrete, d;
In the monitoring of pile foundation in civil engineering, it is generally assumed that the optical fiber and concrete are deformed harmonically. In this study, according to the experience of predecessors, the deformation of optical fiber itself caused by temperature change in this process is smaller than that of concrete, and such deformation can be ignored [2,11]. Therefore, it can be considered that the optical fiber monitoring result is the deformation of concrete caused by temperature.
In the end, the proposed formula for the shrinkage deformation of concrete itself is:
ε c = 5936 e x p 9.54 w / b
  • ε c —final self-shrinkage deformation, με;
  • w / b —water cement ratio of concrete. In this paper, the value is 0.5.
The last test result is selected; the result on day 3 is used to calculate the free strain. The free strain is calculated every 2 m along the length of the pile, and the calculated free strain is connected with a smooth curve. The comparison between the free strain and the measured strain is shown in Figure 9. It can be seen from Figure 9 that the free strain is obviously greater than the measured strain value; it can exceed the measured strain value by up to 15%. This is mainly because the concrete itself deforms during hydration and solidification its release of heat of hydration is affected by the geothermal field, the deformation is constrained by the ground, and the measured strain and free strain are obviously different. This difference reflected in the actual project can cause the pile body to produce non-negligible stress under the restraint of the ground, thereby affecting the quality of the pile and the bearing capacity of the pile foundation. It should be pointed out that it is assumed that in the optical fiber and the concrete coordinated deformation, the strain is measured by the optical fiber, and the concrete deformation is caused by the temperature, which ignores the influence of the external temperature of the pile top to some extent. The influence of external temperature and the degree of soil restraint on pile deformation needs further studies in the future.

5. Conclusions

In this paper, the distributed fiber optic sensing technology based on BOTDR is used to carry out a series of studies on the strain change of the pile in the concrete curing stage; the following conclusions are obtained:
(1)
The distributed optical fiber sensing technology based on BOTDR is used, and the accurate data of the pile strain are obtained to study the curing of concrete bored pile deformation; it reflects the advantage of distributed optical fiber sensing technology in the pile foundation monitoring. The hydration heat is released continuously over time, while the temperature of the pile body is confined to the surrounding soil layer. The variation of temperature at different depths is related to the temperature of surrounding soil layer, it affects the strain distribution of the pile.
(2)
Based on the comparison between the strain distribution of the pile body obtained by BOTDR and the theoretical calculation value, the soil around the pile and the underground constant temperature layer have a significant influence on the pile body strain. The distributed optical fiber can adequately monitor the deformation of the concrete pile during the concrete curing period, especially the pile strain caused by the heat of hydration; it is helpful to the quality control of concrete piles during the curing period.
(3)
Integrated soil information and monitoring result analysis confirms that the pile deformation in the middle of silty clay layer, powder soil, and silt layer and other hard restriction in soil is larger, and it will affect the quality and bearing capacity of the pile.

Author Contributions

L.G. designed the project. C.H. and Y.G. performed the experiment and prepared the manuscript. O.A. and Y.J. improved the English of manuscript. All authors have read and agreed to the published version of the manuscript.

Funding

This research received the funding from the National Natural Science Foundation of China (Grant No. 52027812), the Fundamental Research Funds for the Central Universities of Hohai University (No. B210202047).

Institutional Review Board Statement

The studies are not involving humans or animals.

Informed Consent Statement

The studies are not involving humans.

Data Availability Statement

Data sharing is not applicable.

Acknowledgments

Financial support coming from the National Natural Science Foundation of China (Grant No. 52027812), the Fundamental Research Funds for the Central Universities of Hohai University (No. B210202047), the Key Laboratory of Ministry of Education for Geomechanics and Embankment Engineering, and Hohai University (No. GHXN202005) is gratefully appreciated.

Conflicts of Interest

The authors declare no conflict of interest.

References

  1. Wei, M.C.; Meng, Y.D.; Zhu, C.; Fang, J.C.; Kong, G.Q. Field experiment on hydration effect of backfill bored cast-in-place pile and concrete bearing platform. J. Disaster Prev. Mitig. Eng. 2019, 39, 622–627. [Google Scholar]
  2. Fang, J.C.; Kong, G.Q.; Chen, B.; Che, P.; Peng, H.F.; Lv, Z.X. Field test of influence of concrete hydration on thermodynamic characteristics of pile group. Rock. Soil. Mech. 2019, 40, 2997–3003. [Google Scholar]
  3. Chen, W.C.; Yang, W.J.; Ren, L.; Shen, Z.P. Axial temperature field and strain test of bored pile in sandy soil foundation. Sino-foreign Highw. 2008, 38, 151–157. [Google Scholar]
  4. Tang, L.Y.; Yang, G.S.; Jean, Y.Y.; Wang, Z.B. Analysis on the influence of hydration heat on pile foundation heat in permafrost region. J. Xi’an Univ. Sci. Technol. 2011, 31, 28–32. [Google Scholar]
  5. Cussion, D.; Reprtte, W.L. Early-age cracking in reconstructed concrete bridge barrier walls. ACI Mater. J. 2000, 97, 438–446. [Google Scholar]
  6. Altoubat, S.A. Early age stresses and creep-shrinkage interaction of restrained concrete. ACI Mater. J. 2001, 98, 323–331. [Google Scholar]
  7. Zhang, Y.; Sun, W.; Liu, S. Study on the hydration heat of binder paste in high-performance concrete. Cem. Concr. Res. 2002, 32, 1483–1488. [Google Scholar] [CrossRef]
  8. Chen, Z.Y.; Li, G.Y.; Mu, Y.H.; Yu, Q.; Mao, Y.; Wang, F. Impact of molding temperature and hydration heat of concrete on thermal properties of pile foundation in permafrost regions along the Qinghai-Tibet DC Transmission Line. J. Glaciol. Geocryol. 2014, 36, 818–827. [Google Scholar]
  9. Yuan, X.Z.; Ma, W.; Liu, Y.Z. Study on thermal regime of high-temperature frozen soil while construction of cast-in-place pile. Chin. J. Rock Mech. Eng. 2005, 24, 1052–1055. [Google Scholar]
  10. Ya-Ping, W.U.; Chun-Xiang, G.U.; Wei-Dong, P.A. Influences of refreezing process ofground on bearing capacity of single pile and bridge construction in permafrost. Chin. J. Rock Mech. Eng. 2004, 23, 4229–4233. [Google Scholar]
  11. Lei, G.; Chuan, H.; Xu, Z.Q.; Jin, Y.J.; Yan, J.Q. Experiment Study on Deformation Monitoring of Bored Pile Based on BOTDR. Appl. Sci. 2019, 9, 2435. [Google Scholar]
  12. Weng, Y.; Ip, E.; Pan, Z.; Wang, T. Single-end simultaneous temperature and strain sensing techniques based on Brillouin optical time domain reflectometry in few mode fibers. Opt. Express 2015, 23, 9024–9039. [Google Scholar] [CrossRef] [PubMed]
  13. Fabien, R.; Bao, X.; Li, Y.; Yu, Q.; Yale, A.; Kalosha, V.P.; Chen, L. Signal processing technique for distributed Brillouin sensing at centimeter spatial resolution. J. Lightwave Technol. 2007, 25, 3610–3618. [Google Scholar]
  14. Lee, B. Review of the present status of optical fiber sensors. Opt. Fiber Technol. Mater. Devices Syst. 2003, 9, 57–79. [Google Scholar] [CrossRef]
  15. Lei, G.; Kai, Y.; Xiaorui, C.; Xiangjun, Y. Study on the deformation measurement of the cast-in-place large-diameter pile using Fiber Bragg Grating Sensors. Sensor 2017, 17, 505. [Google Scholar]
  16. Zhang, D.; Shi, B.; Xu, H.Z. The BOTDR-Based Strain Monitoring for Tunnel. J. Eng. Geol. 2004, 4, 422–426. [Google Scholar]
  17. Horiguchi, T.; Shimizu, K.; Kurashima, T.; Tateda, M.; Koyamada, Y. Development of a Distributed Sensing Technique Using Brillouin Scattering. J. Lightwave Technol. 1995, 13, 1296–1302. [Google Scholar] [CrossRef]
  18. Sakairi, Y.; Uchiyama, H.; Li, Z.X.; Adachi, S. System for measuring temperature and strain separately by BOTDR and OTDR. Proc. Spie-Int. Soc. Opt. Eng. 2002, 4920, 274–284. [Google Scholar]
  19. Hong, C.Y.; Zhang, Y.F.; Li, G.W.; Zhang, M.X.; Liu, Z.X. Recent progress of using Brillouin distributed fiber optic sensors for geotechnical health monitoring. Sens. Actuators A Phys. 2017, 258, 131–145. [Google Scholar] [CrossRef]
  20. Zhang, C.C.; Zhu, H.H.; Liu, S.P.; Shi, B.; Zhang, D. A kinematic method for calculating shear displacements of landslides using distributed fiber optic strain measurements. Eng. Geol. 2018, 234, 83–96. [Google Scholar] [CrossRef]
  21. Sierra-Pérez, J.; Torres-Arredondo, M.A.; Güemes, A. Damage and nonlinearities detection in wind turbine blades based on strain field pattern recognition. FBGs, OBR and strain gauges comparison. Compos. Struct. 2016, 135, 156–166. [Google Scholar] [CrossRef]
  22. Wang, Y.T.; Zheng, L.J.; Hou, P.G.; Hu, C.H. Optoelectronics and Fiber Optic Sensing Technology; National Defense Industry Press: Beijing, China, 2003. [Google Scholar]
  23. Zhang, Z.T.; Zhu, J.J.; Kuang, C.L.; Zhou, C. Wavelet packet multi threshold denoising method and its application in deformation analysis. J. Surv. Mapp. 2014, 43, 13–20. [Google Scholar]
  24. Piao, C.D.; Shi, B.; Gao, L. Characteristics and Application of BOTDR in Distributed Detection of Pile Foundation. Adv. Mater. Res. 2010, 163–167, 2657–2665. [Google Scholar] [CrossRef]
  25. Sun, Y.J.; Shi, B.; Chen, S.E.; Zhu, H.H.; Zhang, D.; Lu, Y. Feasibility study on corrosion monitoring of a concrete column with central rebar using BOTDR. Smart Struct. Syst. 2014, 13, 41–53. [Google Scholar] [CrossRef]
  26. Mohamad, H.; Soga, K.; Pellew, A.; Bennett, P.J. Performance Monitoring of a Secant-Piled Wall Using Distributed Fiber Optic Strain Sensing. J. Geotech. Geoenviron. Eng. 2011, 137, 1236–1243. [Google Scholar] [CrossRef]
  27. Li, F.; Qin, W.Z. Restraint stress and stress relaxation in concrete at early ages. J. Tsinghua Univ. (Sci. Technol.) 2010, 50, 363–366. [Google Scholar]
  28. Riding, K.A.; Poole, J.L.; Schindler, A.K.; Juenger, M.C.; Folliard, K.J. Quantification of effects of fly ash type on concrete early-age cracking. ACI Mater. J. 2008, 105, 149–155. [Google Scholar]
  29. Bentz, D.; Peltz, M. Reducing thermal and autogenous shrinkage contributions to early-age cracking. ACI Mater. J. 2008, 105, 414–420. [Google Scholar]
Figure 1. Structure of optical fiber and sensor.
Applsci 11 00418 g001
Figure 2. BOTDR demodulator.
Applsci 11 00418 g002
Figure 3. Arrangement scheme.
Applsci 11 00418 g003
Figure 4. Sensor installed in the field.
Applsci 11 00418 g004
Figure 5. Strain with distance of optical fiber sensor. (① is the data of the first collection; ② is the data of the second collection; ③ is the data of the third collection; ④ is the data of the fourth collection).
Applsci 11 00418 g005
Figure 6. Result of the data processed of optical fiber sensor.
Applsci 11 00418 g006aApplsci 11 00418 g006b
Figure 7. Strain curve of fiber sensor of one side of the pile.
Applsci 11 00418 g007
Figure 8. Average of strain variation curve of fiber sensor.
Applsci 11 00418 g008
Figure 9. The last test tested the strain with the calculated free strain.
Applsci 11 00418 g009
Table 1. Physical and mechanical properties of soil.
Soil Layer
Numbering
Soil NameThickness (m)Density
ρ (g/cm3)
Elastic Modulus
E (MPa)
Cohesion
C (kPa)
Internal Friction Angle
φ (°)
Plain fill3.551.9018.530.924.6
Clay2.581.9738.546.616.6
Silty clay2.891.8929.531.121.6
Silt3.451.8841.06.226.8
Silty sand4.911.9343.03.829.4
Silty clay6.441.8923.030.920.4
⑦-1Silty clay3.081.8821.53019.7
⑦-2Silty clay and silt interbed3.551.9141.03.928.2
Silty sand1.9342.03.829.4
Table 2. Parameters of acquisition instrument.
Project NameParameter SettingsProject NameParameter Settings
Range0.5 kmPulse Width 10 ns
Resolution Ratio0.05 mStarting Frequency10.700 GHz
CS0.0500 MHz/μεStop Frequency11.200 GHz
fB010.800 GHzFrequency Space 5 MHz
Refractive Index1.4650Data Points10,240
Table 3. Measurement interval and ambient temperature
Serial NumberMeasurement IntervalAmbient TemperatureNote
0 h23 °CMeasure after concrete pouring
24 h20 °C
48 h19 °C
72 h21 °C
Table 4. Characteristic table of common wavelet basis function.
Base Function TypedbNHaarBiorNr. Nd
OrthogonalityYesYesNo
Tight branchYesYesYes
SymmetryWeak symmetryApproximate symmetricalYes
Support width2N-112Nr + 1
2Nd + 1
Lost momentN1Nr
Publisher’s Note: MDPI stays neutral with regard to jurisdictional claims in published maps and institutional affiliations.

