Article

Smart Sensing of PSC Girders Using a PC Strand with a Built-in Optical Fiber Sensor

1
Department of Infrastructure Safety Research, Korea Institute of Civil Engineering and Building Technology, Goyang 10223, Korea
2
Department of Civil Engineering, Inha University, Incheon 22212, Korea
3
R and D Center, Towoong E and C, Seoul 06222, Korea
*
Author to whom correspondence should be addressed.
These authors contributed equally to this work.
Appl. Sci. 2021, 11(1), 359; https://doi.org/10.3390/app11010359
Submission received: 13 December 2020 / Revised: 23 December 2020 / Accepted: 24 December 2020 / Published: 1 January 2021
(This article belongs to the Section Civil Engineering)

Abstract

:
This paper presents a multi-functional strand capable of introducing prestressing force in prestressed concrete (PSC) girders and sensing their static and dynamic behavior as well. This innovative strand is developed by replacing the core steel wire of the strand used in PSC structures with a carbon fiber-reinforced polymer (CFRP) wire with a built-in optical Fiber Bragg Grating (FBG) sensor. A full-scale girder specimen was fabricated by applying this multi-function strand to check the possibility of tracking the change of prestressing force at each construction stage. Moreover, dynamic data could be secured during dynamic loading tests without installing accelerometers and made it possible to obtain the natural frequencies of the structure. The results verified the capability to effectively manage the prestressing force in the PSC bridge structure by applying the PC strand with a built-in optical sensor known for its outstanding practicability and durability.

1. Introduction

1.1. PC Strand with Built-in Optical Sensor

The tendon is a critical member introducing prestressing force in concrete structures to improve its deflection and crack characteristics. However, the prestressing force may reduce when the strands in the tendon experience corrosion because of a variety of reasons and lead to significant loss of the structural performance, which may even result in the collapse of the structure if not treated in due time. Figure 1 presents examples of bridges using PSC (prestressed concrete) rods and strands that have recently collapsed [1,2]. Managing the prestressing force is thus primordial to prevent such accidents.
The prestressing force in PSC structures experience changes due to diverse causes. However, there are very few technologies enabling monitoring of prestressing force in the long-term since its introduction is noteworthy. Some examples considered the attachment of electrical resistance gages to the strand itself or the installation of load cells at the anchor of the tendon, but these solutions necessitate a connecting wire for each of the sensors and may face the problem of the increasing resistance of the connecting wire if the distance to the measuring point becomes longer, which in turn will generate problems in data processing. In addition, long-term durability may also be problematic if the sensors are exposed to the external environment. Accordingly, research on sensor-type PC strands is being led in numerous countries to overcome such problems and achieve a strand that can play the role of sensor, apart from its natural application as a member introducing prestressing force in the structure [3,4,5]. Figure 2 shows some examples of sensor-type PC strands that have been developed.
Among the sensor-type strands shown in Figure 2, the one developed by Kim et al. [3] has difficulty in fabrication because it involves inserting the optical fiber inside a hollow steel bar and renders the ensemble monolithic by using a resin, which results in early rupture of the optical fiber. The strand by Zhou et al. [4] made use of a FRP (fiber reinforced polymer) rod integrating both optical fiber and glass fiber, which provided a system developing low tensile strength and inappropriate as a PC strand because of the mechanical properties of glass fibers, like relaxation and creep. The strand by Imai et al. [5] installed an optical fiber along the helical gap between the wires composing the strand, which could not measure exactly the prestressing force developed in the longitudinal direction of the strand. Furthermore, when bundles of strands are used simultaneously, there is the risk of damaging the sensor because of the interference with the neighboring strands. Apart from these examples, Zhang et al. [6] and Lee et al. [7] led studies on the accuracy and transfer length using the strands developed by Zhou et al. [4] and Kim et al. [3]. As a sensing technology for evaluating the behavior of structures, optical fiber sensors show many possibilities. Zhang et al. [8] presented an optical fiber twist sensor based on surface plasmon resonance excitation, which showed high sensitivity in both gaseous and liquid media. Also, Hiba and Branko [9] and Urquijo et al. [10] showed the possibility of long-term monitoring.
The optical sensor PC (OSPC) strand, developed by the Korean Institute of Civil Engineering and Building Technology (KICT) in 2013, adopts the method of measuring the prestressing force by a CFRP (carbon fiber reinforced polymer) core wire incorporating an optical (FBG) sensor (Figure 3). Owing to the high strength and stiffness of CFRP and its remarkable relaxation, creep, and fatigue characteristics, the OSPC strand has mechanical and durable performances similar to those of a conventional steel strand. In addition, the reliability of the prestressing force measured by the OSPC strand was verified by comparison with that measured by a traditional electrical resistance strain gauge through a series of tensile tests by Kim et al. [11,12].

1.2. Precast Segmental PSC Girder for Railway Bridge

On the other hand, previous studies [13] have presented a new-type PSC I-girder and evaluated its dynamic performance for railway bridge applications in Korea. This new-type PSC I-girder improved competitiveness with a longer span length and thinner deck depth by applying a bulb-T-shaped half-deck (BH girder). Figure 4 shows the shape and dimensions of a full-scale BH girder bridge prototype for testing. This study fabricated a full-scale PSC I-girder specimen of previous studies [13]. This specimen was fabricated in three precast segments, prestressed since its assemblage, and was completed by placing the deck in concrete. Its construction involved a change of the prestressing force at each stage. Moreover, after the completion of the bridge, a short-term variation of the prestressing force occurs due to the loads and vibrations generated during the crossing of trains, as well as a long-term variation of the prestressing force is caused by seasonal changes. Any mismanagement of such changes in the prestressing force would result in the collapse of the bridge, as shown in Figure 1. Accordingly, the present study intends to check the viability and measure the performance of the developed OSPC strand in tracking the change of the prestressing force in a PSC-I girder bridge.

2. Fabrication and Test

2.1. Fabrication of Full-Scale BH Girder Bridge and Installation of OSPC Strand

Figure 3 shows the conceptual drawing and a photograph of the manufactured OSPC strand. Since the OSPC strand had shapes and dimensions identical to a conventional steel strand, the same anchoring device could be used. In addition, considering that the OSPC strand exhibits performance equivalent or superior to that of the conventional steel strand, the OSPC strand offers the advantage of being able to play both roles of sensor and reinforcing member.
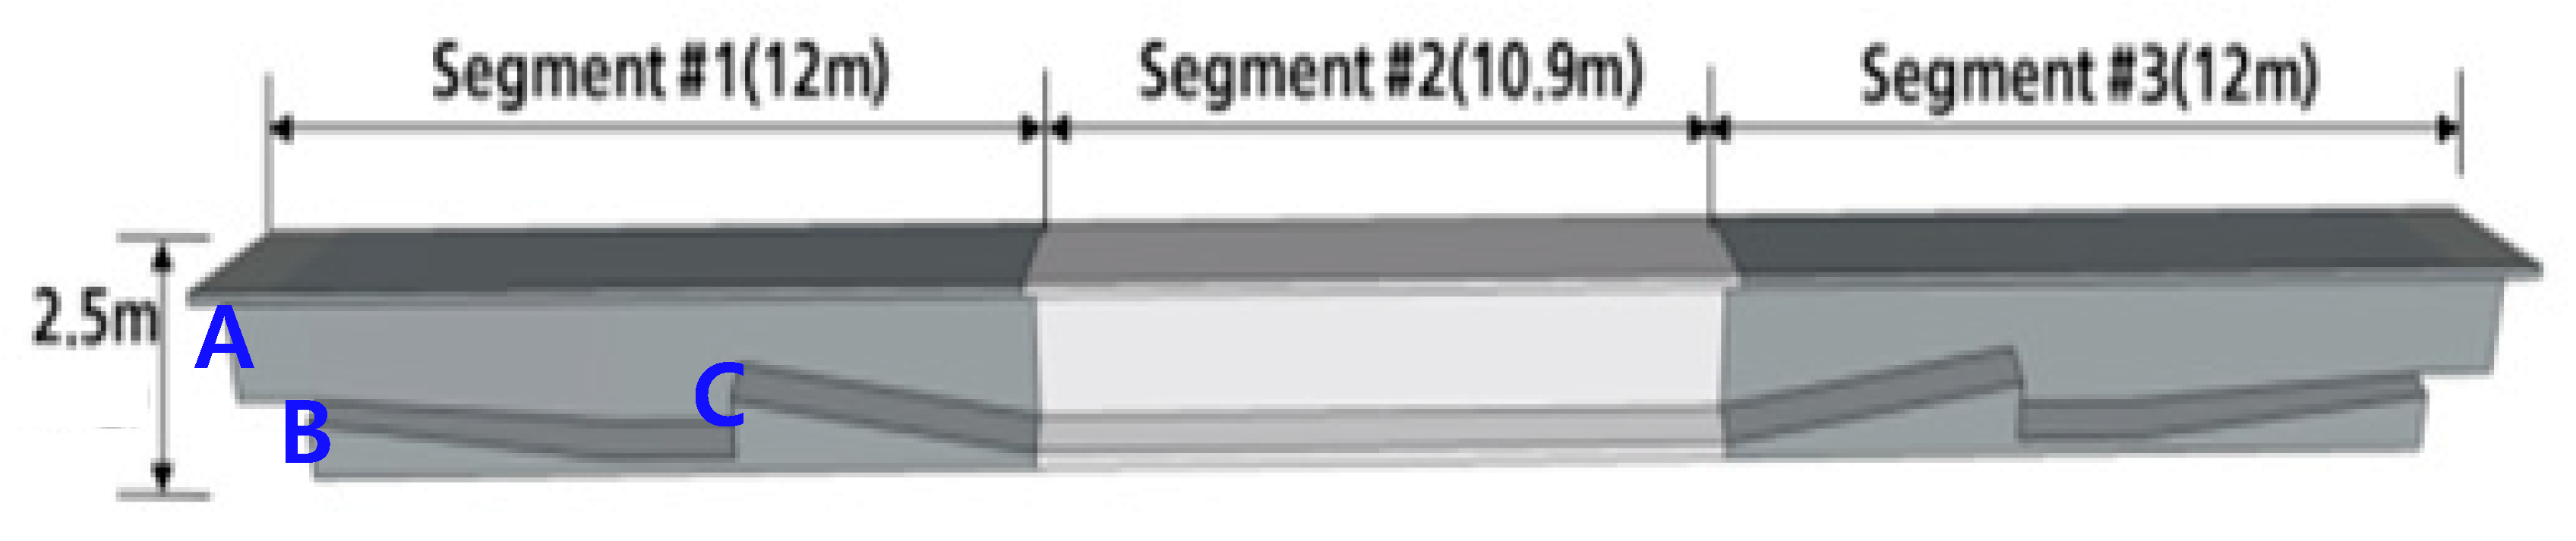
The full-scale BH girder bridge prototype constructed for the test had a length of 35 m and a deck depth of 2.5 m (Figure 4). The anchorages were disposed at the top and bottom of the cross-section and near the connections between the segments. To observe the overall state of the prestressing force in the bridge, one OSPC strand was installed at each anchorage. Considering the profile of the tendon involving straight and curved parts, each sensor was set to have three to seven sensing points. Figure 4 depicts the shape and dimensions of the BH girder bridge applying the OSPC strand and indicates the locations of the anchors (A, B, C). Figure 5 shows the position of the OSPC strand in the cross-section for each of the anchors, A, B, and C, of Figure 4, as well as the numbering of the tendons. Table 1 provides the details of the tendons one, two, three, and four, like the profile and length, the number of sensing points, and the prestressing method.
Table 2 shows the specification of the FBG sensor and measurement equipment used for manufacturing the OSPC. The FBG sensor used in OSPC fabrication distinguished the wavelength intervals so that the wavelengths did not overlap when a tension force was applied. Data was acquired once per second using an interrogator, and then the change in wavelength was converted to strain using the wavelength-strain formula from Equation (1)
Δ λ λ B = ( α + ξ ) Δ T + ( 1 P ε ) ε m
where λ B is the reference wavelength before tension force is introduced, and Δ λ is the change in wavelength from the measurement. ε m is the elastic strain. P ε is effective photoelastic constant for the fiber and generally 0.22 is applied. Although the FBG sensor was sensitive to temperature, the temperature change was not considered. This is because the tension force as introduced for a short time, and the wavelength change by the tension force was quite large [14]. In this paper, after converting the measured wavelength into strain, the tension force was estimated by applying the elastic modulus (195 GPa) from the basic tensile test of OSPC and the cross-sectional area.
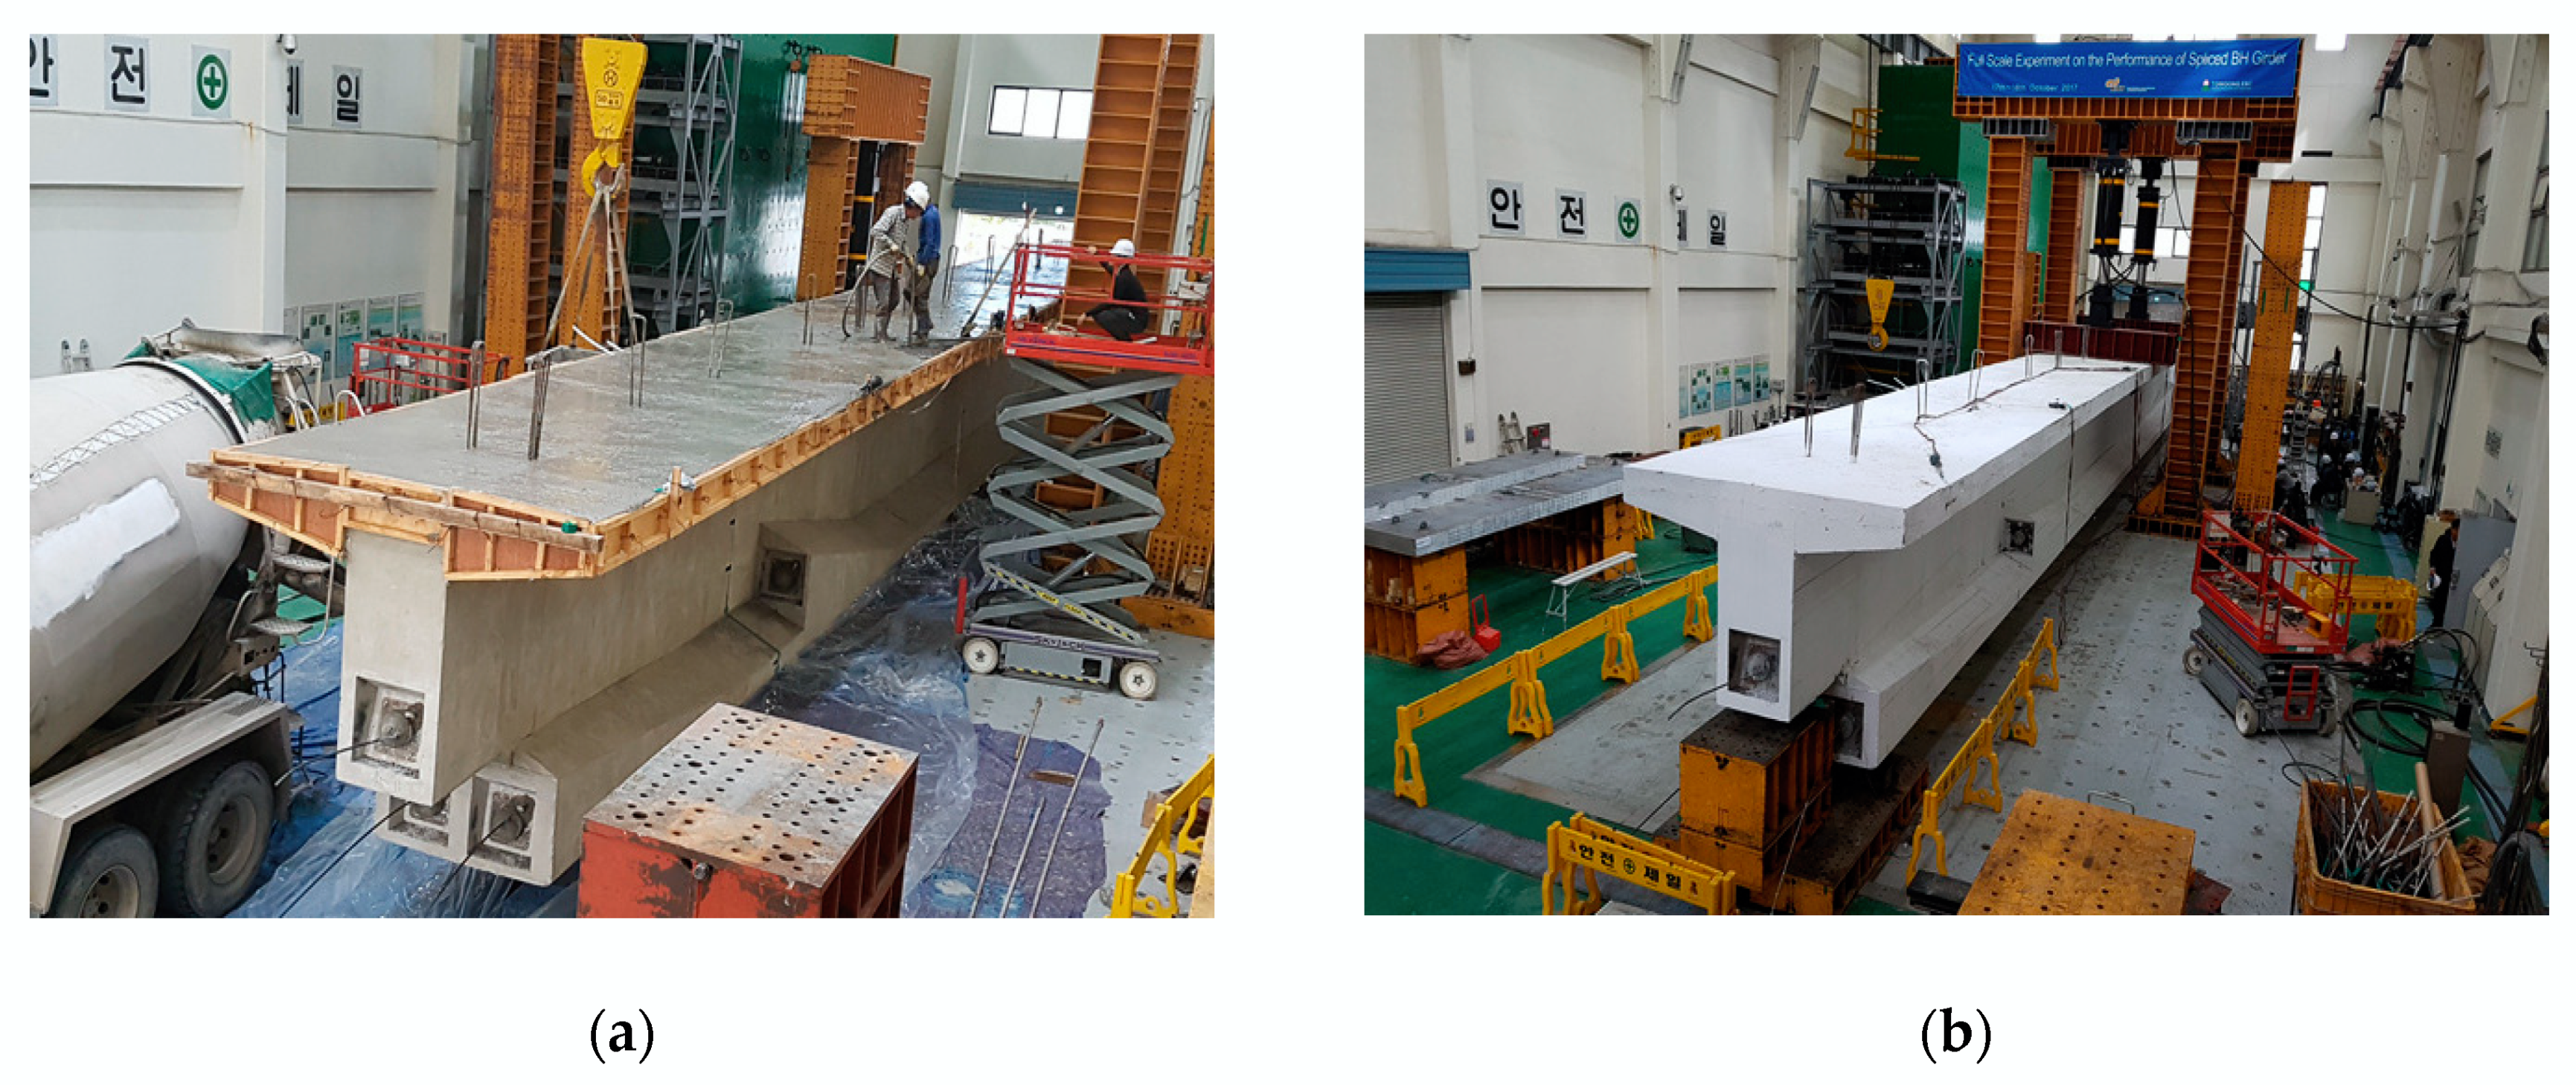
Figure 6 shows pictures of the fabricated full-scale BH girder bridge prototype installed with the OSPC strand. Figure 7 presents the tensioning process of the girder bridge and the measurement of the prestressing force during the process.

2.2. Prestressing of Full-Scale BH Girder Bridge Prototype

The prestressing of the BH girder bridge was executed by tensioning the tendons sequentially with respect to their number, as given in Figure 5 and Table 1. The process was performed in six steps by introducing prestress in tendons one to three of up to 3200 kN and, then, tensioning tendon four up to 2100 kN. The calculation provided an average prestressing force of 177.8 kN in the strands of tendons one to three and of 175.0 kN in the strands of tendon four. The prestressing force measured by the OSPC strand installed in each tendon was 173.1 kN for tendon one, 164.0 kN for tendon two, 165.7 kN for tendon three, and 168.5 kN for tendon four. These values were slightly lower than the target prestressing force and about 92.3% to 97.4% to the target values. However, if prestressing is conducted simultaneously using multiple hydraulic jacks for several strands, the resulting prestressing force for each individual strand would naturally exhibit a slight difference. This situation was reported in 2005 by Chandoga and Jaroševič [15] through actual measurements. Moreover, Cho et al. [16] analyzed the distribution of the prestressing force in the strands of the tendon and revealed that this distribution was normal with a variation of about ±4% around the mean value. Accordingly, even if the prestressing force measured by the OSPC strand is slightly lower than the target value, the measurement can be assumed to be correct.
Figure 8 plots the change of the prestressing force measured in tendon one by the OPSC strand at each tensioning step. It could be observed that the prestressing force presents different distributions along the longitudinal direction. It is well known that the prestressing force generally exhibits its largest value at the end that is tensioned (live end), but Figure 8 revealed that one sensor measured a slightly lower value near the hydraulic jack when the maximum tensioning force was attained. This discrepancy can be credited to the helical arrangement of the strands inside the tendon.
Besides, the loss of prestressing occurring during the removal of the hydraulic jack after the tensioning process could also be measured. This loss is called the immediate loss and is arranged per anchor in Table 2. Assuming a loss of 5 mm due to the slip of the wedge in the anchor, the immediate loss that may occur in the anchors runs between 2.3% and 3.9%. However, the values of the immediate loss in Table 2 fell slightly beyond this range. This greater immediate loss can be explained by some imprecision in the relative arrangement of the wedge and strands and in the fixation of the wedge of the hydraulic jack. Nevertheless, these higher values for the loss are acceptable considering that the loss of the prestress force generally ranged between 15% and 30% by accounting for the immediate loss as well as the loss according to time.
In addition, the anchor set length that is the distance over which the difference in the prestressing force due to the slip of the wedge at the removal of the hydraulic jack (step-7) and the maximum tensioning force (step-6) had an effect that was seen to be longer than 20 m in Figure 8. This length was significantly longer than the value of 13.9 m obtained by calculation for the anchor set length. This calculated value is usually adopted in studies related to the anchor set length because of the difficulty to acquire actual data all along the tendon in the PSC structure. Note that KICT is currently developing an OSPC strand with distributed sensing to improve the present OSPC strand with a finite number of sensing points. The future application of this new OSPC strand to PSC structures will make it possible to compute the anchor set length more accurately.
The so-prestressed BH girder bridge prototype was finally completed by injecting grout and placing the top concrete. The performance of the completed full-scale BH girder bridge was verified via static test through four-point loading and dynamic test using an actuator. Figure 9 presents the placing of top concrete and the completed bridge in place for testing.

2.3. Test and Measurement of Full-Scale BH Girder Bridge

For the measurement of the dynamic properties, accelerometers and displacement sensors were disposed vertically at the center on the bottom of each segment. As presented in Table 3, the values measured by the FBG sensor at mid-length of the OSPC strand in tendon one were used. Consequently, the accelerometers measured the vertical vibration, and the OSPC strand measured the transversal vibration. Figure 10 illustrates an installed accelerometer and the actuators used to load the bridge.
The forced vibration test using the actuators applied loading with gradual increase of the exciting frequency from 1 Hz to 5 Hz, and the corresponding responses of the bridge were observed. The observation revealed that the largest amplitude of vibration occurred around 4 Hz. As shown in Figure 11, resonance happened between 4.2 Hz and 4.3 Hz in both data from the accelerometers and FBG sensor.
In order to analyze the frequency contents of the vibration test data from the accelerometers and FBG sensor, the Welch method [17] was adopted to estimate the averaged periodograms of the overlapping segments in the signals, and these averaged periodograms were used to perform the analysis of the two different data in the frequency domain. Since the resonant frequency occurred below 30 Hz for the bridge, the sampling frequency was set to 100 Hz to secure a sufficient margin. The frequency band computed by the Welch method fell within the Nyquist frequency between 0 and 50 Hz. The Hanning function was used as the window function needed to conduct the segmental averaging of Welch and minimize the leakage effect. The window function involved a total of 4095 data, and the segments were generated by moving the window according to the time sequence. Fast Fourier transform (FFT) was executed for each segment to compute the power in the frequency domain, which was averaged to provide the final value. Figure 12 plots the natural frequencies of the accelerometer data and FBG sensor data obtained by this method. The computed natural frequency of the first mode appears to be identical for both types of data. This result indicates that the FBG sensor embedded in the OSPC strand that was arranged transversally in the bridge could accurately measure the acceleration of the structure.
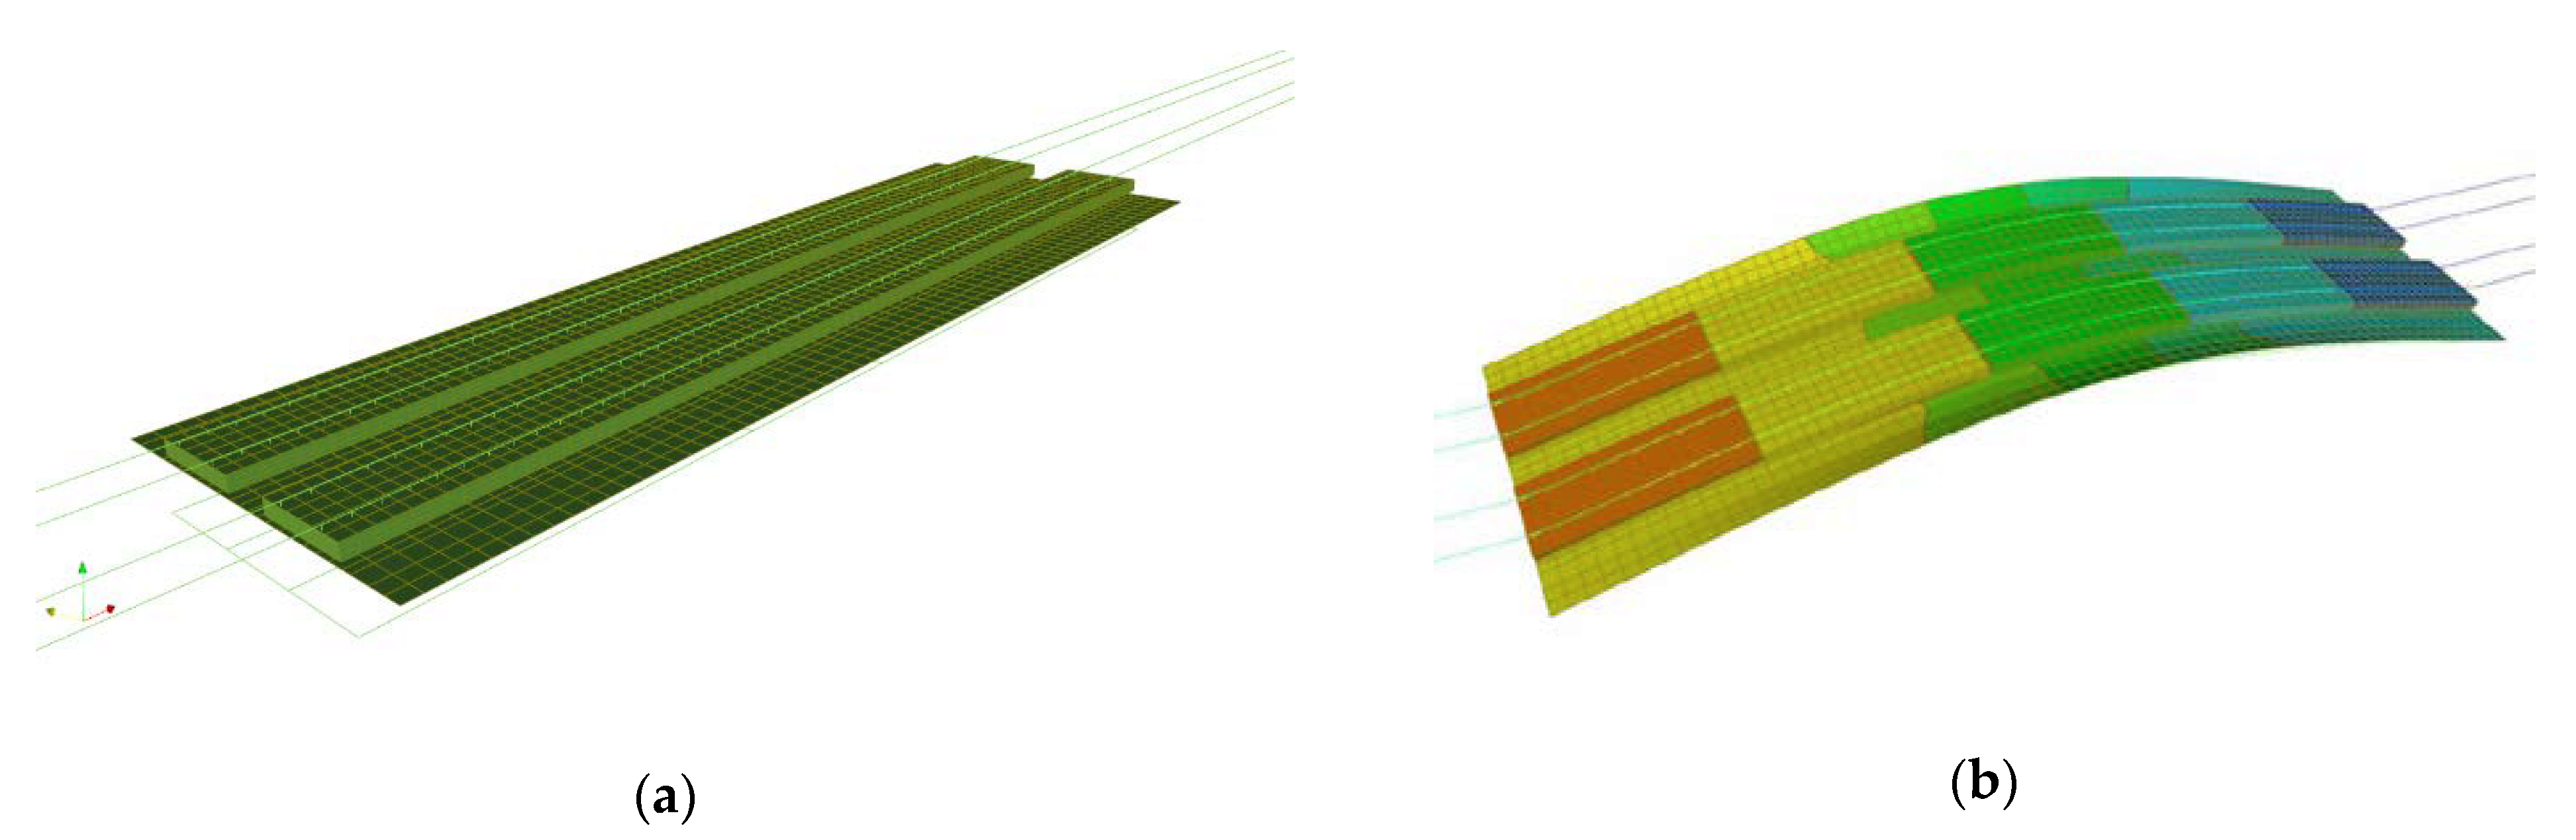
The dynamic analysis of the bridge structure was performed. To that goal, a three-dimensional model was established and reflected the track structure to achieve precise analysis. Two-node beam elements were used for the girder and cross beams, and four-node shell elements were adopted for the deck. The natural frequency analysis was executed using an in-house program developed at KICT in 2008. Figure 13 depicts the analytic model and the first-mode shape of the structure [13].
From the analysis, a natural frequency of 4.2783 Hz was computed for the first mode, which is slightly smaller by about 0.1279 Hz compared to the frequency of 4.1504 Hz obtained from the test. This small difference can be credited to the boundary conditions, which assumed simple supports (hinge and roller) in the analysis, whereas the prototype was supported actually by two rollers at its ends. Moreover, some differences in the material properties adopted in the analysis might also possibly have caused this discrepancy.
The data above are those obtained by vibrating the structure sufficiently using the actuator and allowed clear identification of the natural frequency. In general, data related to the longitudinal direction along the girder in bridge structures present poor sensitivity compared to the vertical acceleration response of the bridge, which made them improper for identifying the natural frequency. However, Lee et al. [18] determined the impact factor of an actual in-service railway bridge structure based upon data measured by electrical resistance gages installed longitudinally in the girder near a FBG sensor during the crossing of train convoys. Moreover, prior to the test presented in this study, the OSPC strand was already installed inside the girder of a road bridge with a span length of 60 m and in operation. Figure 14 shows the layout and a photograph of this bridge together with its natural frequencies extracted from dynamic acceleration data acquired during the crossing of a truck.
Several months after the completion of the bridge shown in Figure 14, the wavelength variation in the structure was measured by the OSPC strand under the crossing of a truck. Figure 15 plots the dynamic data obtained during the measurement and the identified natural frequency.
The wavelength variation plotted in Figure 15a was obtained by removing the Direct Current (DC) content from the raw data and applying a high pass filter. The natural frequency in Figure 15b was computed by FFT. The natural frequency obtained from the OSPC data differed slightly from that of the acceleration response in Figure 14c, but this difference was probably due to the effects of the time elapsed between the two measurements like temperature and change in the state of the bridge in operation.
In view of such results, installing semi-permanently the OSPC strand in the railway BH girder bridge appears to offer a fair and sufficient solution enabling to observe and evaluate the change in the prestressing force as well as the natural frequencies of the structure without other accelerometers nor electrical resistance gages. These features will allow effective maintenance since it is possible to detect any abnormal change of the structure.
Furthermore, the flexural performance of the BH girder bridge was evaluated through the four-point bending test, as shown in Figure 16.
Figure 17 shows the comparison of the strain measured during the four-point bending test by the optical sensor located at the center of tendon one among the OSPC strands and by the electrical resistance strain gage bonded on the closest reinforcement in the cross-section. Linearly varying strains were measured by both types of sensor at early loading until the plastic zone. Beyond a value of about 3600 με, the strain provided by the electric resistance gage showed a steep increase, which indicated yielding of the steel reinforcement arranged at the bottom of the girder bridge. On the other hand, the OSPC strand continued to behave normally and measure the strain even after the yield of the reinforcement and until the final loading stage at approximately 6000 kN. A deflection of about 350 mm was finally observed at mid-span.
Figure 18 shows a plot of the change of the prestressing force measured by the OSPC strand in each tendon of the BH girder bridge at each stage from the start of tensioning during the fabrication of the specimen to the end of the bending test. The prestressing force was seen to undergo change since early prestress, and the elastic shortening could be clearly distinguished by the OSPC strand in the next prestressing stage. The partial increase of the prestressing force caused by the increase of the load following the placing of the top deck could also be observed. The large changes in the prestressing force due to the four-point bending are also clearly indicated in the graphs. Consequently, the OSPC strand could reliably measure the change of the prestressing force at major locations of the structure from construction to failure.
Considering its material characteristics, the optical sensor presents the disadvantage of being difficult to install without specific protection in civil structures for which steel or concrete are usually as construction materials. However, the embedment of the optical sensor in the strand endows it with semi-permanent durability in such an environment and will allow accurately measuring the change in the prestressing force all along the lifetime of the structure. For civil structures, such a possibility enables the OSPC strand to provide reliable and accurate data compared to the conventional electrical resistance gage and will allow more efficient maintenance of the structure.

3. Conclusions

The present study developed a OSPC strand, a strand incorporating an optical sensor as a core wire, enabling the effective management of the prestressing force in PSC structures. The so-developed OSPC strand was installed in a full-scale precast segmental BH girder bridge that is currently under development to be the railway bridge of the next generation, and the possibility to manage the prestressing force was verified. The prestressing force could be accurately measured longitudinally along the girder since the fabrication of the full-scale prototype as well as during the static and dynamic loading tests of the completed structure. The natural frequency of the prototype could be computed with values in agreement with that obtained from accelerometer data measured during the dynamic test. This allowed the identification of any anomalies in the structure by tracking the change of the natural frequency caused by internal or external variations and damage that might occur throughout the lifetime of the bridge. The OSPC strand made it also possible to acquire reliably prestressing force data from the loading test to the failure of the structure. The future application of the OSPC strand to prestressed structures will provide superior durability compared to the conventional electrical resistance gauge owing to the use of the built-in optical sensor. Moreover, the protection of the fragile sensor optical sensor by a CFRP rod improved its resistance and handling for application to real structures. Consequently, the OSPC strand developed in this study offers an attractive alternative for achieving effective maintenance of prestressed civil structures.

Author Contributions

Conceptualization, S.T.K., Y.-H.P., H.Y. and S.S.; dynamic analysis, S.-S.J.; manufacture of specimen, S.-M.Y.; writing—original draft preparation, S.T.K. All authors have read and agreed to the published version of the manuscript.

Funding

This research was supported by a grant from a Strategic Research Project (Project No. 20200040-001) funded by the Korean Institute of Civil Engineering and Building Technology.

Institutional Review Board Statement

Not applicable.

Informed Consent Statement

Not applicable.

Data Availability Statement

Data sharing is not applicable to this article.

Conflicts of Interest

The authors declare no conflict of interest.

References

  1. Taiwan News. Rebuilding Collapsed Taiwan Bridge Estimated to Cost NT$520 Million. Available online: https://www.taiwannews.com.tw/en/news/3792431 (accessed on 20 October 2020).
  2. The International Information Center for Geotechnical Engineers. New Design for Genoa’s Collapsed Morandi Bridge. Available online: https://www.geoengineer.org/news/new-design-for-genoa-collapsed-morandi-bridge (accessed on 20 October 2020).
  3. Kim, J.M.; Kim, H.W.; Park, Y.H.; Yang, I.H.; Kim, Y.S. FBG sensors encapsulated into 7-wire steel strand for tension monitoring of a prestressing tendon. Adv. Struct. Eng. 2012, 15, 907–918. [Google Scholar] [CrossRef]
  4. Zhou, Z.; He, J.; Chen, G.; Ou, J. A smart steel strand for the evaluation of prestress loss distribution in post-tensioned concrete structures. J. Intell. Mater. Syst. Struct. 2009, 20, 1901–1912. [Google Scholar] [CrossRef]
  5. Imai, M.; Okubo, K.; Sogabe, N.; Tobe, H.; Oikawa, M.; Nakaue, S.; Hayakawa, M. Stress distribution monitoring of ground anchor using optical fiber-embedded strand. In Proceedings of the SPIE 10970, Sensors and Smart Structures Technologies for Civil, Mechanical, and Aerospace Systems 2019, Denver, CO, USA, 27 March 2019. [Google Scholar]
  6. Zhang, P.; Wu, Q.; Deng, N.; Wei, Y.; Dong, J. Development and test study of smart OFBG strand cable. Archit. Technol. 2009, 2, 155–157. [Google Scholar]
  7. Lee, S.C.; Choi, S.Y.; Shin, K.J.; Kim, J.M.; Lee, H.W. Measurement of transfer length for a seven-wire strand with FBG sensors. J. Comput. Struct. Eng. Inst. Korea 2015, 28, 707–714. [Google Scholar] [CrossRef]
  8. Zhang, X.J.; Chen, J.; Álvaro, G.V.; Liu, F. Twist sensor based on surface plasmon resonance excitation using two spectral combs in one tilted fiber Bragg grating: Publisher’s note. J. Opt. Soc. Am. B 2019, 36, 1176–1182. [Google Scholar] [CrossRef]
  9. Abdel-Jaber, H.; Glisic, B. Monitoring of long-term prestress losses in prestressed concrete structures using fiber optic sensors. Struct. Health Monit. 2018, 1, 254–269. [Google Scholar] [CrossRef]
  10. Robles Urquijo, I.; Quintela Incera, A.; Van Vaerenbergh, S.; Inaudi, D.; Higuera, L.; Miguel, J. Risks and Opportunities of Using Fibre Optic Sensors for Long Term Infrastructure Health Monitoring Systems in an 18 Year Old Installation. In International Conference on Smart Infrastructure and Construction (ICSIC); ICE Publishing: Cambridge, UK; London, UK, 2019; pp. 623–630. [Google Scholar]
  11. Kim, S.T.; Park, Y.H.; Park, S.Y.; Cho, J.R.; Cho, K. Performance evaluation on core wire of smart strand for PSC structures. In Proceedings of the EWSHM—7th European Workshop on Structural Health Monitoring, IFFSTTAR, Inria, Université de Nantes, Nantes, France, 8–11 July 2014. [Google Scholar]
  12. Kim, S.T.; Park, Y.H.; Park, S.Y.; Cho, K.; Cho, J.R. A sensor-type PC strand with an embedded FBG sensor for monitoring prestress forces. Sensors 2015, 15, 1060–1070. [Google Scholar] [CrossRef] [PubMed] [Green Version]
  13. Yoon, H.; Kim, S.T.; Chin, W.J.; Kim, Y.J.; Cho, J.-R. Dynamic Performance of a New-Type PSC I-girder for Railway Bridge Application. Appl. Sci. 2020, 10, 8728. [Google Scholar] [CrossRef]
  14. Casas, J.R.; Cruz, P.J. Fiber optic sensors for bridge monitoring. J. Bridge Eng. 2003, 8, 362–373. [Google Scholar] [CrossRef] [Green Version]
  15. Chandoga, M.; Jaroševič, A. Rehabilitation and monitored prestressing of corroded tendons. In Proceedings of the Fib Symposium: Structural Concrete and Time, La Plata, Argentina, 28–30 September 2005; pp. 1–8. [Google Scholar]
  16. Cho, K.; Cho, J.R.; Kim, S.T.; Park, S.Y.; Kim, Y.J.; Park, Y.H. Estimation of prestress force distribution in multi-strand system of prestressed concrete structures using field data measured by electromagnetic sensor. Sensors 2016, 16, 1317. [Google Scholar] [CrossRef] [PubMed] [Green Version]
  17. Wikipedia. Welch Method. Available online: https://en.wikipedia.org/wiki/Welch%27s_method (accessed on 20 October 2020).
  18. Lee, K.W.; Jung, S.H.; Park, E.Y. Railway structure health monitoring using innovative sensing technologies. In Proceedings of the 2018 Conference of the Korean Society for Noise and Vibration Engineering, Korean, Hoengseong, Korea, 17–18 April 2008; pp. 762–767. [Google Scholar]
Figure 1. Examples of prestressed concrete (PSC) bridge collapse: (a) Morandi bridge (Italy, 2018) [1]; (b) Nanfang’ao bridge (Taiwan, 2019) [2].
Applsci 11 00359 g001
Figure 2. Research on prestressed concrete (PC) strands with measurable prestressing force: (a) fiber Bragg grating (FBG) sensors encapsulated into seven-wire steel strand by Kim et al. [3]; (b) Smart steel strand by Zhou et al. [4]; (c) Optical fiber-embedded strand by Imai et al. [5].
Applsci 11 00359 g002
Figure 3. Optical sensor PC (OSPC) strand: (a) Conceptual drawing; (b) Actually manufactured product.
Applsci 11 00359 g003
Figure 4. Shape and dimensions of full-scale bulb-T-shaped half-deck (BH) girder bridge prototype for the test.
Applsci 11 00359 g004
Figure 5. Layout of OSPC strands: (a) At support A; (b) At Support B; (c) At central section C; (d) Overall layout and sensing points.
Applsci 11 00359 g005
Figure 6. Full-scale BH girder bridge prototype: (a) Assemblage of precast segments; (b) Installation of OSPC strands.
Applsci 11 00359 g006
Figure 7. Full-scale BH girder bridge prototype: (a) Prestressing process; (b) Measurement of prestressing force during tensioning.
Applsci 11 00359 g007
Figure 8. Variation of prestress force in tendon one of full-scale BH girder bridge prototype per tensioning step measured by OSPC strand.
Applsci 11 00359 g008
Figure 9. Full-scale BH girder bridge prototype: (a) Placing of top concrete; (b) At completion and installed for loading test.
Applsci 11 00359 g009
Figure 10. Loading test of full-scale BH girder bridge prototype: (a) Installed accelerometer; (b) Actuators.
Applsci 11 00359 g010
Figure 11. Dynamic test measurements: (a) Accelerometer data; (b) FBG data.
Applsci 11 00359 g011
Figure 12. Identified natural frequencies of the first mode using: (a) Accelerometer data; (b) FBG sensor data.
Applsci 11 00359 g012
Figure 13. Dynamic analysis: (a) Three-dimensional FE model; (b) First-mode shape of BH girder bridge prototype [13].
Applsci 11 00359 g013
Figure 14. Real bridge applying the OSPC strand: (a) Overview of bridge and layout of sensors; (b) Photograph of the completed bridge and dynamic data acquisition equipment; (c) Natural frequencies extracted from acceleration data.
Applsci 11 00359 g014aApplsci 11 00359 g014b
Figure 15. Data acquired on the road bridge in the previous test: (a) Dynamic data (wavelength variation) measured by OSPC strand; (b) Identification of natural frequency.
Applsci 11 00359 g015
Figure 16. Four-point bending test of BH girder bridge: (a) Prototype installed for the test; (b) Deflected girder bridge.
Applsci 11 00359 g016
Figure 17. Comparison of strain measured by FBG sensor and strain gage in tendon one of BH girder bridge during the four-point bending test.
Applsci 11 00359 g017
Figure 18. Change of prestressing force in BH girder bridge measured by OSPC strand: (a) Tendon one; (b) Tendon two; (c) Tendon three; (d) Tendon four.
Applsci 11 00359 g018
Table 1. Characteristics of tendons with OSPC strand.
Tendon No.ProfileNumber of Sensing PointsLength (m)Prestressing MethodRatio of OSPC Strand in Tendon
OneCurvedSeven35.0One tensioning1/17
TwoHorizontalThree32.7One tensioning1/17
ThreeHorizontalThree32.7One tensioning1/17
FourCurvedFive20.9One tensioning1/17
Table 2. Specification of FBG sensor and measurement equipment.
Tendon No.Number of Sensing PointsWavelength (nm)ReflectivityInterrogator
OneSeven1520, 1525, 1530, 1540,
1550, 1555, 1560
over 90% Applsci 11 00359 i001
TwoThree1520, 1540, 1560over 90%
ThreeThree1520, 1540, 1560over 90%
FourFive1520, 1530, 1540, 1550, 1560over 90%
Table 3. Immediate loss of prestress force per anchor.
Anchor NumberMaximum Prestress Force (kN)Prestress Force after Removal of Hydraulic Jack (kN)Loss Ratio with Respect to Maximum Prestress Force (%)
One173.1153.111.6
Two164.0153.06.7
Three157.3144.78.0
Four166.5154.27.4
Publisher’s Note: MDPI stays neutral with regard to jurisdictional claims in published maps and institutional affiliations.

