Effect of Fuel Mass Flow at the End of Injection on Cavitation and Gas Ingestion in the Nozzle

Abstract
Featured Application
Abstract
1. Introduction
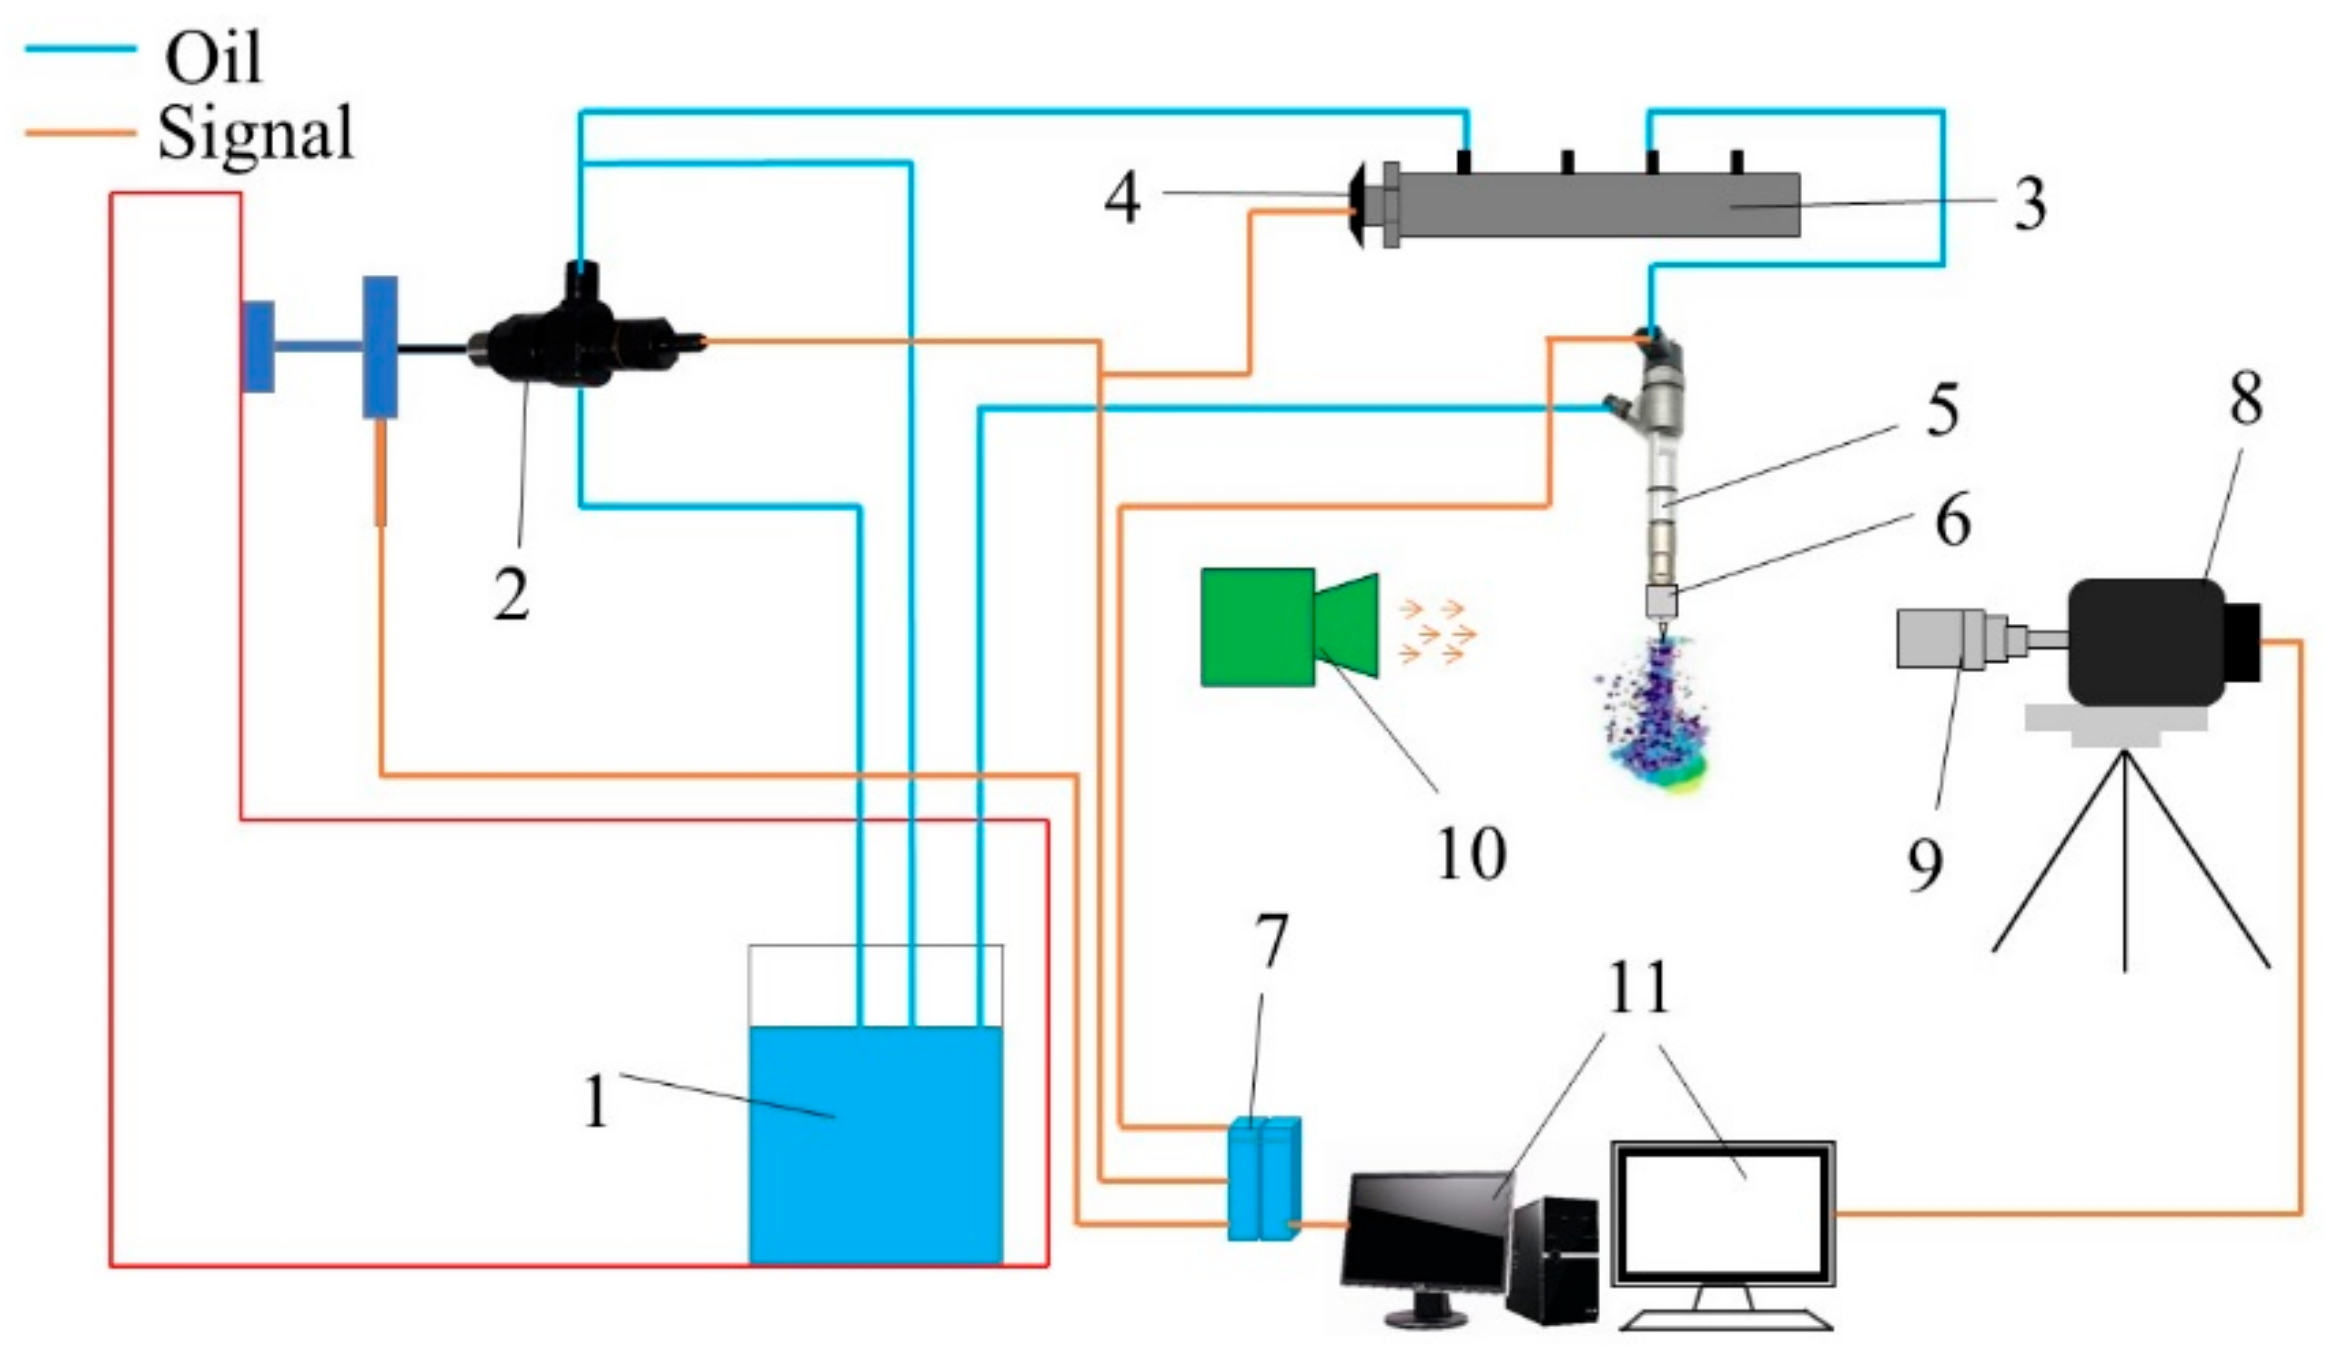
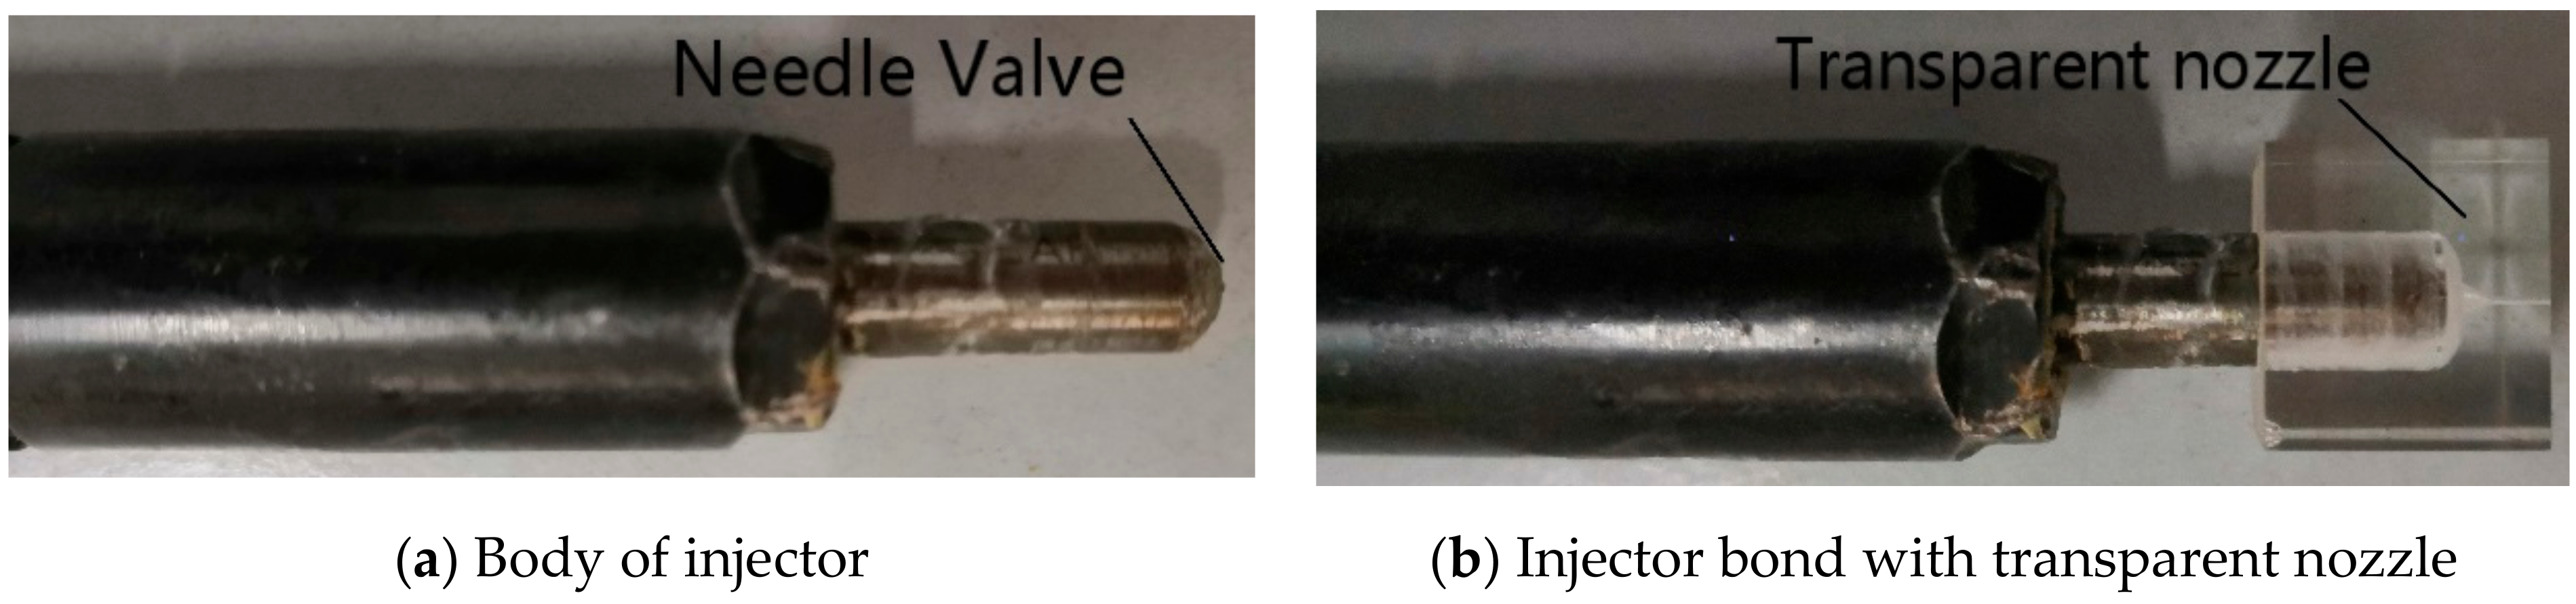
2. Experiment
3. Mathematical Model
3.1. Governing Equations
3.2. Cavitation Model
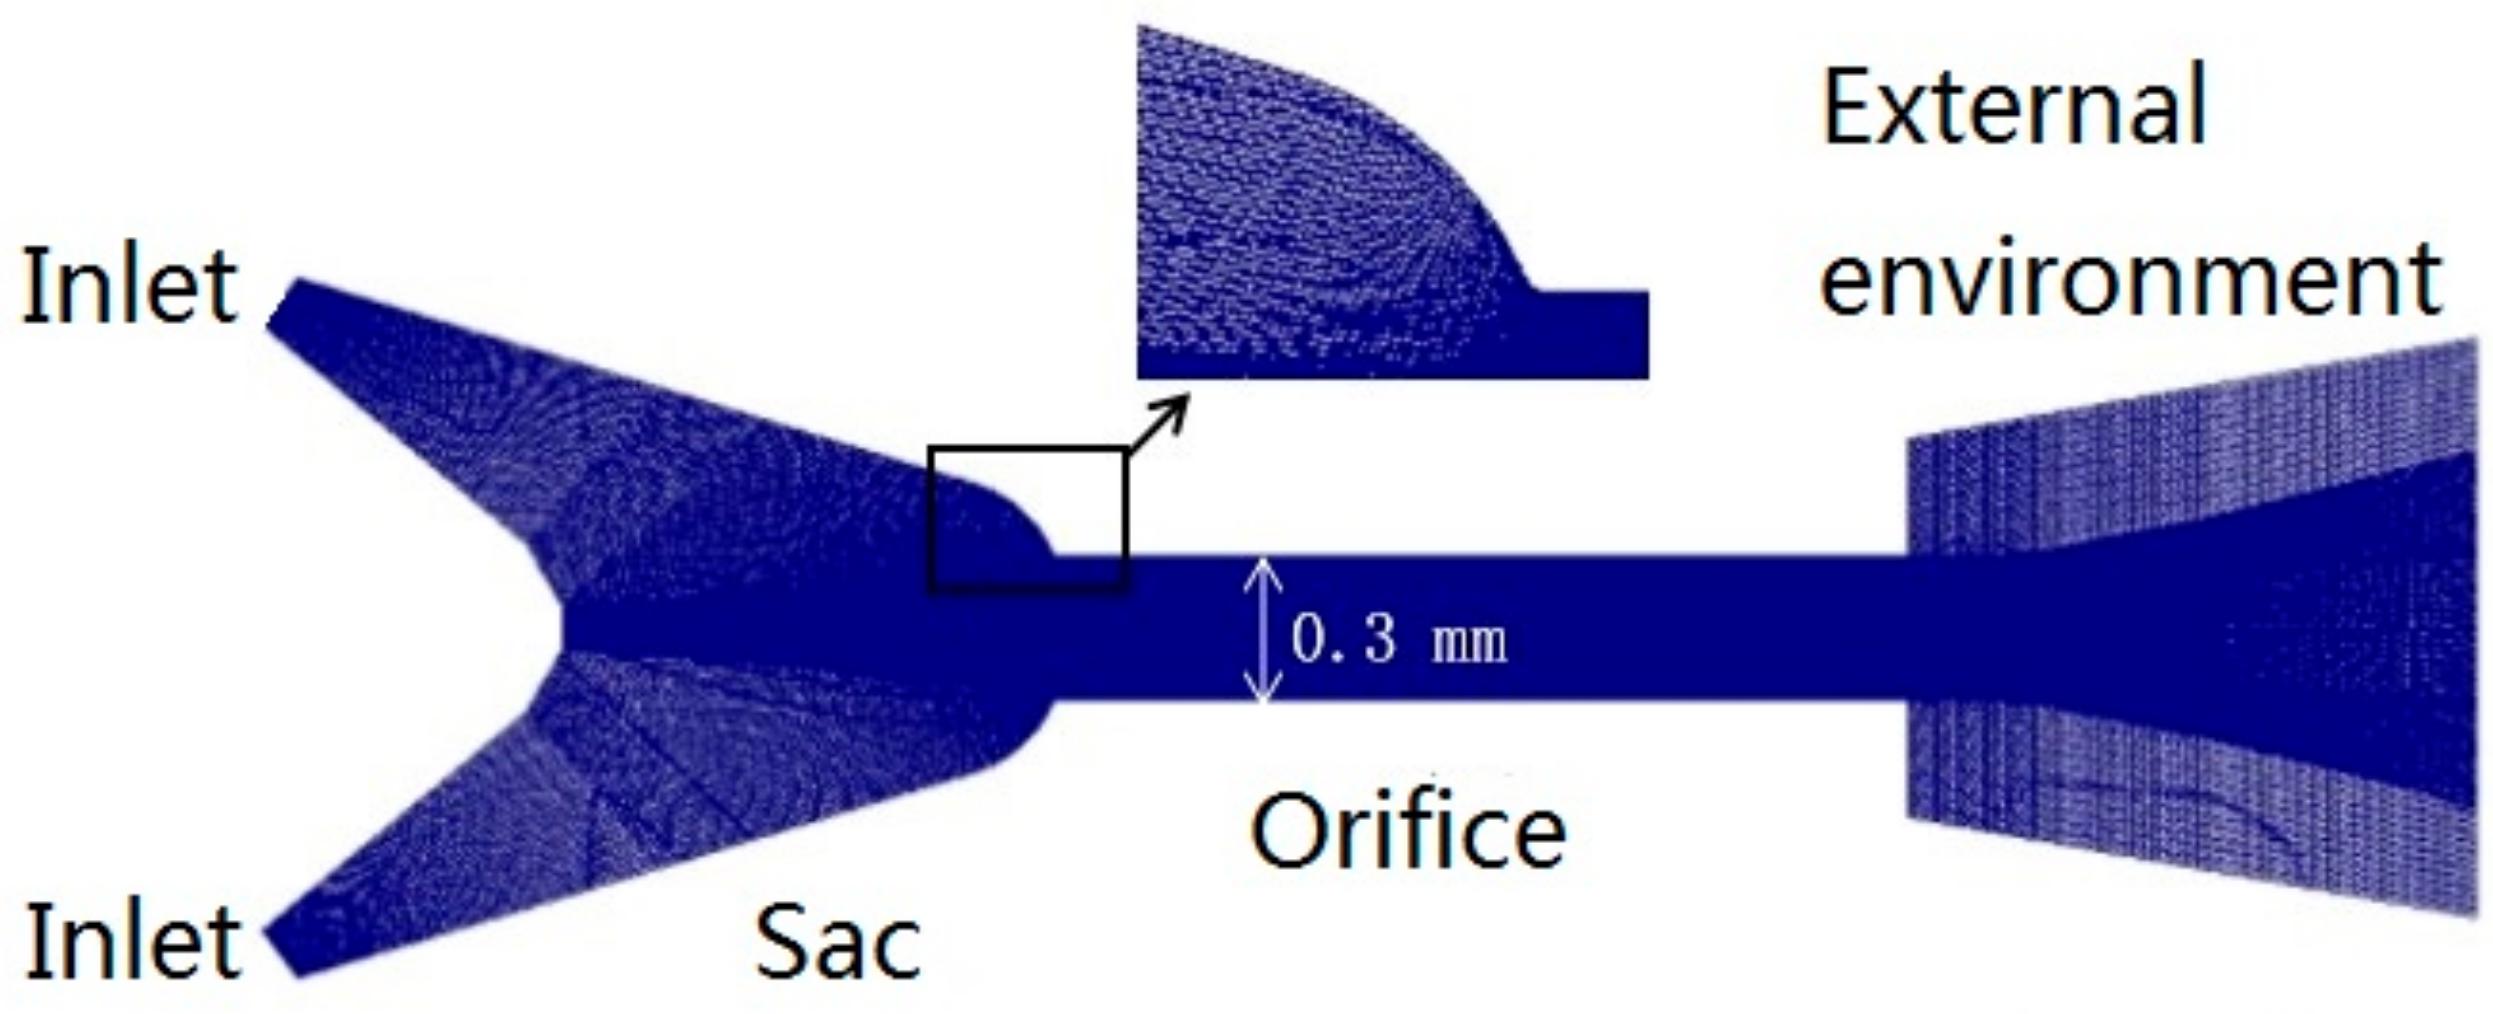
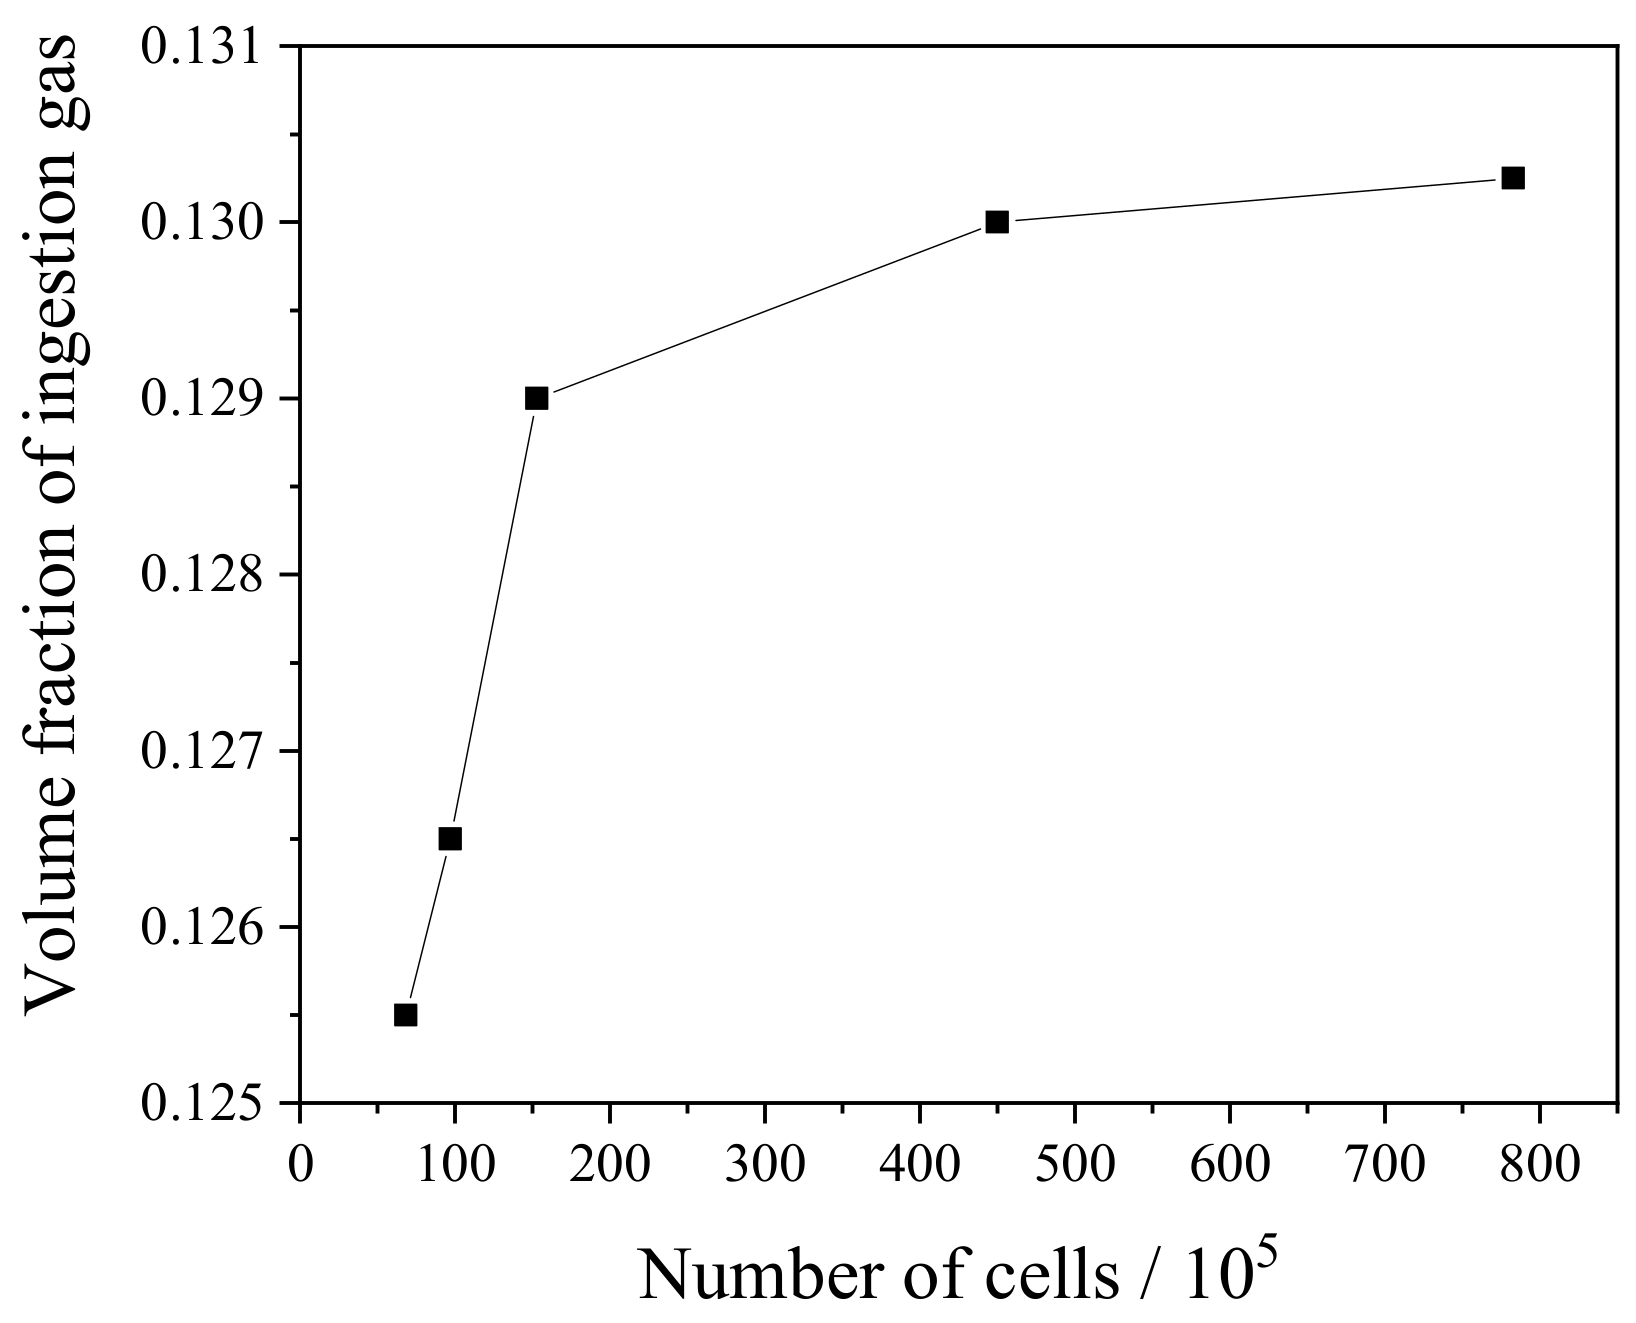
3.3. Computational Domain and Boundary Condition
4. Results and Discussion
4.1. End of Injection (EOI)
4.2. After Injection (AI)
4.3. Influence of Mass Flux
4.4. Analyzing the Cavitation Mechanism of Different Mass Fluxes
5. Conclusions
- (1)
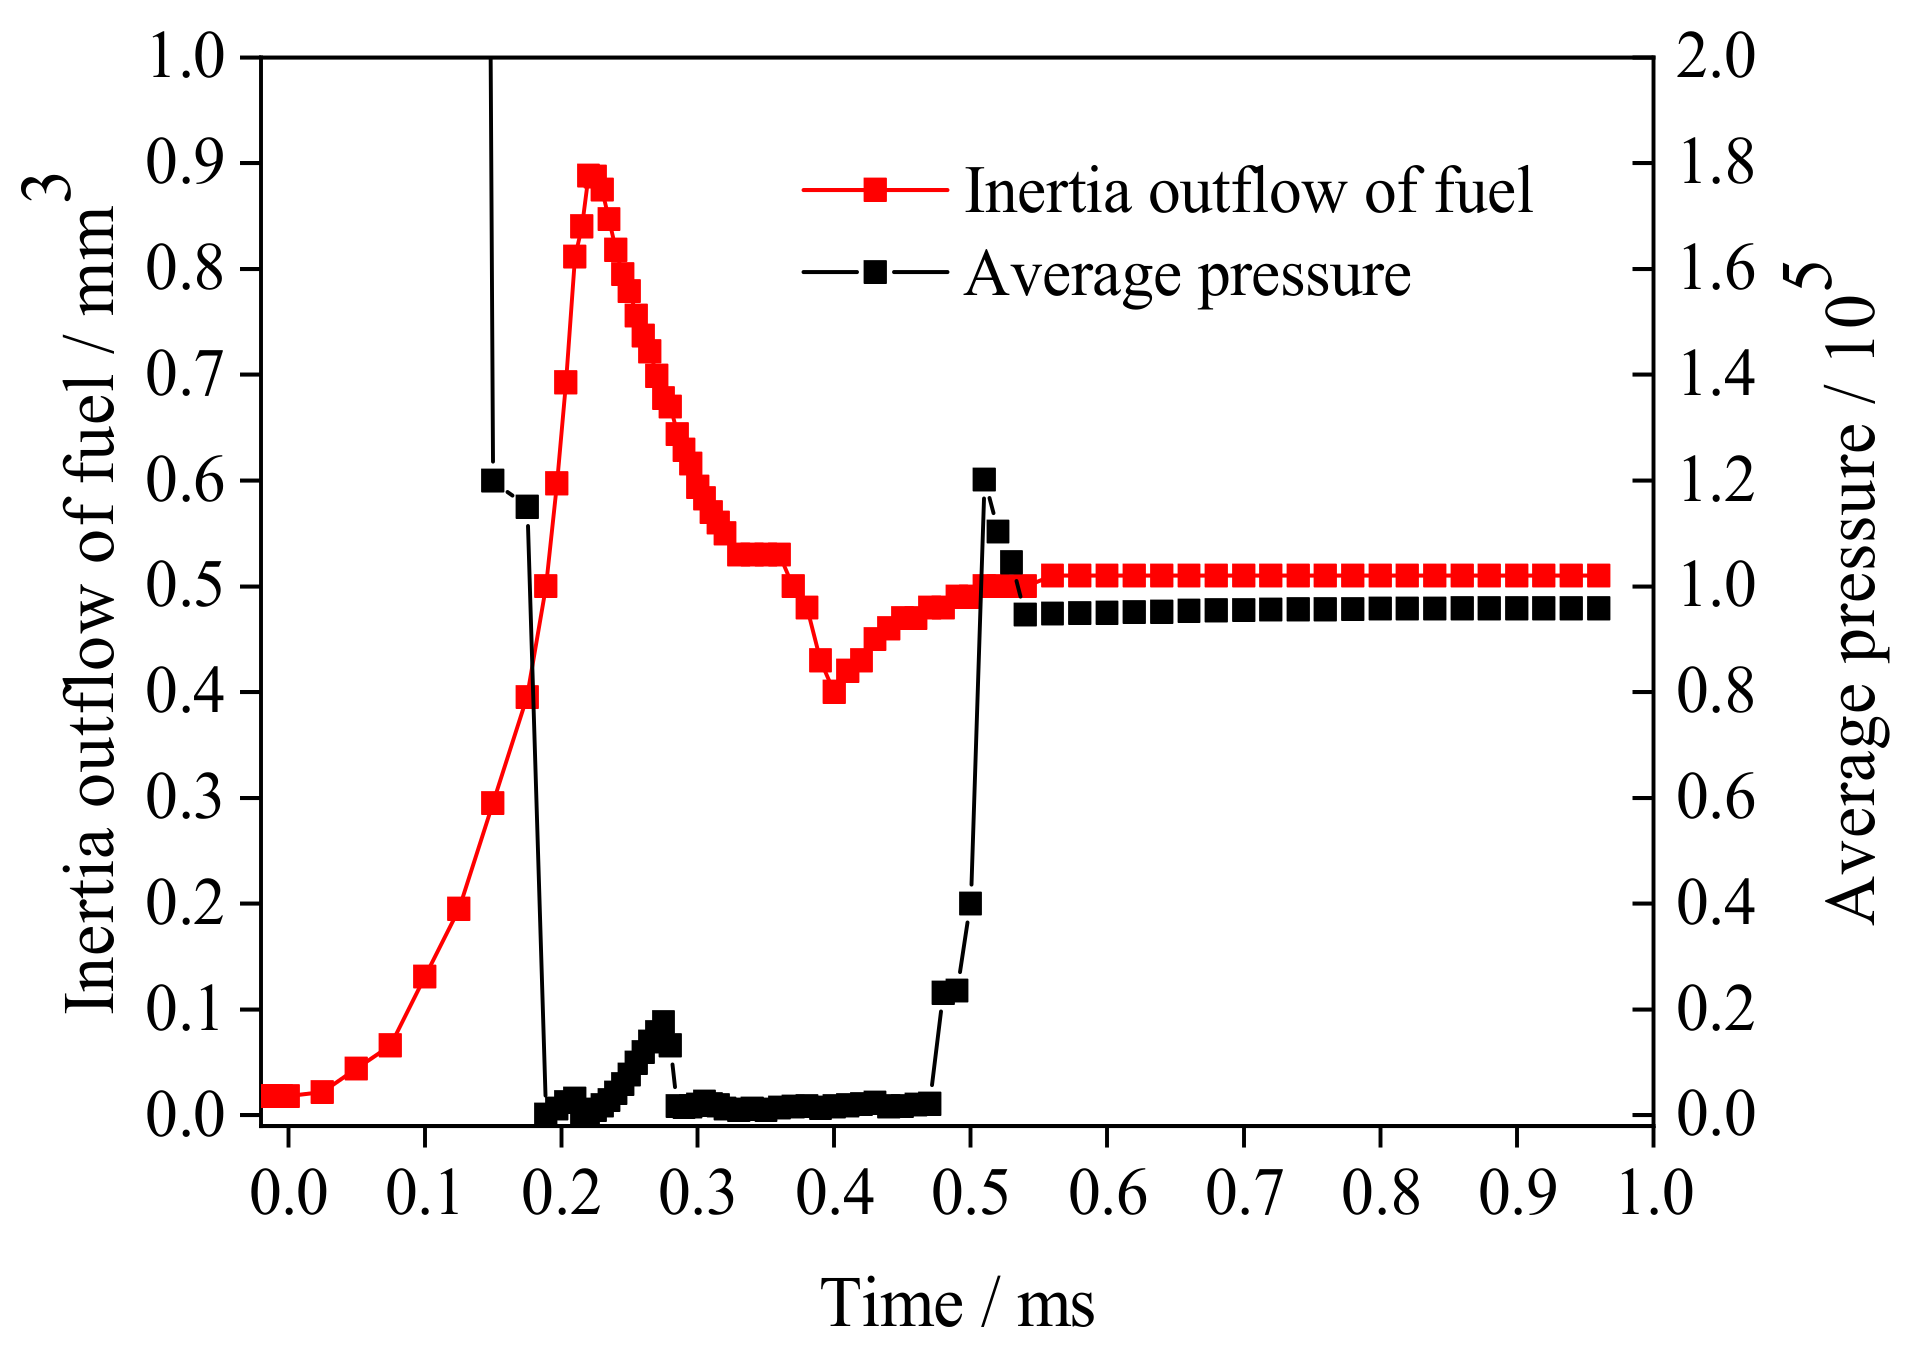
- Cavitation and gas ingestion occurred sequentially in the nozzle, starting with the orifice and finishing in the sac. The sac played a major role in affecting the total amount of ingestion gas and cavitation. The maximum fuel inertial outflow and cavitation in the nozzle were crucial in determining the total fuel outflow.
- (2)
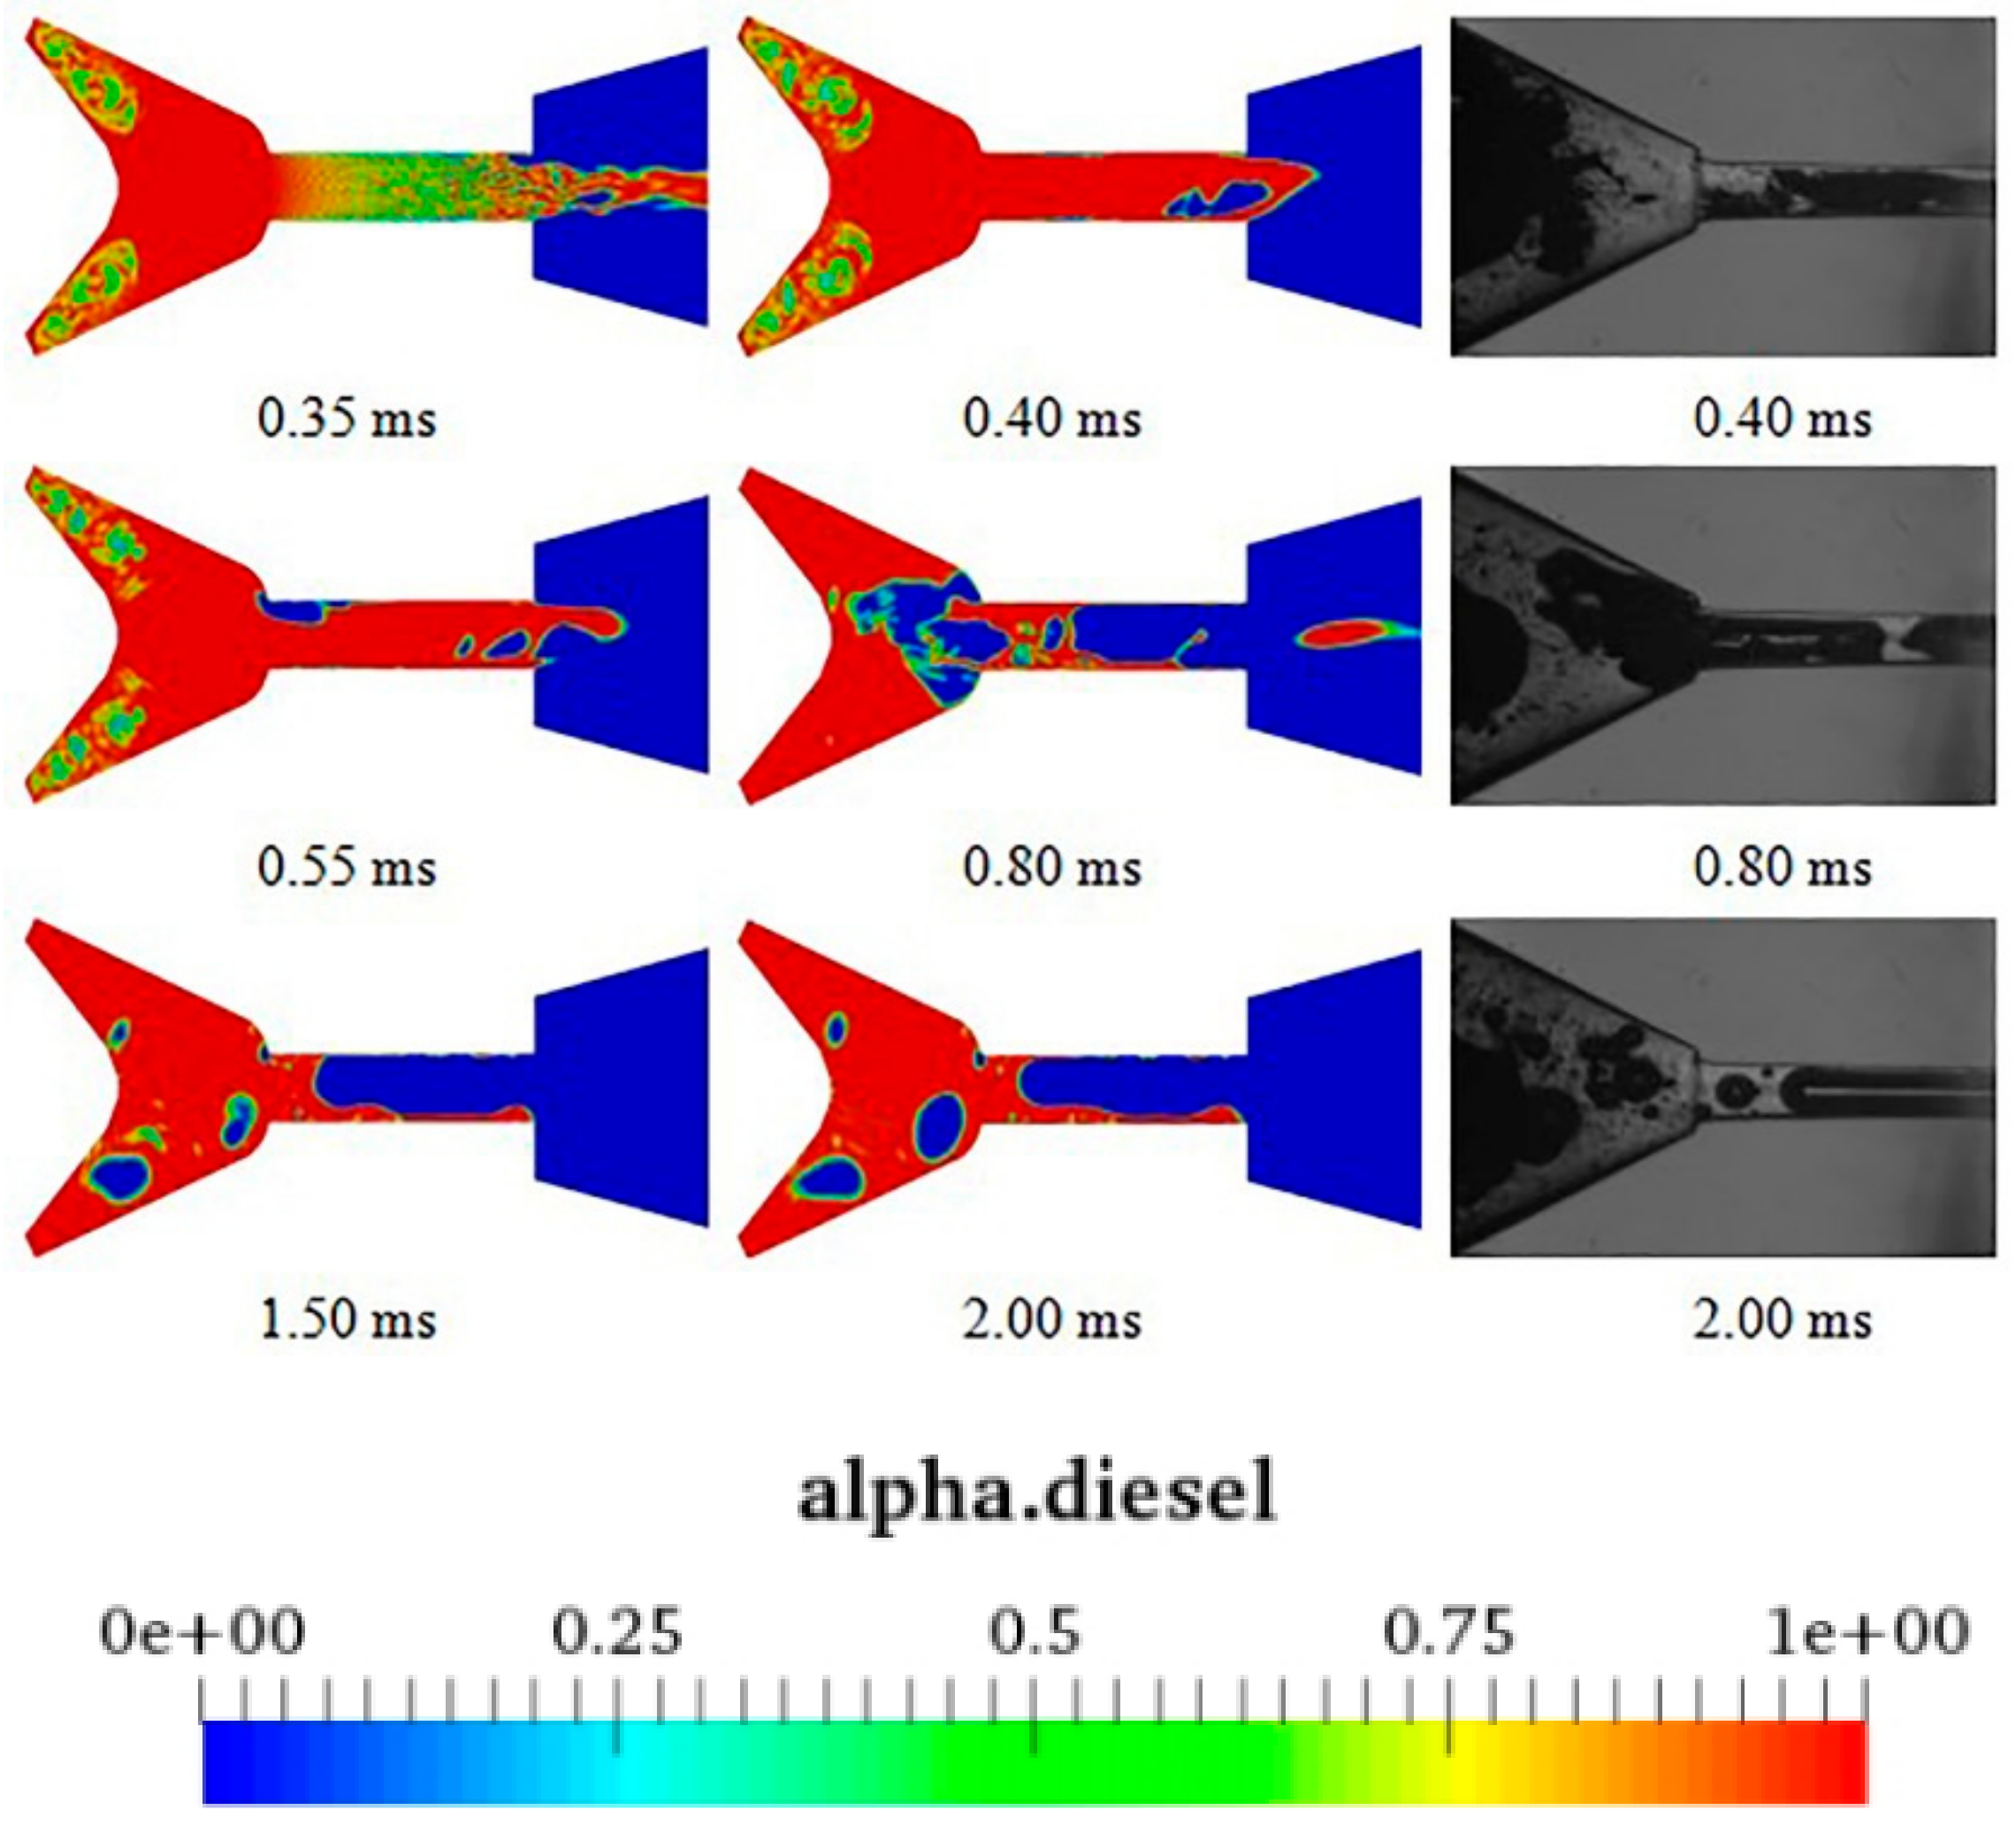
- The pressure difference between the pressure of the cavitation bubble and that of atmospheric pressure caused the cavitation collapse after the EOI, further generating external air to flow back into the nozzle. In addition, the gas ingestion bubbles in the nozzle began to fuse under the action of the surface tension after the EOI, and finally, its shape became regular.
- (3)
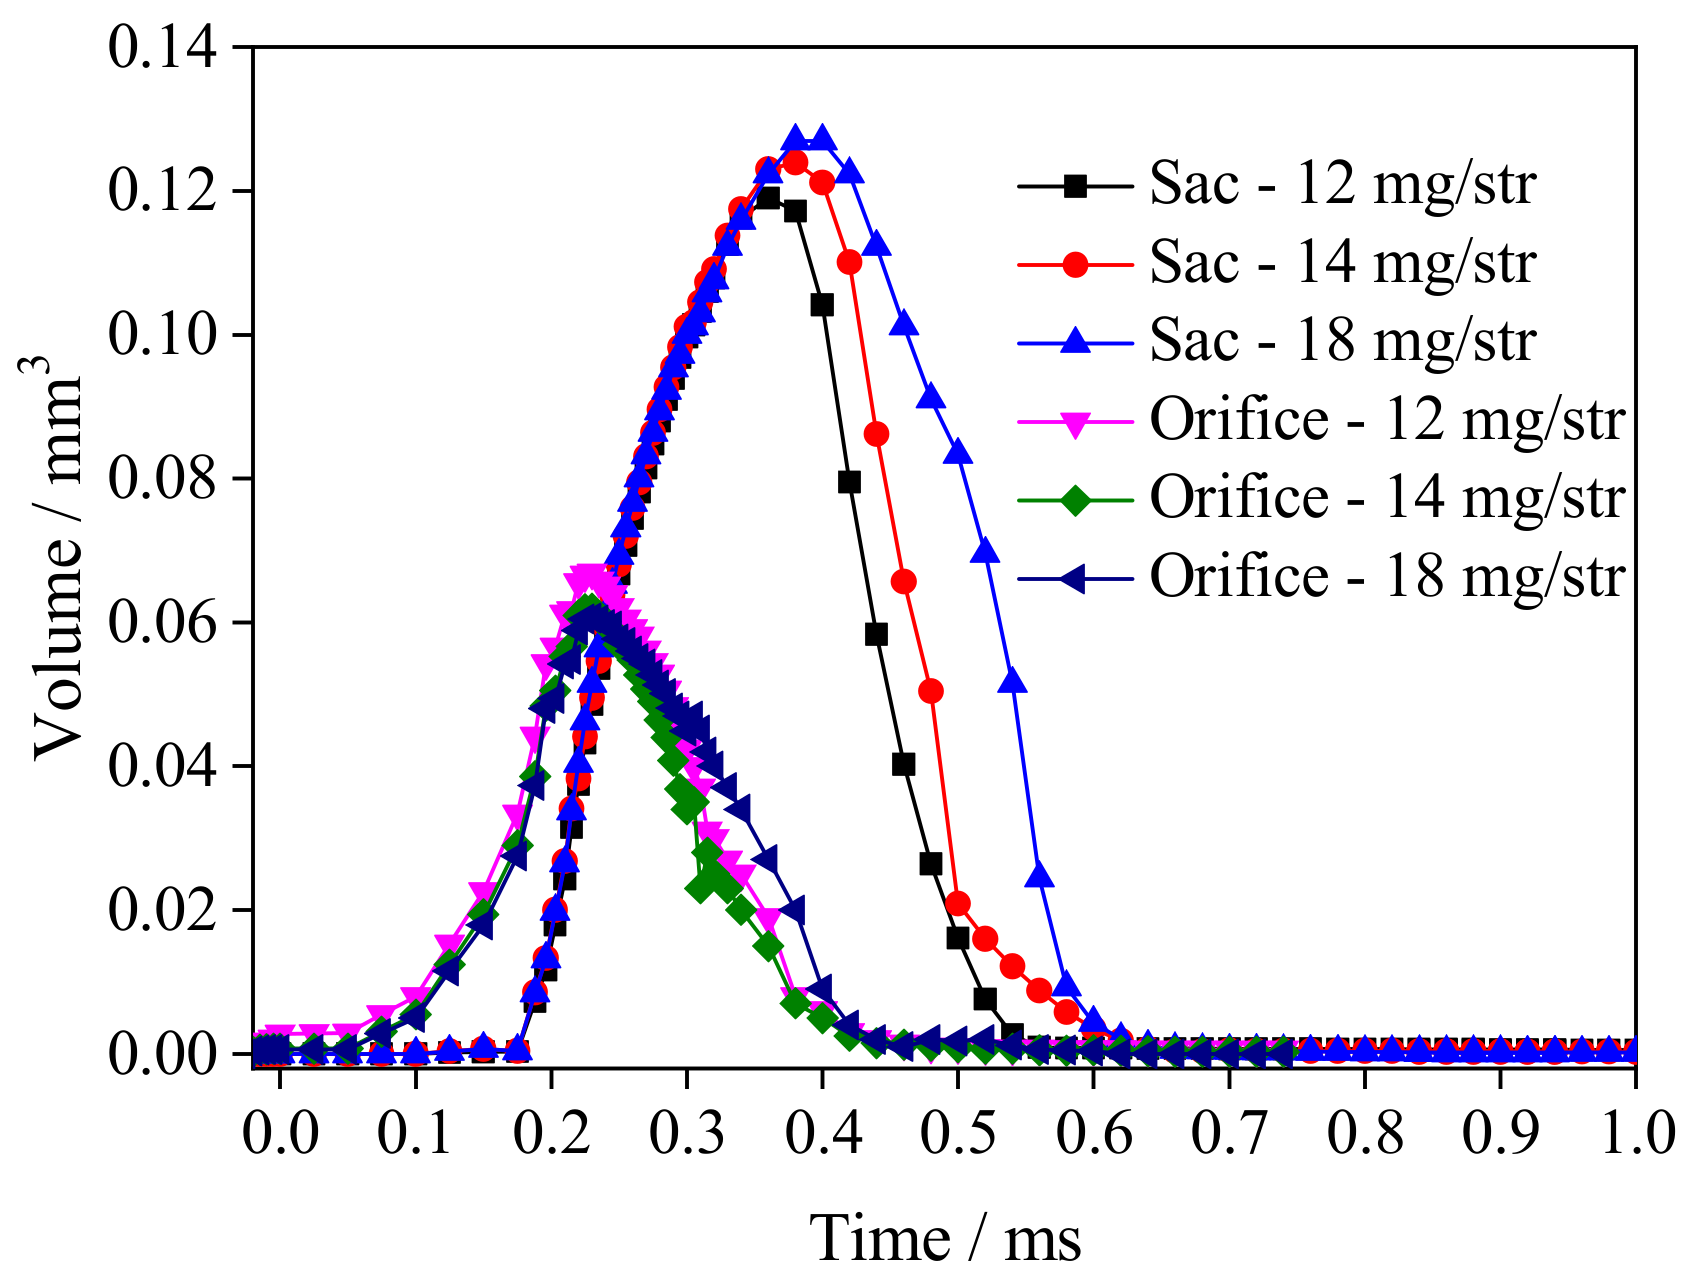
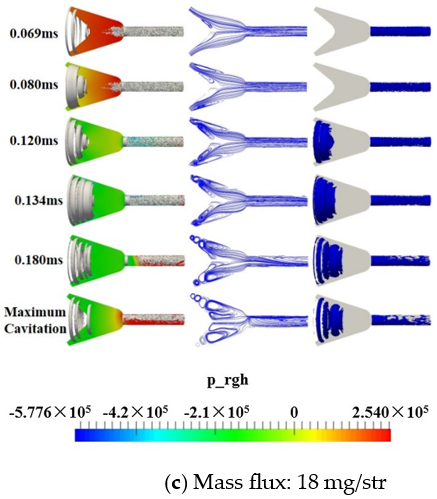
- The cavitation in the sac was mainly annular, and the orifice was mainly bulk cavitation. The cavitation in the sac concentrated on the nozzle inlet and developed downward. This was attributed to the fact that larger fuel mass increased the amount of gas ingestion and cavitation, and resulted in a longer deformation and fusion time for ingestion bubbles.
Author Contributions
Funding
Institutional Review Board Statement
Informed Consent Statement
Data Availability Statement
Conflicts of Interest
References
- Dabiri, S.; Sirignano, W.A.; Joseph, D.D. A numerical study on the effects of cavitation on orifice flow. Phys. Fluids 2010, 22, 42102. [Google Scholar] [CrossRef]
- Sou, A.; Hosokawa, S.; Tomiyama, A. Cavitation in nozzles of plain orifice atomizers with various length-to-diameter ratios. At. Sprays 2010, 20, 513–524. [Google Scholar] [CrossRef]
- Lee, H.; Russell, M.F.; Bae, C.S.; Shin, H.D. Development of cavitation and enhanced injector models for diesel fuel injection system simulation. Proc. Inst. Mech. Eng. Part D J. Automob. Eng. 2002, 216, 607–618. [Google Scholar] [CrossRef]
- Liu, F.; Li, Z.; Wang, Z.; Dai, X.; Lee, C. Dynamics and primary breakup of cavitation bubbles under throttling conditions. Appl. Therm. Eng. 2019, 149, 678–687. [Google Scholar] [CrossRef]
- Bermúdez, V.; Payri, R.; Salvador, F.J.; Plazas, A.H. Study of the influence of nozzle seat type on injection rate and spray behaviour. Proc. Inst. Mech. Eng. Part D J. Automob. Eng. 2005, 219, 677–689. [Google Scholar] [CrossRef]
- Linne, M.; Sedarsky, D.; Meyer, T.; Gord, J.; Carter, C. Ballistic imaging in the near-field of an effervescent spray. Exp. Fluids 2010, 49, 911–923. [Google Scholar] [CrossRef]
- Suh, H.K.; Lee, C.S. Effect of cavitation in nozzle orifice on the diesel fuel atomization characteristics. Int. J. Heat Fluid Flow 2008, 29, 1001–1009. [Google Scholar] [CrossRef]
- Hayashi, T.; Suzuki, M.; Ikemoto, M. Effects of internal flow in a diesel nozzle on spray combustion. Int. J. Engine Res. 2013, 14, 646–654. [Google Scholar] [CrossRef]
- Wei, M.; Gao, Y.; Yan, F.; Chen, L.; Feng, L.; Li, G.; Zhang, C. Experimental study of cavitation formation and primary breakup for a biodiesel surrogate fuel (methyl butanoate) using transparent nozzle. Fuel 2017, 203, 690–699. [Google Scholar] [CrossRef]
- Shibata, S.; Nishio, S.; Sou, A.; Akayama, D.; Mashida, M. Evaluation of cavitation in injector nozzle and correlation with liquid atomization. J. Vis. 2015, 18, 481–492. [Google Scholar] [CrossRef]
- Cao, T.; He, Z.; Zhou, H.; Guan, W.; Zhang, L.; Wang, Q. Experimental study on the effect of vortex cavitation in scaled-up diesel injector nozzles and spray characteristics. Exp. Therm. Fluid Sci. 2020, 113, 110016. [Google Scholar] [CrossRef]
- Qiu, T.; Song, X.; Lei, Y.; Liu, X.; An, X.; Lai, M. Influence of inlet pressure on cavitation flow in diesel nozzle. Appl. Therm. Eng. 2016, 109, 364–372. [Google Scholar] [CrossRef]
- Kubo, M. Internal flow analysis of nozzles for DI diesel engines using a cavitation model. JSAE Rev. 2003, 24, 255–261. [Google Scholar] [CrossRef]
- Mitroglou, N.; Lorenzi, M.; Santini, M.; Gavaises, M. Application of X-ray micro-computed tomography on high-speed cavitating diesel fuel flows. Exp. Fluids 2016, 57, 175. [Google Scholar] [CrossRef]
- Duke, D.; Swantek, A.; Tilocco, Z.; Kastengren, A.; Fezzaa, K.; Neroorkar, K.; Moulai, M.; Powell, C.; Schmidt, D. X-ray Imaging of Cavitation in Diesel Injectors. SAE Int. J. Engines 2014, 7, 1003–1016. [Google Scholar] [CrossRef]
- Duke, D.J.; Matusik, K.E.; Kastengren, A.L.; Swantek, A.B.; Sovis, N.; Payri, R.; Viera, J.P.; Powell, C.F. X-ray radiography of cavitation in a beryllium alloy nozzle. Int. J. Engine Res. 2017, 18, 39–50. [Google Scholar] [CrossRef]
- Mitroglou, N.; McLorn, M.; Gavaises, M.; Soteriou, C.; Winterbourne, M. Instantaneous and ensemble average cavitation structures in Diesel micro-channel flow orifices. Fuel 2014, 116, 736–742. [Google Scholar] [CrossRef]
- Gao, Y.; Wei, M.; Yan, F.; Chen, L.; Li, G.; Feng, L. Effects of cavitation flow and stagnant bubbles on the initial temporal evolution of diesel spray. Exp. Therm. Fluid Sci. 2017, 87, 69–79. [Google Scholar] [CrossRef]
- Hua, W.; Chaohui, W.; Guangjun, J.; Mingrui, W. Effect of Residual Bubbles on Diesel Jet Breakup at Early Stage. Trans. CSICE 2018, 36, 114–119. [Google Scholar]
- Ghiji, M.; Goldsworthy, L.; Brandner, P.A.; Garaniya, V.; Hield, P. Analysis of diesel spray dynamics using a compressible Eulerian/VOF/LES model and microscopic shadowgraphy. Fuel 2017, 188, 352–366. [Google Scholar] [CrossRef]
- Guo, G.; He, Z.; Zhang, Z.; Duan, L.; Guan, W.; Duan, X.; Jin, Y. Visual experimental investigations of string cavitation and residual bubbles in the diesel nozzle and effects on initial spray structures. Int. J. Engine Res. 2020, 21, 437–447. [Google Scholar] [CrossRef]
- Battistoni, M.; Grimaldi, C.N. Numerical analysis of injector flow and spray characteristics from diesel injectors using fossil and biodiesel fuels. Appl. Energy 2012, 97, 656–666. [Google Scholar] [CrossRef]
- Sun, Z.; Li, G.; Yu, Y.; Gao, S.; Gao, G. Numerical investigation on transient flow and cavitation characteristic within nozzle during the oil drainage process for a high-pressure common-rail DI diesel engine. Energy Convers. Manag. 2015, 98, 507–517. [Google Scholar] [CrossRef]
- Salvador, F.J.; Martínez-López, J.; Caballer, M.; De Alfonso, C. Study of the influence of the needle lift on the internal flow and cavitation phenomenon in diesel injector nozzles by CFD using RANS methods. Energy Convers. Manag. 2013, 66, 246–256. [Google Scholar] [CrossRef]
- Payri, F.; Payri, R.; Salvador, F.J.; Martínez-López, J. A contribution to the understanding of cavitation effects in Diesel injector nozzles through a combined experimental and computational investigation. Comput. Fluids 2012, 58, 88–101. [Google Scholar] [CrossRef]
- Salvador, F.J.; Carreres, M.; Jaramillo, D.; Martínez-López, J. Comparison of microsac and VCO diesel injector nozzles in terms of internal nozzle flow characteristics. Energy Convers. Manag. 2015, 103, 284–299. [Google Scholar] [CrossRef]
- Marcer, R.; Le Cottier, P.; Chaves, H.; Argueyrolles, B.; Habchi, C.; Barbeau, B. A Validated Numerical Simulation of Diesel Injector Flow Using a VOF Method. SAE Trans. 2000, 109, 2099–2118. [Google Scholar]
- Alajbegovic, A.; Meister, G.; Greif, D.; Basara, B. Three phase cavitating flows in high-pressure swirl injectors. Exp. Therm. Fluid Sci. 2002, 26, 677–681. [Google Scholar] [CrossRef]
- Bravo, L.; Xue, Q.; Som, S.; Powell, C.; Kweon, C.B.M. Fuel Effects on Nozzle Flow and Spray Using Fully Coupled Eulerian Simulations. In Proceedings of the ASME 2015 Power Conference, San Diego, CA, USA, 28 June–2 July 2015. [Google Scholar]
- Battistoni, M.; Poggiani, C.; Som, S. Prediction of the Nozzle Flow and Jet Characteristics at Start and End of Injection: Transient Behaviors. SAE Int. J. Engines 2016, 9, 84–97. [Google Scholar] [CrossRef]
- Benajes, J.; Pastor, J.V.; Payri, R.; Plazas, A. Analysis of the Influence of Diesel Nozzle Geometry in the Injection Rate Characteristic. J. Fluids Eng. 2004, 126, 63–71. [Google Scholar] [CrossRef]
- Moon, S.; Gao, Y.; Park, S.; Wang, J.; Kurimoto, N.; Nishijima, Y. Effect of the number and position of nozzle holes on in- and near-nozzle dynamic characteristics of diesel injection. Fuel 2015, 150, 112–122. [Google Scholar] [CrossRef]
- Agarwal, A.K.; Dhar, A.; Gupta, J.G.; Kim, W.I.; Choi, K.; Lee, C.S.; Park, S. Effect of fuel injection pressure and injection timing of Karanja biodiesel blends on fuel spray, engine performance, emissions and combustion characteristics. Energy Convers. Manag. 2015, 91, 302–314. [Google Scholar] [CrossRef]
- Tharakan, T.J.; Rafeeque, T.A. The role of backpressure on discharge coefficient of sharp edged injection orifices. Aerosp. Sci. Technol. 2016, 49, 269–275. [Google Scholar] [CrossRef]
- Li, D.; Kang, Y.; Wang, X.; Ding, X.; Fang, Z. Effects of nozzle inner surface roughness on the cavitation erosion characteristics of high speed submerged jets. Exp. Therm. Fluid Sci. 2016, 74, 444–452. [Google Scholar] [CrossRef]
- Chen, Z.; He, Z.; Shang, W.; Duan, L.; Zhou, H.; Guo, G.; Guan, W. Experimental study on the effect of nozzle geometry on string cavitation in real-size optical diesel nozzles and spray characteristics. Fuel 2018, 232, 562–571. [Google Scholar] [CrossRef]
- Zhang, W.; Liu, H.; Liu, C.; Jia, M.; Xi, X. Numerical analysis of jet breakup based on a modified compressible two-fluid-LES model. Fuel 2019, 254, 115608. [Google Scholar] [CrossRef]
- Jiang, G.; Zhang, Y.; Wen, H.; Xiao, G. Study of the generated density of cavitation inside diesel nozzle using different fuels and nozzles. Energy Convers. Manag. 2015, 103, 208–217. [Google Scholar] [CrossRef]
- Ma, J.; Wen, H.; Jiang, S.; Jiang, G. Formation and development of cavitation in a transparent nozzle with double orifices on different planes. Energy Sources Part A 2019, 1–15. [Google Scholar] [CrossRef]
- Yongchuan, D.; Chengyuan, D. Prediction for the Cetane Number of Diesel Fuels from Refractive Index. Chem. Eng. Oil Gas 2000, 1, 23–25. [Google Scholar]
- Yuan, W.; Sauer, J.; Schnerr, G.H. Modeling and computation of unsteady cavitation flows in injection nozzles. Mécanique Ind. 2001, 2, 383–394. [Google Scholar] [CrossRef]
- Singhal, A.K.; Athavale, M.M.; Li, H.; Jiang, Y. Mathematical Basis and Validation of the Full Cavitation Model. J. Fluids Eng. 2002, 3, 617–624. [Google Scholar] [CrossRef]
- Yin, B.; Yu, S.; Jia, H.; Yu, J. Numerical research of diesel spray and atomization coupled cavitation by Large Eddy Simulation (LES) under high injection pressure. Int. J. Heat Fluid Flow 2016, 59, 1–9. [Google Scholar] [CrossRef]
- Kosel, J.; Šuštaršič, M.; Petkovšek, M.; Zupanc, M.; Sežun, M.; Dular, M. Application of (super)cavitation for the recycling of process waters in paper producing industry. Ultrason. Sonochem. 2020, 64, 105002. [Google Scholar] [CrossRef] [PubMed]
- Šarc, A.; Kosel, J.; Stopar, D.; Oder, M.; Dular, M. Removal of bacteria Legionella pneumophila, Escherichia coli, and Bacillus subtilis by (super)cavitation. Ultrason. Sonochem. 2018, 42, 228–236. [Google Scholar] [CrossRef]
- Jasak, H. Error Analysis and Estimation for the Finite Volume Method with Applications to Fluid Flows. Ph.D. Thesis, Imperial College London (University of London), London, UK, 1996. [Google Scholar]
- Liu, J.; Du, H.; Li, M.; Zhao, Z. A study on quasi-dynamic measurement of flow coefficient of a hole-type nozzle. Trans. Chin. Soc. Agric. Mach. 2002, 2, 32–34. [Google Scholar]
- Seif, M.S.; Asnaghi, A.; Jahanbakhsh, E. Implementation of PISO algorithm for simulating unsteady cavitating flows. Ocean Eng. 2010, 37, 1321–1336. [Google Scholar] [CrossRef]


| Parameters | Value | Unit |
|---|---|---|
| Density of diesel/ρ | 840 | kg·m−3 |
| Dynamic viscosity of diesel/μ | 0.0065 | Pa·s |
| Density of air/ρ | 1.21 | kg·m−3 |
| Dynamic viscosity of air/μ | 1.85 × 10⁻⁵ | Pa·s |
| Density of diesel vapor/ρ | 0.14 | kg·m−3 |
| Dynamic viscosity of diesel vapor/μ | 4.25 × 10⁻⁵ | Pa·s |
| Saturated vapor pressure of diesel/pv | 2000 | Pa |
| Surface tension/σ | 0.03 | kg·s−2 |
Publisher’s Note: MDPI stays neutral with regard to jurisdictional claims in published maps and institutional affiliations. |
© 2020 by the authors. Licensee MDPI, Basel, Switzerland. This article is an open access article distributed under the terms and conditions of the Creative Commons Attribution (CC BY) license (http://creativecommons.org/licenses/by/4.0/).
Share and Cite
Wen, H.; Jiang, Y.; Ma, J. Effect of Fuel Mass Flow at the End of Injection on Cavitation and Gas Ingestion in the Nozzle. Appl. Sci. 2021, 11, 258. https://doi.org/10.3390/app11010258
Wen H, Jiang Y, Ma J. Effect of Fuel Mass Flow at the End of Injection on Cavitation and Gas Ingestion in the Nozzle. Applied Sciences. 2021; 11(1):258. https://doi.org/10.3390/app11010258
Chicago/Turabian StyleWen, Hua, Yulong Jiang, and Jinglong Ma. 2021. "Effect of Fuel Mass Flow at the End of Injection on Cavitation and Gas Ingestion in the Nozzle" Applied Sciences 11, no. 1: 258. https://doi.org/10.3390/app11010258
APA StyleWen, H., Jiang, Y., & Ma, J. (2021). Effect of Fuel Mass Flow at the End of Injection on Cavitation and Gas Ingestion in the Nozzle. Applied Sciences, 11(1), 258. https://doi.org/10.3390/app11010258