Article

Equilibrium Study, Modeling and Optimization of Model Drug Adsorption Process by Sunflower Seed Shells

by
Bahdja Hayoun
1,2,*,
Mustapha Bourouina
1,
Marta Pazos
2,
Mª Angeles Sanromán
2 and
Saliha Bourouina-Bacha
3
1
Department of Chemistry, Faculty of Exact Sciences, Campus Targa Ouzemmour, University of Bejaia, Bejaia 06000, Algeria
2
CINTECX-Universidade de Vigo, Department of Chemical Engineering Campus As Lagoas-Marcosende, University of Vigo, 36310 Vigo, Spain
3
Department of Process Engineering, Faculty of Technology, Campus Targa Ouzemmour, University of Bejaia, Bejaia 06000, Algeria
*
Author to whom correspondence should be addressed.
Appl. Sci. 2020, 10(9), 3271; https://doi.org/10.3390/app10093271
Submission received: 14 April 2020 / Revised: 29 April 2020 / Accepted: 4 May 2020 / Published: 8 May 2020

Abstract

:
The adsorption capacity of the medication methylthioninium chloride (MC) from aqueous solution onto sunflower seed shells (SSS), a low cost and abundant alternative adsorbent, was investigated in a batch system. The surface properties of the adsorbent were characterized by Fourier transform infrared (FTIR) spectroscopy, scanning electron microscopy (SEM), specific surface area (by using the Brunauer–Emmett–Teller equation), the liquid displacement method and pHPZC. The ability of SSS to remove the medication was assessed through kinetic, thermodynamic and equilibrium investigations. The adsorption efficiency of the SSS adsorbent for the removal of MC was evaluated considering the effects of its concentration, temperature, adsorption contact time, and the pH of the medium. The results obtained from the kinetic and isotherm studies show that the adsorption of the MC on SSS follows pseudo-second-order kinetics (R² > 0.99) and the Temkin isotherm model (R² = 0.97), respectively. The thermodynamic study showed that the adsorption was endothermic and spontaneous, according to its physisorption mechanism. The mathematical modeling of this process was carried out by using the surface response methodology of Box–Behenken. It was possible to deduce a statistically reliable regression equation that related the adsorption yield to the chosen operating parameters, that is, the initial MC concentration, the adsorbent dosage and the pH. Analysis of the variance indicated that the most influential parameters were the SSS dosage, the pH and their interaction and showed the optimal values for ensuring the best adsorption capacity of 95.58%.

Graphical Abstract

1. Introduction

There has been a great deal of concern about the detection of pharmaceuticals and personal care products in soil, sediments, surface and groundwater [1] as they have become major pollutants due to their low biodegradability, high persistence, and facile bioaccumulation [2]. Among these products, methylthioninium chloride (MC), which is part of a type of medication derived from phenothiazines, has been widely used in a variety of medical treatments, such as methemoglobinemia [3] and lymphatic mapping/sentinel lymphadenectomy in staging melanoma and breast cancer [4]. It has also been used as a therapeutic agent in neurodegenerative diseases [5,6]. This product is not only used in the pharmaceutical field, but it is also used in several other industrial fields including textiles, leather, cosmetics, paper, printing, plastic and food [7,8,9].Therefore, MC is often present in the various effluents that are discharged into the environment. Thus, the continuous release of this pollutant into the environment significantly affects human health and aquatic systems [9,10].
Therefore, the treatment of these effluents by appropriate techniques is very necessary [9,11]. For this purpose, several physical, chemical and biological methods have been developed including coagulation and flocculation, membrane separation, reverse osmosis, oxidation and co-precipitation [9,12]. The use of an inexpensive and effective method is very important [11,13]. The adsorption technique has certain advantages; it is a simple and easy technique, it costs less and it is respectful of the environment [14,15]. Activated carbon is the most commonly used adsorbent due to its very high adsorption capacity [16,17,18], but the disadvantage is that it is expensive [16]. For this reason, several studies have been carried out to examine the use of low-cost adsorbents [19]. For example, various agricultural byproducts, clays [20], biomass [15], synthetic and natural polymers [21], have been evaluated. Thus, it is useful to find effective adsorbent materials, that are available locally and especially, low cost [7,
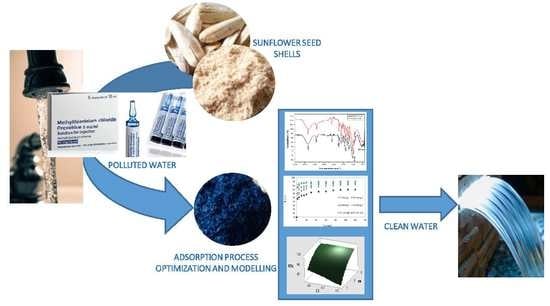
22]. Indeed, sunflower seed shells, an agricultural byproduct of biomass, could be exploited in this area as they are a low-cost product, widely used and can be used without any treatment.
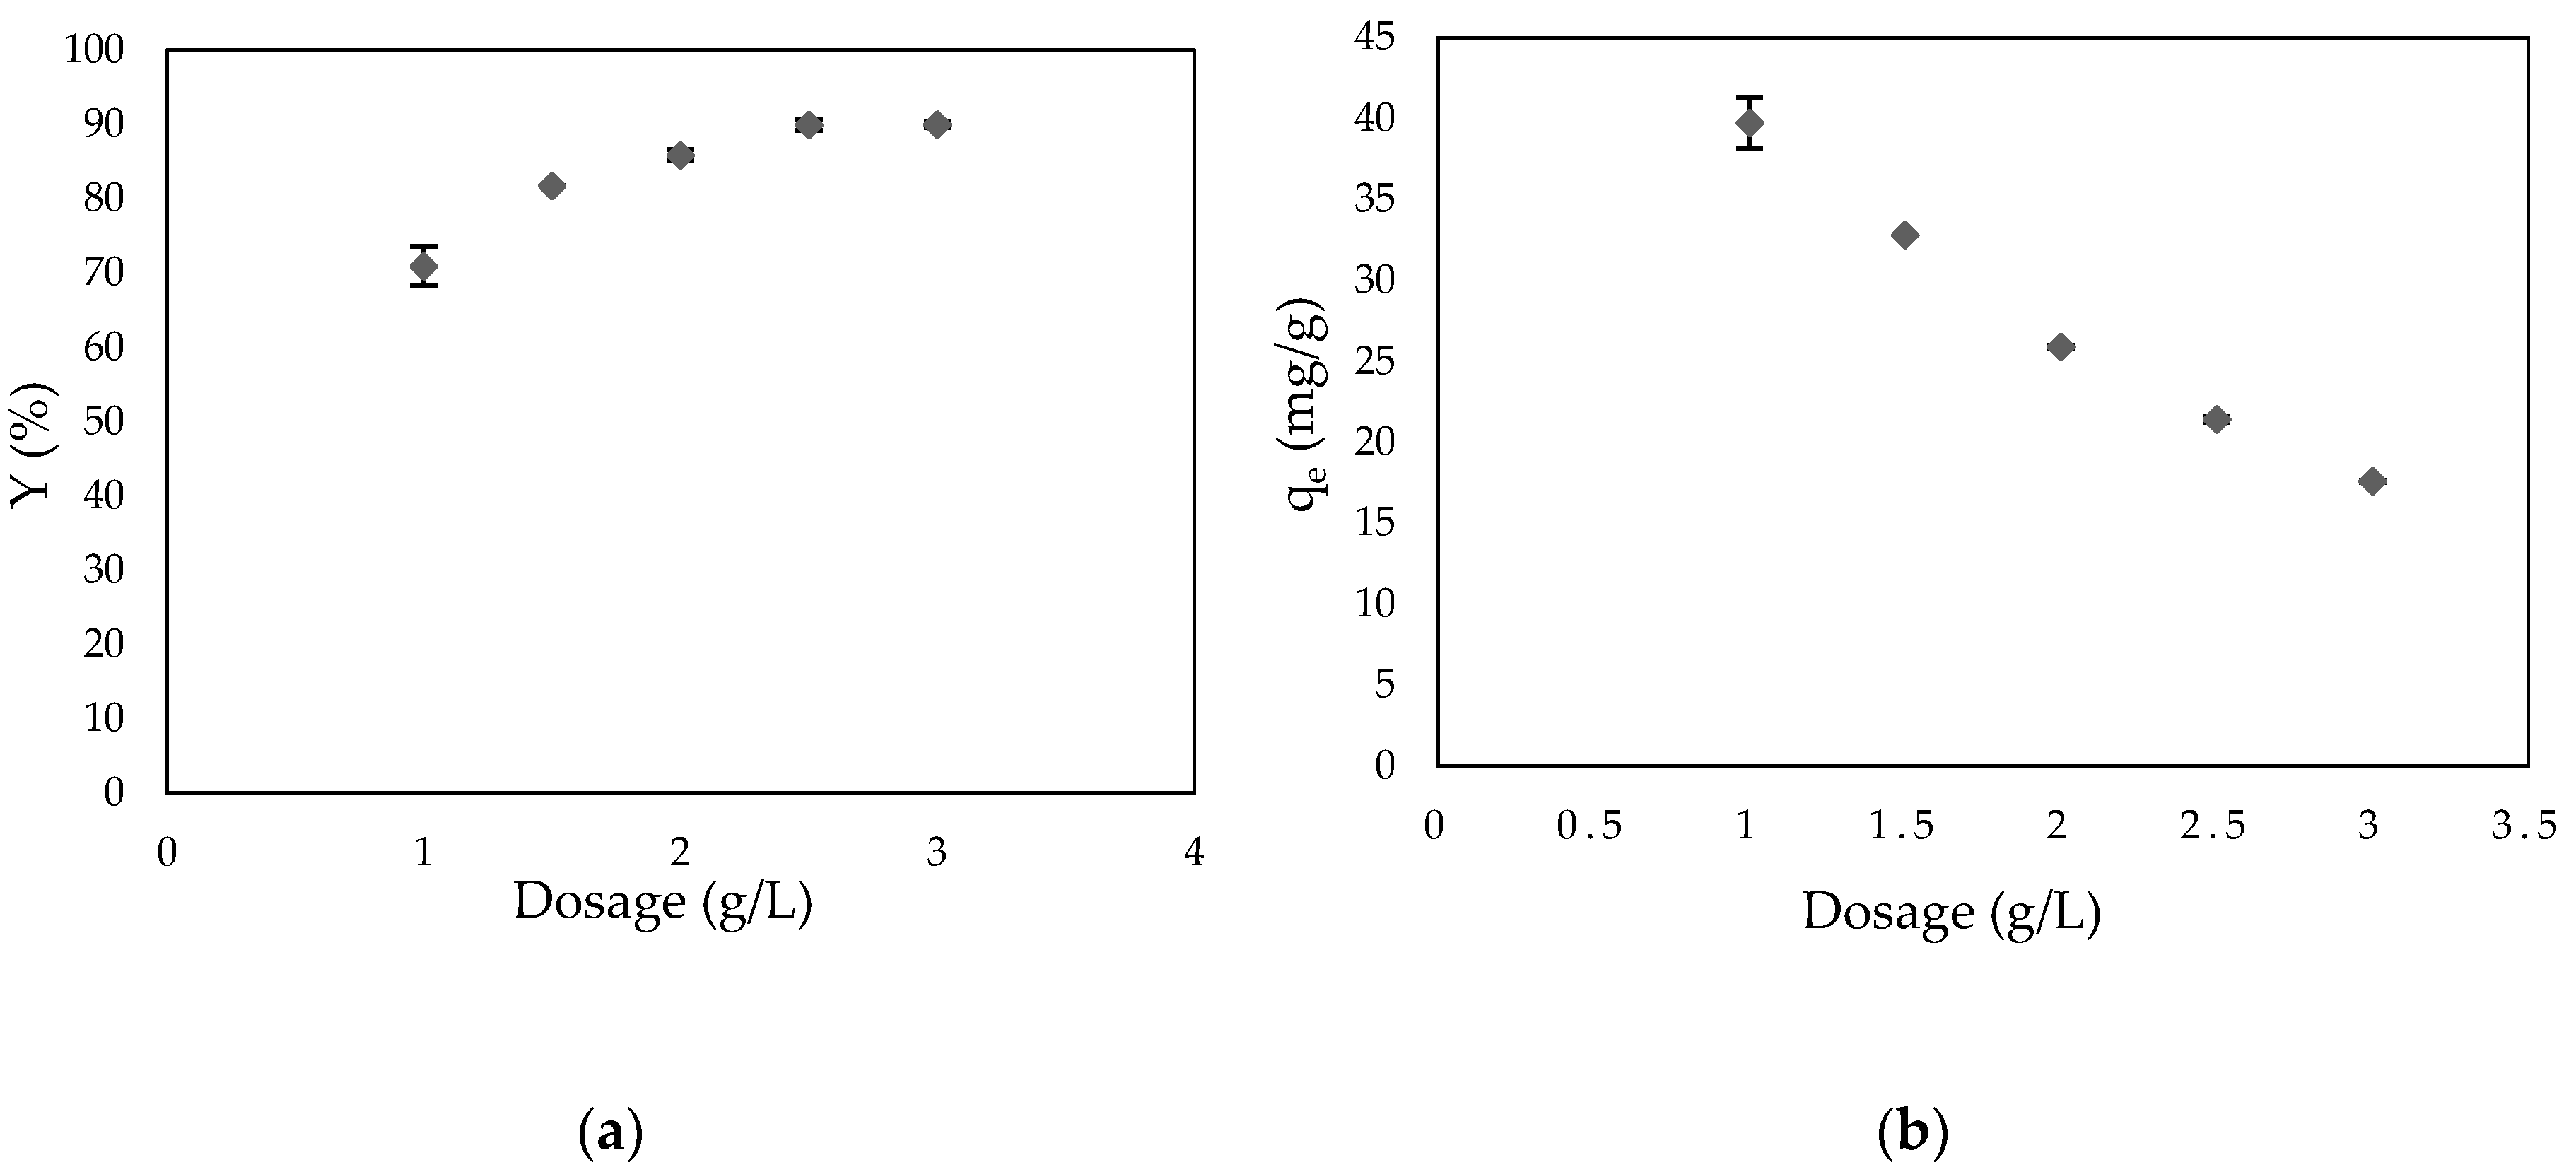
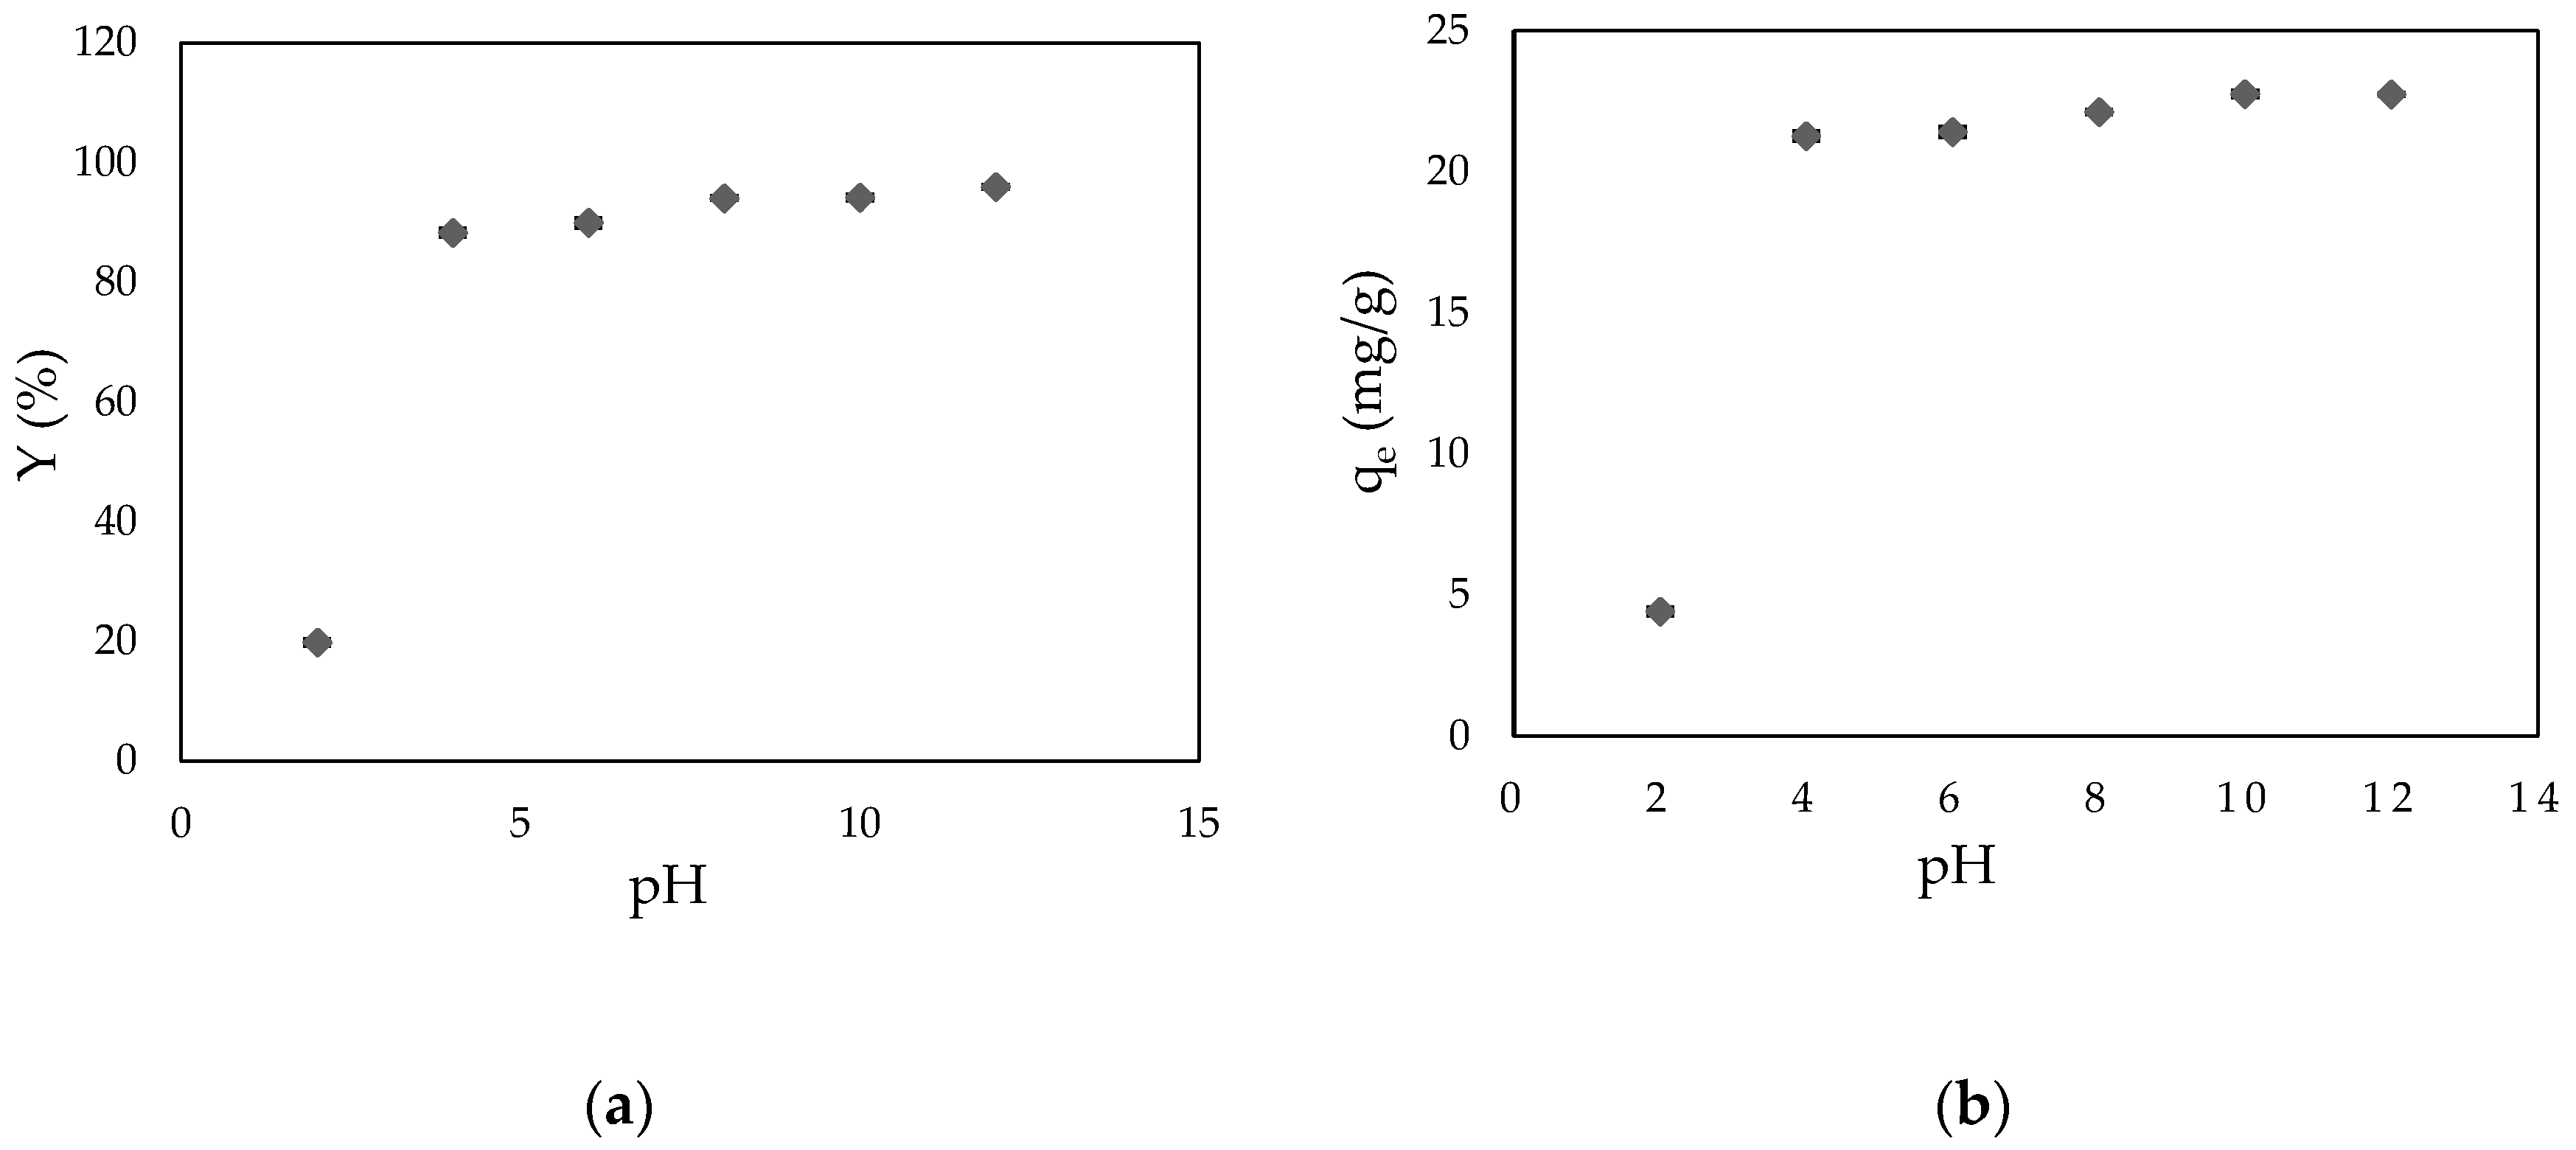
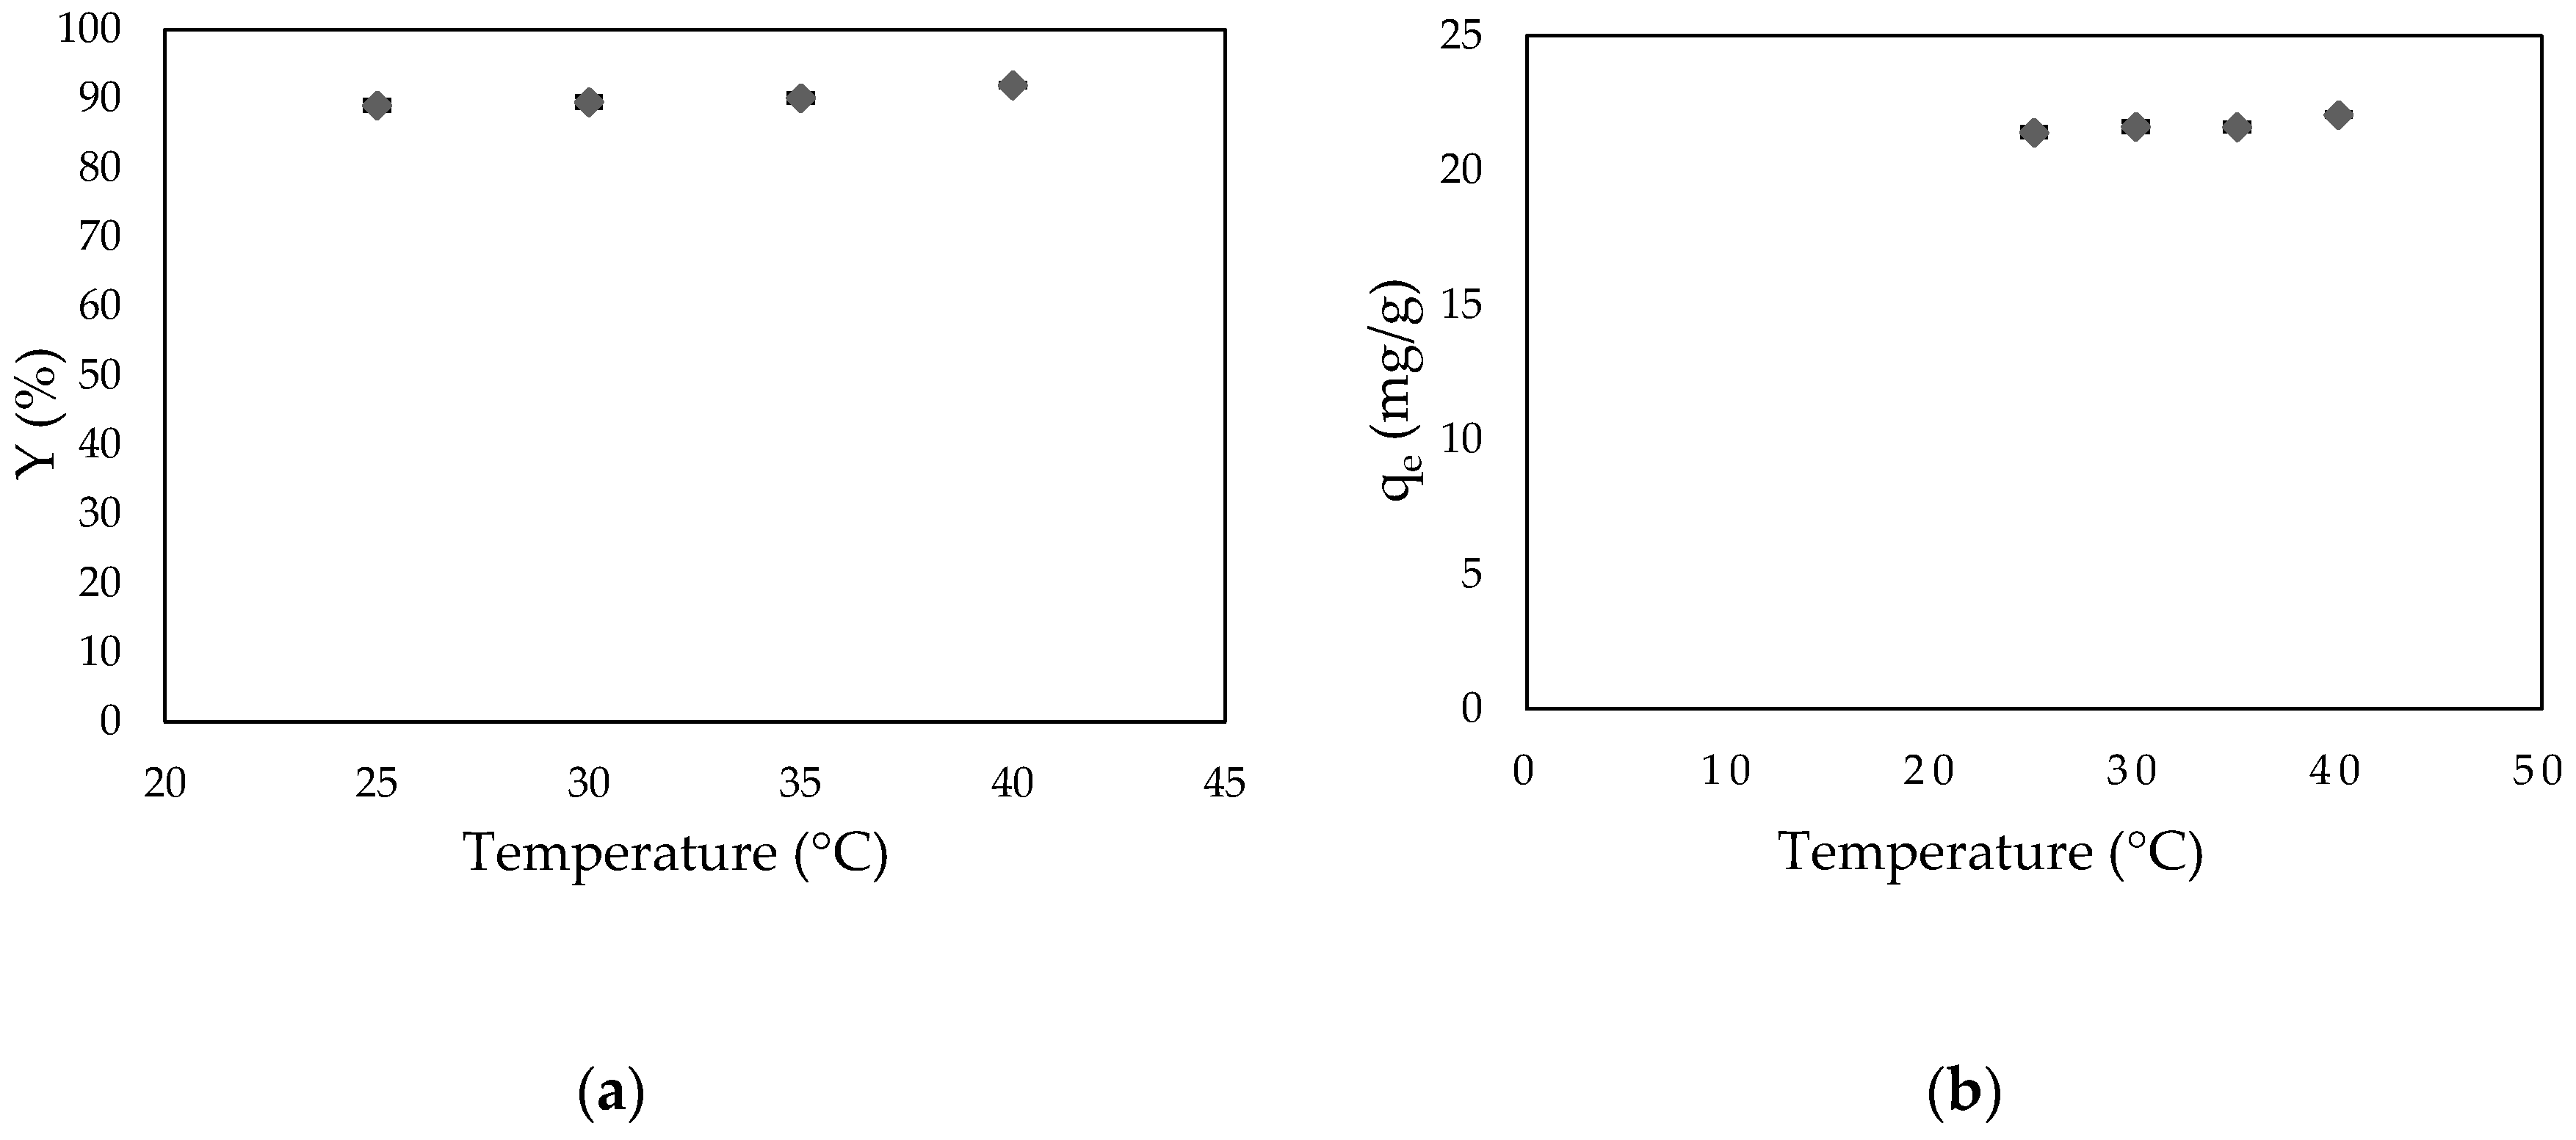
However, several factors greatly influence the adsorption process, such as the initial pollutant concentration, adsorbent dosage, pH and temperature of the solution, etc. These are important because they affect the adsorption process, particularly the adsorption capacity.
Accordingly, it is necessary to use methods based on statistical calculations like the Box–Behnken design (BBD), which is a useful tool because it is fast, efficient and economical in comparison to the classic univariate methods where only one factor is studied at a time. Indeed, the advantage of this technique is the collection of a large amount of information from a minimum of experimental trials, without sacrificing the accuracy of the results. The main aim of this study was to find the best operating conditions for the adsorption of MC on a low-cost adsorbent prepared from sunflower seed shells (SSS). Thus, a study was carried out to determine the influence of the operating parameters on the adsorption efficiency. The adsorption mechanism of the SSS is shown through the study of adsorption isotherms, kinetics and thermodynamics. The efficiency of the adsorption of SSS for the elimination of MC was optimized by evaluating the effects of three parameters, namely, the initial concentration of the drug, the dose of adsorbent and the pH of the solution. Modeling and optimization were carried out by the Box–Behnken design, which allowed us to determine the optimal values of these parameters and to ensure the high adsorption efficiency of MC on the SSS powder.

2. Materials and Methods

2.1. Reagents

Methylthioninium chloride (3,7-bis(dimethylamino)-phenazathionium chloride tetramethyle-thionine chloride), a model medication pollutant (CAS n°: 61-73-4) with a molecular weight of 373.9 g/mol, and maximum wavelength of 668 nm was purchased from Merck (Biochem Chemopharma). A range of concentrations from 20 to 150 mg/L were prepared by successive dilution of the stock solution (150 mg/L). Distilled water was used to prepare all solutions. The pH adjustment of the solutions was made by the addition of HCl (0.1 M) or NaOH (0.1 M) using a pH-meter (Boeco).

2.2. Preparation of Adsorbent

The sunflower seed shells (SSS) was purchased from a local store (Béjaia, Algeria). First, they were washed several times with distilled water and then dried at 60 °C for one day. Then, the dry product was crushed and then sieved to obtain a particle size less than or equal to 0.3 mm. After that, it was stored in closed bottles.

2.3. Characterization of Adsorbent

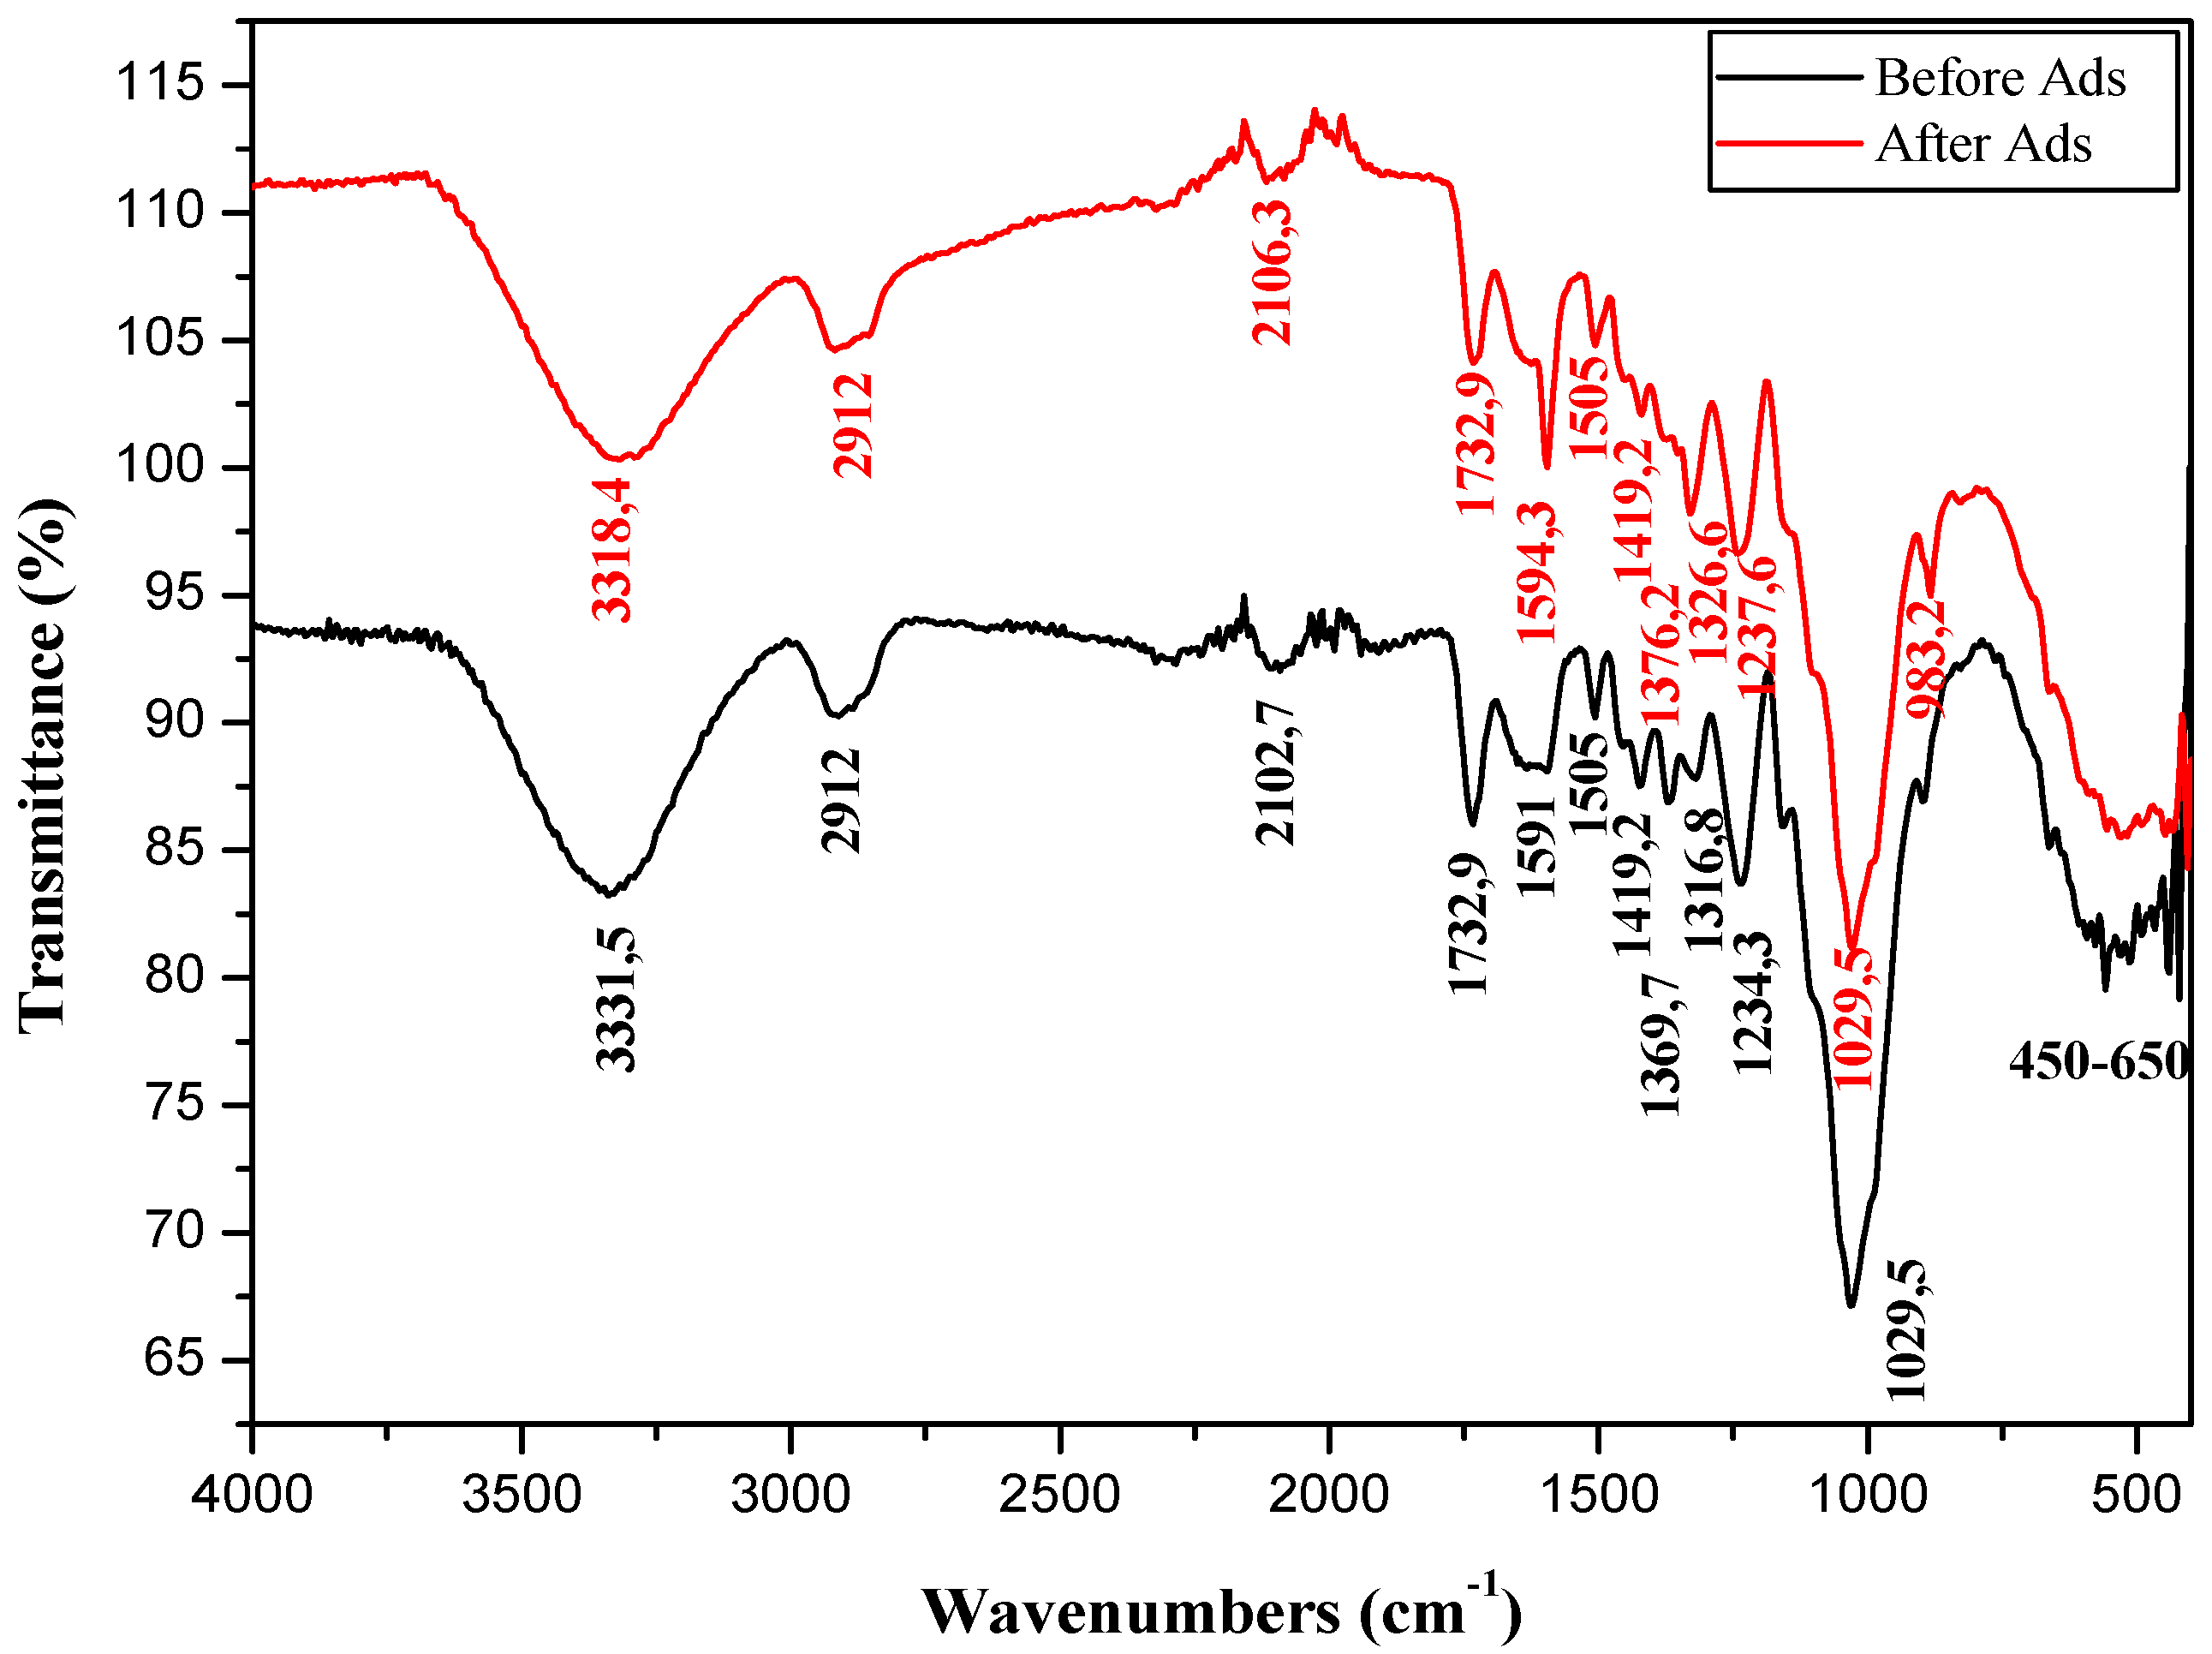
To analyze the functional groups, a Fourier transform infrared (FTIR) spectroscopy study was carried out using a 630 Cary spectrometer using a small amount of adsorbent before and after adsorption of MC.
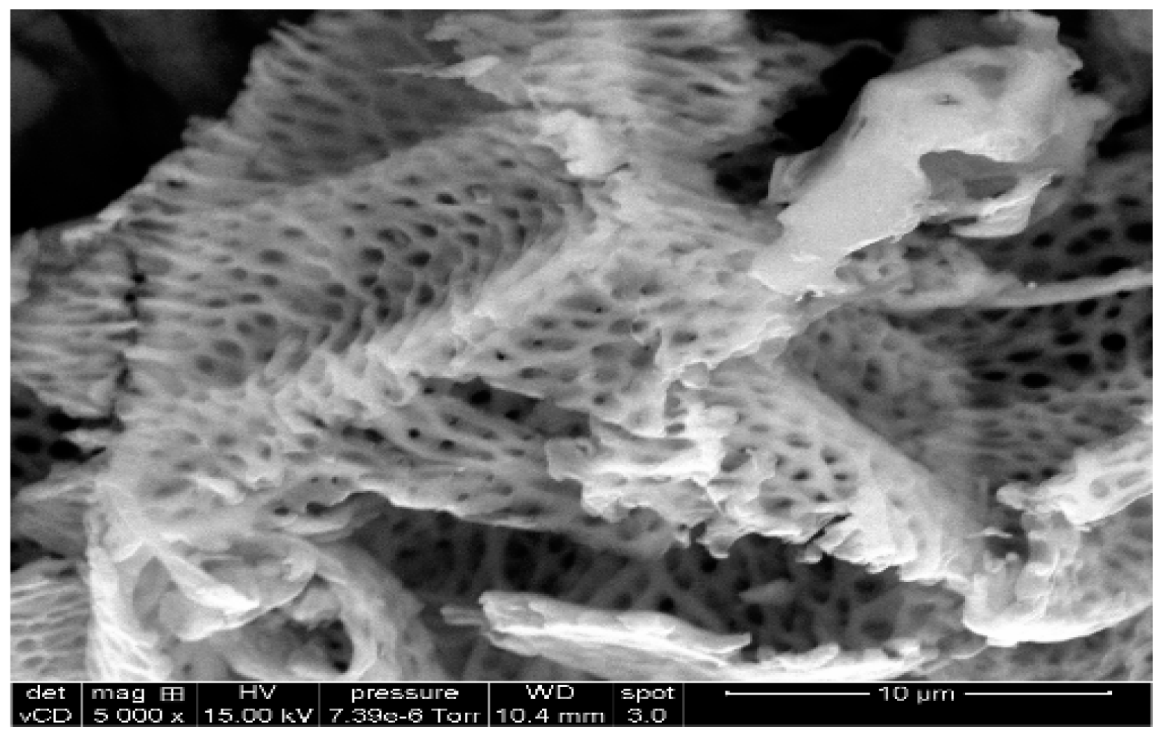
A scanning electron microscope (SEM) FEI Quanta FEG 250 from the University of Lyon 1, France, was used to study the morphology of the adsorbent.
The specific surface area was determined by the adsorption of N2 at 77.3 K using a surface analyzer Nova 2000e (quantachrome instruments) using the BET (Brunauer–Emmett–Teller) equation model. In addition, the total pore volume and average pore diameter were measured.
The real density, apparent density (bulk density), porous volume and porosity of the adsorbent were measured by the liquid displacement method. The real density ρreal (g/cm3) was determined by filling a pycnometer with a well-defined mass of the adsorbent note, mads and then the pycnometer was adjusted to its volume (Vpyc) by adding a well-defined volume of methanol (99% purity) and was weighed. The calculation was made by using the following equation [23].
ρ real = m ads V real   of   adsorbent
However, the apparent density ρapp (g/cm3) (bulk density) was determined using a calibrated cylinder, which was filled with a given adsorbent weight (mads) and then the cylinder was tapped until a minimum volume was recorded. This represents the apparent volume (Vapp) of the adsorbent which was evaluated using the following equation [23].
ρ app = m ads V app
The porous volume P.V (cm3/g) and porosity Ԑ of the adsorbent were calculated using the results of the densities as well as the following equations [23].
P . V   = 1 ρ app 1 ρ real
ε = 1 ρ app ρ real
The determination of the zero point charge of SSS (ZPC) was performed by the salt addition method [24]. A 0.05 M NaCl solution was prepared, transferred to a series of 50 mL beakers and the pH of each solution was adjusted from 2 to 12 by adding 0.1 M HCl or 0.1 M NaOH solution. The initial pH of these solutions (noted as pHi) was measured. Then, 0.15 g of SSS was added to each of the beakers, which were tightly closed using parafilm paper and then stirred at 300 rpm at room temperature. The final pH value was measured after 48 h of agitation, the noted pHf and the ZCP value of the surface was calculated from the plot of ΔpH= f(pHi).

2.4. Adsorption Experiments

Adsorption experiments were carried out by agitating the SSS powder in an Erlenmeyer flask (500 mL) that contained 250 mL of the MC solution of desired concentration and pH in a magnetic stirrer at 300 rpm. The experiments were carried out with varying adsorbent dosage (1–3 g/L), initial MC concentration (20 −150 mg/L), temperature (25–40 °C) and pH (2–12). The samples were withdrawn from the Erlenmeyer at predetermined time intervals. The MC solution was separated from the adsorbent using a Hettich brand centrifuge at 5000 rpm for 3 min and analyzed for their MC content spectrophotometrically at the appropriate wavelength (λmax = 264 nm) using a UV spectrophotometer (Shimadzu). The effect of pH was studied by adjusting the pH of the MC solutions using HCl and NaOH. All experiments were performed in duplicate, all data was calculated and average values are taken to represent the results.
The uptake of MC adsorbed onto SSS per unit mass was calculated using the following equation:
q t = ( C 0   C t ) V m
where qt is the amount of MC adsorbed onto SSS (mg/g) at time t, C0 and Ct are the liquid phase concentrations of MC at initial and time t, respectively. V (L) is the volume of MC solution and m (g) is the mass of the SSS adsorbent used. The MC removal efficiency was calculated as follows:
Y % = ( C 0 C t ) C 0 × 100
and the average relative error (ARE) was calculated as follows [25]:
A RE = i = 1 N | q e , exp q e ,   model q e ,   exp | i
where qe exp and qe model (mg/g) are the uptake at equilibrium measured (exp) and calculated by the isotherm model (model), respectively. We also used the same relationship to determine the mean relative errors for the kinetic models.

2.5. Data Analysis

2.5.1. Kinetics Study

The study of the adsorption kinetics helps to determine the adsorption equilibrium time as a function of the adsorbent used and the operating conditions. It also allows us to understand the phenomena at the interface between the absorbing material and the pollutant molecules in terms of the diffusion and adsorption mechanism [9,18]. Three kinetic models: the pseudo-first order, the pseudo-second order and the intra-particle diffusion model [26,27,28] were used to analyze the kinetic data of MC adsorption on SSS. These models can be written as follows:
pseudo-first order model:
q t = q 1 ( 1 e k 1 t )
pseudo-second order model:
q t = q 2 2 k 2 t 1 + q 2 k 2 t
intra-particle diffusion model:
q t = K d t + c
where q1 and q2 are the theoretical uptakes at equilibrium (mg/g), qt (mg/g) is the uptake at time t, and k1 (1/min) and k2 (g/mg min) are the pseudo-first-order rate constant and the pseudo-second-order rate constant, respectively. Kd (mg.g.√min) is the intra-particle diffusion constant and c (mg/g) is a constant related to the thickness of the boundary layer.

2.5.2. Equilibrium Study

The adsorption isotherms can be defined as the set of adsorption equilibrium states, at a given temperature. Several models have been used in the literature to describe the experimental data of adsorption isotherms [7]. In this study, we chose three models [29,30,31] and we calculated the various parameters by the equations defined as follows:
Langmuir model:
q e = q m   K L   C e 1 +   K L   C e
Freundlich model:
q e =   K F   C e 1 / nF
Temkin model:
q e = B T ln ( K T C e )
where q e and C e . are the uptake and concentration at the equilibrium, respectively. qm (mg/g) is the maximum uptake of the adsorbent, KL (L/mg) is the Langmuir constant related to the free energy of adsorption. KF (mg/g) (L/g)n and nf are Freundlich constants, which are indicators of adsorption capacity and adsorption intensity, respectively. BT (KJ/mol) and KT (L/g) are the Temkin constants.

2.5.3. Thermodynamic Study

Temperature is an indicator of the nature of the adsorption, that is, whether it is an exothermic (ΔH° < 0) or endothermic (ΔH° > 0) process. Measurement of the adsorption heat ΔH° is the main criterion for differentiating chemisorption from physisorption [32].
ΔG°, ΔH° and ΔS° are the thermodynamic parameters that determine the feasibility and spontaneity of the adsorption process. They were determined using the following relations [7,33]:
K ad   = q e C e
Δ G ° = RT . ln K ad
ln K ad   = Δ S ° R Δ H ° RT
where, Kad (L/g) is the distribution constant, qe (mg/g) represents the equilibrium solid-phase concentration, ΔG° (J/mol) is the standard free energy change, ΔH° (J/mol) is the standard enthalpy change and ΔS° (J/mol.K) is the standard entropy change, R is the universal gas constant (J/mol. K), and T is the absolute temperature (K).

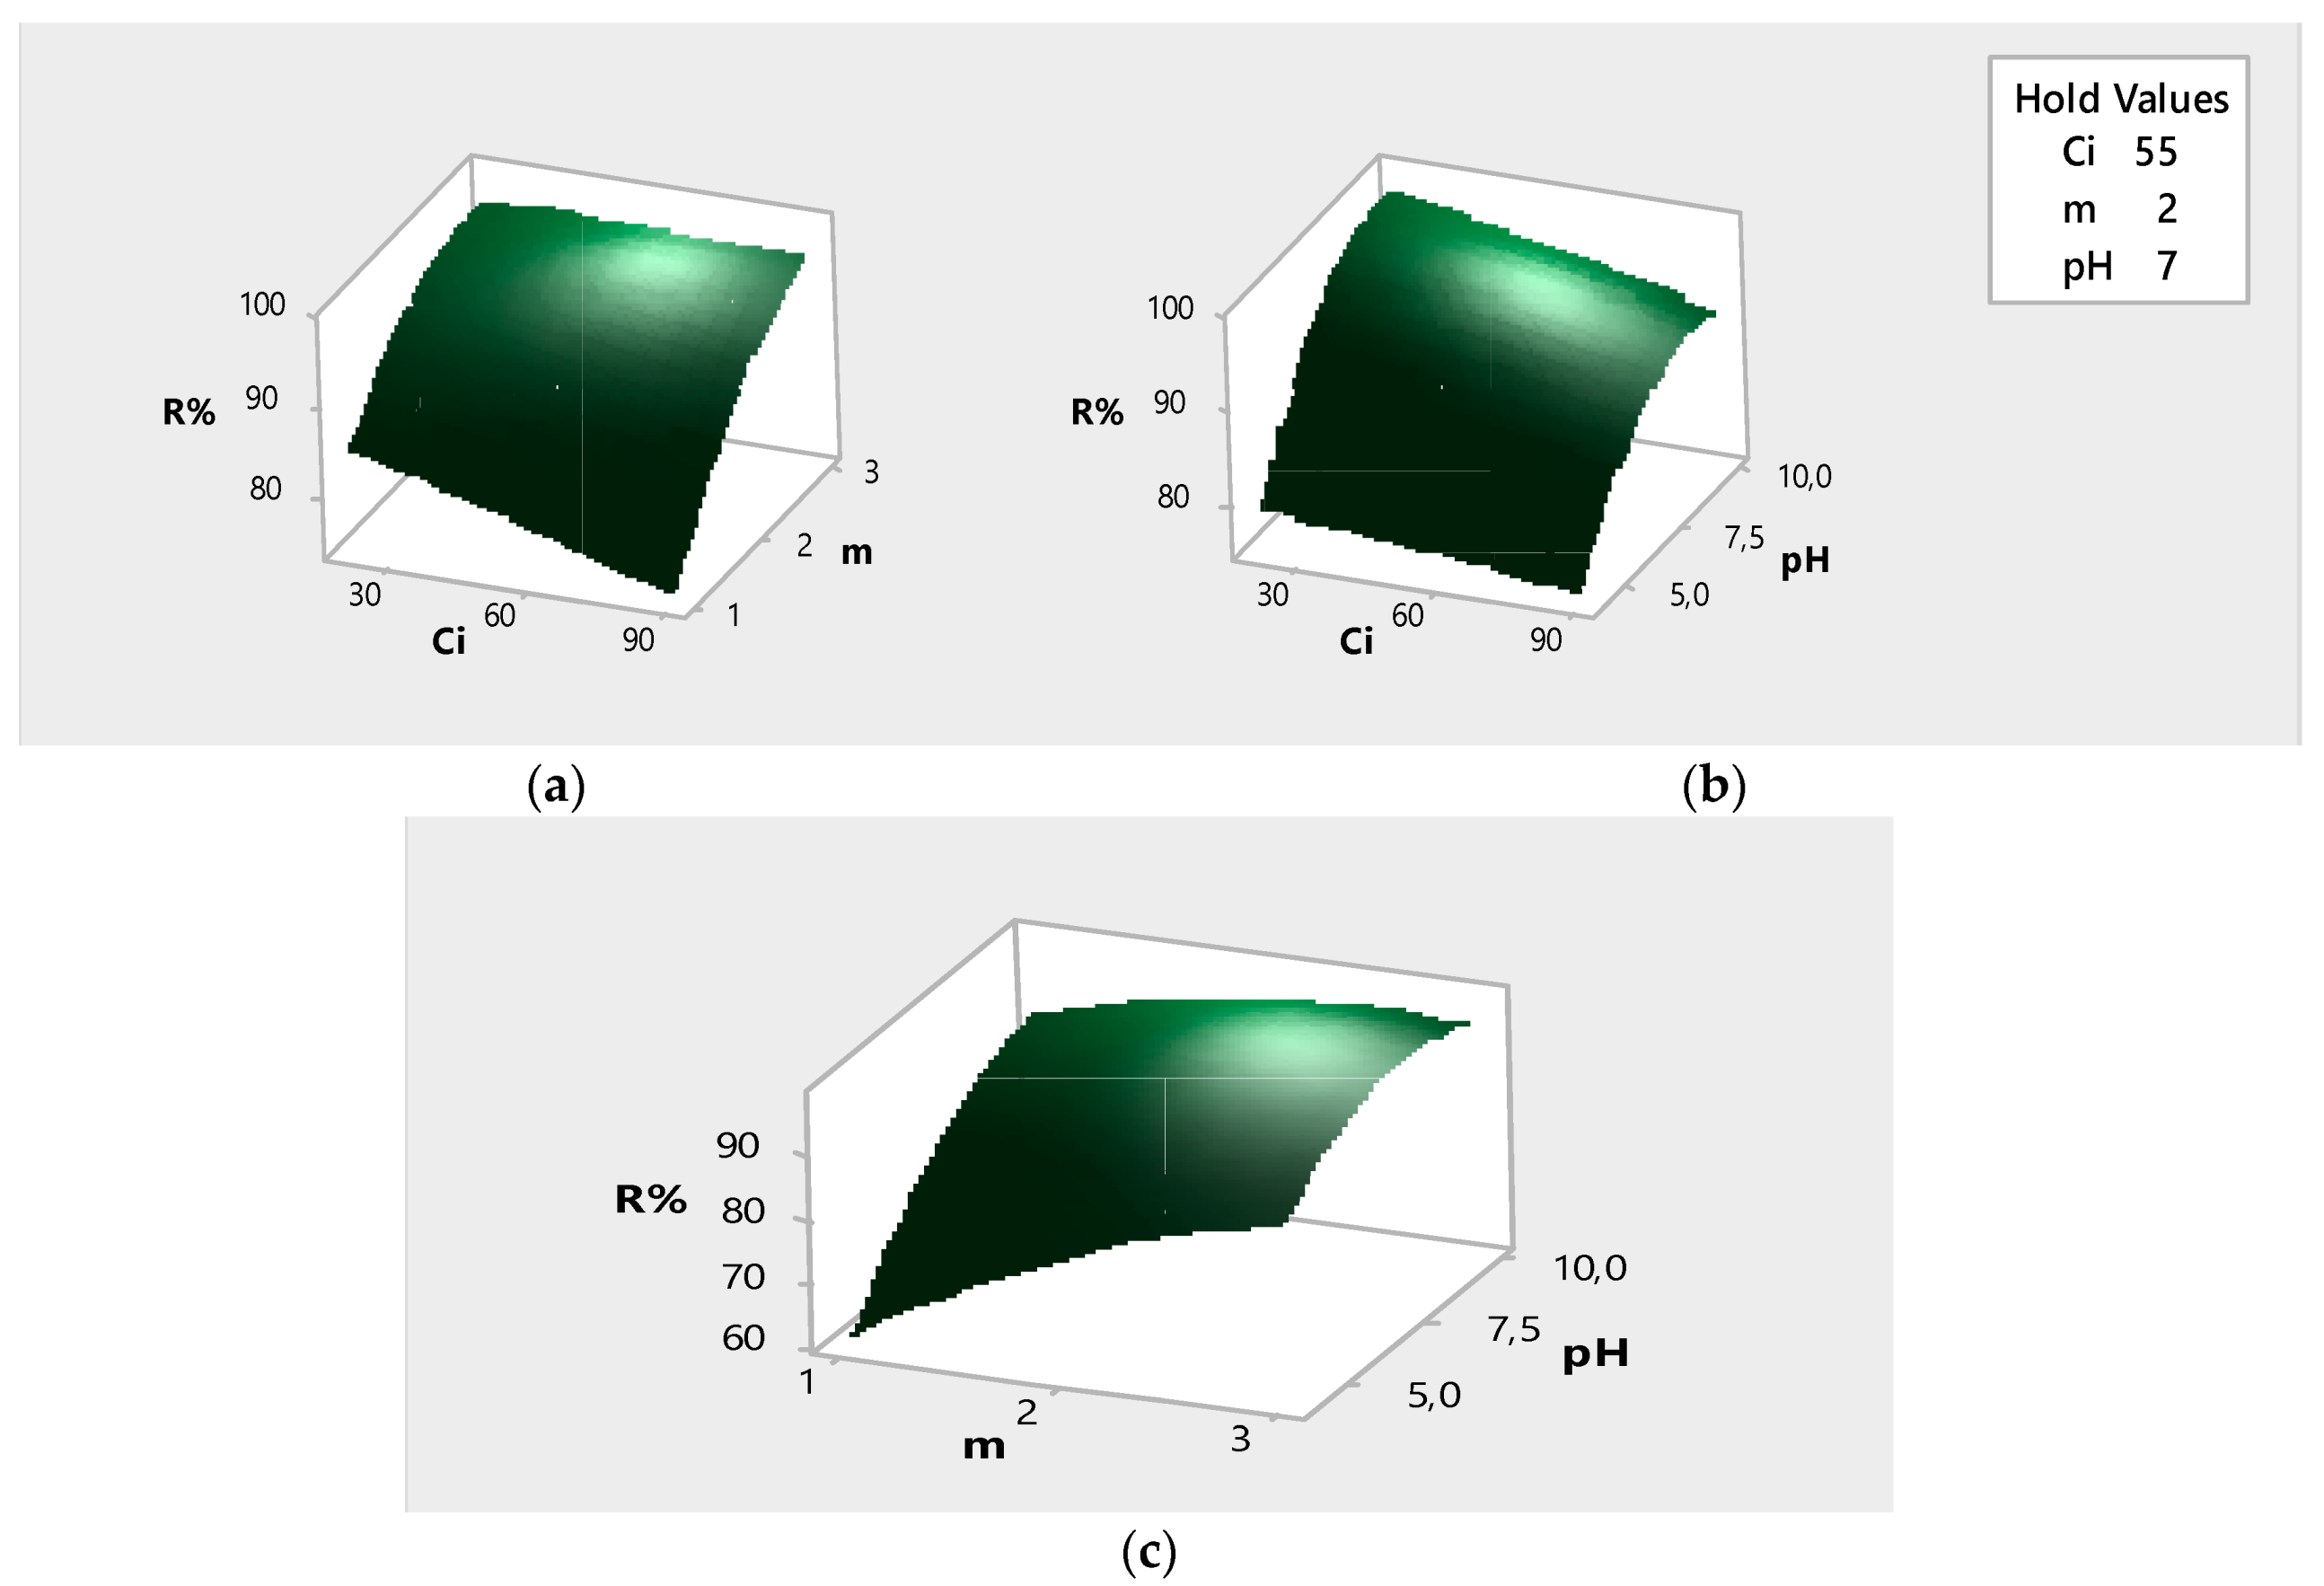
2.6. Experimental Design and Statistical Analysis

A three-level, three-factor, 15-assay Box–Behnken factorial design was used to optimize MC adsorption on the adsorbent prepared from SSS using the software Minitab (version 17). The advantages of BBD are that it avoids having to experiment in extreme conditions and it does not involve combinations for which all factors are simultaneously at their highest or lowest points [19,34,35].
The independent variables selected for the study are the initial concentration of the aqueous solution MC (X1), the adsorbent dosage (X2) and the solution pH (X3), which are considered the factors that have the most influence on the adsorption of the model medication. However, the adsorbent-adsorbate contact time is set at 90 min, as this is the time needed to reach equilibrium. These independent variables were studied at three different levels, low (−1), middle (0) and high (+1), as shown in Table 1 [19]. The predicted response Y is related to these factors through a quadratic polynomial as follows:
Y % = a 0 + a 1 X 1 + a 2 X 21 + a 3 X 3 + a 11 X 1 2 + a 22 X 2 2 + a 33 X 3 2 + a 12 X 1 X 2 + a 13 X 1 X 3 + a 23 X 2 X 3
where Y is the measured response, a0 is the intercept, a1, a2, a3 are linear coefficients, aii(i=1,3) are quadratic coefficients, and aij(i,j=1,3, i≠j) are interactive coefficients.

3. Results

3.1. Characterization of SSS Adsorbent

3.1.1. Fourier Transform Infrared Spectroscopy

The FTIR spectra of the adsorbent before and after adsorption of MC are presented in Figure 1. The FTIR spectra of the SSS clearly show several absorption peaks which reflect the complex nature of the material examined. The broad absorption peak around 3331.5 cm−1 was indicative of the existence of bonded hydroxyl groups on the surface of SSS. The peaks around 2912 and 2102 cm−1 were assigned to the stretching vibration and bending vibration of the C–H bond, respectively [7,16,36]. The broadband at 1732 cm−1 was assigned to the carbonyl group (C=O). The peaks associated with the stretching vibration in aromatic rings (C=O and –NH of amide groups) were observed at 1591 and 1505 cm−1. The weak peaks around 1419 cm−1, 1369 cm−1 and 1316 cm−1 were attributed to the vibration of the –CN bond [9,16]. The peak at nearly 1234 cm−1 was assigned to the bending vibration of carboxylic groups while deformation related to C–O bond was observed at 1040 cm−1 [32].
The strong peak at 1029 cm−1 was attributed to the Si (Si–O) valence vibrational binding. However, the weak peaks that intervene in the range 450–650 cm−1 can be attributed to the Si-reflection vibration binding S–O. All these peaks indicate the massive presence of oxygenated groups on the surface of SSS [36]. However, when the two spectra are compared, it is clear that the SSS spectrum after adsorption of MC shows a slight difference, namely, a generally slight shift in all peaks as well as an increase in the intensity of the peaks around 1594, 1316 and 983 cm−1. These changes are attributed to the loading of the SSS surface with the molecule of the model drug MC [22].

3.1.2. Scanning Electro-Microscopy (SEM)

The morphology of SSS examined by SEM, is illustrated in Figure 2. The SEM micrograph clearly shows that the SSS has an irregular and porous surface and the pores form a kind of honeycomb. This structure allows the MC solution to penetrate into the pores and attach to host sites. Indeed, this ability of the SSS to adsorb the MC was confirmed visually by the staining of the adsorbent after the adsorption test.

3.1.3. BET Specific Surface Area and Other Characteristics of SSS

The physico-chemical characteristics of SSS are summarized in Table 2. As observed, the BET surface area of the SSS was found to be 6.106 m2/g, with a total pore volume of 9.689 cm3/g, and average pore diameter of 3.17330 Å; this shows that the SSS have better surface characteristics as a natural adsorbent, without any treatment.
In addition, the SSS had a very high porosity of about 90% which is in agreement with the SEM characterization, as shown in Figure 2. On the other hand, the real and apparent density, as well as the zero load point were determined. These gave us the same resolution as the other parameters.
Guediri et al. [37] showed a porosity of 79% with a bulk density of 0.026 g/cm3 for orange peels treated with phosphoric acid (OP-H3 PO4). Stavrinou et al. [38] determined BET surface areas of 0.8549 m2/g and 0.6140 m2/g for cucumber peel and potato peel, respectively.

3.2. Adsorption Equilibria

3.2.1. Effect of Adsorbent–Adsorbate Contact Time and Initial MC Concentration

The effect of the contact time (0–120 min) and the initial MC concentration (20, 30, 60, 90, 120, 150 mg/L) on the adsorption efficiency are shown in Figure 3. The adsorption efficiency of MC increases with the contact time and reaches equilibrium at about 90 min with a maximum removal value of 90.07% for an initial concentration of 20 mg/L, pH = 6 of the solution and 2 g/L of the SSS dosage. The rapid increase in MC adsorption efficiency in the first 30 min can be attributed to the availability of the uncovered surface as well as the high number of empty active sites at the initial time of the process on the adsorbent surface. It is clear that the elimination efficiency decreases from 90.07 to 69.77% when the initial concentration of MC decreases from 20 to 150 mg/L. This result can be explained by considering that at a lower initial MC concentration, the ratio of the adsorbent active sites to the total adsorbate is high and therefore all adsorbate molecules can interact with the adsorbent and be removed from the solution [7,17]. However, the uptake of MC at equilibrium state climbed from 8.96 mg/g to 52.50 mg/g, when the initial drug concentration increased from 20 to 150 mg/L. Indeed, it can be assumed that because of the increase in the content of MC in solution, and therefore the increase in the concentration gradient, the arrival of the molecules of the adsorbate towards the surface of the adsorbent becomes easier, which induces the higher occupation of active sites. [18,19,20,21,22,23,24,25,26,27,28,29,30,31,32,33,34,35,36,37,38,39]. Therefore, 60 mg/L was selected as the optimum initial concentration of MC for the adsorption experiments.

3.2.2. Effect of Adsorbent Dosage

The dependence of the MC adsorption efficiency on the dosage of SSS (1–3 g/L) for an initial concentration of 60 mg/L, a solution pH 6 and a contact time of 120 min is illustrated in Figure 4. The adsorption rate increases with the dose of SSS and stabilizes from 2.5 g/L. A significant improvement in the adsorption of MC from 66.39% to 89.04% is observed when the SSS dosage changes from 1 to 2.5 g/L. This result is due to the increase in functional groups and adsorption sites, which is linked to the properties of the adsorbent [7,17].
On the other hand, the increase in sorbent dose from 1 g/L to 3 g/L caused a decrease in the uptake of MC from 39.72 mg/g at 17.60 mg/g, respectively, which is entirely logical given that “q” is inversely proportional to the total quantity of adsorbent in suspension [39].

3.2.3. Effect of pH

The initial pH of the adsorption medium is one of the most influential parameters in the process of adsorption, it affects both the surface charges of the adsorbent and the degree of ionization of the adsorbate. In the present study, the adsorption experiments were performed in the initial solution pH range from 2 to 12 (Figure 5). The results show a significant increase in the adsorption efficiency and uptake from 19.83% and 4.42 mg/g to 88.33% and 21.26 mg/g when the pH values increased from 2 to 4, respectively, followed by a slight increase for pH 12 (95.97%, 22.75 mg/g). The increase in adsorption efficiency may also be due to the protonation of functional groups on the adsorbent surface. As already shown, the pHZPC of SSS is 7.14; therefore, the surface of the adsorbent will be positively charged at a pH below pHZPC and negatively at a pH above pHZPC. Thus, adsorption of MC (cationic substance) is favorable in basic medium. On the other hand, at acidic pHs, the surface of the SSS is excessively protonated, thus, the overall load of the adsorbent is positive. The cationic molecule MC releases positive ions in solution. Consequently, the electrostatic attraction of the cationic pollutant decreases and its adsorption becomes weaker. As the pH increases, the concentration of H ions decreases and more MC molecules occupy the active sites of the SSS until saturation [7,8].

3.2.4. Effect of Temperature

One of the important parameters affecting adsorption capacity is the temperature of the solution. To determine the effect of temperature on the adsorption of MC onto SSS, a study was carried out in the range of 25–40 °C, and the results are shown in Figure 6. The obtained results reveal a slight increase in the MC adsorption efficiency, from 89.04% at 25 °C to 91.97% at 40 °C, and an uptake of 21.41 mg/g at 25 °C to 22.07 mg/g at 40 °C with the increase in temperature. This behavior was evident because as the temperature increases, the viscosity of the solution decreases, which is favorable for the adsorption steps of external transfer, and adsorbate diffusion inside the adsorbent solid. This increase may be due to the increased mobility of MC, which allows it to penetrate the pores of the sample, the increased chemical interactions between the adsorbate and the adsorbent surface functions, or changes in chemical potentials that correlate with the solubility of the adsorbate species. This small variation is indicative of physisorption and suggests that the adsorption is endothermic [32,33].

3.3. Kinetics of Adsorption

The adsorption kinetic is an essential tool in the study of the adsorption mechanism. Therefore, pseudo-first order, pseudo-second order, and intra-particle diffusion models were used to describe the adsorption process. The constants obtained from these three kinetic models are given in Table 3. The results show that the pseudo-second-order model is better adapted because of the high correlation coefficient (R² > 0.99), good agreement between equilibrium uptakes calculated by the model (q2) and the experimentally obtained (qe), and the weak average relative errors. Similar results have been observed in the adsorption of MC on activated carbon [40] and factory-rejected tea [18]. Adsorption of MC onto the adsorbent may comprise several steps, but in this study, kinetic models of pseudo-first order and pseudo-second order could not determine the adsorption mechanism. Hence, intra-particle scattering was used to clarify the adsorption mechanism. The results of this study also showed that adsorption of MC takes place in three stages. The first step is attributed to the transfer of MC in the solution to the liquid phase located near the surface of the adsorbent. The second is the diffusion of the adsorbate through the liquid film surrounding the adsorbent grain while the third corresponds to the diffusion of the MC in the pores of the adsorbent. This last step is the limiting step; it is the slowest step of the process [9,41].

3.4. Adsorption Isotherms

To carry out a more detailed study of the adsorption mechanism, the adsorption isotherms were adjusted to the Langmuir, Freundlich and Temkin models. The constants obtained from the equations of these three models are summarized in Table 4. The results show that the Temkin model is the one that best simulates this process because of the higher correlation coefficient (R2 > 0.970), and a lower mean relative error (ARE = 9.804%). Similar results were observed in the study of adsorption of MC via maize silk powder [25]. For the Langmuir model, the value of the separation factor RL describes the feasibility of the adsorption process. In our study, RL values vary between 0.071 and 0.652 indicating favorability of adsorption [42]. The latter also allowed us to determine the maximum uptake of MC on SSS, qm = 63.29 mg/g at equilibrium time tequ = 90 min. As a comparison, Oguntimein [39] determined a maximum uptake of qm = 0.0365 mg/g for the adsorption of MC onto SSS treated with sodium hydroxide (0.05 M NaOH) at tequ = 120 min, and El-Halwany [43] determined a maximum uptake of qm = 39.4 mg/g for the adsorption of MC onto activated carbon prepared by chemical activation of SSS uses phosphoric acid (H3PO4) at tequ = 150 min.
The Freundlich isotherm model allowed us to determine the parameter nF, which determines the adsorption effectiveness. According to the results, the calculated value of the Freundlich isotherm model constant, nf is greater than 1 (nF = 1.879), which confirms that the adsorption phenomenon is favorable [42].

3.5. Thermodynamic Study

Since temperature plays an important role in MC adsorption, the thermodynamic adsorption parameters were calculated to evaluate the thermodynamic feasibility and the spontaneous nature of the process (Table 5). The results showed that the adsorption of MC on SSS was spontaneous and favorable at all experimental temperatures as a result of the negative values of ΔG; furthermore, the ΔG values decrease with increasing temperature (from −2.967 KJ/mol for 25 °C to −3.953 KJ/mol for 40 °C), which indicates that this process becomes less favorable as the temperature increases. Similar results were observed by Gao et al. [42] in the study of adsorption of MC onto activated carbon produced from tea (Camellia sinensis L.) seed shells. The positive value of ΔH (ΔH = 58.461 KJ/mol) suggests that the process is endothermic [33]. We can see that the entropy value ΔS is positive, almost constant and weak for the whole range of temperatures studied (0.206–0.199 KJ/mol K); this indicates an increase in the randomness of interactions in the diffusion layer during the adsorption process [17].

3.6. Optimization and Modeling by Response Surface

In this study, a three-level, three-factor, 15-assay BBD was used to optimize MC adsorption on adsorbent prepared from SSS. The independent variables evaluated for the study are the initial concentration of the aqueous solution MC (X1), the adsorbent dosage (X2) and the solution pH (X3) (Table 1). The experiments were performed to optimize the adsorption efficiency of the medication on the prepared adsorbent. The obtained results are summarized in Table 6, in which the response evaluated was the MC removal (Y).
The obtained responses were analyzed using Minitab 17 software. The polynomial equation that describes the main effects, the interaction effects and the quadratic effects of the selected independent variables show a significant influence on the responses [44]. The results of the analysis were evaluated using ANOVA variance analysis and are presented in Table 7.
The high values of the correlation coefficient (R²) and the adjusted correlation coefficient (R²Adj), 0.97 and 0.91, respectively, show that the proposed model explains more than 91% of the variations in the experimental response [35].
Similar results were determined by Gulen and Demircivi [45] who determined values of 0.9224 and 0.8227 for R2 and R2Adj coefficients, respectively. So, the authors concluded that these values indicated good fitness and high significance for the statistical model. Elmoubarki et al. [46] also reported that the obtained R2 coefficients are in reasonable agreement with the R2 Adj and more than 95% of the response can be well predicted by the models.
The quadratic model is written in the following form:.
Y % = 4.4 0.121   C i + 29.50   m + 15.60   pH 0.67   pH 2 1.550   m · pH
The quadratic model well describes the adsorption efficiency (Y%) of MC on the adsorbent (SSS). It is significant and adequate as proved by the p-value (p-value = 0.003) with only 3% of total unapplied variations for the model (R2 = 97%) [35,44].
Figure 7 shows the 3-D response surfaces of the individual and interaction effects of the parameters that influence the MC adsorption process on SSS. The 3-D curves were plotted by varying two parameters in the experimental domain while the third parameter is kept constant (at the center level). It was found that high adsorption efficiency can be attained at low initial concentrations and high pH (Figure 7b). With respect to the effect of amount on adsorption efficiency, it can be seen in Figure 7a,c that high efficiency can be obtained when the adsorbent dosage of SSS is high [35]. This is confirmed by Figure 8 which shows the optimal conditions for maximum MC adsorption efficiency onto SSS.
Model terms with a p-value <0.05 are significant at a 95% confidence level, while terms with a p-value <0.05 do not affect the response [44].
Based on the analysis of the statistical results, it can be concluded that the resulting quadratic model is adequate and appropriate for describing the relationship between experimental parameters and adsorption efficiency [35].
Moreover, the optimization of the operating conditions was conducted using the maximum response function (Y = 98.77%) which could be obtained by taking the following operating conditions: Ci = 20 mg /L, m = 2.4 g/L and pH = 8.9.
The predicted optimal adsorption yield was verified by performing three tests under optimal operating conditions (Y = 95.58%). The standard deviation of the achieved experimental results in comparison to the theoretical results is 2.25. Thus, it can be concluded that the model describing the adsorption of MC on SSS is valid.

4. Conclusions

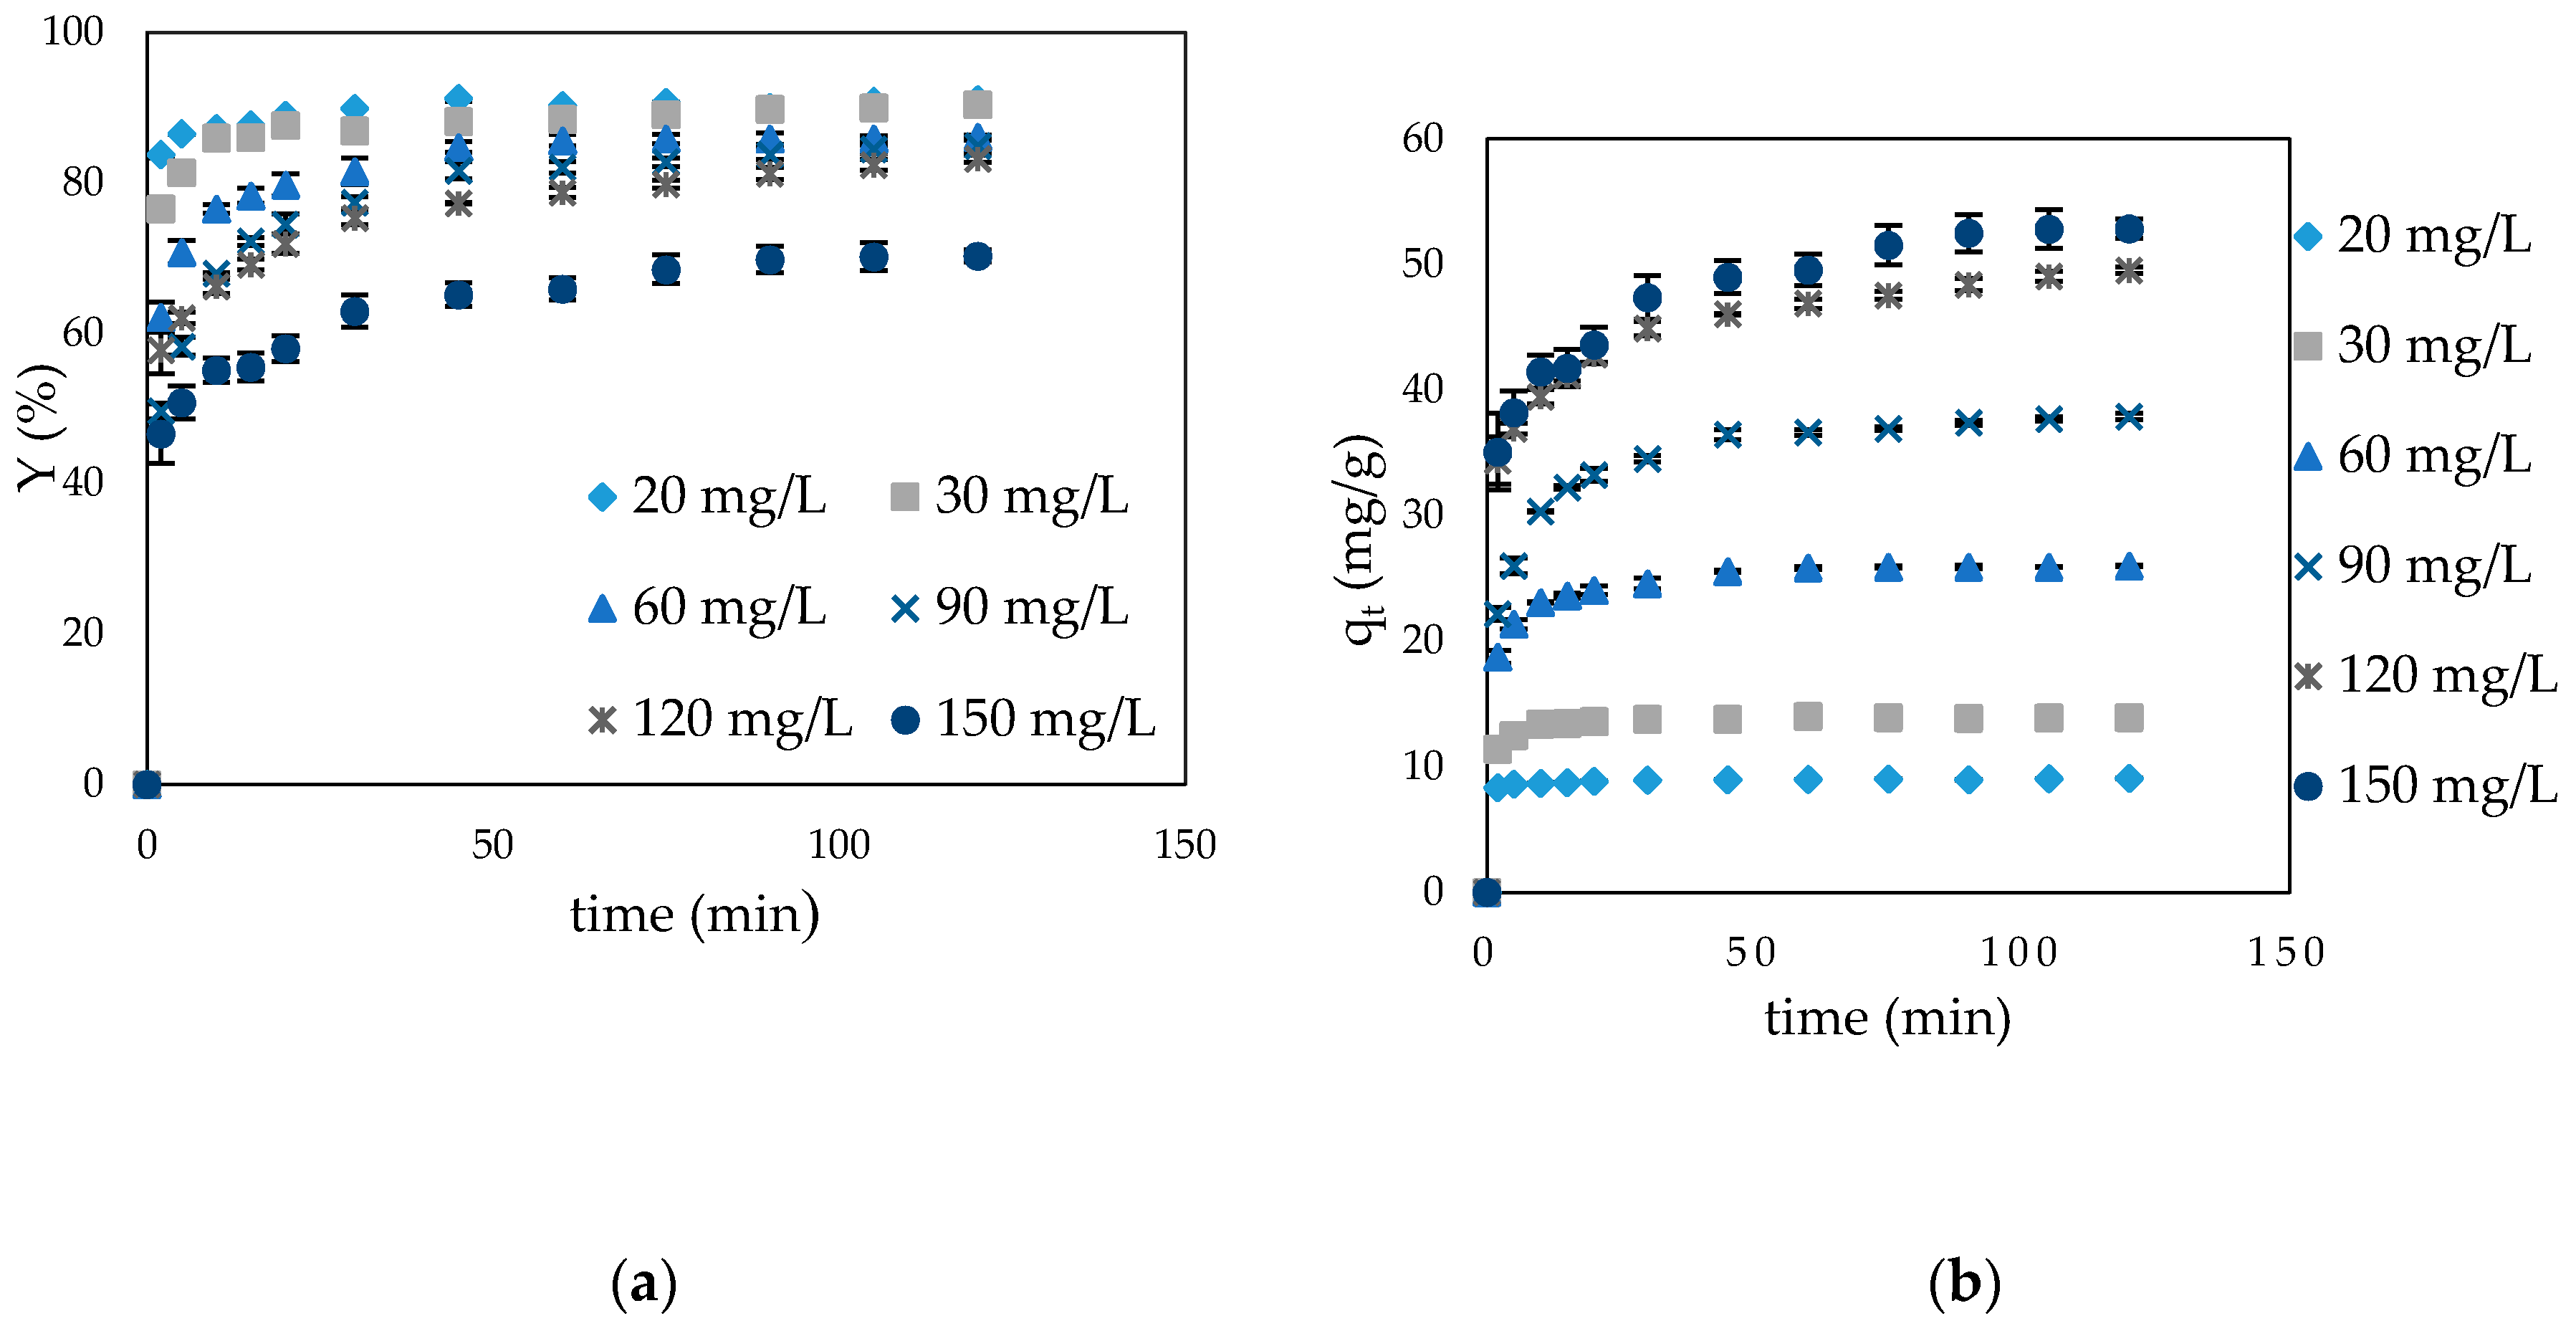
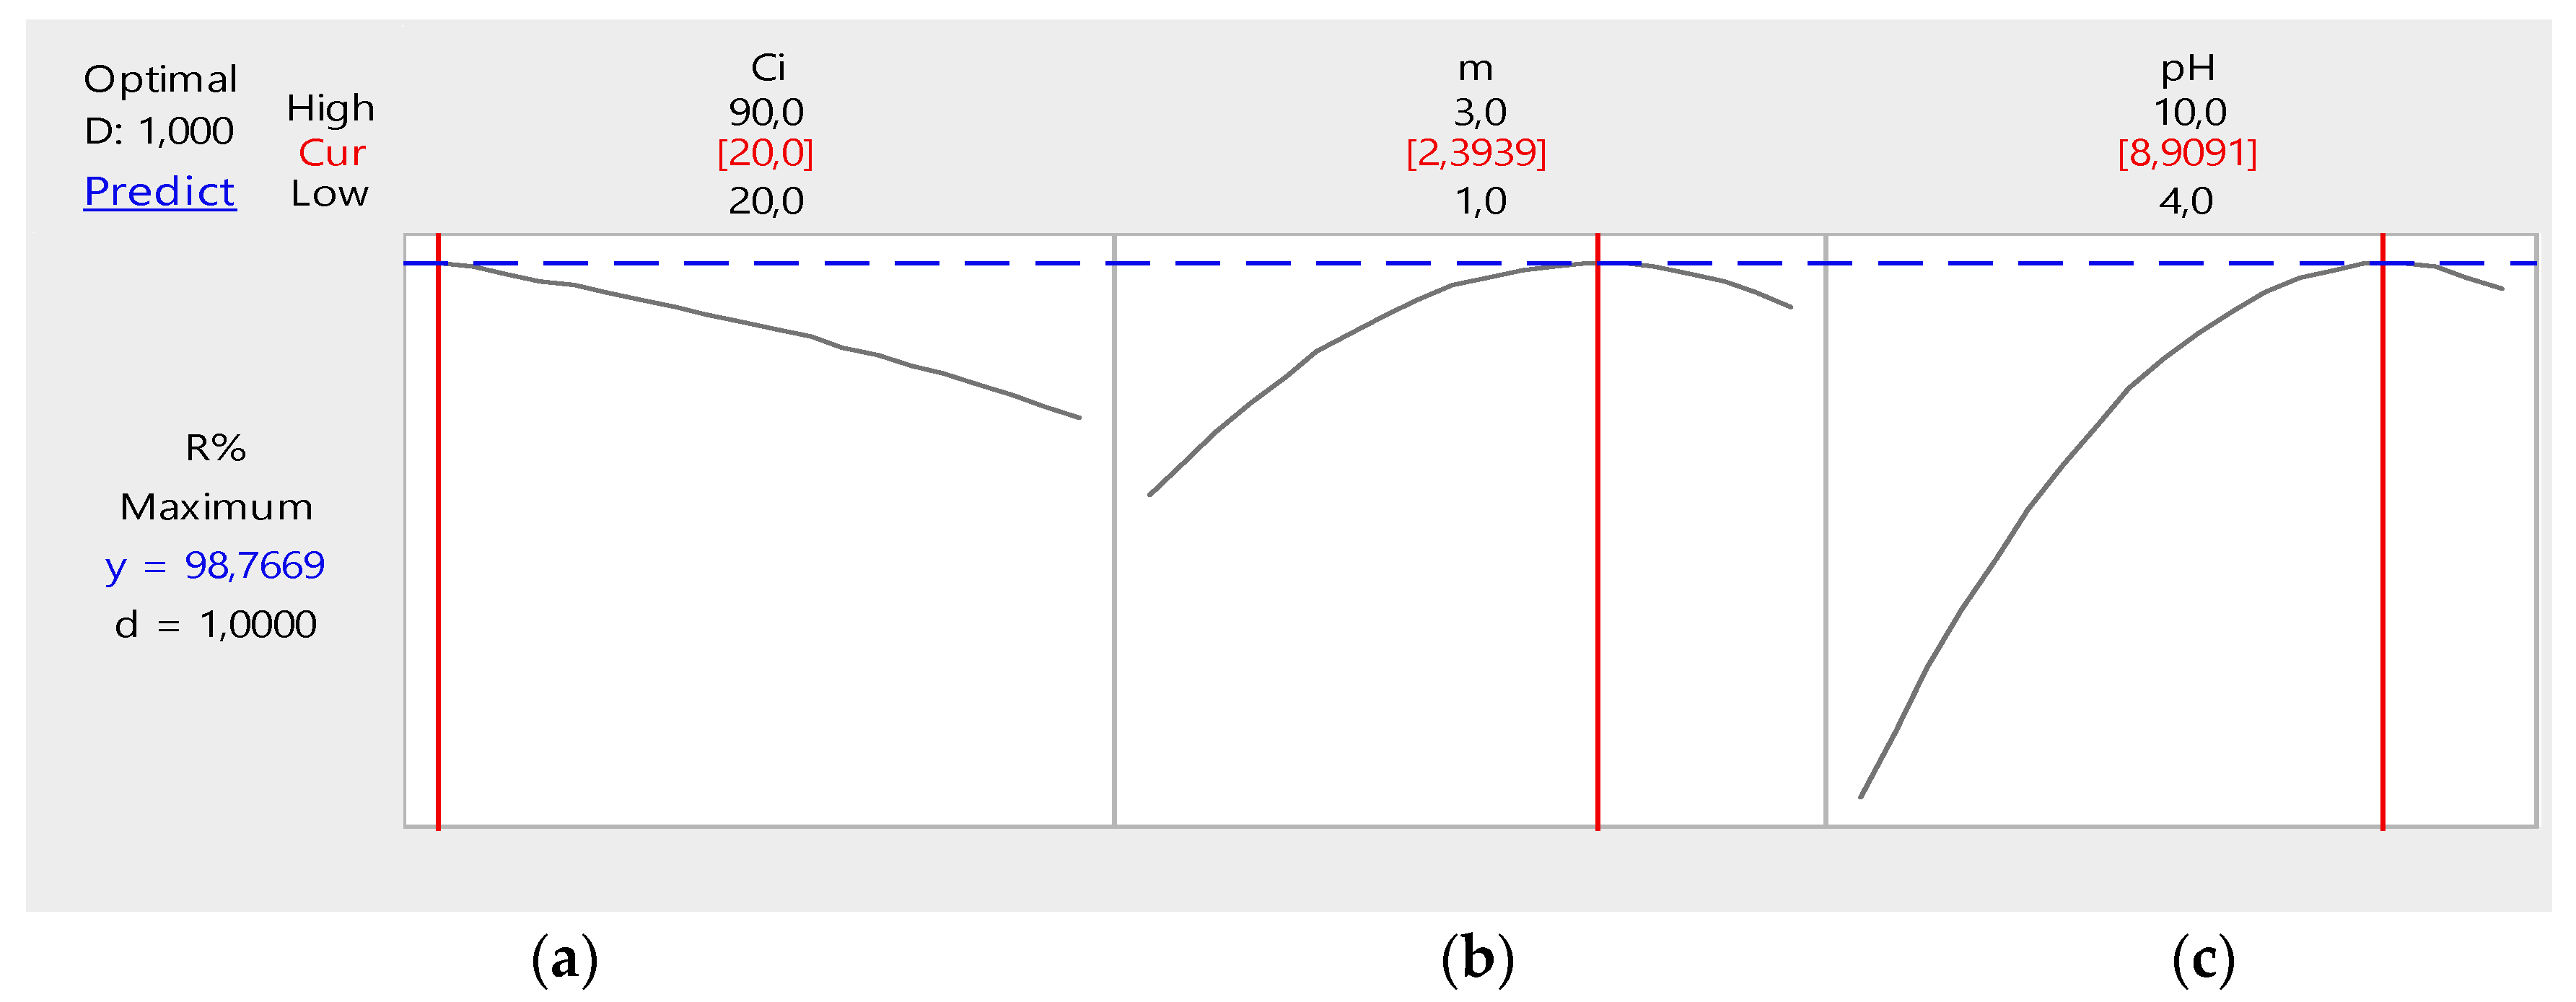
In this work, two approaches were used, the first was the evaluation of MC adsorption on SSS by kinetic, thermodynamic and equilibrium studies; and the second was modeling with an experimental Box–Behnken design. The equilibrium data indicated that the adsorption was fast and achieved within 120 min of contact time. Analyses of the kinetic and isotherm models revealed that the experimental data were well fitted by the pseudo-second order model and the Temkin isotherm, respectively. The adsorption process was shown to be controlled by intra-particle diffusion in the later stages. The thermodynamic study showed that adsorption was endothermic, spontaneous, and thus followed a physisorption mechanism. Furthermore, BBD design was appropriate for determining the optimal conditions for MC adsorption onto SSS. The optimal conditions of adsorption are an adsorbent dose of 2.4 g/L, an initial MC concentration of 20 mg/L and pH = 8,9 with a solution temperature of 25 °C; in these conditions the adsorption efficiency was 95.58%. Thus, SSS may be considered as a cheap and excellent adsorbent that shows excellent adsorptive characteristics for the removal of MC from aqueous solutions.

Author Contributions

B.H. contributed to the design of the experiment, performed the experimental work, considered the results and wrote the paper. M.B. and S.B.-B. supervised and contributed to writing and editing. M.P. and M.A.S. revised and corrected the paper. All authors have read and agreed to the published version of the manuscript.

Funding

This study was funded by the Algerian Ministry of Higher Education and Scientific research, research project code N: A16N01UN060120190001 and the Spanish Ministry of Science, Innovation and Universities, Xunta de Galicia and ERDF (Grant Nº CTM2017−87326-R and ED431C 2017/47).

Conflicts of Interest

Page: 38The authors declare no conflict of interest.

References

  1. Zhou, J.L.; Zhang, Z.L.; Banks, E.; Grover, D.; Jiang, J.Q. Résidus pharmaceutiques dans les effluents des usines de traitement des eaux usées et leur impact sur la réception de l’eau de la rivière. J. Hazard. Mater. 2009, 166, 655–661. [Google Scholar] [CrossRef]
  2. Zhang, S.; Dong, Y.; Yang, Z.; Yang, W.; Wu, J.; Dong, C. Adsorption of pharmaceuticals on chitosan-based magnetic composite particles with core-brush topology. Chem. Eng. J. 2016, 304, 325–334. [Google Scholar] [CrossRef]
  3. Bradberry, S. Methaemoglobinaemia (review). Medicine (U.K.) 2016, 44, 91–92. [Google Scholar]
  4. Choulis, N.H. Dermatological drugs, topical agents, and cosmetics. Side Eff. Drugs Annu. 2012, 34, 257–269. [Google Scholar]
  5. Congdon, E.E.; Wu, J.W.; Myeku, N.; Figueroa, Y.H.; Herman, M.; Marinec, P.S.; Ge Stwicki, J.E.; Dickey, C.A.; Yu, W.H.; Duff, K.E. Methylthioninium chloride (methylene blue) induces autophagy and attenuates tauopathy in vitro and in vivo. Autophagy 2012, 84, 609–622. [Google Scholar] [CrossRef] [PubMed] [Green Version]
  6. Hashweh, N.N.; Bartochowski, Z.; Khoury, R.; Grossberg, G.T. An evaluation of hydromethylthionine as a treatment option for Alzheimer’s disease. Expert Opin. Pharmacother. 2020. [Google Scholar] [CrossRef] [PubMed]
  7. Moussavi, G.; Khosravi, R. The removal of cationic dyes from aqueous solutions by adsorption onto pistachio hull waste. Chem. Eng. Res. Des. 2011, 89, 2182–2189. [Google Scholar] [CrossRef]
  8. Dahlan, N.A.; Ng, S.L.; Pushpamalar, J. Adsorption of methylene blue onto powdered activated carbon immobilized in a carboxymethyl sago pulp hydrogel. J. Appl. Polym. Sci. 2017, 134, 44271. [Google Scholar] [CrossRef]
  9. Krishni, R.R.; Foo, K.Y.; Hameed, B.H. Food cannery effluent, pineapple peel as an effective low-cost biosorbent for removing cationic dye from aqueous solutions. J. Desalin. Water Treat. 2014, 52, 6096–6103. [Google Scholar] [CrossRef]
  10. Lu, M.C.; Chen, Y.Y.; Chiou, M.R.; Chen, M.Y.; Fan, H.J. Occurrence and treatment efficiency of pharmaceuticals in landfill leachates. Waste Manag. 2016, 55, 257–264. [Google Scholar] [CrossRef]
  11. Han, R.; Wang, Y.; Zhao, X.; Wang, Y.; Xie, F.; Cheng, J.; Tang, M. Adsorption of methylene blue by phoenix tree leaf powder in a fixed-bed column: Experiments and prediction of breakthrough curves. Desalination 2009, 245, 284–297. [Google Scholar] [CrossRef]
  12. Rafatullah, M.; Sulaiman, O.; Hashim, R.; Ahmad, A. Adsorption of methylene blue on low-cost adsorbents: A review. J. Hazard. Mater. 2010, 177, 70–80. [Google Scholar] [CrossRef]
  13. Ip, A.W.M.; Barford, J.P.; McKay, G. Reactive Black dye adsorption/desorption onto different adsorbents: Effect of salt, surface chemistry, pore size and surface area. J. Collid Interface Sci. 2009, 337, 32–38. [Google Scholar] [CrossRef] [PubMed]
  14. Pandya, K.Y.; Patel, R.V.; Jasrai, R.T.; Brahmbhatt, N.H. Preliminary study on potential of seaweeds in decolorization efficacy of synthetic dyes effluent. Int. J. Plant Anim. Environ. Sci. 2017, 7, 223–4490. [Google Scholar]
  15. Sulyman, M. Agricultural by-products/waste as dye and metal ions adsorbents: A review. Int. J. Eng. Sci. 2016, 6, 1–20. [Google Scholar]
  16. Feng, Y.; Liu, Y.; Xue, L.; Sun, H.; Guo, Z.; Zhang, Y.; Yang, L. Carboxylic acid functionalized sesame straw: A sustainable cost-effective bio adsorbent with superior dye adsorption capacity. Bioresour. Technol. 2017, 238, 675–683. [Google Scholar] [CrossRef]
  17. Pouretedal, H.R.; Sadegh, N. Effective removal of amoxicillin, cephalexin, tetracycline and penicillin G from aqueous solutions using activated carbon nanoparticles prepared from vine wood. J. Water Process Eng. 2014, 1, 64–73. [Google Scholar] [CrossRef]
  18. Islam, M.A.; Benhouria, A.; Asif, M.; Hameed, B.H. Methylene blue adsorption on factory-rejected tea activated carbon prepared by conjunction of hydrothermal carbonization and sodium hydroxide activation processes. J. Taiwan Inst. Chem. Eng. 2015, 52, 57–64. [Google Scholar] [CrossRef]
  19. Danish, M.; Khanday, W.A.; Hashim, R.; Sulaiman, N.S.B.; Akhtar, M.N.; Nizami, M. Maniruddin, Application of optimized large surface area date stone (Phoenix dactylifera ) activated carbon for rhodamin B removal from aqueous solution: BoxBehnken design approach. Ecotoxicol. Environ. Saf. 2017, 139, 280–290. [Google Scholar] [CrossRef]
  20. Kausar, A.; Iqbal, M.; Javed, A.; Aftab, K.; Nazli, Z.H.; Bhatti, H.N.; Nouren, S. Dyes adsorption using clay and modified clay: A review. J. Mol. Liq. 2018, 256, 395–407. [Google Scholar] [CrossRef]
  21. Li, M.; Zhao, H.; Lu, Z.Y. Porphyrin-based porous organic polymer, Py-POP, as a multifunctional platform for efficient selective adsorption and photocatalytic degradation of cationic dyes. Microp. Mesoporous Mater. 2020, 292, 109774. [Google Scholar] [CrossRef]
  22. Suteu, D.; Zaharia, C.; Malutan, T. Removal of Orange 16 reactive dye from aqueous solutions by waste sunflower seed shells. J. Serb. Chem. Soc. 2011, 76, 607–624. [Google Scholar] [CrossRef]
  23. Narbat, M.K.; Orang, F.; Hashtjin, M.S.; Goudarzi, A. Fabrication of porous hydroxyapatite-gelatin composite scaffolds for bone tissue engineering. Iran. Biomed. J. 2006, 10, 215–223. [Google Scholar]
  24. Muhammad, S.; Hussain, S.T.; Waseem, M.; Naeem, A.; Hussain, J.; Jan, M.T. Surface charge properties of zirconium dioxide. Iran. J. Sci. Technol. 2012, 4, 481–486. [Google Scholar]
  25. Miraboutalebi, S.M.; Nikouzad, S.K.; Peydayesh, M.; Allahgholi, N.; Vafajoo, L.; McKay, G. Methylene blue adsorption via maize silk powder: Kinetic, equilibrium, thermodynamic studies and residual error analysis. Process Saf. Environ. 2017, 6, 191–202. [Google Scholar] [CrossRef]
  26. Langergen, S.; Svenska, B.K. Zur theorie der sogenannten adsoption geloester stoffe. K. Sven. Vetensk. Handl. 1898, 24, 1–39. [Google Scholar]
  27. Ho, Y.S.; Mckay, G. Pseudo-second order model for sorption processes. Process Biochem. 1999, 34, 451–465. [Google Scholar] [CrossRef]
  28. Weber, W.J.; Morris, J.C. Kinetics of adsorption on carbon from solution. J. Sanit. Eng. Div. Proc. Am. Soc. Civ. Eng. 1963, 89, 31–60. [Google Scholar]
  29. Langmuir, I. The constitution and fundamental properties of solids and liquids. J. Am. Chem. Soc. 1916, 38, 2221–2295. [Google Scholar] [CrossRef] [Green Version]
  30. Freundlich, H.M.F. Über die adsorption in lösungen. Z. Phys. Chem. 1906, 57, 385–470. [Google Scholar] [CrossRef]
  31. Temkin, M.J.; Phyzev, V. Recent modifications to Langmuir isotherms. Acta Physicochim. USSR 1940, 12, 217–222. [Google Scholar]
  32. Colak, F.; Atar, N.; Olgun, A. Biosorption of acidic dyes from aqueous solution by Paenibacillus macerans: Kineti, thermodynamic and equilibrium studies. Chem. Eng. J. 2009, 150, 122–130. [Google Scholar] [CrossRef]
  33. Chaudhry, S.A.; Ahmed, M.; Siddiqui, S.I.; Ahmed, S. Fe(III)-Sn(IV) mixed binary oxide-coated sand preparation and its use for the removal of As(III) and As(V) from water: Application of isotherm, kinetic and thermodynamics. J. Mol. Liq. 2016, 224, 431–441. [Google Scholar] [CrossRef]
  34. Mourabet, M.; ElRhilassi, A.; ElBoujaady, H.; Bennani-Ziatni, M.; ElHamri, R.; Taitai, A. Removal of fluoride from aqueous solution by adsorption on Apatitic tricalcium phosphate using Box–Behnken design and desirability function. Appl. Surf. Sci. 2012, 258, 4402–4410. [Google Scholar] [CrossRef]
  35. Tripathi, P.; Srivastava, V.C.; Kumar, A. Optimization of an azo dye batch adsorption parameters using Box–Behnken design. Desalination 2009, 249, 1273–1279. [Google Scholar] [CrossRef]
  36. Oliveira, R.N.; Mancini, M.C.; Oliveira, F.C.S.; Passos, T.M.; Quility, B.; Thire, R.M.S.; Mcguiness, G.B. FTIR analysis and quantification of phenols and flavonoids of five commercially available plants extracts used in wound healing. Revista Matéria 2016, 21, 767–779. [Google Scholar] [CrossRef] [Green Version]
  37. Guediri, A.; Bouguettoucha, A.; Chebli, D.; Chafai, N.; Amrane, A. Molecular dynamic simulation and DFT computational studies on the adsorption performances of methylene blue in aqueous solutions by orange peel-modified phosphoric acid. J. Mol. Struct. 2020, 1202, 127290. [Google Scholar] [CrossRef]
  38. Stavrinoua, A.; Aggelopoulosa, C.A.; Tsakiroglou, C.D. Exploring the adsorption mechanisms of cationic and anionic dyes onto agricultural waste peels of banana, cucumber and potato: Adsorption kinetics and equilibrium isotherms as a tool. J. Environ. Chem. Eng. 2018, 6, 6958–6970. [Google Scholar] [CrossRef]
  39. Oguntimein, G.B. Textile Dye Removal using Dried Sun Flower Seed Hull a New Low Cost Biosorbent: Equilibrium, Kinetics and Thermodynamic Studies. Adv. Res. Text. Eng. 2016, 1, 1008–1014. [Google Scholar]
  40. Foo, K.Y.; Hameed, B.H. Preparation and characterization of activated carbon from sunflower seed oil residue via microwave assisted K2CO3 activation. Bioresour. Technol. 2011, 102, 9794–9799. [Google Scholar] [CrossRef]
  41. Marrakchia, F.; Ahmed, F.; Khanday, W.A.; Asif, M.; Hameed, B.H. Mesoporous-activated carbon prepared from chitosan flakes via single-step sodium hydroxide activation for the adsorption of methylene blue. Int. J. Biol. Macromol. 2017, 98, 233–239. [Google Scholar] [CrossRef] [PubMed]
  42. Gao, J.; Qin, Y.; Zhou, T.; Cao, D.; Xu, P.; Hochstetter, D.; Wang, Y. Adsorption of methylene blue on activated carbon produced from tea (Camellia sinensis L.) seed shells: Kinetics, equilibrium, and thermodynamics studies. J. Zhejiang Univ. Sci. B 2013, 14, 650–658. [Google Scholar] [CrossRef] [PubMed] [Green Version]
  43. El-Halwany, M.M. Kinetics and Thermodynamics of Activated Sunflowers Seeds Shell Carbon (SSSC) as Sorbent Material. J. Chromatogr. Sep. Tech. 2013, 4, 5–11. [Google Scholar] [CrossRef]
  44. Segurola, J.; Allen, N.S.; Edge, M.; Mahon, M.M. Design of eutectic photoinitiator blends for UV/visible curable acrylated printing inks and coatings. Prog. Org. Coat. 1999, 37, 23–37. [Google Scholar] [CrossRef]
  45. Gulen, B.; Demircivi, P. Adsorption properties of flouroquinolone type antibiotic ciprofloxacin into 2:1 dioctahedral clay structure: Box-Behnken experimental design. J. Mol. Struct. 2020, 1206, 127657. [Google Scholar] [CrossRef]
  46. Elmoubarki, R.; Taoufik, M.; Moufti, A.; Tounsadi, H.; Mahjoubi, F.Z.; Bouabi1, Y.; Qourzal, S.; Abdennouri, M.; Barka, N. Box-Behnken experimental design for the optimization of methylene blue adsorption onto Aleppo pine cones. J. Mater. Environ. Sci. 2017, 8, 2184–2191. [Google Scholar]
Figure 1. FTIR spectra of sunflower seed shells (SSS) before and after adsorption of methylthioninium chloride (MC).
Applsci 10 03271 g001
Figure 2. SEM micrograph of SSS.
Applsci 10 03271 g002
Figure 3. Evolution of adsorption efficiency (a) and uptake (b) of MC at equilibrium in terms of contact time and initial MC concentration (conditions: SSS dose: 2 g/L, pH 6.0, flask shaking at 300 rpm at 25 °C).
Applsci 10 03271 g003
Figure 4. Effect of adsorbent dose on the adsorption efficiency (a) and uptake (b) of MC onto SSS (conditions: initial MC concentration 60 mg/L, pH 6, flask shaking at 300 rpm at 25 °C).
Applsci 10 03271 g004
Figure 5. Effect of pH on the adsorption efficiency (a) and uptake (b) of MC onto SSS (conditions: initial MC concentration 60 mg/L, adsorbent dose: 2.5 g/L, flask shaking at 300 rpm at 25 °C).
Applsci 10 03271 g005
Figure 6. Effect of temperature on the adsorption efficiency (a) and uptake (b) of MC onto SSS (conditions: initial MC concentration 60 mg/L, adsorbent dose: 2.5 g/L, pH: 6, flask shaking at 300 rpm at 25 °C).
Applsci 10 03271 g006
Figure 7. Response surface plots of Y% or R%: (a) interaction Ci*m, (b) interaction Ci*pH, (c) interaction m*pH.
Applsci 10 03271 g007
Figure 8. Optimal conditions for maximum MC adsorption efficiency onto SSS: (a) Ci (mg/L) MC initial concentration, (b) m (g/L) SSS dosage and (c) pH.
Applsci 10 03271 g008
Table 1. Range of variation of operating parameters.
SymbolVariableLevel (−1)Level (0)Level (+1)
X1Ci (mg/l) MC initial concentration205590
X2m (g/L) SSS dosage123
X3pH4710
Table 2. Physical and chemical characteristics of SSS.
ParametersValues
Specific surface (m2/g)6.106
Average pore radius (Å)3.17330
Total pore volume (cm3/g)9.689
Porosity (%)82.92
Porous volume (cm3/g)2.217
Apparent density (g/cm3)0.374
Real density (g/cm3)2.189
pHZPC7.14
Table 3. Kinetic parameters of the adsorption of MC on the SSS following different kinetic models.
Initial Concentration of MC (mg/L)20306090120150
qe (exp.) (mg/g)9.02913.92725.89337.38948.5151.522
Pseudo-first order model
q1 (mg/g) 0.4571.5287.64912.22212.95815.979
k1 (1/min) 0.03580.06460.07440.04720.03710.038
R2 0.870.9440.9690.9650.9890.972
ARE (%)97.19192.53179.18678.70884.38082.813
Pseudo-second order model
q2 (mg/g) 9.04712.45326.24738.75944.44454.054
k2 (g/mg min) 0.2430.0160.0270.0090.0030.005
R2 10.9940.9990.9990.9910.999
ARE (%)1.45528.0992.4243.06426.5847.421
Intra-particle diffusion model
Kd1 (mg/g √min)0.3381.1371.1672.622.262.62
C1 (mg/g)7.8639.85813.43320.46131.97523.101
10.9930.8740.9140.9720.978
Kd2(mg/g √min)0.0480.0710.080.3690.8480.963
C2 (mg/g)8.5813.27325.12133.8540.32442.743
0.8750.8890.7410.9770.9980.806
ARE (%)3.7438.43915.49819.3043.28617.329
Table 4. Parameters of the adsorption isotherm models.
Isotherms ModelsParametersValuesR2ARE (%)
Langmuirqm(mg/g)63.290.98657.611
KL(L/mg)0.275
RL0.071–0.652
FreundlichKF (mg/g) (L/g)n8.0050.94514.365
nF1.872
TemkinKT(L/g)1.0930.9709.804
RT/b (BT(KJ/mol))13.508
Table 5. Obtained thermodynamic parameters in the range of tested temperatures.
T (°K)ΔG° (KJ/mol)ΔS° (KJ/mol K)ΔH° (KJ/mol)
298−2.9670.20658.461
303−3.2450.204
308−3.3140.201
313−3.9530.199
Table 6. Matrix of experiments with coded, uncoded factors and the response.
N0X1X2X3Ci (mg/L)m (g/L)pHY (%)
1−1−10201788.5539
21−10901775.1651
3−110203796.5097
4110903793.3073
5−10−1202477.9135
610−1902477.3905
7−1012021096.6233
81019021092.3212
90−1−1551459.7206
1001−1553489.1495
110−115511085.9411
120115531096.7700
13000552791.1453
14000552792.5922
15000552793.4458
Table 7. Analysis of variance (ANOVA) of the model.
SourceDFAdj SSAdj MSF-Valuep-Value
Model91458.65162.07217.980.003
Linear31176.94392.31243.520.001
Ci157.3357.3326.360.053
m1550.38550.38561.050.001
pH1569.22569.21963.140.001
Square3165.7155.2386.130.040
Ci·Ci10.660.6570.070.798
m·m147.5547.5505.270.070
pH·pH1128.99128.98614.310.013
2-way Interaction3116.0038.6674.290.075
Ci·m125.9425.9402.880.151
Ci·pH13.573.5710.400.557
m·pH186.4986.4909.590.027
Error545.089.015
Lack-of-fit342.3714.12410.440.089
Pure error22.701.352
Total141503.73

