Article

Multi-Task Learning U-Net for Single-Channel Speech Enhancement and Mask-Based Voice Activity Detection

School of Electrical Engineering and Computer Science, Gwangju Institute of Science and Technology, Gwangju 61005, Korea
*
Author to whom correspondence should be addressed.
Appl. Sci. 2020, 10(9), 3230; https://doi.org/10.3390/app10093230
Submission received: 2 April 2020 / Revised: 29 April 2020 / Accepted: 3 May 2020 / Published: 6 May 2020
(This article belongs to the Special Issue Intelligent Speech and Acoustic Signal Processing)

Abstract

:
In this paper, a multi-task learning U-shaped neural network (MTU-Net) is proposed and applied to single-channel speech enhancement (SE). The proposed MTU-based SE method estimates an ideal binary mask (IBM) or an ideal ratio mask (IRM) by extending the decoding network of a conventional U-Net to simultaneously model the speech and noise spectra as the target. The effectiveness of the proposed SE method was evaluated under both matched and mismatched noise conditions between training and testing by measuring the perceptual evaluation of speech quality (PESQ) and short-time objective intelligibility (STOI). Consequently, the proposed SE method with IRM achieved a substantial improvement with higher average PESQ scores by 0.17, 0.52, and 0.40 than other state-of-the-art deep-learning-based methods, such as the deep recurrent neural network (DRNN), SE generative adversarial network (SEGAN), and conventional U-Net, respectively. In addition, the STOI scores of the proposed SE method are 0.07, 0.05, and 0.05 higher than those of the DRNN, SEGAN, and U-Net, respectively. Next, voice activity detection (VAD) is also proposed by using the IRM estimated by the proposed MTU-Net-based SE method, which is fundamentally an unsupervised method without any model training. Then, the performance of the proposed VAD method was compared with the performance of supervised learning-based methods using a deep neural network (DNN), a boosted DNN, and a long short-term memory (LSTM) network. Consequently, the proposed VAD methods show a slightly better performance than the three neural network-based methods under mismatched noise conditions.

Graphical Abstract

1. Introduction

Speech enhancement (SE) has been widely used as a preprocessing step in speech-related tasks, such as automatic speech recognition, speaker recognition, hearing aids, and enhanced mobile communication. It attempts to remove background noise from a noisy signal using a single microphone or a microphone array. There have been many studies on statistical SE techniques, including Wiener filtering, the minimum mean square error (MMSE)-based spectral amplitude estimator [1], and non-negative matrix factorization (NMF) [2,3]. Among them, sparse NMF (SNMF) achieves the best performance in noise reduction with matched noise that is modeled by the noise basis. In the last decade, single-channel SE methods based on deep learning have significantly improved the performance of such statistical approaches, even though these techniques require a large amount of training data due to their more complex neural network (NN) architectures for better SE performance.
Deep learning-based SE methods can largely be classified into two categories depending on what they estimate. The SE methods in the first category estimate the magnitude spectrum of clean speech, such as the deep denoising autoencoder [4], deep recurrent NN (DRNN) [5], and convolutional NN (CNN) [6]. These methods provide a high signal-to-noise ratio (SNR) due to their good estimated magnitude spectrum matching to clean speech, but the intelligibility of the estimated clean speech is somewhat degraded when using the noisy input speech phase for clean speech estimation. To overcome this problem, the SE methods belonging to the second category estimate time-domain clean speech using WaveNet [7] or the SE generative adversarial network (SEGAN) [8]. While these approaches in the time domain improve speech intelligibility, they can lead to the issue of missing high-frequency components, thus resulting in degraded speech intelligibility [9,10]. On the other hand, an NN can be applied in the time-frequency domain [11,12,13,14,15] and is motivated by the computational auditory scene analysis (CASA). As used in CASA, which has shown considerable promise in preserving speech intelligibility [16], various deep learning-based SE methods have been proposed to estimate the ideal binary mask (IBM) [12]. Although speech intelligibility could be improved through IBM-based SE, this improvement depends largely on the IBM estimation performance. To reduce this dependency, the ideal ratio mask (IRM) is defined by the ratio of the clean signal energy to the mixture energy at each time-frequency bin, and the IRM-based SE method provides better speech quality and intelligibility than the IBM-based one [17].
Among the many IRM estimation methods, the U-shaped NN (U-Net) has shown excellent speech enhancement performance as the skip connections in the U-Net helped restore the speech spectrum [15]. Since the U-Net was trained only using the clean speech spectrum as the target of the network, as with most deep learning-based methods, the accuracy of the estimated IRM was highly dependent only on the accuracy of the clean speech estimate [5]. However, if an NN could simultaneously estimate both clean speech and noise that has been contaminated in the noisy input speech, the estimation performance of the IRM could be improved by computing the IRM as the ratio between the estimated clean spectrum and the sum of the estimated clean and noise spectra at each time-frequency bin.
In addition to SE, voice activity detection (VAD) plays an important role in speech-related applications [18]. Typically, VAD is carried out using the clean speech estimates from SE modules in noisy environments [19,20,21]. In this case, statistical or NN-based VAD requires hand-labeled annotations to train the VAD models. In practice, it is hard to annotate precise voice activity for noisy speech signals when their corresponding clean speech signals are not available; this problem is more severe for NN-based VAD [22,23,24] because it requires a large amount of training data. Moreover, since the performance of VAD relies on that of SE, VAD must be re-trained whenever the SE is changed in its application or applied to different noise environments. This re-training of VAD also requires a new annotated dataset, which is impractical in terms of the development costs for VAD.
In this paper, a single-channel SE method is proposed based on a multi-task learning U-Net (MTU-Net) architecture to provide a better estimate of the IRM and to simultaneously perform VAD. Inspired by the DRNN-based SE method [5], which jointly optimizes both the speech and noise spectra, the proposed MTU-Net extends the decoding network of a conventional U-Net so that it can estimate the speech and noise spectra together. Then, the IRM is estimated by using the spectra estimated for both clean speech and noise. Finally, the estimated IRM is applied to noisy input spectra to produce a clean speech spectrum estimate, which is more accurate than that obtained from the conventional U-Net. The speech quality and intelligibility of the proposed MTU-Net-based SE method are compared to those of statistical SE methods, especially SNMF [3], and several deep learning-based SE methods, including the conventional U-Net [15], SEGAN [8], and DRNN [5]. In addition to estimating the clean speech spectrum, the estimated IRM can be used to detect voiced intervals. This is because the speech presence probability for VAD can be represented by the mask. Thus, if the sum of IRMs along the frequency bins is greater than a given threshold, the noisy input speech at the time frame is detected as a speech frame. The performance of the proposed mask-based VAD is also compared with the performance of the VAD methods based on the boosted DNN (bDNN) [24] and long short-term memory (LSTM) [22].
This paper is organized as follows. Section 2 reviews a single-channel SE based on a conventional U-Net. Then, Section 3 proposes the MTU-Net-based SE method, where the MTU-Net is developed by extending the conventional U-Net under a framework of multi-tasking learning. After that, a VAD method is also proposed by incorporating the mask estimated from the MTU-Net-based SE. Section 4 evaluates the performance of the proposed MTU-Net-based SE method using objective measurements and comparing these measurements with those of a statistical and NN-based methods. In addition, the performance of the proposed mask-based VAD method is evaluated in terms of the area under the receiver operating characteristic curve objective measurements, which are compared with those of several NN-based methods. Finally, Section 5 concludes the paper.

2. U-Net-Based Speech Enhancement

The U-Net-based SE method is inspired by the observation that the U-Net was developed for medical image segmentation [25], and regions of interest in medical images could be used as target speech spectrograms in noise. Thus, the U-Net can be constructed by using the spectrogram of noisy input speech as an input feature to estimate the IRM between a pair of noisy input and clean target spectrograms.
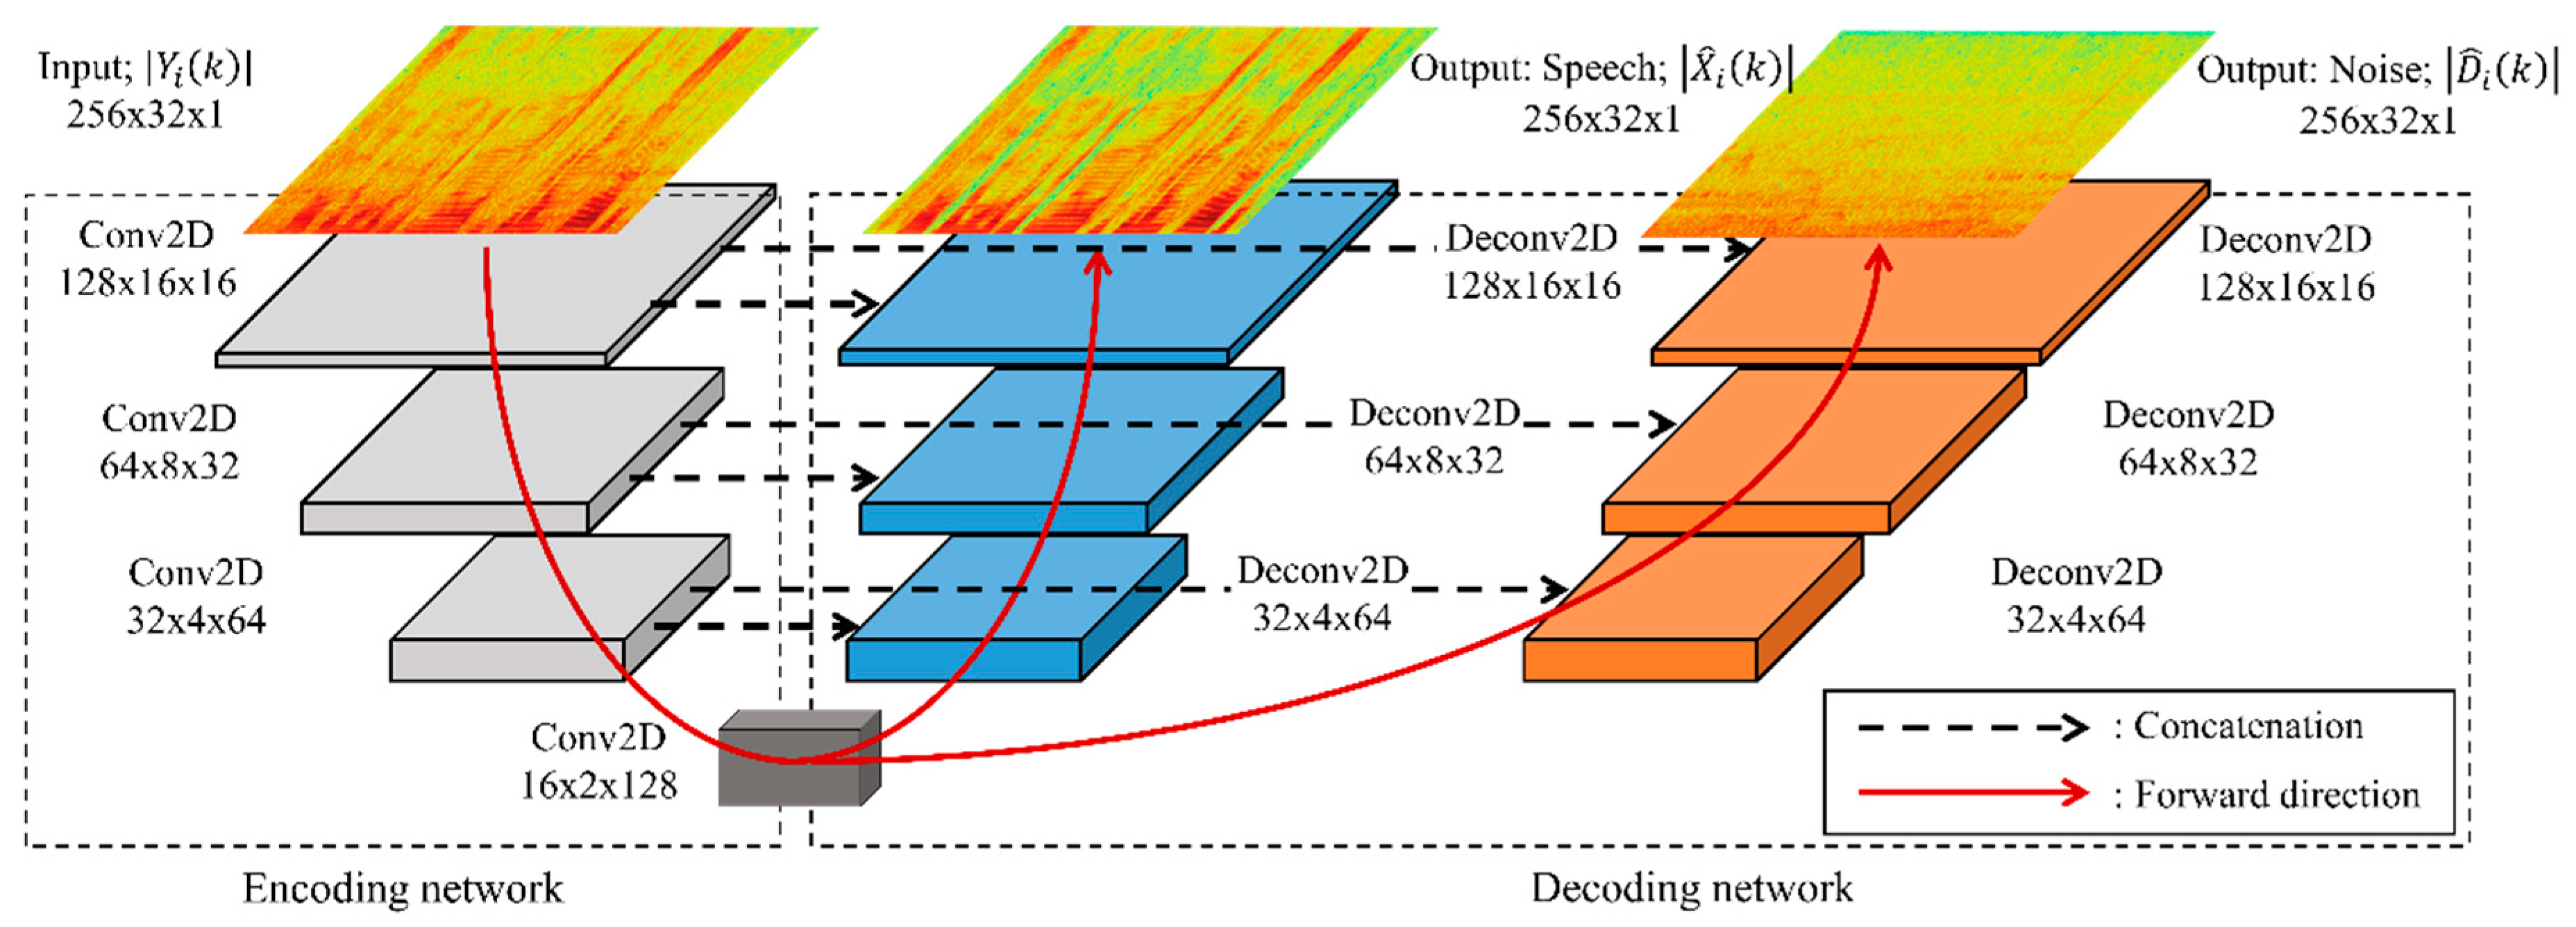
Figure 1 shows the network architecture of the U-Net-based SE method [15], which consists of an encoding network and a decoding network with skip connections between the two networks. As the input features, the noisy input speech sampled at 16 kHz is segmented into consecutive frames of 25 ms with a 10 ms overlap. Then, a 512-point fast Fourier transform (FFT) was applied to each frame, and 256 spectral magnitudes from 32 frames are concatenated into a (256 × 32 × 1)-dimensional image. Next, the input image is passed into the encoding network composed of three 2-dimensional (2D) convolution layers at a stride of 2 × 2. Each convolution layer with a kernel size of 5 × 5 is followed by a batch normalization (BN) layer, where the leaky rectified linear unit (ReLU) activation function is applied. The decoding network is also composed of three 2D deconvolution layers at a stride of 2 × 2, which operate in a reverse sequence to that of the encoding network. The outputs of each deconvolution layer are concatenated with those of their corresponding convolution layer, and they are brought together as the input features for the next deconvolution layer. After that, the outputs of the last deconvolution layer are passed through a sigmoid activation function to estimate the IRM between the 2D spectral images between the noisy input speech and the target speech. Finally, the estimated IRM is multiplied to the noisy input speech spectrum, which results in the estimation of the clean speech spectrum; then, the estimated clean speech in the time domain is reconstructed by applying an inverse FFT (IFFT) to the estimated clean speech spectrum.
To train the U-Net, Xavier initialization [26] is utilized for the initial weights of the configured model, and the biases are initialized to zero. The objective of U-Net-based SE is to minimize the mean square error (MSE) between the spectrogram of the target clean speech, | X i ( k ) | , and that of the estimated clean speech. That is, the spectrogram of the estimated clean speech, | X ^ i ( k ) | , is obtained by multiplying the estimated IRM, H ^ i ( k )   ( 0 H ^ i ( k ) 1 ) , with the spectrogram of noisy input speech, | Y i ( k ) | . Thus, the loss function for the U-Net is defined by
L U N e t ( X ) = 1 N K i = 0 N 1 k = 0 K 1 ( H ^ i ( k ) | Y i ( k ) | | X i ( k ) | ) 2
where k and i denote the frequency bin and frame, respectively. In addition, N is the total number of frames in each minibatch (N = 32 in this paper), and K is the half number of FFT points (K = 256). Adaptive moment estimation (Adam) optimization [27] is utilized for the backpropagation algorithm, and the first- and second-moment decay rates are set as 0.9 and 0.999, respectively, with a learning rate of 0.001. Training is done up to 50 epochs. In addition, the dropout technique is utilized with a keep probability of 0.9 [28]. Note here that the U-Net estimates H ^ i ( k ) instead of directly estimating | X ^ i ( k ) | . In other words, the estimated clean speech spectrum is obtained by multiplying H ^ i ( k ) with Y i ( k ) . Then, the clean speech signal is estimated by applying an IFFT to H ^ i ( k ) Y i ( k ) , such as:
x ^ i ( n ) = IFFT { H ^ i ( k ) Y i ( k ) } = IFFT { H ^ i ( k ) | Y i ( k ) | exp ( j Y i ( k ) ) } .

3. Proposed MTU-Net-Based Speech Enhancement

This section proposes a single-channel SE method by extending the U-Net with multi-task learning—the so-called MTU-Net. In other words, the proposed MTU-Net is defined as a U-Net possessing both clean speech and noise spectra as the network outputs. Since MTU-Net can provide estimates of clean speech and the noise magnitude spectrum, the estimated clean speech magnitude spectrum can be directly used to reconstruct the estimated clean speech. Simultaneously, the IRM or IBM can be estimated via the MTU-Net through the ratio between the estimated clean spectrum and the sum of the estimated clean and noise spectra, while the U-Net described in Section 2 only estimates the IRM.

3.1. Model Architecture

In previous studies, multiple-target-based SE was proposed to improve speech enhancement performance [5,29,30]. Inspired by these approaches, the proposed MTU-Net-based single-channel SE has a network architecture as shown in Figure 2. First, the encoding network in the MTU-Net has the same structure as in the conventional U-Net, which is described in Section 2. However, there is a difference in the decoding network in which an additional decoding path is attached to estimate the noise spectra. In other words, the output of the encoding network is decoded through two paths that are used to estimate the clean speech and noise spectra, respectively. The architecture for the noise decoding path is identical to that for the speech decoding path, and the layers of each decoding path are reversely composed of those in the encoding network. Here, a spectrogram of the noisy input speech is used as the input feature, while its corresponding clean speech and noise spectrograms are used as target features. Note that there is a difference between the U-Net and proposed MTU-Net in mask estimation. The IRM of the U-Net is the output of the network; however, the mask of the proposed MTU-Net is calculated by using estimated speech and noise from the two outputs of the network, which will be explained in Section 3.3.

3.2. Multi-Task Learning

To train the MTU-Net, the input and output features are first normalized from 0 to 1 with minimum and maximum values over all training data. Next, the Xavier initialization technique is utilized for weight initialization [26], and the biases are initialized to 0. Similar to [5], the loss function for multi-task learning is defined to accommodate both speech and noise targets as
L M T L ( X ,   D ) = 1 N K i = 0 N 1 k = 0 K 1 { ( | X ^ i ( k ) | | X i ( k ) | ) 2 + ( | D ^ i ( k ) | | D i ( k ) | ) 2 }
where | X i ( k ) | and | D i ( k ) | are the spectral magnitude components of the target speech and noise at the k-th frequency bin at the i-th frame, respectively, and | X ^ i ( k ) | and | D ^ i ( k ) | are the outputs of the decoding network, which are actually the estimates of | X i ( k ) | and | D i ( k ) | , respectively. As explained in (1), N is the total number of frames in each minibatch, and K is the half number of FFT points, which are set to 32 and 256, respectively, and are the same as those in U-Net. The model parameters are updated up to 50 epochs through the backpropagation algorithm using the Adam optimization technique [27], and the first- and second-moment decay rates are set to 0.9 and 0.999, respectively, with a learning rate of 0.001. A dropout technique [28] is applied only to the first layer of the decoder network with a ratio of 0.5.

3.3. Inference

After finishing the training procedure described in Section 3.2, the clean and noise magnitude spectra for a given noisy input spectrum are estimated and are denoted as | X ^ i ( k ) | and | D ^ i ( k ) | , respectively. As the first approach to estimate clean speech, | X ^ i ( k ) | can be directly used as an estimate of the clean speech magnitude spectrum. Thus, the estimated clean speech, x ^ i ( n ) , is reconstructed by applying the phase of the noisy input speech, Y i ( k ) as
x ^ i ( n ) = IFFT { | X ^ i ( k ) | exp ( j Y i ( k ) ) } .
As a second approach, the mask is estimated and then applied to the spectrum of the noisy input speech. In other words, the IRM can be inferred from | X ^ i ( k ) | and | D ^ i ( k ) | as
H i I R M ( k ) = | X ^ i ( k ) | | X ^ i ( k ) | + | D ^ i ( k ) |
where H i I R M ( k ) is the IRM of the k-th frequency bin at the i-th frame. Simultaneously, the IBM of the k-th frequency bin at the i-th frame, H i I B M ( k ) , can be estimated as
H i I B M ( k ) = { 1 i f   H i I R M ( k ) > θ I B M 0 o t h e r w i s e
where θ I B M is the threshold to obtain the IBM from the IRM and is set to 0.5 according to [11]. This is because the SNR between the estimated clean and noise magnitude spectra, | X ^ i ( k ) | and | D ^ i ( k ) | , becomes zero if | X ^ i ( k ) |   =   | D ^ i ( k ) | , i.e., SNR i ( k ) = 20 log ( | X ^ i ( k ) | | D ^ i ( k ) | ) = 0 ( dB ) . Next, the estimated clean speech, x ¯ i ( n ) , is reconstructed by multiplying the IRM or IBM with the noisy input speech spectrum, Y i ( k ) , followed by an IFFT, as follows:
x ¯ i ( n ) = IFFT { H i ( k ) | Y i ( k ) | exp ( j Y i ( k ) ) }
where H i ( k ) corresponds to either H i I R M ( k ) or H i I B M ( k ) .
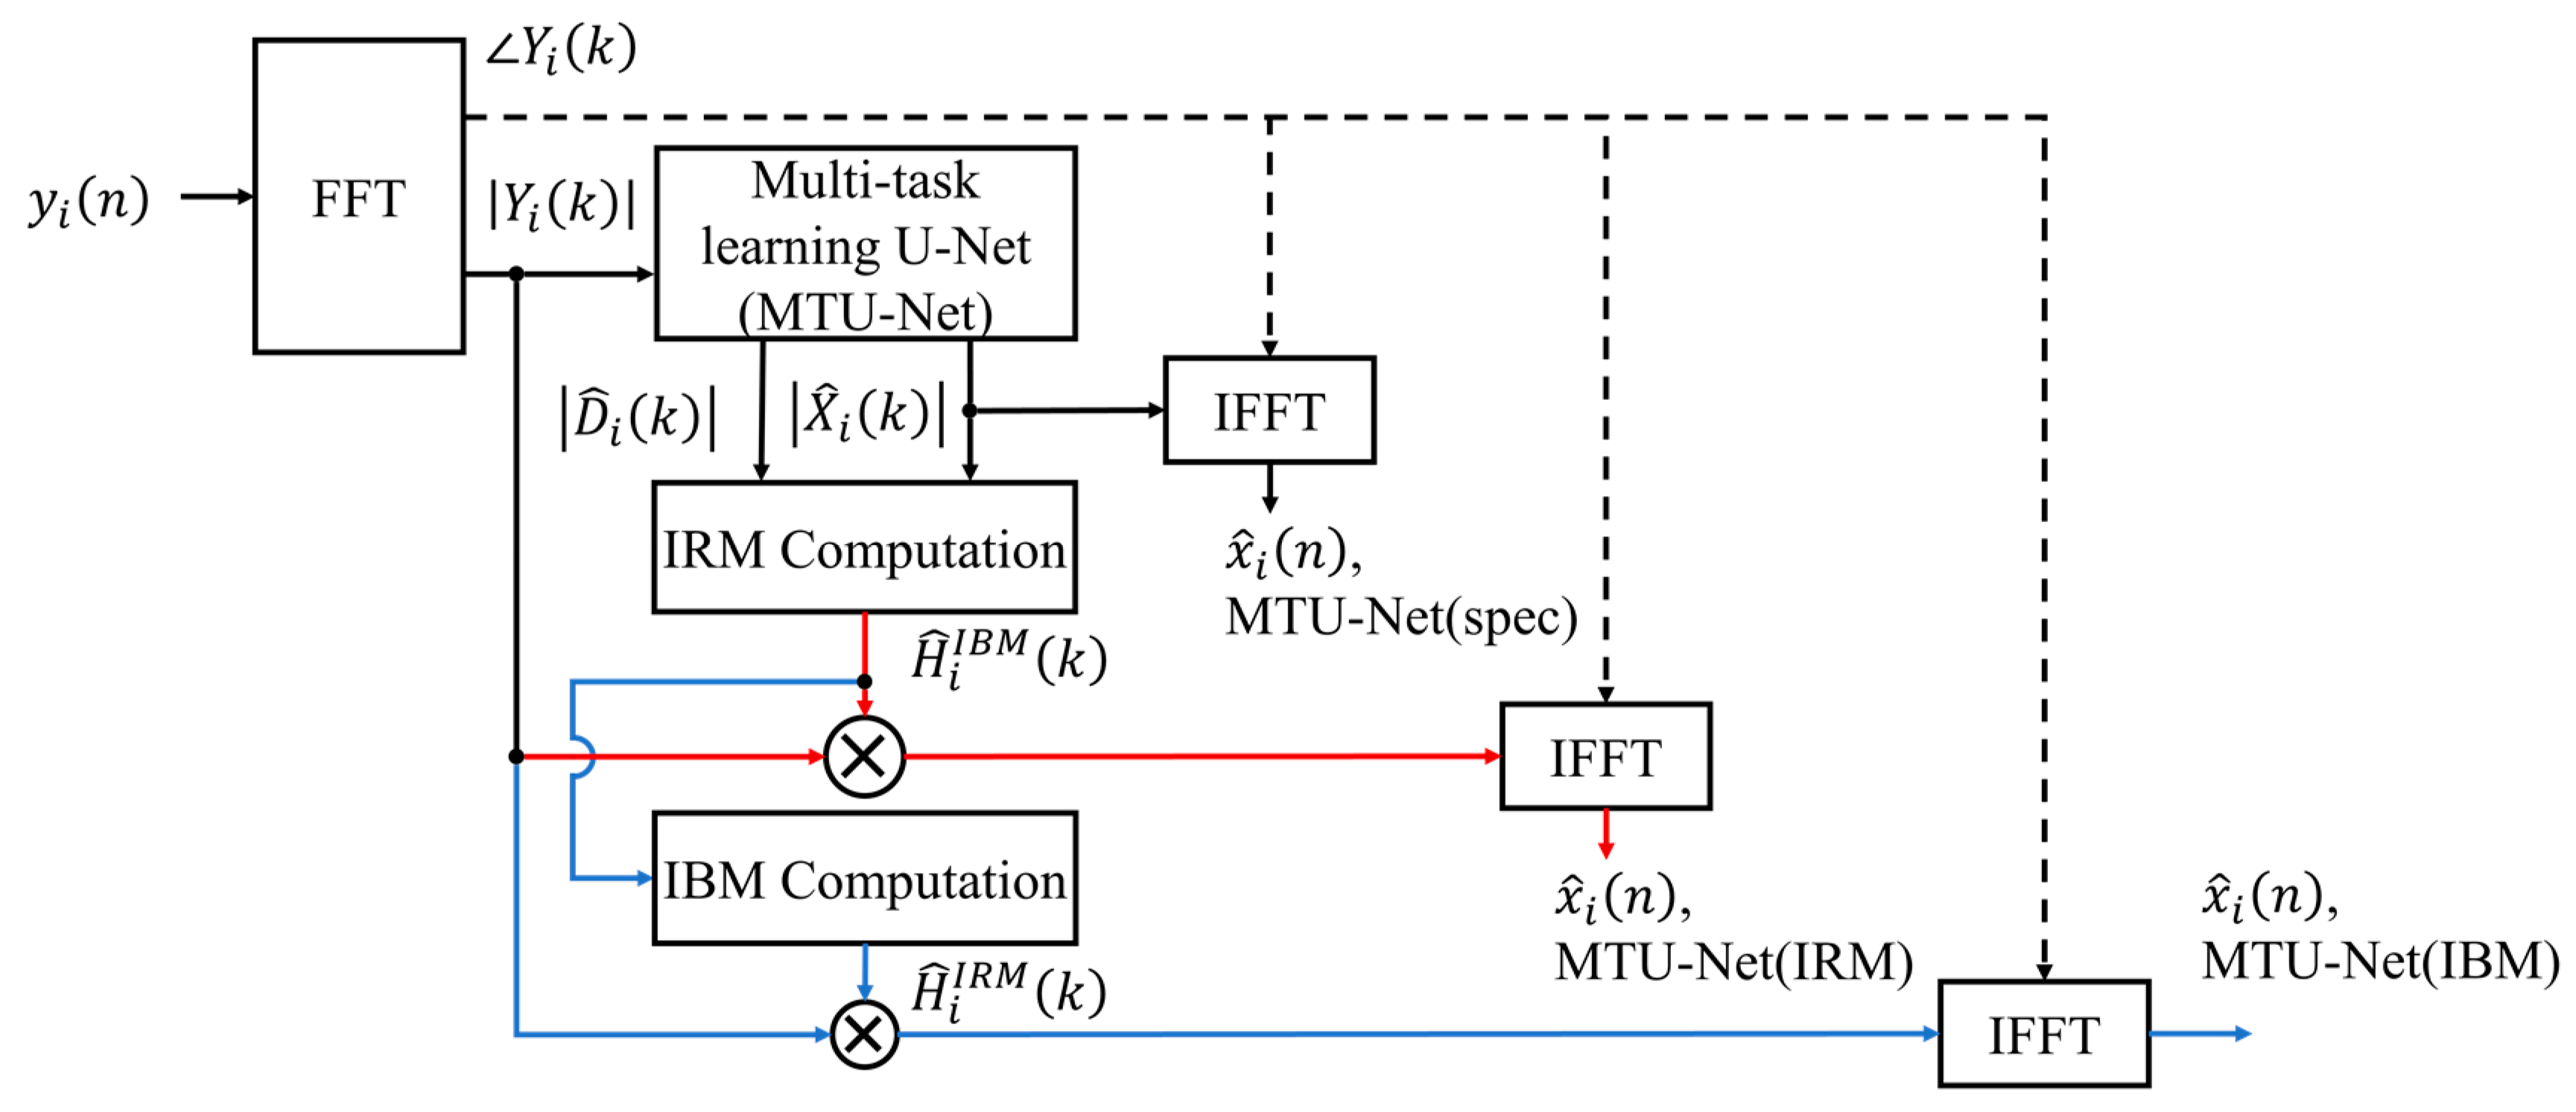
Figure 3 summarizes the three different methods for estimating clean speech from MTU-Net: (i) the estimation of clean speech from the estimated clean speech spectrum and the phase of noisy input speech by using (4), referred to as MTU-Net(spec); (ii) the estimation of clean speech by applying IRM using (5) and (7), referred to as MTU-Net(IRM); and (iii) estimation by applying IBM using (6) and (7), referred to as MTU-Net(IBM). Since the loss function of MTU-Net takes into account the squared error between | X ^ i ( k ) | and | X i ( k ) | , sometimes | X ^ i ( k ) | is greater than | X i ( k ) | or greater than | Y i ( k ) | . This degrades the quality of the estimated clean speech reconstructed by MTU-Net(spec) due to the fluctuation of the trajectory of | X ^ i ( k ) | over all the frame against that of | X i ( k ) | . On the other hand, H i ( k ) | Y i ( k ) | produced by either MTU-Net(IBM) or MTU-Net(IRM) is always smaller than | Y i ( k ) | since 0 H i ( k ) 1 . Therefore, it is expected that MTU-Net(IBM) or MTU-Net(IRM) will provide better performance than MTU-Net(spec).

3.4. Mask-Based VAD Method

According to previous studies on the relationship between the IBM and the performance of speech recognition [31,32], the binary mask was found to be highly related to the human auditory system, as show in [31]. Human labelers for VAD annotation tasks listen to each noisy speech signal directly and then mark the voice-activated intervals for each signal, a method that is similarly used to determine the binary mask for the noisy input speech signal.
The proposed mask-based VAD is described in this subsection based on the relationship between the voice-activated intervals and the binary masks. Figure 4 provides two different block diagrams showing how to combine the SE and VAD. Specifically, Figure 4a shows a combined approach in which the SE module is used as a front-end for VAD. Thus, the VAD method in this category requires large amounts of manually labeled data to train a VAD model. In contrast, the proposed approach shown in Figure 4b does not require any manually labeled data for VAD. Instead, the voice-activated intervals are estimated by using the IRM that has already been estimated from the MTU-Net-based SE, as described in Section 3.3.
To detect voice activity, the pre-estimated IRM in the inference stage, as described in Section 3.3, is utilized to estimate the speech presence probability at the i-th frame, γ i , which is defined as
γ i = 1 K k = 0 K 1 H i I R M ( k ) .
Finally, the decision about whether the i-th frame is voiced or not is done using γ i , as follows:
V A D ( i ) = { 1 i f   γ i > θ V A D 0 o t h e r w i s e
where θ V A D is a threshold for VAD. This threshold can be set to minimize the equal error rate (EER) in the training dataset as done in [33].

4. Performance Evaluation

This section first evaluates the performance of the proposed MTU-Net-based SE method and then compares it with those of several conventional SE methods based on SNMF [3], SEGAN [8], DRNN [5], and U-Net [15]. Here, SNMF, DRNN, SEGAN, and U-Net were trained with hyperparameters according to [3,5,8,15], respectively. In particular, the proposed MTU-Net-based SE method was implemented in three different ways: MTU-Net(spec), MTU-Net(IRM), and MTU-Net(IBM).
Next, the performance of the proposed mask-based VAD method was also evaluated and compared with several NN-based VAD methods, including DNN [24], bDNN [24], and LSTM [22]. In this study, all the compared methods were implemented with the same hyperparameters used in their reference papers. Here, spectrograms were used as input features for all the implementations, while multi-resolution cochleagrams were used as per their original implementations in [22,24]. This was done because the proposed VAD method uses mask values from the proposed MTU-Net-based SE method that utilizes spectrograms as input features. All the methods for SE and VAD were implemented in Python 3.5.2 with Tensorflow 1.13.1, and all the experiments were conducted on an Intel Core i7-7700 workstation with an NVidia GTX 1080ti GPU.

4.1. Experimental Setup

First, to train the model parameters for each of the five different SE methods and three different VAD methods, 4620 speech utterances were excerpted from the TIMIT training database [34]. Then, one of eight different noises (buccabber1, destroyerengine, destroyerops, factory1, hfchannel, leopard, m109, and machinegun) from the NOISEX-92 database [35] was artificially added to each speech utterance under four different SNR conditions in the range of −5–10 dB in a 5 dB step.
Table 1 compares the hyperparameters and model footprint of each SE method used in this experiment, where the model footprints were measured using the 32-bit floating point format. As shown in the table, speech and noise bases were only required to estimate speech signal from the SNMF-based SE method, which was enough to model the bases with 1 MB. On the other hand, the NN-based SE methods including MTU-Net required many model parameters. Among them, SEGAN required the largest model size due to using time-domain signals as its input features. The proposed MTU-Net had to be about 1.5 times larger than U-Net because the proposed method had one more decoding network to estimate the noise spectrogram than U-Net.
Next, the performance of the SE and VAD methods was evaluated under two different noise conditions, matched and mismatched noise conditions. To this end, 200 speech utterances from 129 males and 71 females were excerpted from the TIMIT test database where all the sentences selected were not included in the training dataset. Then, the matched noise condition was simulated by mixing the same types of noises used for the training dataset for each of the 200 utterances; the result was referred to as the matched evaluation dataset. On the other hand, the mismatched evaluation dataset was simulated by mixing one of four different noises (babble, f16, buccabber2, and factory2) from the NOISEX-92 database, which was unseen noise in the training dataset; these noises were mixed to each of the 200 utterances.

4.2. Objective Quality Evaluation for Speech Enhancement

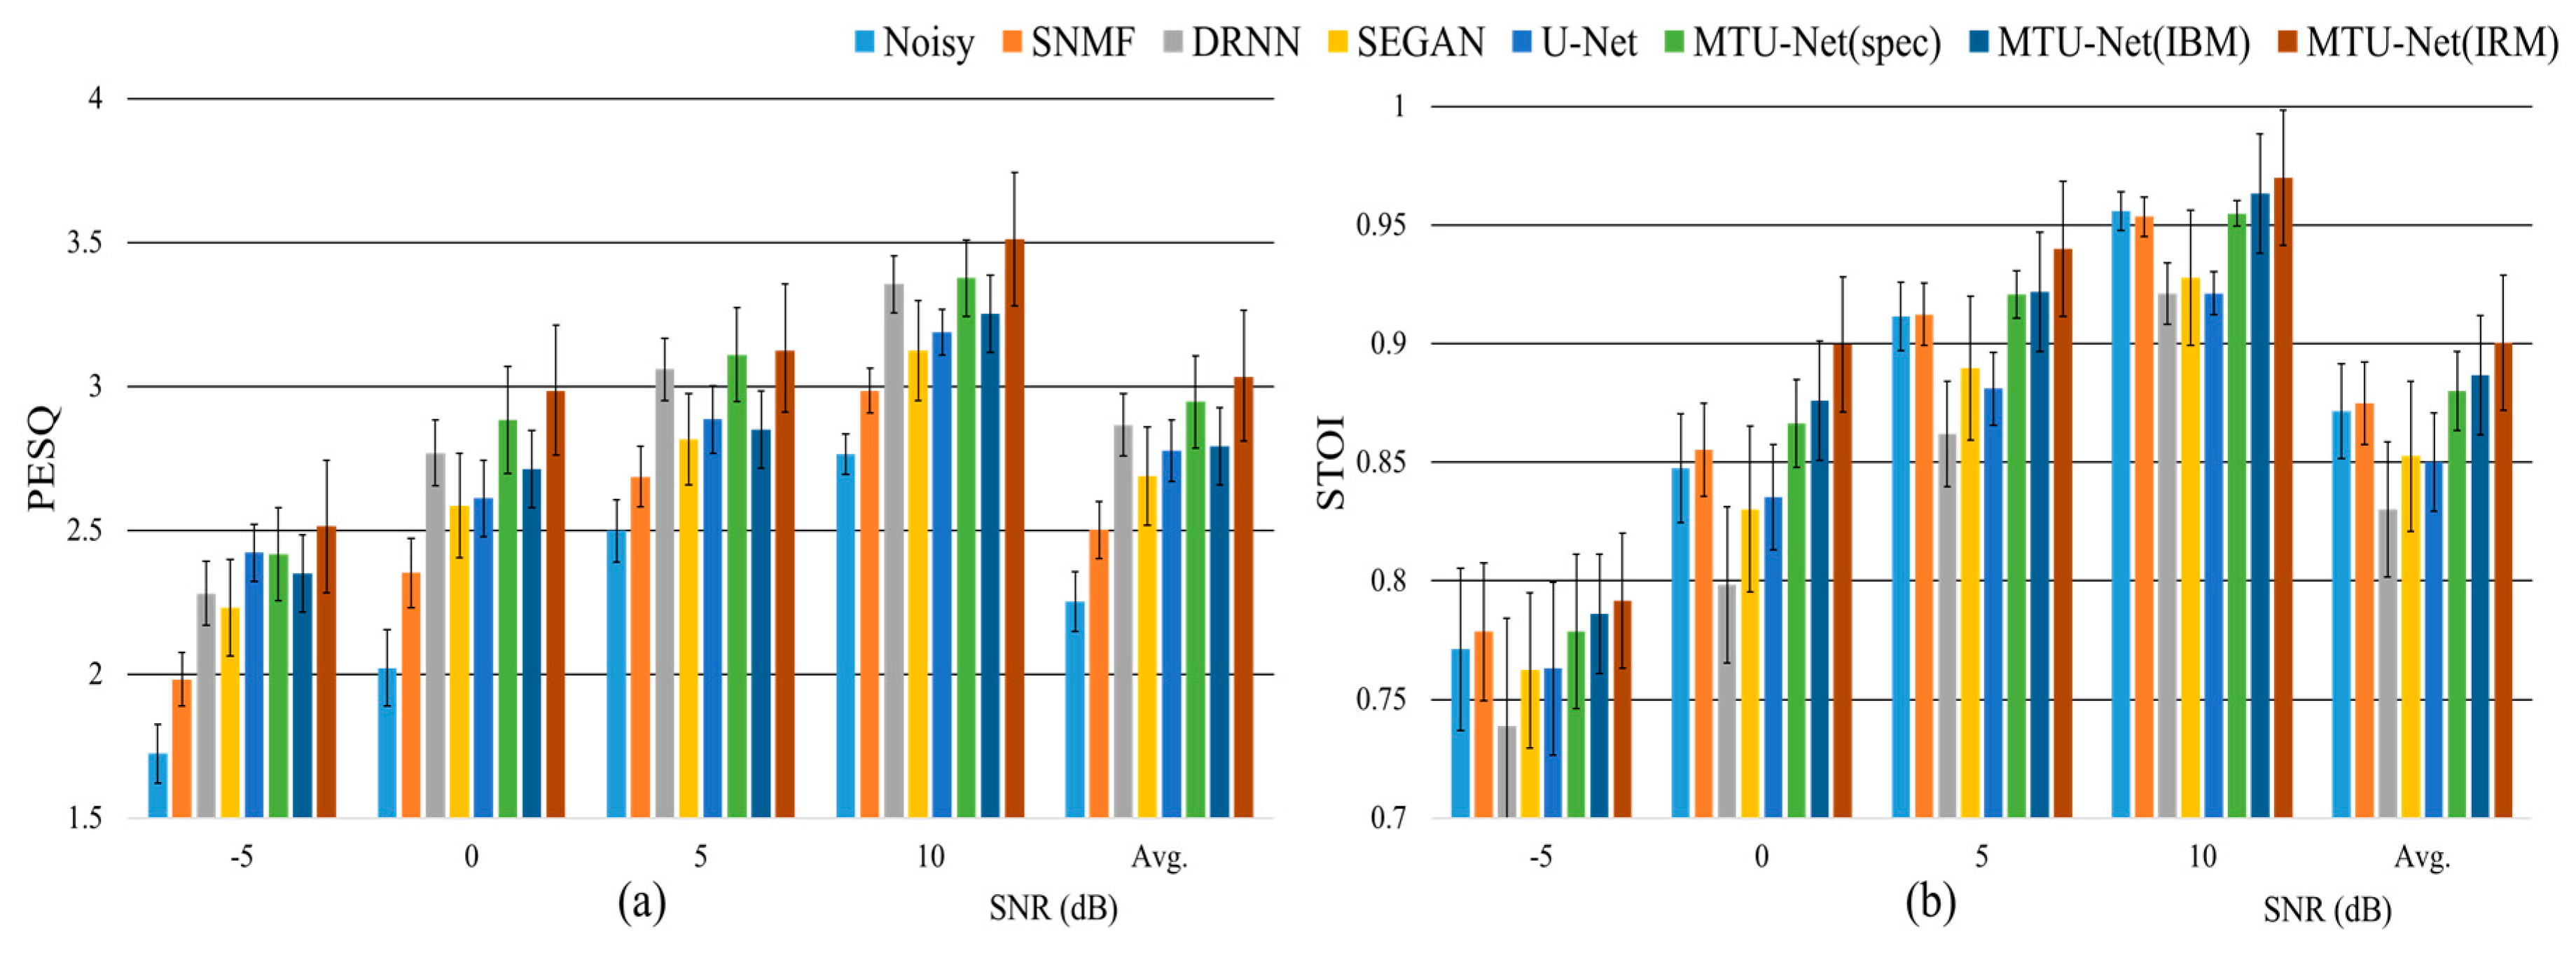
The performance of each SE method was evaluated using the perceptual evaluation of speech quality (PESQ) [36] and short-time objective intelligibility (STOI) scores [37]. Figure 5 compares the average PESQ and STOI scores of noisy input speech and estimated speech according to the seven different SE methods using the matched evaluation dataset. Each bar in the figure was drawn after averaging the objective values over all speech signals, and the vertical line at the top of each bar denotes the standard deviation of each measurement. As shown in Figure 5a, the U-Net had a significantly better PESQ score than the SNMF and SEGAN and had similar performance to the DRNN. On the other hand, MTU-Net(IBM) had slightly lower and higher performance than the DRNN and U-Net, respectively. However, MTU-Net(IRM) had PESQ scores that were 0.17 and 0.26 higher than those of DRNN and U-Net, respectively.
When comparing the SE performance considering STOI scores, as shown in Figure 5b, the deep learning-based methods, such as DRNN, SEGAN, and U-Net, achieved lower STOI scores than the unprocessed noisy speech because of the adverse effects on the speech components. In contrast, the proposed MTU-Net with the spectrogram, IBM, and IRM showed higher STOI scores by 0.88, 0.89, and 0.90, respectively, compared to the noisy input speech. Consequently, the proposed MTU-Net-based SE method with the IRM outperformed all other methods in terms of its PESQ and STOI scores.
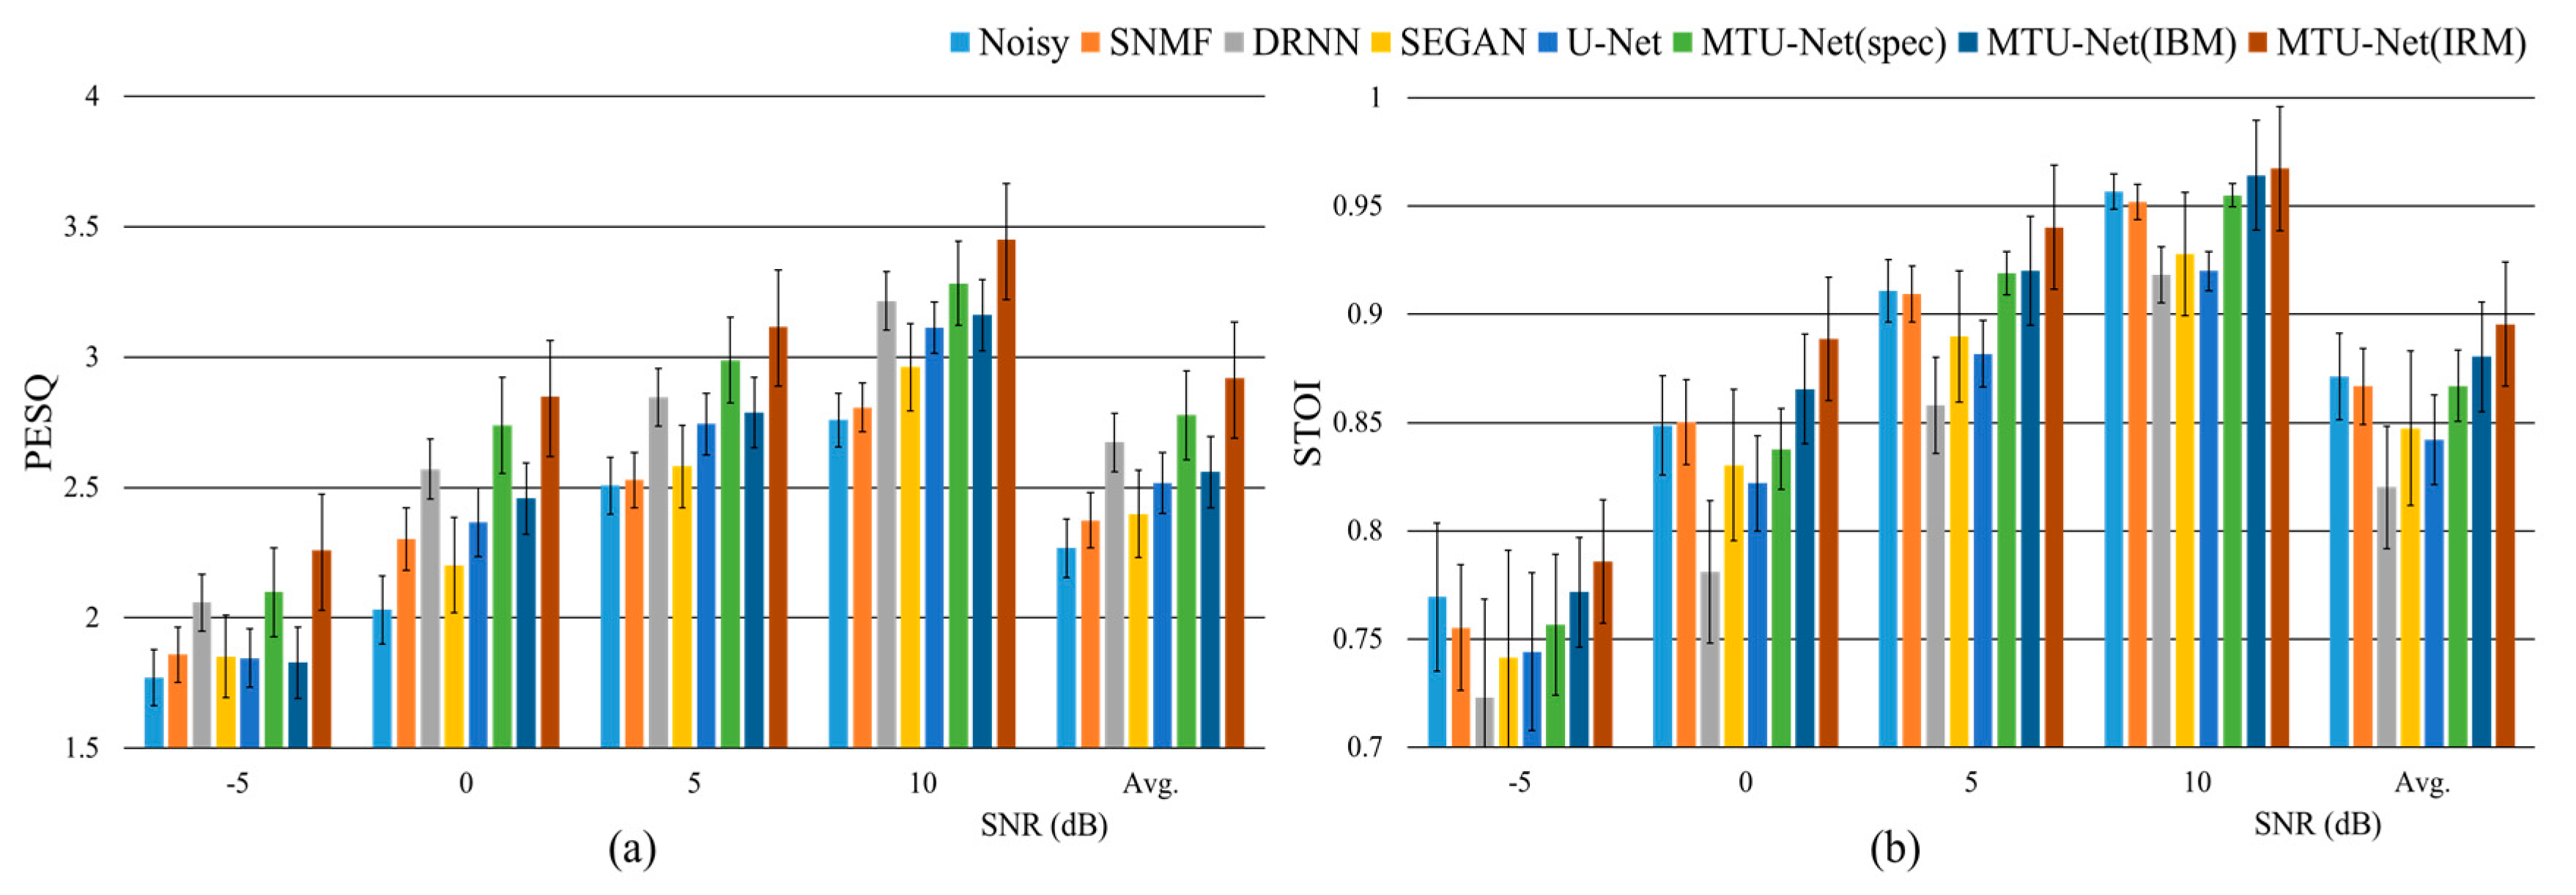
The performance evaluations of the SE methods were repeated under mismatched noise conditions. Figure 6 compares the average PESQ and STOI scores of the noisy input speech and the estimated speech according to the seven different SE methods applied to the matched evaluation dataset. Compared to Figure 5, which presents the evaluation results under the matched noise conditions, the NN-based SE methods, including DRNN, SEGAN, and U-Net, under the mismatched noise conditions had significantly degraded PESQ and STOI scores. However, the proposed MTU-Net with IRM provided similar PESQ and STOI scores under the matched noise conditions. This suggests that the proposed MTU-Net-based SE method with IRM is more robust than that with a spectrogram and IBM and is even more robust than other NN-based SE methods.
Next, the performance of all the SE methods was decomposed according to noise types and displayed in Table 2 and Table 3 for PESQ and STOI, respectively. As shown in Table 2, the proposed MTU-Net-based SE methods provided higher PESQ scores than the others. MTU-Net(IRM) was the best in terms of PESQ for all noise types. In addition, MTU-Net(spec) and MTU-Net(IBM) showed comparable STOI scores to SNMF-based SE and much higher STOI scores than the other three NN-based SE methods of DRNN, SEGAN, and U-Net. MTU-Net(IRM) also had the highest STOI scores for all noise types.

4.3. Objective Quality Evaluation for Voice Activity Detection

This subsection evaluates the performance of each VAD method using both the matched and mismatched evaluation datasets by measuring the area under the receiver operating characteristic curve (AUC) and the EER scores [38]. First, the noisy input signal was directly applied to the DNN-, bDNN-, and LSTM-based VAD methods. Second, MTU-Net(IRM) was used as a front-end for the DNN-, bDNN-, and LSTM-based VAD methods. Table 4 compares the average AUC and EER scores under the matched noise conditions. As shown in the table, each of the supervised learning-based VAD methods that employed MTU-Net as a front-end achieved higher AUCs and lower EERs than those directly using the noisy input signal. Moreover, all the supervised learning-based VAD methods achieved higher AUCs and lower EERs than the proposed mask-based VAD method. This was because the NN models for VAD were trained to accommodate the characteristics of the noises that commonly appeared in both model training and testing. However, the proposed VAD method operated without any training; thus, its performance was lower than that of the NN-based VAD methods. Nevertheless, the performance degradation of the proposed VAD method was not severe.
Next, the performance evaluations of the VAD methods were repeated under the mismatched noise conditions; these results are shown in Table 5. As shown in the table, the performance of the NN-based VAD methods was significantly degraded compared to that under the matched noise conditions shown in Table 4. The NN-based VAD methods directly using noisy input speech achieved especially higher AUC and lower EER values than the VAD methods using the estimated clean speech processed by MTU-Net. This was caused by the performance degradation of the SE methods under mismatched noise conditions. However, the performance of the proposed VAD method had similar average AUC and EER values when not considering the noise condition because the proposed VAD methods only depend on the performance of MTU-Net(IRM) operating fairly well with noisy utterances under matched and mismatched conditions. Moreover, the proposed mask-based VAD method provided higher average AUCs and EERs than the three NN-based VAD methods.

5. Conclusions

This paper proposed an MTU-Net-based single-channel SE method that extended the conventional U-Net by employing a framework of multi-task learning. The proposed MTU-Net provided estimates of clean speech and noise magnitude spectra. Thus, the estimated clean speech was directly reconstructed using the estimated clean speech magnitude spectrum. In addition, an IRM or IBM was estimated by the ratio between the estimated clean spectrum and the sum of the estimated clean and noise spectra, thus allowing the clean speech to be estimated by applying the IRM or IBM to the noisy input spectrum. The performance of the proposed MTU-based SE method was evaluated under matched and mismatched noise conditions and compared to the performance of other neural network-based SE methods, such as DRNN-, SEGAN-, and conventional U-Net-based SE. Consequently, it was shown that the PESQ and STOI scores of the proposed SE method were higher than those of the other SE methods under both matched and mismatched conditions. Under matched noise conditions, the MTU-based SE method with IRM increased the average PESQ by 0.17, 0.52, and 0.40 compared to DRNN, SEGAN, and U-Net, respectively. Moreover, the average STOI score of the proposed SE method was higher by 0.07, 0.05, 0.05 compared to DRNN, SEGAN, and U-Net, respectively.
Next, the IRM estimated by the proposed MTU-Net-based SE method was utilized for VAD. In other words, the proposed VAD method operated in an unsupervised manner by using the by-product of the proposed SE method. To compare the performance of the proposed VAD with that of the supervised learning-based methods using deep neural networks such as DNN, bDNN, and LSTM, each was trained using noisy speech utterances under the matched noise condition. Here, the proposed SE method was applied to noisy speech utterances as a front-end for the deep neural network-based VAD methods. The comparison showed that the proposed VAD method offers similar detection performance (measured by the AUC and ERR) for whatever noise contaminates the noisy speech utterances, while the performance of the deep neural network-based VAD methods degrades significantly under the mismatched noise condition.
To improve the performance of the proposed MTU-Net-based SE method, especially under mismatched noise conditions, future studies should employ an online noise adaptation technique using non-negative matrix factorization [39]. Conversely, the domain adversarial training technique [40] should be incorporated into the proposed SE method.
In future work, to further improve the performance of the proposed MTU-Net-based SE method, the MTU-Net should incorporate a type of online noise adaptation using non-negative matrix factorization [39] or domain adversarial training [40]. In addition, the effect of the proposed MTU-Net-based SE method on noisy speech under reverberant conditions will be investigated in detail.

Author Contributions

All authors discussed the contents of the manuscripts. H.K.K. contributed to the research idea and the framework of this study, and G.W.L. performed the experimental work. All authors have read and agreed to the published version of the manuscript.

Funding

This work was supported by the research fund of the Signal Intelligence Research Center supervised by the Defense Acquisition Program Administration and Agency for the Defense Development of Korea.

Conflicts of Interest

The authors declare no conflict of interest.

References

  1. Ephraim, Y.; Malah, D. Speech enhancement using a minimum mean-square error short-time spectral amplitude estimator. IEEE Trans. Acoust. Speech Signal Process. 1984, 32, 1109–1121. [Google Scholar] [CrossRef] [Green Version]
  2. Virtanen, T. Monaural sound source separation by nonnegative matrix factorization with temporal continuity and sparseness criteria. IEEE Trans. Audio Speech Lang. Process. 2007, 15, 1066–1074. [Google Scholar] [CrossRef] [Green Version]
  3. Jeon, K.M.; Kim, H.K. Local sparsity based online dictionary learning for environment-adaptive speech enhancement with nonnegative matrix factorization. In Proceedings of the Annual Conference of the International Speech Communication Association (Interspeech), San Francisco, CA, USA, 8–12 September 2016; pp. 2861–2865. [Google Scholar]
  4. Lu, X.; Tsao, Y.; Matsuda, S.; Hori, C. Speech enhancement based on deep denoising autoencoder. In Proceedings of the Annual Conference of the International Speech Communication Association (Interspeech), Lyon, France, 25–29 August 2013; pp. 436–440. [Google Scholar]
  5. Huang, P.-S.; Kim, M.; Hasegawa-Johnson, M.; Smaragdis, P. Joint optimization of masks deep recurrent neural networks for monaural source separation. IEEE/ACM Trans. Audio, Speech Lang. Process. 2015, 23, 1–12. [Google Scholar]
  6. Park, S.R.; Lee, J.W. A fully convolutional neural network for speech enhancement. In Proceedings of the Annual Conference of the International Speech Communication Association (Interspeech), Stockholm, Sweden, 20–24 August 2017; pp. 1993–1997. [Google Scholar]
  7. Rethage, D.; Pons, J.; Serra, X. A wavenet for speech denoising. In Proceedings of the IEEE International Conference on Acoustics, Speech and Signal Processing (ICASSP), Calgary, AB, Canada, 15–20 April 2018; pp. 5069–5073. [Google Scholar]
  8. Pascual, S.; Bonafonte, A.; Serra, J. SEGAN: Speech enhancement generative adversarial network. In Proceedings of the Annual Conference of the International Speech Communication Association (Interspeech), Stockholm, Sweden, 20–24 August 2017; pp. 3642–3646. [Google Scholar]
  9. Wu, J.; Hua, Y.; Yang, S.; Qin, H.; Qin, H. Speech enhancement using generative adversarial network by distilling knowledge from statistical method. Appl. Sci. 2019, 9, 3396. [Google Scholar] [CrossRef] [Green Version]
  10. Fu, S.-W.; Tsao, Y.; Lu, X.; Kawai, H. Raw waveform-based speech enhancement by fully convolutional networks. In Proceedings of the Asia-Pacific Signal and Information Processing Association Annual Summit and Conference, Kuala Lumpur, Malaysia, 12–15 December 2017; pp. 6–12. [Google Scholar]
  11. Li, Y.; Wang, D. On the optimality of ideal binary time–frequency masks. Speech Commun. 2009, 51, 230–239. [Google Scholar] [CrossRef] [Green Version]
  12. Heymann, J.; Drude, L.; Haeb-Umbach, R. Neural network based spectral mask estimation for acoustic beamforming. In Proceedings of the IEEE International Conference on Acoustics, Speech and Signal Processing (ICASSP), Shanghai, China, 20–25 March 2016; pp. 196–200. [Google Scholar]
  13. Narayanan, A.; Wang, D. Ideal ratio mask estimation using deep neural networks for robust speech recognition. In Proceedings of the IEEE International Conference on Acoustics, Speech and Signal Processing (ICASSP), Vancouver, BC, Canada, 26–31 May 2013; pp. 7092–7096. [Google Scholar]
  14. Wang, Z.-Q.; Wang, D. Robust speech recognition from ratio masks. In Proceedings of the IEEE International Conference on Acoustics, Speech and Signal Processing (ICASSP), Shanghai, China, 20–25 March 2016; pp. 5720–5724. [Google Scholar]
  15. Lee, G.W.; Jeon, K.M.; Kim, H.K. U-Net-based single-channel wind noise reduction in outdoor environments. In Proceedings of the IEEE Conference on Consumer Electronics, Las Vegas, NV, USA, 4–6 January 2020; Available online: https://pdfs.semanticscholar.org/e8fe/a19ef035b94e656d6930a410aefab6d00e9f.pdf (accessed on 22 March 2020).
  16. Wang, D. On ideal binary mask as the computational goal of auditory scene analysis. In Speech Separation by Humans and Machines; Divenyi, P., Ed.; Kluwer Academic Publishers: Norwell, MA, USA, 2005; pp. 181–197. ISBN 1-4020-8001-8. [Google Scholar]
  17. Wang, Y.; Narayanan, A.; Wang, D. On training targets for supervised speech separation. IEEE/ACM Trans. Audio Speech Lang. Process. 2014, 22, 1849–1858. [Google Scholar] [CrossRef] [PubMed] [Green Version]
  18. Vlaj, D.; Kotnik, B.; Horvat, B.; Kaĉiĉ, Z. A computationally efficient mel-filter bank VAD algorithm for distributed speech recognition systems. EURASIP J. Adv. Signal Process. 2005, 2005, 561951. [Google Scholar] [CrossRef] [Green Version]
  19. Ramirez, J.; Segura, J.C.; Benitez, C.; Torre, À. An effective subband OSF-based VAD with noise reduction for robust speech recognition. IEEE Trans. Acoust. Speech Signal Process. 2005, 13, 1119–1129. [Google Scholar] [CrossRef]
  20. Dwijayanti, S.; Yamamori, K.; Miyoshi, M. Enhancement of speech dynamics for voice activity detection using DNN. EURASIP J. Audio Speech Music Proc. 2018, 2018, 10. [Google Scholar] [CrossRef]
  21. Zhang, Y.; Tang, Z.; Li, Y.; Luo, Y. A hierarchical framework approach for voice activity detection and speech enhancement. Sci. World J. 2014, 2014, 723643. [Google Scholar] [CrossRef] [PubMed] [Green Version]
  22. Zazo, R.; Sainath, T.N.; Simko, G.; Parada, C. Feature learning with raw-waveform CLDNNs for voice activity detection. In Proceedings of the Annual Conference of the International Speech Communication Association (Interspeech), San Francisco, CA, USA, 8–12 September 2016; pp. 8–12. [Google Scholar]
  23. Kim, J.; Kim, J.; Lee, S.; Park, J.; Hahn, M. Vowel based voice activity detection with LSTM recurrent neural network. In Proceedings of the International Conference on Signal Processing Systems, Auckland, New Zealand, 21–24 November 2016; pp. 134–137. [Google Scholar]
  24. Zhang, X.-L.; Wang, D. Boosting contextual information for deep neural network based voice activity detection. IEEE/ACM Trans. Audio Speech Lang. Process. 2016, 24, 252–264. [Google Scholar] [CrossRef]
  25. Ronneberger, O.; Fischer, P.; Brox, T. U-Net: Convolutional networks for biomedical image segmentation. In Proceedings of the International Conference on Medical Image Computing and Computer Assisted Intervention (MICCAI), Munich, Germany, 5–9 October 2015; pp. 234–241. [Google Scholar]
  26. Glorot, X.; Bengio, Y. Understanding the difficulty of training deep feedforward neural networks. In Proceedings of the International Conference on Artificial Intelligence and Statistics, Sardinia, Italy, 13–15 March 2010; pp. 249–256. [Google Scholar]
  27. Kingma, D.; Ba, J. Adam: A method for stochastic optimization. In Proceedings of the International Conference on Learning Representations (ICLR), San Diego, CA, USA, 7–9 May 2015; pp. 2–5. [Google Scholar]
  28. Srivastava, N.; Hinton, G.; Krizhevsky, A.; Sutskever, I.; Salakhutdinov, R. Dropout: A simple way to prevent neural networks from overfitting. J. Mach. Learn. Res. 2014, 15, 1929–1958. [Google Scholar]
  29. Tu, Y.; Du, J.; Xu, Y.; Dai, L.; Lee, C.-H. Deep neural network based speech separation for robust speech recognition. In Proceedings of the International Symposium on Chinese Spoken Language Processing (ISCSLP), Singapore, 12–14 September 2014; pp. 532–536. [Google Scholar]
  30. Grais, E.; Sen, M.; Erdogan, H. Deep neural networks for single channel source separation. In Proceedings of the IEEE International Conference on Acoustics, Speech and Signal Processing (ICASSP), Florence, Italy, 4–9 May 2014; pp. 3734–3738. [Google Scholar]
  31. Kjems, U.; Pedersen, M.S.; Boldt, J.B.; Lunner, T.; Wang, D. Speech intelligibility of ideal binary masked mixtures. In Proceedings of the European Signal Processing Conference (EUSIPCO), Aalborg, Denmark, 23–27 August 2010; pp. 1909–1913. [Google Scholar]
  32. Montazeri, V.; Assmann, P.F. Constraints on ideal binary masking for the perception of spectrally-reduced speech. J. Acoust. Soc. Am. 2018, 144, EL59–EL65. [Google Scholar] [CrossRef] [PubMed]
  33. Germain, F.G.; Sun, D.L.; Mysore, G.J. Speaker and noise independent voice activity detection. In Proceedings of the Annual Conference of the International Speech Communication Association (Interspeech), Lyon, France, 25–29 August 2013; pp. 732–736. [Google Scholar]
  34. Garofolo, J.S.; Lamel, L.F.; Fisher, W.M.; Fiscus, J.G.; Pallett, D.S.; Dahlgren, N.L. TIMIT Acoustic Phonetic Continuous Speech Corpus LDC93S1. Available online: https://catalog.ldc.upenn.edu/LDC93S1 (accessed on 22 March 2020).
  35. Varga, A.; Steeneken, H.J.M. Assessment for automatic speech recognition: II. NOISEX-92: A database and an experiment to study the effect of additive noise on speech recognition systems. Speech Commun. 1993, 12, 247–251. [Google Scholar] [CrossRef]
  36. P.862: Perceptual Evaluation of Speech Quality (PESQ): An Objective Method for End-to-End Speech Quality Assessment of Narrow-band Telephone Networks and Speech Codecs. Available online: https://www.itu.int/rec/T-REC-P.862 (accessed on 22 March 2020).
  37. Taal, C.H.; Hendriks, R.C.; Heusdens, R.; Jensen, J. A short-time objective intelligibility measure for time-frequency weighted noisy speech. In Proceedings of the IEEE International Conference on Acoustics, Speech and Signal Processing (ICASSP), Dallas, TX, USA, 14–19 March 2010; pp. 4214–4217. [Google Scholar]
  38. Bai, Y.; Yi, J.; Tao, J.; Wen, Z.; Liu, B. Voice activity detection based on time-delay neural network. In Proceedings of the Asia-Pacific Signal and Information Processing Association Annual Summit and Conference, Lanzhou, China, 18–21 November 2019; pp. 1173–1178. [Google Scholar]
  39. Zhou, Q.; Feng, Z.; Benetos, E. Adaptive noise reduction for sound event detection using subband-weighted NMF. Sensors 2019, 19, 3206. [Google Scholar] [CrossRef] [PubMed] [Green Version]
  40. Ganin, Y.; Ustinova, E.; Ajakan, H.; Germain, P.; Larochelle, H.; Laviolette, F.; Marchand, M.; Lempitsky, V. Domain adversarial training of neural networks. J. Mach. Learn. Res. 2016, 17, 1–35. [Google Scholar]
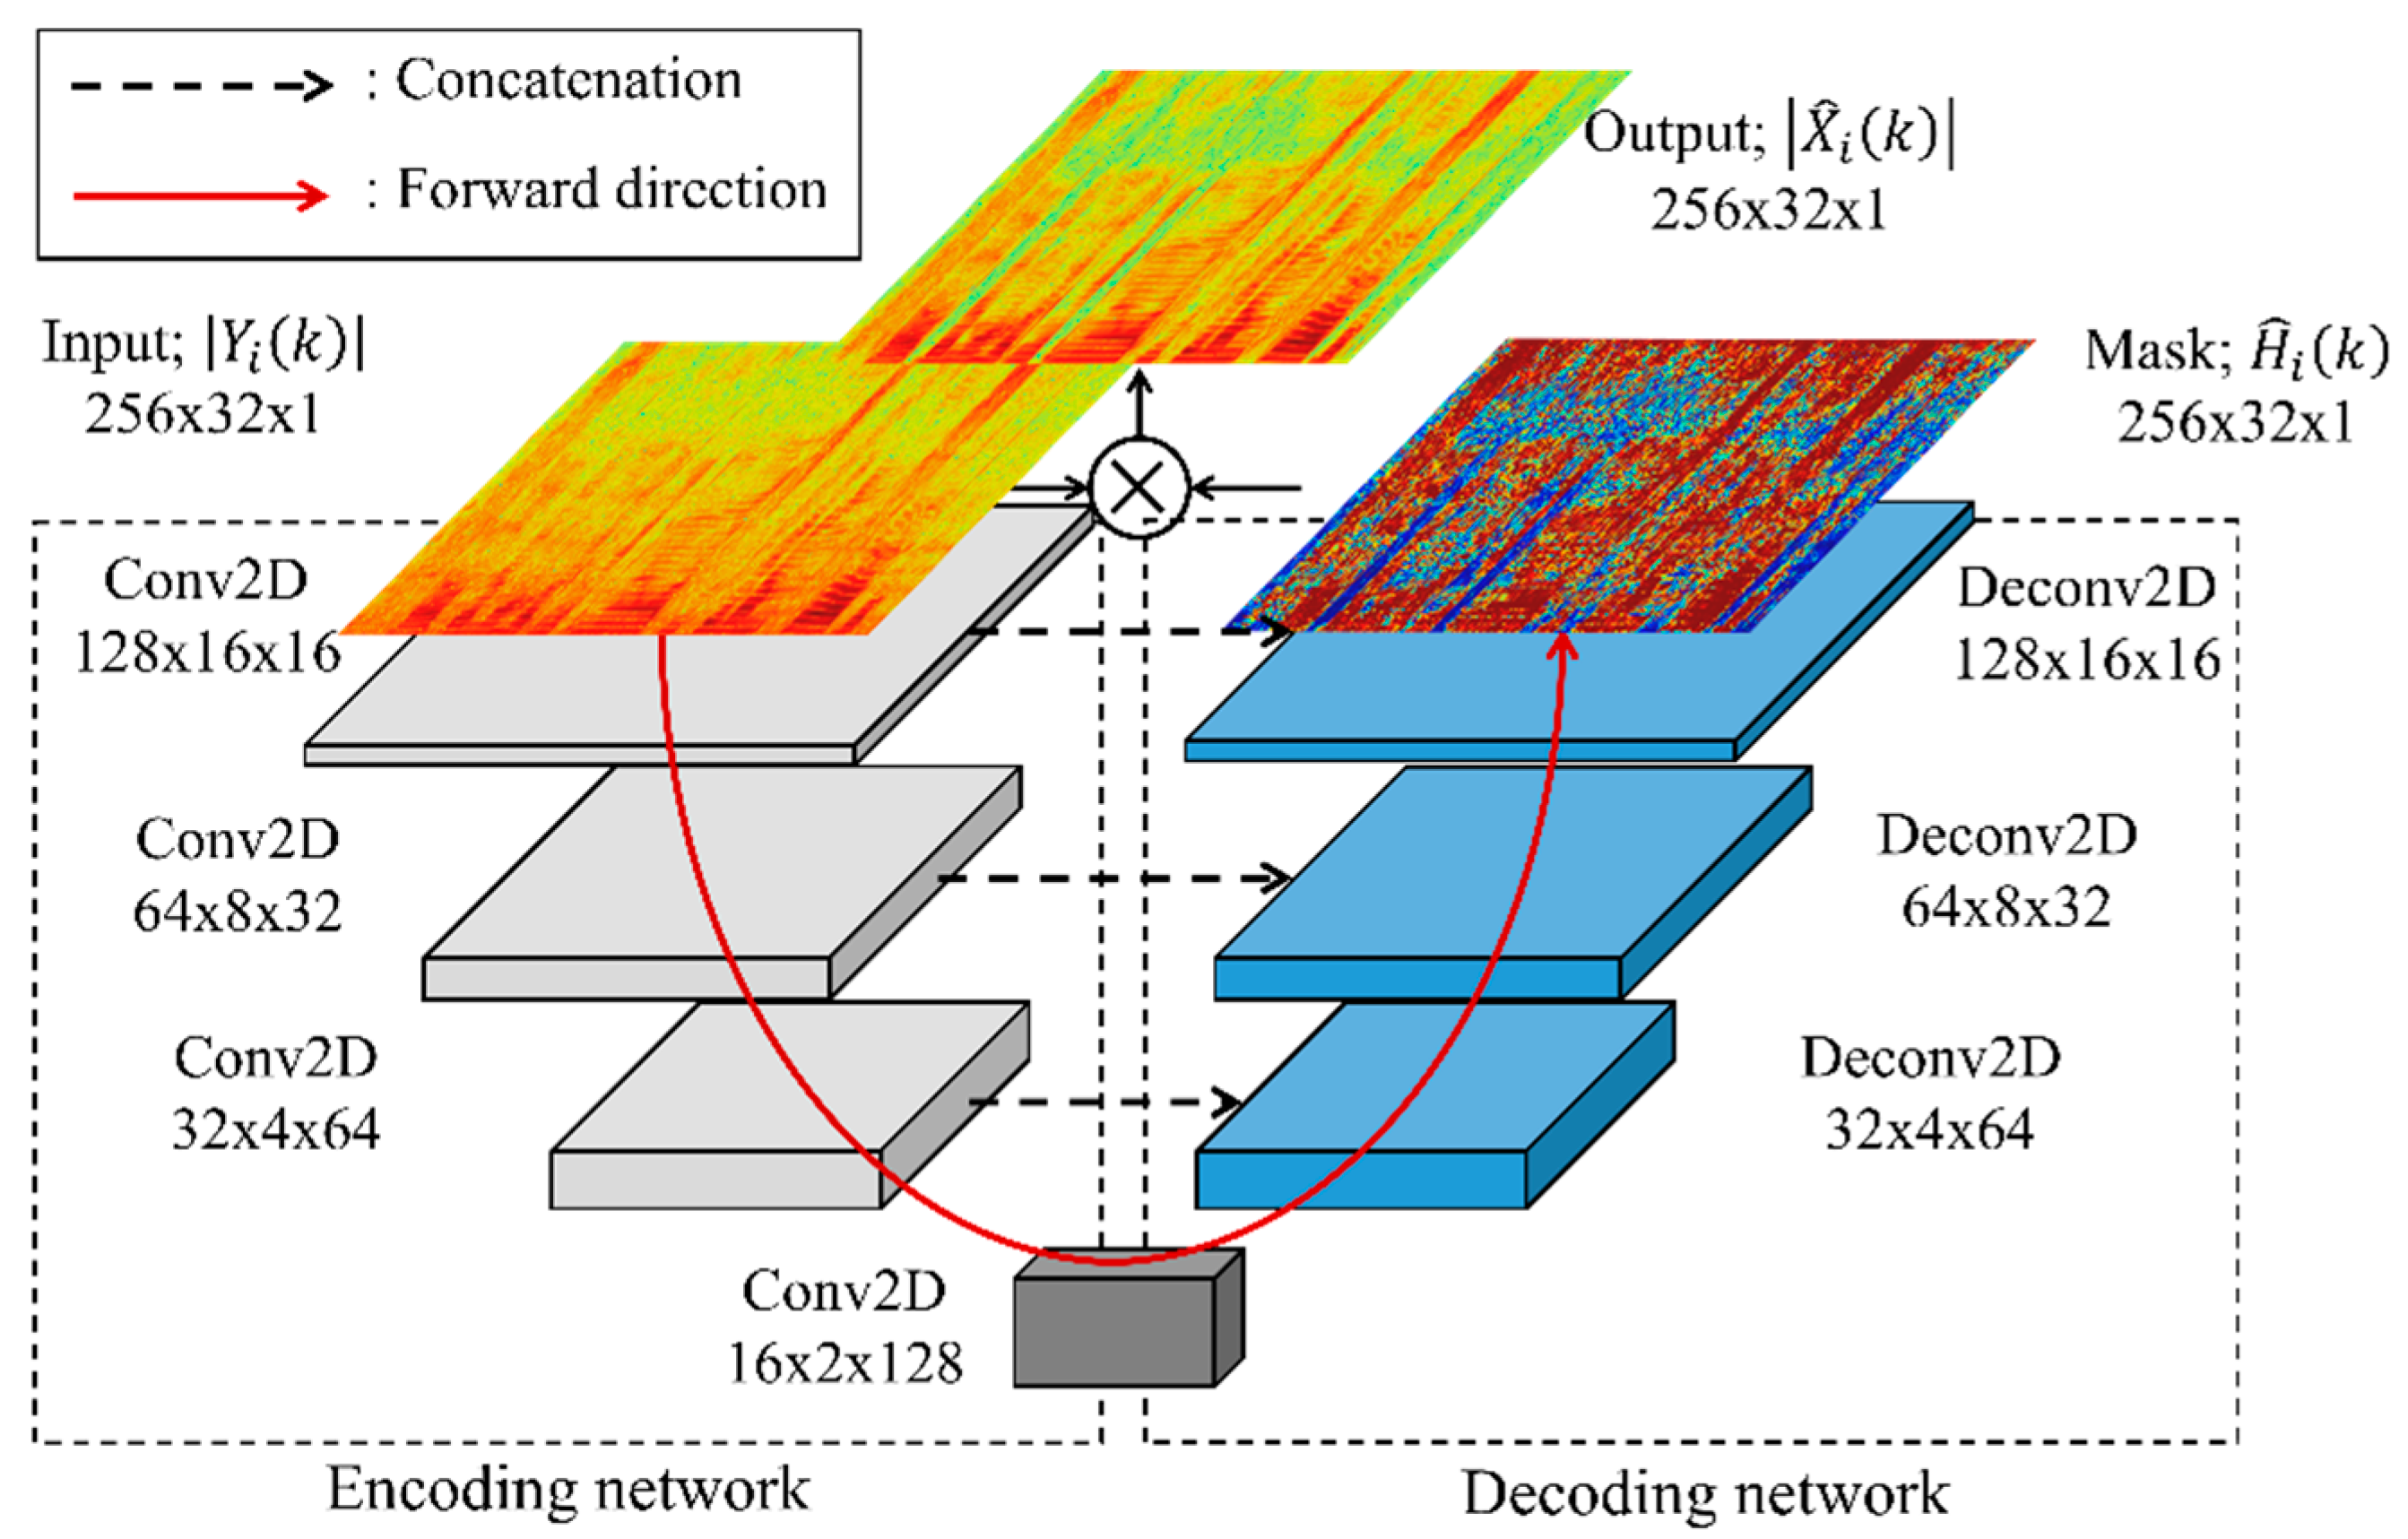
Figure 1. Network architecture of the U-Net-based single-channel speech enhancement.
Applsci 10 03230 g001
Figure 2. Network architecture of the proposed multi-task learning U-Net (MTU-Net)-based single-channel speech enhancement.
Applsci 10 03230 g002
Figure 3. The procedure of obtaining three different estimates of clean speech from the noisy input speech and the outputs of the proposed MTU-Net.
Applsci 10 03230 g003
Figure 4. Comparison of block diagrams concerning the combination of speech enhancement and voice activity detection: (a) a conventionally combined approach and (b) the proposed approach.
Applsci 10 03230 g004
Figure 5. Comparison of the objective quality measures for seven different speech enhancement methods applied to the matched evaluation dataset: (a) perceptual evaluation of speech quality (PESQ) and (b) short-time objective intelligibility (STOI).
Applsci 10 03230 g005
Figure 6. Comparison of the objective quality measures for seven different speech enhancement methods applied to the mismatched evaluation dataset: (a) perceptual evaluation of speech quality (PESQ) and (b) short-time objective intelligibility (STOI).
Applsci 10 03230 g006
Table 1. Comparison of the model footprints of each speech enhancement method used in the experiment.
MethodSNMFDRNNSEGANU-NetMTU-Net
Hyper-Parameters
Network structure- Speech Basis
(513 × 64)
- Noise Basis
(513 × 64)
- Input
(513 × 1000)
- Dense
(1000 × 1000)
- RNN
(1000 × 1000)
- Dense
(1000 × 1000)
- Output
(1000 × 513)
(1000 × 513)
- Input
(16,384 × 1)
- 1DConv_Enc
{8192 × 16, 4096 × 32, 2048 × 32, 1024 × 64, 512 × 64, 256 × 128, 128 × 128, 64 × 256, 32 × 256, 16 × 512, 8 × 1024}
- 1DConv_Dec
{8 × 1024, 16 × 512, 32 × 256, 64 × 256, 128 × 128, 256 × 128, 512 × 64, 1024 × 64, 2048 × 32, 4096 × 32, 8192 × 16}
- Output
(16,384 × 1)
- Input
(256 × 32)
- 2DConv_Enc
{128 × 16 × 64, 64 × 8 × 128, 32 × 4 × 256, 16 × 2 × 512}
- 2DConv_Dec
{32 × 4 × 256, 64 × 8 × 128, 128 × 16 × 64}
- Output
(256 × 32)
- Input
(256 × 32)
- 2DConv_Enc
{128 × 16 × 64, 64 × 8 × 128, 32 × 4 × 256, 16 × 2 × 512}
- 2DConv_Dec
{32 × 4 × 256, 64 × 8 × 128, 128 × 16 × 64}
{32 × 4 × 256, 64 × 8 × 128, 128 × 16 × 64}
- Output
(256 × 32)
(256 × 32)
Feature typeSpectral magnitude (513)Log spectral magnitude (513)Time sample (16384)Spectral magnitude (257)Spectral magnitude (257)
Model footprint1.0 MB40.2 MB1.0 GB27.5 MB42.3 MB
Table 2. Comparison of the perceptual evaluation of speech quality (PESQ) scores of seven different speech enhancement methods applied to the mismatched evaluation dataset.
MethodsNoise
babblef16buccabber2factory2Average
Noisy2.262.252.192.472.29
SNMF2.332.312.272.592.37
DRNN2.502.682.682.832.67
SEGAN2.132.432.412.572.40
U-Net2.392.512.512.662.52
MTU-Net(spec)2.602.792.782.942.78
MTU-Net(IBM)2.232.762.552.702.56
MTU-Net(IRM)2.772.952.983.022.92
Table 3. Comparison of the short-time objective intelligibility (STOI) scores of seven different speech enhancement methods applied to the mismatched evaluation dataset.
MethodsNoise
babblef16buccabber2factory2Average
Noisy0.850.870.880.880.87
SNMF0.840.880.870.880.87
DRNN0.800.830.810.830.82
SEGAN0.830.850.850.860.84
U-Net0.820.850.840.850.84
MTU-Net(spec)0.830.880.870.890.87
MTU-Net(IBM)0.840.890.890.890.88
MTU-Net(IRM)0.850.910.910.890.90
Table 4. Comparison of the receiver operating characteristic curves (AUCs) (%) and equal error rates (EERs) (%) of seven different voice activity detection methods according to their different signal-to-noise ratios under matched noise conditions.
AUC (%)−5 dB0 dB5 dB10 dBAverage
Noisy + DNN86.7290.1891.0392.5190.11
Noisy + bDNN86.0690.7589.8891.4789.54
Noisy + LSTM86.5191.2191.0892.2290.26
MTU-Net(IRM) + DNN89.3293.3194.3695.4893.12
MTU-Net(IRM) + bDNN89.4792.3992.3093.5291.92
MTU-Net(IRM) + LSTM89.6392.9292.7593.8992.30
Proposed mask-based VAD84.6388.0489.8889.1387.92
EER (%)−5 dB0 dB5 dB10 dBAverage
Noisy + DNN23.1617.2815.7414.3417.63
Noisy + bDNN23.6418.6220.4018.68720.34
Noisy + LSTM24.1719.0719.3617.7220.08
MTU-Net(IRM) + DNN21.4216.7015.8914.0617.02
MTU-Net(IRM) + bDNN20.3717.0117.4315.6817.62
MTU-Net(IRM) + LSTM20.2516.6616.7815.3017.25
Proposed mask-based VAD22.7019.3618.1718.7119.73
Table 5. Comparison of the AUCs (%) and EERs (%) of the seven different voice activity detection methods according to their different signal-to-noise ratios under mismatched conditions.
AUC (%)−5 dB0 dB5 dB10 dBAverage
Noisy + DNN81.0586.0288.9491.4386.86
Noisy + bDNN79.0585.1087.8590.5985.65
Noisy + LSTM80.6086.3789.0290.8486.71
MTU-Net + DNN79.5284.7987.2489.2285.19
MTU-Net + bDNN79.4284.6387.1189.1184.69
MTU-Net + LSTM79.4585.1887.2089.1685.25
Proposed mask-based VAD84.6088.0489.8889.1387.91
EER (%)−5 dB0 dB5 dB10 dBAverage
Noisy + DNN27.5623.2119.8216.3221.73
Noisy + bDNN30.3024.4121.9819.7524.11
Noisy + LSTM27.3922.2019.9218.0521.89
MTU-Net + DNN29.4025.3223.8221.8425.10
MTU-Net + bDNN30.7725.9523.9422.4425.78
MTU-Net + LSTM30.5025.5124.2022.8325.83
Proposed mask-based VAD22.7419.3618.1618.7119.74