Article

Effect of Heat-Treatment Remediation on the Mechanical Behavior of Oil-Contaminated Soil

1
Department of Civil Engineering, National Chiao Tung University, Hsinchu 300, Taiwan
2
Department of Civil and Environmental Engineering, National University of Kaohsiung, Kaohsiung 811, Taiwan
*
Author to whom correspondence should be addressed.
Appl. Sci. 2020, 10(9), 3174; https://doi.org/10.3390/app10093174
Submission received: 3 April 2020 / Revised: 29 April 2020 / Accepted: 30 April 2020 / Published: 2 May 2020
(This article belongs to the Special Issue Recycling Waste in Construction Materials)

Abstract

:

Featured Application

The physical properties of heat-treated soil are clarified in this study before the soil is reused as a construction material in civil engineering.

Abstract

The heat treatment of oil-contaminated sites is widely carried out for the purposes of remediation. However, heat treatment changes the physical and chemical properties of soil. Before the soil can be reused as a construction material in civil engineering, such as in backfill or road base materials, the changes to its physical properties must be understood. Therefore, this study investigates the changes in the physical and chemical properties of oil-contaminated soil after heat treatment. In this investigation, experimental samples of soil with added oil from a refinery plant are used to investigate the removal rate of total petroleum hydrocarbons (TPHs) by thermal desorption and incineration. The physical properties of the soil, including water permeability and mechanical properties, are compared before and after heat treatment. The results of this study are as follows. (1) Particle size analysis reveals that heat treatment makes soil particles finer. (2) In the burning reduction test, heat treatment at 900 °C removes more than 90% of THP. (3) In the direct shear test, the friction angle (ϕ) increases with the removal rate. (4) In the hydraulic test, as the removal rate increases, the permeability coefficient increases after heat treatment.

1. Introduction

Soil pollution is an important issue in relation to the environment and public health [1,2]. Among pollutants, organic substances—including petroleum hydrocarbons, insecticides, and herbicides—are a major type of pollutants in soil [3,4,5]. In Taiwan, by the end of 2015, soil and groundwater pollution were controlled at 3090 sites, covering a total area of 15.2 million square meters [6], of which gasoline and diesel pollution were the most common forms of organic pollution. These pollutants are present as a result of leakage accidents, oil storage tanks, oil refineries, industrial parks, and other facilities [7,8,9].
According to site research, the main pollution components of petroleum-contaminated soils include alkanes, olefins, naphthenes, aromatic hydrocarbons, ethers, and alcohols, such as benzene, toluene, ethylbenzene, and xylene (these four are collectively referred to as BTEX) and trimethylbenzene (TMB). Together, these pollution components constitute total petroleum hydrocarbon (TPH) [10,11]. C10-C40 are hydrocarbons that are difficult to volatilize or attenuate in the environment. Once they leak, they accumulate in the soil for a long time and gradually leak into the groundwater, irreversibly polluting the environment. The remediation of affected soil is much more difficult than that of other media. When pollutants are distributed in soil pores, the conduction resistance increases the difficulty of soil remediation, and the physical and chemical properties of the pollutants influence the selected methods and effects of remediation.
Several soil restoration techniques are available, each of which can be applied to soil of different properties with different forms of pollution. Before the use of such techniques, the treatment time, economic benefits, safety, and characteristics of the locale must be considered. Treatment methods can be divided into (1) physical and chemical treatment methods, (2) heat-treatment methods, (3) biological treatment methods, and (4) plant restoration methods. Among various methods for remediating soil with organic pollution, heat treatment is the most extensively used because of its high removal efficiency and short restoration time, and it has been actively developed in recent years. Heat-treatment methods include hot gas decontamination, thermal desorption, high-temperature incineration, and pyrolysis. All of these methods use heat to separate or accelerate the separation of pollutants. They take a short time and have a high treatment efficiency, and they have been successfully used to treat soil that is contaminated by gasoline, aircraft fuel, and even polychlorinated biphenyls, pesticides, and dense non-aqueous phase liquid (DNAPL).
Most studies on the heat treatment of soil focus on the removal of organic pollutants, but few discuss the reuse of soil thereafter. In Taiwan, treated soil has been reused as a construction material in civil engineering, such as in backfill and road base materials. However, heat treatment changes the physical properties of the soil, which greatly affects the subsequent engineering application. The effect of heat treatment must be understood, but the related data are lacking. Therefore, this study investigates the percentage removal of total petroleum hydrocarbons (TPHs), as well as changes in soil physical properties upon the heat treatment of petroleum-contaminated soils. A high-temperature furnace in a laboratory was used to heat soil specimens and simulate heat treatment, including thermal desorption and high-temperature incineration. Test removal efficiency was obtained by varying the operating conditions. Heat-treated specimens were further subjected to soil mechanical experiments to compare their basic physical properties (including particle size distribution and Atterberg index), permeability, and mechanical properties, before and after heat treatment. The effects of various heat-treatment operating conditions on soil properties are investigated to provide a reference for future site remediation.

2. Experimental Section

2.1. Specimen Preparation

Changes in the mechanical properties of petroleum-contaminated soils upon heat treatment were experimentally studied. To simulate actual conditions, the soil was obtained from an existing petroleum-contaminated site, a refinery plant in southern Taiwan, but the sampled soil was not polluted. To reduce soil heterogeneity, all soil specimens in this investigation were taken from the same location. The pollutants were commercially available gasoline and diesel. Particle size greatly influences the mechanical properties of soil. Therefore, a fixed particle size distribution was used to eliminate the influence of particle size distribution. The soil was sifted using an American Society for Testing and Materials (ASTM) standard sieve, and soil that passed through the No. 4 sieve (4.76 mm) was used. A single sieve analysis was conducted on all of the soil that passed through the No. 4 sieve (4.76 mm), yielding the particle size distribution curve in Figure 1.
The simulated pollutants in the experiment were gasoline and diesel, and the pollution concentration was set to 0 (uncontaminated soil specimen), 5000, or 10,000 ppm, according to the literature [12,13] and previous investigation data in the refinery plant. The simulated soil specimens in each experiment were mixed with gasoline or diesel to the experimental concentration. After stirring, they were placed in a high-temperature furnace for heat treatment.

2.2. Heat Treatment

The high-temperature furnace (Dengyang Inc., Kaohsiung, Taiwan) had a maximum temperature of 1500 °C. Table 1 presents the test conditions. The experimental parameters were the concentration of gasoline or diesel, the heat-treatment temperature, and the treatment time. To simulate the working temperature in different heat treatment methods, including low-temperature thermal desorption (LTTD), high-temperature thermal desorption (HTTD), and incineration, three temperatures were selected, which were 320, 560, and 900 °C. Heat-treatment times of 10, 30, and 60 min were used to investigate the effect of temperature and time on treatment efficiency and the mechanical properties of the soil after treatment. After the test soil specimens were heat-treated, they were subjected to testing for properties including particle size distribution curve, specific gravity, Atterberg limit, and permeability, and they underwent a direct shear test to obtain the permeability coefficient, cohesion (c), friction angle (ϕ), and other parameters. The heat-treated soil also underwent a loss-on-ignition test to confirm the efficiency of heat treatment.

2.3. Testing of Soil Mechanics

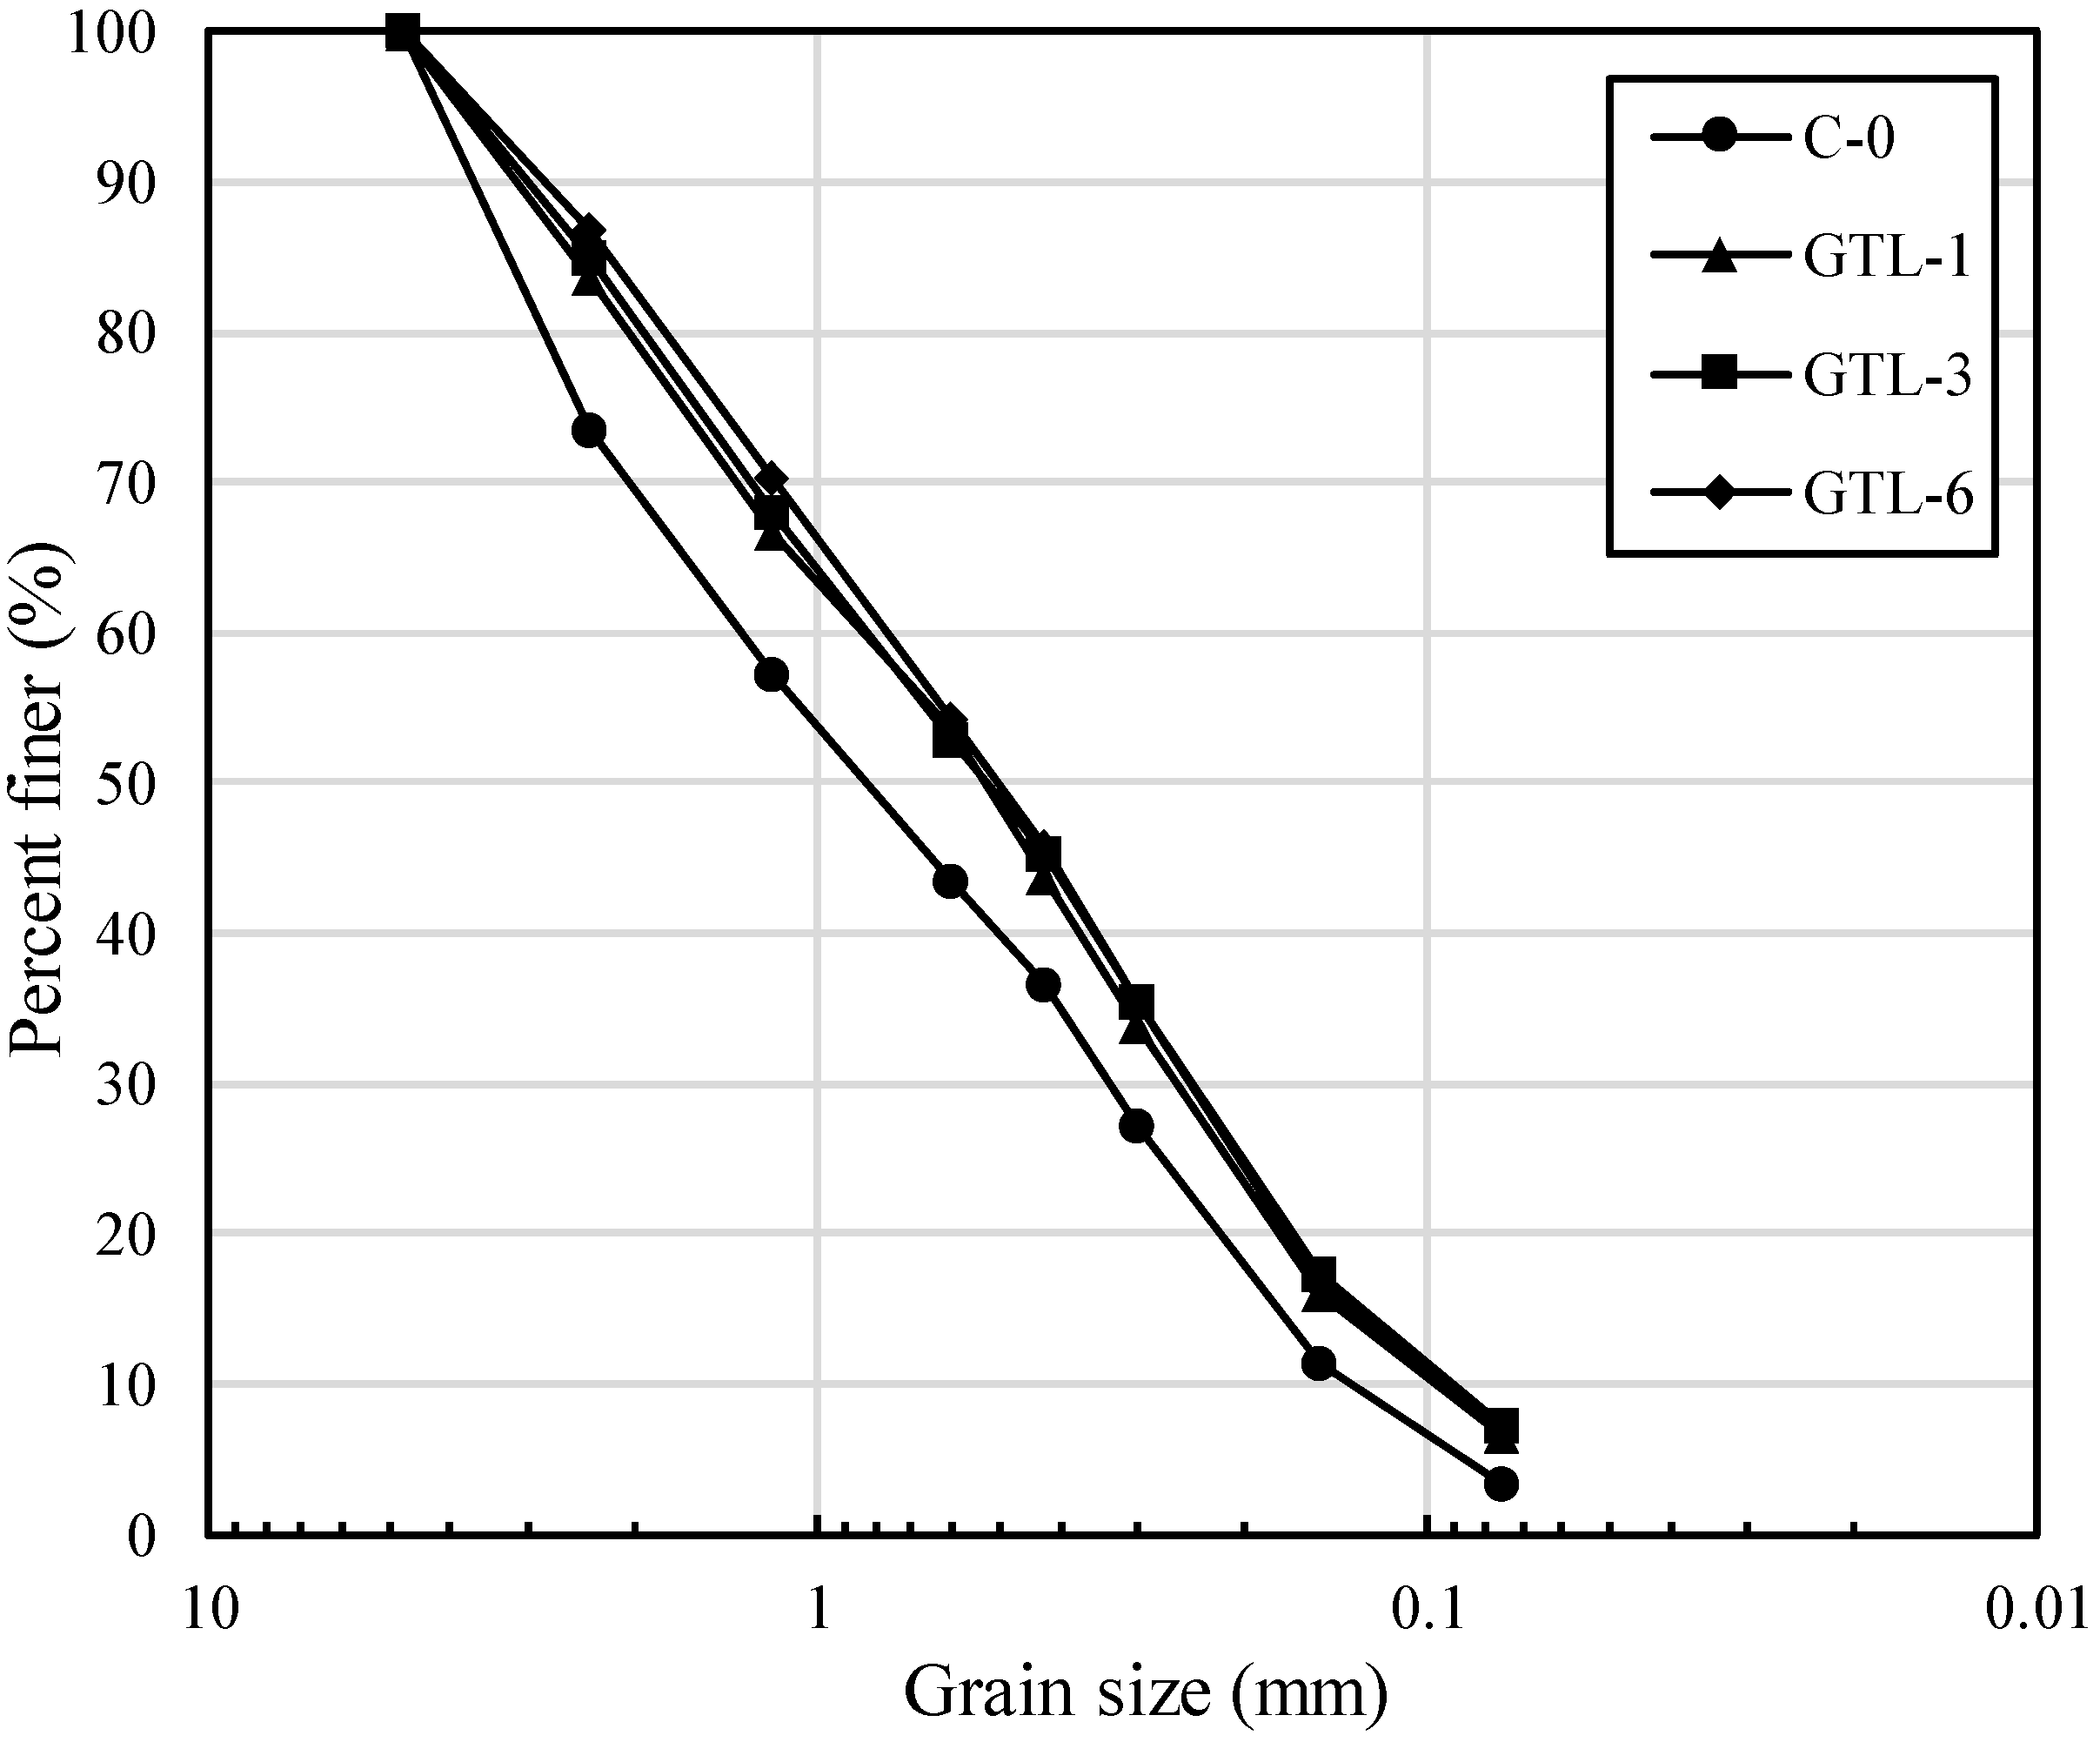
2.3.1. Sieve Analysis

Heat-treated soil was subjected to a sieve analysis, according to the ASTM D452-85 (fine mesh sieve analysis) test specifications. After about 5 min of sieving, soil with particle sizes less than 4.75 mm (#4 sieve), 2.36 mm (#8 sieve), 1.18 mm (#16 sieve), 0.6 mm (#30 sieve), 0.425 mm (#40 sieve), 0.355 mm (#50 sieve), 0.15 mm (#100 sieve), or 0.075 mm (#200 sieve), and soil that remained on the base plate, were obtained.

2.3.2. Atterberg Limit Test

The Atterberg limit test was performed according to the ASTM D452-85 test specification. The experimental results demonstrated the liquid limit (LL) and the plastic limit (PL) of the soil.

2.3.3. Specific Gravity Test

The specific gravity test was carried out according to the ASTM D854-83 specifications. The ratio of the unit weight of the soil to the unit weight of water at 4 °C was thus obtained, and the corresponding difference between the incineration soil and natural sandstone was determined.

2.3.4. Direct Shear Test

The shear strength of soil is commonly defined by the Mohr–Coulomb failure criterion:
τ = c + σ tan ( ϕ )
where c represents the cohesion of the soil and ϕ is the friction angle. Generally, a higher friction angle corresponds to better resistance of a material to sliding and subsidence, and a higher bearing capacity [14,15].
To obtain the shear strength of soil, the direct shear test is effective and convenient. It could be performed according to ASTM D3080-90. The size of the direct shear box was 100 × 90 × 20 mm, and the loads applied to the specimens were 31, 62, 124, and 187 kPa. Horizontal shear stress was applied to the direct shear box at 1 mm/min. Under various normal stresses, the shear stress was recorded. From the shear stress-displacement diagram, the highest shear stress under different normal stresses was obtained. From the failure envelope of the specimen, the friction angle (ϕ) was determined.

2.3.5. Permeability Test

The permeability of soil is closely related to the range and rate of distribution of pollutants. It is estimated using Darcy’s law: when a fluid flows through a porous material, the flow rate is proportional to the head loss (h) and is inversely proportional to the flow distance (L), where k is the permeability coefficient.
v = k ( h L )
The permeability coefficient k is related to soil particle size, pore connectivity, and fluid properties.
In the permeability test, the specimens were first prepared using the standard compaction test so that all specimens retained a similar initial density (18.1 kN/m3) and water content (13.4%). Then, the specimens were placed in the instrument (Kuanghsin Inc., Kaohsiung, Taiwan) for measuring constant head permeability, and they were tested according to the ASTM D3080-90 test specification. After the soil was saturated, the head difference, the length of the specimen, and the total flow in the sectional area and time were measured. The permeability coefficient k was calculated using Equation (2).

2.4. Heat-Treatment Efficiency Test

To understand the treatment efficiency of contaminated soils under different heat-treatment conditions, the standard loss-on-ignition test method of the Taiwan Environmental Protection Agency (NIEA R216.02C) was used [16]. First, a known amount of heat-treated soil was placed in a crucible in a high-temperature furnace. The temperature in the furnace was set to 900 °C, and the specimen was burned for 60 min. The soil was taken out, cooled, and then weighed. The weight loss upon this first treatment was the weight lost during the heat treatment at a particular temperature for a particular time. The weight loss after complete combustion was the weight lost at the maximum temperature for the longest heat-treatment time (900 °C, 60 min). The removal percentage was defined as the weight lost after the first treatment divided by the weight lost after complete combustion.
Removal   percentage = Weight   lost   after   the   first   treatment Weight   lost   after   complete   combustion × 100 %

3. Results and Discussion

3.1. Basic Properties of Soil

To understand the basic physical properties of the original soil, its particle size distribution curve, specific gravity, and Atterberg limit were obtained. The basic test results reveal that the specific gravity of the soil was 2.85, and the Atterberg limit tests indicated that it was non-plastic. Figure 1 shows the particle size distribution of the soil: D10 (effective particle size) = 0.137 mm, D30 = 0.303 mm, and D60 = 1.403 mm. Based on these data, the uniform coefficient Cu was calculated as 10.2 and the curvature coefficient Cz was 0.47. As a result of the above particle size distribution, gradation conditions, and Atterberg limits, the soil was classified as SP, sandy soil with poor gradation, based on the unified soil classification method. The constant head test yielded a permeability coefficient (k) of 3.47 × 10⁻⁶ m/sec, consistent with soil with low permeability. The direct shear test revealed a soil friction angle (ϕ) of 42.5°.
Figure 1 plots the particle size distribution of the soil after heat treatment. The test conditions are a concentration of gasoline of 1000 ppm and a heat-treatment temperature of 320 °C. Regardless of the conditions of heat treatment, the particle size distribution curve shifted to the right as a result of heat treatment, indicating that the size of the soil particles was reduced. In many processes that involve heat treatment, numerous factors cause changes in the particle size, including thermal stress such as non-uniform thermal expansion, chemical stress such as a chemical reaction on the surface of particles, and static stress and kinetic stress such as the rapid movement of particles [17,18,19]. The thermal shock of the combustion process also reduced the particle size [20]. Accordingly, heat treatment tended to shrink soil particles.

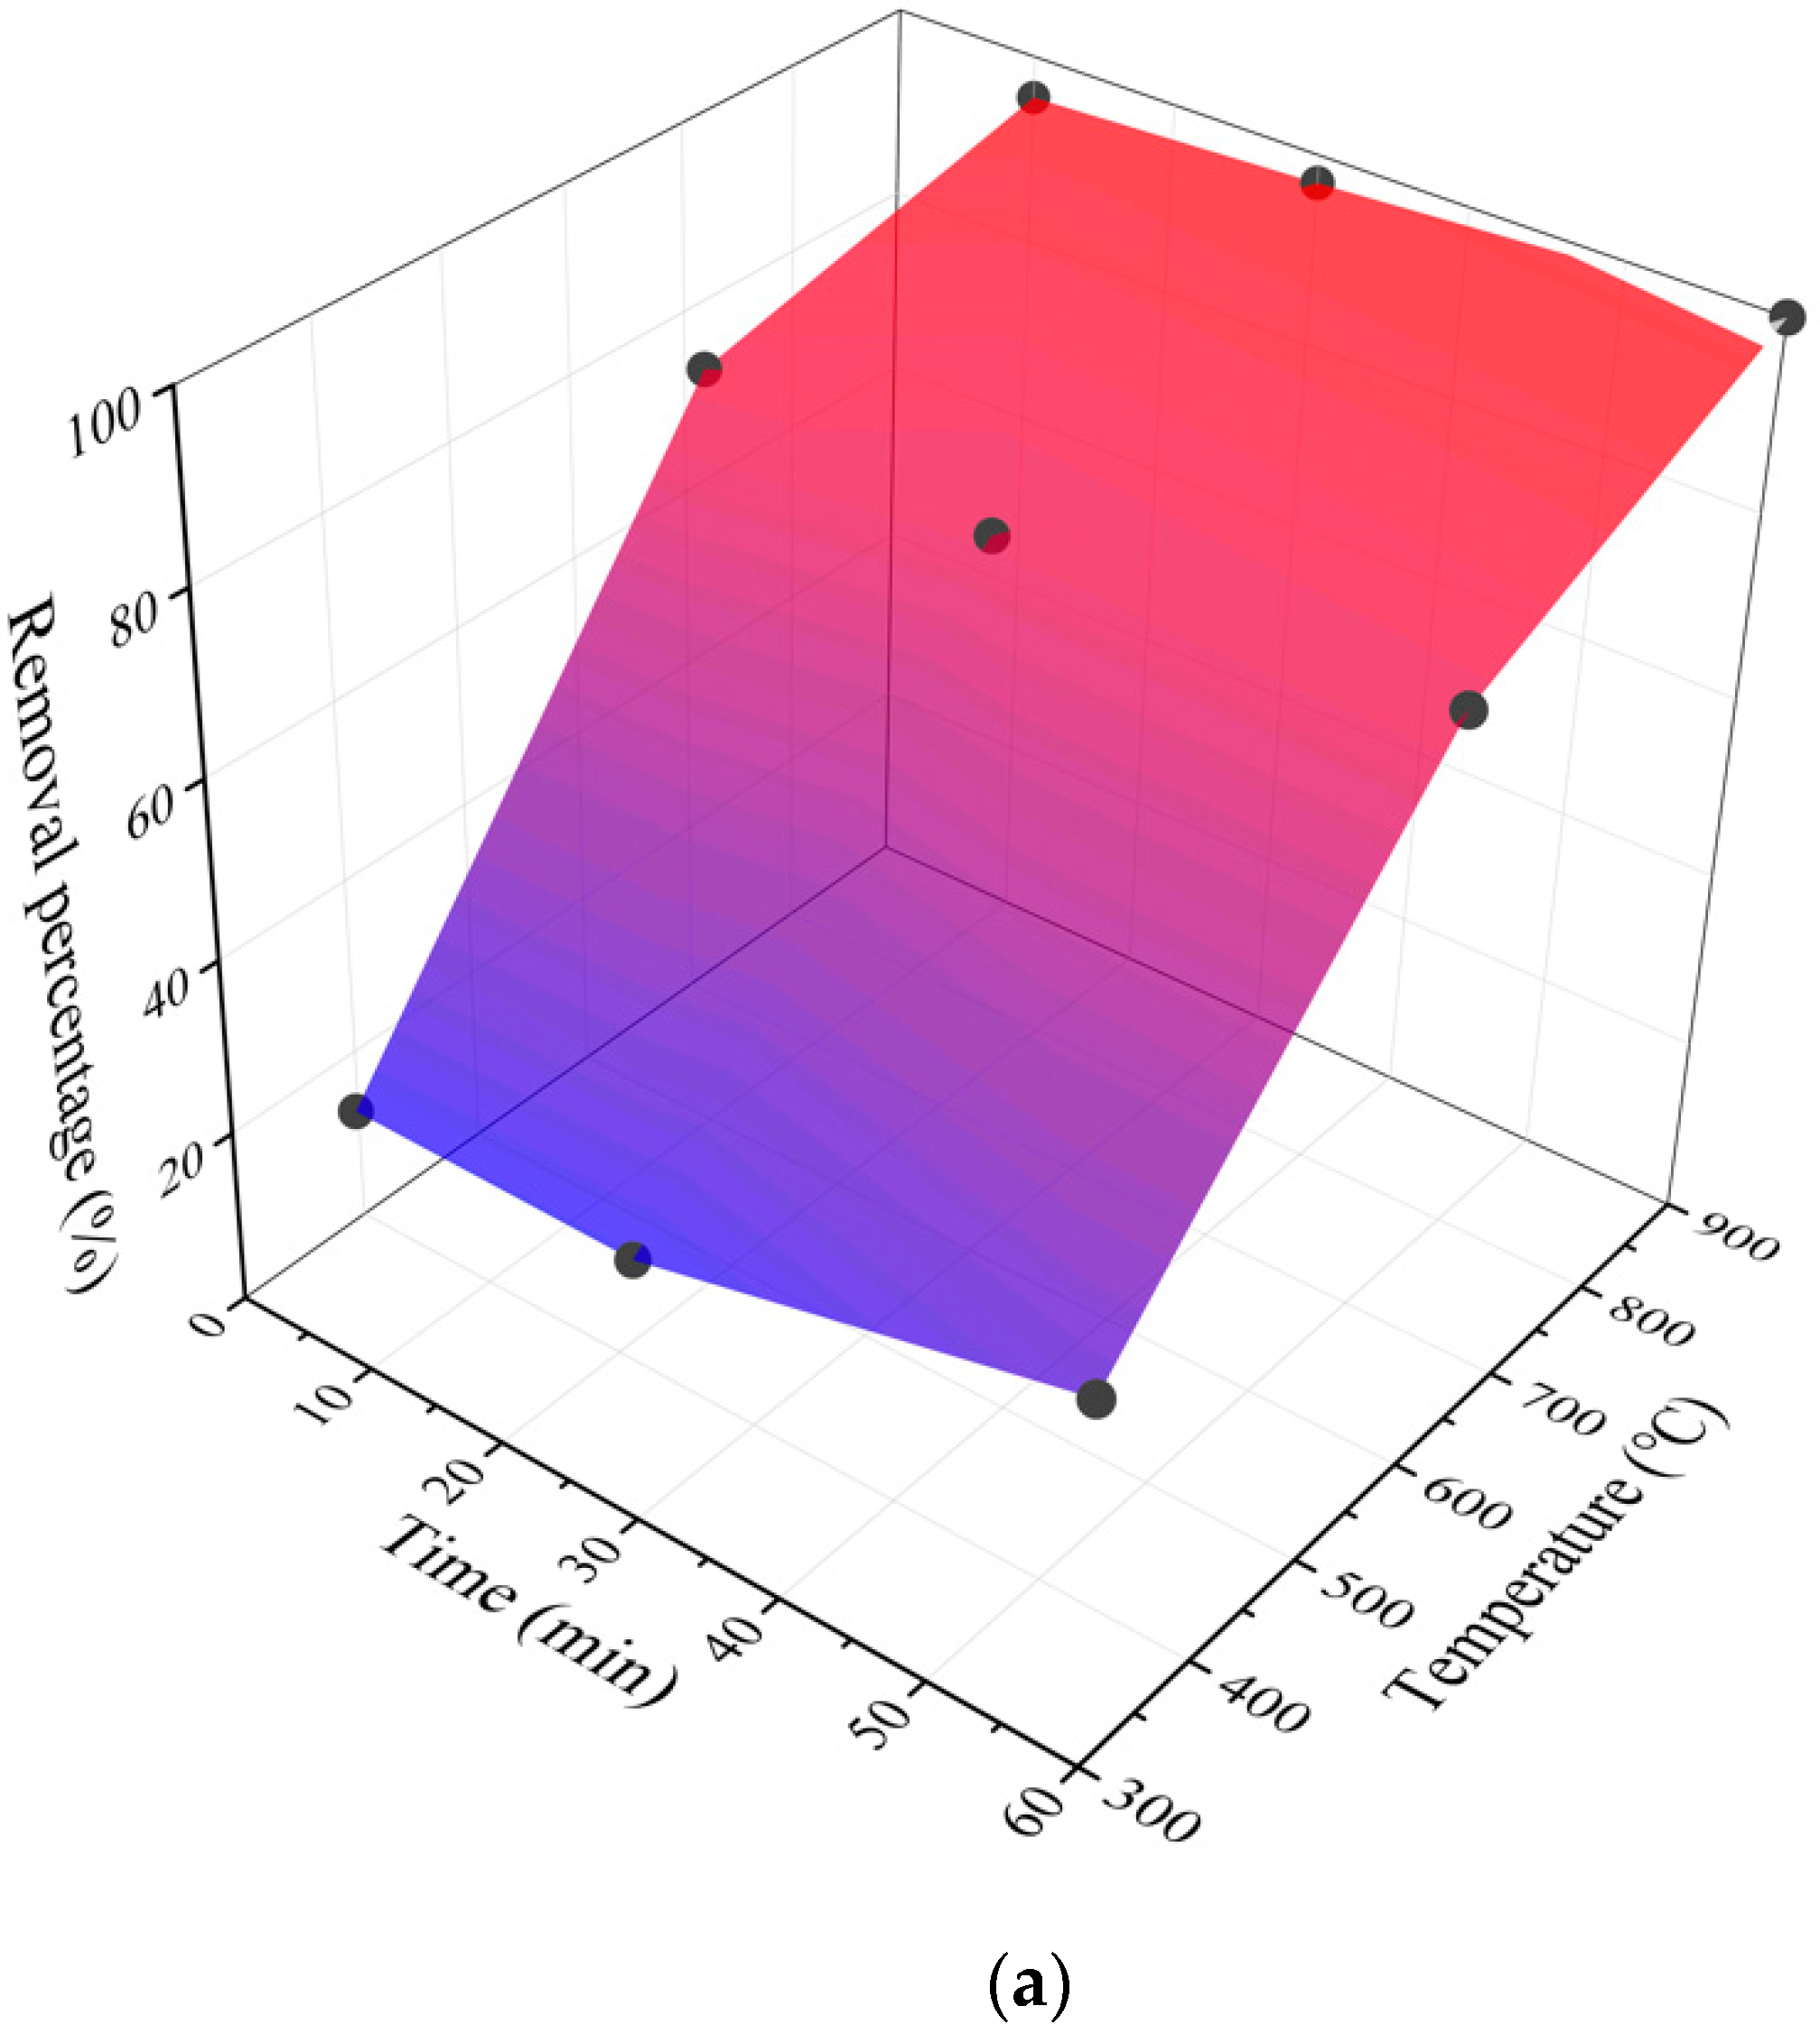
3.2. Relationship between Pollutant Removal Percentage and Treatment Parameters

According to Taiwan’s regulations concerning soil and groundwater pollution remediation, the concentration of total petroleum hydrocarbons in soil must be below 1000 ppm. Hence, in this experiment, the removal percentage of 5000 ppm-contaminated soil specimens had to exceed 80%, while that of 10,000 ppm-contaminated soil specimens had to exceed 90% to meet regulatory standards. Figure 2a,b plots the removal percentage at various operating temperatures and times when 5000 ppm of gasoline or diesel was added. The results indicate that soil that contained 5000 ppm of contaminant must be treated at over 600 °C for 30 min to ensure that the removal percentage of gasoline or diesel reaches 80%. Figure 3a,b shows the results obtained for 10,000 ppm of gasoline or diesel. Although the removal percentage tended to increase with treatment time or temperature, a removal percentage of 90% could only be achieved at a temperature of 900 °C. Sankaran et al. [21] used a fluidized bed incinerator to treat waste oil sludge, and the combustion efficiency was 98%–99%. Therefore, removal efficiency of more than 90% should be achieved by using high-temperature incineration to treat oil-contaminated soil. The removal efficiency was decided by treatment temperature and time. The results of this study also show that the removal efficiency increases with the operating temperature and time. In order to meet the standards of regulations, the operating temperature and time will be different for different oil-contaminated soil.

3.3. Effect of Pollutant Removal Percentage on Friction Angle

To determine the influence of different heat-treatment procedures on the mechanical properties of soil, Figure 4 shows the relationship between the friction angle of the soil and the removal percentage. As presented in Figure 4, regardless of whether the pollutant is gasoline or diesel, the friction angle increases with the removal percentage at different pollutant concentrations and under various treatment conditions. A higher heating temperature yields a larger friction angle. An increase in the friction angle (ϕ) reflects an increase in the strength of the soil, indicating a tendency of the engineering properties of the soil to improve as the treatment efficiency increases. Figure 5 compares the friction angles of soil to which gasoline or diesel was added at a particular pollution concentration after heat treatment. Under the same heat-treatment conditions, the ϕ value of diesel-contaminated soil is greater than that of gasoline-contaminated soil.

3.4. Effect of Pollutant Removal Percentage on Permeability

The permeability coefficient of the original soil was 3.47 × 10⁻⁶ m/s, so the soil had low permeability. Heat treatment at various temperatures increased the permeability coefficient of the soil to 4.25 × 10⁻⁶ ~ 1.38 × 10⁻⁴ m/s (Figure 6). The permeability coefficients of the 5000 ppm gasoline specimen after heat treatment at three temperatures were between 6.32 × 10⁻⁶ and 2.3 × 10⁻⁴ m/s; those of the 10,000 ppm gasoline specimen were between 1.07 × 10⁻⁵ and 7.88 × 10⁻⁴ m/s. Therefore, regardless of whether gasoline was added, the permeability coefficient of the soil after heat treatment exceeded that of the original soil specimen. Although treatment at 320 and 560 °C increased the permeability of the soil, the soil maintained low permeability.
The permeability coefficient of the soil with 10,000 ppm of gasoline added that was treated at 900 °C was between approximately 3.76 × 10⁻⁴ and 1.65 × 10⁻³ m/s; that of the soil with diesel after heat treatment at the three temperatures was between 1.9 × 10⁻⁴ and 3.31 × 10⁻³ m/s, all consistent with soil with medium permeability. Therefore, high temperature increased the permeability coefficient.
As plotted in Figure 6, the permeability coefficient of each soil specimen increases with the removal percentage under all operating conditions. Figure 7 demonstrates that the permeability coefficient of the heat-treated soil with diesel is greater than that of the soil with gasoline under the same treatment conditions.

4. Conclusions

Heat treatment is widely used in the remediation of oil-contaminated soil. To re-use the treated soil as a construction material in civil engineering, such as in backfill and road base materials, the changes to its physical properties must be understood. Therefore, this investigation studied the removal percentages of total petroleum hydrocarbons (TPHs) from petroleum-contaminated soils by heat treatment as well as changes in their physical properties. It also discussed the effect of heat-treatment operating conditions (treatment temperature and time) on soil properties. The experimental results reveal a rightward shift of the particle size distribution curve of the soil upon heat treatment, indicating a decrease in the overall particle size of the soil, mainly due to thermal stress during high-temperature treatment, which breaks down soil particles.
Under various operating conditions, if the contaminant concentration is 5000 ppm, a treatment temperature of approximately 600 °C can reduce the pollution concentration to below regulatory levels. However, if the concentration of gasoline or diesel is 10,000 ppm, only heat treatment at 900 °C can meet regulatory standards. The friction angle increases with the removal percentage at different pollution concentrations and under various treatment conditions. Comparing the friction angles of the soil with added gasoline or diesel at the same pollution concentration after heat treatment indicates that the ϕ value of the diesel-contaminated soil is greater than that of the gasoline-contaminated soil. The increase in the friction angle (ϕ value) represents an increase in the strength of the soil, indicating a tendency for the engineering properties of the soil to improve as the treatment efficiency increases. Heat treatment slightly increased the permeability coefficient of the original soil specimen, but it significantly increased that of the soil with added gasoline or diesel. As the removal percentage increased, the permeability coefficient tended to rise. In particular, the permeability coefficient of the contaminated soil with added diesel increased more. This study clarified the effect of heat-treatment operating conditions on soil properties to provide a reference for future site remediation. Last but not least, some limitations of this study should be noted. For the amount of heat-treated soil, this study only deals with volumes used for laboratory experiments. For a larger area of contaminated soil, further study is necessary. In addition, weathering may affect the type of hydrocarbons that remain in the soil and enhance the sorption of hydrophobic organic contaminants (HOCs) to the soil matrix. Freshly spiked soil is different in terms of behavior when compared to old soil. The weathering effect of pollutants could be investigated in the future.

Author Contributions

Data curation, M.-C.W. and C.-H.L; Formal analysis, M.-C.W., C.-H.L. and C.-L.L.; Funding acquisition, M.-C.W.; Investigation, C.-H.L; Methodology, M.-C.W. and C.-L.L.; Project administration, M.-C.W.; Resources, M.-C.W. and C.-L.L.; Supervision, M.-C.W. and C.-L.L.; Writing – original draft, M.-C.W. and C.-L.L.; Writing – review & editing, M.-C.W. and C.-L.L. All authors have read and agreed to the published version of the manuscript.

Funding

This research was funded by Ministry of Science and Technology, Taiwan, grant number MOST 107-2811-M-009-030 and MOST 107-2625-M-009-010.

Conflicts of Interest

The authors declare no conflict of interest.

References

  1. Pinedo, J.; Ibáñez, R.; Lijzen, J.P.A.; Irabien, Á. Assessment of soil pollution based on total petroleum hydrocarbons and individual oil substances. J. Environ. Manag. 2013, 130, 72–79. [Google Scholar] [CrossRef] [PubMed]
  2. Panagiotakis, I.; Dermatas, D. Remediation of contaminated sites. Bull. Environ. Contam. Toxicol. 2015, 94, 267–268. [Google Scholar] [CrossRef] [PubMed]
  3. Roy, S.; Labelle, S.; Mehta, P.; Mihoc, A.; Fortin, N.; Masson, C.; Leblanc, R.; Châteauneuf, G.; Sura, C.; Gallipeau, C.; et al. Phytoremediation of heavy metal and PAH-contaminated brownfield sites. Plant Soil 2005, 272, 277–290. [Google Scholar] [CrossRef] [Green Version]
  4. Cormier, S.A.; Lomnicki, S.; Backes, W.; Dellinger, B. Origin and health impacts of emissions of toxic by-products and fine particles from combustion and thermal treatment of hazardous wastes and materials. Environ. Health Perspect. 2006, 114, 810–817. [Google Scholar] [CrossRef] [PubMed] [Green Version]
  5. Ali, M.F.; Abbas, S. A review of methods for the demetallization of residual fuel oils. Fuel Process. Technol. 2006, 87, 573–584. [Google Scholar] [CrossRef]
  6. Taiwan’s Environmental Protection Administration (EPA). Yearbook of Environmental Protection Statistics. 2018. Available online: https://www.epa.gov.tw/np.asp?ctNode=31054&mp=epa (accessed on 10 April 2018).
  7. Adeniyi, A.A.; Afolabi, J.A. Determination of total petroleum hydrocarbons and heavy metals in soils within the vicinity of facilities handling refined petroleum products in Lagos metropolis. Environ. Int. 2002, 28, 79–82. [Google Scholar] [CrossRef]
  8. Abioye, O.P.; Agamuthu, P.; Abdul Aziz, A.R. Phytotreatment of soil contaminated with used lubricating oil using Hibiscus cannabinus. Biodegradation 2012, 23, 277–286. [Google Scholar] [CrossRef] [PubMed]
  9. Hu, G.; Li, J.; Zeng, G. Recent development in the treatment of oily sludge from petroleum industry: A review. J. Hazard. Mater. 2013, 261, 470–490. [Google Scholar] [CrossRef] [PubMed]
  10. Wixtrom, R.N.; Brown, S.L. Individual and population exposures to gasoline. J. Expo. Anal. Environ. Epidemiol. 1992, 2, 23–78. [Google Scholar] [PubMed]
  11. Hakkola, M.; Saarinen, L. Exposure of tanker drivers to gasoline and some of its components. Ann. Occup. Hyg. 1996, 40, 1–10. [Google Scholar] [CrossRef]
  12. Wang, J.; Liu, X.; Zhang, X.; Liang, X.; Zhang, W. Growth response and phytoremediation ability of Reed for diesel contaminant. Procedia Environ. Sci. 2011, 8, 68–74. [Google Scholar] [CrossRef] [Green Version]
  13. Shen, Y.; Ji, Y.; Li, C.; Luo, P.; Wang, W.; Zhang, Y.; Nover, D. Effects of Phytoremediation Treatment on Bacterial Community Structure and Diversity in Different Petroleum-Contaminated Soils. Int. J. Environ. Res. Public Health 2018, 15, 2168. [Google Scholar] [CrossRef] [PubMed] [Green Version]
  14. Weng, M.C.; Lin, C.L.; Ho, C.I. Mechanical properties of incineration bottom ash: The influence of composite species. Waste Manag. 2010, 30, 1303–1309. [Google Scholar] [CrossRef] [PubMed]
  15. Lin, C.L.; Weng, M.C.; Chang, C.H. Effect of incinerator bottom-ash composition on the mechanical behavior of backfill material. J. Environ. Manag. 2012, 113, 377–382. [Google Scholar] [CrossRef] [PubMed]
  16. TEPA. Test Methods for Contents of Ash and Combustibles in Waste. NIEA, R205.01C. 2003. Available online: https://www.epa.gov.tw/niea/7FB27BAD6A4AC928 (accessed on 1 March 2020).
  17. Ulerich, N.H.; Vaux, R.A.; Newby, R.A.; Keairns, D.L. Experimental/Engineering Support for EPA’s PBC Program; Final Report, EPA-600/7-80-015A; Westinghouse Research and Development Center: Pittsburgh, PA, USA, 1980. [Google Scholar]
  18. Vaux, W.G.; Fellers, A.W. Measurement of Attrition Tendency in Fluidization. AICHE Symp. Ser. 1981, 77, 107–115. [Google Scholar]
  19. Shamlou, P.A.; Liu, Z.; Yates, J.G. Hydrodynamic Influences on Particle Breakage in Fluidized Beds. Chem. Eng. Sci. 1990, 45, 809–817. [Google Scholar] [CrossRef]
  20. Lin, C.L.; Wey, M.Y. Effects of High Temperature and Combustion on Fluidized Material Attrition in a Fluidized Bed. Korean J. Chem. Eng. 2003, 20, 1123–1130. [Google Scholar] [CrossRef]
  21. Sankaran, S.; Pandey, S.; Sumathy, K. Experimental investigation on waste heat recovery by refinery oil sludge incineration using fluidised-bed technique. J. Environ. Sci. Health 1998, A33, 829–845. [Google Scholar] [CrossRef]
Figure 1. Particle size distribution curves of soil before and after thermal treatment. Note: C: original soil; G: soil with gasoline pollutant; T: the concentration of pollutant is 10,000 ppm; L: heating temperature is 320 °C; 1: heating for 10 min; 3: heating for 30 min; 6: heating for 60 min.
Applsci 10 03174 g001
Figure 2. Removal percentage of 5000 ppm of pollutant with different treatment parameters. (a) Gasoline; (b) Diesel.
Applsci 10 03174 g002aApplsci 10 03174 g002b
Figure 3. Removal percentage of 10,000 ppm of pollutant with different treatment parameters. (a) Gasoline; (b) Diesel.
Applsci 10 03174 g003aApplsci 10 03174 g003b
Figure 4. Relationship between pollutant removal percentage and frictional angle. (a) Gasoline; (b) Diesel. Note: C: original soil; G: soil with gasoline pollutant; D: soil with diesel pollutant. L: heating temperature is 320 °C; M: heating temperature is 560 °C; H: heating temperature is 900 °C.
Applsci 10 03174 g004
Figure 5. Comparison of the frictional angles of gasoline and diesel.
Applsci 10 03174 g005
Figure 6. Relationship between pollutant removal percentage and permeability. (a) Gasoline; (b) Diesel. Note: C: original soil; G: soil with gasoline pollutant; D: soil with diesel pollutant. L: heating temperature is 320 °C; M: heating temperature is 560 °C; H: heating temperature is 900 °C.
Applsci 10 03174 g006
Figure 7. Comparation of the permeabilities of gasoline and diesel.
Applsci 10 03174 g007
Table 1. Testing conditions in this research.
PollutantConcentration (ppm)Temperature (°C)Time (min)Set of Specimens
NoneNoneNoneNoneC-0
32010, 30, 60CL-1, CL-3, CL-6
56010, 30, 60CM-1, CM-3, CM-6
90010, 30, 60CH-1, CH-3, CH-6
Gasoline500032010, 30, 60GFL-1, GFL-3, GFL-6
56010, 30, 60GFM-1, GFM-3, GFM-6
90010, 30, 60GFH-1, GFH-3, GFH-6
10,00032010, 30, 60GTL-1, GTL-3, GTL-6
56010, 30, 60GTM-1, GTM-3, GTM-6
90010, 30, 60GTH-1, GTH-3, GTH-6
Diesel500032010, 30, 60DFL-1, DFL-3, DFL-6
56010, 30, 60DFM-1, DFM-3, DFM-6
90010, 30, 60DFH-1, DFH-3, DFH-6
10,00032010, 30, 60DTL-1, DTL-3, DTL-6
56010, 30, 60DTM-1, DTM-3, DTM-6
90010, 30, 60DTH-1, DTH-3, DTH-6
Note: C: original soil; G: soil with gasoline pollutant; D: soil with diesel pollutant. F: the concentration of pollutant is 5000 ppm; T: the concentration of pollutant is 10,000 ppm. L: heating temperature is 320 °C; M: heating temperature is 560 °C; H: heating temperature is 900 °C. 1: heating for 10 min; 3: heating for 30 min; 6: heating for 60 min.

