Article

Using Feature Fusion and Parameter Optimization of Dual-input Convolutional Neural Network for Face Gender Recognition

1
Department of Computer Science and Information Engineering, National Chin-Yi University of Technology, Taichung City 411, Taiwan
2
School of Intelligence, National Taichung University of Science and Technology, Taichung 404, Taiwan
3
Department of Electrical Engineering, National Chung Hsing University, Taichung City 402, Taiwan
*
Author to whom correspondence should be addressed.
Appl. Sci. 2020, 10(9), 3166; https://doi.org/10.3390/app10093166
Submission received: 18 March 2020 / Revised: 21 April 2020 / Accepted: 29 April 2020 / Published: 1 May 2020
(This article belongs to the Special Issue Advances of Computer Vision)

Abstract

:
In recent years, convolutional neural networks (CNNs) have been successfully used in image recognition and image classification. General CNNs only use a single image as feature extraction. If the quality of the obtained image is not good, it is easy to cause misjudgment or recognition error. Therefore, this study proposes the feature fusion of a dual-input CNN for the application of face gender classification. In order to improve the traditional feature fusion method, this paper also proposes a new feature fusion method, called the weighting fusion method, which can effectively improve the overall accuracy. In addition, in order to avoid the parameters of the traditional CNN being determined by the user, this paper uses a uniform experimental design (UED) instead of the user to set the network parameters. The experimental results show that in the dual-input CNN experiment, average accuracy rates of 99.98% and 99.11% on the CIA and MORPH data sets are achieved, respectively, which is superior to the traditional feature fusion method.

1. Introduction

In recent years, the rapid rise of deep learning methods has become the most popular research topic. Deep learning methods have been widely used in classification [1,2,3], identification [4,5,6], and target segmentation [7,8,9]. Deep learning methods are superior to traditional image processing methods, as they do not require the user to determine the capture of image features. They can extract features in images through self-learning of convolutional and pooling layers in a network. Therefore, automatic learning the interested features from the training images is considered to be a good method to replace the features selected by the user. The most typical example is the feature learning and recognition through the convolutional neural network (CNN). LeCun et al. proposed the first CNN architecture, LeNet-5 [10], and applied this network to the handwriting recognition in the MNIST dataset. The used images are grayscale, and the size of each image is 32 × 32. The recognition accuracy of LeNet-5 is better than those of other traditional image processing methods. Krizhevsky et al. [11] proposed AlexNet and introduced GPU into deep learning. They also added Dropout [12] and ReLu [13] to the deep neural network architecture to improve its recognition accuracy. Szegedy et al. [14] proposed GoogleNet, and introduced the “Inception” structure into the network. The proposed inception is to increase the breadth of the network—that is, use different convolution kernel sizes to extract different features. In [14], they also used a 1 × 1 convolution operation to reduce the dimension, which can improve the accuracy when the network reduces the parameters. He et al. [15] proposed the residual structure to directly map the features of the lower layer to the higher-level network—that is, the deeper network has the representation capabilities close to the previous layers. Therefore, in the deep CNN, the difficult trained problem of the network can be effectively solved.
In the above-mentioned methods, the convolutional neural network uses only a single input. Therefore, some researchers began to study multi-input convolutional neural networks. Su et al. [16] proposed a multi-view CNN for the classification of 3D models. By shooting 3D models, two-dimensional pictures with different perspectives were taken as network inputs. Sun et al. [17] used a multi-input CNN for flower grading. They used three different flower images as inputs, and fused the features through convolution and pooling operations. Li et al. [18] developed a dual-input neural network architecture for detecting coronary artery disease (CAD). They used Electrocardiogram and Phonocardiogram signals as input of the network to extract different signal characteristics. Two signal characteristics are combined to improve the accuracy of classification. These results prove that multi-input CNNs can effectively improve the classification accuracy, and have a better performance than single-input CNNs.
Using multi-input CNNs will provide different features, and the advantage of each network feature to improve the accuracy of the entire system is an extremely important task. How to properly integrate these different features is an important issue, as the individual features obtained by multiple networks have different interpretations of the same image. Some features obtained can allow the network to determine the correct result, and some features obtained can also cause serious misjudgment. In order to solve this problem, a multi-layer network fusion mechanism [19] is added to the output of a feature network, which partially enhances or suppresses each of the original output features to perform a fusion operation. Thus, multiple features can cooperate with each other and improve the overall recognition rate. In multi-input CNNs, feature fusion techniques such as summation operation [20], product operation [21], maximum operation [22] and concatenation operation [23] are often used. Feature fusion is the integration of multiple different feature information in order to obtain more prominent feature information. Different feature fusion methods will produce different performances. Choosing a reasonable fusion method has important value for improving accuracy.
In the above-mentioned networks, the parameters designed by the user are not the optimal parameters of CNNs. How to determine a convolutional neural network architecture and its parameters requires continuous experimentation to learn. In the engineering field, there are two common methods for optimizing parameters: the first is the Taguchi method [24,25], and the second is the uniform experimental design (UED) [26,27]. If it is applied to more factors and levels, the number of experiments is at least the square of the level. The UED has fewer experiments, and then uses multiple regression to find the best parameters in the shortest time.
In this study, the feature fusion and parameter optimization of a dual-input CNN is proposed for the application of face gender classification. In order to improve the traditional feature fusion method, a new feature fusion method, called the weighting fusion method, is proposed and will effectively improve the overall accuracy. In addition, in order to avoid the parameters of the traditional CNN being determined by the user, this paper uses a UED instead of the user to set the network parameters. Two data sets, including CIA and MORPH data sets, are used to evaluate the proposed method.
The remainder of the paper is organized as follows: Section 2 introduces the proposed dual-input CNN with the feature fusion of weighting operation and the parameter optimization of UED; Section 3 illustrates the experimental results of a dual-input CNN using the CIA and MORPH datasets; and Section 4 offers conclusions and future works in this study.

2. The Dual-Input Convolutional Neural Network

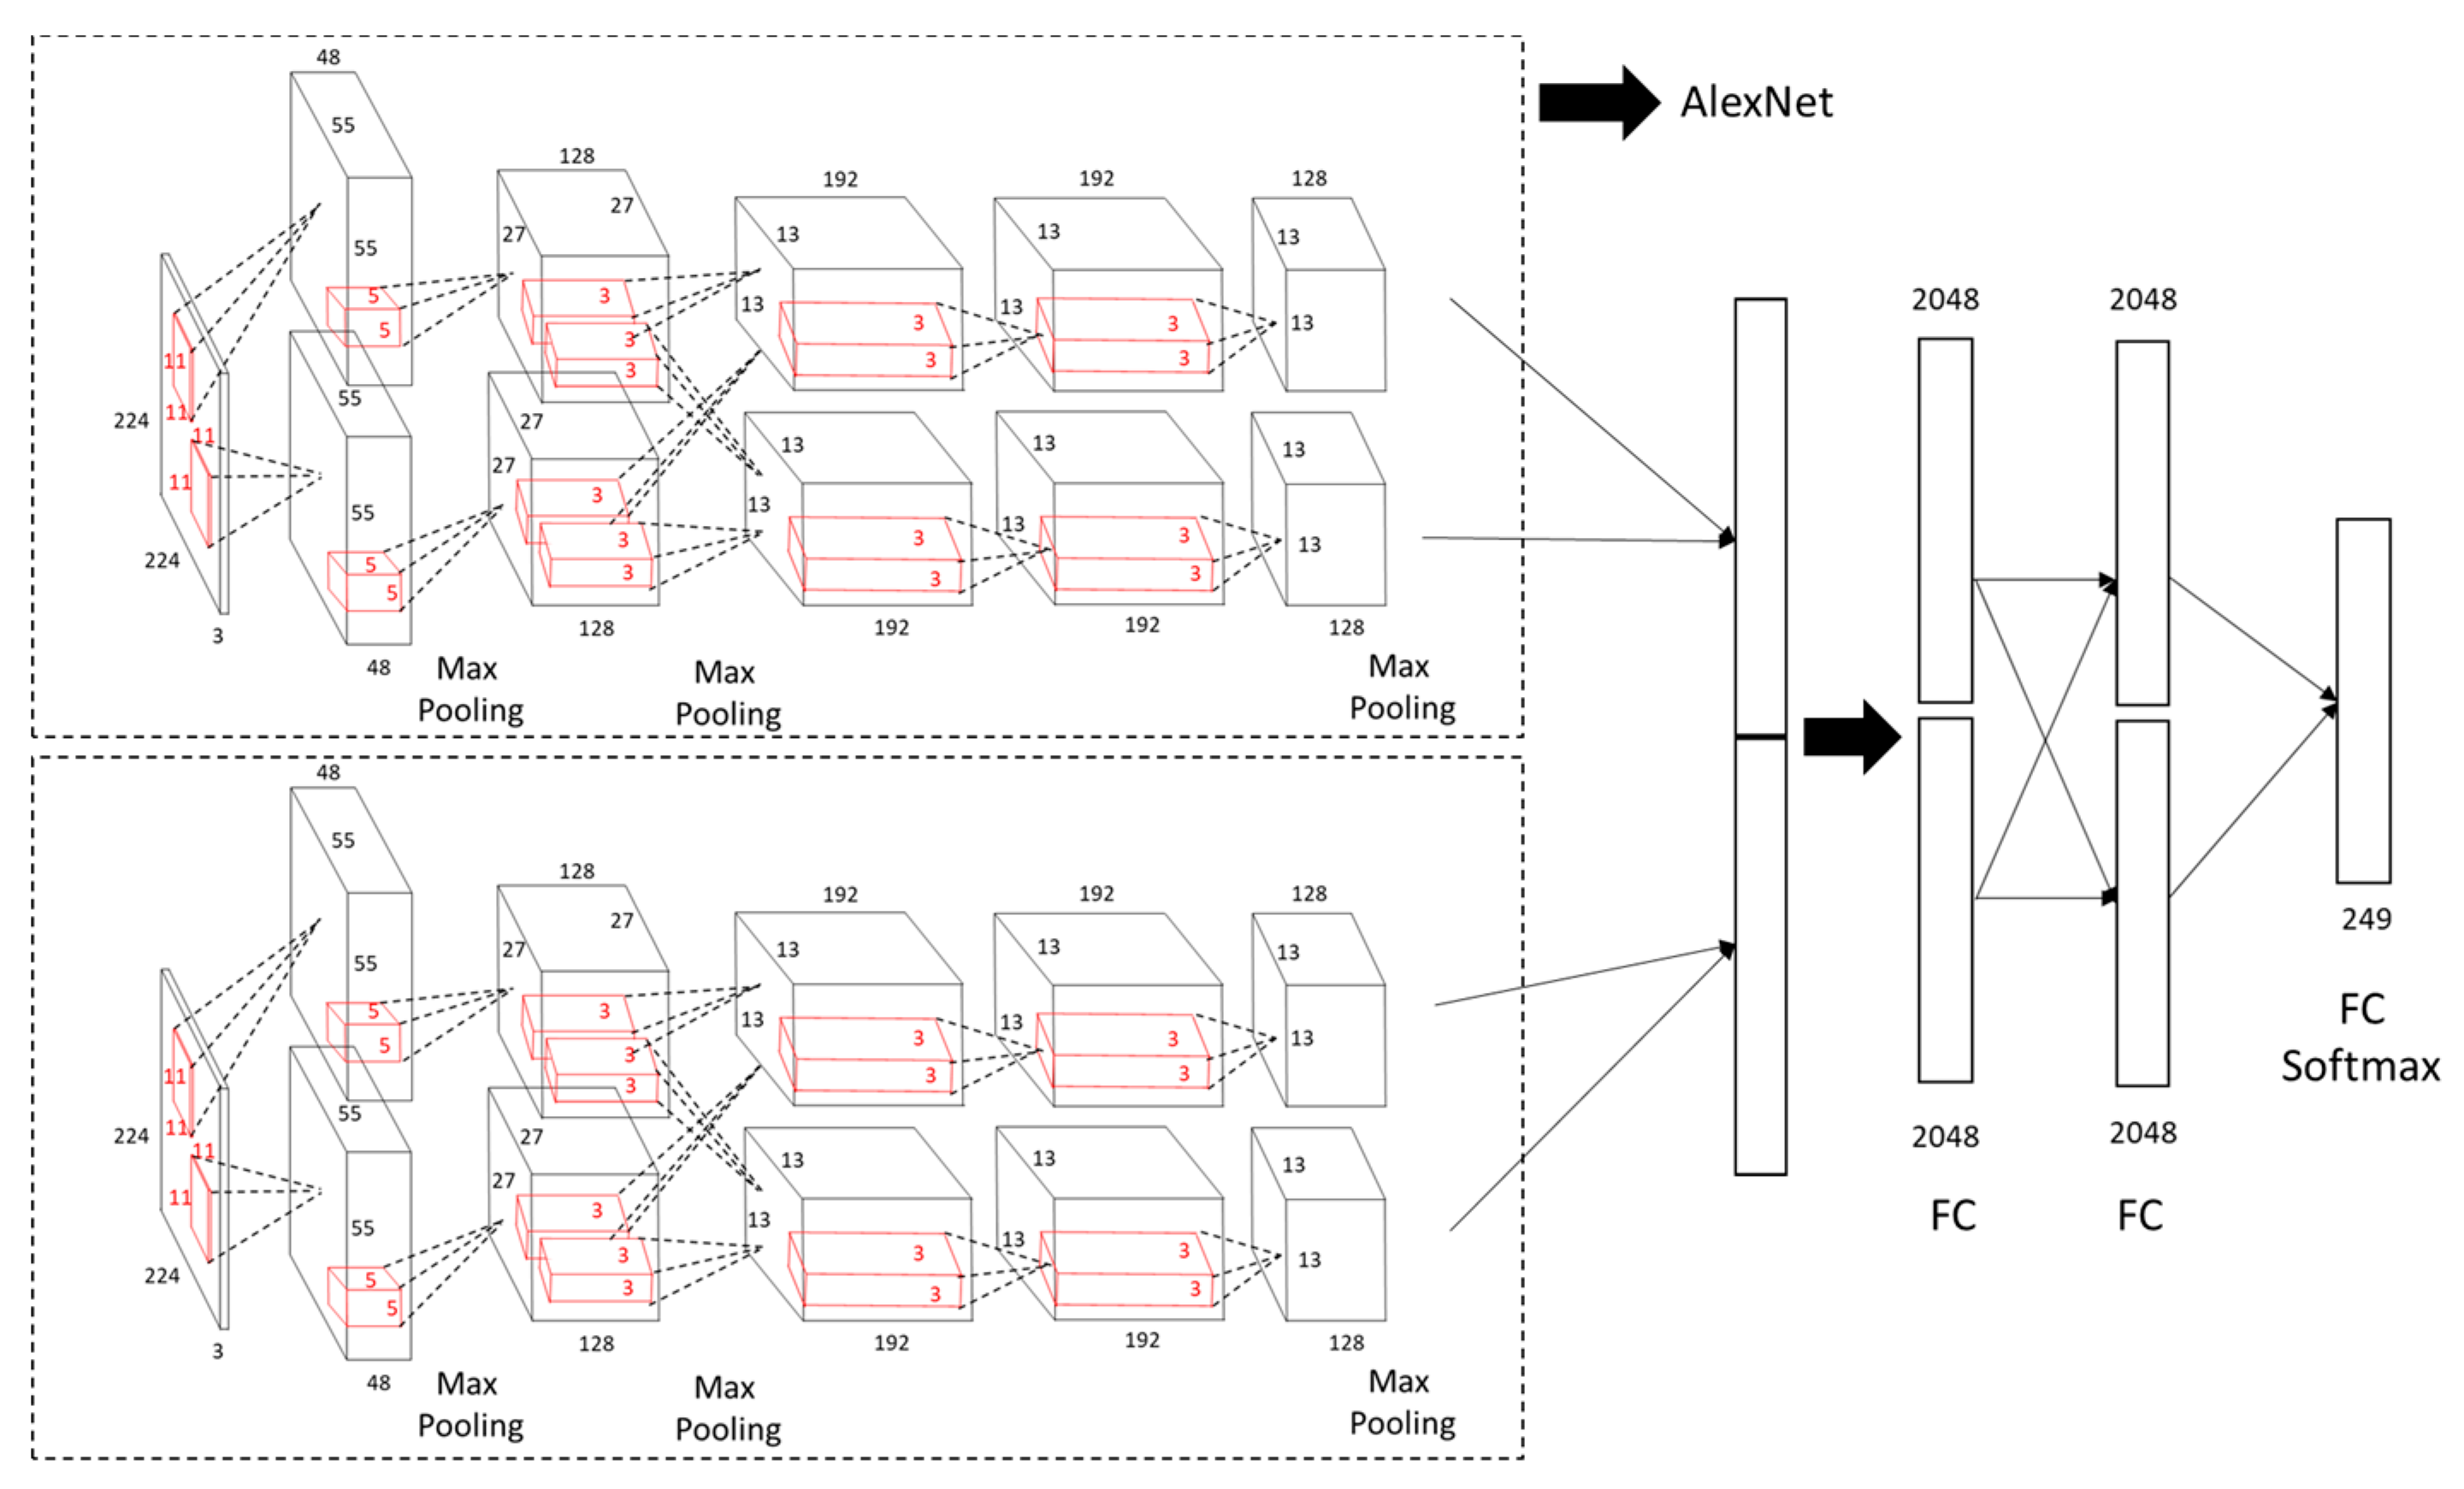
In this section, the dual-input convolutional neural network (Dual-input CNN) is introduced and shown in Figure 1. The proposed dual-input CNN can arbitrarily construct its feature extraction network. Three well-known CNN architectures commonly used by users are LeNet, AlexNet and GoogleNet. AlexNet has two main characteristics: the first point is the use of a non-linear activation function-ReLU with faster convergence speed; and the second point is that using Dropout in the first and second fully connected layers can effectively reduce the overfitting problem. However, more complex problems still cannot be solved. Although GoogleNet can solve more complex problems, it has a very deep architecture and requires a long training time. Based on the above analysis, this study uses AlexNet with a moderate architecture length as the feature extraction network architecture. In the dual-input CNN, two feature extraction AlexNet results are used for data fusion and then passed to the subsequent fully connected layer.
With regard to data fusion, this study proposes a weighting fusion method that assigns higher weights to strong feature inputs. The weighting fusion result is obtained more effectively than the concatenation method, sum method, product method and maximum method. Fusion function f : x t a , x t b y t   is the fusion of two feature maps x t a and x t b at time t. y t is the fused feature value. The different fusion methods will be described as follows.

2.1. The Basic Convolutional Neural Network Architecture

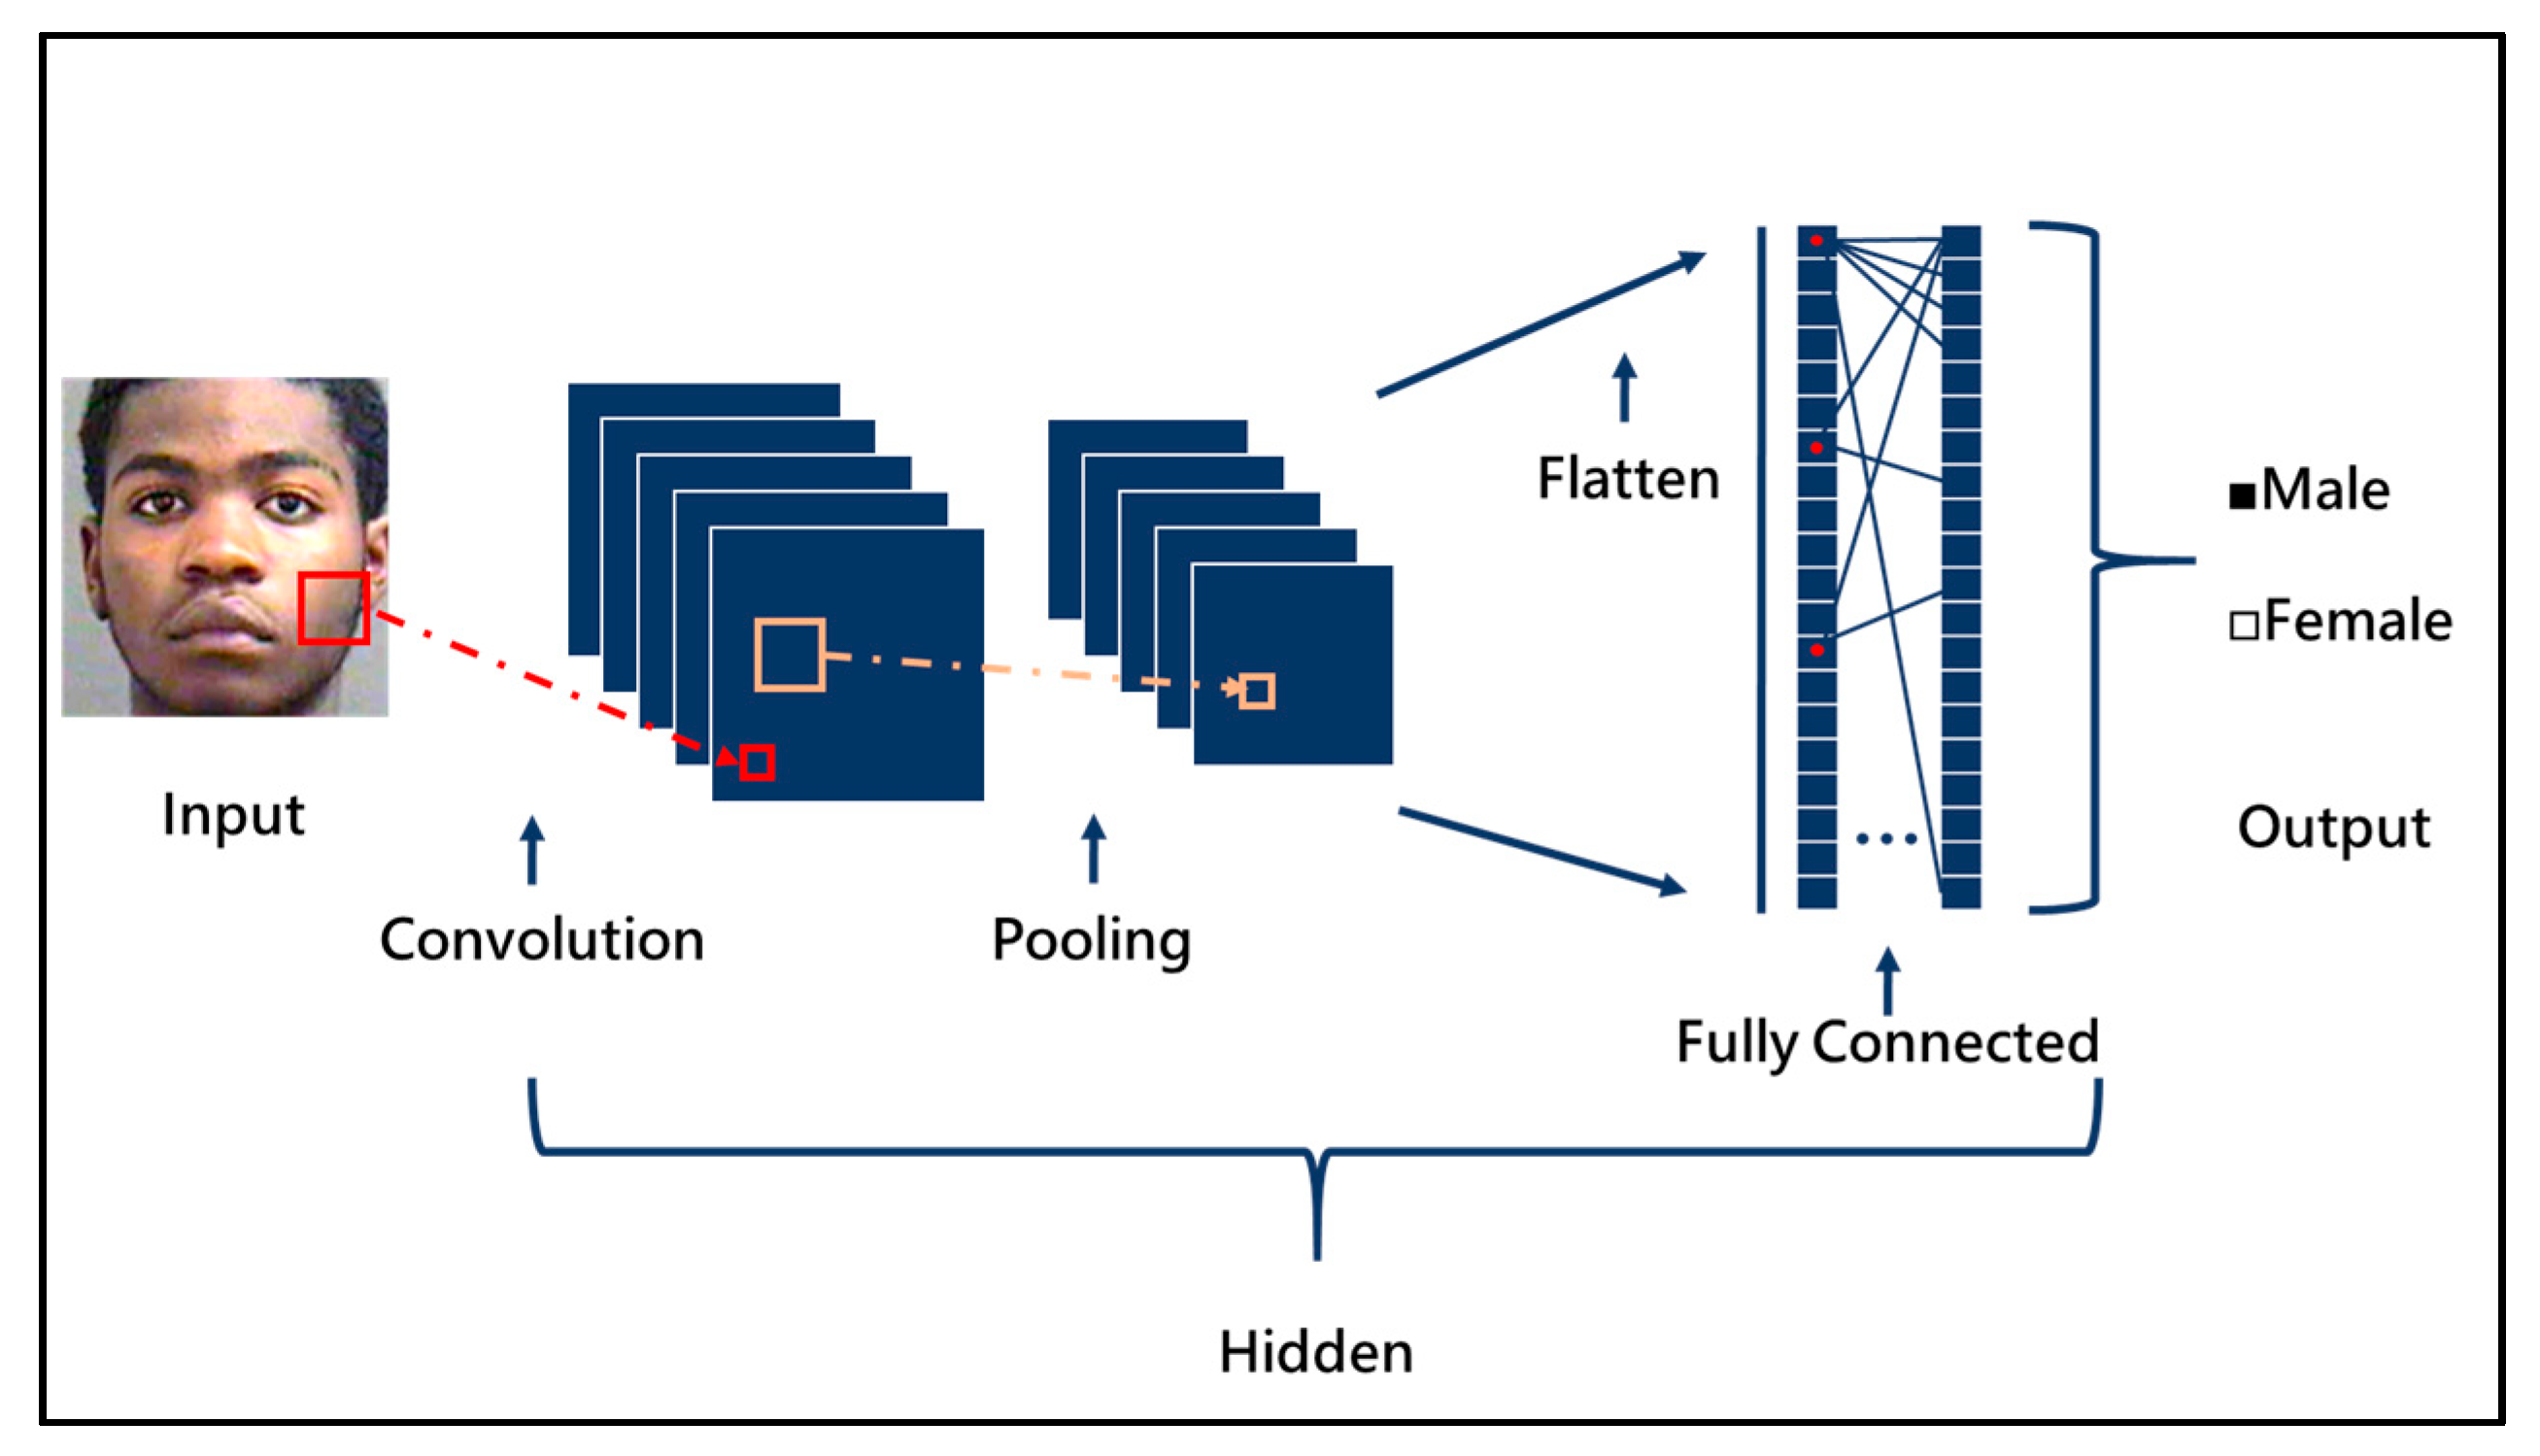
The basic CNN architecture is shown in Figure 2. It is mainly divided into four parts: a convolution layer; pooling layer; fully connected layer; and activation function. In CNN, the convolutional layer, pooling layer and activation function are mainly used for feature extraction, and the fully connected network classifies the obtained features. The four layers will be described below.
The following subsections describe the three important operations in the feature extraction section, namely convolution, activation function and pooling.

2.1.1. Convolution Layer

The convolution mainly uses the mask of the convolution kernel to perform the convolution operation on the input matrix by the sliding window method. The output matrix obtained has a relative relationship with the convolution kernel size, stride size and padding size of the input matrix. The output matrix is shown in the following formula
    W o = [ ( W i k w ) + 2 p s ] + 1 ,   H o = [ ( H i k h ) + 2 p s ] + 1
where W o and H o are the height and width of the output matrix, respectively; W i and H i are the height and width of the input matrix, respectively; p is the number of padding cycles; and s is the stride during the convolution kernel operation.

2.1.2. Pooling Layer

Pooling is mainly used to reduce the data dimension without losing too much important information. There are two common pooling calculation methods. The first is maximum pooling, which takes the maximum value in the mask as an output, and the others are not calculated. The second is average pooling. The output is the average of all values in the mask.

2.1.3. Fully Connected Layer

A fully connected layer is a fully connected multi-layer neural network. All feature maps are converted into a one-dimensional array as the network input of the fully connected layer. Finally, the fully connected neural network is used for classification or prediction.

2.1.4. Activation Function

The activation function is divided into linear functions and non-linear functions. Non-linear functions have better representation capabilities than linear functions. Therefore, non-linear functions are more commonly used in general neural networks. Currently, ReLU is more commonly used as a non-linear function. The ReLU function is shown in the following formula:
f ( x ) = { x ,     i f ( x > 0 ) 0 ,     o t h e r w i s e
If the input x is greater than 0, the output is x; otherwise, the output is 0.

2.2. Network Parameter Optimization Using Uniform Experimental Design

The uniform experimental design (UED) uses multiple regression to find the optimal parameters. The steps of UED will be explained as follows:
Step 1: Determine the affecting factor. Here, a convolutional neural network is taken as an example, as shown in Figure 2. In the two convolutional layers, the affecting factors are selected as the convolution kernel size, step size and padding size. There are six affecting factors in total.
After completing the factor selection and parameter setting, determine the number of experiments according to the following equation
n > 2 × S
where n is the number of experiments and S is the number of affecting factors. The number of affecting factors S is set to 6. If the number of experiments is less than 12, the uniformity will be poor. Therefore, the number of experiments is set to 13.
Step 2: After obtaining the number of experiments, use the following formula to calculate the total number of rows in the uniform table
m = n 1
where m is the total number of columns. Then, calculate the table information in the uniform table according to the following formula x i , j .
x i , j = (   i × j   )   M o d   n
where i = 1 , 2 , 3 , m and j = 1 , 2 , 3 , n . According to a uniform table U n ( n m ) , m and n are set as 12 and 13. The initial uniform table is shown in Table 1.
Step 3: According to the initial uniform table, select the usage table of U 13 ( 13 12 ) , as shown in Table 2. If the affecting factor is 6, select the 1, 2, 6, 8, 9 and 10 columns. The results are shown in the grey background of Table 1.
Step 4: Experiment and record the results.
Step 5: Find optimization parameters using multiple regression analysis
ε = Y [   α 0 + i = 1 f α 1 i β i + i = 1 f α 2 i β i 2 + i = 1 f α 3 i β i 3 + i = 1 f 1 j = i + 1 f α 4 i j β i β j   ]
where ε is error. When ε approaches 0, it means that its coefficient is the optimal weight. Then use this optimal weight to find the optimization parameter, and obtain the optimal parameter result of UED.   f is the number of affecting factors. α 0 is the constant, and α 1 i , α 2 i , α 3 i , α 4 i j are the coefficient of β .

2.3. Feature Fusion Methods

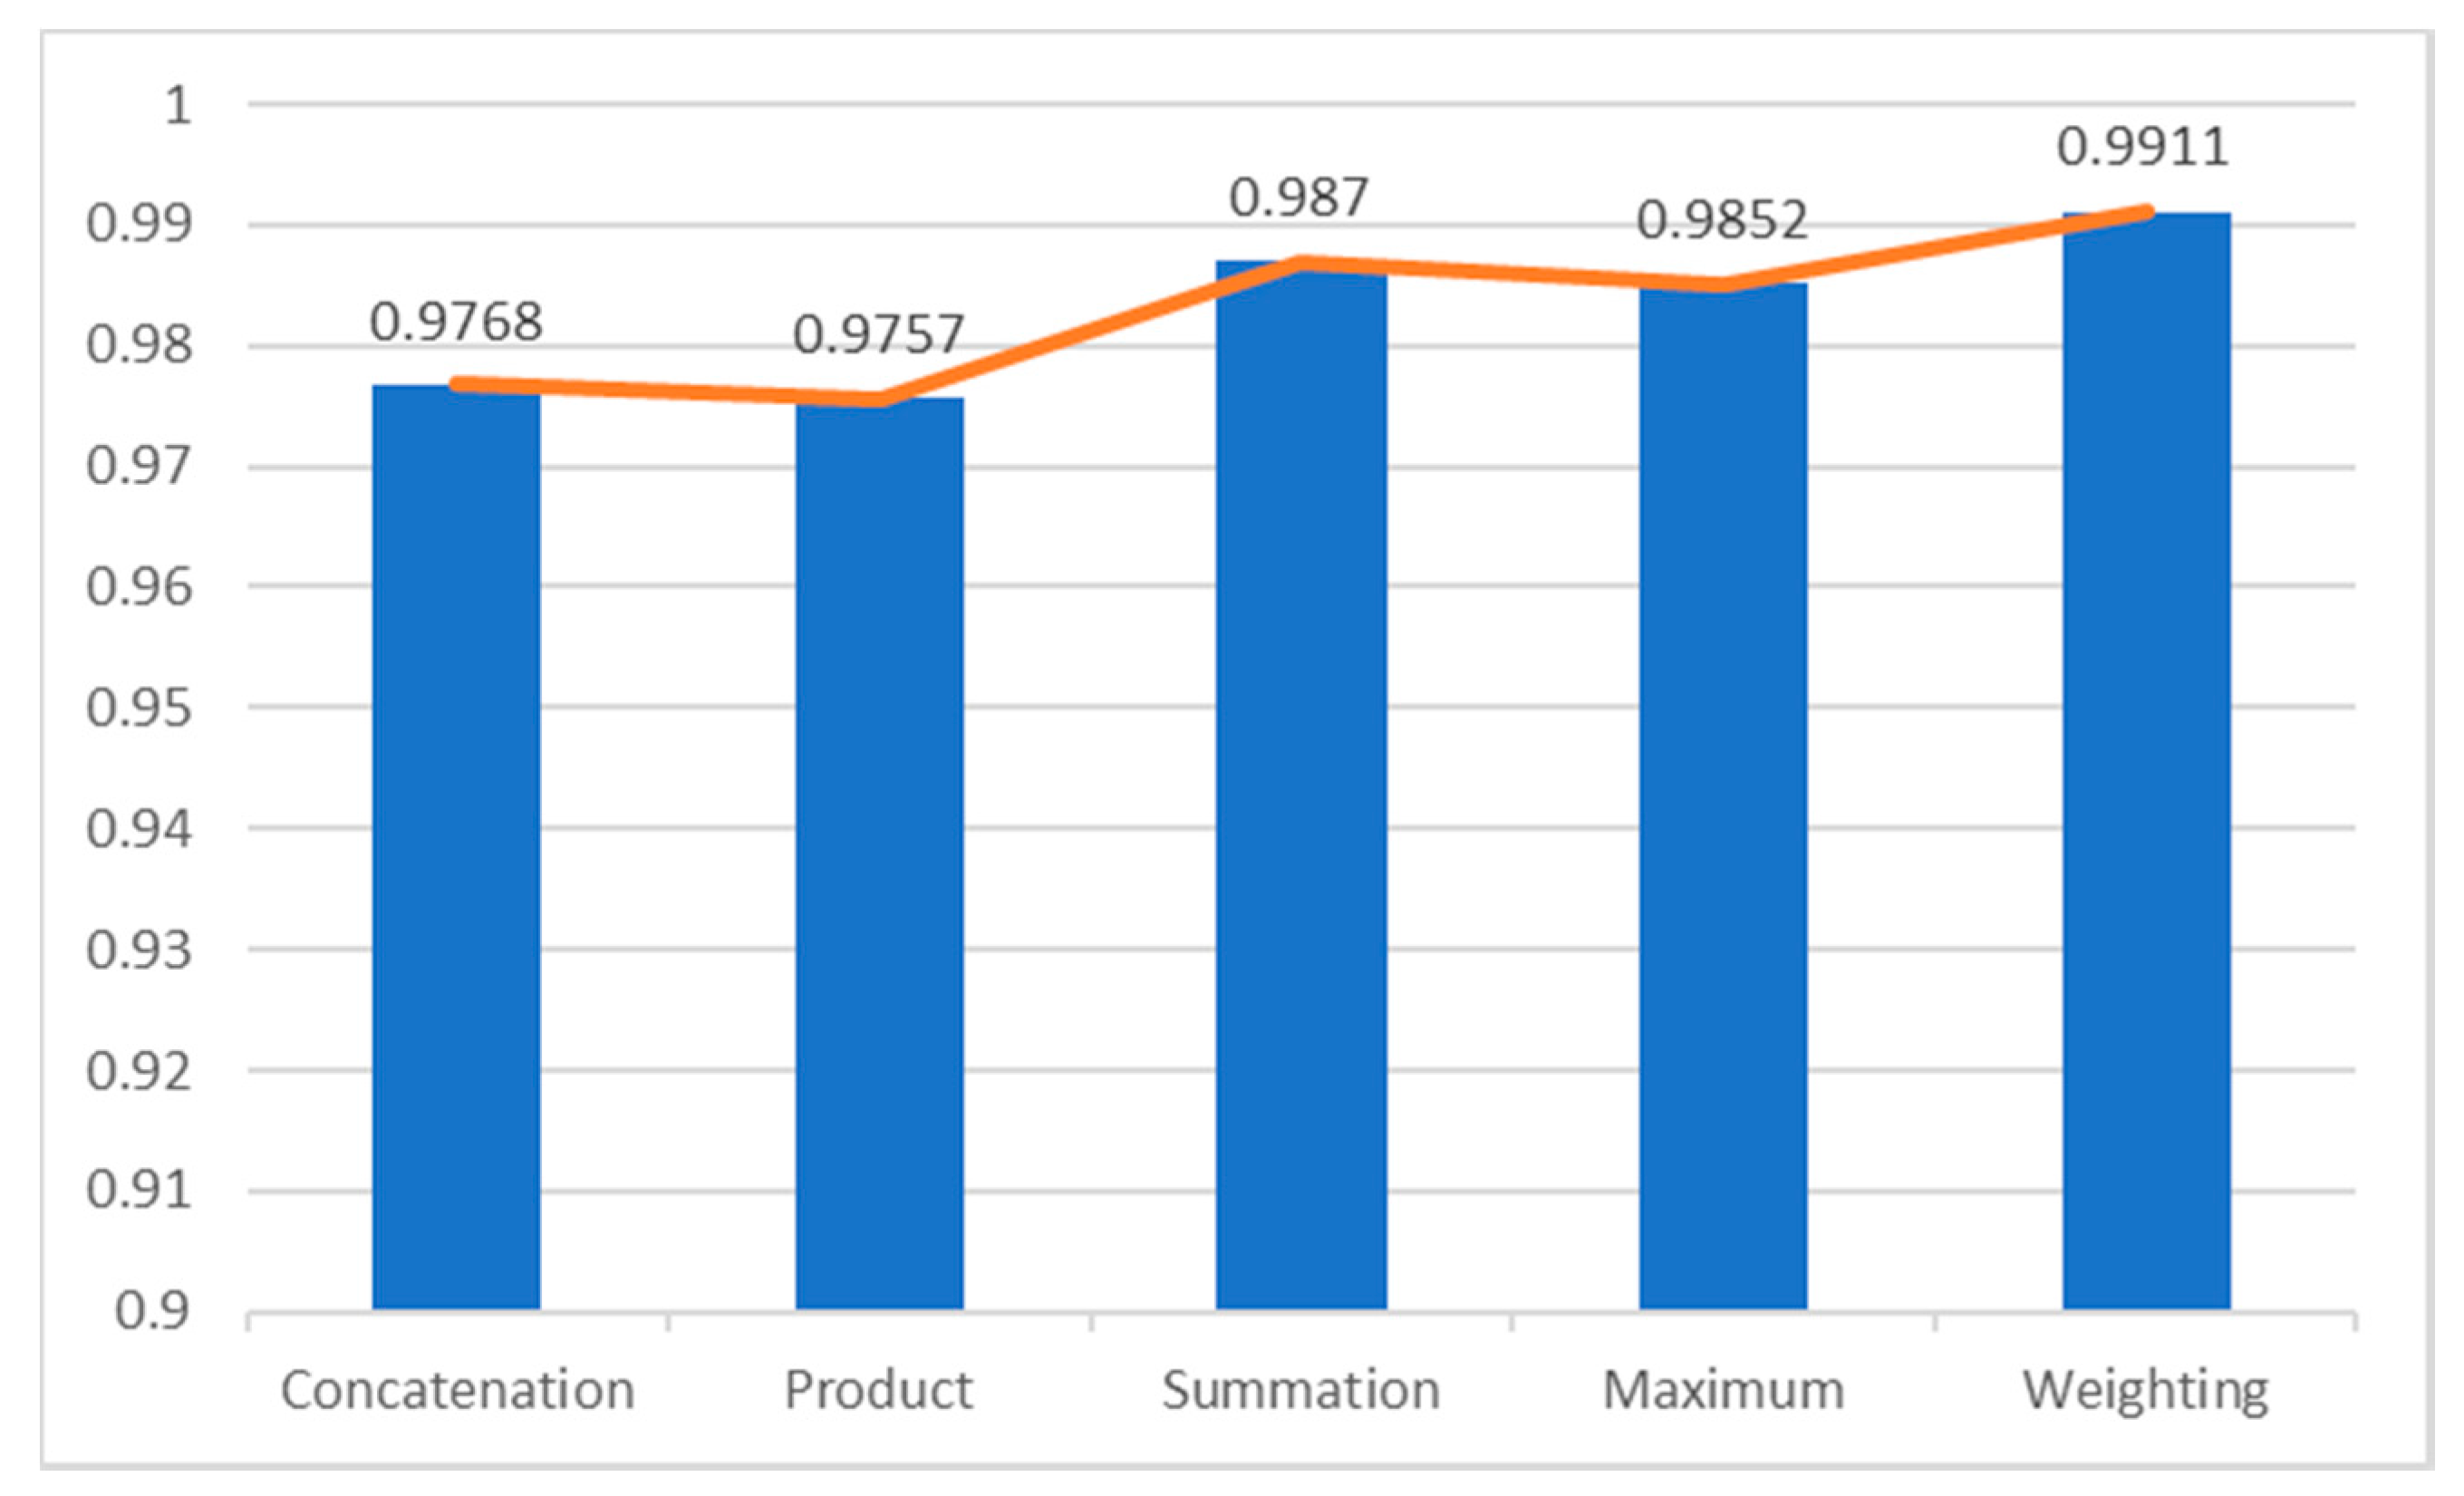
This subsection will introduce five feature fusion methods, namely the traditional concatenation method, the summation method, the product method, the maximum method and the proposed weighting fusion method. In terms of feature fusion methods, the traditional concatenation method is different from the other four methods. When two images are input as an example, the traditional method has twice the input dimensions of the full connection network as the other four methods do.

2.3.1. The Traditional Concatenation Method

The concatenation function is y c a t = f c a t ( x a , x b ) . When two images are input as an example, the outputs of two feature extraction networks are concatenated—that is, it is to stack different feature elements together. The detailed calculation is as follows:
y i , j , 2 d c a t = x i , j , d a   and   y i , j , 2 d 1 c a t = x i , j , d b

2.3.2. Summation Method

The summation function is y s u m = f s u m ( x a , x b ) . It calculates the same spatial position i and j of each element in each feature, and the two feature maps on the feature channel d are added according to the corresponding relationship. The detailed calculation is as follows:
y i , j , d s u m = x i , j , d a + x i , j , d b

2.3.3. Product Method

The product function is y p r o d = f p r o d ( x a , x b ) . It calculates the product of the two feature maps according to the corresponding relationship. At the same time, multiple sets of dot product fusion results are used as the final fusion output. The detailed calculation is as follows:
y i , j , d p r o d = x i , j , d a · x i , j , d b

2.3.4. Maximum Method

Similar to the product function, the maximum function is y m a x = f m a x ( x a , x b ) . This uses the elements in the two feature maps for comparison, and takes the large value as the output result. The detailed calculation is as follows:
y i , j , d m a x = m a x { x i , j , d a   ,     x i , j , d b }

2.3.5. Proposed Weighting Method

The proposed weighting function is y w e i g h t = f w e i g h t ( x a , x b ) . It uses the backpropagation learning method of the neural network to determine the input with a high degree of influence, and multiplies this input by the appropriate weight ( w a , w b ) ratio. The range of the two weights is between 0 and 1, and the sum of the weights is 1. The detailed calculation is as follows:
y i , j , d w e i g h t = (   x i , j , d a × w a ) + (   x i , j , d b × w b   )

3. Experimental Results

In order to evaluate the proposed feature fusion and parameter optimization of the dual-input convolutional neural network (Dual-input CNN), two face datasets, namely the CIA dataset and the MORPH dataset, are used to verify the gender of the face image. In this experiment, two datasets perform an image increment. The increment mechanism is to increase the brightness, decrease the brightness, rotate the image to the left and rotate the image to the right. The number of increment images is five times the number of original images. The hardware specifications used in the experiments are shown in Table 3.

3.1. MORPH Dataset

The MORPH dataset is a face database that is mainly composed of Westerners. It has a wide variety of people, and the age distribution ranges from 16 to 77. The images in the MORPH dataset were incremented by performing the brightness reduction, brightness increase, rotate left and rotate right operations, as displayed in Figure 3. Therefore, the amount of incremented data was five times that of the original MORPH dataset. Table 4 shows the number of images before and after the increment. In this table, the amount of data obtained after image increment was five times the amount of original data, including male images from 46,659 to 233,295 and female images from 8492 to 42,460, respectively.

3.1.1. Accuracy Analysis Using Various Fusion Methods

According to different fusion methods (the concatenation method, the summation method, the product method, the maximum method and the proposed weighting fusion method), the cross-validations were performed to obtain a fairer accuracy rate. Recently, many researchers [28,29,30] adopted three cross-validations for verifying their methods. Therefore, this study also used three cross-validations to evaluate the accuracy comparison in MORPH dataset. As shown in Table 5, the weighted fusion method proposed in this paper obtained the highest average accuracy rate of 99.11%. Figure 4 is the average accuracy comparison using various feature fusion methods.

3.1.2. Hybrid of the Weighting Fusion Method and UED

In this subsection, the uniform experimental design (UED) method uses multiple regression analysis to find optimization parameters of two-input CNN based on a weighting fusion method. Table 6 shows the affecting factors and levels of the two-input CNN. The affecting factors include the convolution kernel size, stride size and padding size in the first and fifth convolution layers. Table 7 shows the initial parameters used for the uniform experiment table. Table 8 is the uniform experiment table. This table can be obtained through the calculation steps in Section 2 for subsequent experiments. Finally, the optimization network architecture is obtained.
The proposed method combines the weighting fusion method and UED to achieve gender classification in the MORPH dataset. Three cross-validation experiments are performed to obtain a fairer accuracy rate. The accuracy rate of the eight sets in parameter experiments is 99.13%. The optimal network architecture parameters from Table 9 are found and shown in Table 10. Finally, the average accuracy of the gender classification accuracy of this optimized architecture is 99.26%. The average accuracy of the optimized structure for gender classification of the MORPH dataset has indeed improved by 0.13%.

3.2. CIA Dataset

The CIA data set is a small face database collected by our laboratory. This database is mainly Chinese. The age distribution is 6 to 80 years old, and is shown in Figure 5. Table 11 shows the number of images before and after the increment.
According to different fusion methods (the concatenation method, the summation method, the product method, the maximum method and the proposed weighting fusion method), three cross-validations were performed to obtain a fairer accuracy rate. As shown in Table 12, the weighted fusion method proposed in this paper obtained the highest average accuracy rate of 99.98%.

4. Conclusions

In this study, the feature fusion and parameter optimization of a dual-input convolutional neural network (Dual-input CNN) is proposed to achieve face gender classification. A new weighting fusion method is proposed, which replaces the traditional feature fusion methods. Both the MORPH and the CIA data sets are used for verifying the face gender classification. Experimental results prove that the average accuracy of the proposed method in the MORPH dataset and the CIA dataset is 99.11% and 99.98%, respectively, and its performance is also better than the traditional feature fusion method. In addition, in the MORPH data set, combined with the proposed weighting fusion method and uniform experimental design (UED) to find the optimal parameter structure, the experimental results prove that the average accuracy of the MORPH data set reaches 99.26%, which is significantly higher 0.13% than when the UED method is not used.
However, there are inevitably limitations on the proposed dual-input CNN. For example, only the first and fifth convolution layers are used as affecting factors, and a dual-input CNN is discussed in this study. Therefore, how to properly select the affecting factors and a multi-input CNN will be considered in future works.

Author Contributions

Conceptualization, C.-J.L.; methodology, C.-J.L., C.-H.L. and S.-Y.J.; software, C.-J.L. and C.-H.L.; data curation, C.-H.L. and S.-Y.J.; writing-original draft preparation, C.-J.L. and C.-H.L; writing-review and editing, C.-J.L. and S.-Y.J.; funding acquisition, C.-J.L. All authors have read and agreed to the published version of the manuscript.

Funding

This research was funded by the Ministry of Science and Technology of the Republic of China, grant number MOST 108-2221-E-167 -026.

Conflicts of Interest

The authors declare no conflict of interest.

References

  1. Wang, J.; Yang, Y.; Mao, J.; Huang, Z.; Huang, C.; Xu, W. CNN-RNN: A Unified Framework for Multi-label Image Classification. arXiv 2016, arXiv:1604.04573. [Google Scholar]
  2. Hershey, S.; Chaudhuri, S.; Ellis, D.P.W.; Gemmeke, J.F.; Jansen, A.; Channing Moore, R.; Plakal, M.; Platt, D.; Saurous, R.A.; Seybold, B.; et al. CNN Architectures for Large-Scale Audio Classification. arXiv 2016, arXiv:1609.09430. [Google Scholar]
  3. Lee, H.; Kwon, H. Going Deeper With Contextual CNN for Hyperspectral Image Classification. IEEE Trans. Image Process. 2017, 26, 4843–4855. [Google Scholar] [CrossRef] [PubMed] [Green Version]
  4. Wang, X.; Gao, L.; Song, J.; Shen, H. Beyond Frame-level CNN: Saliency-Aware 3-D CNN With LSTM for Video Action Recognition. IEEE Signal. Process. Lett. 2017, 24, 510–514. [Google Scholar] [CrossRef]
  5. Ullah, A.; Ahmad, J.; Muhammad, K.; Sajjad, M.; Baik, S.W. Action Recognition in Video Sequences using Deep Bi-Directional LSTM With CNN Features. IEEE Access 2018, 6, 1155–1166. [Google Scholar] [CrossRef]
  6. He, R.; Wu, X.; Sun, Z.; Tan, T. Wasserstein CNN: Learning Invariant Features for NIR-VIS Face Recognition. IEEE Trans. Pattern Anal. Mach. Intell. 2019, 41, 1761–1773. [Google Scholar] [CrossRef] [Green Version]
  7. Long, J.; Shelhamer, E.; Darrell, T. Fully convolutional networks for semantic segmentation. In Proceedings of the 2015 IEEE Conference on Computer Vision and Pattern Recognition (CVPR), Boston, MA, USA, 7–12 June 2015; pp. 3431–3440. [Google Scholar]
  8. Hazirbas, C.; Ma, L.; Domokos, C.; Cremers, D. FuseNet: Incorporating Depth into Semantic Segmentation via Fusion-Based CNN Architecture. In Proceedings of the Computer Vision—ACCV 2016, Taipei, Taiwan, 20–24 November 2016; Springer International Publishing: Cham, Switzerland, 2017; pp. 213–228. [Google Scholar]
  9. He, K.; Gkioxari, G.; Dollár, P.; Girshick, R. Mask R-CNN. arXiv 2017, arXiv:1703.06870. [Google Scholar]
  10. Lecun, Y.; Bottou, L.; Bengio, Y.; Haffner, P. Gradient-based learning applied to document recognition. Proc. IEEE 1998, 86, 2278–2324. [Google Scholar] [CrossRef] [Green Version]
  11. Krizhevsky, A.; Sutskever, I.; Hinton, G. ImageNet Classification with Deep Convolutional Neural Networks. In Neural Information Processing Systems; Massachusetts Institute of Technology Press: Cambridge, MA, USA, 2012; Volume 25, pp. 1097–1105. [Google Scholar]
  12. Srivastava, N.; Hinton, G.; Krizhevsky, A.; Sutskever, I.; Salakhutdinov, R. Dropout: A Simple Way to Prevent Neural Networks from Overfitting. J. Mach. Learn. Res. 2014, 15, 1929–1958. [Google Scholar]
  13. Agarap, A.F. Deep Learning using Rectified Linear Units (ReLU). arXiv 2018, arXiv:1803.08375. [Google Scholar]
  14. Szegedy, C.; Liu, W.; Jia, Y.; Sermanet, P.; Reed, S.; Anguelov, D.; Erhan, D.; Vanhoucke, V.; Rabinovich, A. Going Deeper with Convolutions. arXiv 2014, arXiv:1409.4842. [Google Scholar]
  15. He, K.; Zhang, X.; Ren, S.; Sun, J. Deep Residual Learning for Image Recognition. arXiv 2015, arXiv:1512.03385. [Google Scholar]
  16. Su, H.; Maji, S.; Kalogerakis, E.; Learned-Miller, E. Multi-view Convolutional Neural Networks for 3D Shape Recognition. arXiv 2015, arXiv:1505.00880. [Google Scholar]
  17. Sun, Y.; Zhu, L.; Wang, G.; Zhao, F. Multi-Input Convolutional Neural Network for Flower Grading. J. Electr. Comput. Eng. 2017, 2017, 1–8. [Google Scholar] [CrossRef] [Green Version]
  18. Li, H.; Wang, X.; Liu, C.; Wang, Y.; Li, P.; Tang, H.; Yao, L.; Zhang, H. Dual-Input Neural Network Integrating Feature Extraction and Deep Learning for Coronary Artery Disease Detection Using Electrocardiogram and Phonocardiogram. IEEE Access 2019, 7, 146457–146469. [Google Scholar] [CrossRef]
  19. Park, E.; Han, X.; Berg, T.L.; Berg, A.C. Combining multiple sources of knowledge in deep CNNs for action recognition. In Proceedings of the 2016 IEEE Winter Conference on Applications of Computer Vision (WACV), Lake Placid, NY, USA, 7–10 March 2016; pp. 1–8. [Google Scholar]
  20. Feichtenhofer, C.; Pinz, A.; Zisserman, A. Convolutional Two-Stream Network Fusion for Video Action Recognition. In Proceedings of the 2016 IEEE Conference on Computer Vision and Pattern Recognition (CVPR), Las Vegas, NV, USA, 27–30 June 2016; pp. 1933–1941. [Google Scholar]
  21. Wu, L.; Wang, Y.; Li, X.; Gao, J. What-and-where to match: Deep spatially multiplicative integration networks for person re-identification. Pattern Recognit. 2018, 76, 727–738. [Google Scholar] [CrossRef] [Green Version]
  22. Aygün, M.; Hüseyin Şahin, Y.; Ünal, G. Multi Modal Convolutional Neural Networks for Brain Tumor Segmentation. arXiv 2018, arXiv:1809.06191. [Google Scholar]
  23. Du, C.; Wang, Y.; Wang, C.; Shi, C.; Xiao, B. Selective feature connection mechanism: Concatenating multi-layer CNN features with a feature selector. Pattern Recognit. Lett. 2020, 129, 108–114. [Google Scholar] [CrossRef]
  24. Meena, N.K.; Swarnkar, A.; Yang, J.; Gupta, N.; Niazi, K.R. Modified Taguchi-Based Approach for Optimal Distributed Generation Mix in Distribution Networks. IEEE Access 2019, 7, 135689–135702. [Google Scholar] [CrossRef]
  25. Ibrahim, M.S.; Hanif, A.; Ahsan, A. Identifying Control Factors for Business Process Improvement in Telecom Sector Using Taguchi Approach. IEEE Access 2019, 7, 129164–129173. [Google Scholar] [CrossRef]
  26. Tsai, J.; Yang, P.; Chou, J. Data-Driven Approach to Using Uniform Experimental Design to Optimize System Compensation Parameters for an Auto-Alignment Machine. IEEE Access 2018, 6, 40365–40378. [Google Scholar] [CrossRef]
  27. Wang, Y.; Xu, B.; Sun, G.; Yang, S. A Two-Phase Differential Evolution for Uniform Designs in Constrained Experimental Domains. IEEE Trans. Evol. Comput. 2017, 21, 665–680. [Google Scholar] [CrossRef]
  28. Al-Mudhafar, W.J. Incorporation of Bootstrapping and Cross-Validation for Efficient Multivariate Facies and Petrophysical Modeling. In Proceedings of the SPE Low Perm Symposium, Denver, CO, USA, 5–6 May 2016. [Google Scholar]
  29. Ben-Cohen, A.; Diamant, I.; Klang, E.; Amitai, M.; Greenspan, H. Fully Convolutional Network for Liver Segmentation and Lesions Detection. In Deep Learning and Data Labeling for Medical Applications; Springer International Publishing: Cham, Switzerland, 2016; pp. 77–85. [Google Scholar]
  30. Ménard, R.; Deshaies-Jacques, M. Evaluation of Analysis by Cross-Validation. Part I: Using Verification Metrics. Atmosphere 2018, 9, 86. [Google Scholar] [CrossRef] [Green Version]
Figure 1. Structure of a dual-input convolutional neural network.
Applsci 10 03166 g001
Figure 2. Structure of a basic convolutional neural network.
Applsci 10 03166 g002
Figure 3. The MORPH dataset.
Applsci 10 03166 g003
Figure 4. The average accuracy using various feature fusion methods.
Applsci 10 03166 g004
Figure 5. CIA dataset.
Applsci 10 03166 g005
Table 1. The initial uniform table U 13 ( 13 12 ) .
m123456789101112
n
1123456789101112
2246810121357911
3369122581114710
4481237112610159
5510271249161138
6612511410392817
7718293104115126
8831161941272105
9951106211731284
10107411185212963
11119753112108642
12121110987654321
13131313131313131313131313
Table 2. Usage table of U 13 ( 13 12 ) .
The Affecting FactorsColumns
215
31610
416810
5168910
61268910
7126891012
Table 3. The hardware specifications used in the experiments.
HardwareSpecifications
CPUIntel(R) Xeon(R) CPU E3-1225 v5 @ 3.30GHz
GPUNvidia GTX1080-Ti 11GB
Table 4. The number of images before and after the increment.
MaleFemale
The number of images before the increment46,6598492
The number of images after the increment233,29542,460
Table 5. The accuracy comparison using various fusion methods in a MORPH dataset.
ConcatenationProductSummationMaximumWeighting
Cross-validation 10.97660.97700.98710.98370.9912
Cross-validation 20.97420.97820.98710.98230.9914
Cross-validation 30.97950.97280.98670.98970.9908
Average accurate0.97680.97570.98700.98520.9911
Table 6. The affecting factors and levels of the two-input CNN.
LevelFirst-Layer ConvolutionFifth-Layer Convolution
KernelStridePaddingKernelStridePadding
1920311
21141522
313-27--
Table 7. The initial parameters used of the uniform experiment table.
UED
Experimental Parameter Set
First-Layer ConvolutionFifth-Layer Convolution
KernelStridePaddingKernelStridePadding
1920311
21141522
31322711
4920322
51121511
61342722
7940311
81141511
91342711
10940322
111140511
121321722
13941311
Table 8. The uniform experiment table of the two-input CNN.
UED
Experimental Parameter Set
First-Layer ConvolutionFifth-Layer Convolution
KernelStridePaddingKernelStridePadding
1942512
21121711
31341512
4940721
51140321
61320721
7922311
81122712
91321312
10941521
111140312
121340521
13941311
Table 9. Gender classification in the MORPH dataset using a hybrid of the weighting fusion method and UED.
Cross-Validation 1 (%)Cross-Validation 2 (%)Cross-Validation 3 (%)Average Accuracy (%)
199.05350899.09883898.81597898.989441
298.78334098.82867098.66004298.757350
398.75895598.72743198.31190798.598998
498.60383398.66185698.59114198.618943
598.55306398.62196598.57119598.582074
699.03718998.99185998.79059398.939880
798.93564998.88488098.67273598.831088
899.20037799.18224599.00636499.129662
998.91933198.91389198.73075798.854660
1098.56575698.61652698.46421698.548833
1198.61471298.54581198.43157998.530701
1298.52223998.55850398.35905198.479931
1398.87944098.89213398.62652598.796033
UED99.29103799.32004999.16230099.257795
Table 10. The optimal network architecture parameters.
First-Layer ConvolutionFifth-Layer Convolution
KernelStridePaddingKernelStridePadding
Optimal Network Parameters1141322
Table 11. The number of images before and after the increment in CIA.
MaleFemale
The number of images before the increment10801007
The number of images after the increment54005035
Table 12. The accuracy comparison of various feature fusion methods in the CIA dataset.
ConcatenationProductSummationMaximumWeighting
Cross-validation 10.99910.94200.99800.99951
Cross-validation 210.95110.999011
Cross-validation 30.99950.92050.99760.99950.9995
Average accurate0.99950.93790.99820.99970.9998

