1. Introduction
Financialization describes an economic system or process that attempts to transform all value exchanged, whether it is tangible or intangible, into a financial instrument [
1]. Financialization attempts to reduce any work product or service to an exchangeable financial instrument, such as currency, and thus make it easier for people to trade these financial instruments. It is an essential part of Enterprise Security, Privacy, and Risk (ESPR), particularly in risk research and analysis. Financialization may use the Internet of Things (IoT) as a hybrid solution, which allows financial systems to get all their data connected, and it has collected a large amount of financial data to perform large-scale risk analysis [
2]. This can largely improve efficiency and accuracy by using analytics, which can process and analyze financial data. Results can be presented as graphical outputs and visualization. Over the last five decades, financialization has been occupying an increasingly dominant role in the financial services industry. During the 1980s, various financial instruments contributed to less than 20% of future trading. It grew to almost 50% by the 1990s and 60% by 2000 [
3]. Various financial instruments such as mortgage back securities (MBS), including both collateralized mortgage obligations (CMO) and collateralized debt obligations (CDO), and credit default swap (CDS) may also have contributed to the financial meltdown during 2008 [
4].
Over the last two decades, and especially since the financial meltdown, there have been increasing legislative restrictions. Therefore, there are needs to formulate policies and requirements in both regulatory risk and compliance requirements to manage operational risk for significant businesses, suppliers, and financial services: the Sarbanes-Oxley Act and Basel II and III [
5]. Information Technology is making an impact on risk management regulations worldwide; an example of this is the European Union (EU) General Data Privacy Regulation (GDPR). According to this new regulation, an organization can be fined heavily if it does not disclose breaches as laid out in the regulation [
6].
Several commercial incidents often arise from the lack of rigor in continuously enforcing regulatory compliance practices for all the short-term, medium-term, and long-term financial services:
The key events in the financial industry and supply chain operational risk strongly suggest that there is an urgent need for transforming financial practices to provide fair and accurate outputs to serve the purpose. A lack of regulatory compliance, governance, and ethical responsibilities results in significant losses, not to mention damages to reputation, the economy, and trust in the industry. Enabling continuous, transparent, and real-time access to fair market valuation will enable a more efficient market [
13,
18]. Moreover, the use of different financial models can provide more reliable results based on the different types of scenarios and investment requirements. Then, all different outputs can be shown to the stakeholders so that the chances of risk reduction or avoidance can be maximized [
9].
In this paper, we propose the Business Integrity Management and Analytics (BIMA) framework to provide risk analysis and optimization services for ESPR. This framework formalizes a new layer of abstraction for the business to offer true values in financial risk analysis for ESPR. The aim is to close the loop between the abstraction and the reality of the business. The framework belongs to all three types: a conceptual framework, an architectural, and software-as-a-service (SaaS) framework. In other words, BIMA provides recommendations, guidelines, and policies as a conceptual framework to improve the ways that financial services should work, with details to be described in
Section 2.1,
Section 2.2 and
Section 4.6. BIMA is also an architectural and SaaS framework, with details to be described in
Section 2.3,
Section 3 and
Section 4. Research methods can be validated through SaaS and experiments are described in
Section 4. Therefore, when each component of SaaS can be validated, results and analysis can contribute to the integrity and financial recommendation aspects for the BIMA framework. In relation to modern financial practices, the BIMA framework comprises a collection of tools to deal with advanced finance problems, in which compliance can be fulfilled.
Contemporary enterprises and operations face the challenges of stricter and increased governance by various regulations (including the Sarbanes–Oxley Act, Basel II and III) and are being held accountable for meeting the high expectations set by the boards, investors, regulators, and other stakeholders. Significant losses caused by inadequate risk management and controls have plagued the industry over the past decade, with a substantial increase in the number of firms involved in massive failures over the past few years. Costs associated with compliance can significantly impact enterprises. However, the costs associated with bad practices and misconduct, including non-compliance, fraud, improper risk management, and loss of business integrity are even more significant. In all of these circumstances, Business Integrity Management and Analytics becomes fundamentally important. We also propose the use of an integrated method to identify sources of risk, put and call prices, market volatility, and prediction of market trends based on the historical and recent financial data. This integrated method consists of the Monte Carlo method, the Black–Scholes–Merton model, the Heston model, and analytics/visualization. Four different analytical methods can be used in complementarity to each other. Therefore, our BIMA framework can calculate different types of operational risk, investment risk, points to sell/buy, decision-making, prediction of market movement, and recommendation for investment. The aim is to identify areas catching up risk and provide solutions for risk mitigation. Therefore, we propose a market prediction layer based on a service-oriented architecture, which has an established framework for interconnecting multi-vendor architectures. Additionally, as part of our BIMA framework, there is the prediction of the future marketplace, which consists of the cyclic services and policy–process–core entities. Service-Oriented Architectures (SOA) based on the soft computing framework has been proposed to cater to this prediction layer. The rest of this paper is organized as follows:
Section 2 demonstrates the business integrity framework, the Monte Carlo method, the Black–Scholes–Merton model, the Heston Model, and the analytics/visualization used throughout the paper.
Section 3 describes the architecture of the framework.
Section 4 discusses the benefits and services offered by the BIMA framework, together with real case studies and the added value presented. Finally,
Section 5 concludes this paper and presents our contributions.
2. Business Integrity Management and Analytics Framework
2.1. Business Analytics
Business Analytics (BA) represents the next-generation service and platform for business intelligence and data mining [
19]. It can be used as a tool to support particular types of businesses such as supply chain or as tools to analyze complex business information [
20]. BA consists of different areas of expertise blended together, including machine learning, statistics, social science, and domain expertise. The use of BA can ensure decision-makers to understand better on situations and make decisions quickly [
21,
22]. Originated from Artificial Intelligence (AI) [
23], machine learning has been developed into an independent area and includes the use of advanced algorithms to calculate complex information and data related to businesses [
24]. Statistical analysis is required to understand the meanings and interpretations of the machine learning algorithm. Social science aspects include understanding the people behind the data, which may consist of customers’ choices, prices of items, changes in market trends, and so on. Domain expertise means the analysts should have an excellent understanding of the types of businesses with expert knowledge or experience.
Currently, BA has been used in increasing ways as follows. Firstly, it can be used to understand customers’ requirements and market trends, so that strategies can be adjusted accordingly, such as promoting more favorite products or targeting certain groups of customers. Secondly, business analytics may simplify complex information from the businesses that can be presented in real time. Anyone without prior backgrounds can understand the most relevant information for the businesses. This provides businesses to move up with competitiveness. Thirdly, business analytics can be used effectively in many disciplines and areas to provide a greater extent of contributions. These include finance, healthcare, education, social networks, weather studies, security, education, manufacturing, smart cities, and so on. The applicant has all high-quality publications in each of these areas. In summary, business analytics can create values and impacts for businesses and research. Better management, adoption, and use cases can be essential for any organization.
2.2. Background
This section presents the related background to financialization, since it is a highly specialized area in BA and data analytics. The view of integrity can be self-evolving. The evolution from transactional integrity to business integrity is underway as businesses evolve to develop a consistent and interdependent view of their policies, processes, and core entities both internally and externally [
25]. Managing business integrity requires a holistic view of governing systems, business processes, and core entities, and it should be managed independently [
26]. Businesses can work toward regulatory compliance when they can handle all policies, business processes, and core entities together. As businesses are increasingly held accountable for meeting compliance requirements, the Integrated Governance, Risk, and Compliance (GRC) solutions can emerge to help companies stay competitive while meeting compliance [
27]. At present, this area is littered with a large number of point solutions, resulting in costly implementation and integration with other compliance solutions.
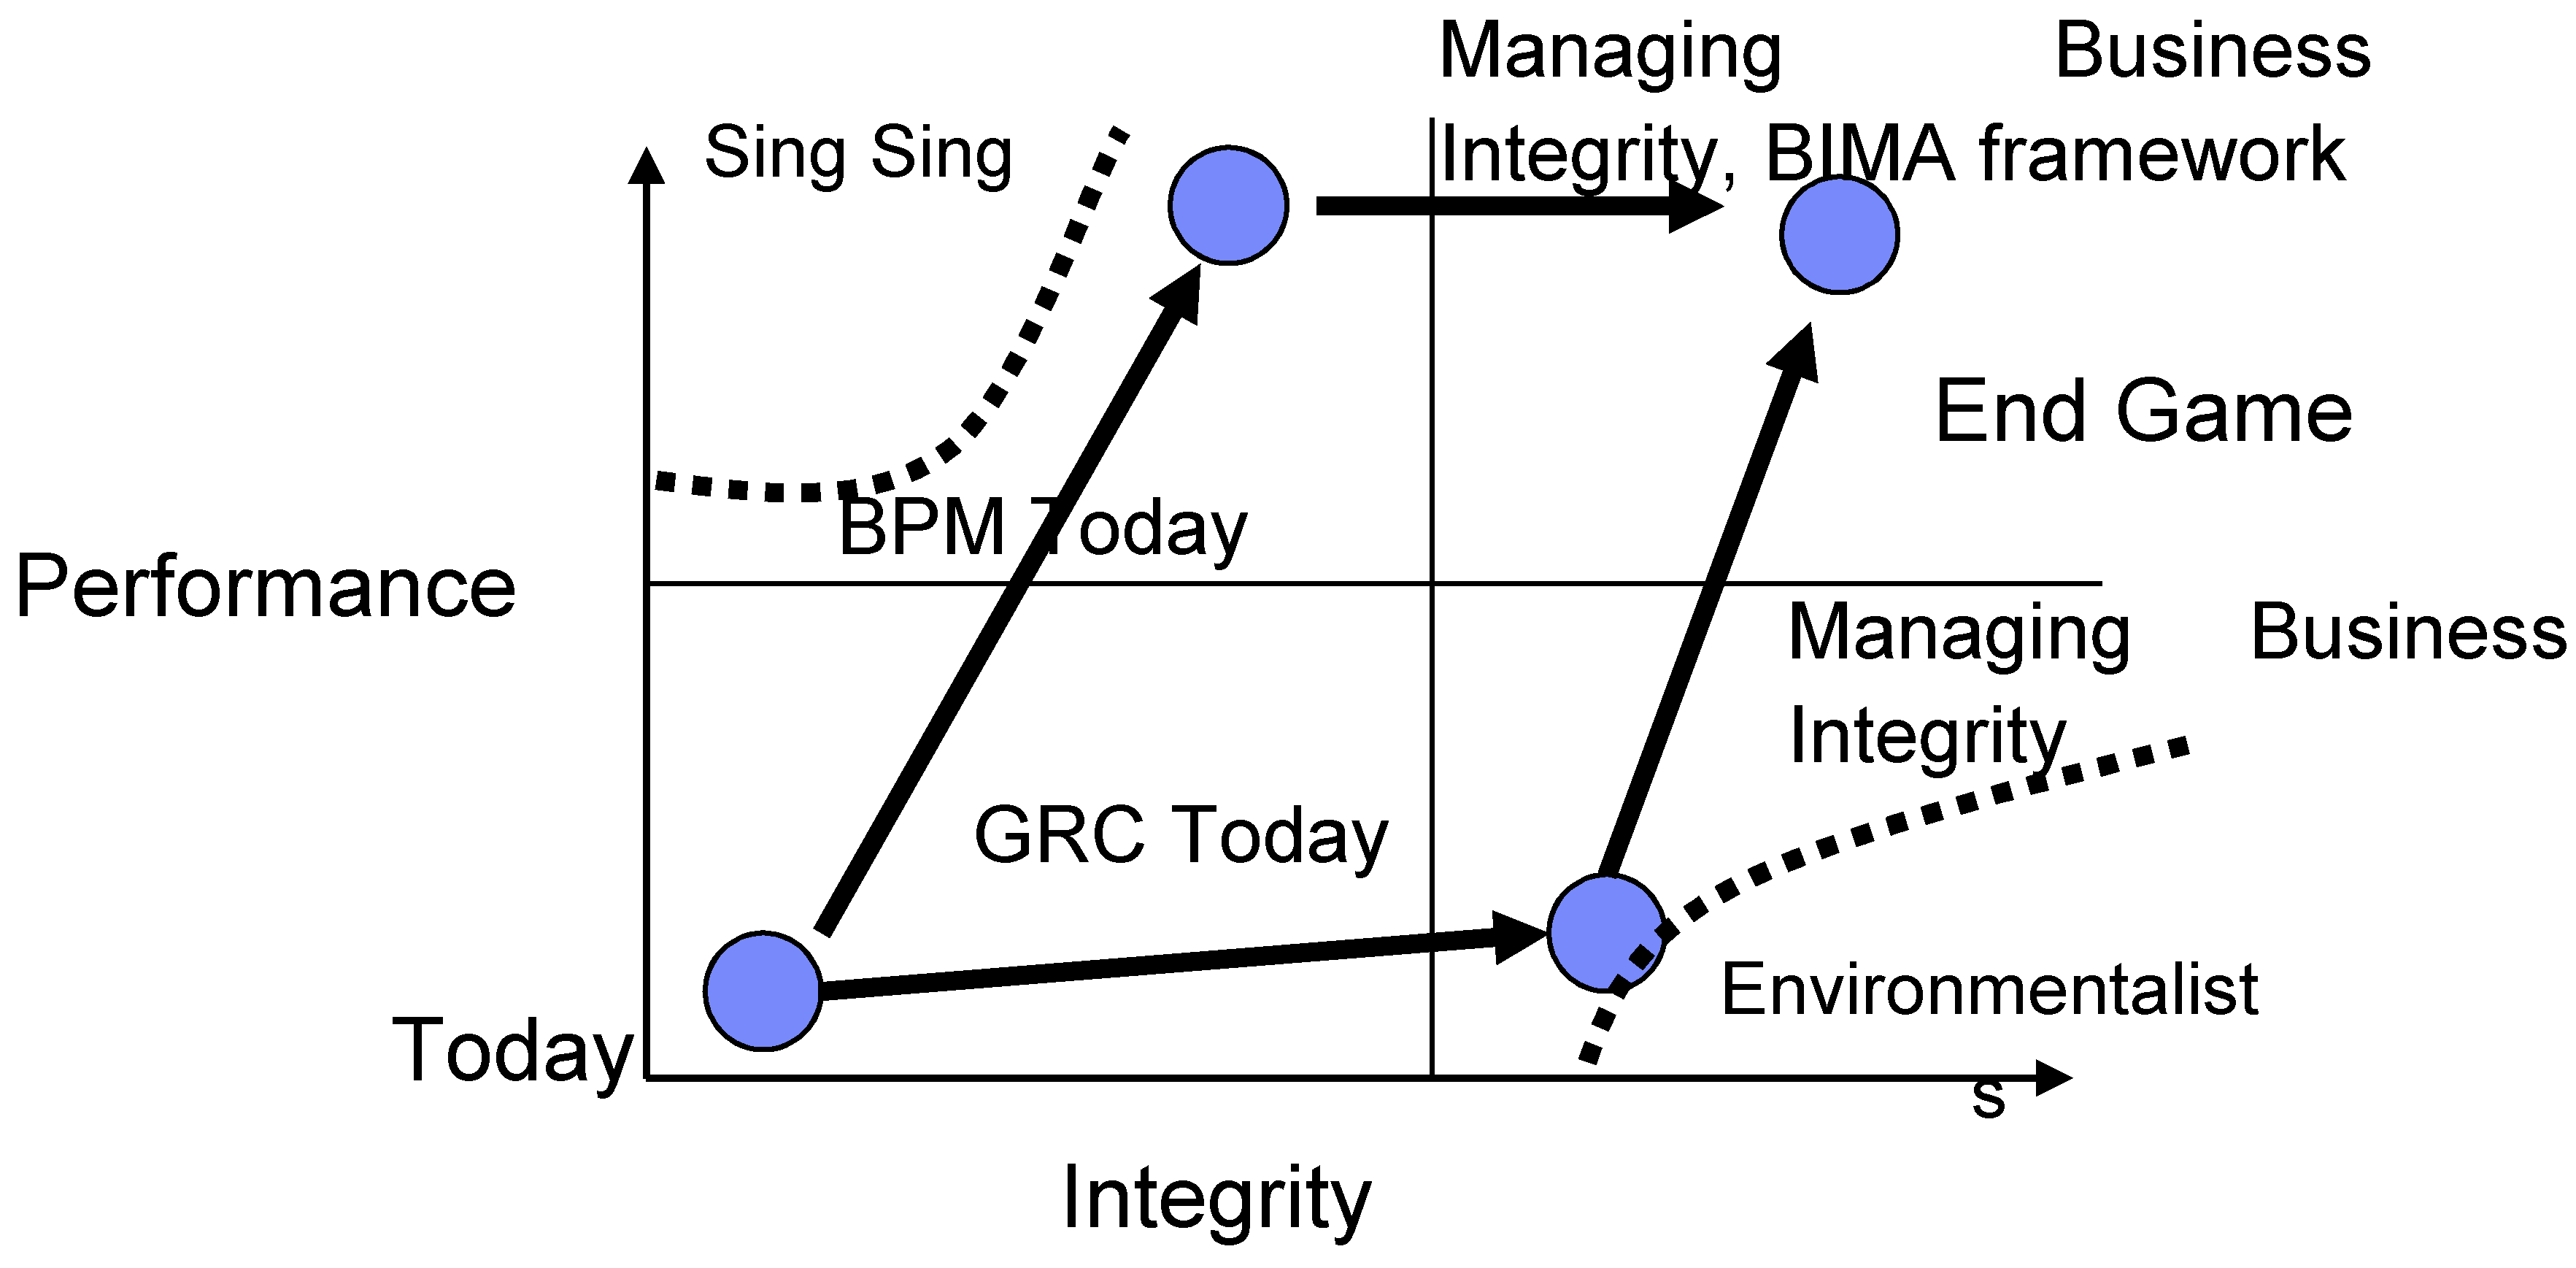
As shown in
Figure 1, business performance and integrity should be considered simultaneously. Many businesses today leverage business performance management (BPM) tools. They aim to develop various key performance indicators (KPIs) and performance dashboards to facilitate real-time monitoring of the business performance. However, KPIs should be established in conjunction with the integrity and auditability of these KPIs, or the drive toward better KPI often resulted in a skewed/distorted view of the performance of a corporation. As an example, focusing on revenue growth sometimes resulted in less stringent criteria applied to the distinction between gross versus net during the revenue recognition process. On the other hand, focusing on compliance alone without keeping the business performance in mind might result in a rigid business environment and severely limit the business to grow in a rapidly changing business environment. Consequently, managing business integrity intends to provide a methodology for businesses to steer clear from the potential pitfalls of focusing only on performance or compliance.
The technology implications of managing business integrity are as follows:
A quantifiable risk framework that assesses risk across all enterprise functions and the processes that will facilitate risk mitigation across enterprises and service providers.
Managing business integrity necessitates the continuous tracking of regulation across jurisdictions over time, automates mapping from regulations to obligations, and generates business controls from obligations. Continuous monitoring of the compliance posture based on these business controls enables ongoing assurance that includes full implementation of attestation, investigation, and remediation for these regulatory compliance requirements.
End-to-end information provenance that records who, when, where, and what for every step in the business process will emerge as an enterprise requirement utilizing provenance-aware middleware, applications, and storage. This has become particularly important as information security has become a growing concern, and it is necessary to determine the extent of an impact accurately when a breach occurs through the provenance on record.
An integrated GRC repository will emerge for managing provenance, procedure, and event data.
2.3. What Is Managing Business Integrity Mean in the Context Today?
It is the believe of the authors that the business integrity management has a rising challenge, since businesses can be evolved to develop a consistent and interdependent view of their policies, processes, and core entities, as shown in
Figure 2. For many decades, transactional integrity (ACID: atomicity, consistency, isolation, and durability) in which transactions performed on the database are guaranteed to behave appropriately has been the cornerstone of distributed computing theory. Integrity is a growing concern to businesses faced with increasingly stringent government regulations, the disaggregation of enterprises into global value nets, and the continuing explosion of business information. In most cases, data, processes, and policies within the business are typically inconsistent and incomplete. Emerging solutions can address consistencies and the management of systems, processes, and core entities independently. The most noticeable difference between business integrity and transactional integrity is that transactional integrity is all or nothing (e.g., an ATM transaction cannot allow an intermediate state). On the other hand, business integrity might not afford all or nothing and has to live with a risk-based continuum of integrity.
The basic notion of managing business integrity assumes the existence of an operational aspect of the abstraction of the semantics of the business (or enterprise) that can be described in part by policies, processes, entities, and the interdependencies among them. The operational aspects of the abstraction can then be used to interact with Governance, Risk, and Compliance (GRC)-related applications as well as business performance management (BPM)-related applications and solutions. The Component Business Model (CBM), which captures the core business service components, was an attempt to produce such an abstraction of the business. Hence, managing business integrity is the management of the individual as well as the interdependent aspects of policies, processes, and entities:
Information integrity: Master Information Management (single semantic definition of core entities (e.g., customer, employee, product))
Policy integrity: Common and/or Best Practices (e.g., accounting practices) stored in policy repository/warehouse
Process integrity: Standardized Business Processes (e.g., enterprise process framework) stored in a Process Warehouse (e.g., catalog, models, metadata)
Given the emergence of master data management, managing business integrity can be viewed as an extension of it into master integrity management. Supporting outputs can be demonstrated in the form of analytics to allow business leaders, investors, and policymakers to fully understand the transparency and outputs of computational or data analysis [
28]. Our work should provide a financial cloud platform that has algorithms with big data analytics, such as business process management and customer-driven analysis, as our previous work has suggested [
21].
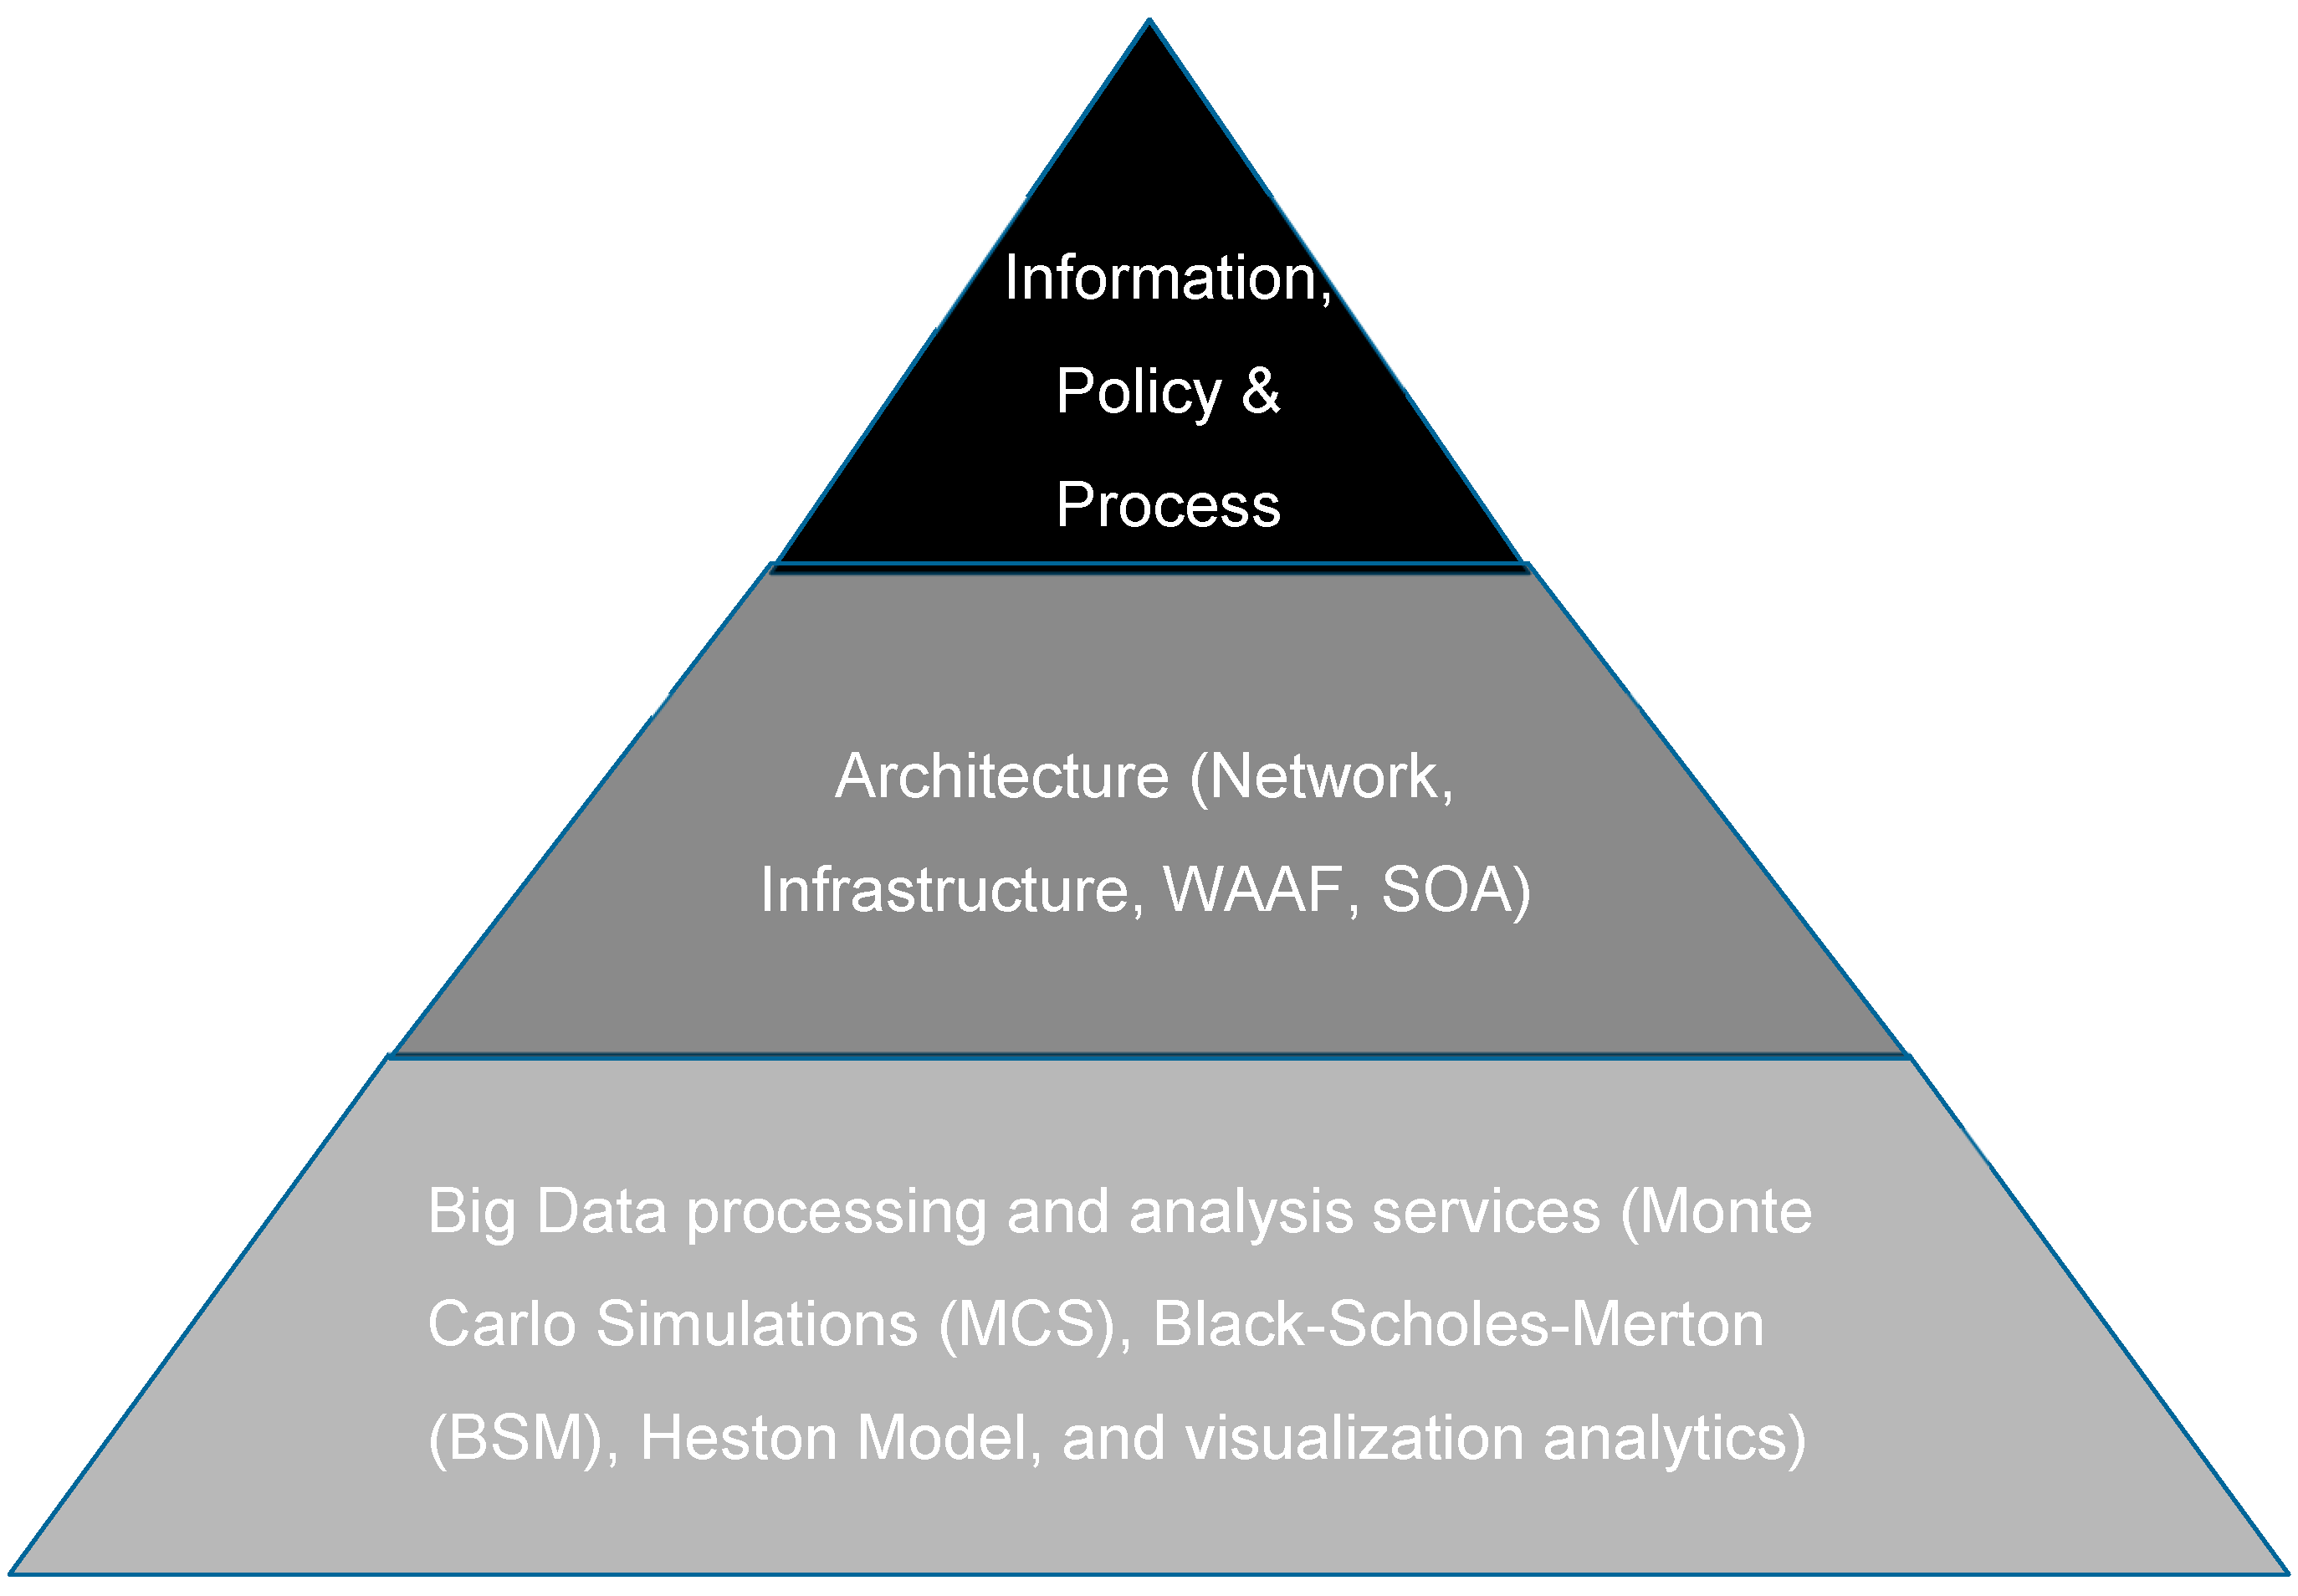
The critical aspects of achieving business integrity include strict regulation on information, policy, and process integrity. Additionally, at the infrastructure design and implementation level, we need an integrated approach to cloud-based financialization supporting IT infrastructure, architectural design based on SOA. The aim is to provide a solid foundation for information service integrity, data integrity, and protecting the integrity of the policies. Finally, it needs to be supported by big data analytics processing frameworks and established algorithms. This is illustrated in
Figure 3 on the pillars of a business integrity-driven approach to implementing financialization services by our analytical methods, which can be simulated in the cloud.
As shown in
Figure 3, services include business integrity, financial services, and data analytics models. There are seven reasons for using an SOA-based architectural design and implementation approach to financial services. Overall, they provide support for business strategies such as the increased federation of services, increased intrinsic interoperability, increased vendor diversity, and increased business and technology alignment. This can result in strategic business benefits of improved Return-On-Investment (ROI), reduced IT burden, and increased organizational agility. The following sections demonstrated each of our approaches to achieve business integrity in financialization.
2.4. Big Data Processing and Analysis Services Offered by BIMA Framework
Our approach to financialization, through the use of the BIMA framework, is the adoption of big data processing and analysis services (BDPAS), which typically run advanced algorithms and advanced formulas to simulate complex, large-scale, and real-time financial calculations. BDPAS aims to achieve these functions. First, it can process thousands of data at once within seconds. Second, it informs the investors of the best options for put/call prices and types of invested stocks. Third, it computes different kinds of risks and provides numerical values for risk measures. Fourth, it predicts the future trends and finally present outputs in the form of visualization, analytics, and graphs to allow anyone to understand the outputs of analysis. BDPAS consists of four mainstream methods as follows:
Monte Carlo Simulations (MCS): Monte Carlo simulations (MCS) have been widely used to compute the risk as well as prices for different types of investments through large-scale simulations [
29,
30].
Black–Scholes–Merton (BSM) model: BSM can be used to simulate market complexity, volatility, and risk/return ratios and have track records in supply chain finance [
31].
Heston Model: The Heston model is a specialized stochastic model that can be effectively used to calculate market return and risk by using the data from the Chicago index. Although BSM is powerful to calculate financial derivatives, certain theoretical assumptions made by BSM mean the results are sometimes too hypothetical, and the use of the Heston Model can help reassure the validity of the BSM model [
32,
33].
Visualization and analytics: All the data processing can be computed and handled by the big data algorithms. Results can be transformed into visualization and analytics to allow anyone to understand and make decisions [
34]. Results can be available to anyone buying it such as cloud computing and not just expensive assets owned by financial institutions.
Details for each method are as follows.
2.4.1. Monte Carlo Simulations
Monte Carlo simulations (MCS) can be used in different types of simulations, such as simulating a possible bankruptcy of multiple suppliers based on the calculated probabilities to show that MCS can be used to reduce the risk of supplier bankruptcy. MCS can be used to show that the average losses would be more predictable and be used to calculate an insurance premium. Similar work at the Austrian National Bank has been conducted to estimate operational risk costs based on MCS, deriving probabilities of events and impacts of the latter based on historical data collected with banks, which was a method also proposed by the European Central Bank (ECB) staff [
35].
Monte Carlo analysis is a technique that is used in finance in order to simulate losses in financial risk management [
36]. The idea of Monte Carlo simulations is to generate random numbers in order to model the stochastic behavior of an input parameter. Each different sequence of random numbers can generate another output.
Due to the probability distribution of losses, Monte Carlo analysis can be used to estimate the average, total, and variance of the losses after a determined number of events. The analysis can be quite useful to evaluate premiums and risks for insurance services [
37]. In the case of insurance, Monte Carlo analysis can be used to estimate the total, variance, and average losses given several policies sold. Monte Carlo analysis only requires a probability or frequency distribution that can be sampled from historical data or calculated based on mathematical models such as the BSM model.
Monte Carlo simulations have an excellent history of providing reliable results for risk management. Barrad and Valverde [
38] used MCS to estimate the probability distribution of supply chain losses caused by disruptions. Cohen and Huchzermeier [
30] used Monte Carlo simulations to produce accurate estimates of a firm’s downside risk exposure to price/foreign exchange risk in the supply chain. Grittner and Valverde [
39] used MCS for the estimation of reordering points in the embedded systems industry by using historical demand taken from an Enterprise Resource Planning system. Felix and Valverde [
40] used Monte Carlo for Radio-frequency identification (RFID) simulations for the supply chain management of the UK dental industry.
2.4.2. Black Scholes Merton (BSM) Model
The Black–Scholes–Merton (BSM) option pricing model [
41] is used in the BIMA framework for estimating the probability of bankruptcy of suppliers by extracting and examining the riskiness in the stock market price of the supplier. The model assumes that the maturity of liabilities equals one year; the dividend rate is based on the sum of ordinary dividends, preferred dividends, and interest expense; and the call option equation has been modified to account for the fact that shareholders receive ordinary dividends [
41].
Under the BSM model, the probability of bankruptcy is simply the probability that the market value of assets, V0, is less than the face value of the liabilities, D, at time T (i.e., V0(T) < D). The BSM model assumes that the natural log of future asset values is normally distributed. The probability of bankruptcy is a function of the distance between the current value of the firm’s assets and the face value of its liabilities, which is adjusted for the expected growth in asset values relative to asset volatility.
2.4.3. Heston Model
The Heston model is a specialized stochastic model aiming to calculate volatility concerning prices. It relaxes the constant volatility assumption in the classical Black–Scholes model by incorporating an immediate short-term variance process based on market volatility [
42]. The Heston model contains the Wiener process and the CIR process. The Wiener process is a continuous-time stochastic process used under BSM to calculate pricing options [
33]. The Heston model has been derived from the CIR model of Cox, Ingersoll, and Ross for interest rates. The CIR process is a Markov process with continuous paths defined by the following stochastic differential equation (SDE). The Heston model has the following advantages in financial derivatives demonstrated by Chang [
43].
Compute and track volatility—The Heston model can track the movement of volatility, which can help investors to make a better judgment for investment when prices are high and volatility is low (which happens but the period is short and it is not always available).
Accuracy—The Heston model can compute pricing and risk values to several decimal places and also calculate its mean, lower, and upper range to get our results as accurate as possible. Accuracy can be measured based on the differences between the actual and predicted values and ways to get very close, as demonstrated by our previous work.
2.4.4. Visualization and Analytics
Visualization and analytics are essential aspects of Emerging Services, which have positive impacts supported by case studies for different sectors and disciplines. Advanced algorithms or Application Program Interfaces (APIs) can be written to demonstrate it. Instead of numerical computing and large-scale database queries, outputs can be transferred and presented in the form of analytics [
44,
45].
Visualization includes integrated technologies from artificial intelligence, machine learning, business intelligence, data warehouse, software architecture, statistical computing, predictive modeling and analysis, and finally big data services [
21,
46]. Instead of numerical computations, outputs of MCS, BSM, and Heston models can be collected, analyzed, and presented in the form of visualization and analytics. The benefits are as follows. First, analysts can spend less time interpreting results, which tend to make sense to scientists but not necessarily analysts. Second, investors and decision-makers without a technical computing background can understand the outputs of large-scale financial analysis better and quicker. Third, key outputs essential to core businesses can be given the priority for analysis, so that more focus can be spent on the most relevant type of data for businesses, since not all data can carry meaningful business values.
3. The Architecture and the Core Components
This section describes the architecture and the core components of the Business Integrity Management and Analytics (BIMA) framework for financialization so that high-frequency trading and simulations for predicting risk, return, and critical metrics can be undertaken.
3.1. Network Infrastructure
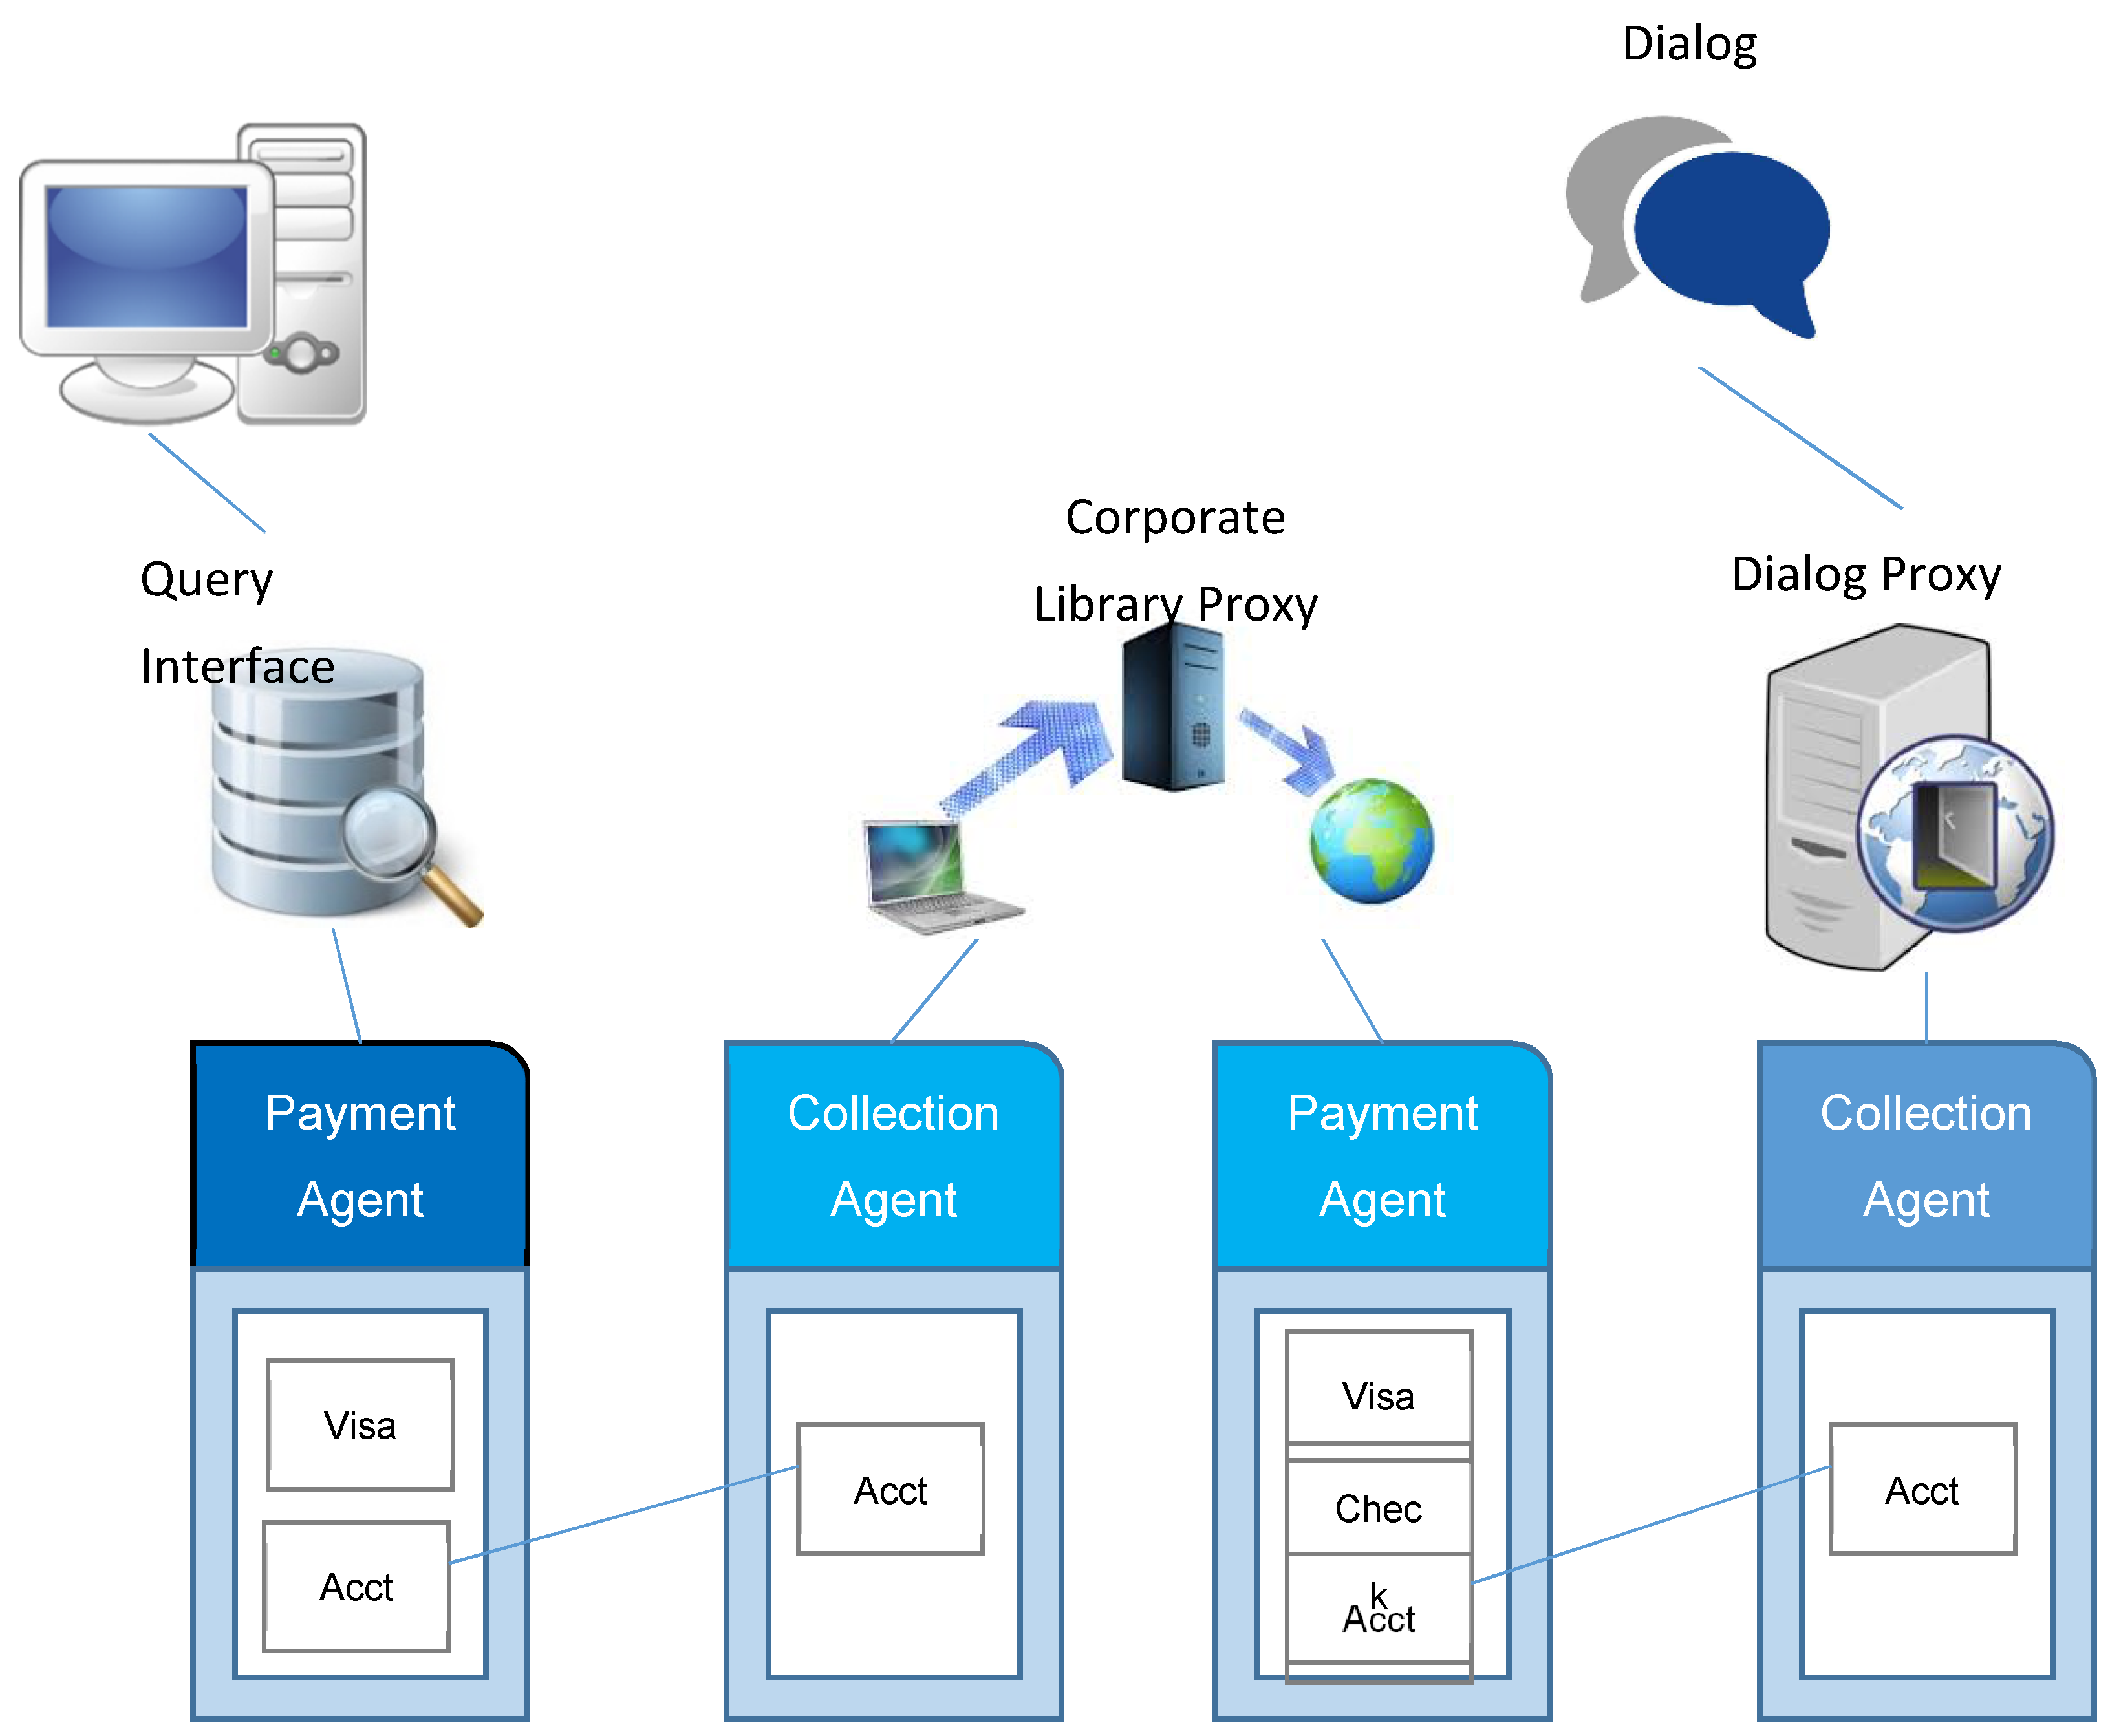
Figure 4 shows the network infrastructure based on the information interplay between financial institutes, investors, and policymakers. Electronic Data Interchange (EDI) can take place between the various stakeholders through the big data processing and analysis services of the BIMA framework. This allows the policymakers to make their policies up-to-date, which can be reviewed by the investors and decide on the market trends to make decisions on investment. The financial institute is the one that makes the end choices rather than the one in the middle to manipulate, hide, and delay the processing of information and decisions.
There are additional features offered by the architecture. First, security has been blended successfully to ensure all transactions to be safe and resilient. This can be achieved by the combined uses of the firewall to protect the services, XML to define access control, user privileges, and advanced security rules. Network security can be fully integrated with web services languages and rules set by XML. Second, the transaction costs can be managed based on the demands and time of transactions, which can be low as $0.05 per transaction. Payments can be made via a fair, open, and market-acceptable platform such as secure cloud computing. Third, there is a comprehensive payment system, which includes the following:
The customer pays with a credit card after the vendor presents the amount of money to be paid and a reference number.
Advanced Point of Sale (POS) terminal application: payments can be made via secure browsers.
All results based on the market trends can be calculated in real-time by big data processing and analysis services (BDPAS).
The Interpay ecosystem consists of the collection and payment agents to ensure the delivery of web services in the BIMA framework to be smooth and successful. It supports multi-tenancy for hundreds of users, thus lowering operational costs in the long run. The Interpay, as part of the BIMA framework, also suggests that add-ins can be developed and integrated into web services. Additionally, web services can be used as “Add-ons” to existing Enterprise Resource Planning (ERP) systems such as Systems, Applications & Products in Data Processing (SAP). Once the web service is integrated into the ERP, it can now collaborate with other ERP modules (i.e., Supplier Relationship Management (SRM), Supplier Customer Relationship Management (SCM), and Customer Relationship Management (CRM)) to manage suppliers and data can be refreshed in almost real time (15-s refresh).
3.2. Architecture Guidelines for the BIMA Framework
Framework architectures with significant attention in the literature are “Framework for information system architecture” from Zachman [
47], “The 4 + 1 view model of software architecture” from Kruchten [
48], “Recommended practice for the architectural description of software-intensive systems” [
49,
50], and the “Model Driven Architecture” (MDA) from OMG (2018). As described by Kong and Liu [
51], and also Lowe and Eklund [
52], specifications for web systems are consequently different from conventional software systems. Kong [
51] stated that for web services architectures, “Model Driven Architecture” or “Web Application Architecture Framework” (WAAF) could be used for web services because these architecture frameworks recognize the open and more modularized approach of web services. Web service architecture is a core architecture for the BIMA framework, since many services are delivered by web and cloud-based services. To ensure the best practice approach,
Table 1 shows the WAAF Matrix [
53] to present architecture design guidelines for the BIMA framework presented in the form of the WAAF Matrix.
3.3. SOA Based Soft Compute Platform Supporting WAAF Matrix
According to our extended WAAF best practice, designing guidelines in a Service-Oriented Architecture (SOA) is suitable for market prediction services as proposed in our BIMA framework. The WAAF matrix supports various stages in the web services development [
47]. With the aim to illustrate how to implement WAAF in the BIMA framework, Service-Oriented Architecture (SOA) based on a big data analytics platform is used, which supports WAAF’s matrix architectures: planning, business, information, User Interfaces (UI), systems, and web objects. SOA has emerged supporting scalability and service reuse. At the same time, the BIMA framework has impacted business services such as prediction, put, and call prices, which require real-time analytics integrating and composing different market vendors. SOA-driven architecture is the key to business integrity and to integrate various business systems. A systematic approach for SOA design strategies and business processes for the BIMA framework is as follows:
Distributed systems have been developed and deployed in a traditional software architecture model based on a layered architecture. However, this was not able to provide a sustainable IT system that is cost-effective. Therefore, SOA has emerged to address this issue and has emerged with key design principles such as loose coupling, service reusability, service composability (which means any types of services can be blended together for different purposes), and service discoverability (new needs can be identified and made into services).
An SOA reference architecture has been adopted by the BIMA framework to solve the classical problem of customization, composability, and interoperability. The primary focus of our approach is to integrate SOA for the BIMA framework for market prediction services. Consequently, the BIMA framework has emerged to address the challenges faced by volume, velocity, and veracity of data being received and analyzed in real time. Hence, an SOA model is used to tackle the required speed and accuracy of data.
The BIMA framework has become a reality for businesses. Examples include (1) Google’s Gmail service, which has been operating in an Exabyte of data; (2) Amazon web services that have streaming media globally every second; and (3) other real-time life sensitive data such as medial, weather forecasts, Earth monitoring, and space applications data. As a result, there is a growing need for a structured framework to select, process, and monitor highly relevant data. In this context, Gorton [
4,
54] describes a lightweight with a risk reduction approach to significant data analytics process and architecture, which is known as Lightweight Evaluation and Architecture Prototyping for BIMA framework (LEAP4BD). This provides a good starting point for organizations to use a semantic knowledge-based tool for data selection and acquisition. It is yet another tool for data extraction, which is not SOA-based and lacks a systematic approach. Similarly, Li et al. [
55] have proposed a framework for a geoscience big data framework, which consists of multidimensional data where Hadoop (Hbase) has been adopted for storing and managing multidimensional geoscientific data and the MapReduce-based parallel algorithm has been used for processing such data. Although the Hadoop framework does propose large-scale data extraction, it lacks in the generalization and application of SOA architecture.
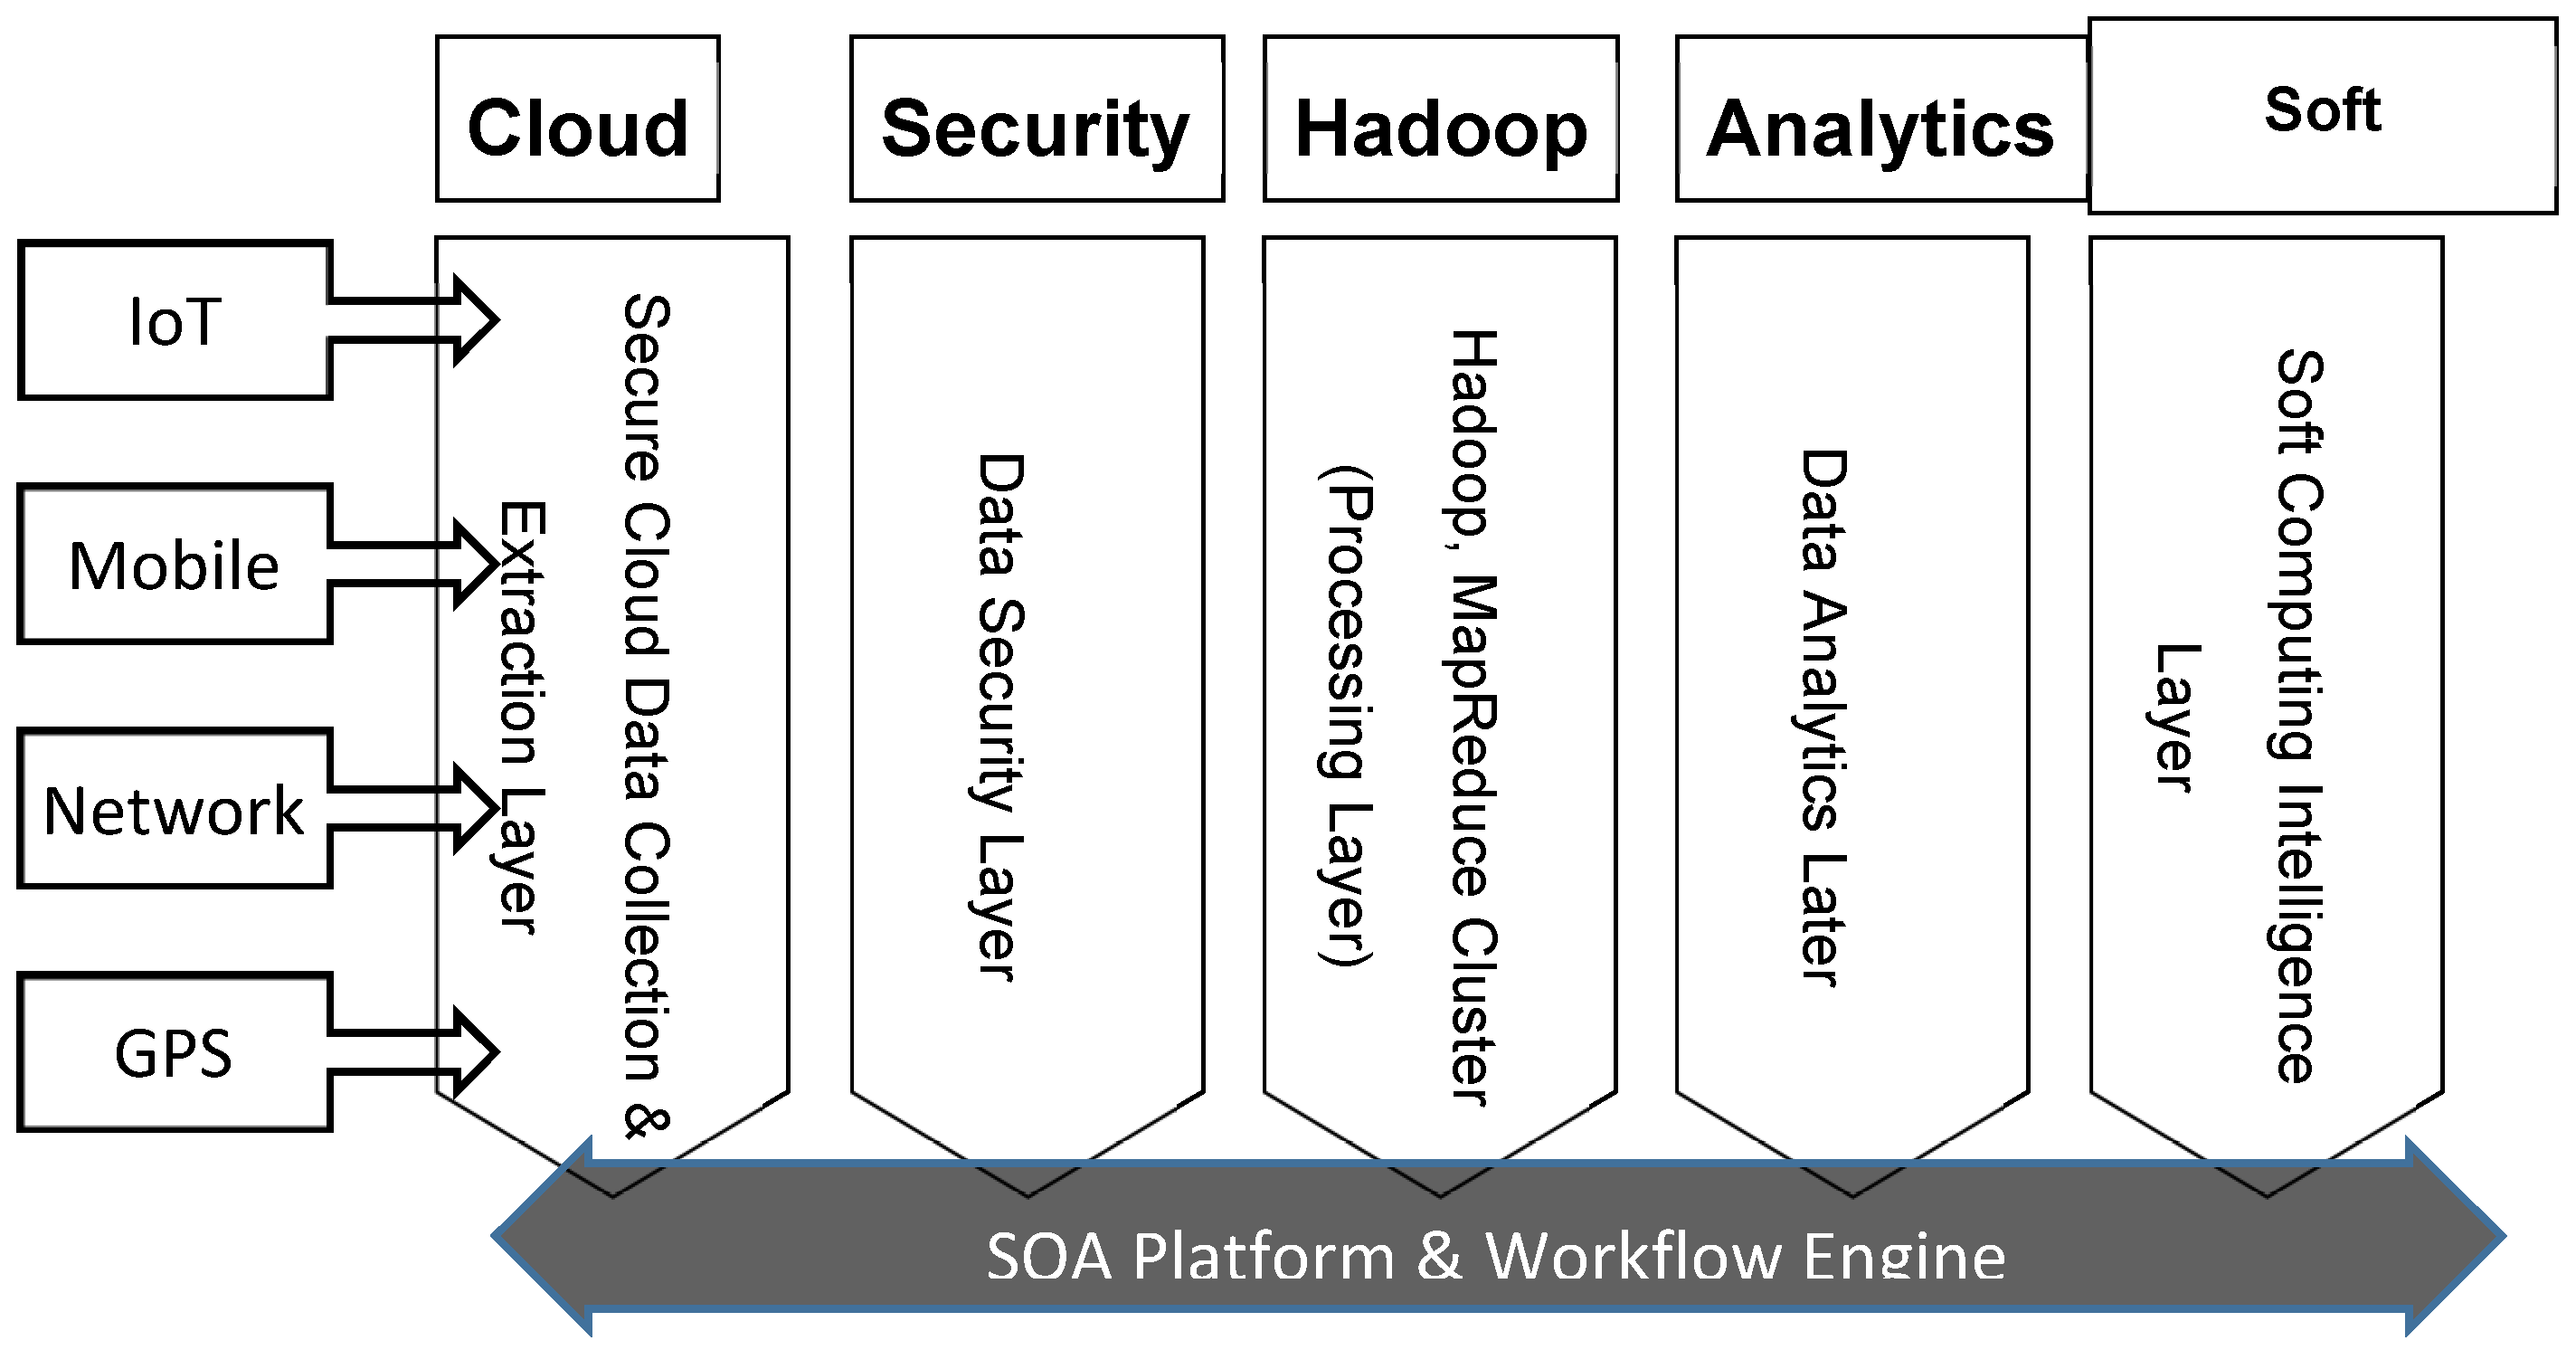
The proposed SOA based on a soft computing framework for big data (SoftBD) layer is part of our overall BIMA framework with soft compute intelligence algorithms for decision making when collecting, selecting, extracting, validating, and evaluating the data. Additionally, soft computing algorithms such as the neuro-fuzzy and Bayesian theorem that allows data prediction based on historical data collected. The SoftBD framework is shown in
Figure 5.
SoftBD starts receiving data continuously with cloud platforms such as Amazon EC2, Windows Azure, Google, and Salesforce. The data sources can be from multiple sources including geoscience, entertainment monitoring, selection and prediction (Home and Cinema), aircraft monitoring, IoT devices, healthcare, mobile, financial market integrity analysis, and forecastings such as the BIMA framework, wireless sensor networks, and natural disaster areas such as fire, flood, and earthquake, and epidemics. The cloud is the best suitable platform as it provides elastic services to store and maintain data globally. The next layer is a data clustering layer using the Hadoop platform, which can be part of the chosen cloud platform. This layer does the data processing, categorizing the data into entertainment, geosciences, and WSN (wireless sensor network). The next layer is a data analytics layer, which could include the Hadoop/MapReduce algorithm to speed up analyzing the data parallelization. The big challenge in Hadoop is resource allocation and scheduling for parallel high-performance computing. The final layer on the vertical services is our new soft compute intelligence layer, which includes algorithms and models on fuzzy-logic, neuro-fuzzy, and Bayesian theorem. The primary purpose of this service layer is to offer prediction models on the categorized and analyzed data. This also covers data evaluation, assessment, and validation. All of the vertical segments are based on service-oriented architecture provisioning, which consists of loosely coupled services within the BIMA framework.
4. Discussion: Benefits and Services Offered by the BIMA Framework
The integrated approach in the BIMA framework allows investors to perform high volume trading and analyzes stocks, bonds, mortgages, and any commodity of their choices, including the risk analysis and pricing analysis of any type. The benefits and services offered by the BIMA framework can be explained as follows.
4.1. Probability of Bankruptcy
Our financial service has been used to calculate the probability of bankruptcy based on a sample of seven companies. The basic idea for estimating the likelihood of a company bankruptcy is to recognize the stock price movement pattern of the company and evaluate the historic events information, which is available to the public via company press meets, market focus, and so on. The procedure for extracting such information was developed by Hillegeist et al. [
56]. The model assumes that, first, the maturity of liabilities equals one year. Second, the dividend rate is based on the sum of ordinary dividends, preferred dividends, and interest expense. Third, the call option equation has been modified to account for the fact that shareholders receive regular dividends [
41].
All the input variables are based on the BSM model requirement, and all processing is completed by our BDPAS services within seconds. Probability can be calculated and checked based on Monte Carlo and Black Scholes modeling. In the proposed system, the BSM model is fed by using daily return data from the Center for Research in Security Prices database and the big data processing and analysis services (BDPAS) from the BIMA framework. In the examples below, Crown holdings have the highest probability of bankruptcy due to the toxic debt, coupled with inadequate investment decisions and overall management. Results can feed into the tool and allow investors to review their business decisions and, consequently, adjust their forecast. There are other applications presented previously for this probability, such as insurance valuation [
57] and supplier evaluation in ERP solutions [
38]. See
Table 2 for results. Our analysis can identify that the company, CROWN HOLDINGS INC, has a very high percentage of declaring bankruptcy. In this way, our work provides contributions to real-world risk analysis for ESPR.
4.2. Risk Calculations by Monte Carlo Simulations (MCS)
This section describes how MCS simulations (time step = 10) can be used to calculate the precise numeric price and risk options. The least square method (LSM) is a precision method in MCS to calculate results to be as accurate as possible. Risk analysis is carried out using models of both the American and European options due to their popularity. The difference is that while an American option may be exercised at any time, European options can only be exercised at expiry [
36]. The majority of exchange-traded options are American. A European option may be used only at the expiry date of the opportunity, which means at a single predefined point in time [
36]. Simultaneous calculations in both options are suitable because American options can illustrate the average performance, and the European option can demonstrate the best pricing or risk at the time research work takes place. Both American and European options are used for analysis. Both can be converted to percentages [
22]. This means that if a risk price is calculated and is equal to 2.42, it can be interpreted that 2.42% is the percentage that the risk can happen and, as such, the price to accept it is 2.42.
Using LSM permits these models to be divided into sections, each of which can be calculated independently, allowing them to be distributed across clouds or grids with consequent improvements in efficiency [
29]. LSM can be adapted to run 100,000 simulations in the cloud within a few seconds. The following is the result of running LSM to calculate the expected risk price.
MCAmericanPrice = 2.335 (risk price)
MCEuropeanPrice = 2.287 (risk price)
This means that the average performance for risk price is 2.335 (2.335% for operational risk to happen). The best risk pricing that the completion of a project or the end of investment (exit/expiry) to happen is 2.287 (2.287% for operational risk to happen).
MCS simulations in the BIMA framework can calculate the range of lower, upper, and medium limits. This is a crucial step to calculate precise options and to produce results as accurately as possible. Numerical calculations performed without the precision method may have a broader range in the final result. Thus, the likely range of risk pricing with the highest frequency of occurrence should be computed. The put price is used to calculate risk pricing, as it represents a price to accept this risk [
29]. The result shows that the expected European option (for risk price) is 2.22728, with its upper limit as 2.24039 and the lower limit as 2.21430. MCS calculations allow the computation of accurate results of up to five decimal places, including its exact price, lower limit, and upper limit. See
Table 3. Results are consistent with each other when the number of simulation goes up to 500,000 by 50,000 each time.
Gaussian Collateralized Debt Obligation (CDO) is also another model commonly used by financial institutes to compute the interest rates for currencies, mortgages, and bonds. The popularity of relying on CDO due to the lack of regulations is one of the factors that contributed to the financial crisis in 2008 [
58]. MCS has a significant performance improvement over Gaussian CDO software under the same circumstances for modeling and simulations. For example, MCS is always under 20 s for up to 500,000 simulations and has up to 10 times better performances than Gaussian CDO, which can fail to simulate beyond 300,000 simulations [
59]. MCS can achieve high-performing simulations by completing all option calculations promptly and is also more capable of running higher numbers of simulations. Instead of being unable to run beyond 300,000 simulations in one go by a Gaussian CDO desktop, MCS can run up to 500,000 simulations with much better performance, such as 20 s for 500,000 simulations for MCS versus 150 s for 300,000 simulations for a Gaussian CDO experienced in high-frequency trading [
59].
4.3. Integrating Monte Carlo Simulations (MCS) and Black-Scholes-Merton Model (BSM) for High-Frequency Price Simulations
Monte Carlo simulations (MCS) can be integrated with the Black-Scholes-Merton (BSM) model to perform full and comprehensive high-frequency simulations [
59,
60] so that all pricing options can be calculated under all possible scenarios and circumstances. The combined effort can ensure a more reliable and accurate approach (as opposed to using one model in isolation). Visualization and analytics can ensure that investors and stakeholders without finance or computing backgrounds can understand the interpretations of the results, as opposed to dealing with numerical computations directly. The algorithms based on the MCS and BSM can be written and the input variables are based on the market demands, investors’ targets, and the trading decisions. Based on all the inputs, the integrated MCS and BSM model can perform all the stress tests and present visualization and analytics as outputs.
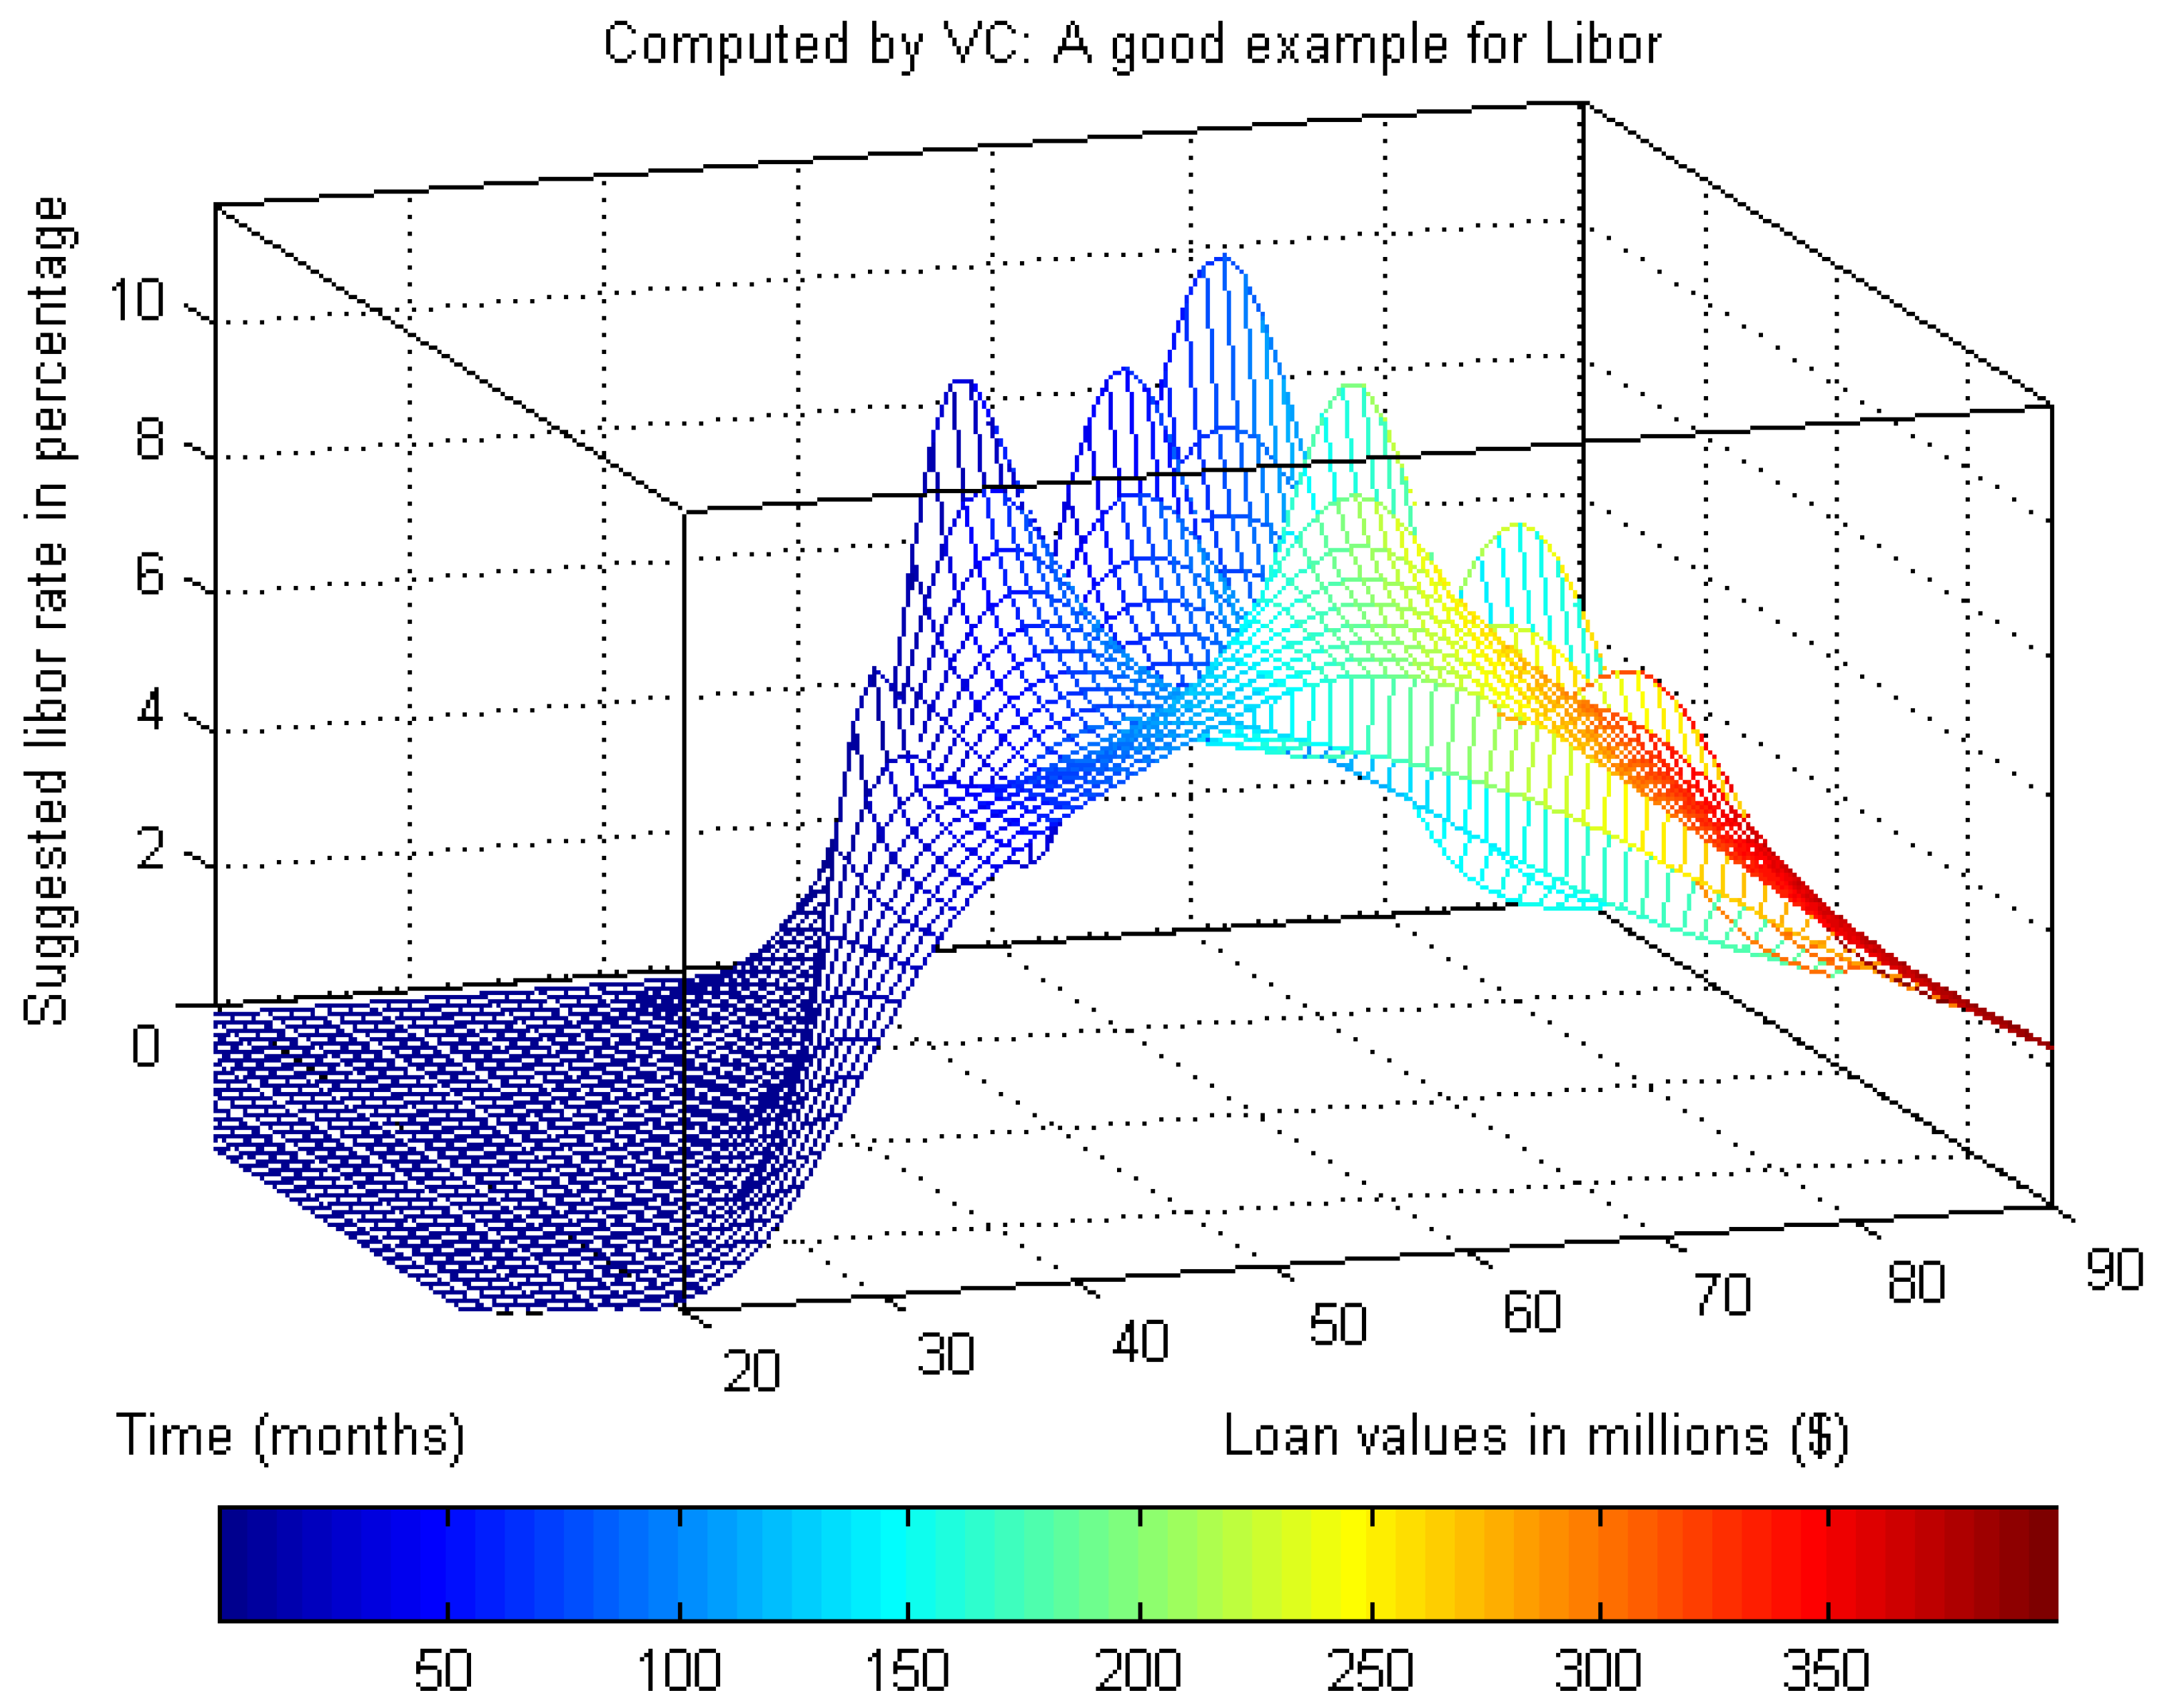
The integrated MCS-BSM model can be used to perform the London Interbank Offered Rate (LIBOR) calculations. Inputs based on the market-defined values, the Bank of England’s interest rates, the previous LIBOR rates, time to expiry, and input prices. The integrated model can be used to compute all the possible options for lending so that results can be transparent to the potential investors and lenders. As shown in
Figure 6, outputs allow any banks and multi-billion global companies to understand the implications, since they can compare the rate and also decide the best time to borrow. The results in
Figure 6 suggest that the loan values under
$100 million under the expiry date of 30 years will get meager LIBOR rates. When the loan values go above 30 years, the LIBOR rate can be increased according to the amount of the loan and the date to expiry. The LIBOR rate can fluctuate between 2% and 10% depending on circumstances. One interesting observation is that if banks borrow more than
$350 million up to 90 years of expiry, the LIBOR rate then falls to near 2%. This means that banks can effectively acquire the maximum amount of money for the most prolonged period. If they cannot afford and even go into a bust, they may get away from legal challenges, and then the toxic debts will be absorbed by the lenders. Hence, the financialization with high trading analytics can allow this type of information transparent to the public and not the secrets shared within banking. Data processing and analysis techniques were adopted based on work presented in Chang [
61] that we divide large data into P-Map, P-Reduce, and P-Merge. In this way, different types and sizes of complex data can be processed with a short execution time.
4.4. Performance Evaluation of the London Interbank Offered Rate (LIBOR)
In this section, we described a performance evaluation to conduct LIBOR simulations in
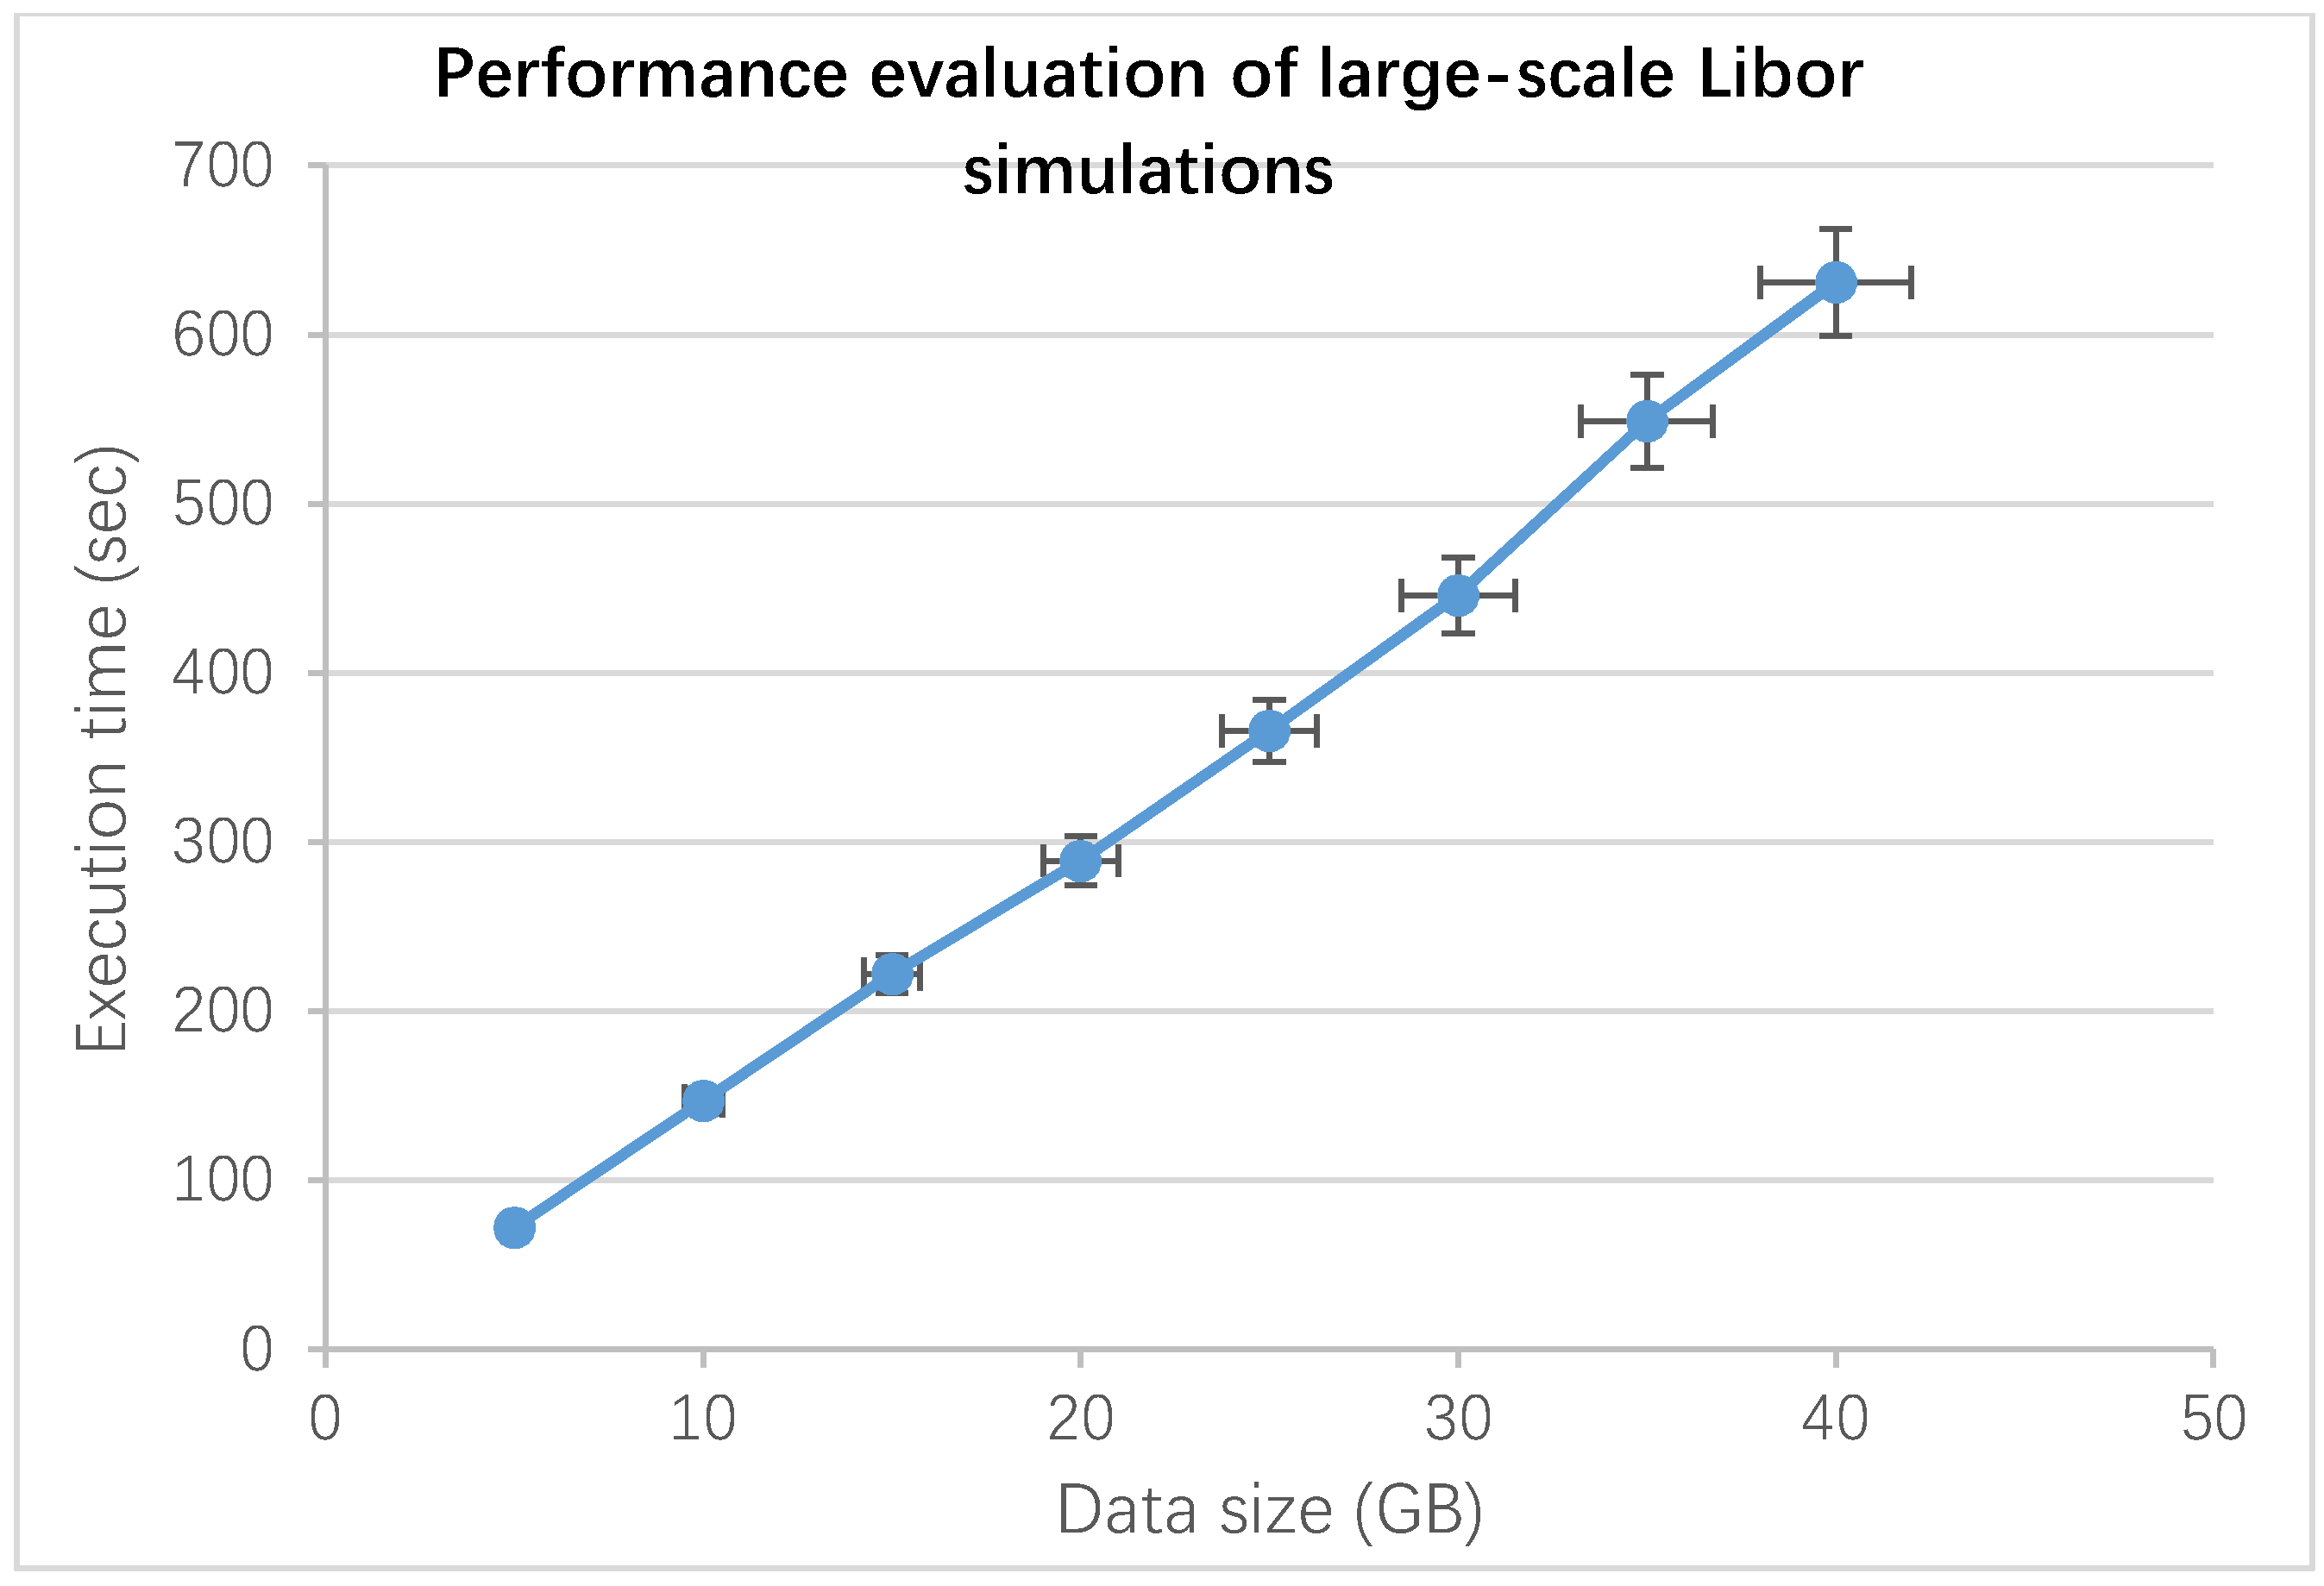
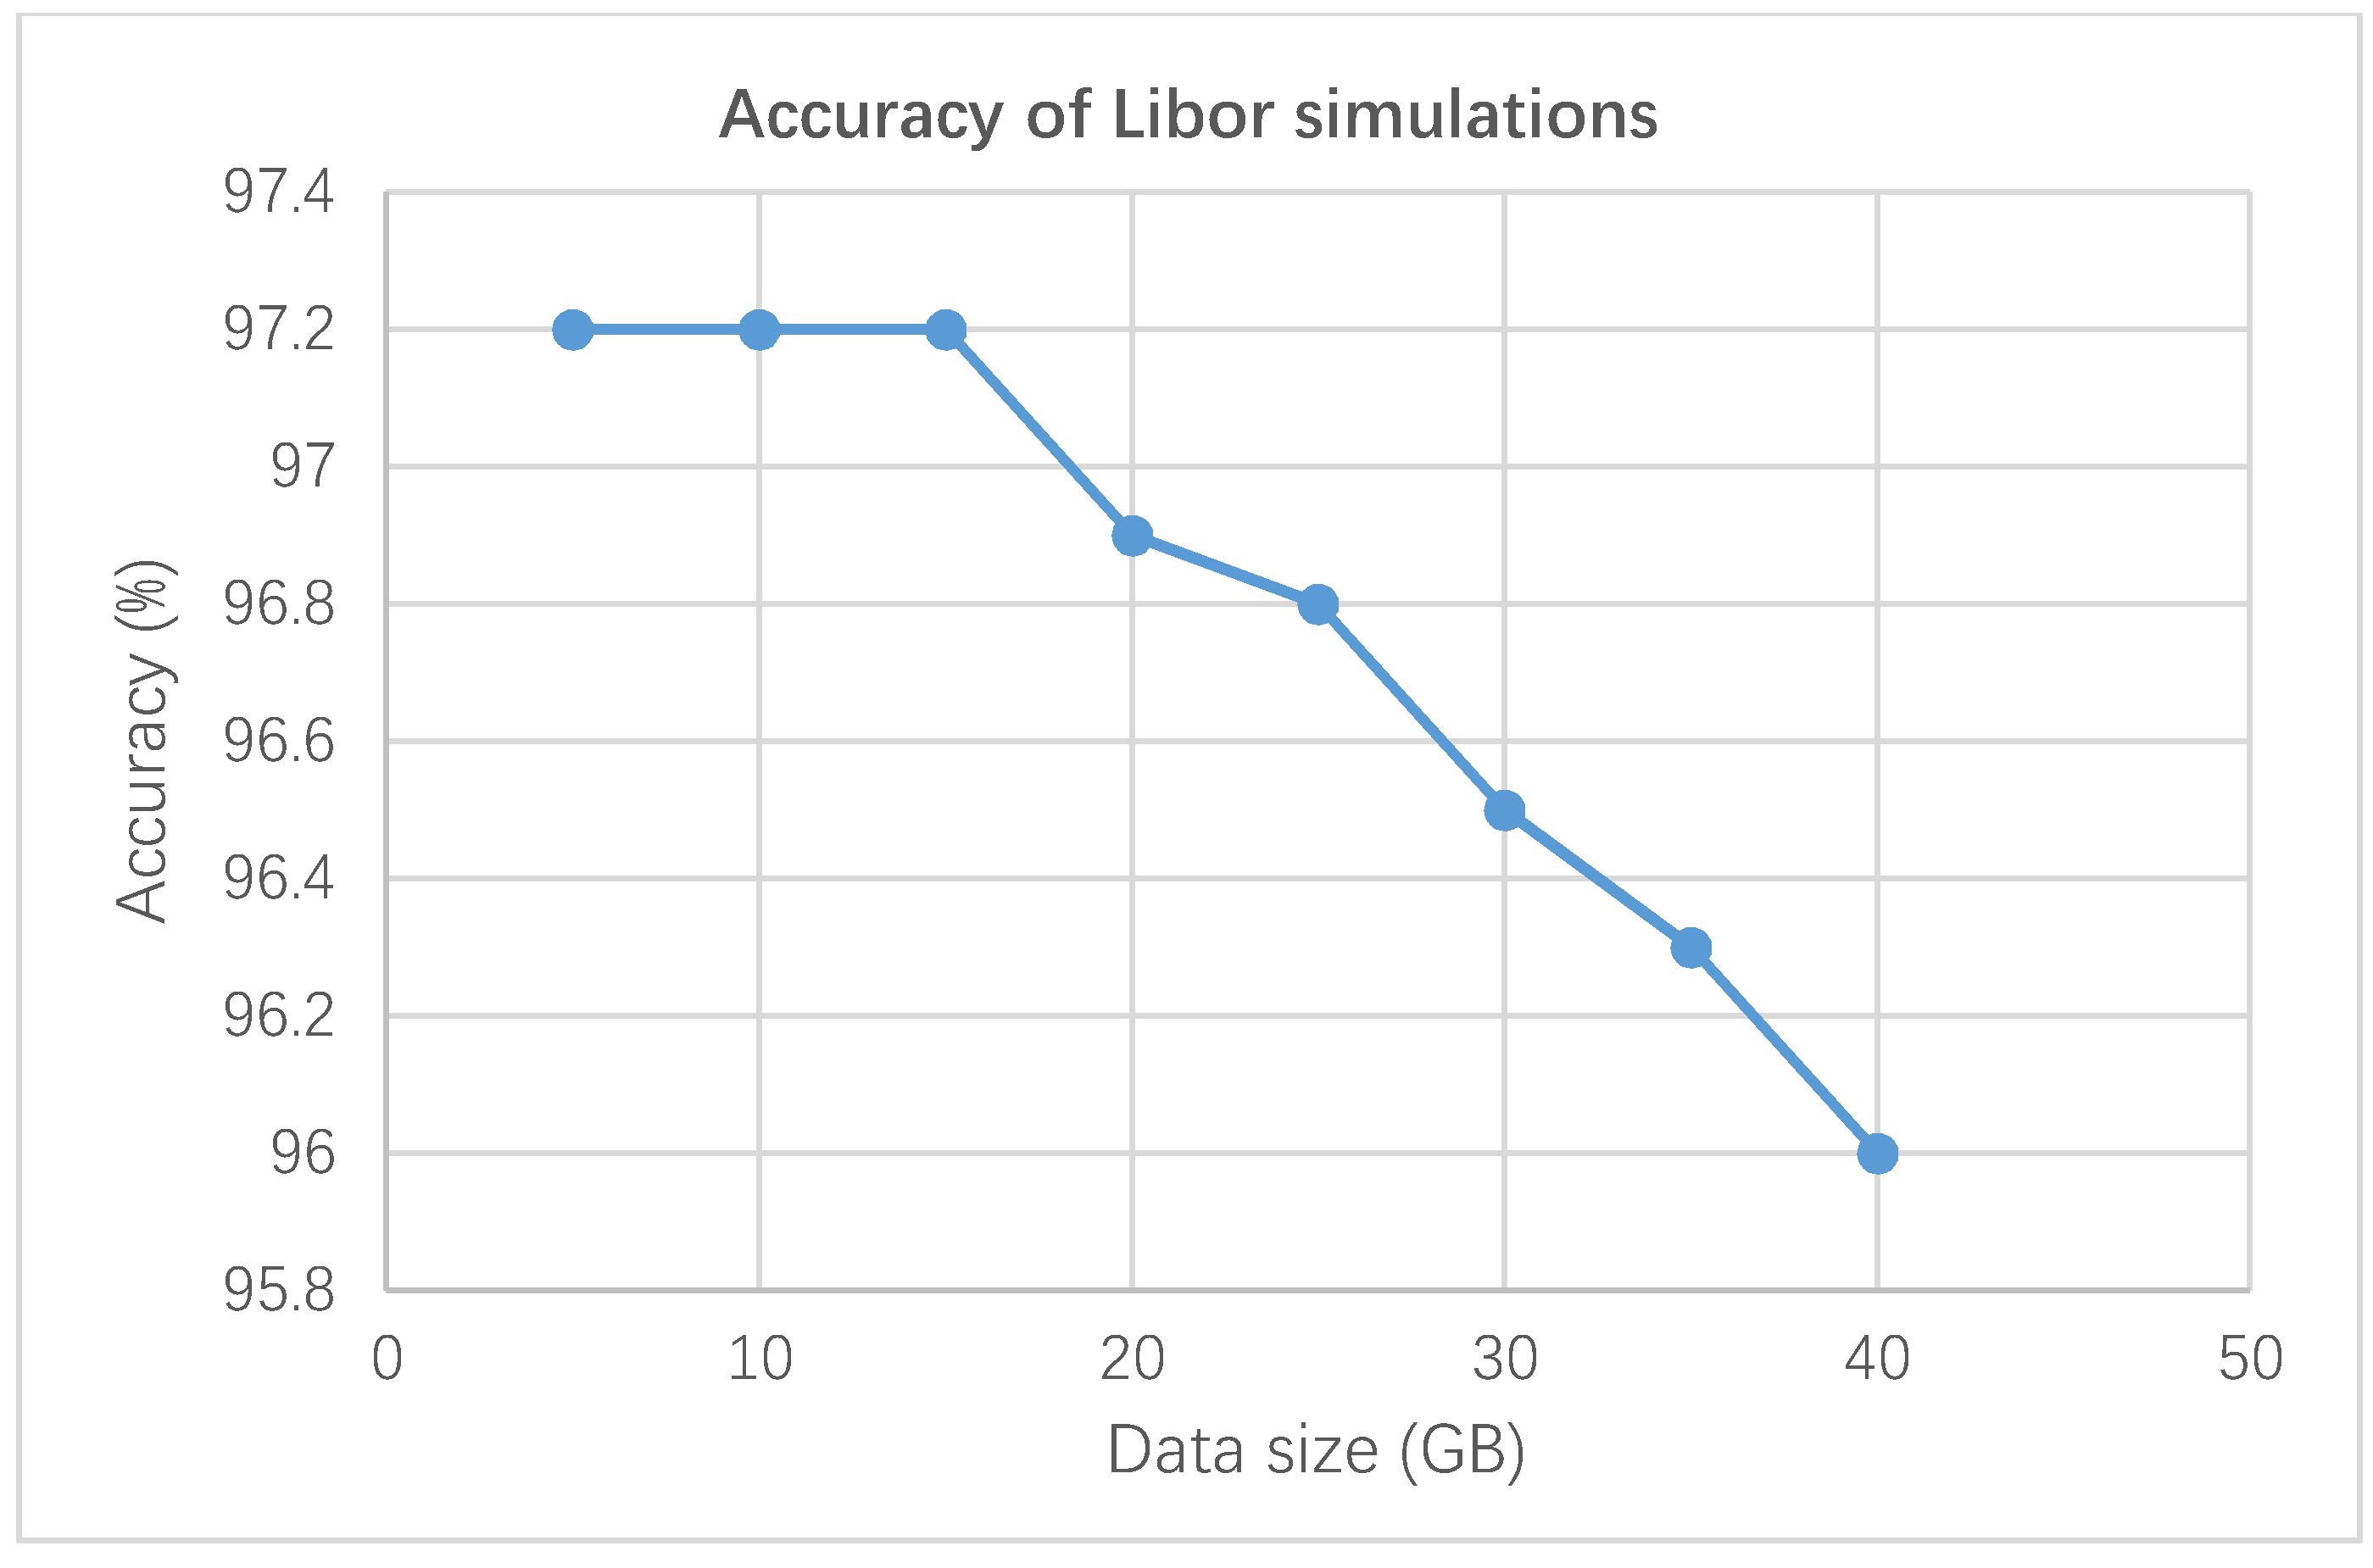
Section 4.3. We used a high-end computer cluster consisting of a total of 50 GHz of CPU power, 10 Gbps network speed, and 1 TB disk space for performance evaluation. We used between 5 and 30 GB of data for each large-scale experiments and measured five times to get the mean result. There were two sets of experiments involved. The first set was focused on execution time between 5 and 40 GB of data. The second set was focused on the percentage of accuracy by comparing the expected values and actual values of Libor rates.
Figure 7 and
Figure 8 show the results of our performance evaluation. In
Figure 7, the execution time increased proportionally with the data size. Even though there was the additional time required to run and process a larger data size, particularly between 35 and 40 GB, performance evaluation showed that the final result was similar to linear regression. In
Figure 8, the percentage of accuracy was high, staying at 97.2%. It showed that our work was robust in predicting reliable forecasts. The effect was that the data size was noticeable when the data size was increased to 20 GB, and then 40 GB, respectively. Even at 40 GB, the accuracy was high, maintaining at 96%.
4.5. The Heston Model with Visualization and Analytics
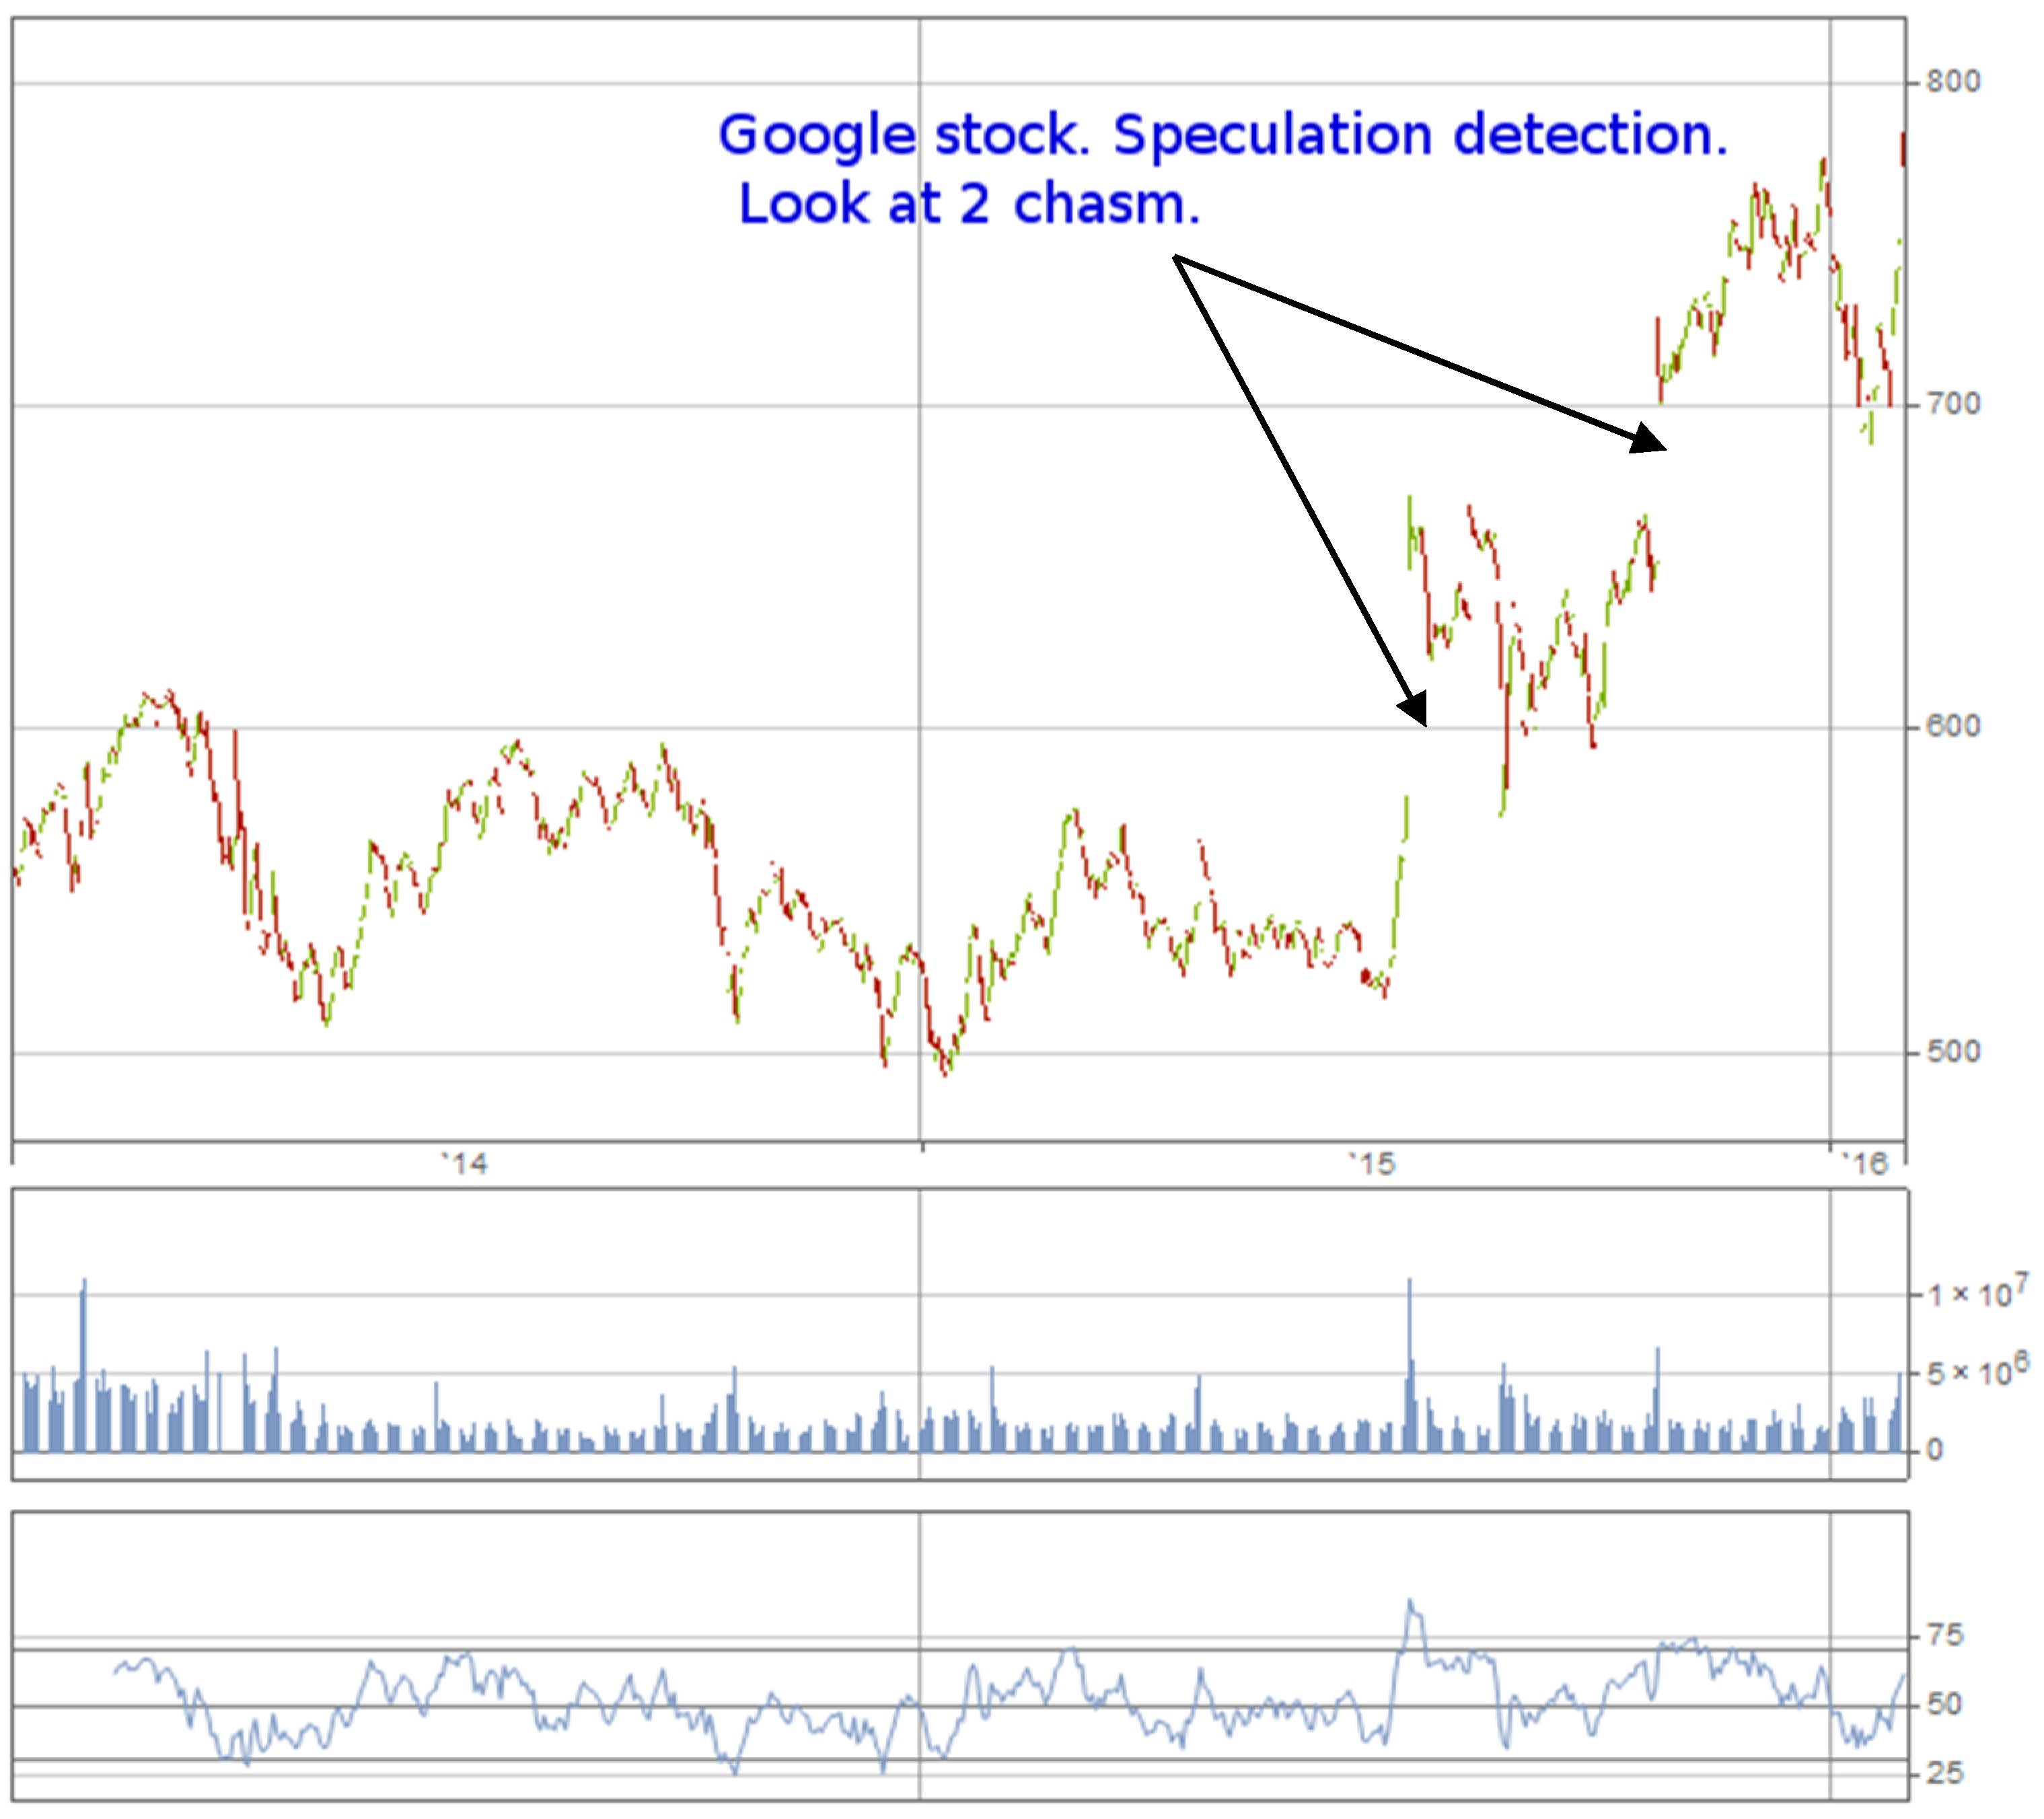
As presented in
Section 3, the Heston model is a specialized type of stochastic model that can use the market volatility as an input rather than the theoretical input for BSM, which tends to be used in predicting the outcomes after a period of expiry time [
33,
42]. This means that the Heston model can be used in real-time trading, since the market volatility can be changed daily. Blended with visualization and analytics, the Heston model can be further integrated with cloud computing to offer “Business Intelligence as a Service” (BIaaS) to offer high-frequency trading and the monitoring of risk and prices. While furthering the development of the Heston model, a machine learning algorithm is added to intelligently detect any ‘abnormal’ trading activities and report to the investors that they should think twice. Once abnormal events are identified, the chasm will be shown on the analytics.
Figure 9 shows the trading activities for Google stock. The upper section shows the prices over some time, and the lower section shows the trading volume and the R-squared values (one type of risk tracking index) for the market movement. There are two points of abnormal activities identified by a chasm. Each point suggests there is more than
$100 per stock rise over the next following trading day. It means that either the investors have been well-informed about the positive earning and strategies set by Google, or investors have decided to join forces to make profits altogether instead of fighting with one another for better financial gains. Chasm approaches can identify if there is speculation made by humans. In other words, misconduct and mispricing may also play an important role, and thus analytics can be presented as a caveat. This can allow investors to receive a useful warning before making an investment, so that the potential risk or financial loss can be prevented. With our financialization approach, we can analyze all this abnormal trading under the remit of legal acceptance to provide transparent and fair proposals for investment and governance.
4.6. The Real-World Black–Scholes Model (BSM) and Monte Carlo Simulations (MCS) for Bankrupcy and Risk Analysis
The proposed system was used for the production of an insurance product that could be used by companies to protect themselves from supplier bankruptcy. The probability of bankruptcy for a sample of 100 companies was calculated by using the BSM module of the proposed system. As Valverde and Talla [
62] introduced, the system was used to create pooling arrangements by using the BSM bankruptcy probabilities among suppliers to reduce the risk due to supplier bankruptcy. The pooling arrangement can be used by an insurance company to minimize risk and estimate an average loss that can be used to determine insurance premiums. A risk pool is one of the forms of risk management practice in insurance. Pooling arrangements do not change a company’s expected loss but reduce the uncertainty (standard deviation) of a loss. Risk pooling arrangements make each participant’s loss more predictable [
57,
62,
63].
With the proposed system, we used pooling arrangements of 5, 10, 25, and 50 companies to see the effect of the number of companies in terms of risk reduction and to estimate an average loss that can be used to evaluate insurance premiums. For each pooling arrangement, a probability table of bankruptcies was calculated by using MCS. An MCS for the bankruptcy of companies for multiple periods with the probabilities was calculated with the BSM model with the help of the proposed system. The objective of the simulation is to calculate losses for the bankruptcy of suppliers. The simulation helps to test whether the risk management model can reduce the variability of losses and whether the estimated insurance premium can cover all the damages. Ten simulations are performed for each risk pool of 5, 10, 50, and 100 to verify the results. An estimated expected loss and variance for each risk pool are calculated.
In
Table 4, the probability that no company goes bankrupt for the pooling arrangement of 10 companies is 90%, while the probability that only one company goes out of business is 9.6%. The same table also shows that the probability that five or more companies go bankrupt is close to zero. It is interesting to notice that the probability of no bankruptcy is the highest for all arrangements. As the risk of the variability of losses decreases with the number of sold policies, insurance companies can have a high level of certainty that they will be able to profit from these contracts. In contrast, the insured companies would be able to benefit by hedging the risk of bankruptcy of suppliers.
4.7. Managing Business Integrity
The BIMA framework allows all the analysts, investors, and stakeholders to acknowledge the work they have proposed and done carefully. Since all transactions are transparent, all of them will be informed about the significance of integrity to ensure the investment they have made can be monitored carefully and fulfill compliance. All the simulations presented in
Section 5 allow the decision-makers of the regulatory bodies to see clearly whether the investments are subject to compliance. As explained in
Figure 3 of
Section 2, the BIMA framework works for three layers:
Top layer: Information, policy, and process integrity
Middle layer: Architecture
Bottom layer: Big data processing and analysis services
All the work in these three layers has been closely connected together. For example, results in the bottom layer presented in
Section 5 can send to the top layer presented in
Section 2 to allow the stakeholders to double-check whether such investments are relevant and profit-making in the long term based on the real-time simulation results. All the trading activities can be monitored in real time to ensure that no market speculation, rogue trading, and misspelling can take place without further meeting compliance. Architecture plays the middle layer to connect all services, data, and activities altogether to provide a reliable platform for everyone involved. The interconnectivity and collaborative events in the BIMA framework can capture and integrate information integrity, policy integrity, and process integrity altogether. The aim is to ensure all the trading, transactions, and sales activities in financialization have followed guidelines and simulation results recommended by the framework.
4.8. Summary of Discussion
The BIMA framework is a conceptual, architectural, and software-as-a-service framework.
Section 2.3 and
Section 4 describe our methodology and how we validate our framework through the use of MCS, Black Scholes Model (BSM), the Heston model, and analytics for different types of risk analysis. Examples also include bankruptcy risk, high-frequency risk simulations, LIBOR, and real-world bankruptcy risk analysis. In summary, our research contributions include the development of the BIMA framework with the six major functions for financial cloud analytics relevant for this call, as follows:
Innovative applications of emerging information technologies for disaster response operations: Our BIMA framework uses sophisticated financial clouds that integrate financial models and algorithms well. Different examples were demonstrated to validate their accuracy and effectiveness.
Risk modeling and analytics for humanitarian operations: Although our work is not the typical humanitarian work, we provide not-for-profit services to help identify errors and risk for research purposes. This is considered a new type of humanitarian work by helping others to see the risk through, avoid their loss, and reduce their impacts.
System of systems approaches for operations risk analysis: Our work provides robust models and systems to perform operational risk and in-depth analysis.
Improving social welfare by safety and risk-related data-driven analytics: The destruction of the social welfare system due to the financial crisis in 2008 can have its impacts reduced through the use of our BIMA framework, since we balance integrity with performance and profits.
Our limitations are as follows. First, there are only six significant functions demonstrated in this paper due to the restricted length. Second, some businesses do not use any of these models for financial analysis, risk management, and forecasting. A possible reason is that they have models for domain-specific problems, such as Support Vector Machine (SVM), for analyzing risk in engineering. Third, it imposes the use of the mathematical models integrated into the framework and that the social effects (behavioral aspects) are not consistently included in the research methodology. On the other hand, real cases have been tested at the University of Southampton and anonymous participating firms since the previous work [
59]. Through robust simulations, experiments, and tests, we can validate the framework as resilient and suitable for financial practices.
5. Conclusions
This paper presented the BIMA framework as advanced research and analytical output based on business analytics to provide research contributions for ESPR. The paper explained the motivation, the architecture, and the models associated with the framework. A solution-based approach was presented for financialization analytics, in which our detailed results and analysis using the BIMA framework were demonstrated. There was a need for the framework to align with business strategy, business performance, and integrity. The BIMA framework was designed to provide a platform of transparency to perform financial computations for different types of investment, risk modeling, and large-scale simulations of asset pricing, LIBOR interest rates, and speculation detection. Results were not only transparent to the investors but also permitted policymakers and stakeholders to be aware of market trends, prices, risks, and any unexpected events in real time. We demonstrated different ways to measure and analyze risk for ESPR. The main contribution of the proposed framework was as follows.
First, the framework had the integration of multiple mathematical models used for financial risk management applications. Second, its SOA architecture also allowed this framework to be integrated into other commercial platforms or enterprise systems such as ERP, SCM, CRM, and internet-based payment systems. Third, the ability to compliance regulations such as Sarbanes-Oxley (SOX) Ac 2002 was another main contribution. The architecture was presented to illustrate the concepts and core values of the BIMA framework. Big data processing and analysis services were adopted with four integrated services: Monte Carlo simulations, the Black–Scholes–Merton model, the Heston model, and finally, analytics, and visualization. All services were demonstrated by visualization and analytics in detail. Benefits and services included bankruptcy calculation, risk calculation, pooling arrangements calculations for insurance valuation, overnight stress test with high-frequency price simulations, LIBOR rate inspection, and speculation detection. Real cases from the BIMA framework were presented to ensure that banks could always follow guidelines and compliance rather than fiddling around the regulations and involving in activities including misselling, rogue trading, LIBOR scandals, market speculation, and bankruptcy. Our work has made worthy contributions to risk measurement and analysis through data and business analytics, since it could effectively combine integrity and risk analysis altogether with overall business performance, thus contributing to risk research. Our work contributes to real-world recommendations and solutions to the offering of different ways to conduct financial risk analysis in ESPR.
Although the proposed framework has limitations, the architecture of the system allows the integration of more mathematical models that can provide the flexibility to accommodate different types of financial applications. Future research would conduct large-scale stress tests for the platform to find possible problems and make a more robust platform. The integration with payment systems offers the potential to create a more commercial successful framework application, but the test with the most well-known payment systems should be well-addressed.


