1. Introduction
Composite materials with honeycomb sandwich structures can be formed by bonding honeycomb core materials and panels. They are widely used in various fields (including aerospace, railway vehicle construction, and architecture) as they possess several diverse advantages, including high specific strength, favorable shock resistance, and vibration reduction [
1,
2,
3]. Moreover, by changing the honeycomb structure, thickness, and materials used in the panels, the panel’s properties and performance can be tuned as required [
4,
5]. In general, sandwich structures with honeycomb cores are typically more effective than homogeneous panels for sound-transmission reduction applications [
6,
7,
8]. The research mentioned above has shown that composite materials with a honeycomb sandwich structure can improve noise insulation.
Scholars have proposed numerous methods for improving the sound transmission loss (STL) of honeycomb sandwich panels. Ng et al. [
9] found a new material for their honeycomb core that increased damping, and thus improved sound insulation performance at frequencies between 50 and 100 Hz. Arunkumar et al. [
10] found that using a panel made of fiber-reinforced plastic with the honeycomb core provided better vibro-acoustic and transmission loss characteristics due to the high stiffness and inherent damping associated with this material. Kocha [
11] used a honeycomb structure of high stiffness to contain a granular filling, and subsequently found that the filled honeycomb led to lower sound pressure levels compared to empty honeycomb.
Jung et al. [
12] used micro-perforated panels (MPPs) in combination with honeycomb materials and found that their novel structure reduced certain critical frequencies and the overall STL was improved because the MPP provided additional acoustical resistance. Naify et al. [
13] found that attaching gas layers with different acoustic impedance on a honeycomb sandwich panel can produce a substantial increase in STL in the mid-to-high frequency range. Hambric et al. [
14] designed a structure in which the cross-section was split into two thinner honeycomb sandwich subpanels separated by an air gap. They found that the panel, when optimized, improved the STL at critical rotorcraft transmission tonal frequencies.
Some scholars have also attempted to improve the sound absorption performance of certain composite structures by utilizing honeycombs. For example, Yang et al. [
15] found that the absorption of sound by MPPs backing a honeycomb cavity in a small-scale enclosure provided broadband noise control. Xie et al. [
16] designed a microperforated honeycomb metasurface panel (MHMP) and found that MHMP is thinner and has better sound absorption than MPP at the same peak frequency of sound absorption. Then, Xie et al. [
17] designed a composite structure formed by filling honeycomb with polyester fiber, and their results showed that the composite structure is better sound absorption than polyester fiber of the same thickness.
By combining different concepts (additional layers, structural resonators, multi-material etc.), the acoustic insulation of some structures can be improved. Shankar et al. [
18] mounted air, nitrogen, argon, and helium barrier layers on honeycomb sandwich panels and found that the STL of the structure was substantially improved by the addition of a helium barrier layer. Yang et al. [
19] found that a glass fiber-filled honeycomb sandwich panel improved STLs at all frequencies tested and that the STL could be further improved by increasing the fiber content. Song et al. [
20] found that the STL of a honeycomb sandwich plate is significantly increased by attaching a stop band.
Nomex honeycomb is a nonmetallic biomimetic core material that is light in weight and has high strength. It is produced by immersing aramid fibers in phenolic resin solution. Compared with honeycomb sandwich panels made from aluminium, Nomex honeycomb sandwich panels are lighter and have a higher strength—mass ratio. Nomex honeycomb sandwich panels also possess other advantages including resistance to aging, flame retardancy, and heat insulation; they can also improve the acoustic performance of structures at and below resonance [
21]. Therefore, numerous investigations have been made to improve the acoustic performance of Nomex honeycomb sandwich panels.
Huang et al. [
21] found that the noise transmitted through a light-weight panel can be reduced by attaching a Nomex honeycomb, and that a honeycomb sandwich panel used as a double-layered core gives a much greater STL than that based on a single-layered core. Shankar et al. [
22,
23] analyzed the influence of different panel design parameters on the sound transmission loss of honeycomb sandwich panels using a reverberant source room and an anechoic receiver room. They found that core density influences STL above the coincidence frequency, but other parameters like cell size and skin type show negligible effects. Moreover, Kevlar core has much higher stiffness than Nomex core, and hence it can be expected to result in poorer acoustical performance than Nomex core.
Additionally, a few scholars have explored the effect of varying the structural parameters of the honeycomb sandwich panel on STL. Arunkumar et al. [
10] found that varying the thickness of the face sheet has a significant effect on the panel’s vibration and sound radiation characteristics, but the vibration and acoustic response are not sensitive to cell size. Zergoune et al. [
24] found that the cell angle of the honeycomb core had no effect on STL, but increasing the panel thickness lead to a significant improvement in STL in the mid-frequency range. Wang et al. [
25] found that increasing the face sheet thickness can lead to an improvement in STL, both below and above the coincidence frequency. Griese et al. [
26] found that honeycomb sandwich panels have an increased number of resonances in the 1–1000 Hz range, but there is greater sound pressure transmission loss between these resonant frequencies. It is thus apparent that changing various structural parameters of the honeycomb sandwich panels can, on the whole, affect the sound insulation performance and local frequency bands of the panel to different degrees.
The abovementioned research indicates that the honeycomb sandwich structure can achieve better acoustic insulation by combining different concepts [
18,
19,
20,
21] and changing the various dimension parameters of the structures can have a large influence on their sound insulation performance. Nevertheless, reverberation room testing is a more expensive and time-consuming experiment. For the impedance tube test, the small sample size makes it difficult to make general conclusions about the sound insulation of that structure [
27]. But impedance tube measurement samples are small, with low cost. They are suitable for the initial stage of material design, and the test can study the effects of the dimension parameters on STL in the structure. However, whether the influence rule studied by the impedance tube test is consistent with the rule of the actual panel is yet to be investigated.
In this study, Nomex honeycomb sandwich structures were tested using an impedance tube to determine their STL values. The results were used to explore the effect of changing the size of the honeycomb cells, panel thickness, and thickness of the honeycomb core on the acoustic performance of the Nomex honeycomb sandwich structures. Both single- and double-layered structures were employed. In addition, the acoustic boundary element method (BEM) and finite element method (FEM) with the scattering matrix method were employed to simulate the STL performance of the materials in the impedance tube tests. The simulation methods and ideas are hoped to help others to improve simulation accuracy of the STL of the honeycomb sandwich core material tested by impedance tube. The research and results are to verify whether the influence law of the structure dimension parameters on the STL tested by the impedance tube is similar to that of the actual large panel, and provide a reference for the application of the impedance tube test method in the structure noise reduction design.
3. Experiments and Simulations
3.1. Materials
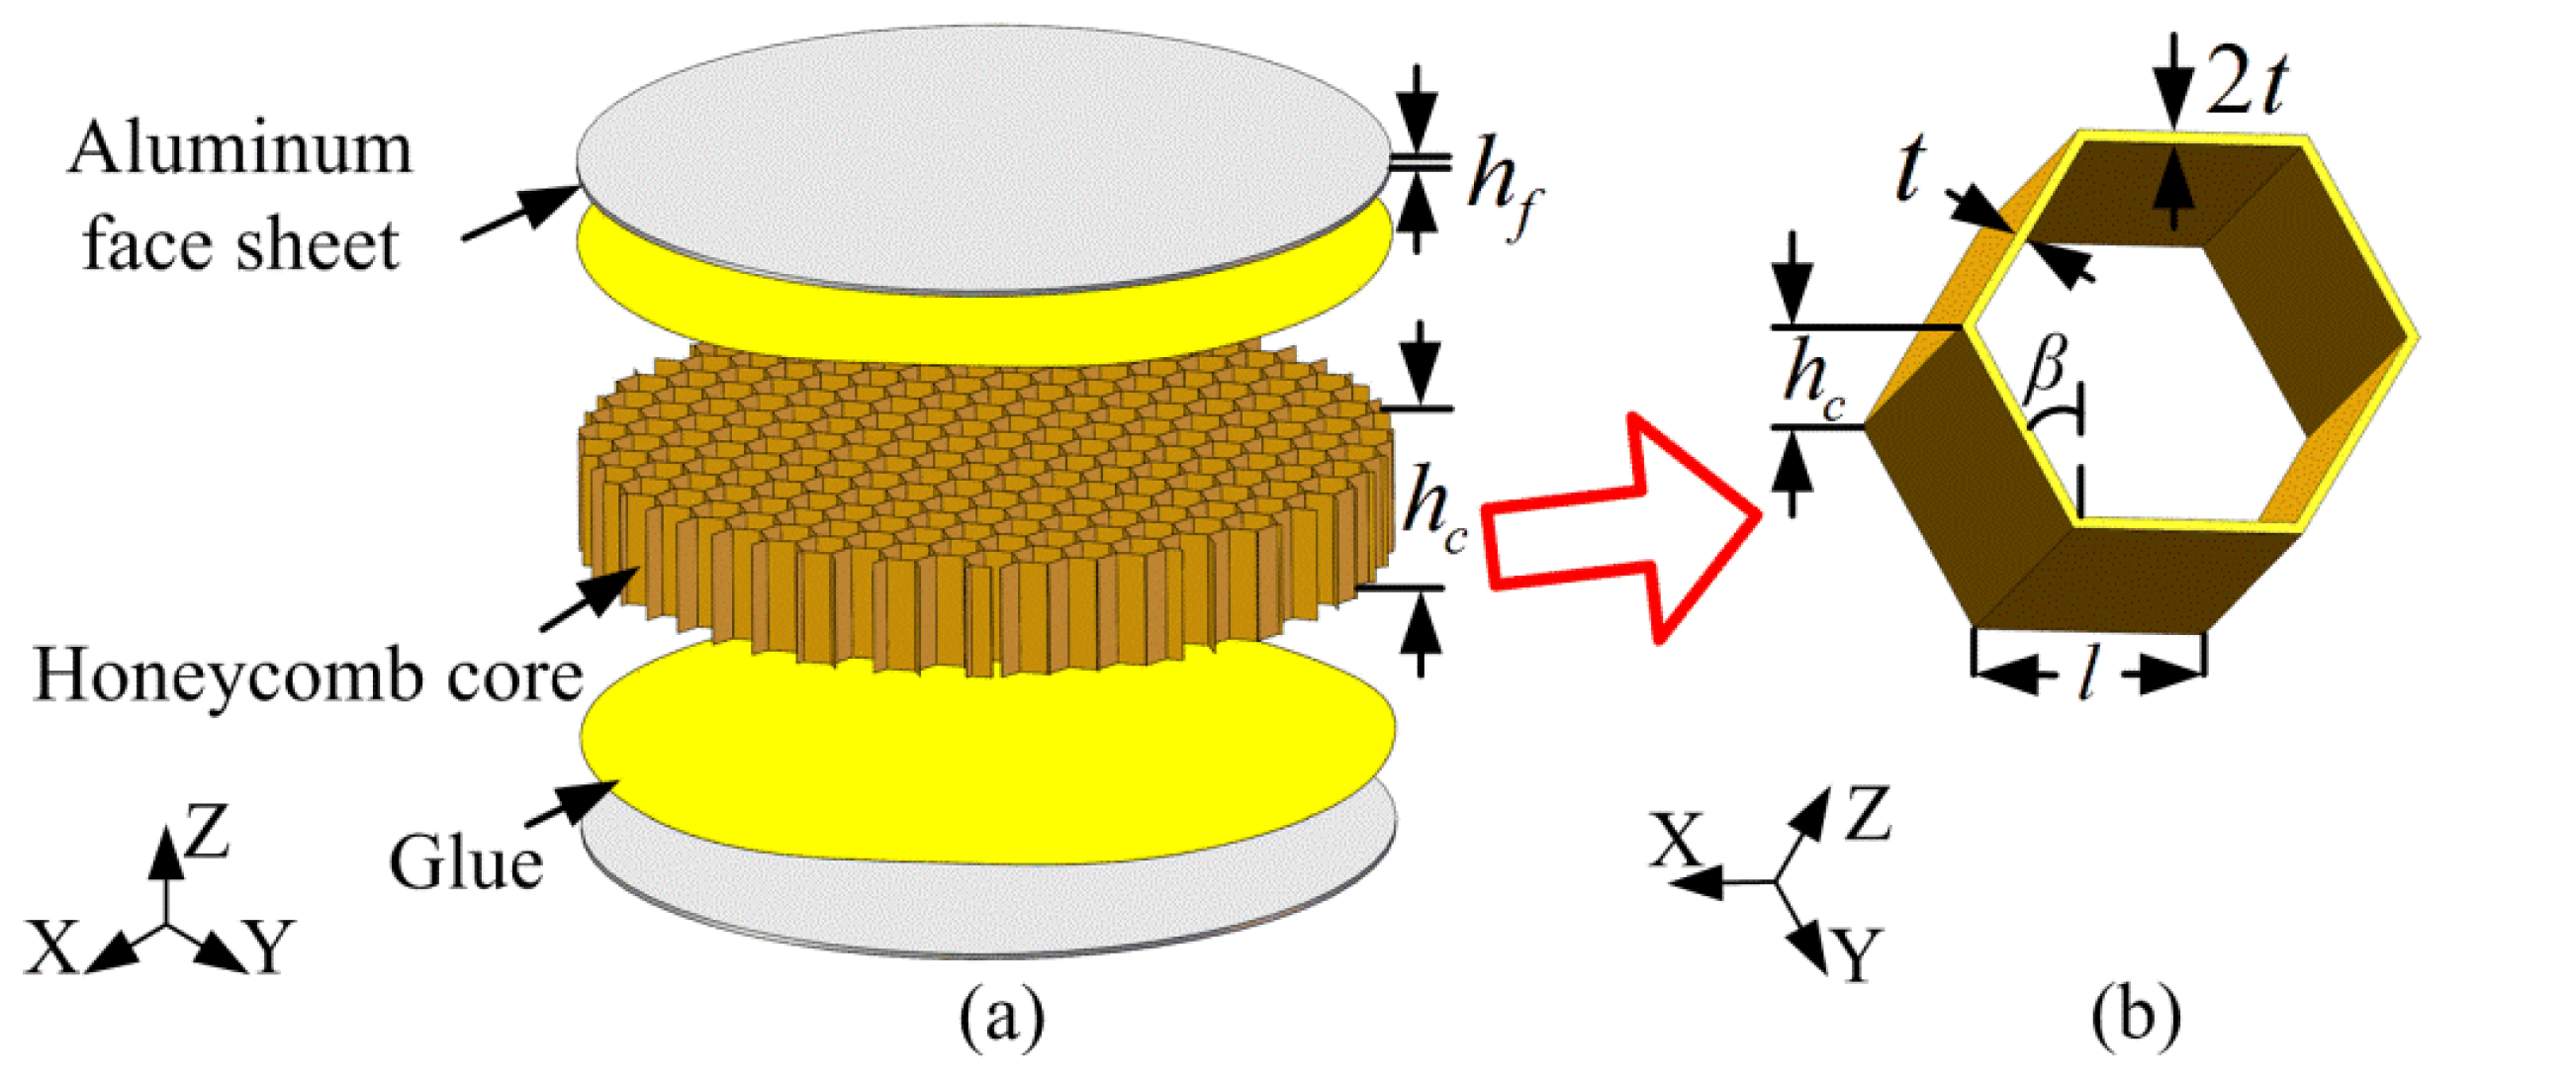
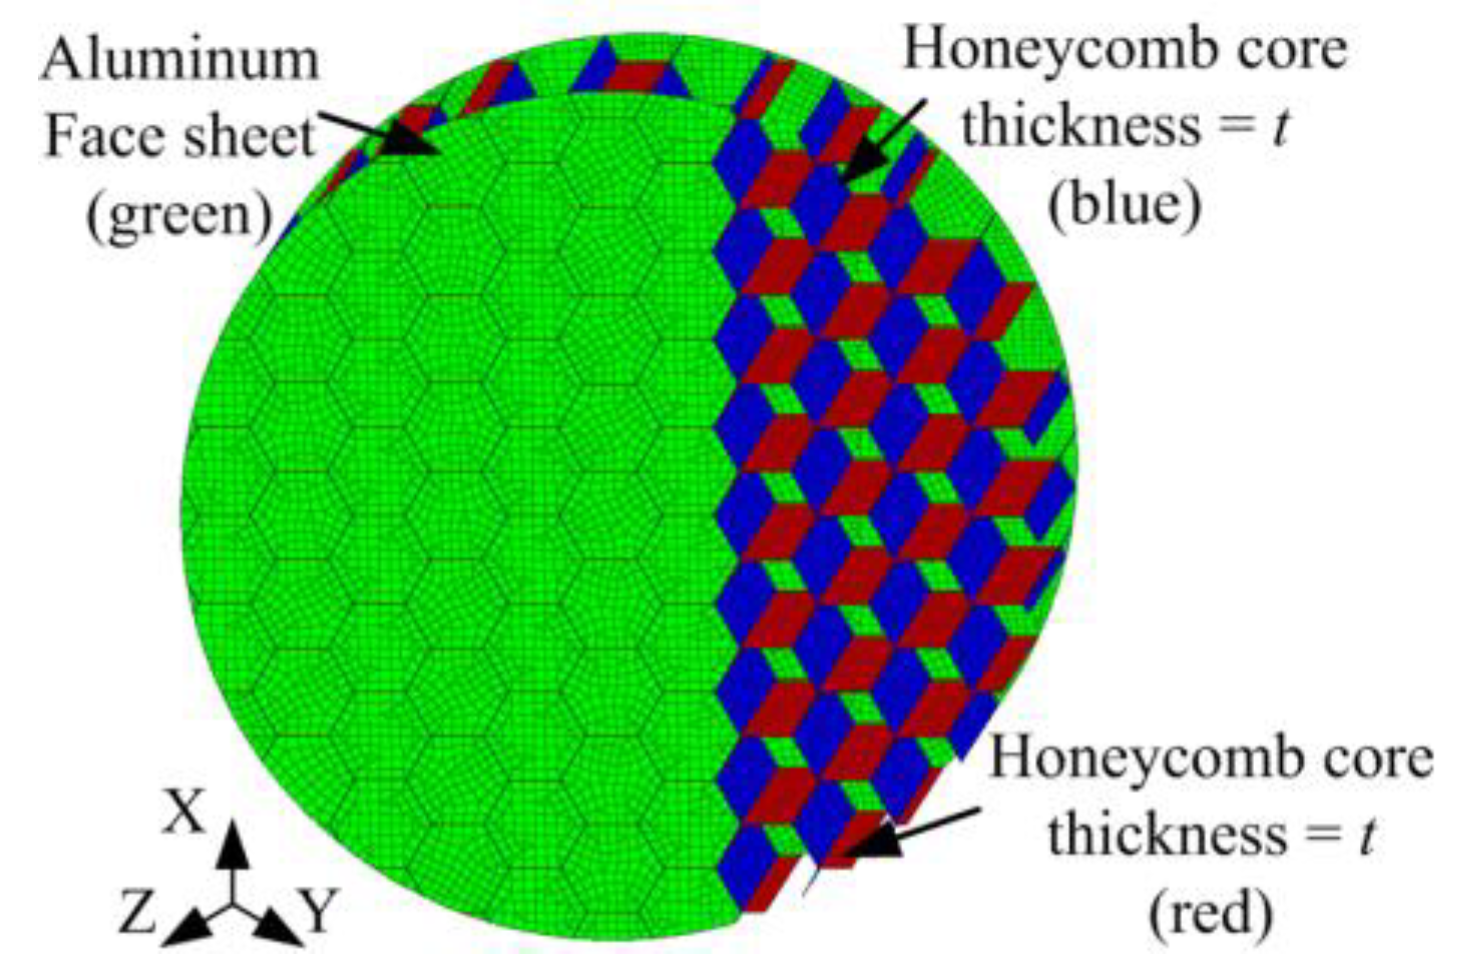
Figure 3 illustrates the structure of a typical Nomex honeycomb sandwich structure (diameter = 30 mm). As shown in
Figure 3a, Nomex honeycomb sandwich structures are composed of three layers: two face sheets and the honeycomb core. The two face sheets were glued to the sides of the honeycomb core using a modified acrylate adhesive. The face sheets in the sandwich were constructed from 6061 aluminium alloy plate (with a density of 2700 kg/m
3, Poisson’s ratio of 0.33, and thickness of
hf).
The honeycomb cells in the core have a regular hexagonal structure and are made of very thin Nomex paper, as shown in
Figure 3b. The static mass density of the honeycomb structure corresponds to
ρe = 48 kg/m
3, the density of Nomex paper is 1100 kg/m
3, and the Poisson’s ratio is 0.33. The parameters describing the dimensions of the honeycomb cells are the thickness of the wall
t = 0.07 mm, the wall angle (
β = 30°), and the length of the sides of the cells (
l). The symbol
hc is used to denote the thickness of the honeycomb core.
Four basic groups of specimen structures were used in the experiments. Overall, there were honeycomb cells with two different specifications, structures with face sheets of different thickness, structures with cores of different thickness, and single- and double-layered honeycomb sandwich structures. The parameters and types of the structures used are shown in more detail in
Figure 3 and
Table 1.
Where D2 is a double-layer Nomex honeycomb sandwich panel formed by stacking two honeycomb sandwich panels of 20 mm thickness, with an aluminium panel of 1 mm thickness in the middle.
3.2. Test Methods
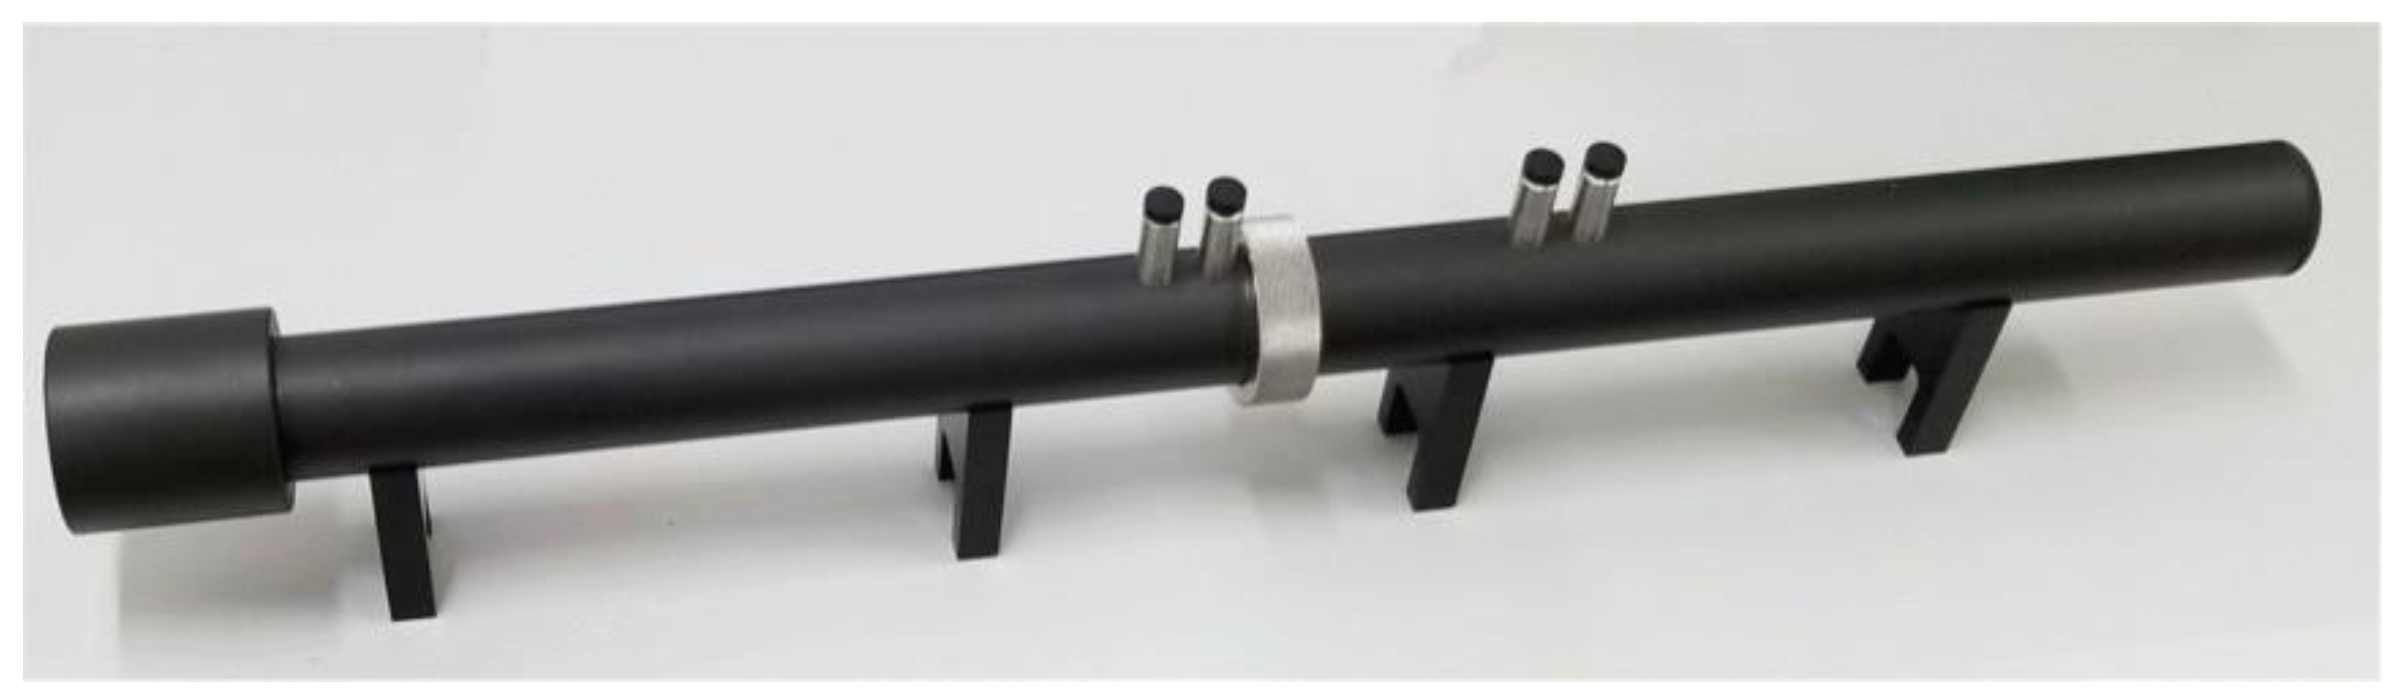
The STL values of the structures were measured using an impedance tube of 30 mm diameter (according to standards outlined in the document ASTM E2611-09).
Figure 4 shows a photograph of the impedance tube used (model ZT13, SKC Acoustics Technology Co., Ltd., Beijing, China) which covers the frequency band 1.6–6.3 kHz. Each sample must be sealed tightly and flexibly in the tube for testing, as the presence of gaps around the edge of a sample can greatly affect the resulting STL values obtained [
31]. In our experiments, therefore, samples were fixed in position using Teflon tape, in order to avoid sound leaking around the sample via surrounding cracks or gaps. Considering that the seals around the samples can have a significant effect on the test results, three separate samples were prepared for each specimen test, in order to check the reproducibility of the procedure and thus guarantee the accuracy of the final test result. In addition, in order to verify that the samples were properly sealed and the tubes were seamless, each sample was subjected to the same test twice.
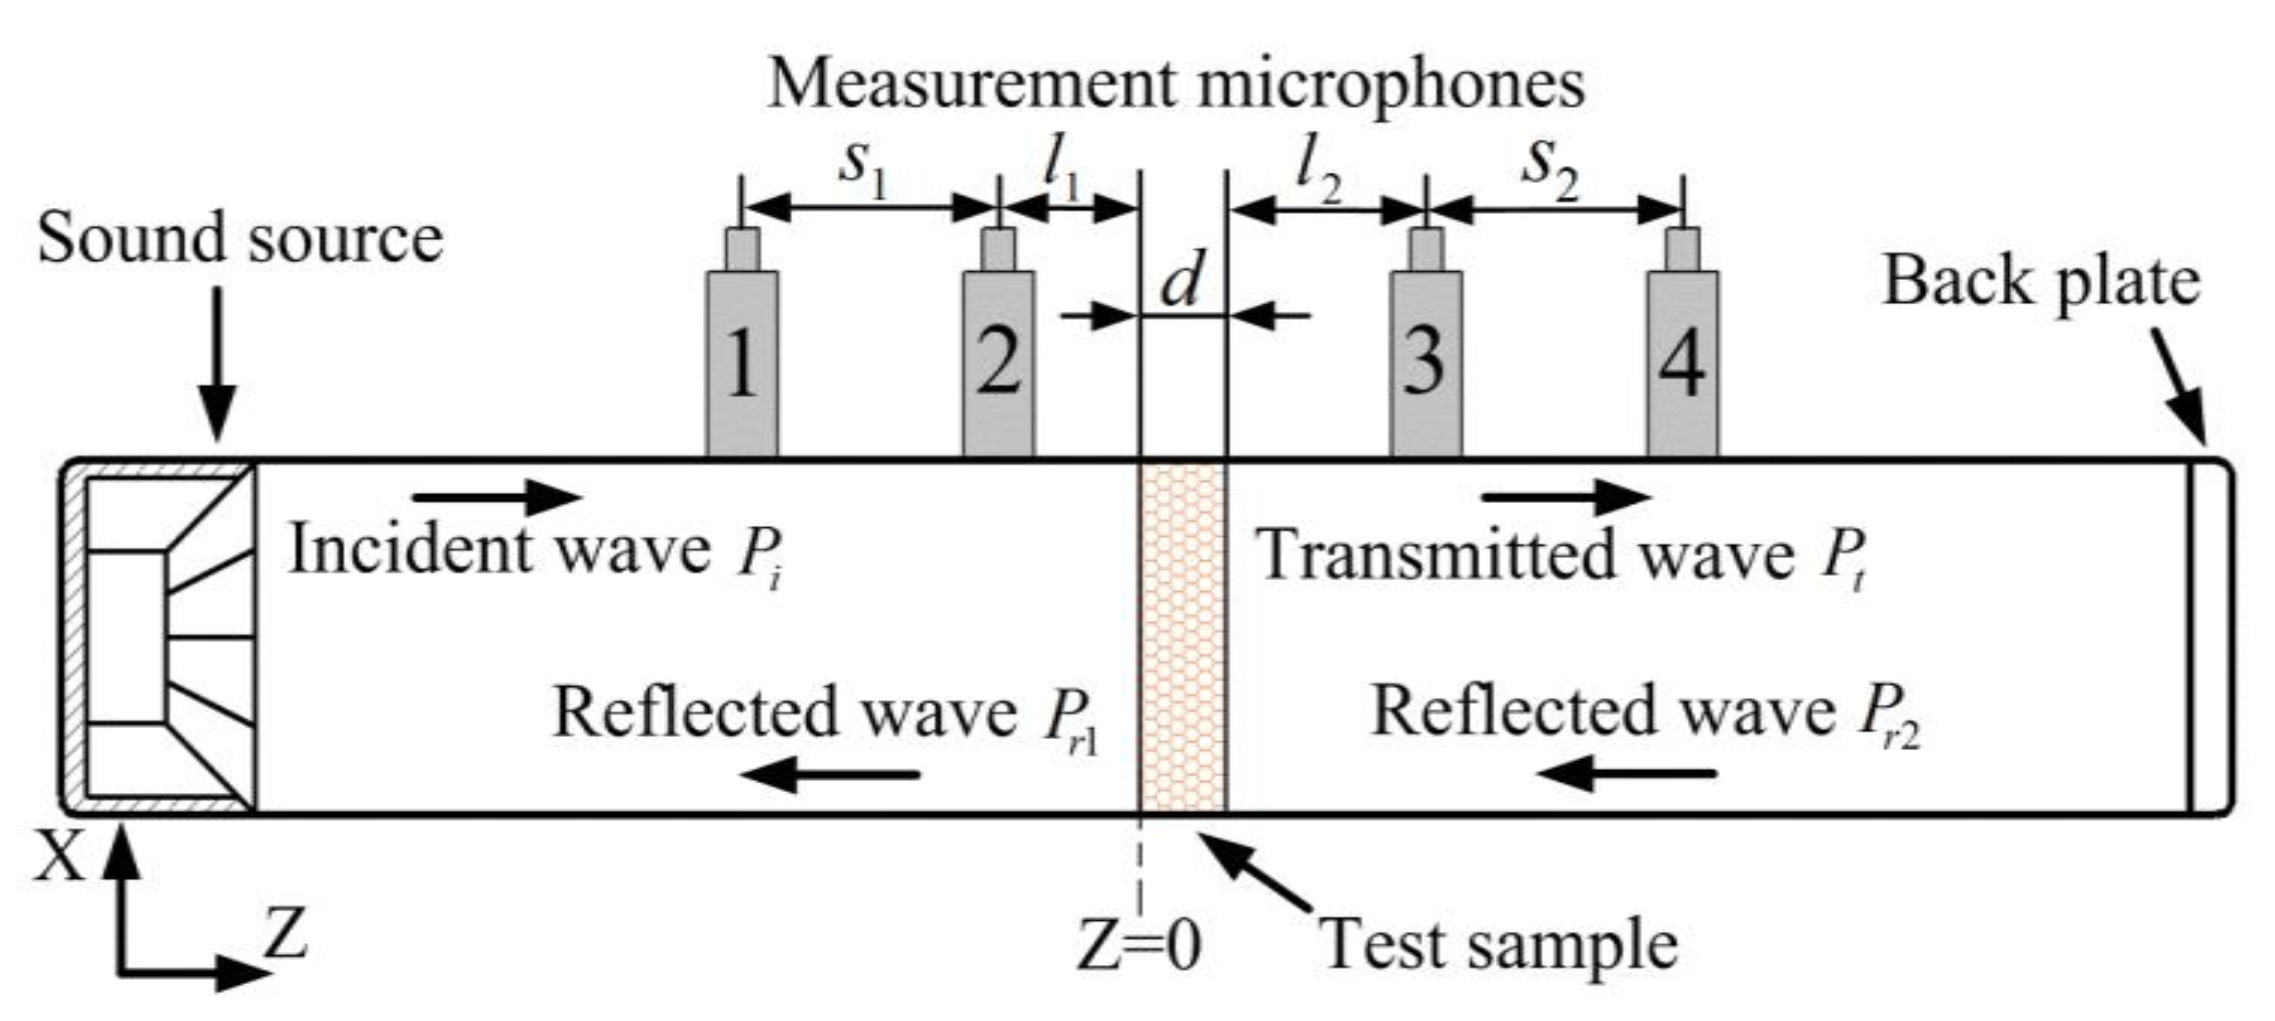
When measuring the STL of a sample using the impedance tube, it is necessary to decompose the steady-state broadband signal into incident and reflected waves in front of the specimen (i.e., in the tube containing the sound source). A similar decomposition, into transmitted and reflected waves, must be performed at the other end of the apparatus (i.e., in the receiving tube), as in
Figure 5.
The sound source generates an acoustic signal, which propagates inside the tube as plane waves. The acoustic pressure produced by these plane waves are measured using the four microphones mounted in the wall of the impedance tube. As shown in
Section 2, when the sound waves (
Pi) generated by the sound source impinge onto the surface of the specimen, a portion of the sound (
Pr1) is reflected. The remaining portion (
Pt) is transmitted to the other side and propagates within the receiving tube. In practical conditions, the sound-absorption end cannot completely absorb the acoustic wave energy. Therefore, a portion of the transmitted wave (
Pt) is reflected.
It is supposed that only plane waves propagate in the impedance tube shown in
Figure 4, so that the acoustic pressure in the sound-source tube can be expressed as:
Similarly, the acoustic pressure in the receiving tube is expressed as:
The amplitudes of the acoustic pressures
Pi,
Pr1,
Pt, and
Pr2 in the tube shown in
Figure 4 can be obtained by simultaneously solving Equations (5) and (6) in terms of the acoustic pressures
p1–
p4 measured in the impedance tube by the four microphones (1–4), giving:
We further suppose there is a linear relationship among the amplitudes
Pi,
Pr1,
Pt, and
Pr2, which can be expressed in the form:
where
T denotes the scattering matrix of the test sample:
where
t11,
t12,
t21, and
t22 are the unknowns and represent the linear relationship between
Pi,
Pr1, and
Pt,
Pr2. They can be obtained by solving Equation (11) in terms of Equations (7)–(10).
As can be seen in Equations (3) and (4), the STL value can be calculated by finding the ratio of the amplitudes of the transmitted acoustic pressure in the receiving tube and the incident acoustic pressure in the sound-source tube. If one attempts to solve Equation (11), however, it is generally found that no solution can be obtained based on results from a single experiment. This is because the reflected acoustic waves in the receiving tube will penetrate the specimen and return to the sound-source tube. In order to overcome this problem, it is necessary to carry out two experiments using the same specimen, but two different acoustic ends.
Theoretically, any two ends could be used but, generally speaking, the greater the difference in the acoustic properties of the two different ends that are used, the better the effect. At present, this kind of ‘double-load’ measurement technique is the one mainly used when measuring the STL values of materials using an impedance tube.
The double-load method requires two kinds of boundary condition to be set at the tail end of the tube (e.g., condition ‘
a’ might correspond to having a back plate in position, and condition ‘
b’ to having no back plate). Under such circumstances, the expressions generated using Equation (11) for the two experiments can be combined into a single equation of the form:
Using Equation (13), the scattering matrix (
T) of the test material can now be obtained. Under ideal conditions, if no reflected waves appear from the tail end of the receiving tube (i.e.,
Pr2 = 0), the transmission coefficient,
τ(
ω), of the acoustic pressure is equal to the
t11 component of
T in Equation (12). However, the scattering matrix of a sample does not change with the test conditions, and therefore the STL of the material can be found using Equation (4):
3.3. Simulation Methods
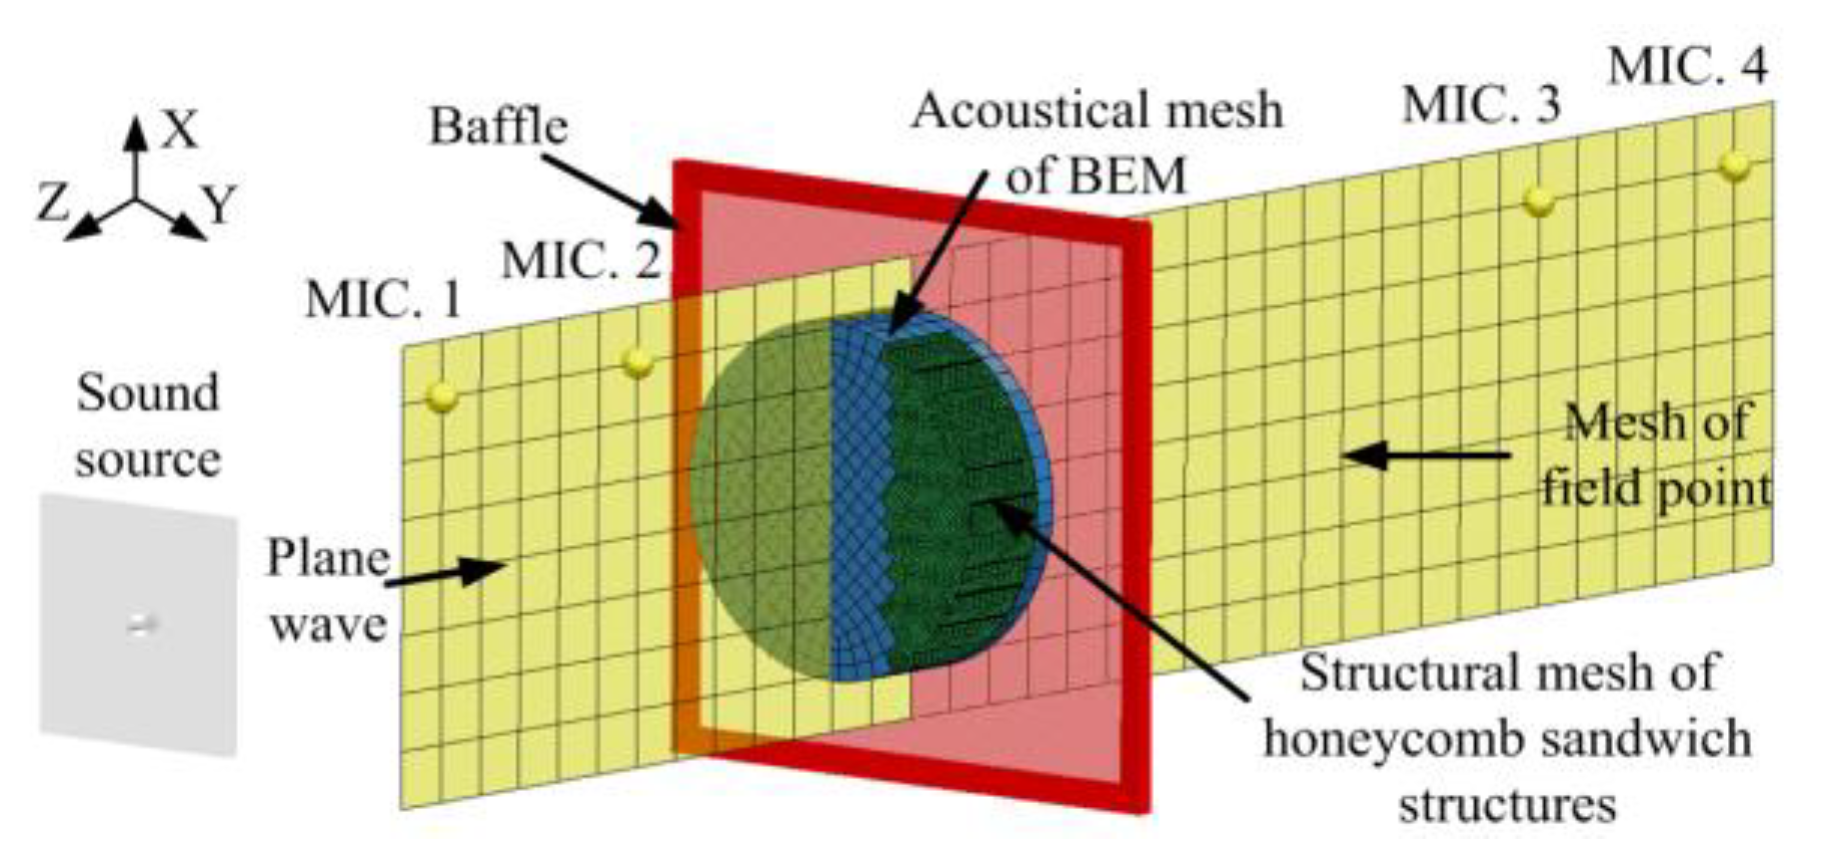
For this paper, the BEM and FEM were used to simulate the test results, and to attempt to simulate the actual situation of the test. The simulation methods and ideas are hoped to provide references for others to more accurately simulate the STL of honeycomb sandwich materials tested with an impedance tube. A finite-element mesh was established for the honeycomb sandwich structure. As shown in
Figure 6, a C
3-type structure can be modeled using three components, all of which are shell elements. Two types of wall were found in the honeycomb core, each of which exhibit the same material properties but with different thicknesses. The model of the honeycomb sandwich panel was 30 mm in diameter, 20 mm in thickness, and the mesh side length was 0.4 mm. The side length of acoustical mesh was 2 mm, which satisfies the calculation requirements (less than 1/6 of the minimum wavelength) of the test frequency (6.3 kHz).
As the honeycomb sandwich structures were complex, the simulations were carried out using an indirect BEM. In the method used, the sound fields inside and outside of the structure were calculated simultaneously, and the effect of the cavity in the honeycomb sandwich structure was also taken into account. Some specific details of the method are shown in
Figure 7.
The sound source generated plane waves on the left side of the diagram, and these were used to simulate the plane waves produced by the sound source in the impedance tube. An acoustical mesh was used to cover the structural mesh of the honeycomb sandwich structure so as to isolate the internal and external sound fields. The sound fields were also divided into two parts by a baffle, which stopped the back sound field of the honeycomb sandwich structure from influencing the front sound field. Four microphones were set in the mesh at the field points corresponding to the experimental locations so that the acoustic pressures at these field locations can be determined. The overlap between the acoustical mesh and baffle was set to be a transparent panel, that is, the transmitted acoustic waves could pass through the baffle at these points.
Using modal-based vibro-acoustic response analysis, the acoustical meshes in front and inside of the honeycomb sandwich panel were set as Coupling Meshes. In practice, the honeycomb core needs to be processed into a circle. Due to the limit of processing accuracy, its actual diameter was slightly smaller than that of the impedance tube. So, the tube wall only constrained the aluminum plate, and the honeycomb core was constrained by the adhesive layer on the aluminum plate and the Teflon tape. Therefore, in the simulation, the edges of the aluminum plate and honeycomb core were constrained.
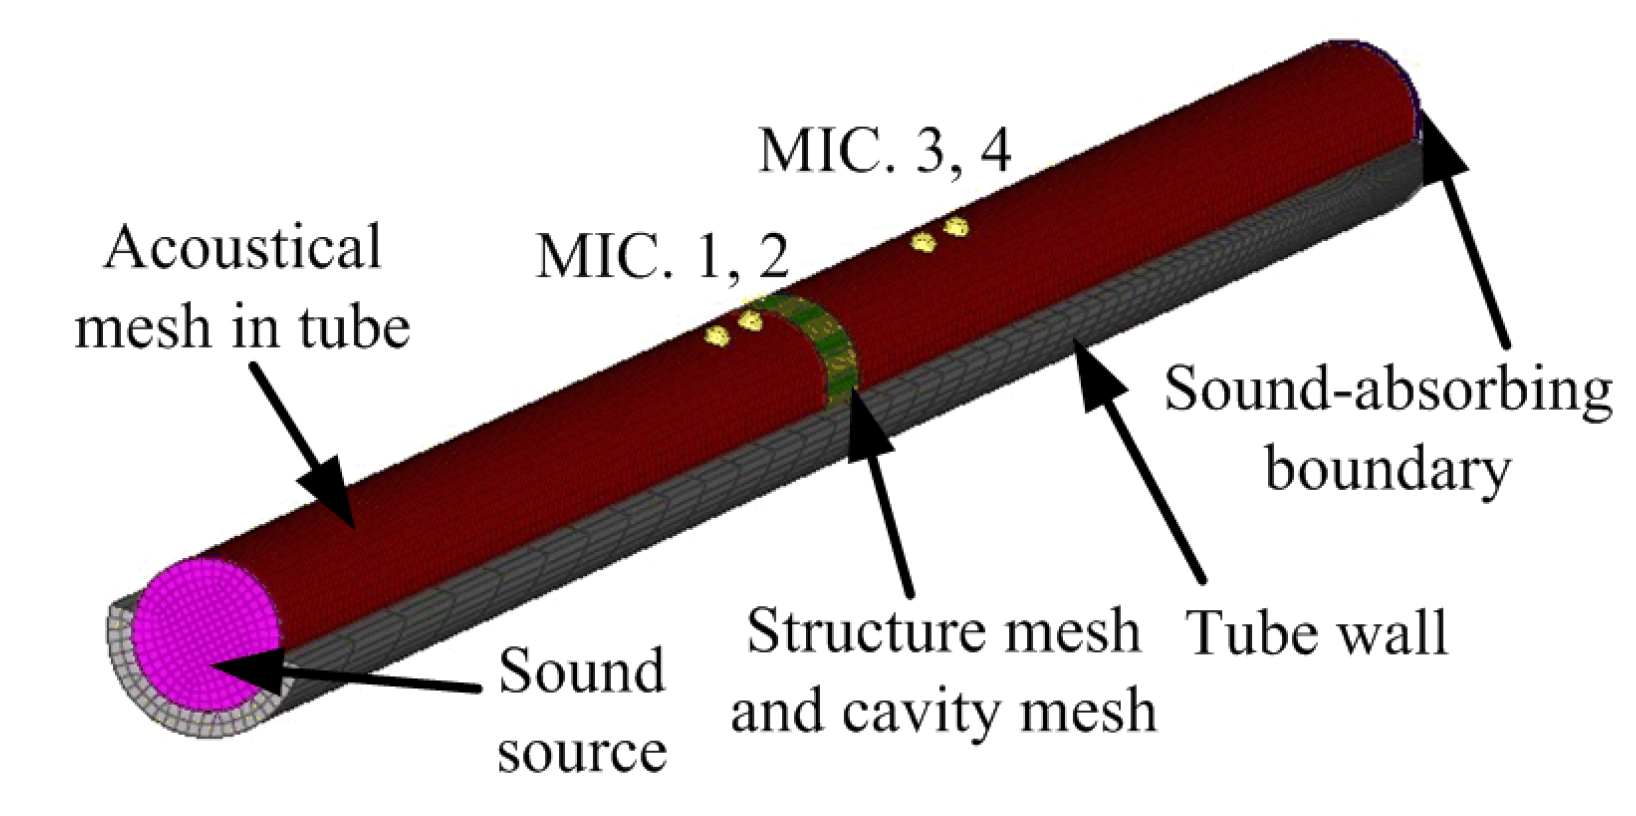
The FEM model is shown in
Figure 8. There is a plane wave sound source on the left, which simulated the plane wave generated by the sound source in the impedance tube. Two acoustic meshes of the air cavity in the impedance tube simulated the propagation of sound waves in the tube, and they were coupled with tube wall and structure mesh. The structural mesh and the cavity acoustic mesh were coupled. The end of the impedance tube was set as a sound-absorbing boundary, and the calculation of STL was the same as the BEM.
The sound field behind the baffle was taken to be infinite, and therefore no reflected waves appeared at the acoustical boundary of the sound field. The transmission coefficients of the honeycomb sandwich structures could then be calculated using Equations (7) and (9), that is:
Finally, the simulated STL value of the honeycomb sandwich structure was calculated using Equation (4) in terms of Equation (15).
4. Results and Discussions
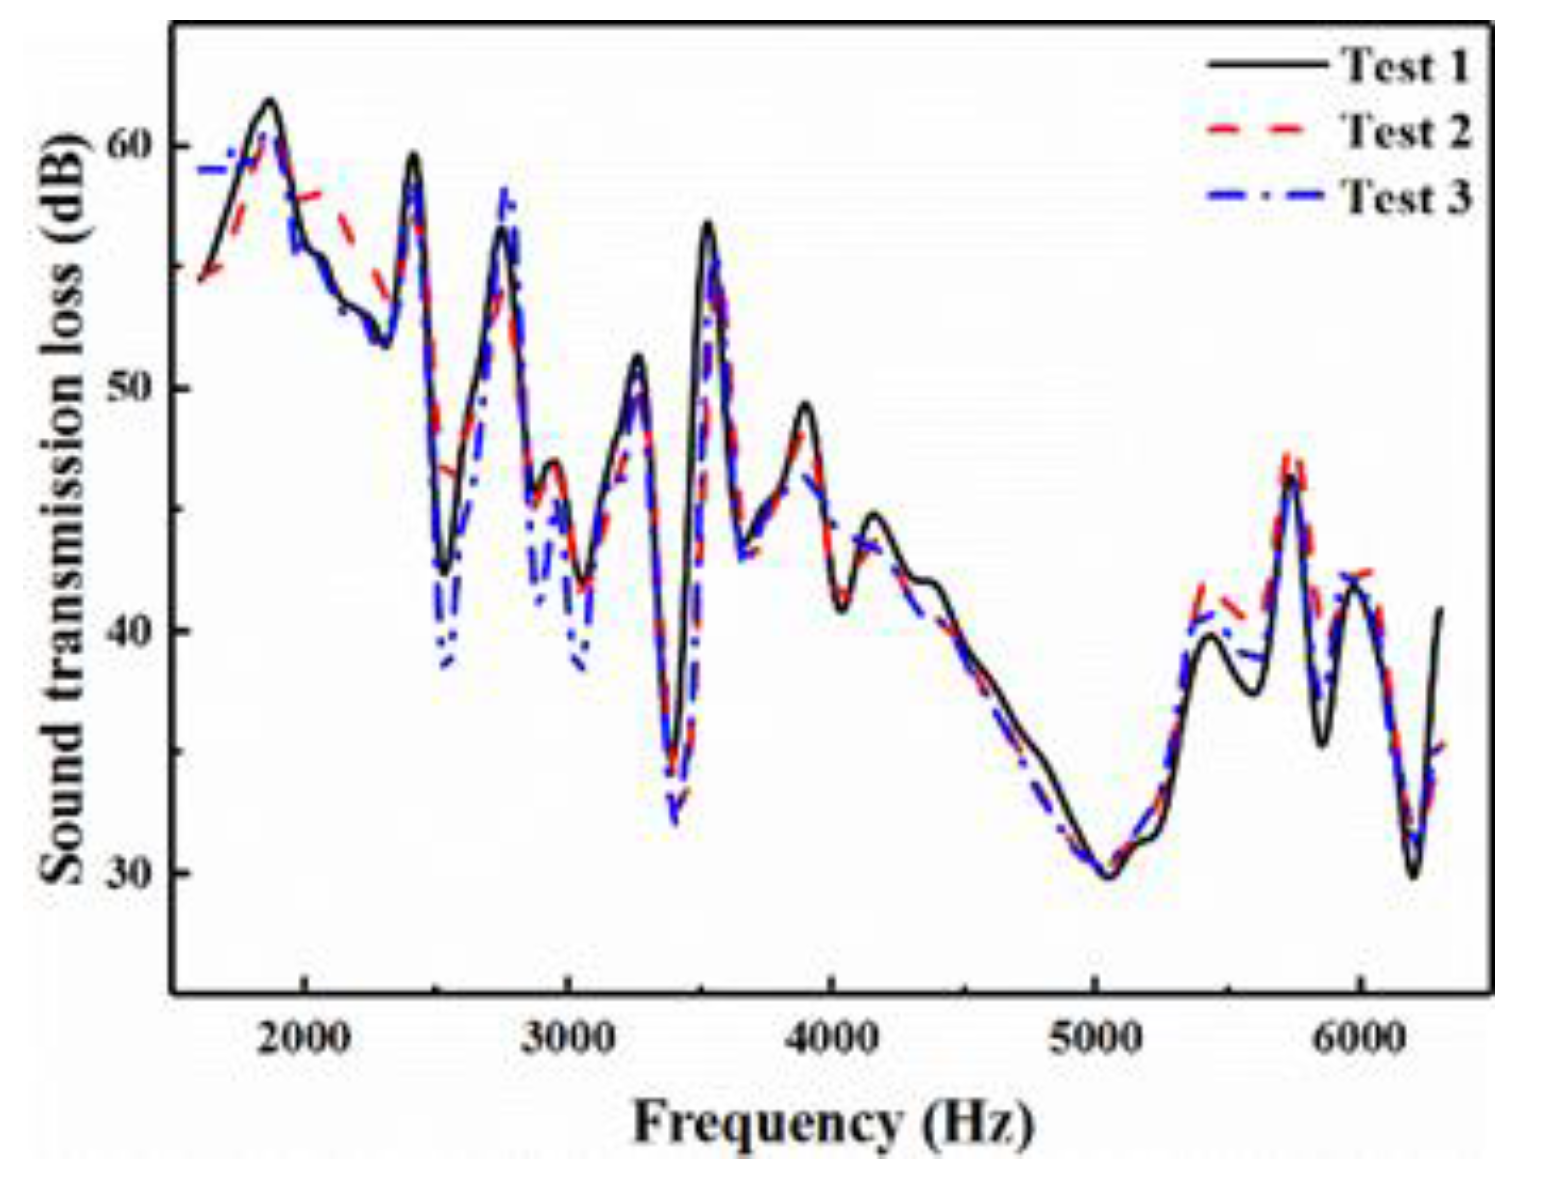
The reproducibility results obtained for an A2-type panel are shown in
Figure 9. It can be seen that the trends observed in the STL curves are essentially consistent between tests. This implies that the specimens and the tube were indeed favorably sealed, and that the test results obtained were experimentally reproducible and reliable.
4.1. Acoustic Performance Using Cores with Cells of Different Size
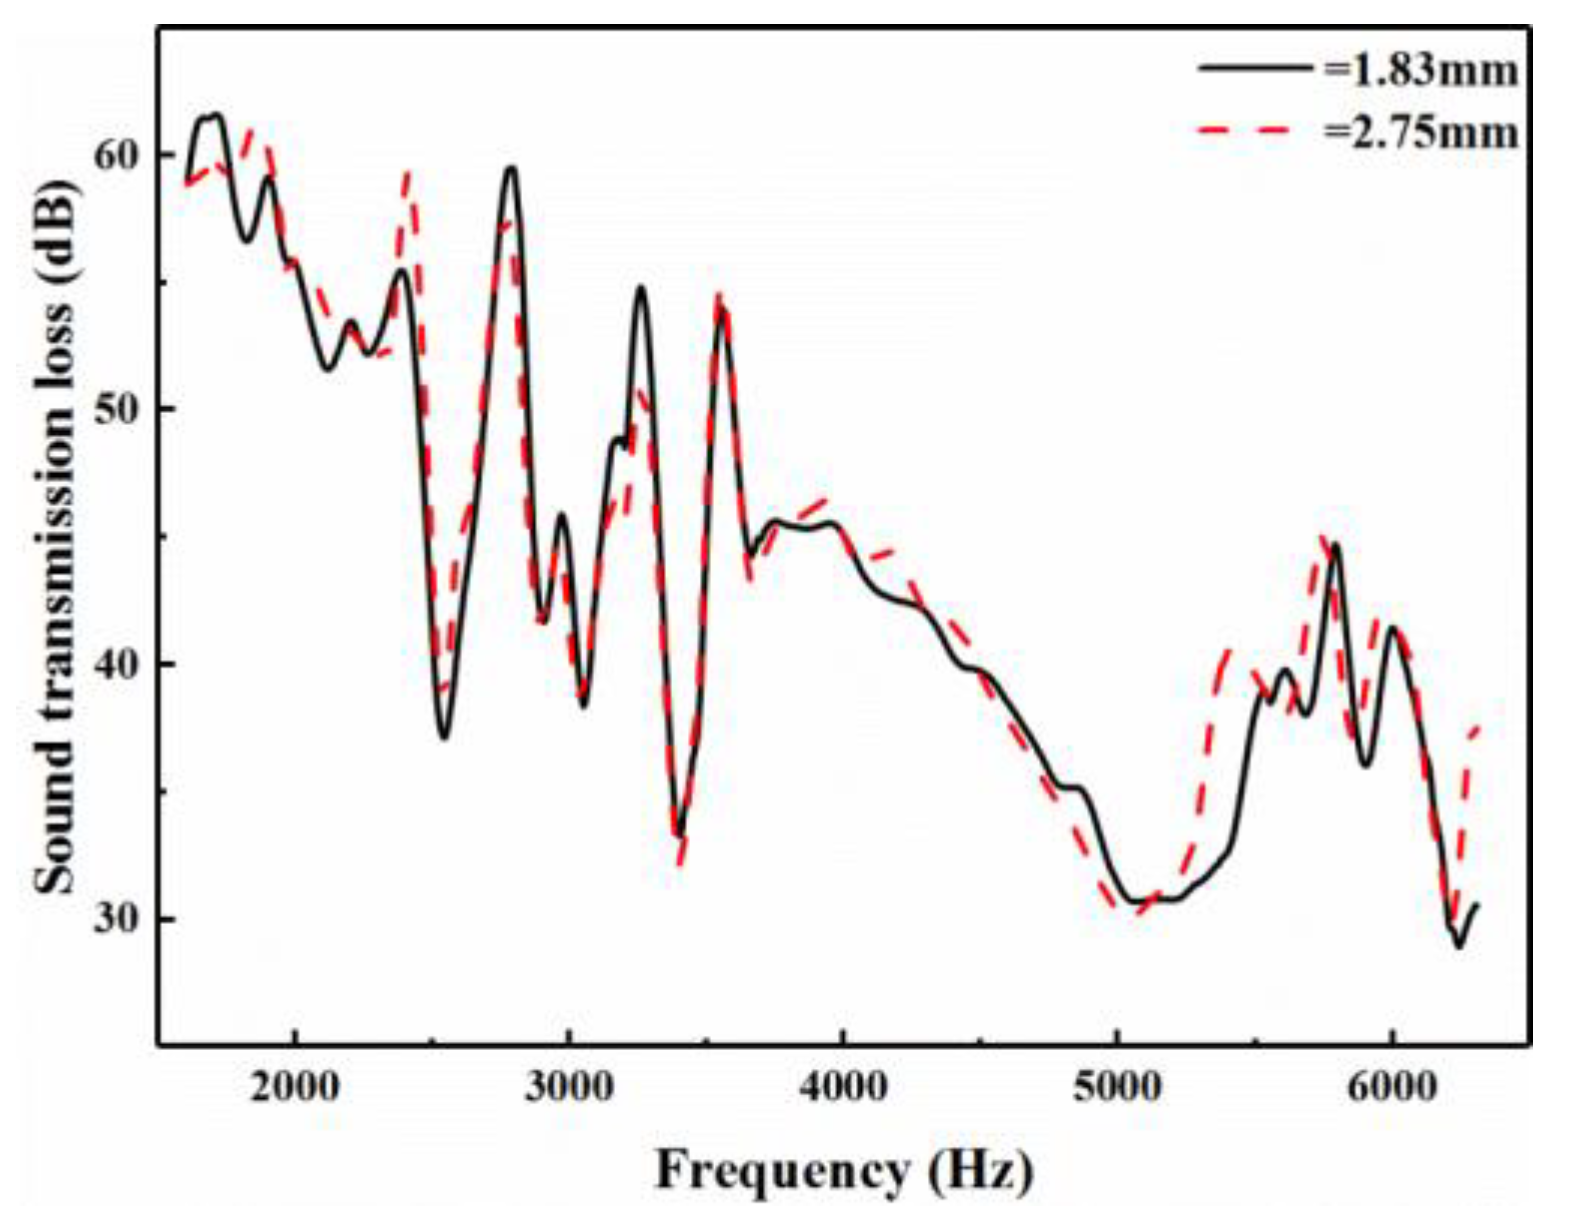
Figure 10 shows STL curves obtained using two Nomex honeycomb sandwich structures with cores made of cells of different sizes (the length of the sides of the cells (
l) was 1.83 mm and 2.75 mm respectively). As can clearly be seen in
Figure 10, the two curves are very similar, which indicates that cell size had an insignificant effect on the STL values of the materials. We note that the equivalent densities of the two honeycomb structures involved were both 48 kg/m
3.
Interestingly, Arunkumar et al. [
32] also carried out similar research. They found that the increase of the length of the sides of the cells reduced the stiffness of the panel. If the length of the sides of the cells was increased, the number of honeycomb core per unit area was reduced. In this situation, since the equivalent area density of the honeycomb core stays the same, the honeycomb core wall will be thicker, and its rigidity will increase. They found that changing the cell size did not significantly affect the natural frequency of the panel, due to the variation in the counterbalance between the stiffness and weight of the panel. As a result, the effect of cell size on the sound radiation characteristics was not significant.
As shown in
Figure 10, the resonance frequency of the small sample was larger than the large sample [
27], and until 5000 Hz, STL was mainly in the stiffness region.
Figure 10 also clearly shows that the STL curve decreased with increasing frequency in the frequency band 1.6–5 kHz, and that the STL curve displays noticeable and characteristic discrete valleys throughout the frequency band 2.5–3.8 kHz. Moreover, a valley and a peak can be seen in the STL curves around 5 kHz and 5.8 kHz, respectively.
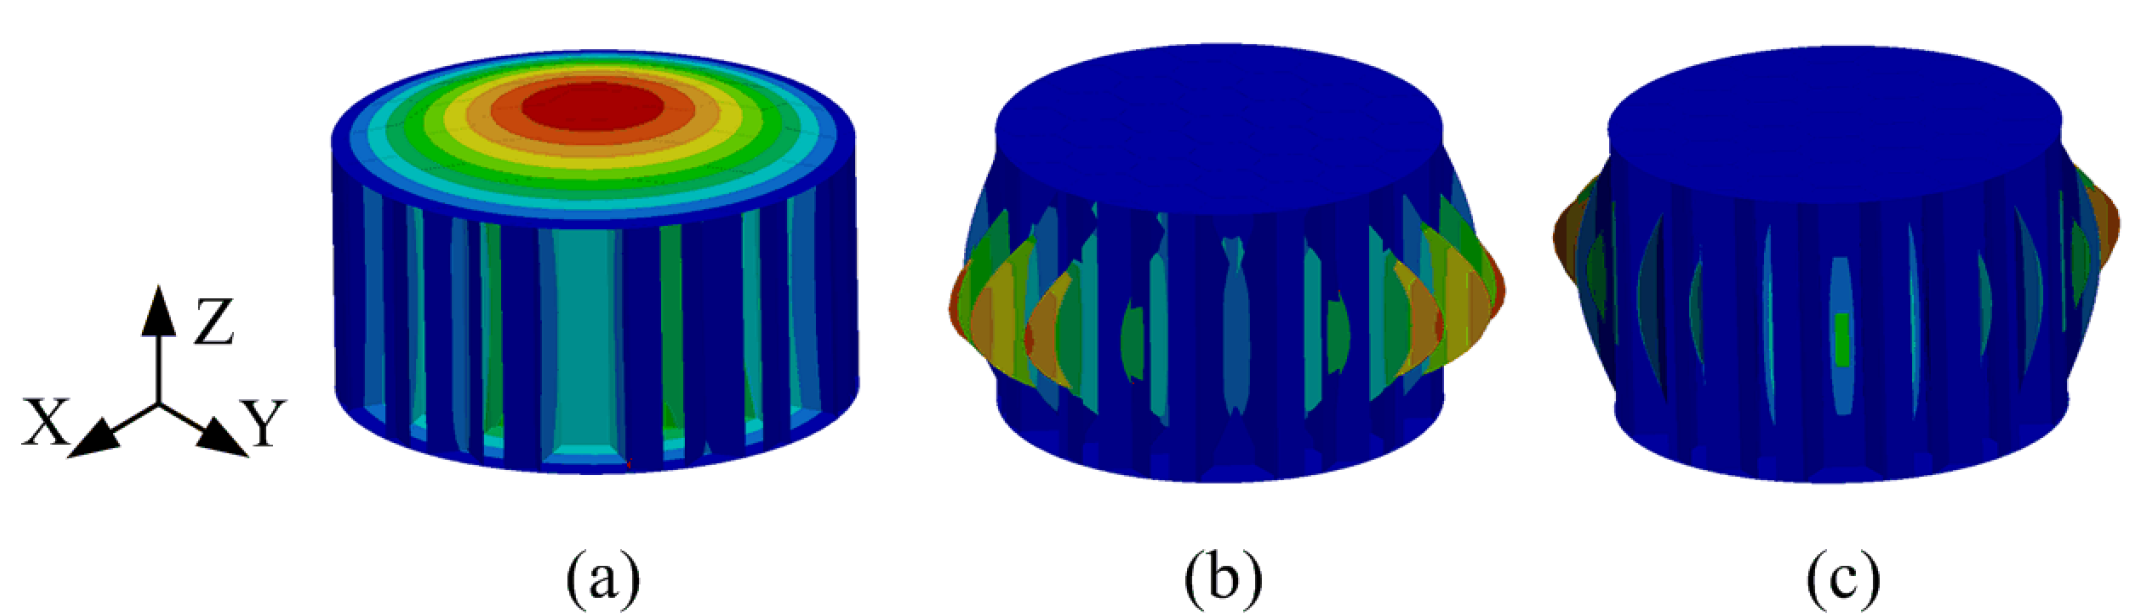
Figure 11 shows the shapes of the modes occurring in the A
2-type panel according to simulations. Considering the frequencies corresponding to the first, it can be seen that the significant valley in the STL curve at 5.1 kHz can be attributed to the vibration of the aluminium face sheet of the panel. The STL curve decreased due to the influence of the structural mode of the panel, and it can justify the statement that the modal region starts at 5.1 kHz.
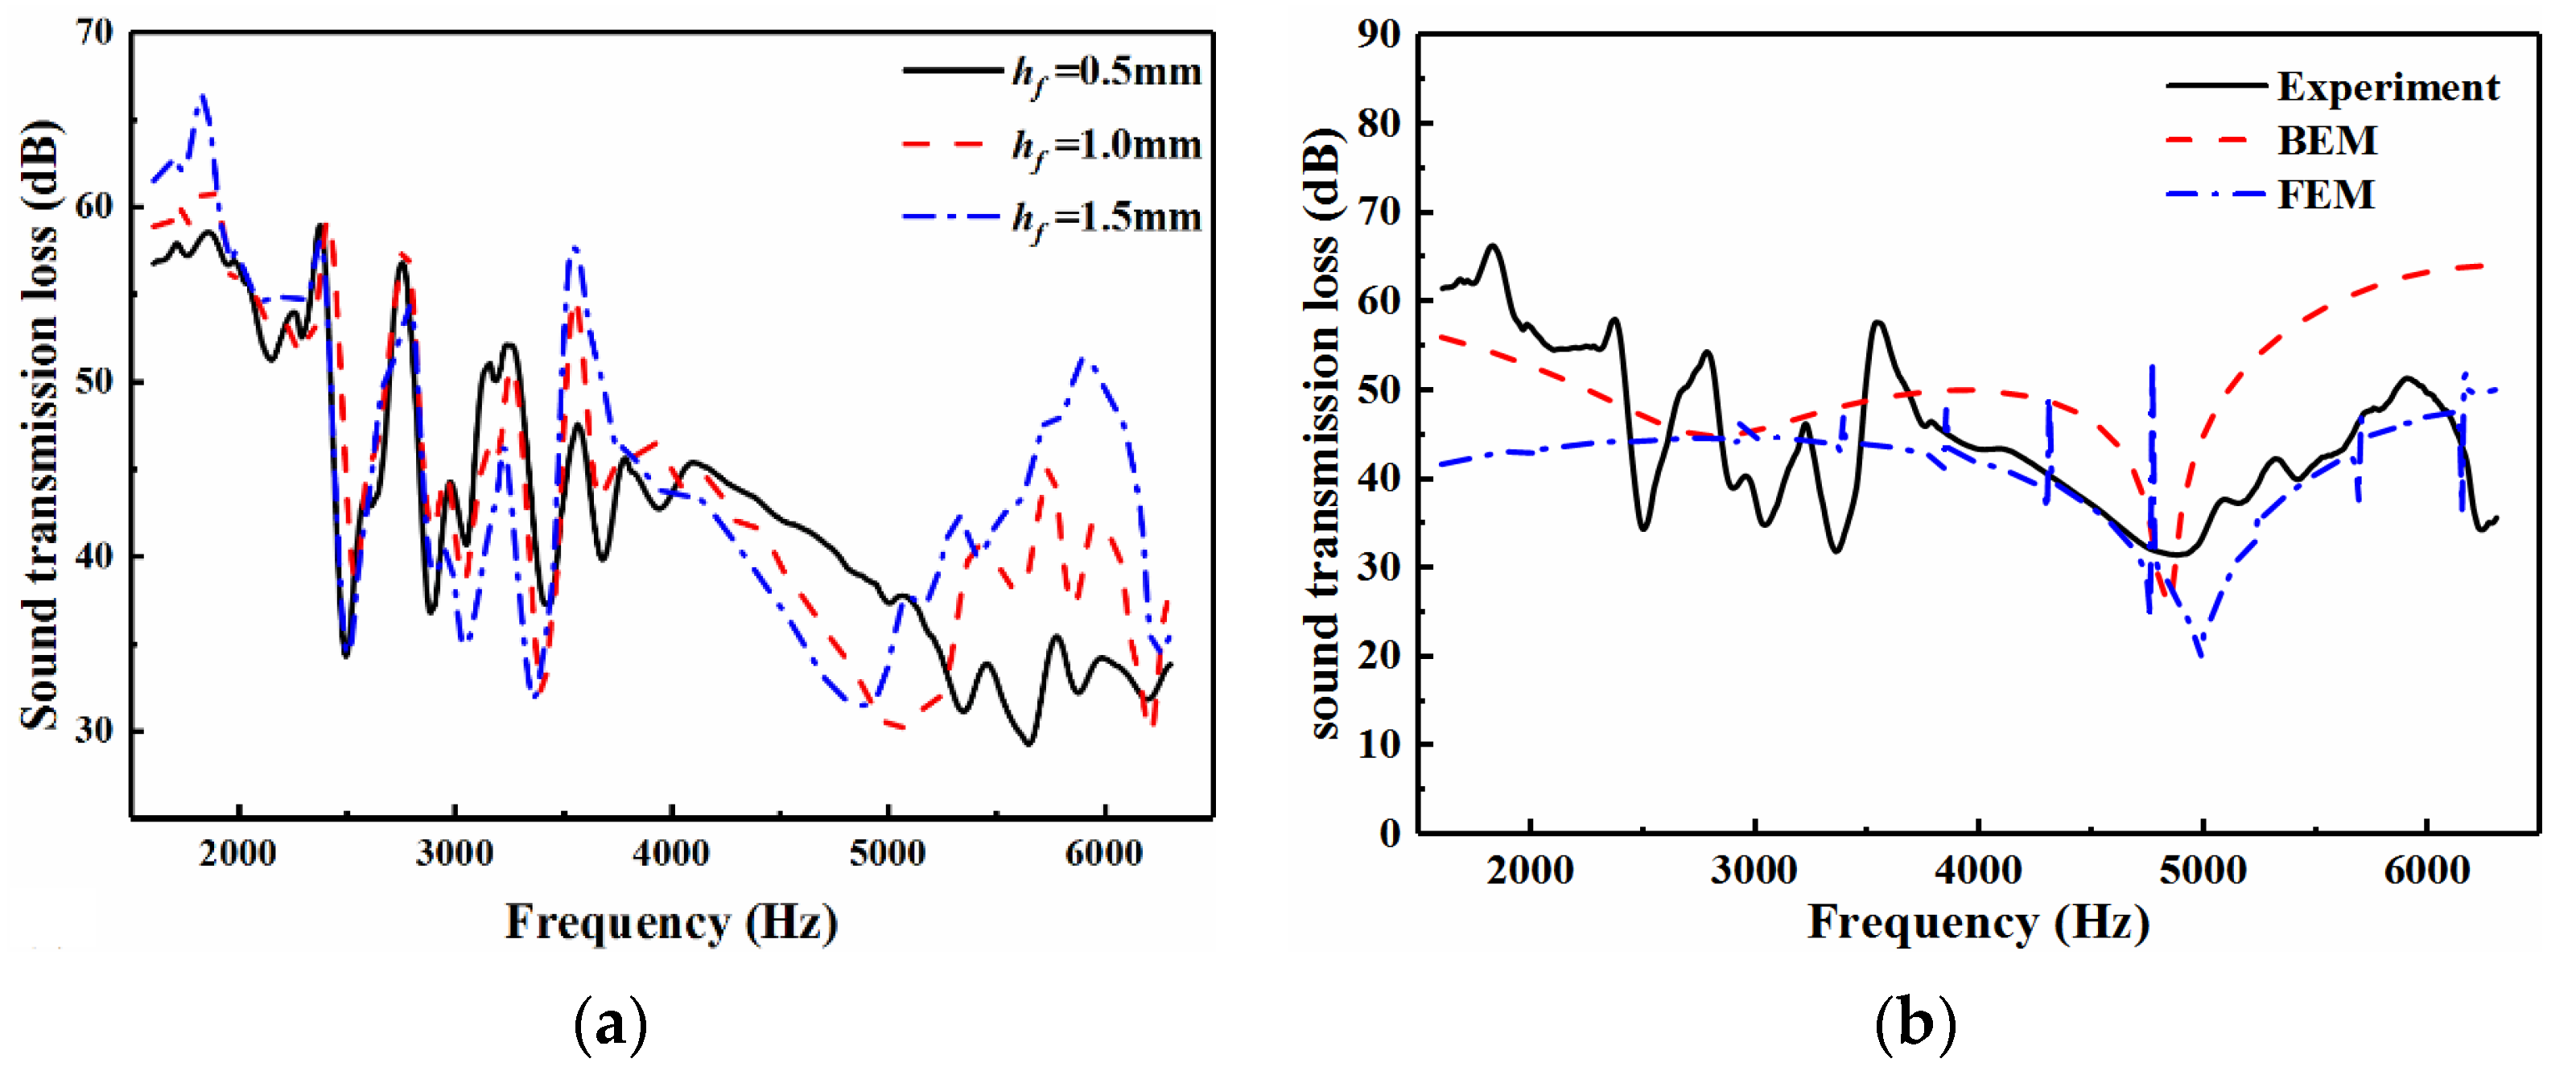
4.2. Acoustic Performance Using Structures with Face sheets of Different Thickness
The STL curves obtained using three Nomex honeycomb sandwich structures constructed using face sheets of different thickness are shown in
Figure 12a. The STL in the 1.6–2.0 kHz region, however, significantly increased as the thickness of the plates was increased.
Moreover, the figure also shows that the STL valley point of the honeycomb sandwich structures shifted in the low-frequency direction as the thickness of the sheets was increased. The STL greatly improved with increasing thickness of the face sheets, the average STL successively rising by 9 dB (B2 versus B1) and 7 dB (B3 versus B2). Combined with a sandwich skin, the core can provide sample stiffness, and the increase in the face sheet thickness resulted in an increase in the mass per unit area. The overall STL increased as the face sheet thickness was increased after the resonance region.
Figure 12b shows a comparison of an experimental curve (with
hf = 1.5 mm) and the corresponding results obtained via simulation. It can be seen that the simulation reproduced the general trends in the experimental curve. The curve trend of the BEM simulation result was similar to the test result, but in the frequency band after 5000 Hz, the BEM simulation result was larger than the test. For the FEM simulation result, it was basically consistent after the 3500 Hz frequency band, it had a higher degree of agreement with the test results than the BEM. However, the difference between the FEM and the test results was in the 1.5–2.5 kHz.
For the impedance tube test, the sound pressure of the test was calculated by calculating the average value of the sound pressure during the test time. It was difficult for the random sound source from the speaker to reach a steady state, because its sound pressure and frequency are not steady. So the sound pressure of the test floated up and down in a steady state, which caused some measurement errors. In the BEM, ignoring the loss of the tube wall, the sound wave generated by the plane sound source can only pass through the coupling mesh. The results of the BEM exhibited some difference to the test results in the resonance region. The FEM results, considering the influence of the tube wall, was in agreement with the test results in the resonance region, but had a difference in the stiffness region.
Figure 13 shows the shapes of the simulated modes for the B
3-type panel, which basically conformed to those in
Figure 11. This also indicates that the trends observed in the STL curves of the honeycomb sandwich panels were influenced by the structural modes of the panels.
4.3. Acoustic Performance Using Honeycomb Cores of Different Thickness
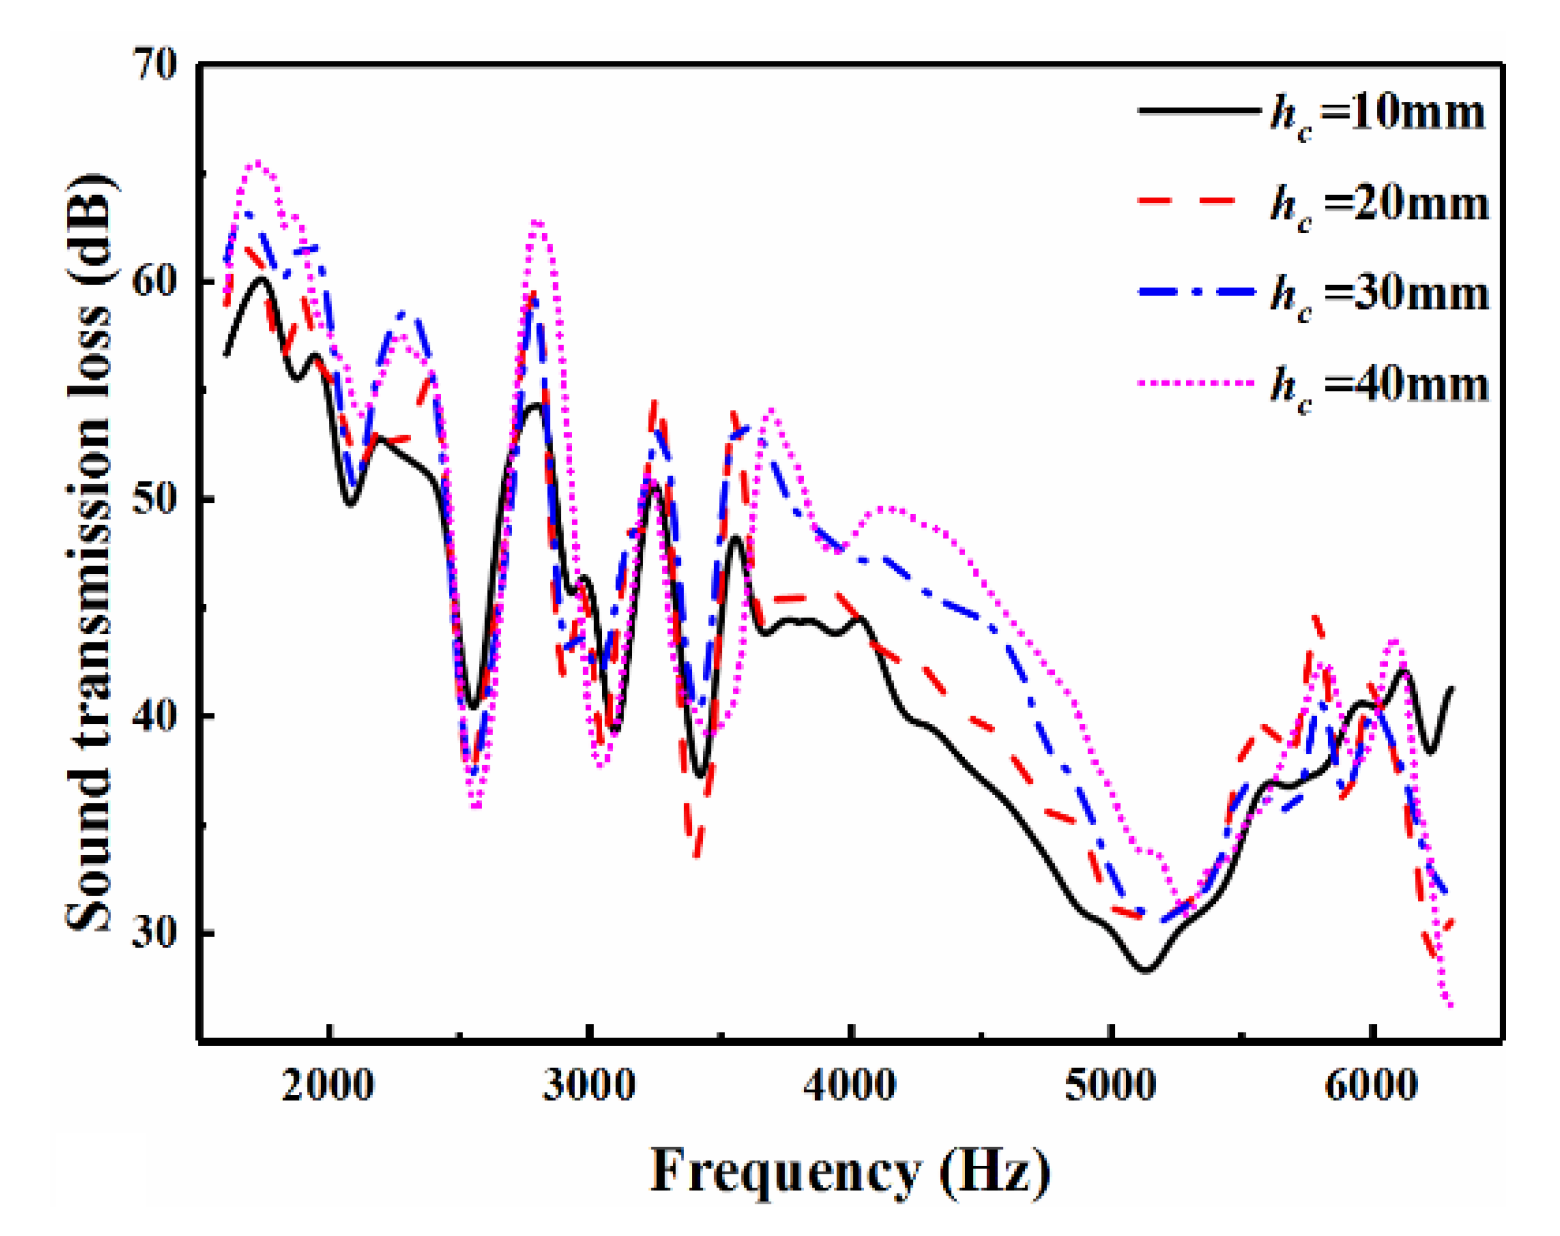
The STL results for sandwich structures with Nomex honeycomb cores of different thickness are shown in
Figure 14. As can be seen, increasing the thickness of the core increased the STL of the sandwich structure on the whole.
In the frequency range 3.6–5.2 kHz, the average STL value increased successively by 2 (C2 versus C1), 4 (C3 versus C2), and 3 dB (C4 versus C3). Thus, the largest increment in STL occured when the thickness of the core was increased from 20 to 30 mm. That is, as the thickness of the honeycomb core was increased, the increment in STL grew at first and then declined. Once the thickness reached 30 mm, however, the benefit gained by increasing the thickness of the honeycomb core further began to weaken (with respect to STL improvement).
It can be seen that increasing the thickness of the honeycomb core had a stronger effect on STL than increasing the thickness of the face sheet. According to the analysis mentioned earlier, STL is mainly in the stiffness region until 5000 Hz. So, increases in STL are affected by the stiffness of the structure. The stiffness of the structure can be improved by increasing thickness, but Wang et al. [
33] found excessive thickness will reduce the stiffness of the honeycomb sandwich panel and optimum middle thickness values maximized the stiffness. Therefore, the benefit gained by increasing the thickness begins to weaken, which can be attributed to the stiffness of structure approaching the maximum. The same phenomenon also appeared in the research conducted by Wang et al. [
25].
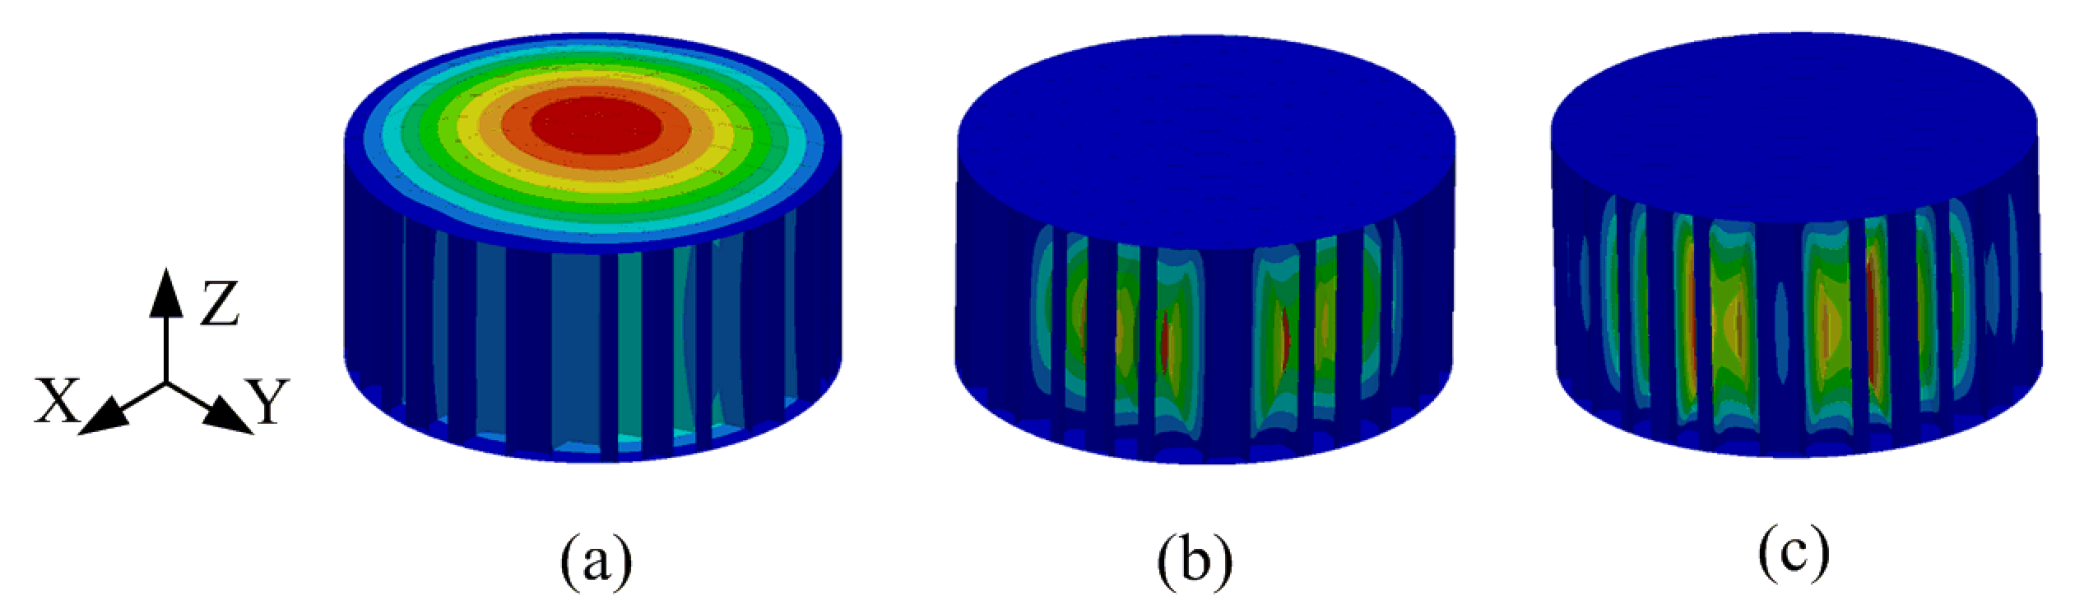
Figure 15 shows the shapes of the simulated modes for the C
2-type panel. This also indicates that the trends observed in the STL curves of the honeycomb sandwich panels were influenced by the structural modes of the panels. Moreover, changing the various structural parameters could change the mode frequencies.
4.4. Acoustic Performance of Single-Vs. Double-Layered Structures
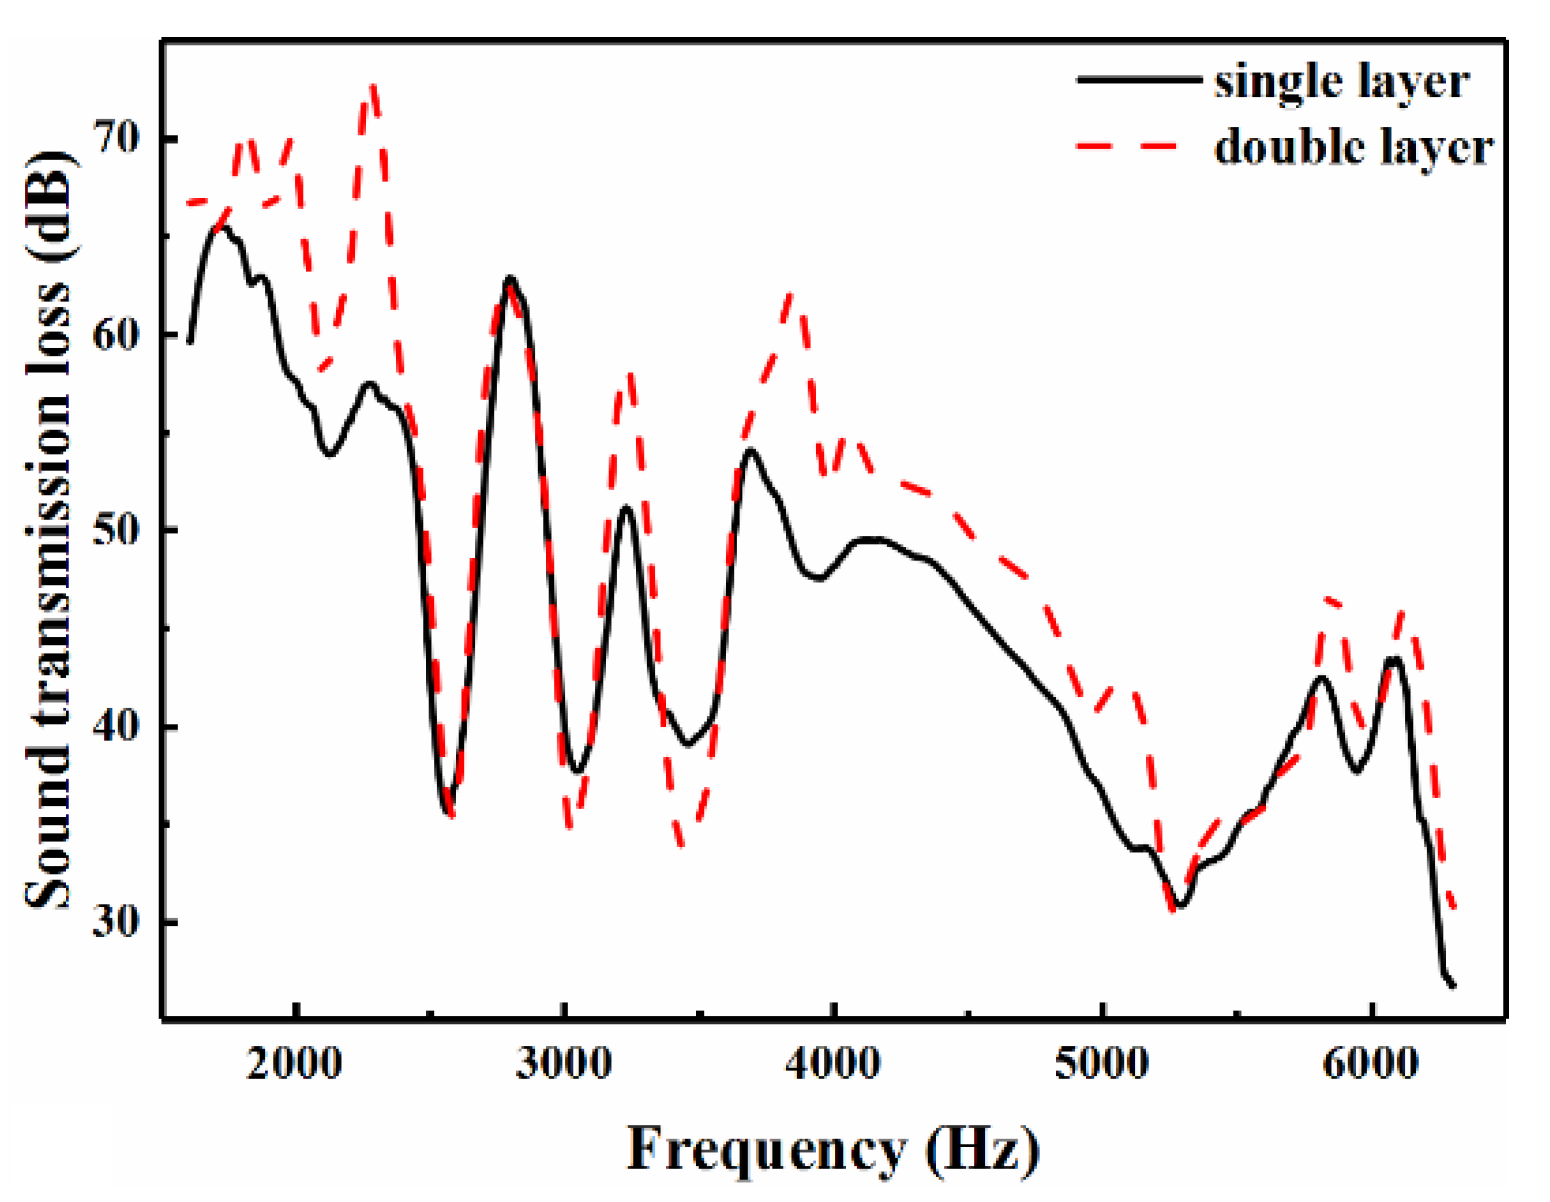
The STL results for single- and double-layered (the double-layered structures were assembled by bonding two single-layers, which formed a panel-core-panel-core-panel structure) Nomex honeycomb sandwich structures are shown in
Figure 16. On the whole, the performance of the double-layered honeycomb sandwich structure was superior to that of the single-layered structure. In the 1.6–2.4 kHz and 3.7–5.2 kHz frequency bands, the average STL value of the double-layered structure was 4 dB larger than that of the single-layered structure. The increase in STL was mainly in the ranges of 1.5–2.5 kHz and 4–5 kHz, which are in the stiffness region. Arbaoui et al. [
34] found the stiffness of the composite multilayer structures increased with intermediate layers. So, increase in STL is affected by the increasing of stiffness of the multilayer structure.
Figure 17 displays the simulated results for the shapes of the modes occurring in the D2-type panel. The shapes of first mode are the same as those in the previous simulations, and the vibration of the upper and lower aluminium face sheet lead to a significant decrease in the STL curve. For the simulation, there are few simulations available for impedance tube testing, especially for small impedance tubes in the test range of 1600–6300 Hz, and it is difficult to accurately model [
19]. In the research mentioned above it can be seen that the STL results of impedance tube tests are consistent with the changes in the structure’s stiffness and resonance region, indicating that the influence of the dimension parameters on the structure’s STL can be studied using an impedance tube.


