Article

MViDO: A High Performance Monocular Vision-Based System for Docking A Hovering AUV

by
André Bianchi Figueiredo
* and
Aníbal Coimbra Matos
Faculty of Engineering, University of Porto and INESC TEC-INESC Technology and Science, 4200-465 Porto, Portugal
*
Author to whom correspondence should be addressed.
Appl. Sci. 2020, 10(9), 2991; https://doi.org/10.3390/app10092991
Submission received: 13 February 2020 / Revised: 27 March 2020 / Accepted: 30 March 2020 / Published: 25 April 2020

Abstract

:
This paper presents a high performance (low computationally demanding) monocular vision-based system for a hovering Autonomous Underwater Vehicle (AUV) in the context of autonomous docking process-MViDO system: Monocular Vision-based Docking Operation aid. The MViDO consists of three sub-modules: a pose estimator, a tracker and a guidance sub-module. The system is based on a single camera and a three spherical color markers target that signal the docking station. The MViDO system allows the pose estimation of the three color markers even in situations of temporary occlusions, being also a system that rejects outliers and false detections. This paper also describes the design and implementation of the MViDO guidance module for the docking manoeuvres. We address the problem of driving the AUV to a docking station with the help of the visual markers detected by the on-board camera, and show that by adequately choosing the references for the linear degrees of freedom of the AUV, the AUV is conducted to the dock while keeping those markers in the field of view of the on-board camera. The main concepts behind the MViDO are provided and a complete characterization of the developed system is presented from the formal and experimental point of view. To test and evaluate the MViDO detector and pose an estimator module, we created a ground truth setup. To test and evaluate the tracker module we used the MARES AUV and the designed target in a four-meter tank. The performance of the proposed guidance law was tested on simulink/Matlab.

1. Introduction

This work presents a monocular vision-based system for a hovering Autonomous Underwater Vehicle (AUV) in the context of the autonomous docking process. In this work, we developed a complete approach to bring a hovering AUV to a docking station using only one sensor: a single camera. The aim was to explore the development of a system to assist autonomous docking based on a single cost-effective sensor only. It was intended to realize how far we can get by using only the image in determining the relative pose and tracking the target. Space limitations onboard the AUV and energy limitations dictated the requirements for the development of this work. Based only on the data collected by a low-cost camera it was possible to reach a guidance law that drives the AUV to the cradle of a docking station. This work was intended to observe the target at a rate of 10 frames per second minimum (processing time less than 100 ms). This is due to the fact that the control operates at 20Hz and it is not desired that there is more than one estimation between two consecutive frames. As can be seen from the results (Section 5, Section 5.2.2, Figure 31), this objective has been achieved. The detector and relative pose estimation algorithm provides 12 frames per second (83 ms) to which adds the processing time of the developed filter which for 1000 particles per marker occupies 13 ms of the total processing time. We propose algorithms that should be able to run in a low power consumption and low-cost system with minimal interference with existing HW modules of AUV MARES [1]. Being our goal to develop high-level algorithms and not to develop hardware, we have chosen a generic platform called Raspberry Pi 2, which we can classify in general as a low power consumption and low-cost system. So, instead of considering data sources from other sensors and increase the computation cost for sensor fusion, we choose to explore the maximum capabilities of data provided by the image sensor, as we will explain at Section 2. Our approach, considering Raspberry Pi 2 processing constraints, should be able to get more than 10 estimations per second (a requirement for smooth control of MARES). In this work, in addition to presenting the developed vision-based system that detects and tracks the docking station visual markers, we also address the problem of defining a guidance law for a hovering AUV when performing a docking maneuver. We used as a case study the docking of MARES, a small size modular AUV [1], but our approach is pretty general and can be applied to any hovering vehicle. The results presented in this paper are the outcome of continuous effort made by the center for robotics at INESC TEC for autonomous docking of AUVs. This work has started with the localization and positioning of an Autonomous Surface Vehicle (ASV), assuming parallel target and camera planes [2]. Then the efforts were devoted to the preliminary characterization of relative position estimation and vehicle positioning. In that work [3], it was demonstrated that the hovering AUV MARES (Figure 1) was capable to track and position itself with regard to the target, at a given pre-specified depth. The estimation of the relative position, based solely on the image, is subject to abrupt variations as well as indeterminate solutions in the absence of one of the markers. There was a need to persist with the tracking even in the case of partial or momentary occlusions of the markers that compose the target. The solution we found to overcome this problem is presented on Section 2 (Section 2.3). The proposed solution allowed not only to maintain the estimates of the relative pose even during the occlusion of one or more markers, but also to reduce the number of outliers detections (Section 5). In order to drive the AUV MARES from any point within the camera field of view to the point where the cradle of the docking station is, we designed and developed a guidance law (Section 4). The proposed law allows always keeping the markers in line of sight during the docking maneuver. We show that by adequately choosing the references for the linear degrees of freedom (DOF) of the AUV it is possible to dock while keeping the target markers in the field of view of the on-board camera.
This document is organized as follows:
  • Section 1 contains a survey of the state of the art related to our work; the contributions of our work and the methodology followed for the development of the presented system.
  • Section 2 contains the developed system for docking the AUV MARES using a single camera. In particular, the pose estimation method, the developed tracking system and the guidance law,
  • Section 3 contains a theoretical characterization of the used set camera-target,
  • Section 4 describes the developed guidance law,
  • Section 5 describes the experimental setup and presents the experimental results: an experimental validation of the developed algorithms under real conditions such as the sensor noise, lens distortion and the illumination conditions,
  • Section 6 contains the results of tests to the guidance law performed in a simulation environment,
  • Section 7: a discussion about the results,
  • Section 8: conclusions.

1.1. Related Works

In the context of autonomous docking a hovering AUV, our work was concerned in four main issues:
  • build a target composed by well identifiable visual markers,
  • visually detect the target through image processing and estimate the relative pose of the AUV with regard to the target: the success of the docking process relies in accurate and fast target detection and estimation of the target relative pose,
  • ensure target tracking: the success of the docking process depends on a robust tracking of the target even in situations of partial target occlusions and the presence of outliers,
  • define a strategy to guide the AUV to the station’s cradle without ever losing sight of the target.
Taking these concerns into account, a survey of the state of the art, related to each of these issues, was made and the different approaches were analyzed.

1.1.1. Vision-Based Approaches to Autonomous Dock An Auv

In recent years, the use of artificial vision and identifiable markers for pose estimation in an underwater environment, has become a subject of interest for the scientific community working in subaquatic robotics. Recent examples are the work of [4] where it is proposed a solution using active light-marker localization for docking an AUV. For that, the authors use a module based on a monocular system for detect a set of active light markers. Since the light-markers are placed in known positions of the docking station the authors in [4] can estimate the pose between the docking station and the camera. In order to detect the light-markers, the authors in [4] use a blinking pattern to allow the markers to be discerned. Visual markers are one of the most used systems to help to guide the AUV to the dock, and other approaches have been proposed by [5]. In [5] the authors propose a docking method for a hovering AUV at a seafloor station. The proposed method is based on visual positioning and makes use of several light sources located on the docking station to visual guide the AUV. The proposed method is divided into two stages by distance, a first stage in which the vehicle is visual guided based on the light sources and a final stage in which the AUV just keeps its attitude and moves forward into a corn-shaped station. This method is not applicable to our case because the entrance of our docking station is not corn-shaped. Note that in the method proposed in [5], the authors suspend vision-based guidance when the AUV is at the dock entrance since the light sources are too close for the AUV to see. The solution we propose in our work does not need to suspend guidance based on vision, allowing a more aware docking of the docking maneuver. The use of a single camera on-board of an AUV and multiple light markers mounted around the entrance of a docking station in order to guide visually an AUV is also a solution presented in [6]. In this type of approach, the estimation of the relative pose required for autonomous docking is done using the markers geometry. As in the case of the work mentioned above ([5]), also in the work presented in [6] there was a position where the lights on the dock were outside of the camera viewing range when the AUV was close to the dock, and the vision-guidance is invalid in this area. In the literature, we also find works that are based on solutions that use passive targets to signal the dock. In the case of [7] the passive targets are docking poles. Passive markers in an underwater environment limit the process both in terms of minimum distance to the target and visibility conditions. In the solution we propose, we tried to circumvent these limitations by building a hybrid target (active and passive). In other works, such as [8], the authors proposed a method to estimate the relative pose of a docking station using a single camera. They assume that the dock is circular so the proposed method is for a 5-DOF pose estimation neglecting the roll effects because all the markers are physically identical, and there is no way to distinguish them. Furthermore not considering the roll effect, the proposed method in [8] presents ambiguities in angles estimation.

1.1.2. Vision-Based Related Works

For purposes other than docking, works based on artificial vision were found. In [9] an approach is proposed for estimating the relative pose between AUVs in tight formation. For a pose estimation based on visual information, they use active light markers as optical markers placed on the follower AUV. The pose estimation method in [9] is then based on the minimization of a non-linear cost function comprising error terms from light marker projection, plus range and attitude measurements when available. The use of a camera to estimate the relative position of an underwater vehicle also serves other purposes, such as the work in [10], where it is intended that an AUV performs an autonomous home into a subsea panel in order to perform an intervention. For the subsea panel detection and subsequent relative position estimation, the authors in [10] propose a method in which the images gathered by a single camera on-board AUV are compared with a priori known template of the subsea panel. There are other works whose approach is based on stereo vision, such as the work in [11], where the authors use dual-eye cameras and an active 3D target. The real-time pose estimation is made by means of 3D model-based recognition and multi-step genetic algorithm. Although we recognize the advantage in using stereo vision, the energy and space requirements available in our vehicle dictated a solution based only on a single camera. Vision-based homing has been widely implemented in the ground and aerial robotics [12] and its concepts have been translated to underwater robotics in some works such as [13].

1.1.3. Approaches Based on Different Sensors

An alternative homing method (non vision-based) was proposed by [14]. The proposed method in [14] uses electromagnetic waves emitted and received by means of large coils placed in both the docking station and the AUV. The overall system makes it possible to compute bearing to the dock at distances up to 35 m in seawater. Bearing was also employed by [15] using an USBL (ultra-short baseline) sensor carried on the vehicle. The control law derived just has to ensure that the bearing angle is null along the trajectory to home. However, it is well known that, in USBL systems, the angle resolution decreases with the distance and the sensor may not be omnidirectional, thus being possible to measure angles and ranges only when the beacon is located at a given angular position, with regard to the USBL sensor. In [16], an extremum-seeking algorithm was introduced to find the maximum approach rate to a beacon. Nevertheless, the method in [16] requires initialization otherwise the AUV may be driven to a stable equilibrium point in the opposite direction of the beacon. In works such as [17], a priori information on the area is used to generate an artificial potential field combined with a sliding mode control law to home an AUV to its docking station.

1.1.4. Vision-Based Relative Localization

The detection of markers and the computation of the position and attitude of the AUV with respect to them have been addressed in several works [5,18]. In the context of vision-based relative localization estimation, there are strategies such as ego-motion based on cameras. Ego-motion is defined as the 3D motion of an agent in relation to its environment, that strategy consists in estimating a camera motion relative to a rigid scene. Ego-motion using a single camera-Monocular Visual Odometry (MVO)-consists of sequential estimation process of camera motions depending on the perceived movements of pixels in the image sequence. MVO operates by incrementally estimating the pose of the vehicle through the examination of the changes that motion induces on the images of its onboard camera. For MVO to work effectively, there should be sufficient illumination in the environment and a static scene with enough texture to allow apparent motion to be extracted [19]. Furthermore, consecutive frames should be captured by ensuring that they have sufficient scene overlap. For accurate motion computation, it is of utmost importance that the input data do not contain outliers. Outlier rejection is a very delicate step, and the computation time of this operation is strictly linked to the minimum number of points necessary to estimate the motion [19]. The work [20] proposes robust methods for estimating camera egomotion in noisy, real-world monocular image sequences in the general case of unknown observer rotation and translation with two views and a small baseline. The recent works have demonstrated that the computational complexity of ego-motion algorithms is a challenge for embedded systems because there are iterative operations that limit the processing speed. However, the recent work [21] proposes a hardware architecture for the “ego-motion challenge” that consists of using look-up tables and a new feature matching algorithm. The camera motion is estimated with no iterative loop and no geometrical constraints. The authors in [21] claim that their algorithm complexity is low and that a small size GPU-based implementation is feasible and suitable for embedded applications. The major drawback of the camera-based ego-motion approach is due to image analysis which is typically computationally expensive [21]. Perspective-n-points (PnP) algorithms can accurately solve points-based pose estimation (see work [22]), but a drawback of PnP algorithms, just like the other methods found in the literature, is that they fail in estimating poses in cases where not all markers are detected and a partial occlusion of the target, i.e., an incomplete observation is highly possible in a docking process. In our work, for estimate the relative position of an AUV with regard of the target we consider the algorithm presented on [23]. The algorithm presented in [23] serves our needs with regard to position estimation, however, in terms of the relative attitude estimation the algorithm presented in [23] has some assumptions and simplifications that do not fit our problem. There are two ambiguities when using a target with only three markers: an ambiguity in the signal when the target is rotated around the x axis and another ambiguity when the target is rotated around the y axis. For that reasons, we decided to develop a new alternative algorithm for attitude estimation (presented in Section 2.2).

1.1.5. Tracking: Filtering Approaches

In the literature we could find some classical approaches to Bayesian nonlinear filtering such as the ones described in [24,25]. The most common choice lies in the Kalman Filter, but do not serve our case considering the nonlinearity of the particular problem that we want to solve and a non-Gaussian sensor noise. On the other hand, the Extended Kalman filter could be applied for nonlinear non-Gaussians models, however, the linearized model considers Gaussian noise. Despite other approaches such as the Point Mass Filter approach applies to any nonlinear and non-Gaussian model [24], the main limiting issue is the dimensionality of the grid size and the algorithm is of quadratic complexity in the grid size. In fact, in grid based systems, adjusting the grid size by varying the cell size in order to lead to less expensive computational cost will not be a good choice because by increasing the grid size would reduce the system resolution. A Particle Filter approach has advantages of simple calculation and fast processing. Particle Filters can be implemented for arbitrary posterior probability density function, which arises in particular when faced with nonlinear observations and evolution models or non-Gaussian noises [26]. On the other hand, in particle filter, the tradeoff between estimation accuracy and computational load comes down to adjusting the number of particles [26]. The particle filters can propagate more general distributions and that is of particular benefit in underwater visual tracking.

1.1.6. Docking: Guidance Systems

In the literature we found some works focused on the purpose of guiding an AUV to a dock using a vision-based system. We highlight here two:
  • In [27] a monocular vision guidance system is introduced, considering no distance information. The relative heading is estimated and an AUV is controlled to track a docking station axis line with a constant heading, and a traditional PID control is used for yaw control,
  • In another work [28], two phases compose the final approach to the docking station: a crabbed approach where the AUV is supposed to follow the dock centerline path. The cross-track error is computed and fed-backed; and a final alignment to eliminate the contact of the AUV and the docking station.
None of the works found in the literature takes into account our concern to never lose sight of the target until the AUV is fully anchored in the cradle. For this reason, a new solution was developed that is presented in this paper.

1.2. Contributions of This Work

Taking into account the state of the art, we highlight the following points as being the contributions of our work:
  • A module for detection and for attitude estimate of an AUV dock station based on a single camera and a 3D target: for this purpose, a target was designed and constructed whose physical characteristics maximize its observability. The developed target is a hybrid target (active/passive) composed by spherical color markers which could be illuminated from the inside allowing to increase the visibility of the markers at a distance or in very poor visibility situations. It was also designed an algorithm for detecting the target that responds to needs of low computational cost and that can be run in low power, low size computers. A new method for estimate the relative attitude was also developed in this work.
  • A novel approach for tracking by visual detection in a particle filtering framework. In order to make the pose estimation more resilient to markers occlusions, it was designed and implemented a solution based on Particle Filters that considers geometric constraints of the target and constraints of the markers in the color space. These specific approaches have improved the pose estimator performance, as presented in the results section. The innovation in our proposal for the tracking system consists of the introduction of the geometric restrictions of the target, as well as the restrictions in the color space as a way to improve the filtering performance. Another contribution is the introduction, in each particle filter, of an automatic color adjustment. This allowed not only to reduce the size of the region of interest (ROI), saving processing time, but also to reduce the likelihood of outliers.
  • It was developed a method for real-time color adjustments during the target tracking process, which improves the performance of the markers detector through better rejection of outliers.
  • It was designed and implemented an experimental process, with Hardware-in-the-loop, to characterize the developed algorithms.
  • A guidance law was designed to guide the AUV with the aim of maximizing the target’s observance during the docking process. This law was designed from a generalist perspective and can be adapted to any system that bases its navigation on monocular vision, or another sensor whose field of view is known.

1.3. Requirements

For the purpose of design and implement the MViDO system, it would be necessary to find a specific solution to meet certain requirements. One of the requirements for the development of that system was that its implementation was done on a computer that was small enough to be accommodated onboard the AUV-embedded low-cost hardware. Such a requirement implied a more limited processing feature, i.e., a high performance (low computationally demanding) system. By commitment to the control system of the AUV, the NViDO system should not exceed 0.011 s to process each frame received from the camera. Another requirement was that the system be based only on a single camera so that the AUV dynamics were the least changed possible, i.e., it was not intended to alter the MARES body, so any extra equipment (sensor) to be installed in the vehicle would necessarily have to be incorporated into the housing available for that purpose. On the other hand, the space on board the vehicle is limited and the energy available as well. The housing available to add a sensor only supports a camera and a light source. Furthermore, using more than one camera would create more drag and consume more energy. These were the starting points for the development of the MViDO system.

Components Specifications

The developed system is integrated as an independent module in the MARES AUV system. All the developed algorithms, presented here, were implemented on a Raspberry Pi 2 model B, a computer that is small enough to be accommodated onboard the MARES AUV. The single camera used for the vision system was a Bowtech underwater camera with a Sony 1 / 3 EX-View HAD CCD sensor. The camera and lens specifications are those shown in Table 1 and Table 2.

1.4. Methodology

We had to deal with a specific problem and we proposed a concrete solution. Taking into account the requirements, it was necessary to find a solution based on a monocular system and with limited processing capacity (a solution that can be run in low power, smaller computers). Whereas it was intended to estimate the relative position and attitude of the AUV in relation to a dock using a single camera, and taking into account that, in the vicinity of the dock, the AUV’s camera may not necessarily be facing the dock, we chose to construct a target to attach to the dock and whose markers were visible on different points of view. On the other hand, we chose to use different colors for each of the markers in order to avoid ambiguities in the relative pose estimation. In order to estimate a 3D relative pose of the AUV in relation to the built target, we propose an algorithm of low computational cost that detects, identifies and locates the spherical color markers in the image and then estimates the position and orientation of the target with regard to the camera frame mounted onboard AUV. The module developed for the detection of markers and relative pose estimation presents fairly satisfactory estimates and with sufficient accuracy to feed the control, especially with accurate orientation information needed in the final docking phase. We propose here a particular solution to deal with situations of partial occlusion of the target (absence of one or more markers) or appearance of outliers that affect the estimate of the 3D relative pose. Our particular solution, based on particle filters, rather than following the more common approach of throwing particles over the target as a whole, considers a particle filter for each of the markers and considers the geometric constraints of the target and the constraints of the markers in the color space. The proposed solution also considers real-time color adjustments which allow, in a scenario with features of color similar to our markers, a greater number of outliers is avoided and the weight of the particle of the filter has a more adjusted value and that the results are more accurate.

2. Mvido: A Monocular Vision-Based System for Docking a Hovering Auv

This section presents three components of the modular MViDO system developed in order to assist the autonomous docking process of an AUV. Here are three of our contributions: the target, the attitude estimator, and the tracking system. The total MViDO system is also composed of other contribution-the developed guidance law-which is presented in a separate Section 4.

2.1. Target and Markers

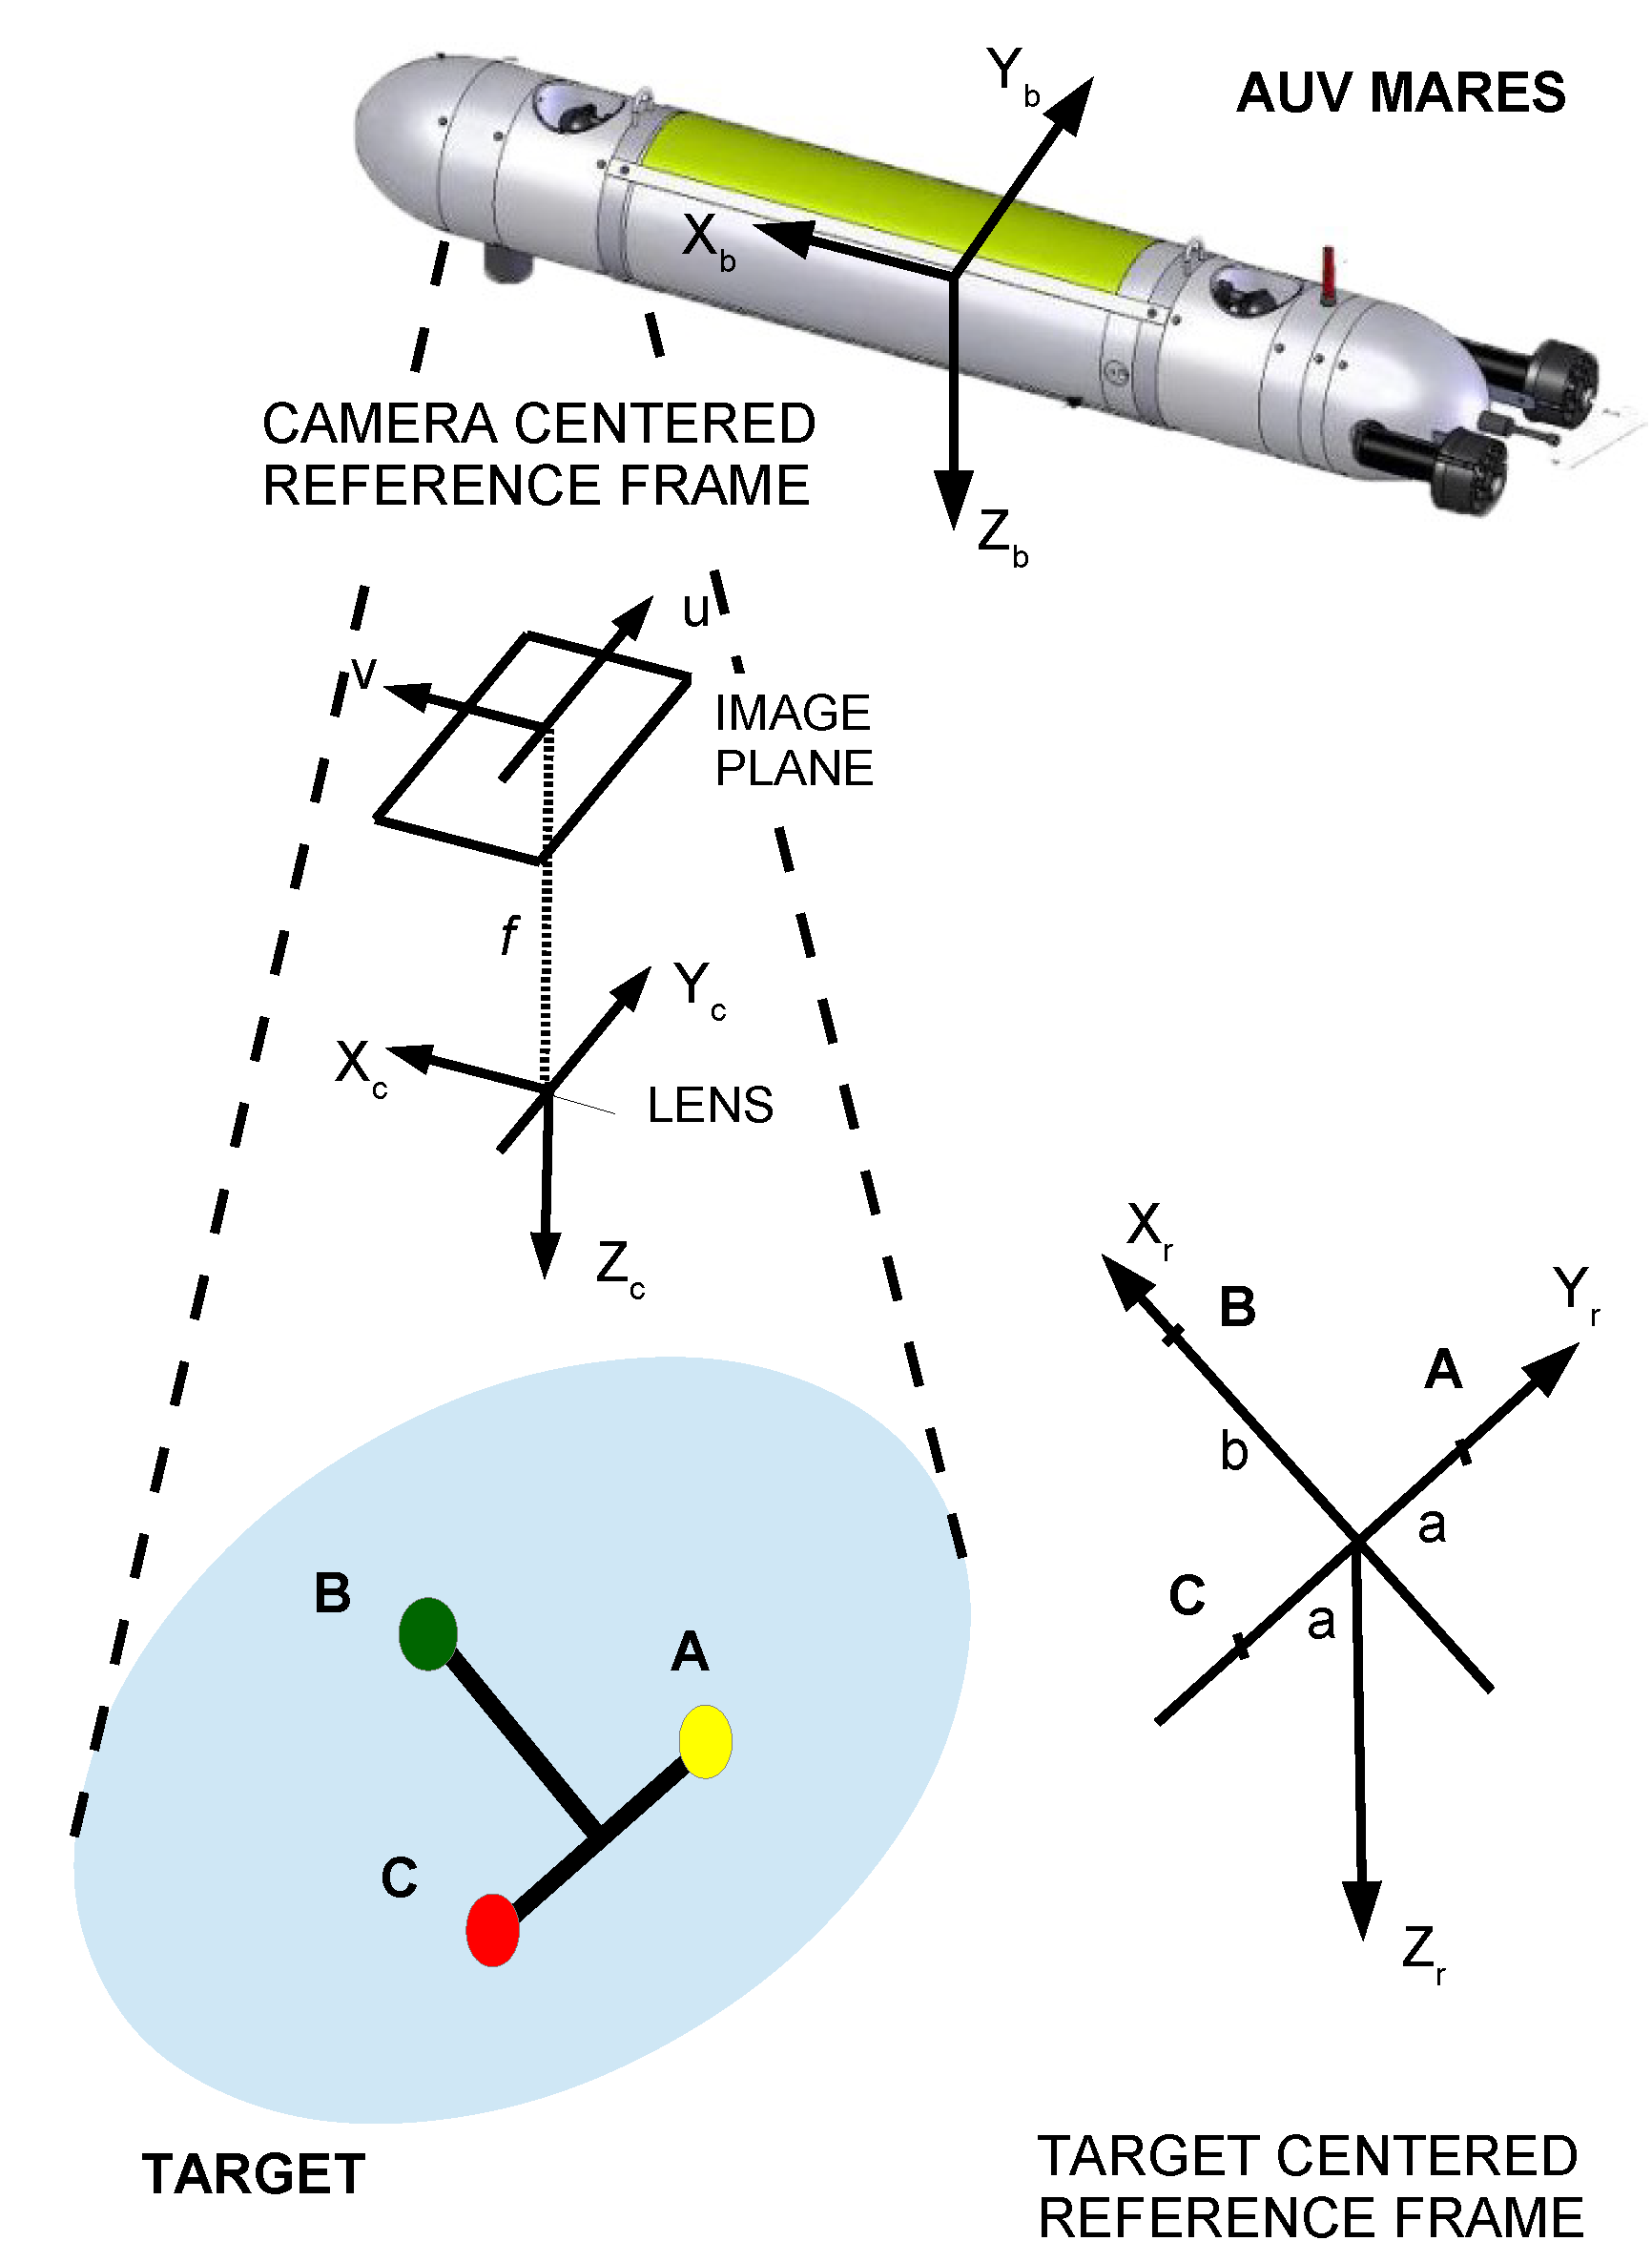
The docking station choice plays an important role in vision-based docking. We believe that choosing a target composed of well-identifiable markers to attach the dock aids in 3D pose estimation. In the context of this work, a target was designed and built. The developed target is formed by three color spherical markers rigidly connected. Our solution for the dock’s target based on spherical markers, as shown in Figure 2 and Figure 3, allows the target to be viewed from different points of view and without shadows to make image segmentation easier We chose to use different colors for each of the markers in order to avoid ambiguities in the relative pose estimation. The first solution was based on passive visual markers, occasionally illuminated outside only in certain circumstances of visibility. This solution proved not to be the best since lighting from outside created unwanted shadows. A second solution was developed (Figure 2) based on hybrid visual markers. In this hybrid target, the markers could be illuminated from the inside allowing to increase the visibility of the markers at a distance or in very poor visibility situations. The interior lighting intensity is controllable from the docking station. The fact that the lighting is controllable allows us to adjust the intensity so that the colors continue to be noticeable. In a limit situation, where a stronger interior lighting is required, when the camera is facing the color lightning marker, what we see is very bright ellipses and a colored halo around that ellipses and in this way we continue to have color information. In situations of good visibility or in close proximity to the target, interior lighting is almost unnecessary and the target becomes quasi-passive avoiding energy consumption. In certain situations, the fact that the markers can be illuminated can also serve as a first beacon signaling the presence of the target. The choice of dimensions for the target (see Figure 2a) was related to three factors: the maximum operating distance Camera-Target, the field of view of the lens and the constructive characteristics of the dock (see Figure 3). The target presents different distances on the two axes a and b (see Figure 2a) in order to avoid ambiguities in the relative position estimation.

2.2. Attitude Estimator

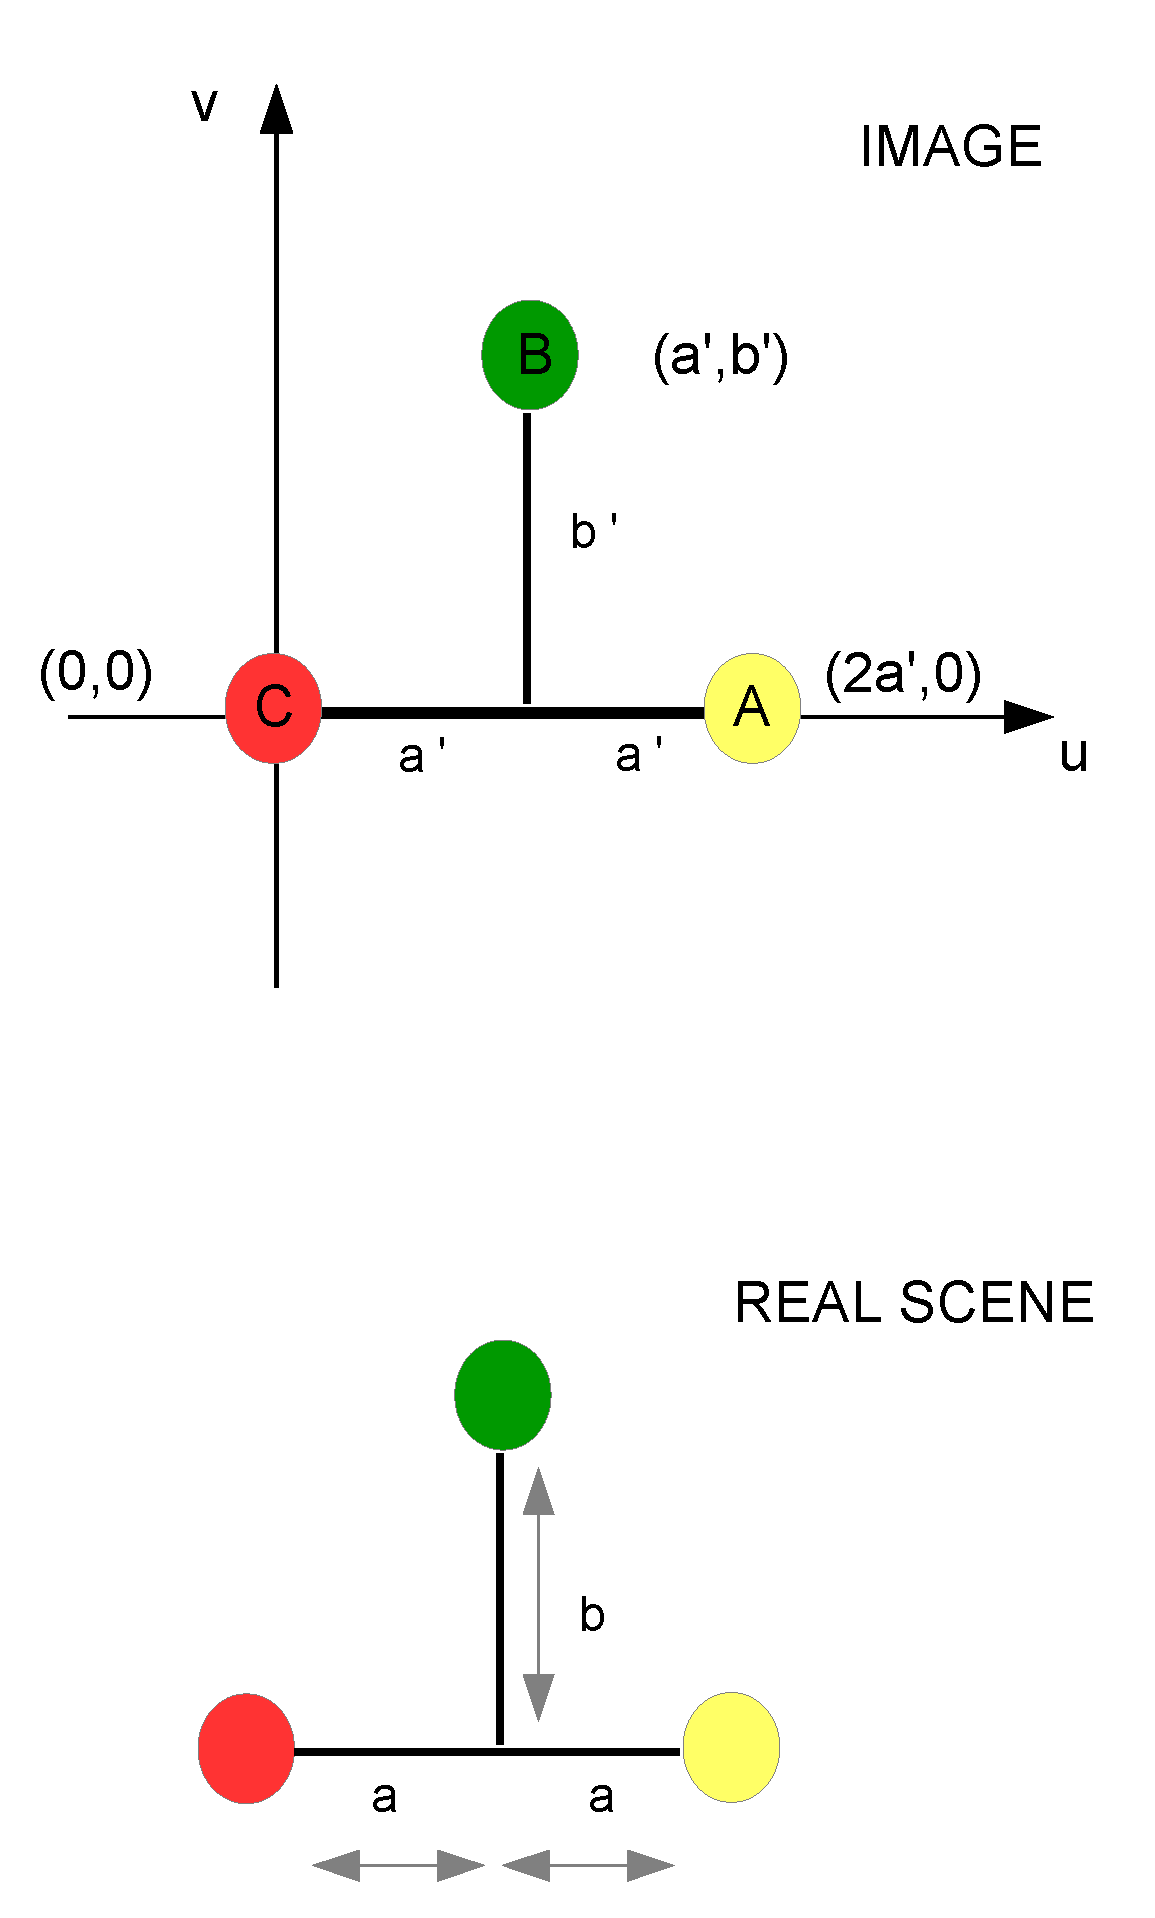
In our previous work [3], we develop an algorithm to visually detect the target formed by the three-color spherical markers rigidly connected. The detection algorithm is based on an image color segmentation which detects the center of mass of each of the markers after an iterative process where, for each captured frame, a threshold is made for the range of the reference colors of the markers. When the three points in the image are identified, we proceed to relative pose estimation. For the 3D pose estimation, the developed algorithm is based on a u , v image that determines the target position and orientation with regard to the camera frame-mounted onboard AUV.
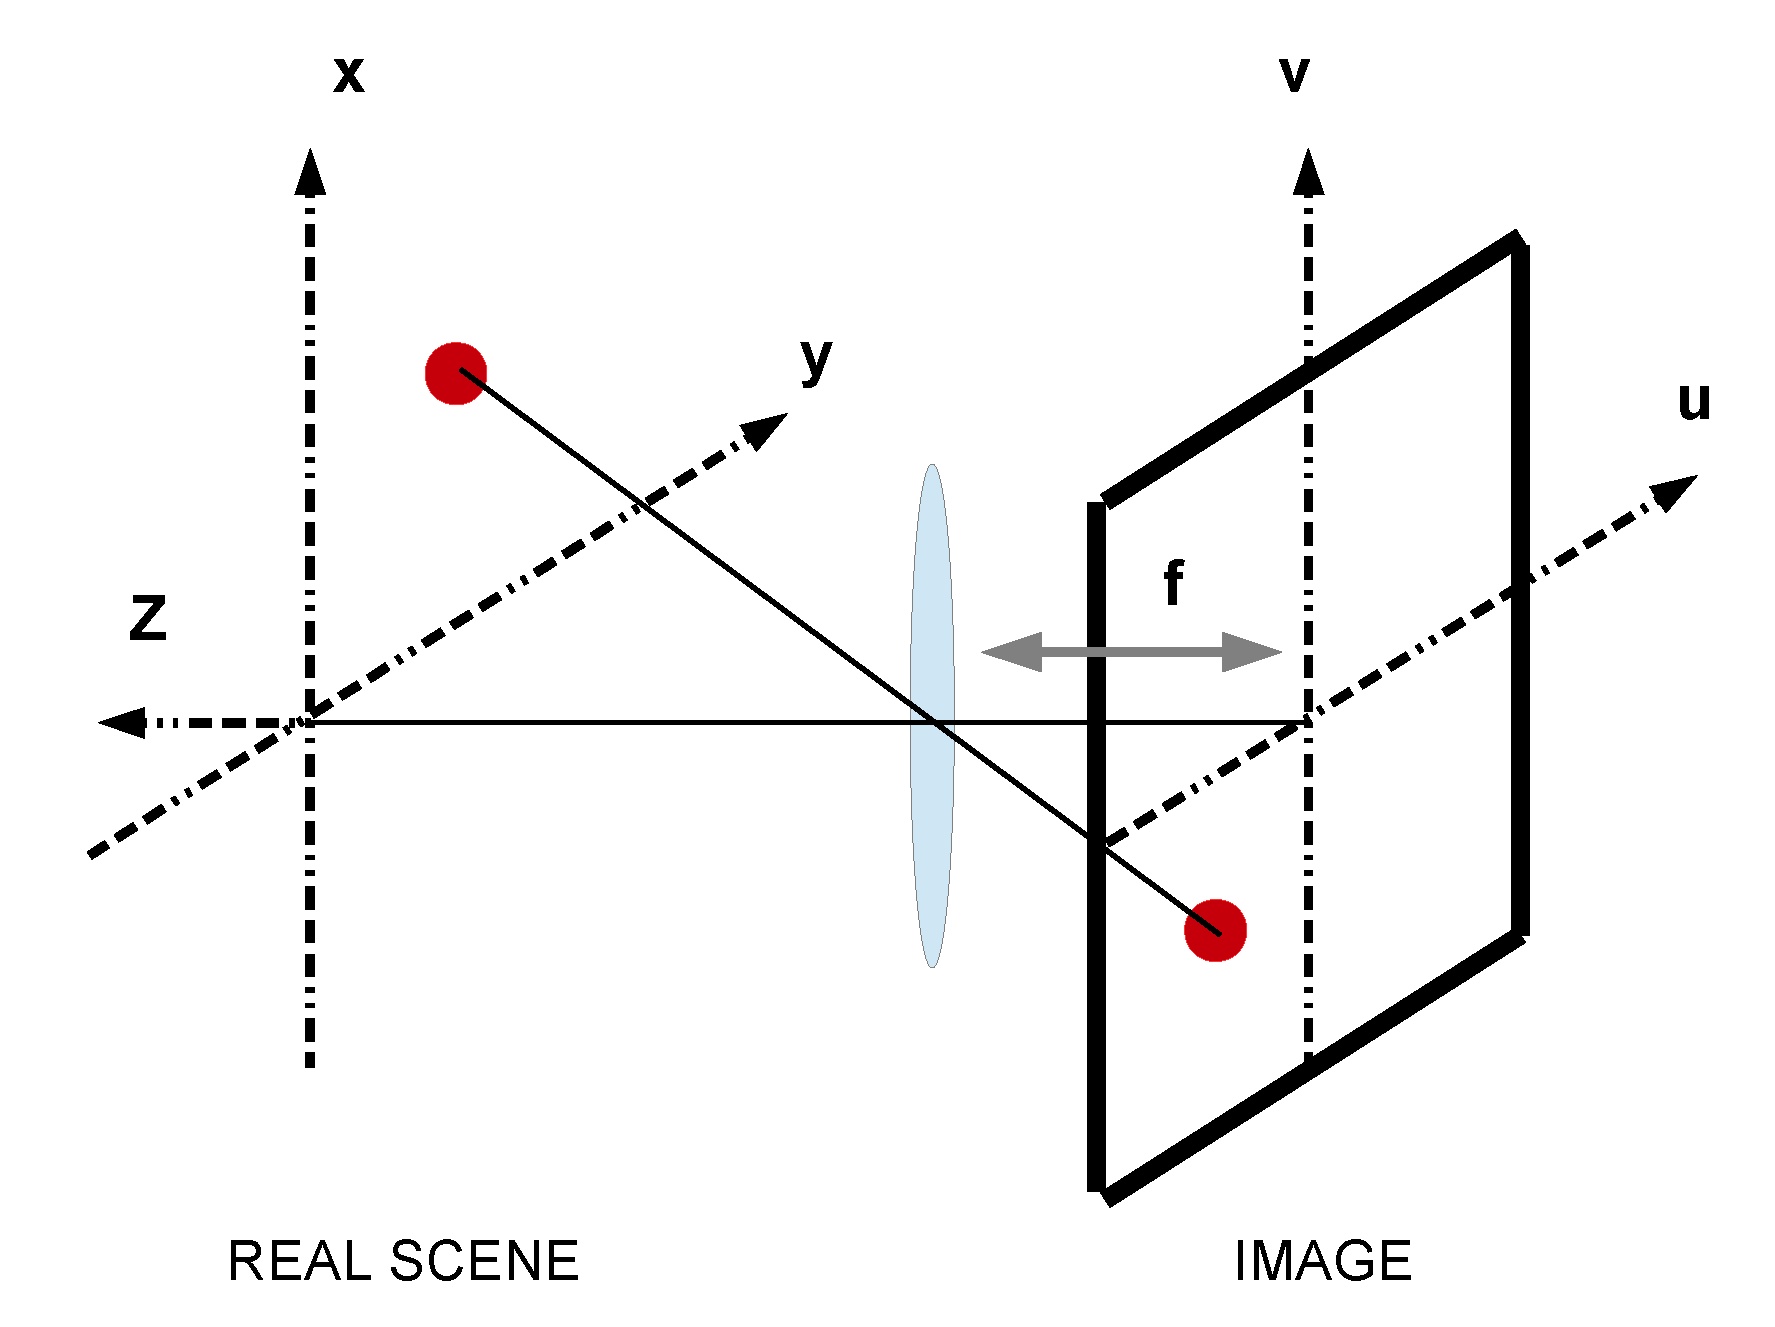
For estimate the relative position of the AUV MARES with regard of the target (see Figure 4), we use the algorithm presented on [23] and we consider the pinhole camera model presented on Figure 5. A relative position vector is defined as represented bellow:
d = x r y r z r T
where x r , y r , z r are the estimated relative distances of the centre of the color markers from the camera along x c , y c , z c directions. The estimate of z r can be obtained from the following equation in z r 2 :
z r 4 k 2 k 3 k 1 k 4 2 z r 2 k 1 2 + k 2 2 + k 3 2 + k 4 2 + 1 = 0 ,
where, k 1 , k 2 , k 3 and k 4 are known constants, determined in function of the coordinates of the markers in the image, the focal length of the camera and the fixed real distances between the markers on the target. That constants are given by:
k 1 = u C u A 2 a f
k 2 = v C v A 2 a f
k 3 = u A + u C 2 u B 2 b f
k 4 = v A + v C 2 v B 2 b f ,
where ( u A , v A ) ; ( u B , v B ) ; ( u C , v C ) are the image coordinates of the markers, a is the distance from the marker A and C to the center of the target reference frame and b is the distance from the marker B to the center of target reference frame, f is the focal length of the lens, More details of the algorithm can be found in [23].
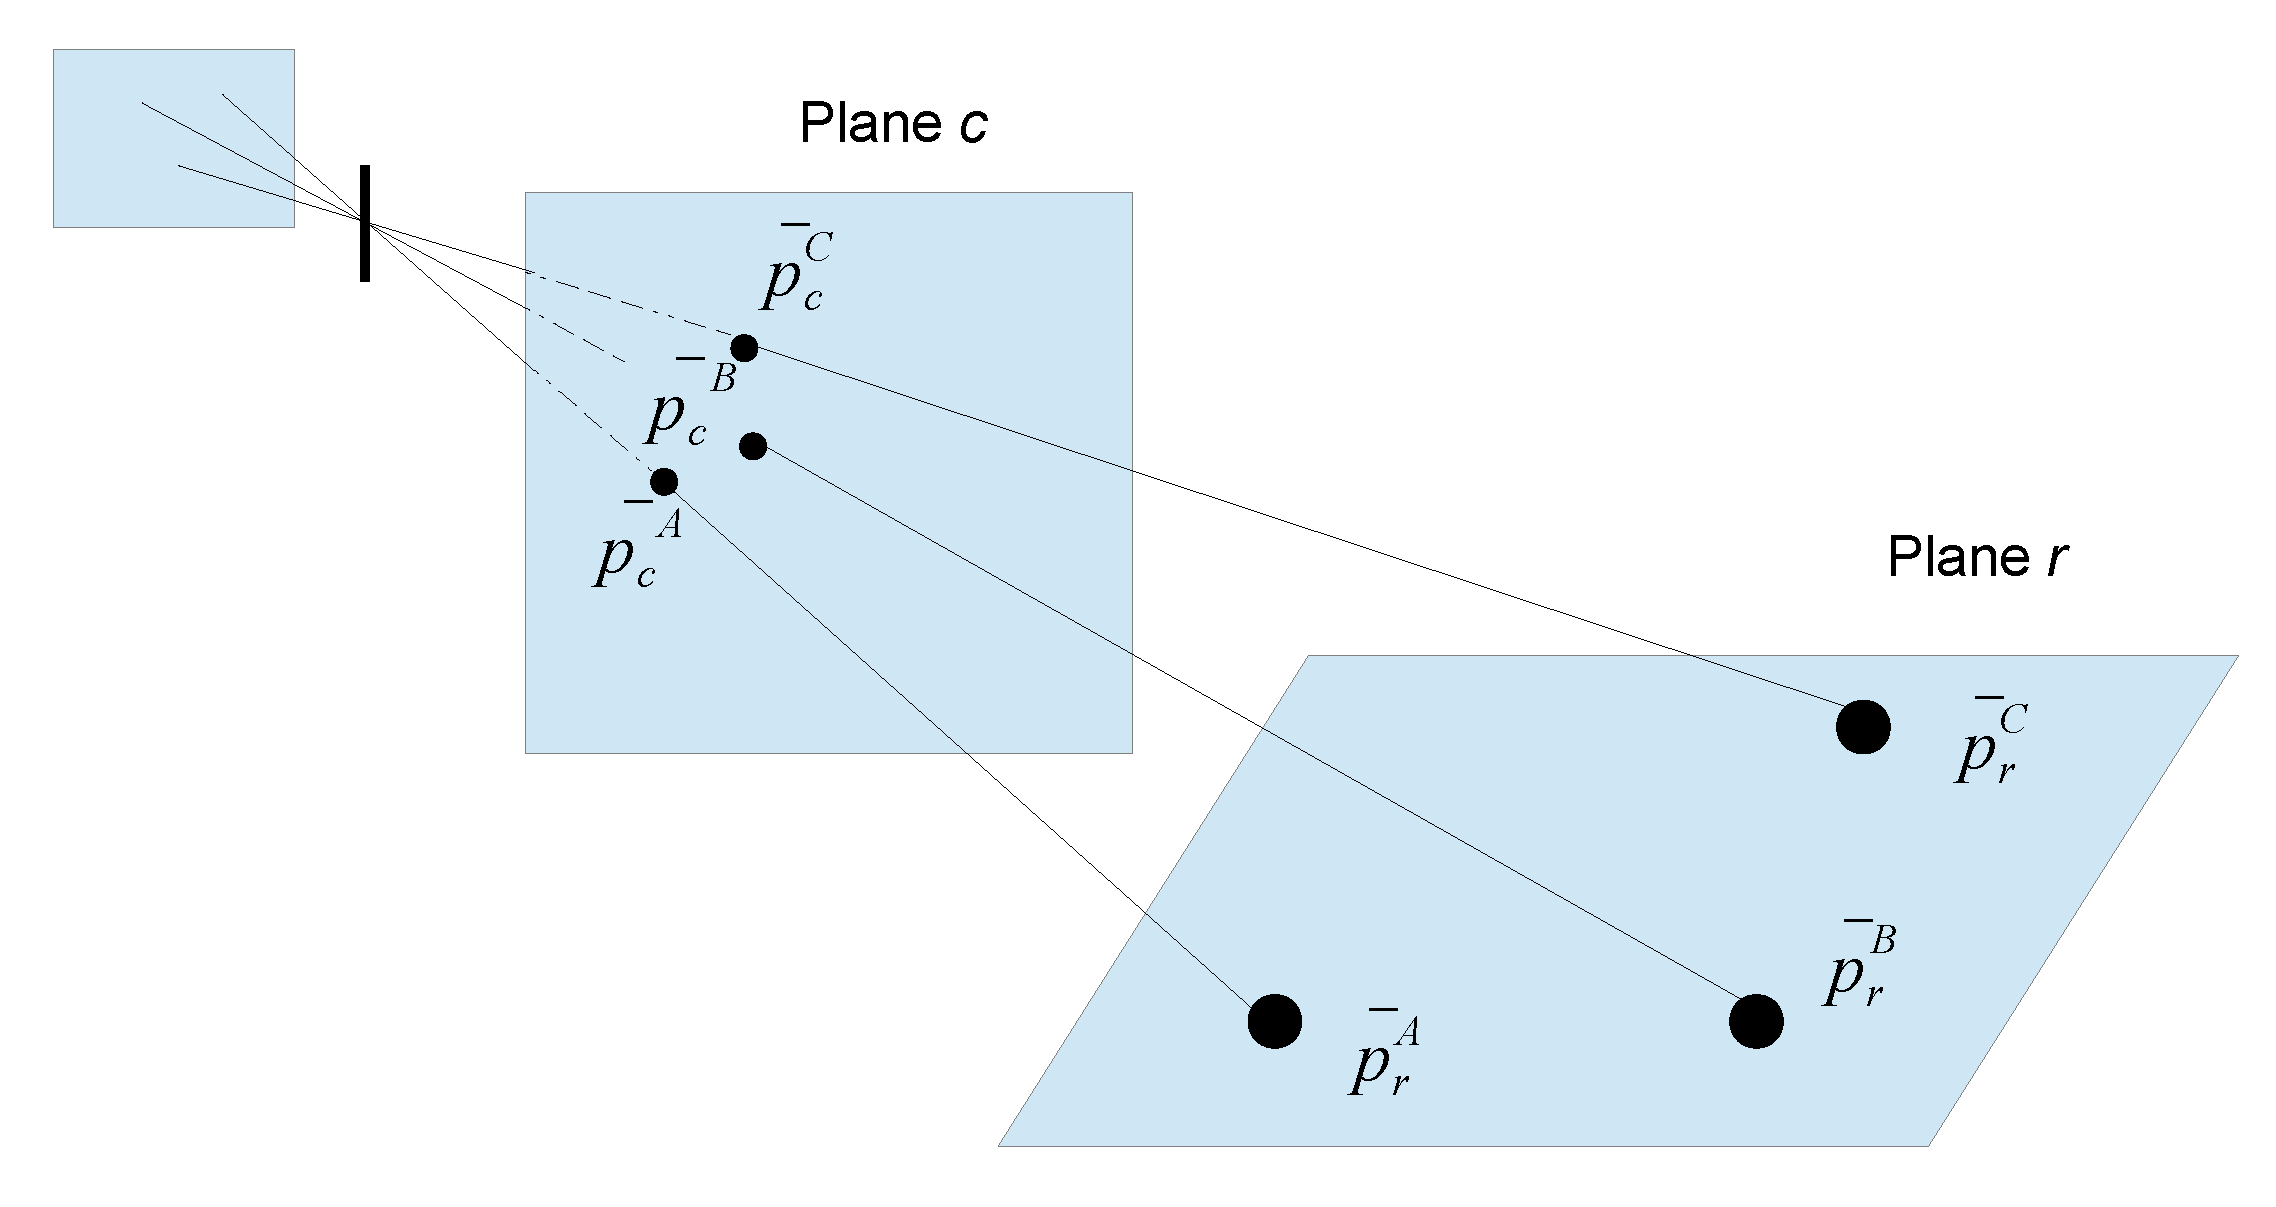
In terms of the relative orientation estimation, the algorithm presented in [23] has some assumptions and simplifications that do not fit our problem. There are two ambiguities when using a target with only three markers: an ambiguity in the signal when the target is rotated around the x axis and another ambiguity when the target is rotated around the y axis. For that reasons, we decided to develop a new algorithm for attitude estimation. For that, we considered the Figure 6. In first place, we rotate the ’plane r’ (the plane of the target) in order to place it parallel to the ’plane c’ (a mirror plane of the CCD sensor of the camera). Then, a scale factor is applied in order to obtain the same limits for both planes. Finally, a translation is applied to match the two planes.
This will allow us to transform any point from one referential frame into the other:
p c = α R p r + t r
In this perspective projection α is a scale factor (which depends on the focal length), R is the rotation matrix, t r is the translation term, p c and p r are a point in the plane c (a mirror plane of the sensor of the camera) and in the plane r (plane of the target) respectively. With reference to Figure 4 and according to the Figure 6 the vectors p ¯ c and p ¯ r are defined as:
p ¯ c R 3 : p ¯ c = p c u p c v 0
p ¯ r R 3 : p ¯ r = p r x p r y p r z .
Beginning by eliminating the translation term in Equation (7):
p ¯ c A p ¯ c B = α R p ¯ r A p ¯ r B p ¯ c A p ¯ c C = α R p ¯ r A p ¯ r C p ¯ c B p ¯ c C = α R p ¯ r B p ¯ r C RR T = I
In matricial form:
P p c = p ¯ c A p ¯ c B p ¯ c A p ¯ c C p ¯ c B p ¯ c C R 3 x 3
P p r = p ¯ r A p ¯ r B p ¯ r A p ¯ r C p ¯ r B p ¯ r C R 3 x 3 .
Once,
P p c = α R P p r ,
then,
p ¯ c A p ¯ c B p ¯ c A p ¯ c C p ¯ c B p ¯ c C =
= α R p ¯ r A p ¯ r B p ¯ r A p ¯ r C p ¯ r B p ¯ r C .
In order to solve this, a pseudo-inverse is applied:
P p c P p r T = α R P p r P p r T .
Then we determine α R :
α R = P p c P p r T P p r P p r T 1 ,
converting the rotation matrix R into quaternion elements:
q 0 2 + q 1 2 q 2 2 q 3 2 = R 11 2 q 1 q 2 + 2 q 0 q 3 = R 12 2 q 1 q 2 2 q 0 q 3 = R 21 q 0 2 q 1 2 + q 2 2 q 3 2 = R 22 ,
where R 11 , R 12 , R 21 and R 22 are the coefficients of the matrix R and q 0 , q 1 , q 2 and q 3 are the quaternion elements.
Now, solving the equations in order to the quaternion elements:
q 0 4 1 2 R 11 + R 22 q 0 2 1 16 R 12 R 21 = 0 q 2 = 1 4 q 1 R 12 + R 21 q 3 = 1 4 q 0 R 12 R 21 q 1 4 1 2 R 22 R 11 q 1 2 + 1 16 R 12 + R 21 2 = 0
q = q 0 q 1 q 2 q 3 · 1 q 0 q 1 q 2 q 3 .
This is how we compute the attitude.

2.3. Resilience to Occlusions and Outliers Rejection

Just by itself, the color-based detector algorithm proved to be insufficient for a robust later pose estimation because of the false detections, the outliers and the noise in the color detections. On the other hand, partial occlusions of the target implies only a partial detection which would not allow a pose estimation. To overcome these limitations, we decided to develop a filter algorithm in a color-based context. The implemented algorithm allows an adaptive color detection, in the sense that each marker model is updated over time in order to make it more robust against changes in water turbidity conditions and underwater illumination changes. The main goal is to track the state of each of the three markers in the captured images. In our color tracker, we used a probabilistic Bayesian approach and in particular a sequential Monte Carlo technique and we considered two types of constraints related to the target in order to improve the performance of the filter: the geometrical constraints of the target and the constraints of the markers in the color space. The developed solution allowed to improve the performance of the relative pose estimator by rejecting outliers that occurs during the detection process and made it possible to obtain pose estimates in situations of temporary occlusion of the markers.
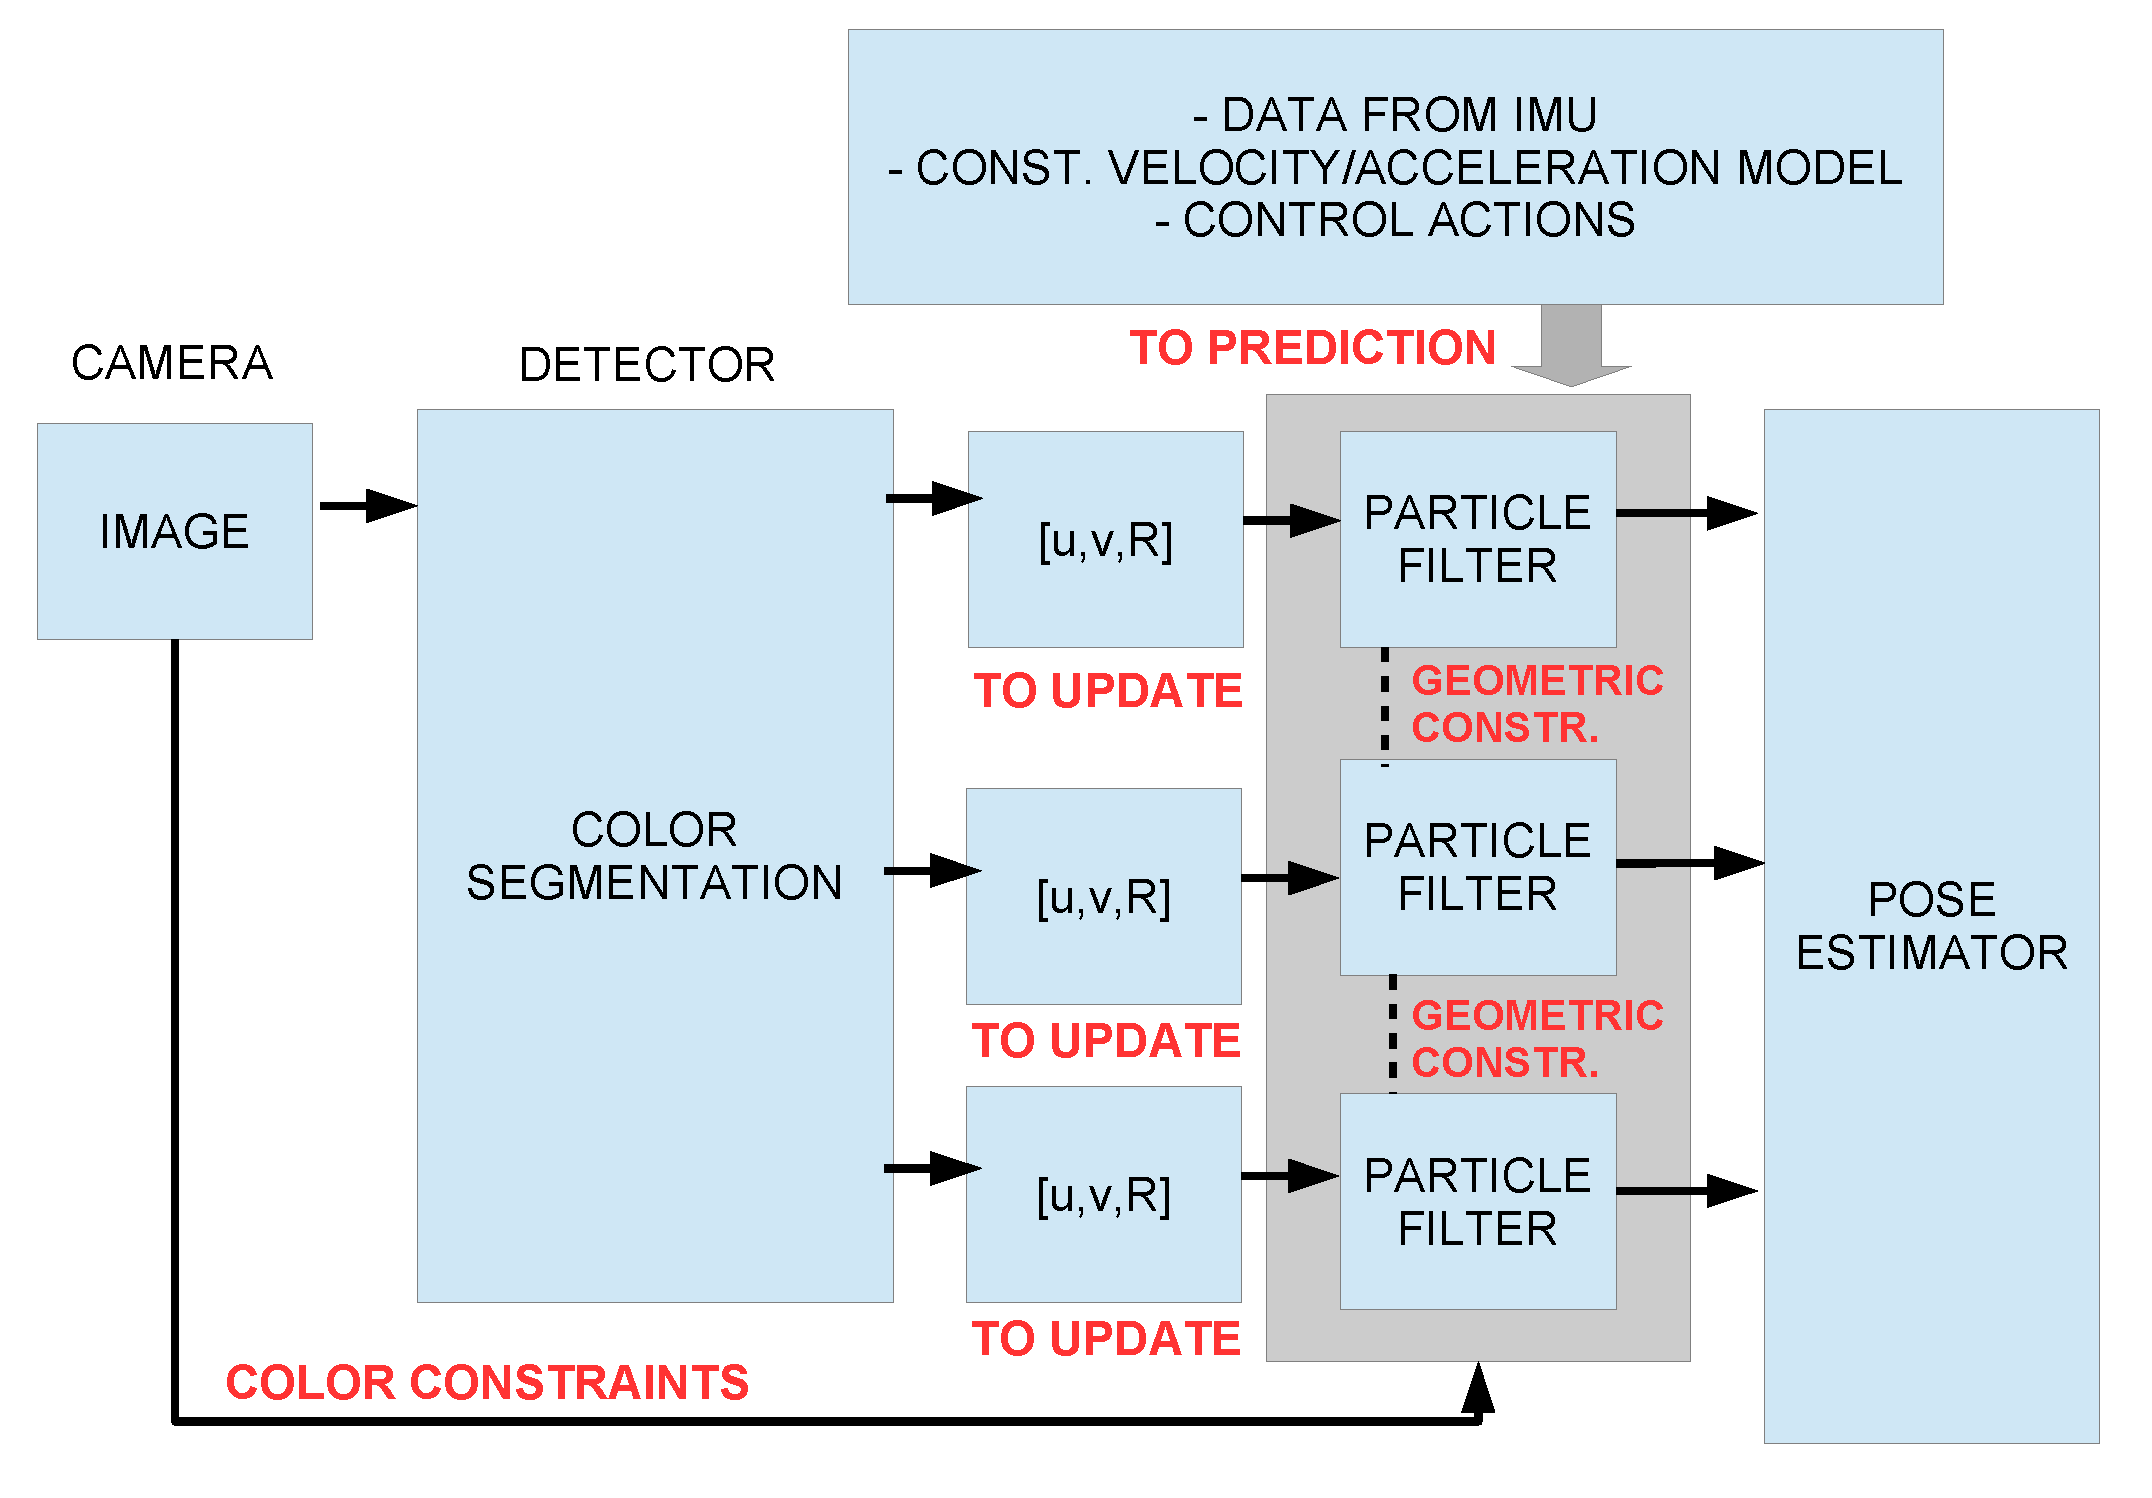
For the proposed tracking system, we developed the filters based on a particle filter framework. For the formal model of the particle filter we adopt the one presented on [24] and we choose the resampling method presented in [29]. The Figure 7 presents the scheme we propose for the proposed tracking system. As shown in the Figure 7, the filter block appears between the markers detector block and the pose estimator block. The filter block consists of three particle filters, one filter per each marker. Each particle filter receives from the detector block the position u , v and the radius R of the respective marker in the image.

2.3.1. Problem Formulation

Considering an image I composed by a set of pixels I x i , y j where i N 0 I w i d t h and j N 0 I h e i g h t , in the Hue, Saturation, Value (HSV) space I H S V where is extracted a set of color blobs B l = B l r e d , B l y e l l o w , B l g r e e n . Considering that in HSV color space, the Hue refers to the perceived color; the Saturation measures its dilution by white light (the “vividness” of the color); and the Value is the intensity information. The detector block is used to detect the color blobs in the HSV space. Based on that visual sensing, the position and the radius of each detected color blob B l k i is extracted from the image with some uncertainty. Each detected color blob in the image is represented by B l k i = u , v , r d B l . Where u , v is the position of the blob on the image and r d B l is the blob radius on the image. The blobs are selected considering the colour likelihood model, which is defined in a way that privilege the hypotheses with HSV values which are close to the reference HSV values and the blobs with bigger radius.
P ( B l c o l o r i ) = C 1 P c o l o r ( B l c o l o r i ) + C 2 r d B l c o l o r i m a x ( r d B l c o l o r ) ,
where C 1 and C 2 are parameters to weight the values given by the model color and radius. P c o l o r is a function that returns the mean probability of all pixels inside the circle defined by u , v , r d B l and considering the function (24).
Analyzing Equation (21), the probability P ( B l c o l o r i ) of being the color blob i will result from the sum (a fusion) of two terms. The first term C 1 P c o l o r ( B l c o l o r i ) concerns to constraints in the color space. The second term C 2 r d B l c o l o r i m a x ( r d B l c o l o r ) concerns to the geometric constraints of the target.
We want to use a particle filter per each marker that compose the target, to determining the position of each marker in an image. For each marker, a particle filter is implemented in order to make the system reliable under one marker occlusion. With three particle filters we increase the system redundancy making it more reliable. For each color marker B l C k , we have a state vector as presented below:
BlC k = u , v , r d B l , c x , c y , c r d B l ,
where k is the marker index, u , v is the position of the marker on the image, r d B l is the marker radius on the image and c x , c y , c z is the linear velocity. The BlC k is initialized with the values of B l k i which has the higher probability ( m a x ( P ( B l c o l o r ) ) on the set B l k . Each filter uses a constant velocity model (see Figure 7).

2.3.2. Considering Geometrical Constraints

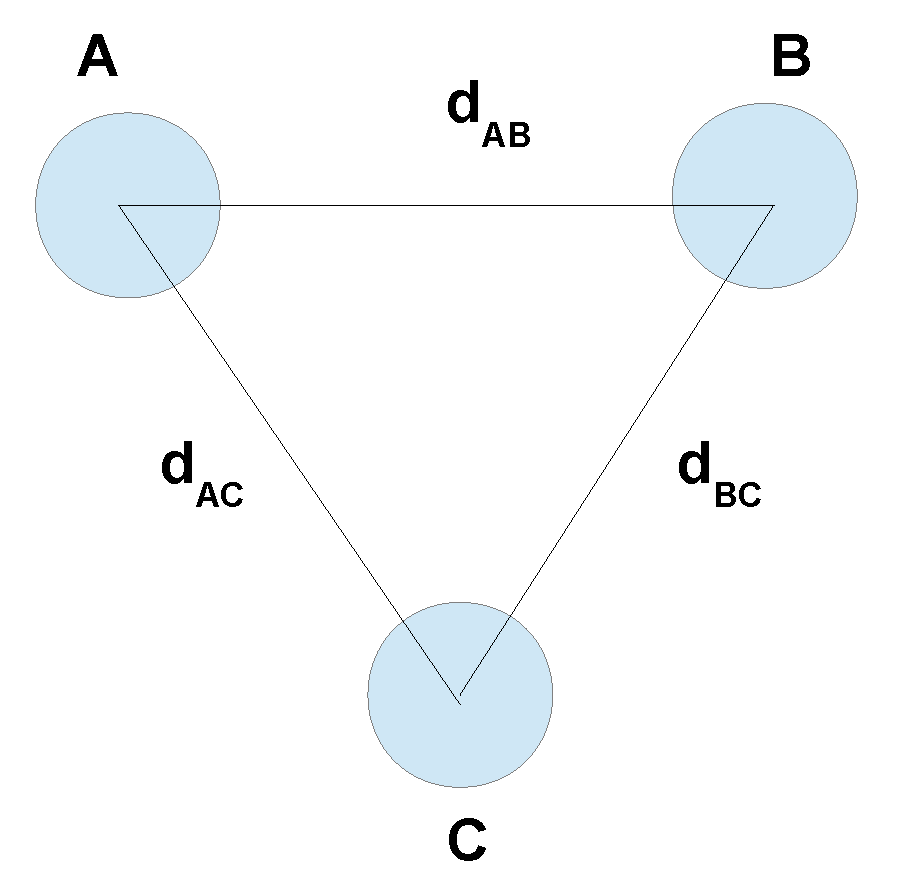
In the filter block (see Figure 7) we consider geometrical constraints related to the target in order to improve the performance of the filter. Since the target geometry is well-known, such as the distance between the three markers (see Figure 8) and the radius of each marker, we used this information to condition filter estimates.
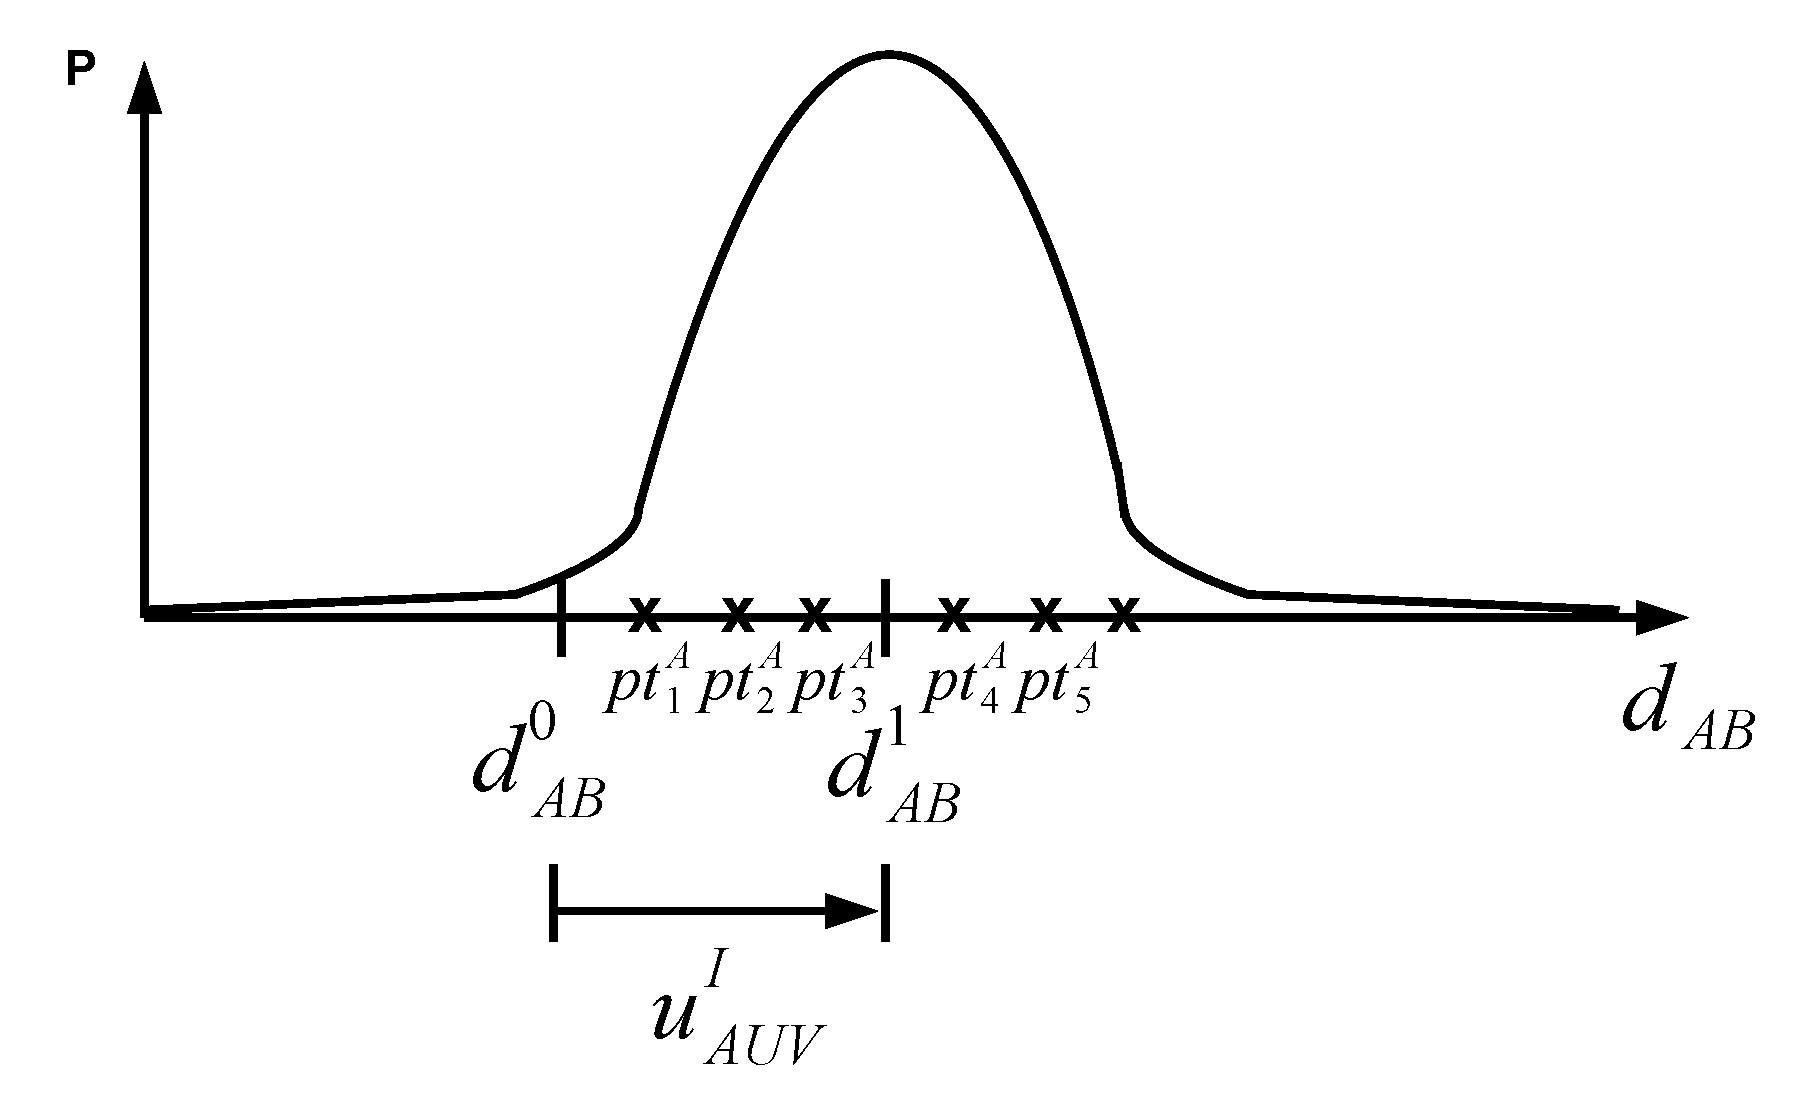
If the underwater scene contains other objects with a similar color to that of the markers, the colour cues became more prone to ambiguity. For that reason, it is necessary to use the target geometry constraints to allow the markers to be located with low ambiguity. When we take into account the geometric constraints, the procedure we implemented is as follow: considering the first instant t = 0 when the markers A and B are detected, the estimated distance d A B at t = 0 is d A B 0 . Supposing a time progression, at the instant t = 1 , the distance d A B 1 will change according to the movement of the AUV, that is:
d A B 1 = d A B 0 + u A U V I ,
where u A U V I is the movement of the AUV projected in the frame I of the camera. That movement depends on the proximity and pose of the AUV with regard to the target, and depend on the properties of the camera sensor and lens, namely the sensor size and the focal length:
u A U V I = F ˙ x , y , z , θ , ϕ , Ψ , f , s x = d ˙ A B ,
where θ , ϕ , Ψ are the angles of pitch, roll and yaw respectively and s x is the physical dimension of the CCD sensor in the x axis.
Knowing that,
x c , y c = f x w z w , f y w z w ,
where x w , y w , z w are coordinates in the referential associated with the center of the camera lens W, x c , y c are the coordinates in the referential associated with the CCD of the camera C, f is the focal length of the camera lens. We could say that,
d A B 2 = f x w A s x z w A f x w B s x z w B 2 + f y w A s x z w A f y w B s x z w B 2 .
The u A U V I depends on the pose of the AUV, However, if the initialized distance is based on a wrong marker position extraction, since the system has three particle filters, one per marker, the system will automatically reset the wrong initialized particle filter.
Considering that the movement uncertainty is described by a Gaussian function:
G ( x ) = 1 σ 2 π e ( x μ ) 2 2 σ 2 .
The probability of the particle p t i A is given by:
P p t i A = e d p t i d A B 0 u A U V I 2 σ 2 σ 2 π ,
where d p t i is the distance of particle p t i to the marker of reference (see Figure 9), and σ is the value of the standard deviation.
When there is no AUV velocity feedback in the particle filter, then:

2.3.3. Considering Constraints in the Color Space

In the filter block (see Figure 7) we also consider constraints in the color space in order to improve the performance of the filter. The assignment of weights to the particles takes into account the color information that is sampled from the image at the inside of each particle. σ = m a x u A U V I and u A U V I = 0 .
In order to consider the color constraints, we developed and implemented the follows procedure: For each particle p t i with position p i R 2 in the image, will be evaluated N points of color p o c j R 3 (HSV color space), at positions o j R 2 such as:
p o c j o j , p o c j R 3 , o j R 2 , j 1 , , N : p i o j < r d ,
where r d is the estimated radius of the corresponding marker.
Considering the particle p t i A referring to the marker A and described by the parameters u , v and r d , where u , v are the localization of the particle in the image, and r d is the estimated radius for the marker A. See the Figure 10
The probability P p t i A will be the result of nine samples such as:
P p t i A = P A i ( u , v ) × P A i ( u a , v ) × P A i ( u , v a ) × × P ¯ A i ( u b , v ) × P ¯ A i ( u , v b ) .
P p t i A = j = 1 9 P A o j
o j = u r d δ v r d δ
o 0 = u v ,
where δ is a constant adjustable parameter that serves to place the sample on the periphery of the markers edges. P A i ( u , v ) is a value according to the color of the pixel i ( u , v ) , positioning at position u , v of the image I. The P A i ( u , v ) = F A H , S , V , where F A H , S , V is a discrete function and with auto adjustable value.
If the components H , S , V of the i ( u , v ) are within the pre-defined reference HSV range (See the Figure 11), then P A i ( u , v ) = 1 . Otherwise, P A i ( u , v ) = γ m i n . Where, γ m i n is a parameter of non-zero value that ensures that in case of an outlier in color, do not lead to P p t i A = 0 .

2.3.4. Automatic Color Adjustment

In an underwater environment, the color changes along the water column due not only to the luminosity but also to the turbidity of the water. The idea here is to readjust the graph of the Figure 11 for the actual context of the system and in this way, obtain a more adjusted definition of the color of the marker in order to reduce the probability of a false detection of the marker being assumed to be true.
We pick a sample of the color components H , S , V at the most representative particles, the particles with greater weight. With that samples we construct a histogram of occurrences of each component value. Instead of using the reference intervals for each component H , S , V we started to use that histogram, and the reference values for the color components becomes that which occurs more often. Considering for example the marker with the red color, the probability function of the red marker is initialized as:
P H , S , V r e d = 1 i f H m i n r e d < H < H m a x r e d S m i n r e d < S < S m a x r e d V m i n r e d < V < V m a x r e d 0 . 5 i f S > S s a t V > V s a t 0 o t h e r w i s e
The function is discretized in N values in the space of each component. In this way, an occurrence histogram, HI , is created for each color component, H , S , V (See the Figure 12). Assuming initially the value 0 in each Bin of the histograms HI H k , HI S k , HI V k .
At the first instant in which the target is tracked then, for each marker the N particles of greater probability are selected. Using the inner five pixels (the same used for color constraints Section 2.3.3), P i x e l i ( u , v ) , P i x e l i ( u a , v ) and P i x e l i ( u , v a ) . The values of the H S V components of that pixels will be used to increment the histograms HI H k , HI S k , HI V k for each marker. That is,
HI H k = HI H k 1 + HI H P i x e l 0 , P a r t i c l e 0 + + HI H P i x e l 5 , P a r t i c l e N HI S k = HI S k 1 + HI S P i x e l 0 , P a r t i c l e 0 + + HI S P i x e l 5 , P a r t i c l e N HI V k = HI V k 1 + HI V P i x e l 0 , P a r t i c l e 0 + + HI V P i x e l 5 , P a r t i c l e N .
Since each color marker will have its histogram, HI H k , HI S k , HI V k G r e e n , HI H k , HI S k , HI V k B l u e and HI H k , HI S k , HI V k Y e l l o w , then, taking the example of the red marker, at the instant T the function P H , S , V r e d described in Equation (34) becomes:
P H , S , V r e d = HI H k H m a x HI H k × HI S k S m a x HI S k × HI V k V m a x HI V k .
The function (36) is the new probability function to be used in the Filter with constraints in the color space.

3. Mvido: Theoretical Characterization of the System Camera-Target

We consider here the image sensor characterized by it physical dimension s x and s y and by it resolution in pixels, s x p and s y p (see Figure 13). We consider that the target is characterized by its dimension, s L x and s L y , and by the radius of each of the three spheres that compose the target, r d s p h e r e (see Figure 13). For the theoretical characterization of the system, we consider the model presented in Figure 14, which relates the horizontal field of view of the camera H F O V , the horizontal sensor size s y and the working distance W D for a given angle of view A O V .
Assuming that, we start by characterizing the minimum distance at which the camera could see the target.
For that, we consider the rectilinear lens field of view as a function of lens focal length:
H F O V = W D S y f
From the Equation (37) and the model Figure 14, we can arrive at the minimum working distance, W D m i n , that will be given by:
W D m i n = O P A f O P B
where,
O P A = max s L x , s L y
and
O P B = min s x , s y .
We choose for O P A and for O P B the worst case, i.e., the case that is more limiting. Therefore, O P A = s L y because for our target the measured s L y is greater than the s L x measurement, and O P B = s x because for CCD camera sensor the measured s x is less than the s y measurement. Whereby, for the used camera and lens and for the used target, the minimum distance between the camera and the target that ensure that the entire target is visible in the image is:
W D m i n 0.66 m .
We also defined the maximum distance at which each marker is detectable, considering ideal conditions of visibility and constant luminosity. For that, let us consider the resolution of the sensor as a function of field of view:
r e s o l u t i o n = N p i x e l s H F O V
where N p i x e l s is the horizontal number of pixels of the camera sensor. In that way, the working distance W D in terms of r d s p h e r e and number of pixels N p i x e l s of the sensor, is given by:
W D = N p i x e l s s y r d s p h e r e f .
From that, we considered that the maximum working distance (the worst case) is given by:
W D m a x = O P A 1 O P B r d s p h e r e f ,
where
O P A 1 = min N p i x e l s x , N p i x e l s y .
The worst scenario is when the maximum working distance is a small value so we choose the smaller number of pixels, i.e., N p i x e l s x = 576 p i x e l s and the smaller measure of the CCD sensor s x = 0.0024 m. Therefore, for the used camera and lens and for the used target, the maximum working distance is:
W D m a x 4.4 m .
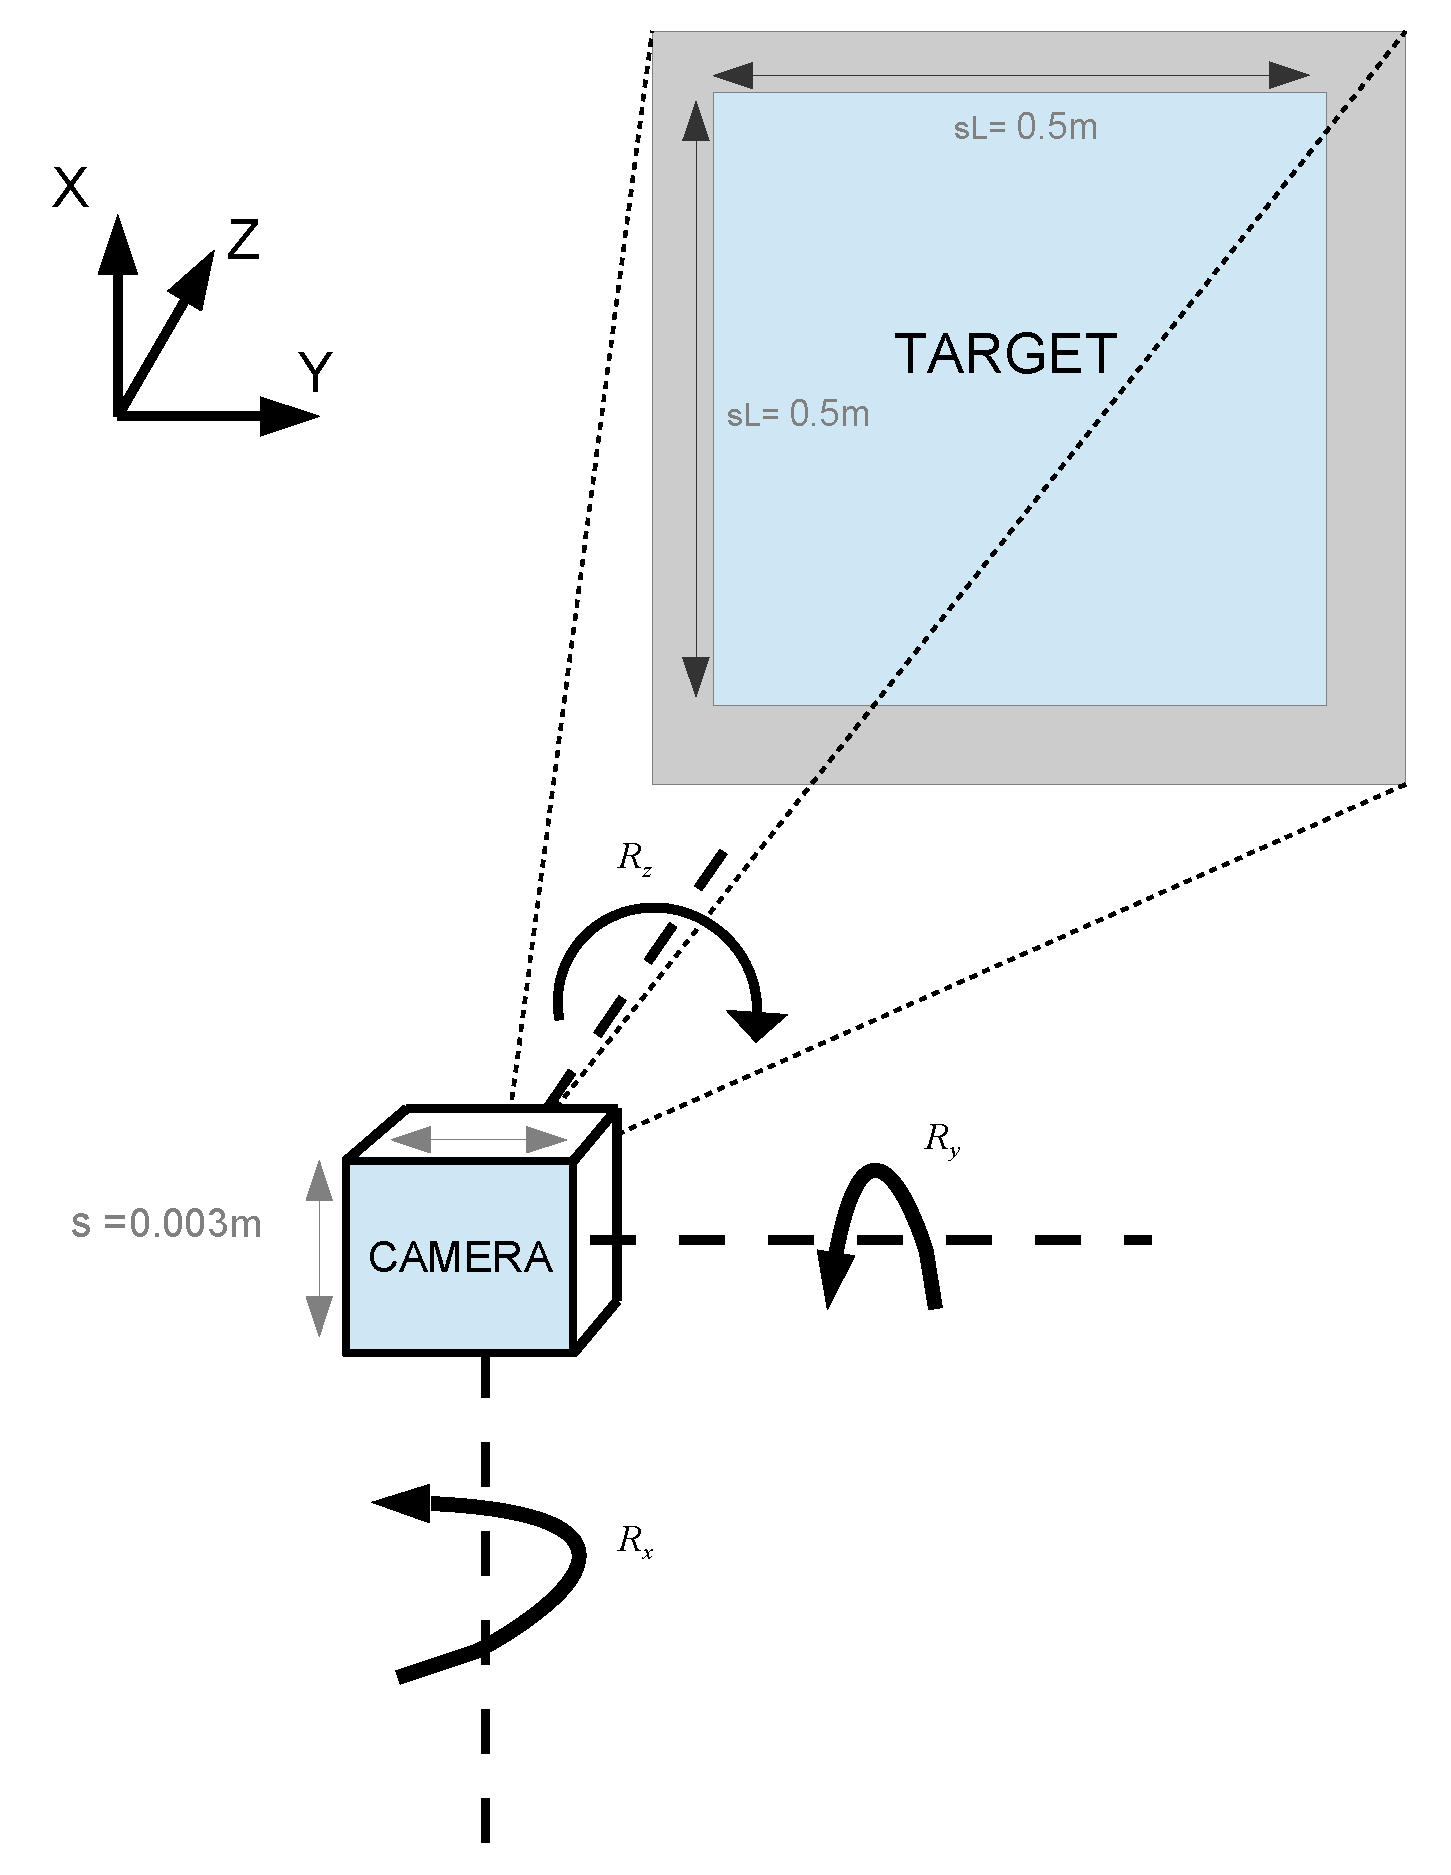
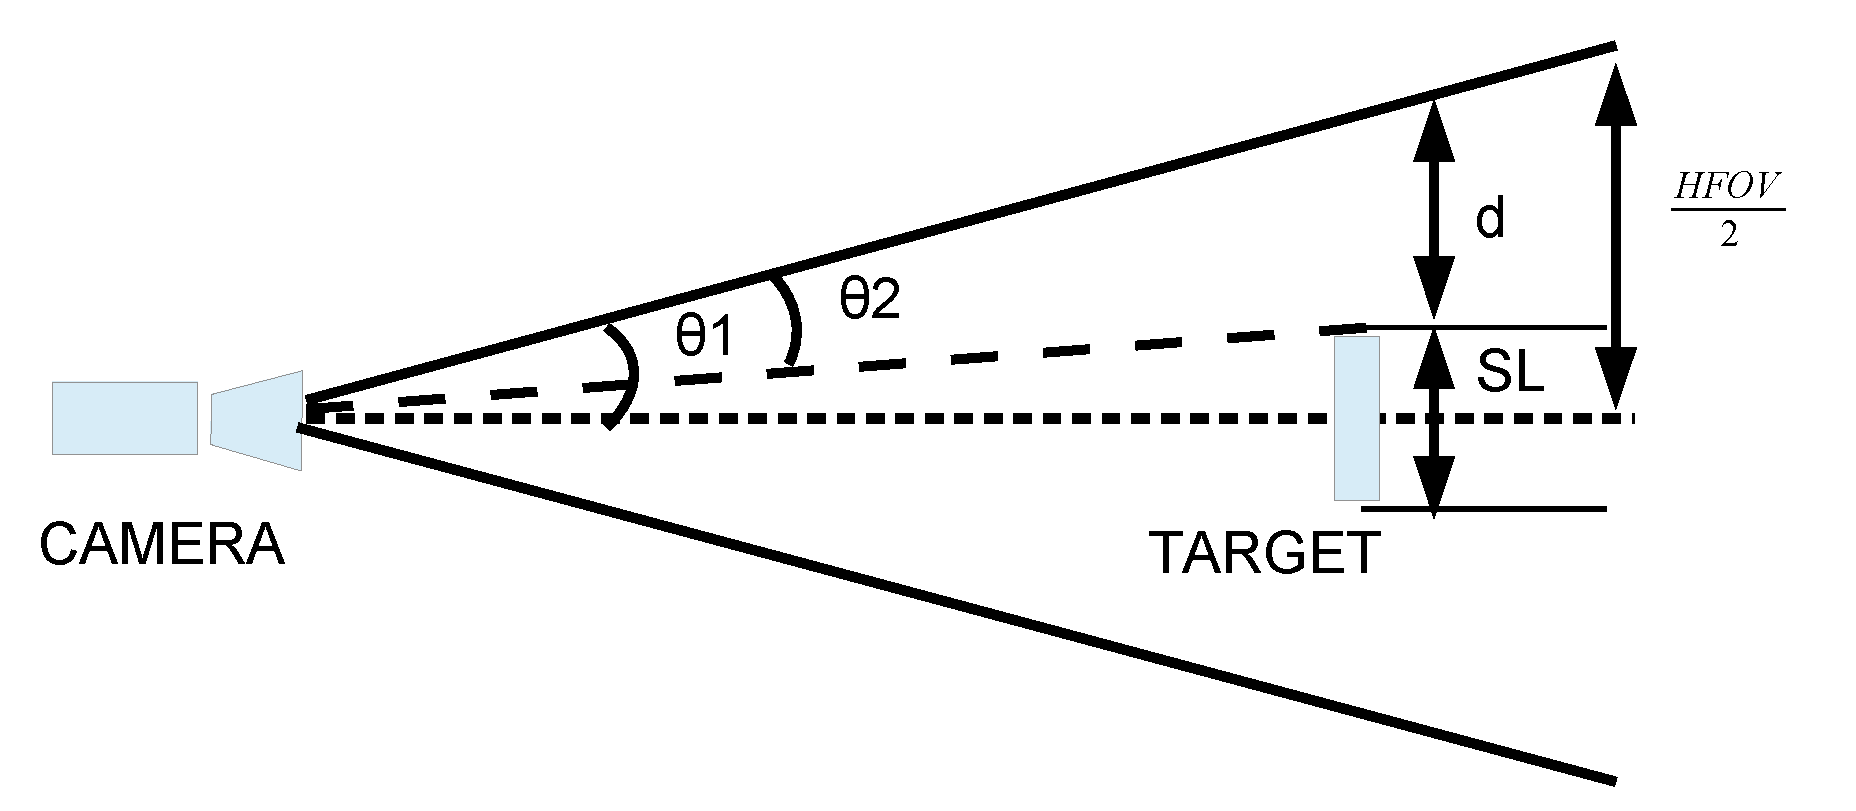
To define the limit pose of the camera without the target leaving the image projected in the sensor, we considered the worst case in terms of clearance between the target and frame boundaries, that is, we consider the target and the sensor as squares (as illustrated in Figure 15).
Lets consider the Figure 16,
Thus, the rotation of the camera around the z-axis has no relevance, and the analysis will be done for the rotations around x-axis and y-axis, in which case the analysis is the same.
Taking into account Figure 16 and Figure 14, then
θ m a x = θ 1 θ 2
θ 1 = A O V 2 = t g 1 s 2 f
θ 2 = t g 1 s L 2 W D
θ m a x = θ 1 θ 2
θ m a x = t g 1 s 2 f t g 1 s L 2 W D
Given the characteristics of our CCD sensor, our lens and our target, the graph of the following Figure 17 represents the maximum rotation of the camera in R x or R y as a function of the working distance, in order not to lose the target.

Sensitivity Analysis

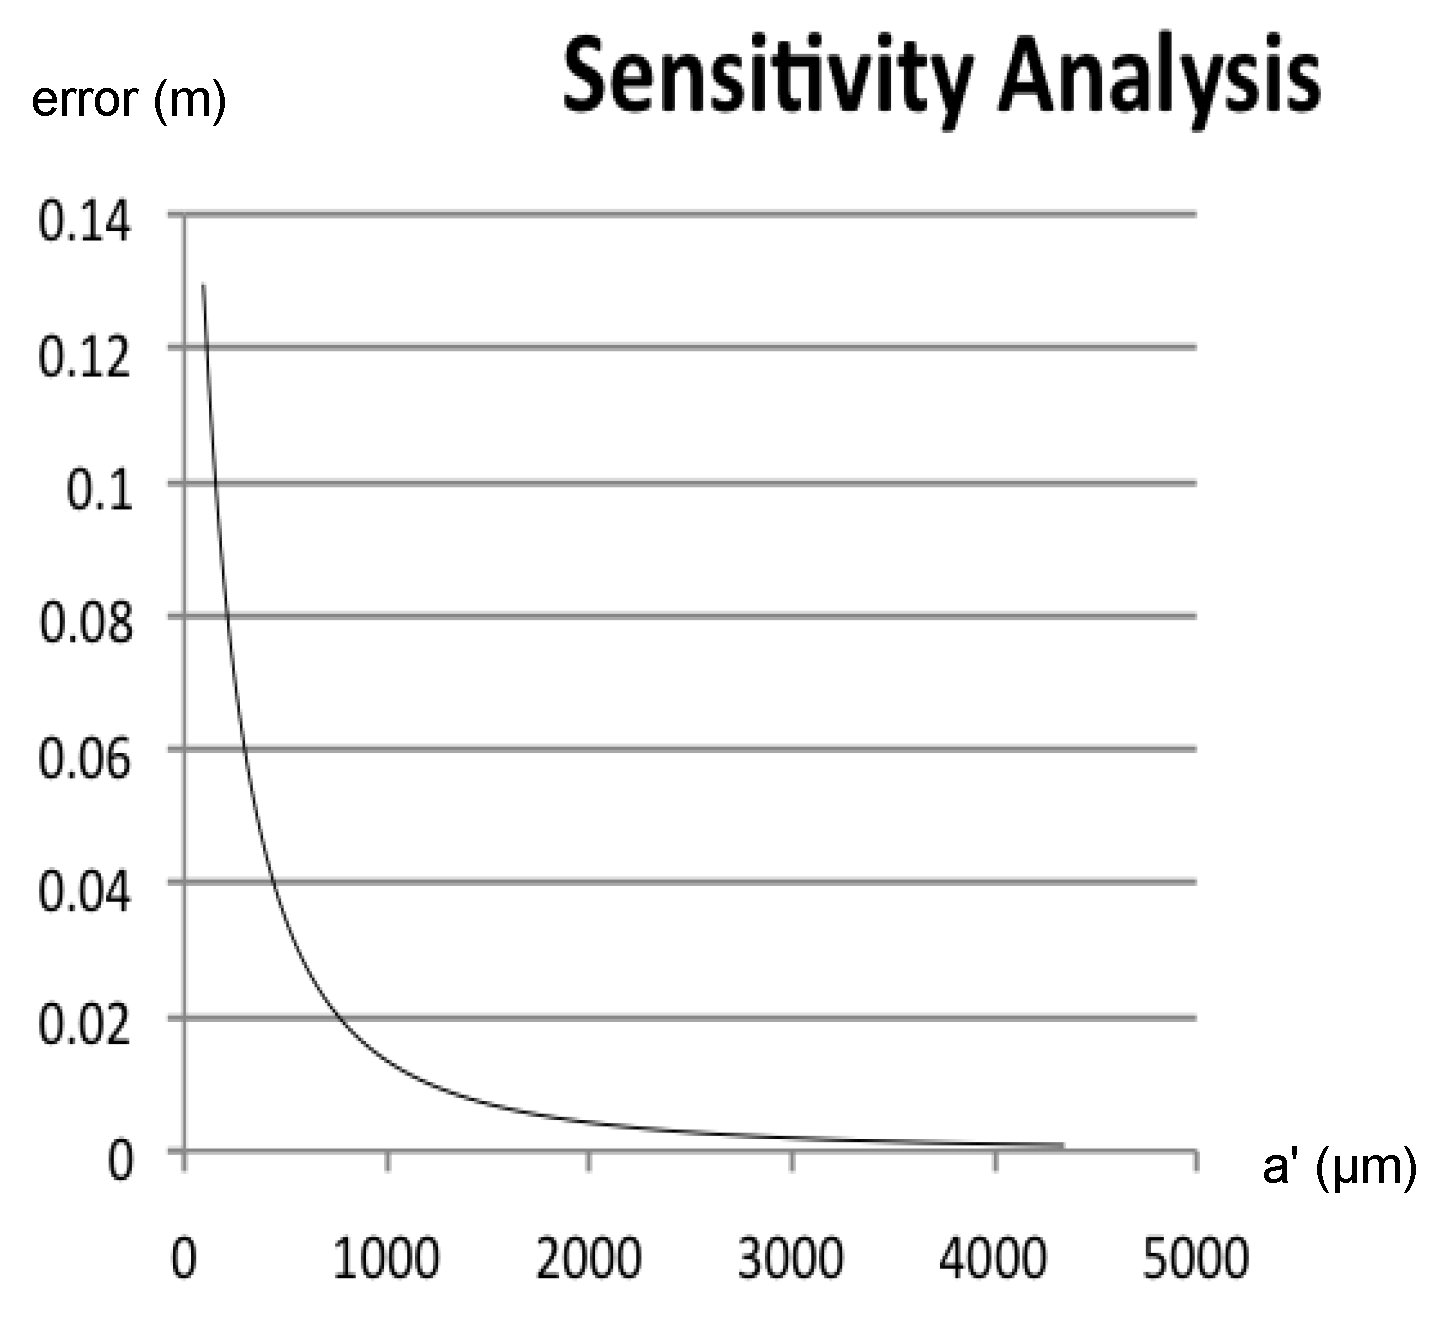
We want to know how the error of the location of a marker in the image is reflected in our estimate. The algorithm we use to estimate the relative localization, estimates Z e from the following simplified equation:
z e = f 2 ( b 2 ( u C u A ) 2 + b 2 ( v C v A ) 2 + a 2 ( u A + u C 2 u B ) 2 + a 2 ( v C + v A 2 v B ) 2 ) ( u C v B u C v A + u A v C + v A u B u A v B v C u B ) 2 + 4 a 2 f 4 b 2 ,
where ( u A , v A ) , ( u A , v A ) and ( u A , v A ) are the coordinates in the image of the marker A, B and C respectively. The uncertainty in z e is obtained by taking the partial derivatives of z e with respect to each variable u A , u B , u C , v A , v B and v C , then, the uncertainty in z e is given by:
Δ z e = z e u A . Δ u A 2 + z e u B . Δ u B 2 + z e u C . Δ u C 2 + z e v A . Δ v A 2 + z e v B . Δ v B 2 + z e v C . Δ v C 2 .
In an ideal case, without noise in the marker’s detection, the uncertainties associated with each variable Δ u A , Δ u B , Δ u C , Δ v A , Δ v B and Δ v C are the uncertainty associated with the description, that is 1 (one) pixel. From the experimental validation of the detection algorithm, we know that the uncertainty associated with each variable Δ u A , Δ u B , Δ u C , Δ v A , Δ v B and Δ v C is about 10 pixels on average. In order to analyze how the error of the location of a marker in the image is reflected in the estimate of z e we proceed with a linearization around a point. In this sense, the red marker was centered at zero in the image, and we vary the projection of a in the image. We know that the real measure of a (see Figure 18) when projected onto the image becomes a . In the image, a varies depending on the distance the target is from the camera. When the target moves away from the camera, the value of a decreases and vice versa.
The graph of the following Figure 19 shows the result obtained, considering for each variable the uncertainty associated with a description and the uncertainties on the markers detection:

4. Mvido: Guidance Law

It is a challenge to define guidance laws that conduct the AUV to the dock, while keeping visual markers in sight. For our point of view, the solution can be based on basic motion primitives that are already implemented by the vehicle on-board control system. This section describes the implementation of a guidance system for docking maneuvers for a hovering AUV. We address the problem of driving the AUV to a docking station with the help of visual markers detected by the vehicle on-board camera, and show that by adequately choosing the references for the linear degrees of freedom of the AUV it is possible to conduct it to the dock while keeping those markers in the field of view of the on-board camera. We address the problem of defining a guidance law for a hovering AUV when performing a docking maneuver. We used as a case study the docking of AUV MARES, but our approach is pretty general and can be applied to any hovering vehicle. During the docking, it is of utmost importance that the visual markers are within the field of view of the camera. Considering a local frame with origin in the center of the markers, with the usual North-East-Down convention, there should be a compromise between the motion on the vertical coordinate z and the motion on the horizontal plane ρ = x 2 + y 2 (where x and y are Cartesian coordinates) from the center of the markers to the center of the AUV’s camera. We want to ensure that the ratio z ρ gives a slope greater than the slope of the cone, which is defined by the angle of view of the camera A O V . This means that we define the condition:
ρ z . t a n ( A O V 2 )
As is commonly the case with AUVs, we consider here that its on-board control system is able to independently control its DOFs. Relevant for this work is the ability to keep a fixed position on the horizontal plane and of keeping a given depth. Such controllers are part of the Mares on-board control system as described in [1]. For the purpose of defining the guidance law and testing its performance, we model here the closed-loop behavior of the AUV as a first-order system, both in the horizontal plane and in the vertical coordinate [30,31]. Two decoupled models were considered: a model for the behavior in the horizontal plane ρ and a model for the behavior in the vertical coordinate z. In this way:
Z ( s ) Z r e f ( s ) = p z s + p z
P ( s ) P r e f ( s ) = p h s + p h ,
where P ( s ) and Z ( s ) are respectively the Laplace transforms of ρ and of the vertical coordinate z. In order to drive the AUV to the cradle while keeping the markers within the camera field of view, we propose a guidance law that can ensures a much faster convergence of ρ to zero that of z to zero. This law is defined by:
ρ r e f ( t ) = 0
and,
z r e f ( t ) = ρ ( t ) e ( T s Z T s P ) ε ρ t ,
where ( T s Z T s P ) is the difference between the settling times of the closed loop models (vertical and horizontal) for a unit step input, and ε ρ is the actual error to the reference of ρ .
For this assumptions it is possible to conclude that
lim t ρ ( t ) z ( t ) = 0 .
Observation: in our law, we force a restriction on the evolution generated for the reference z r e f ( t ) by a condition: reference values below to z 0 are not considered, keeping the actual z.

5. Experimental Results: Pose Estimator and Tracking System

5.1. Experimental Setup

5.1.1. Pose Estimator

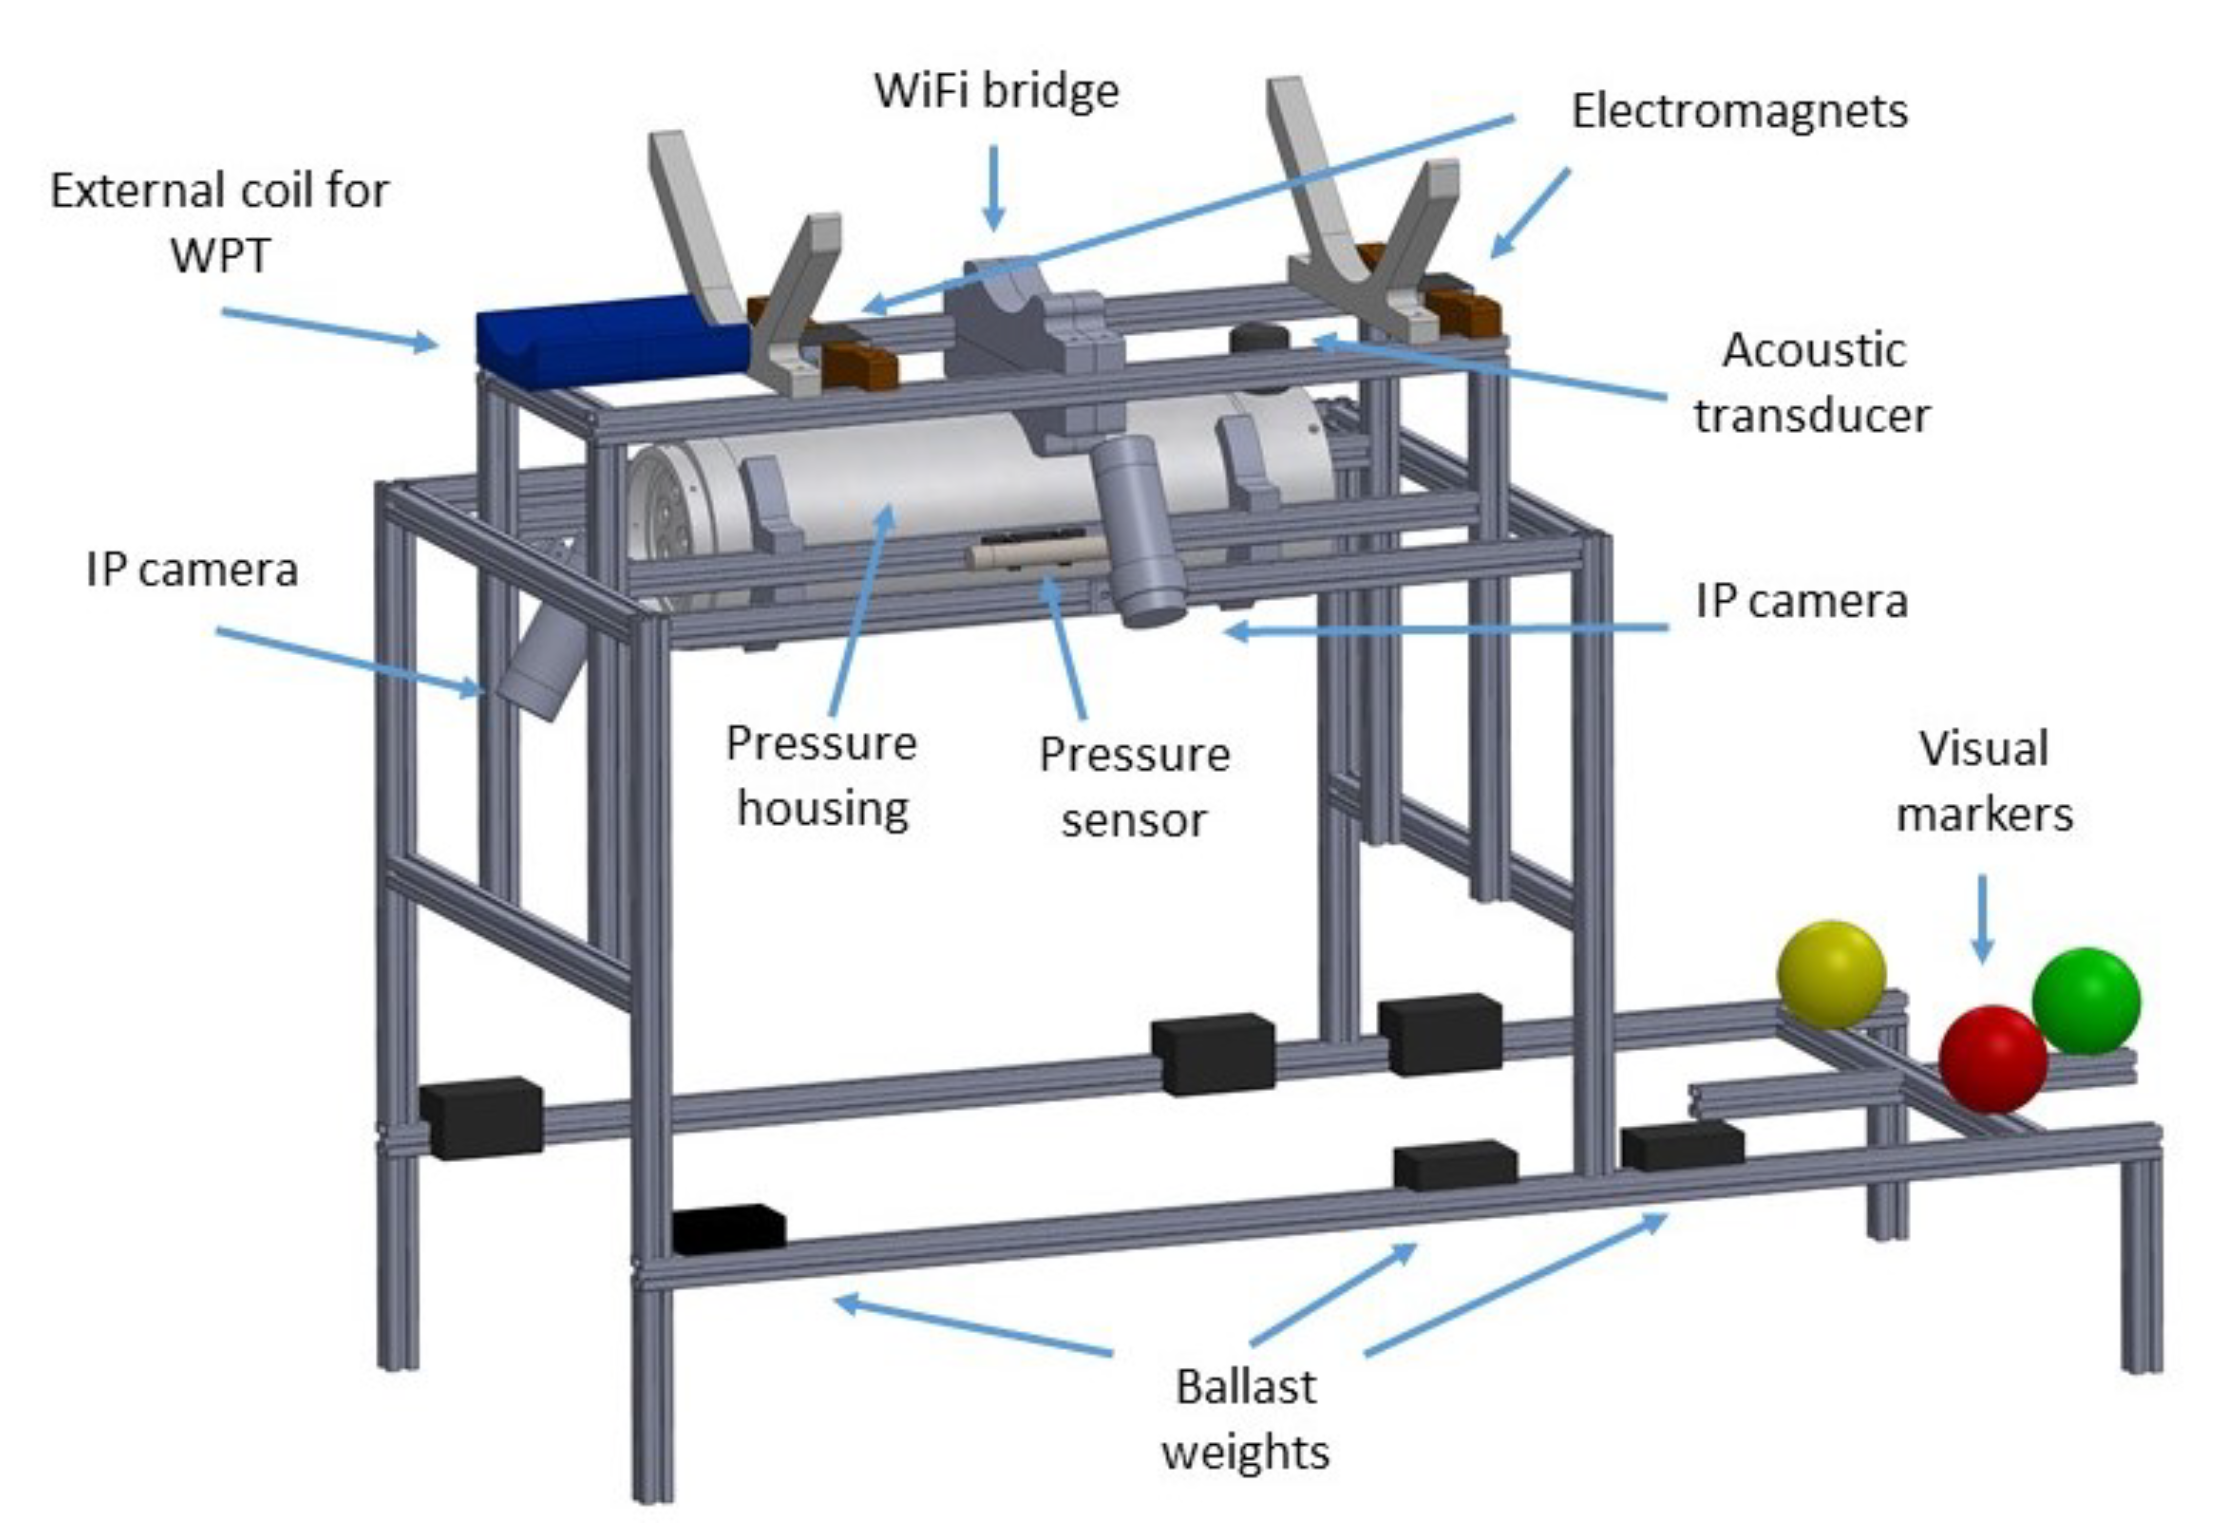
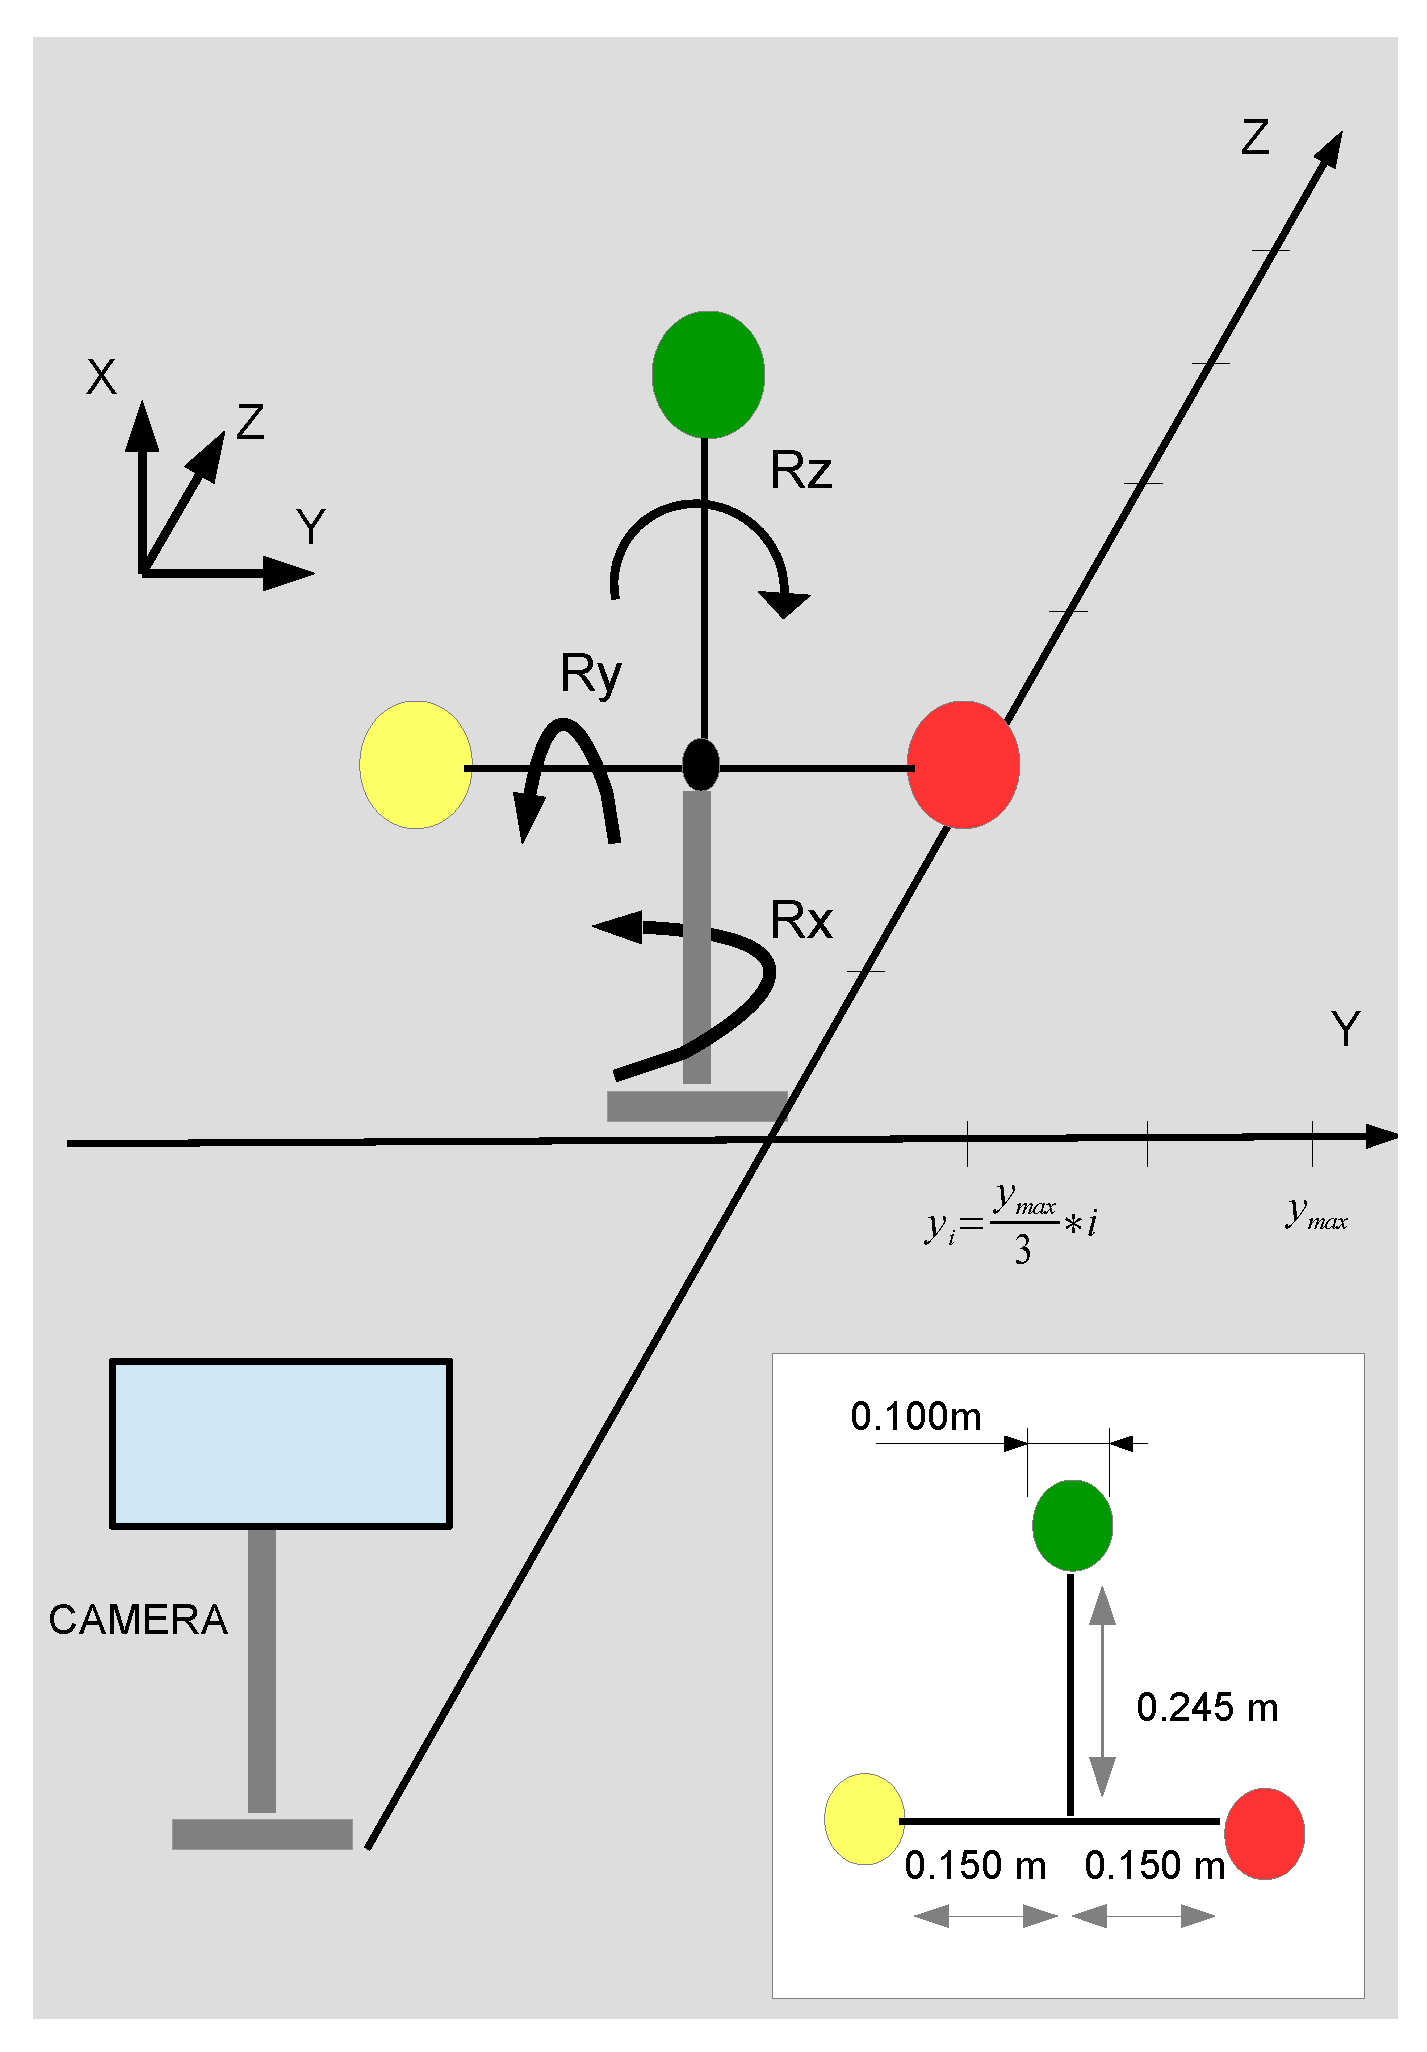
For the experimental validation of the relative pose estimates, the AUV MARES camera was placed at a fixed position and then using tube rails, the target were moved along the longitudinal and lateral axes to specified known positions, as illustrated in Figure 20 and Figure 21. At each position, the markers platform was rotated around the longitudinal, lateral and vertical axis by different known angles. All that experimental procedure was done under a specific lighting condition. This procedure was done with the hardware in the loop, and 109 videos captures were made with a duration of 1 min each, taking into account the on-board storage capacity of the hardware. The resulting logs are compared against the ground truth given by this process.

5.1.2. Tracking System

To test the developed filter, the target was placed in the bottom of a tank, and the AUV Mares started a dive from the surface, four meters from the target, towards the target. The AUV Mares stops when arrives at close proximity of the target (1 m from the target). A video from the AUV onboard camera was captured during the test. That video was used to test the filter. During the video an outlier and temporary occlusions of the marks were created as detailed in the Figure 22. Contrary to the experimental validation of the pose estimator, where ground truth was made, the experimental validation of the filter was essentially qualitative, since no ground truth was done.

5.2. Results

5.2.1. Pose Estimator

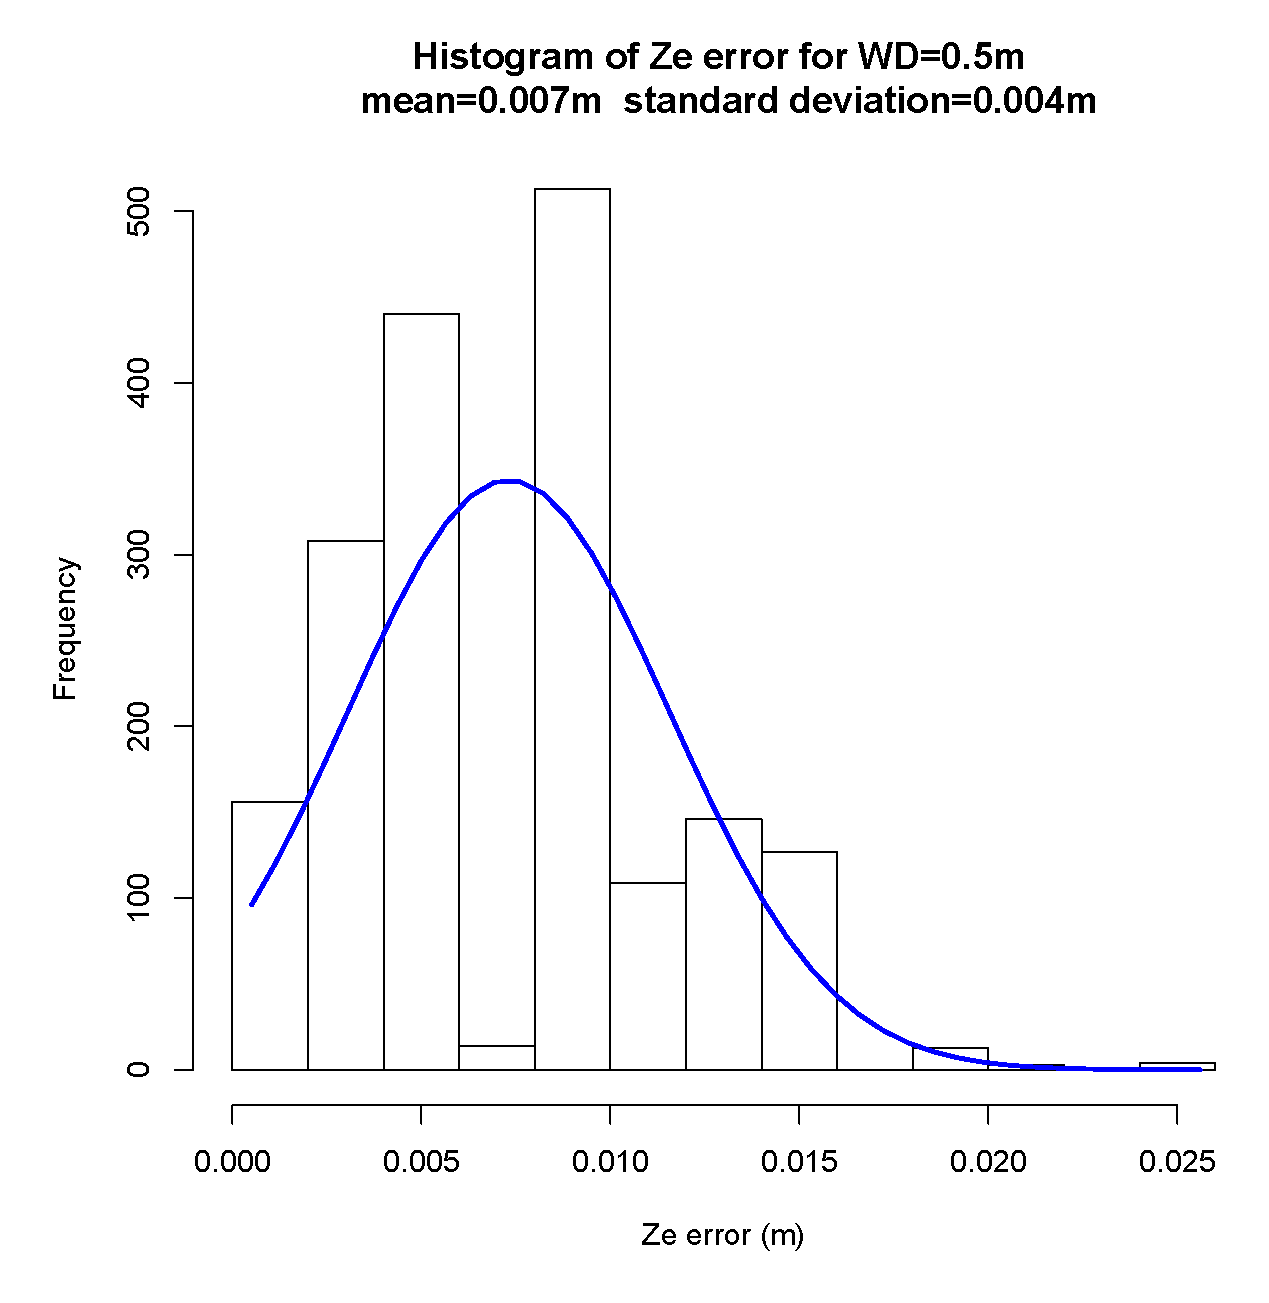
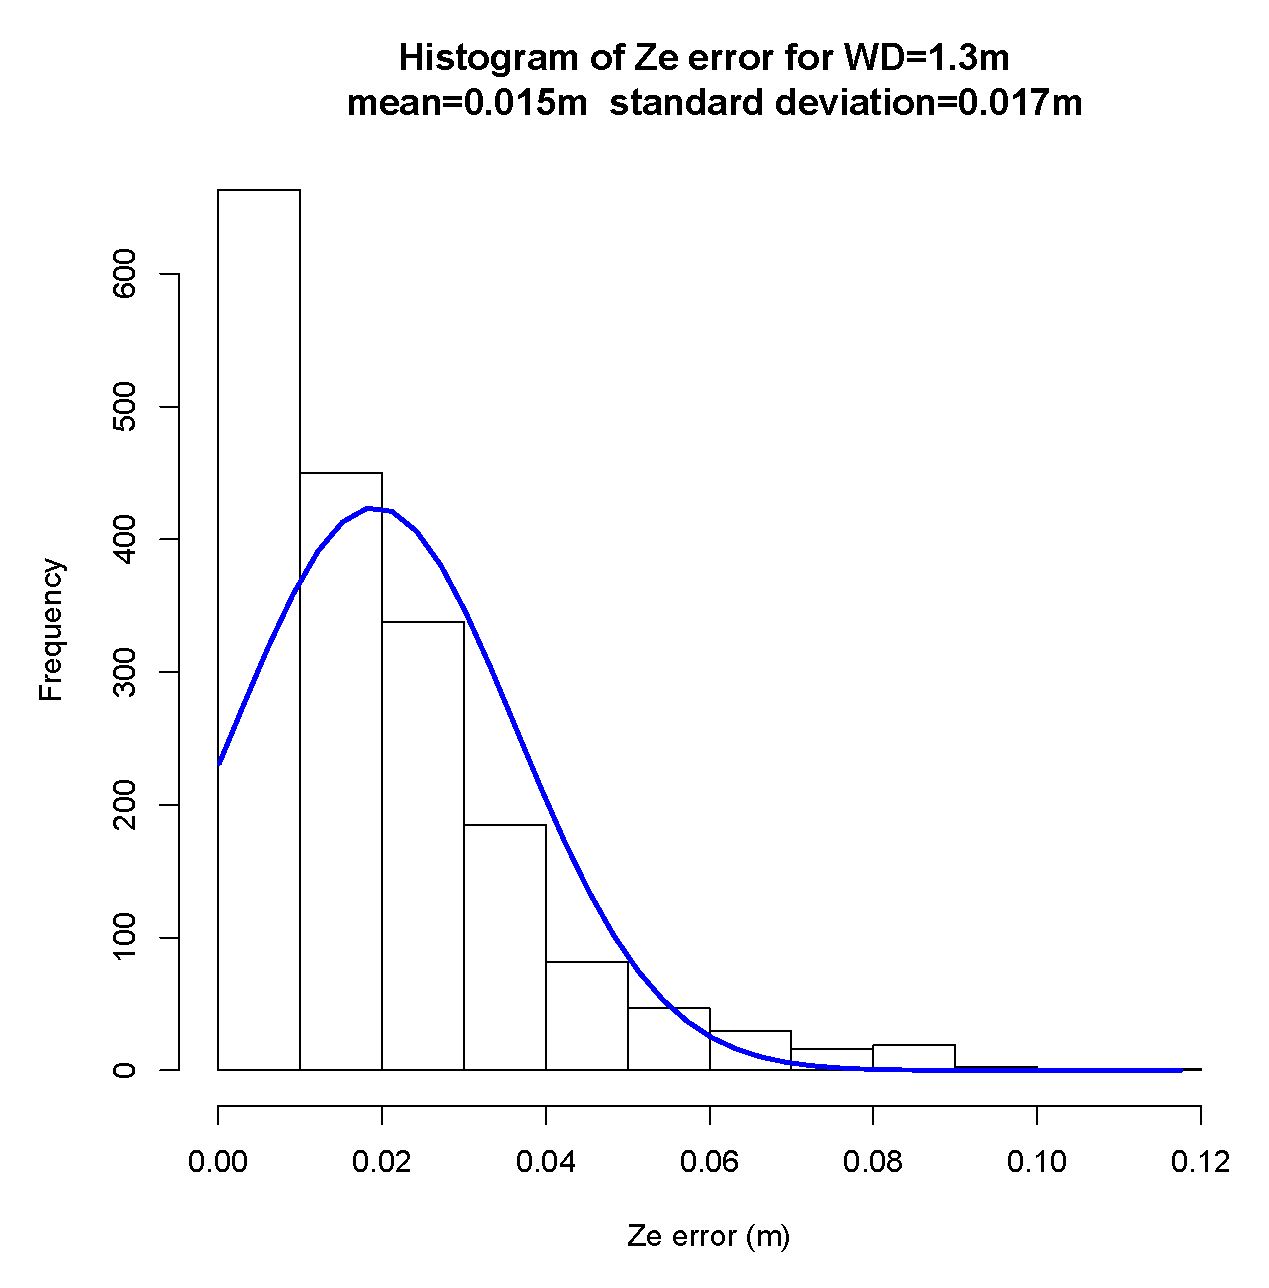
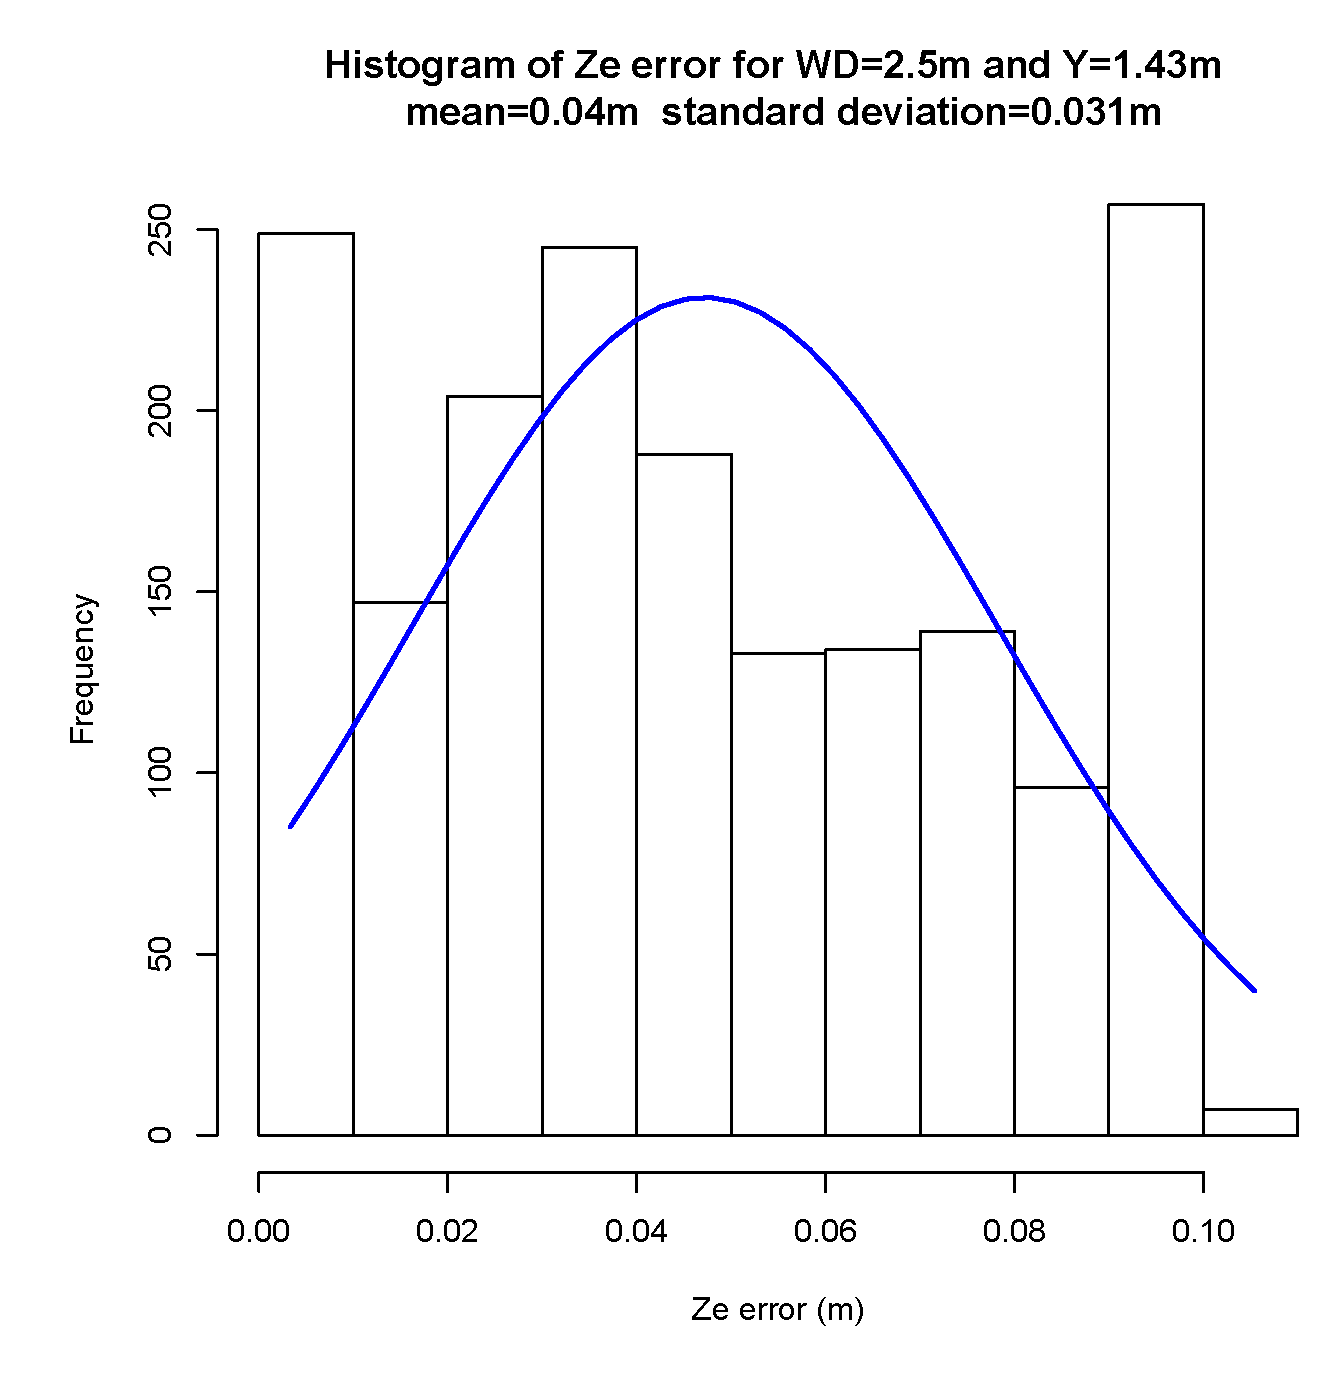
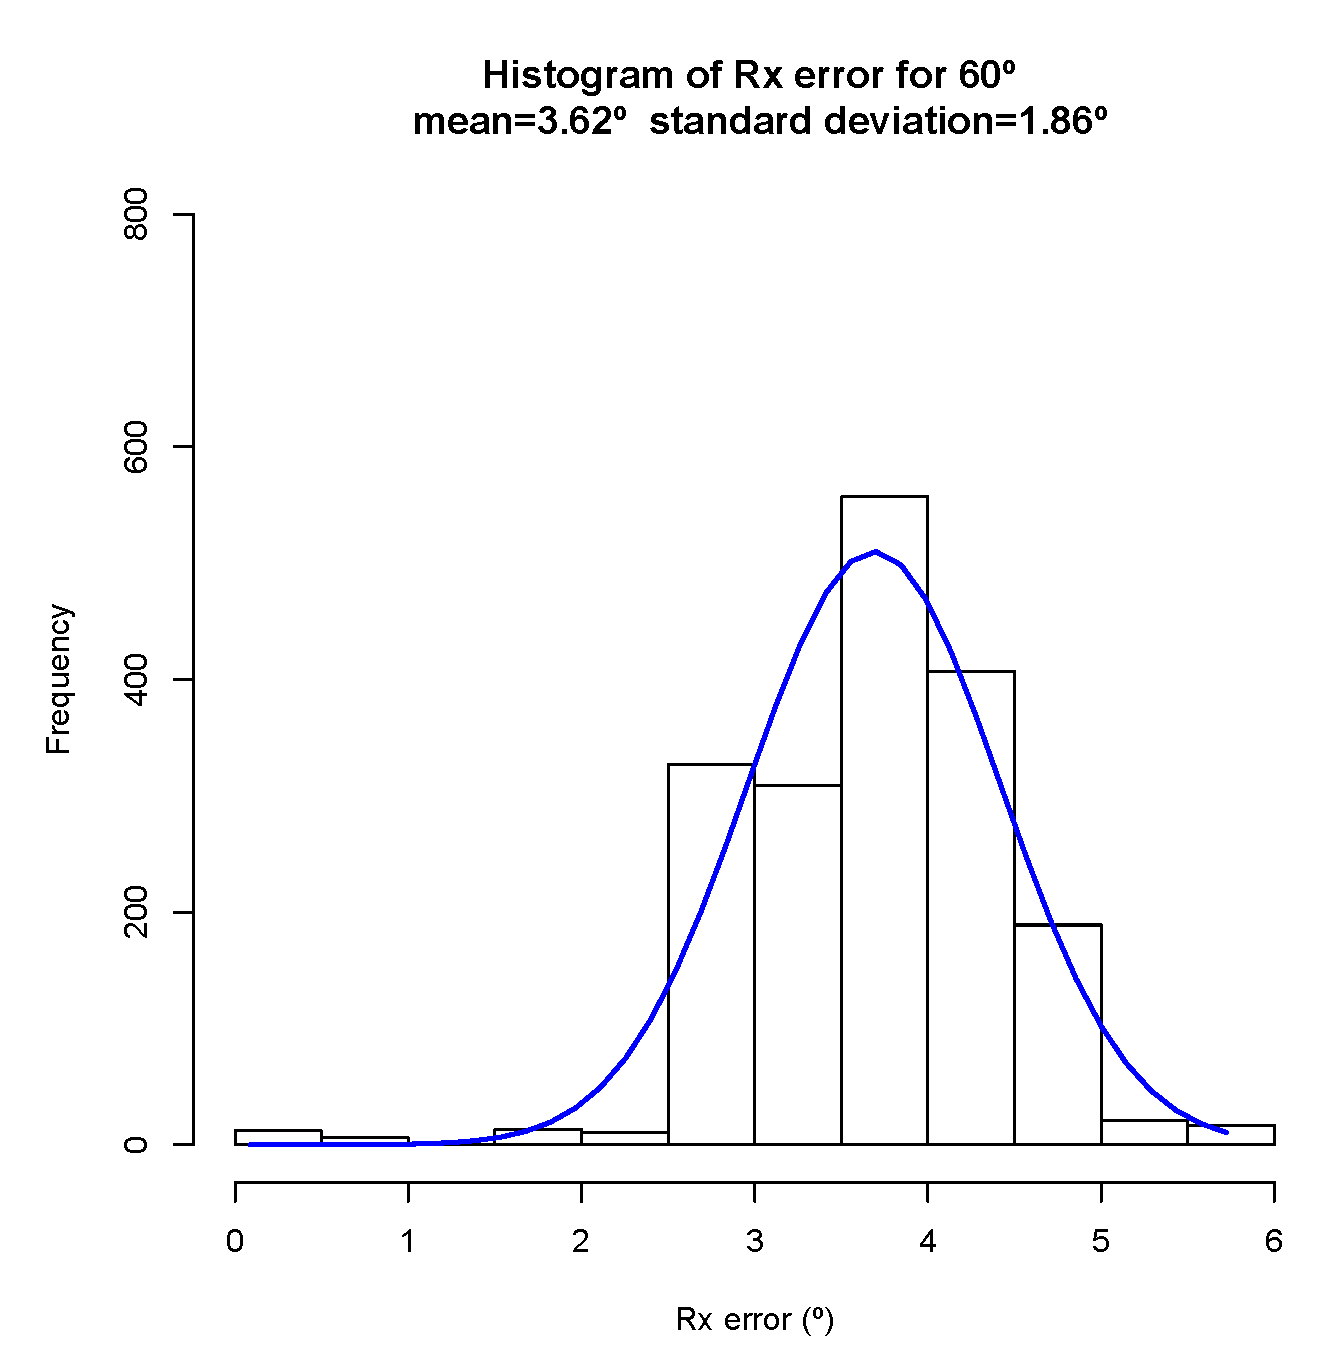
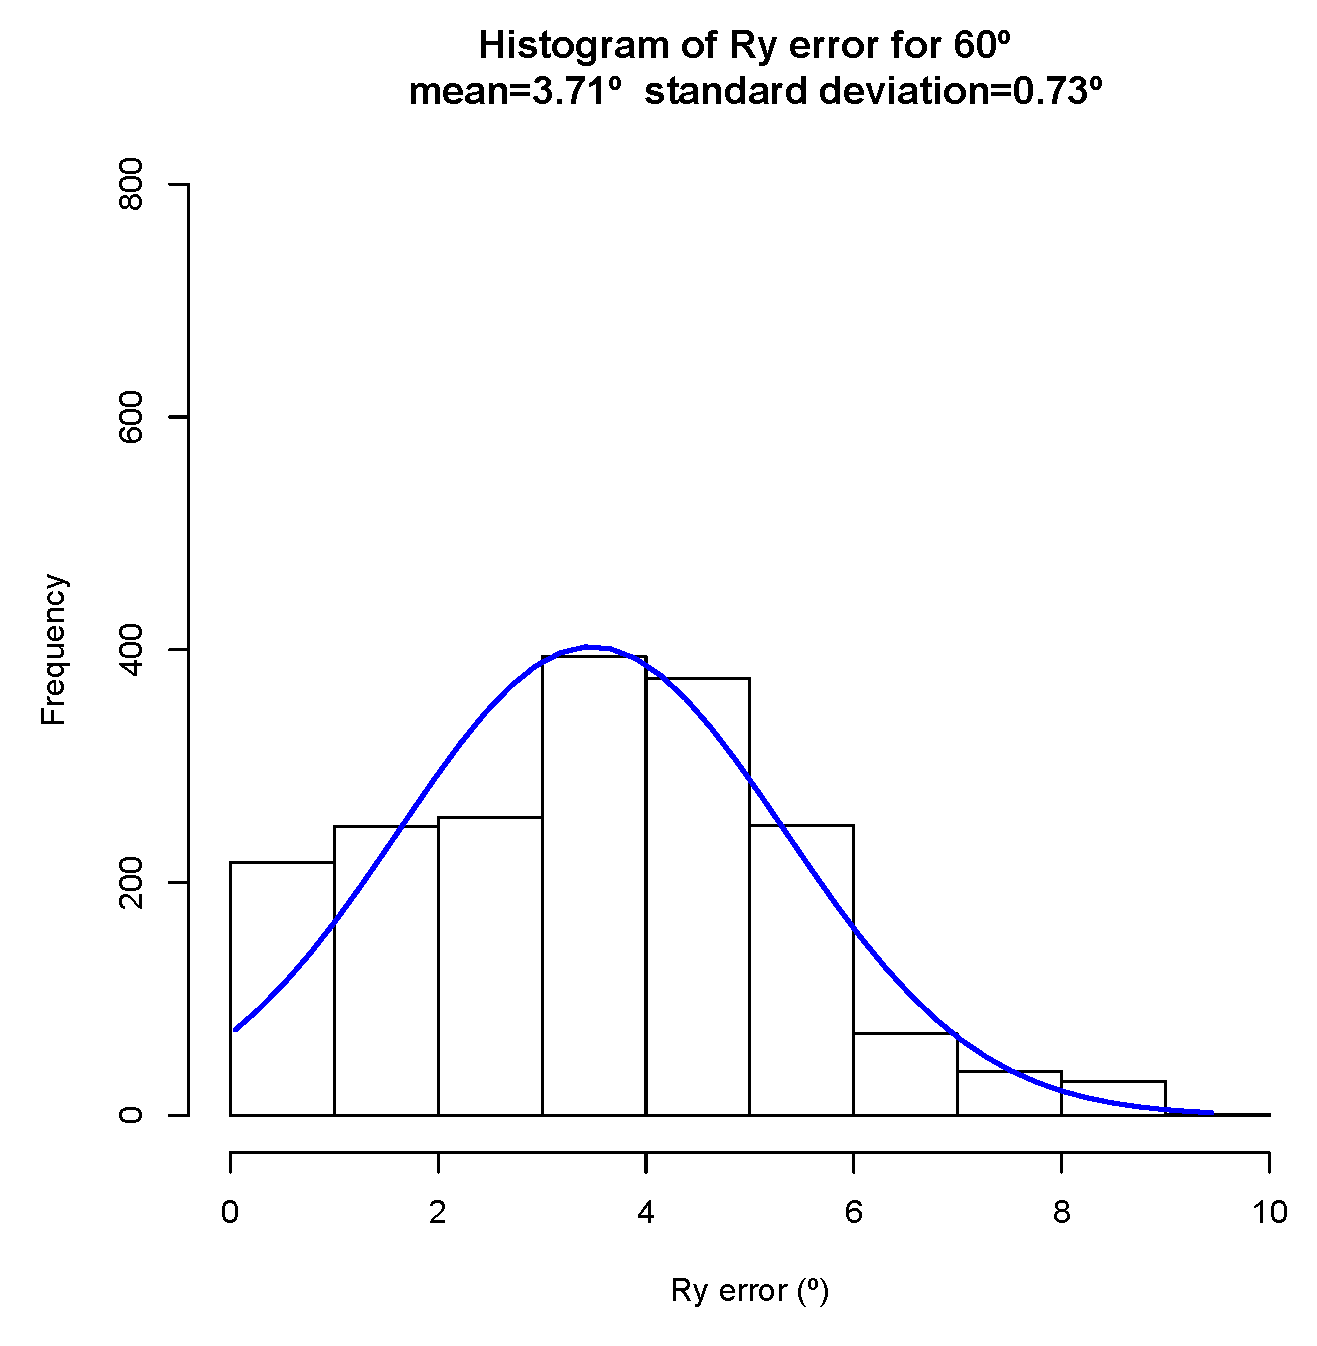
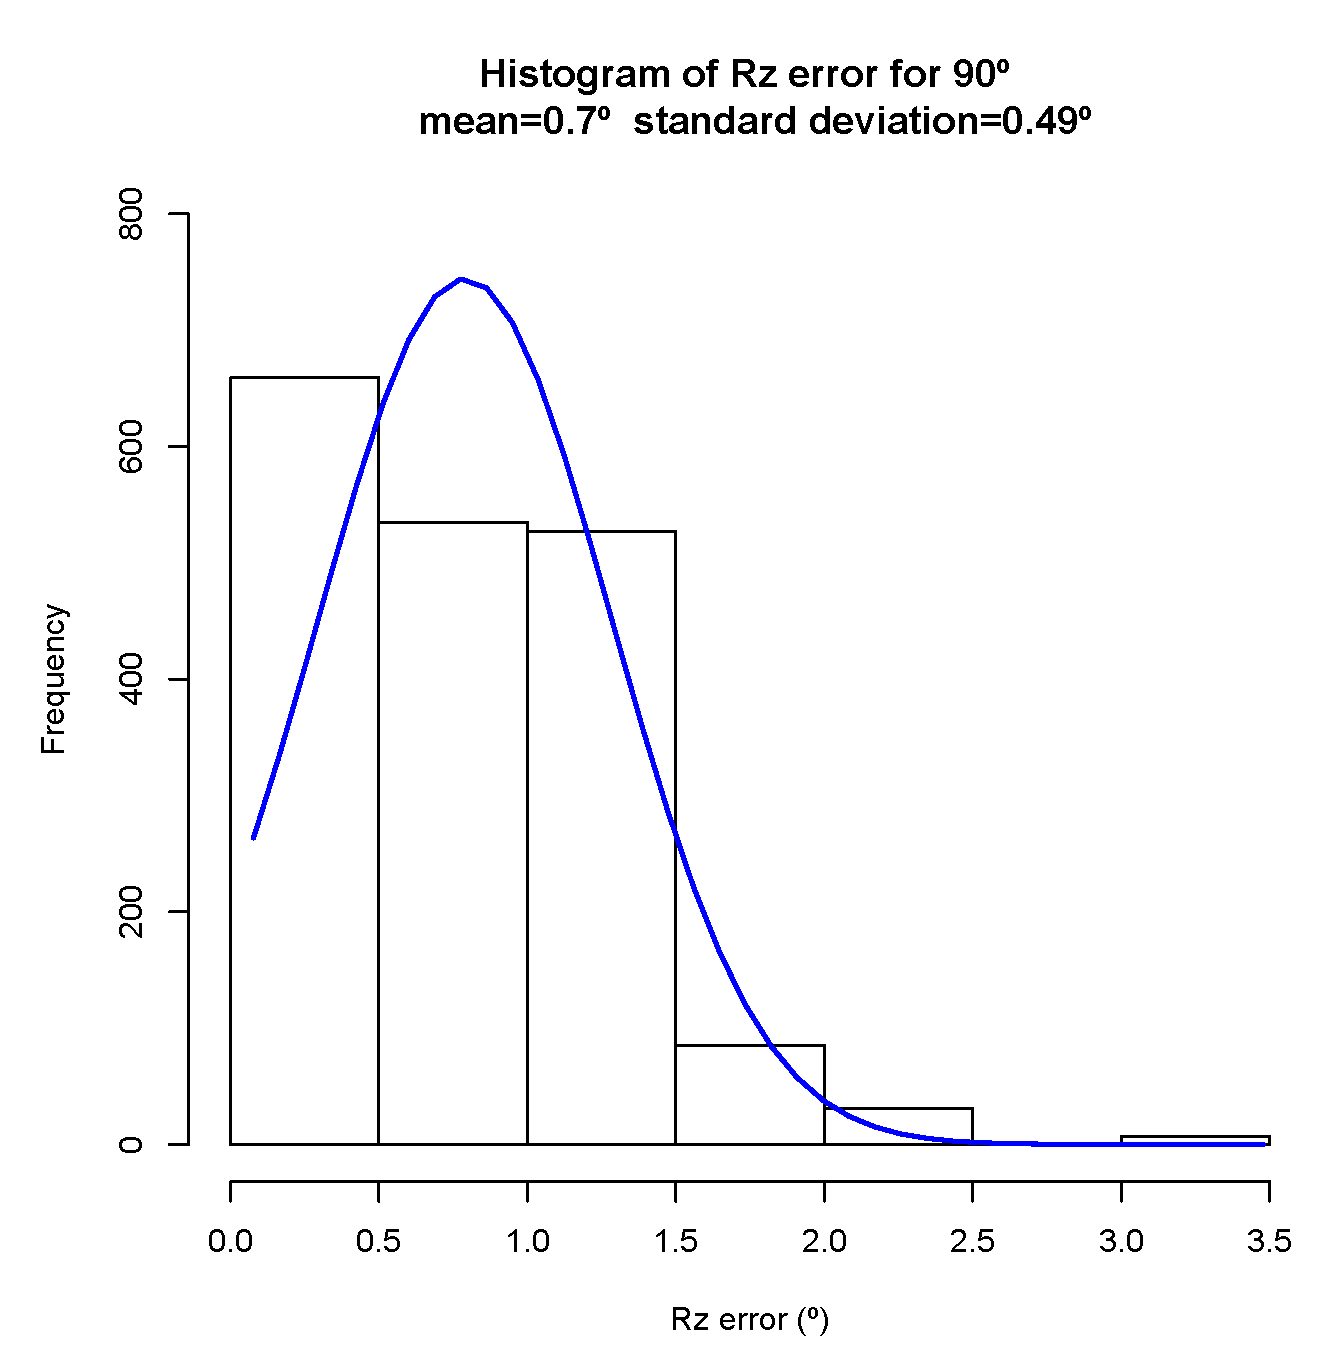
The Figure 23, give us the notion about the system precision based on error to ground truth in working distance estimations and the standard deviation analysis. As expected, the error increases with the working distance reaching the maximum error for the W D of 2.5 m. The worst case is when the target was positioning at the maximum working distance and rotated 60 in R x , in this case the mean error was about eight centimetres. For the perception of the error distribution, the Figure 24, Figure 25 and Figure 26 show the histogram of the error in the function of three working distances: The minimum working distance W D = 0.5 m; the maximum working distance to be operated W D = 2.5 m, and an intermediate working distance W D = 1.3 m. For each histogram is estimated (using R) the Gaussian curve that is closest to the obtained data. In order to analyze the impact in Z e estimation when the target is within the limit of the field of view of the camera, we present the histogram of the error in Z e (Figure 27) when the target is placed at a critical position, i.e., the maximium working distance to operate and near the border of the field of view of the camera Once we have developed an algorithm for attitude estimation, we present here the results in terms of error to ground truth when the target was rotated around the three axes. The Figure 28, Figure 29 and Figure 30 show the histograms that summarizes the obtained results. Here we present three cases: R x = 60 , R y = 60 and R z = 90 .

5.2.2. Tracking System

For the parametrization of the filters, the choice of the number of particles was related to the computational resources, namely with the processing time of each frame. It was necessary to establish a compromise between the adjustment of the number of particles and the processing time. For the particle number adjustment, we chose to analyze the effect of an increase in the number of particles (per marker) at moments in which the AUV was in a hovering situation after dynamic moments. Each time we adjust the number of particles, the threads time of the algorithm was measured as shown in the Figure 31. This time will give us an idea of the rate at which we provide the estimation data to the control.
In addition to the number of particles, it was also analyzed the parametrization of the uncertainties of update (observations) and prediction (a static model) of the filter. For the update uncertainties, the values were adjusted according to the characterization of the pose estimator. For the adjustment of the prediction uncertainties was considered the typical velocity of the AUV Mares, the maximal diving velocity of the AUV Mares and the characteristics of the camera.
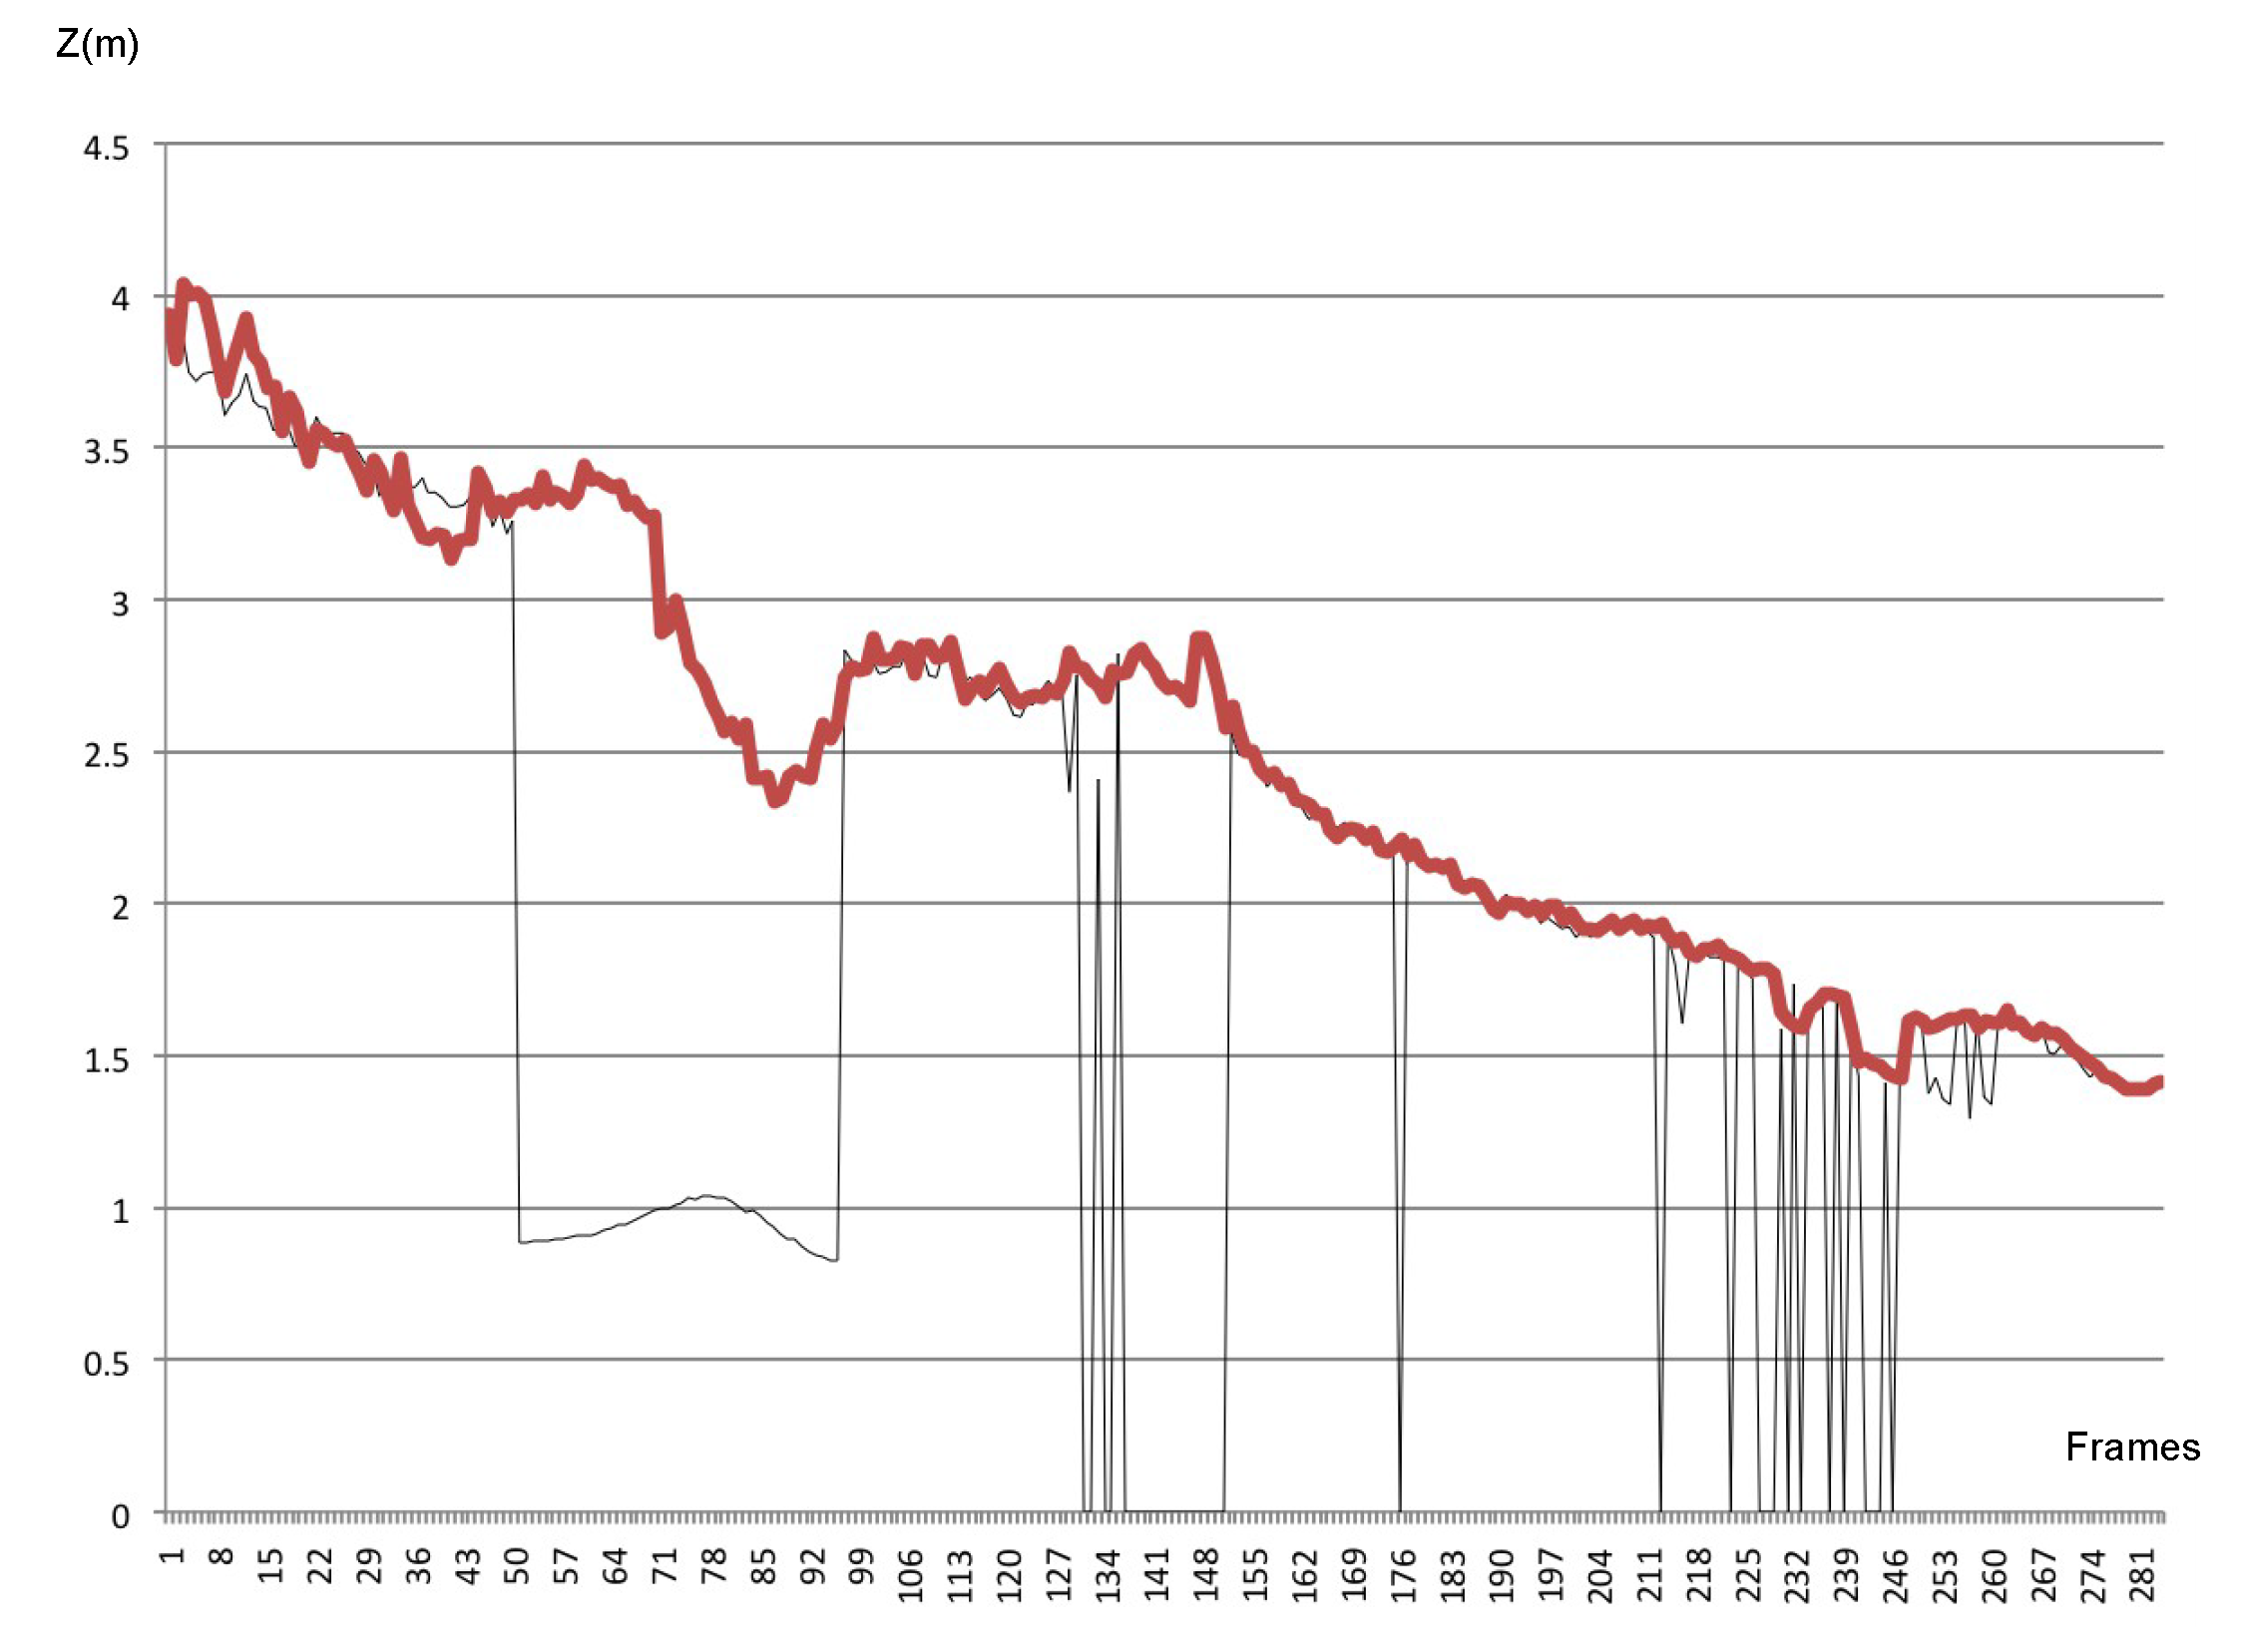
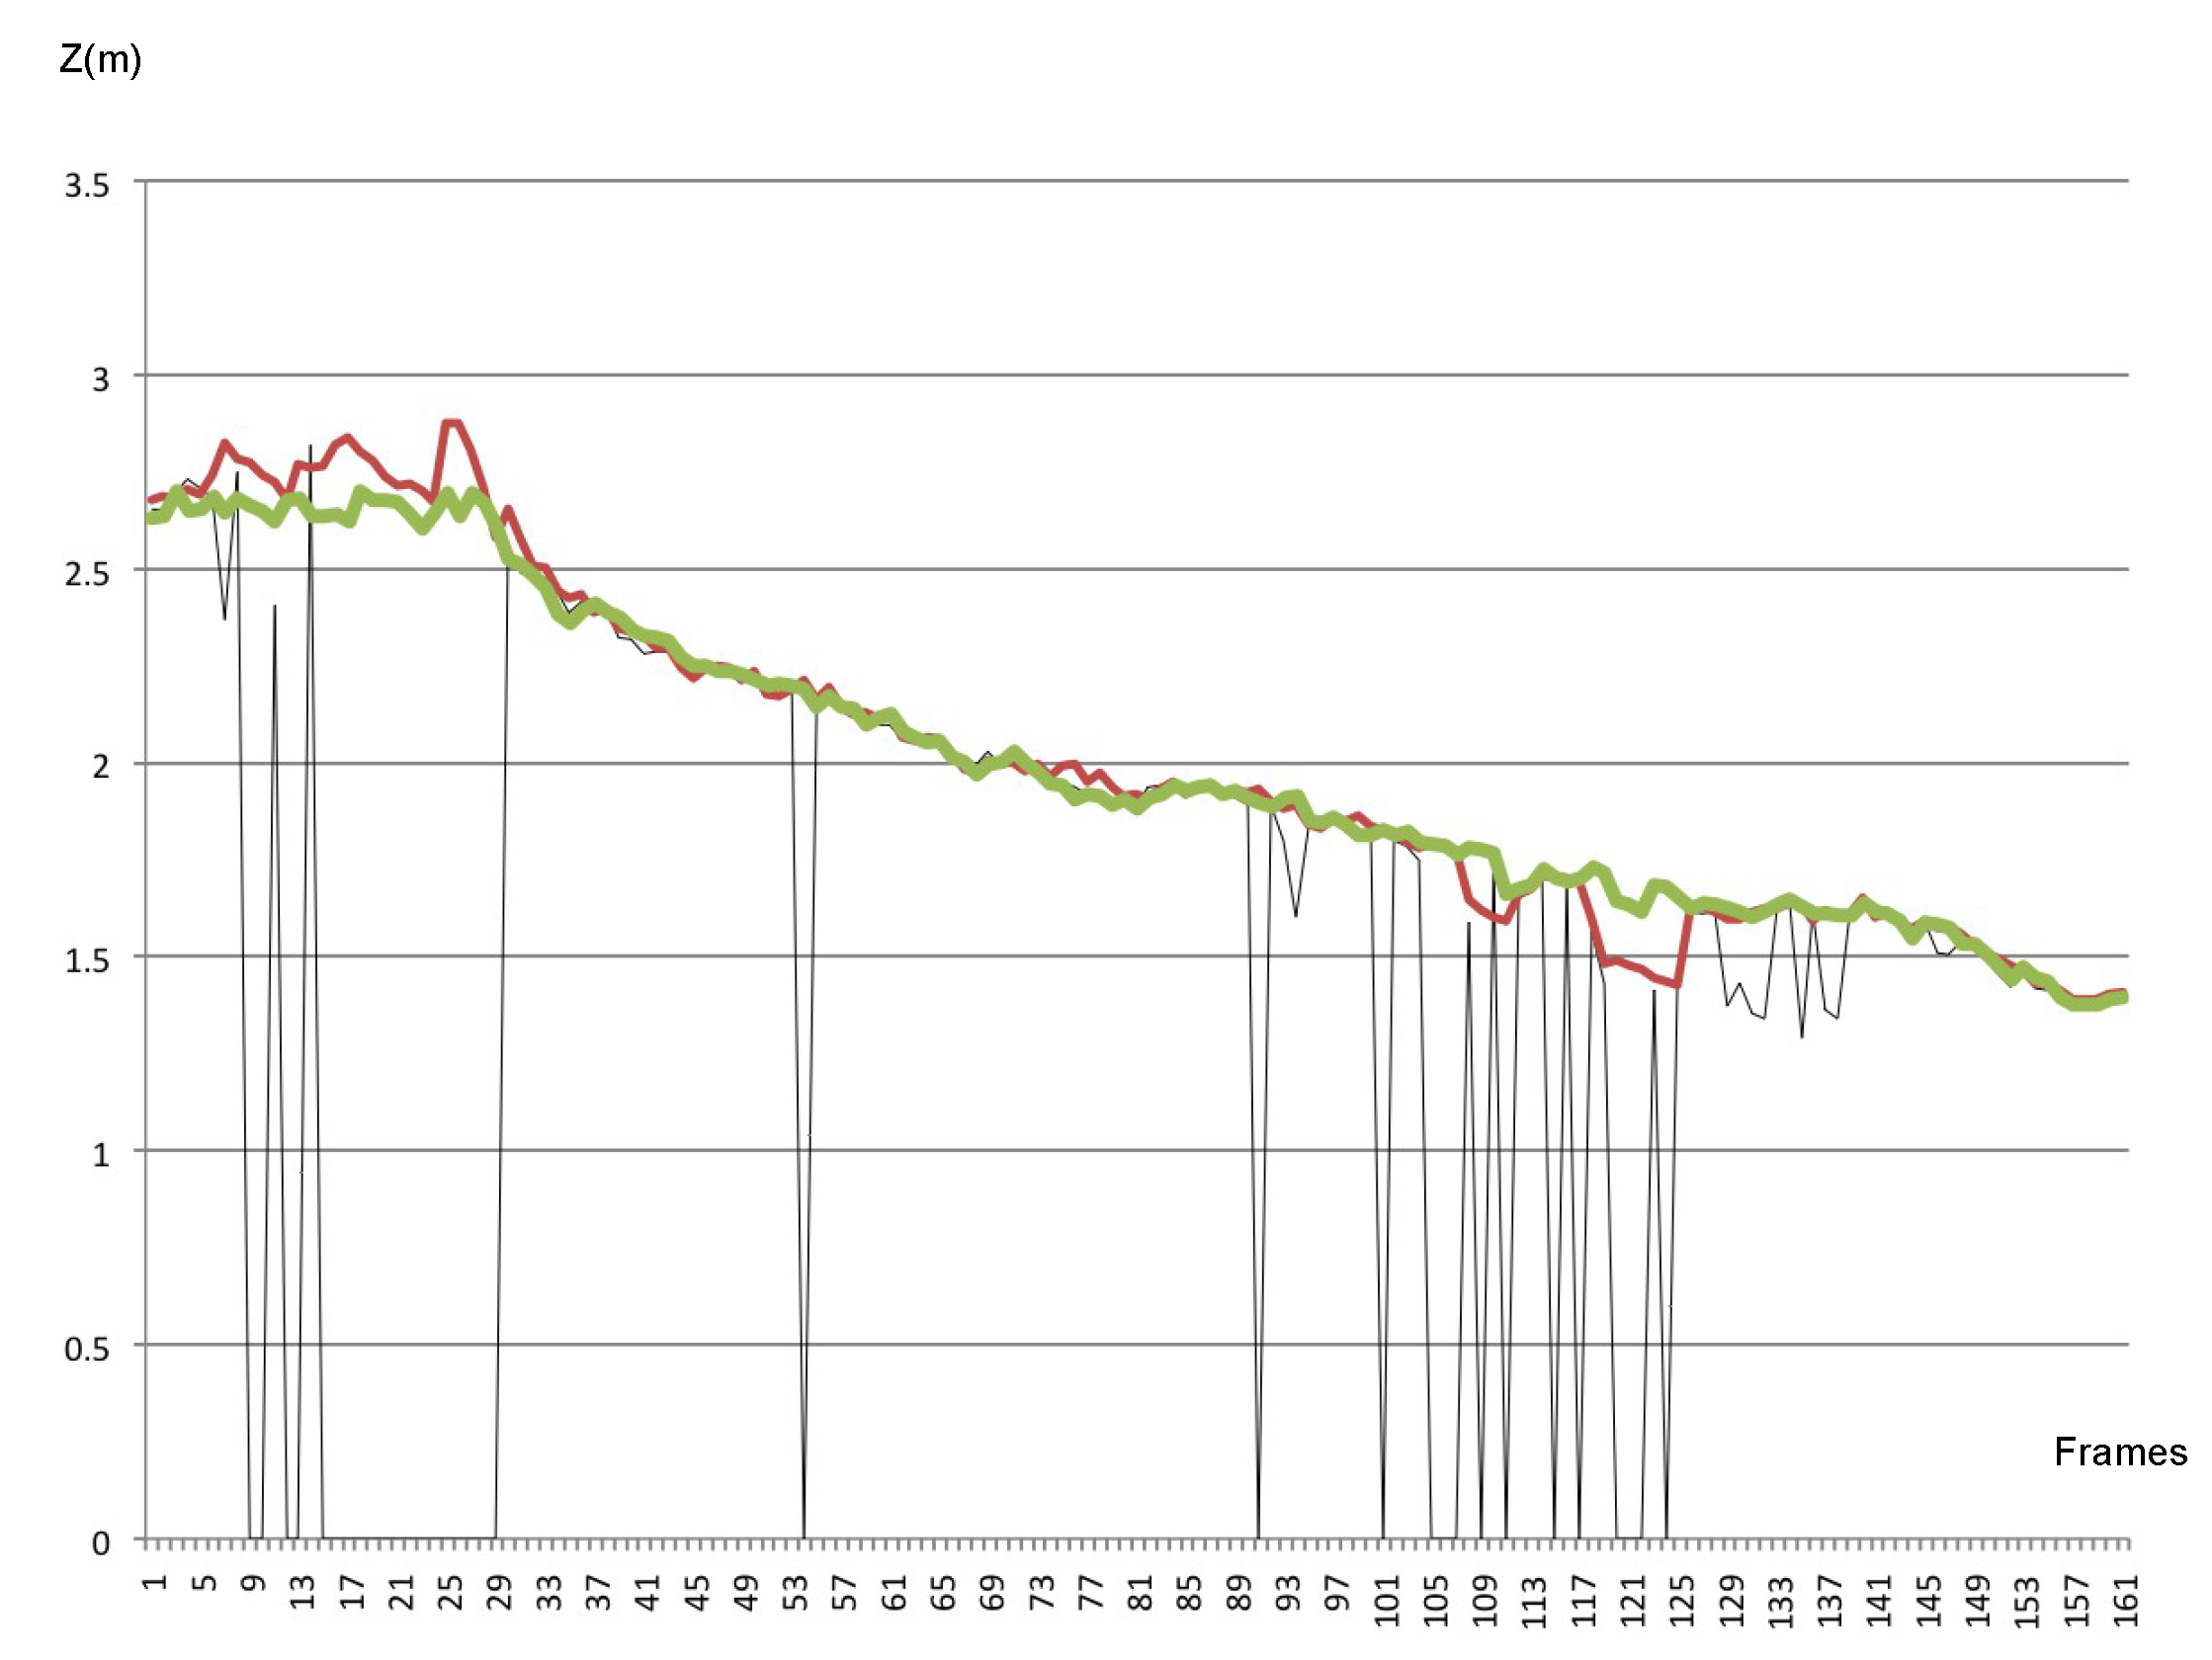
With the parameterized filter, we compared the results by using the filter with the results without the use of the filter. Figure 32 represents the descent of the AUV towards the target. In the graph of Figure 32 it is possible to see the performance of the estimations algorithm with and without the use of the filter. To generate the graph of the Figure 32, 360 frames were sampled. The outlier occurs from the frame 44 to frame 108. The temporary occlusions occur from the frame 124 to frame 284. There were several partial occlusions, sometimes partial occlusion of a marker, sometimes partial occlusion of two markers.
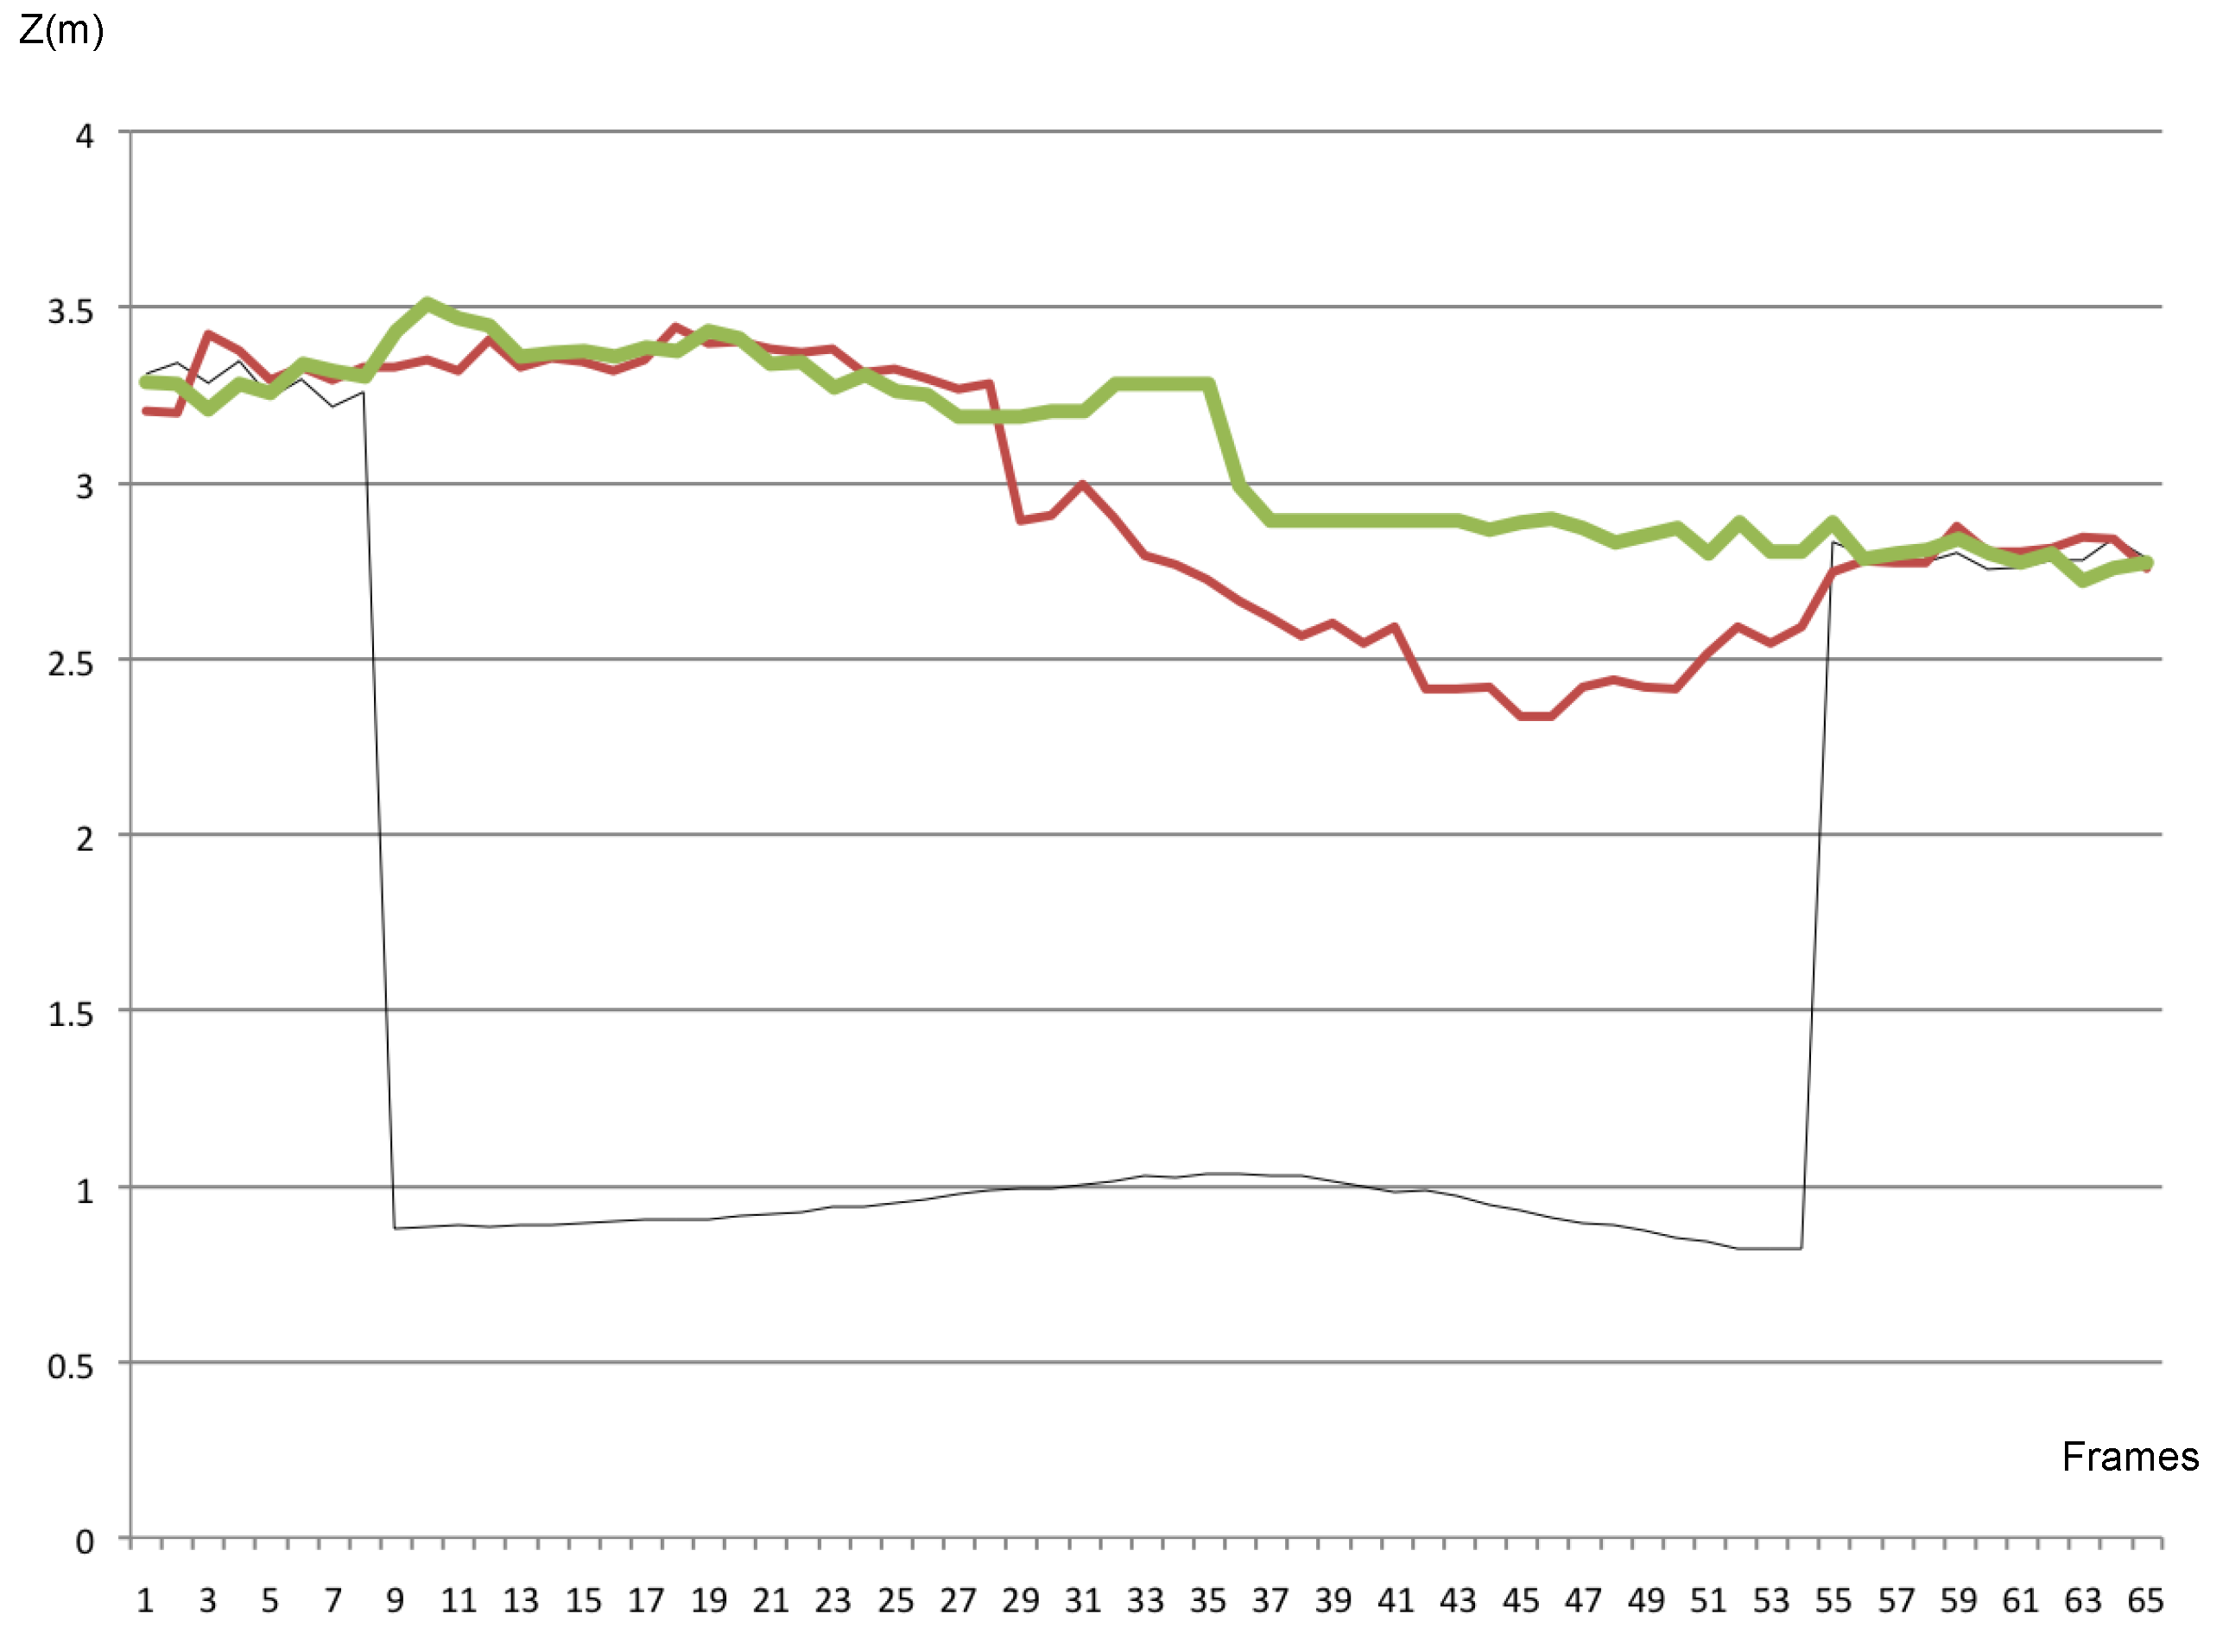
The Figure 33 is a detail of the graph of the Figure 32, from the frame 44 to frame 108, and allows us to observe how the algorithm behaves in the outlier zone. In the graph of the Figure 33 the resultant curve of the pose estimator is compared with the resulting curve of the estimator with the use of the filter, in a situation of outliers detection.
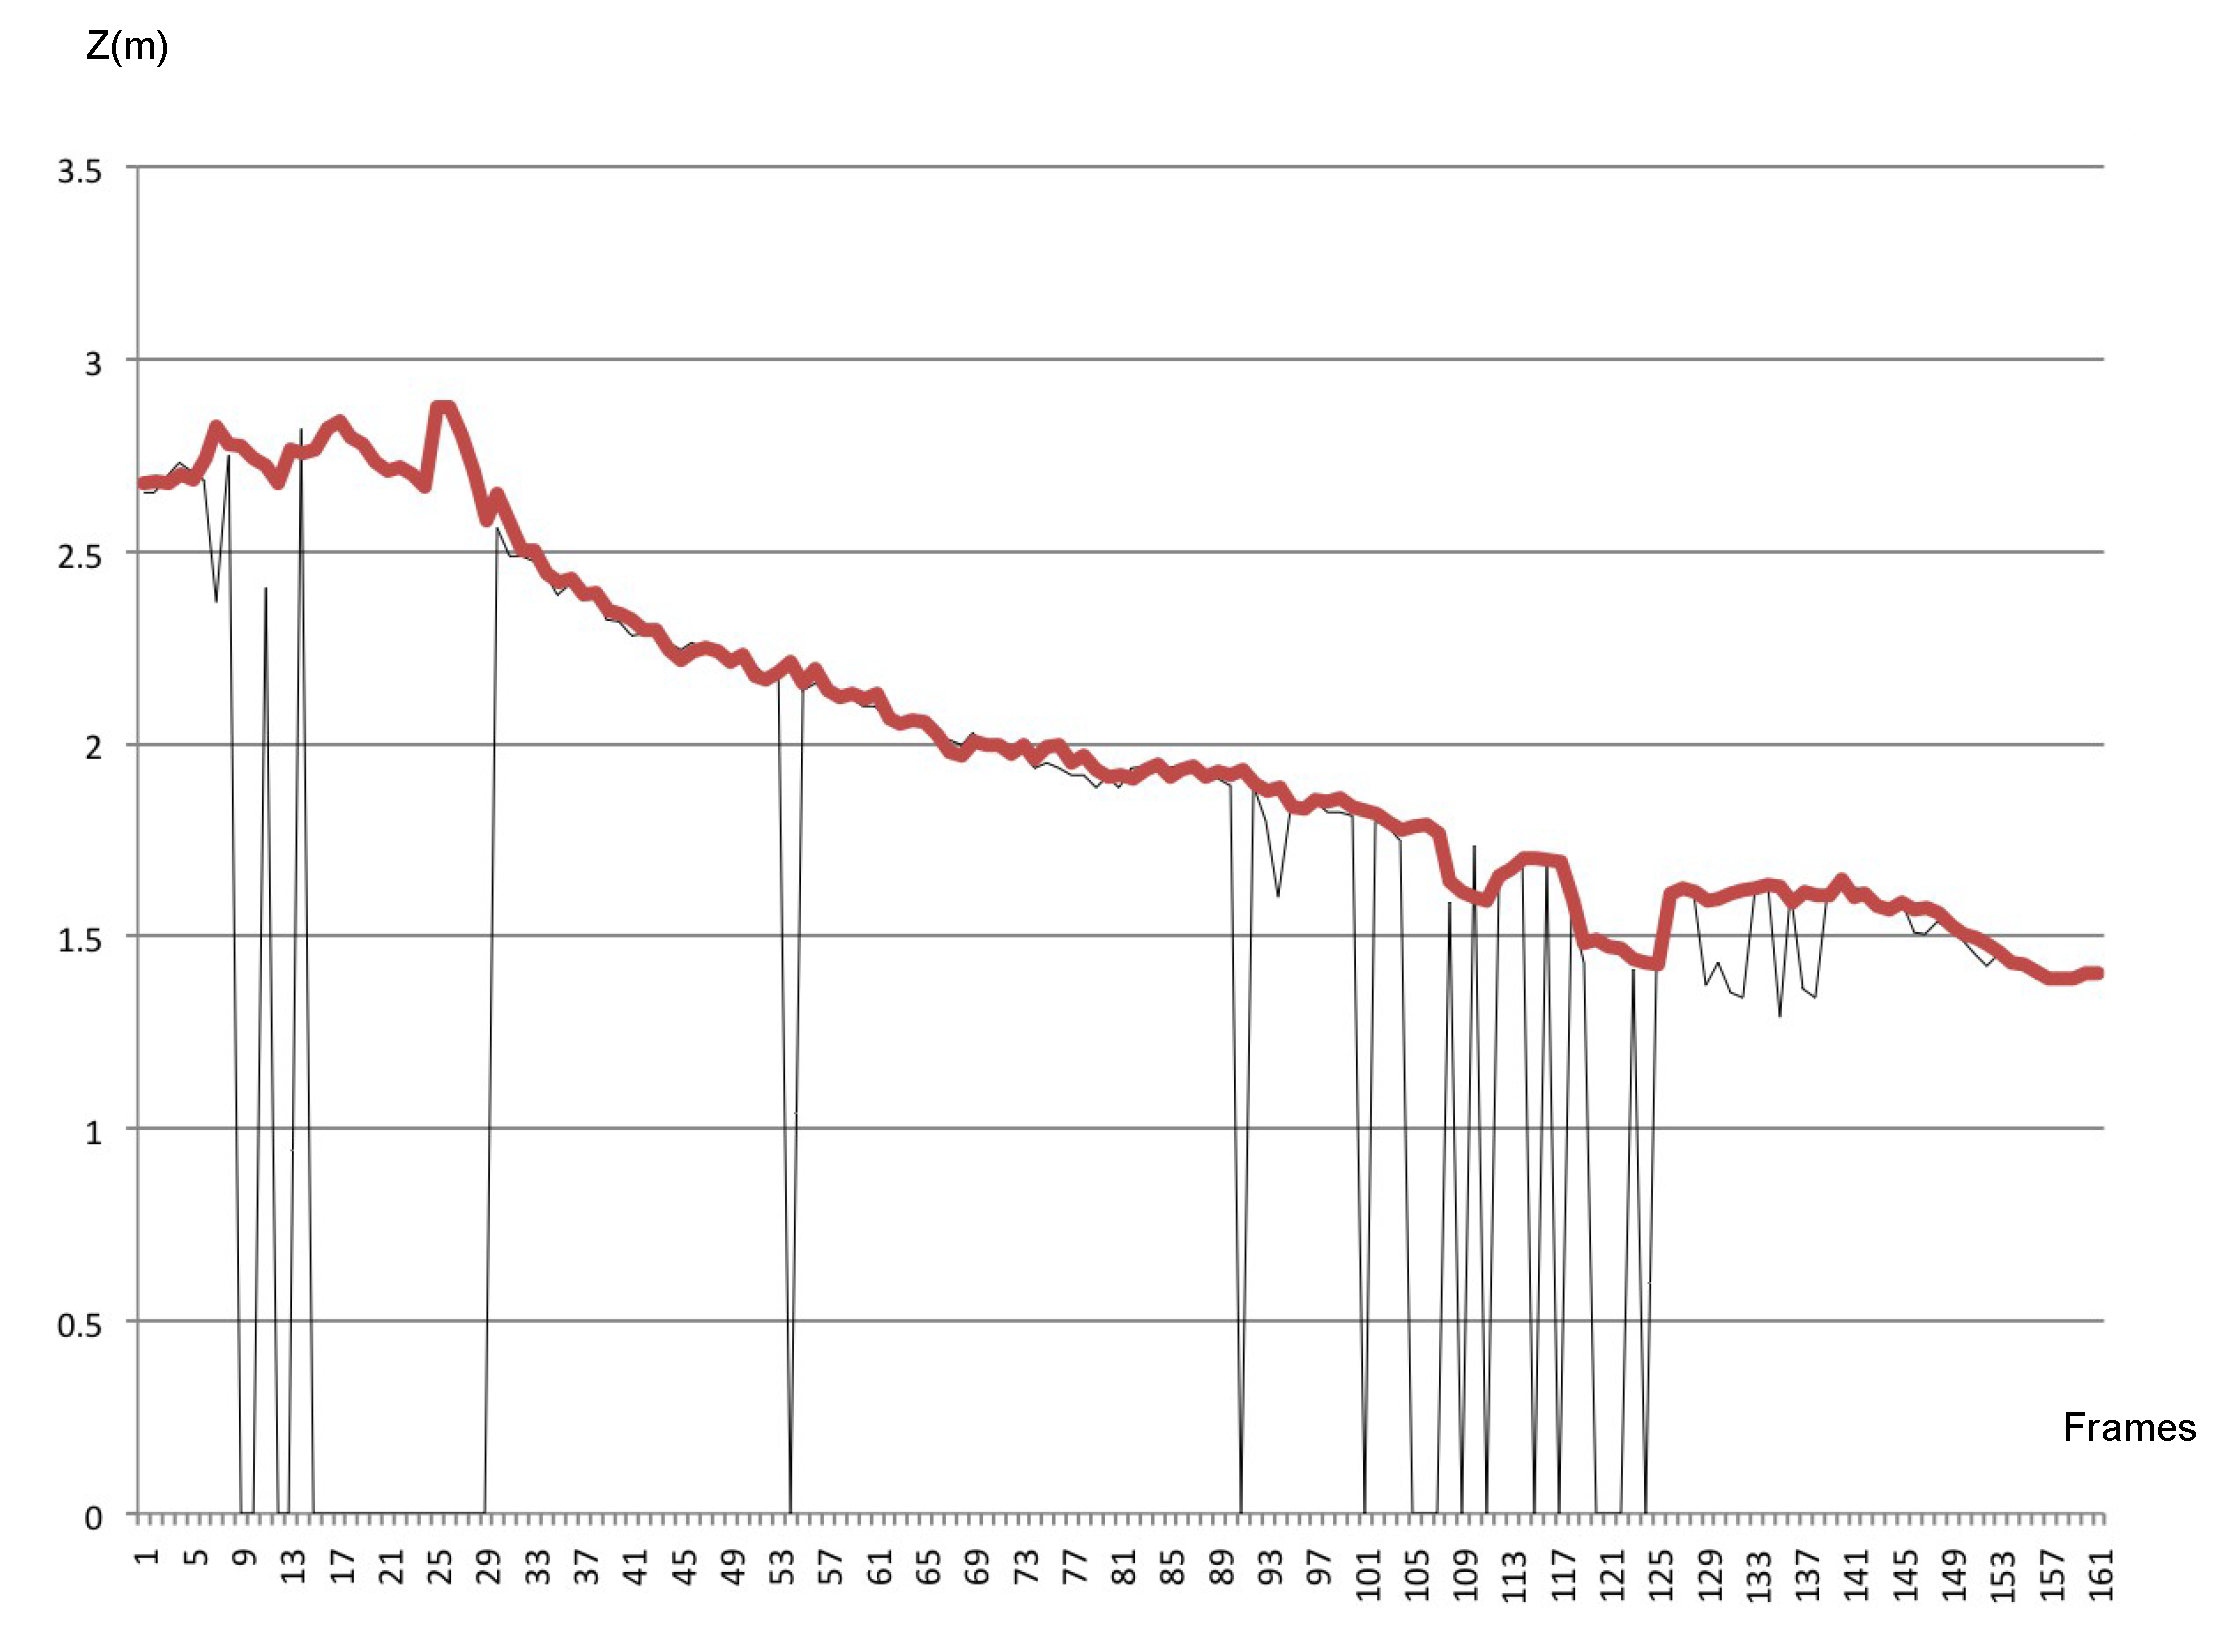
The Figure 34 is a detail of the graph of the Figure 32, from the frame 124 to frame 284, and allows us to observe how the algorithm behaves in the partial occlusions zone.
As can be seen in Figure 34, the use of the filter allows the continuity in obtaining estimates during situations of temporary and partial occlusions of the markers. However in areas where occlusions occur more frequently, the performance can be improved, and for this reason the constraints of the target geometry were added to the filter. The graph of the Figure 35 is a detail of the graph of the Figure 32, from the frame 124 to frame 284, where we can observe how the filter behaves in the temporary and partial occlusions zone when the geometric constraints were added to the filter. In the graph of Figure 35 it is possible to compare the estimates in the situation in which the occlusions occur more frequently.
On the other hand, in the case of outliers and false detections, the graph of Figure 36 is a detail of the graph of the Figure 32, from the frame 44 to frame 108, and represents the results obtained in the outlier zone. it is possible to compare the estimates without the use of the filter with the estimates made using the filter with and without color restriction.

6. Simulation Results: Guidance Law

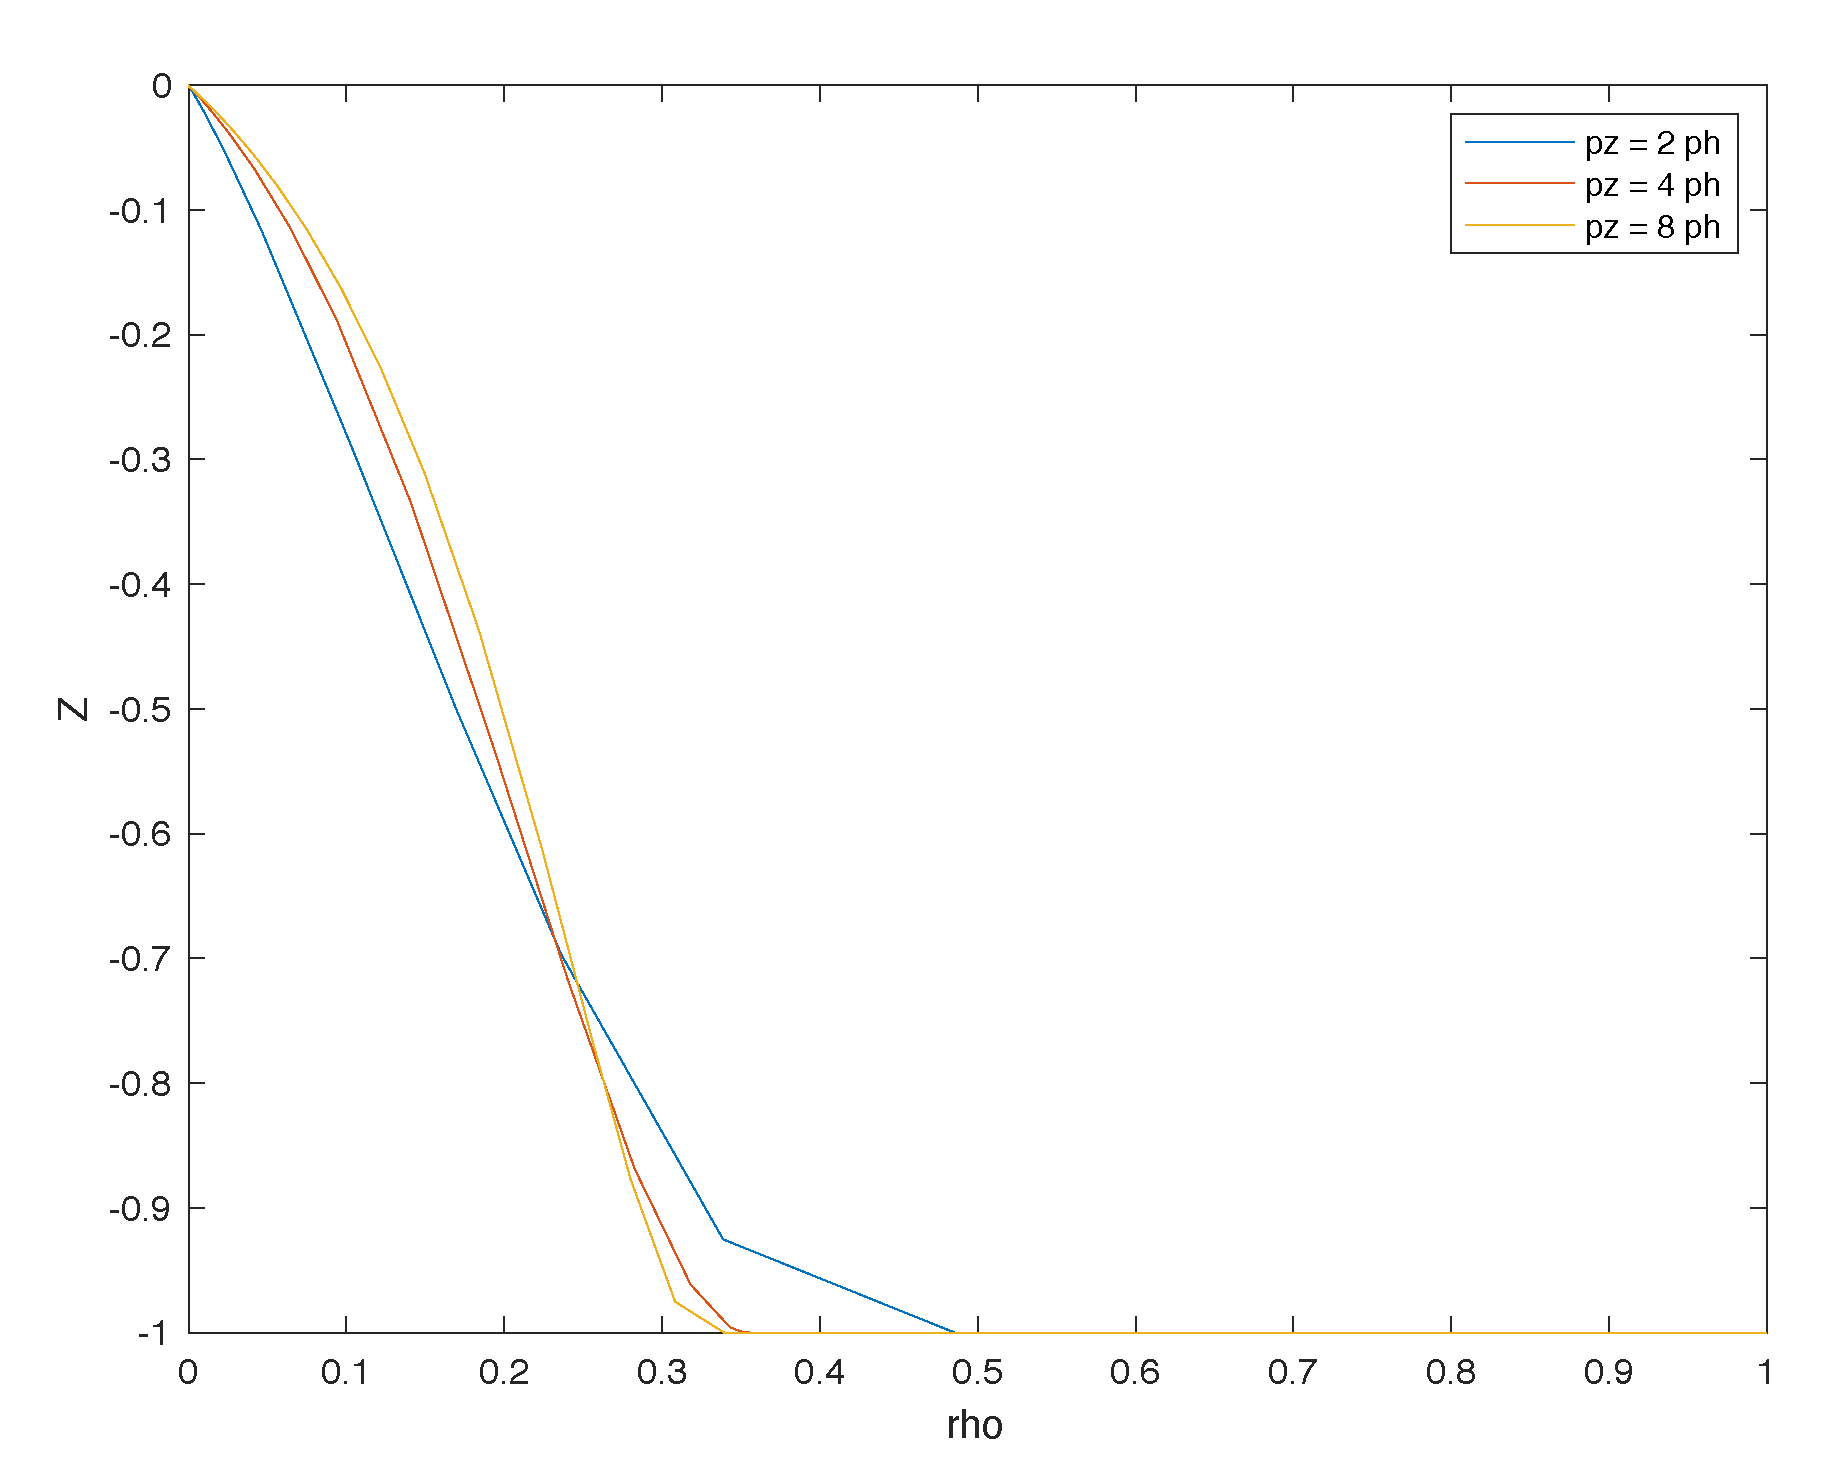
The performance of the proposed law was tested in a simulation environment—simulink/Matlab. We consider here a first-order model for the closed-loop behavior of the AUV in the horizontal plane ρ and a first-order model for the closed-loop behavior of the AUV in the vertical coordinate z. Once we propose a guidance law that can ensure a much faster convergence of ρ to zero that of z to zero, the best way to test this law was to consider the horizontal behavior slower than the vertical one. That means that for a first simulation, the relation between the pole of the horizontal model P ( s ) P r e f ( s ) , and the pole of the vertical model Z ( s ) Z r e f ( s ) , is:
p z > p h .
The Figure 37 presents the trajectories in the ( ρ , z ) plane considering three different situations: p z = 2 p h ; p z = 4 p h ; p z = 8 p h .
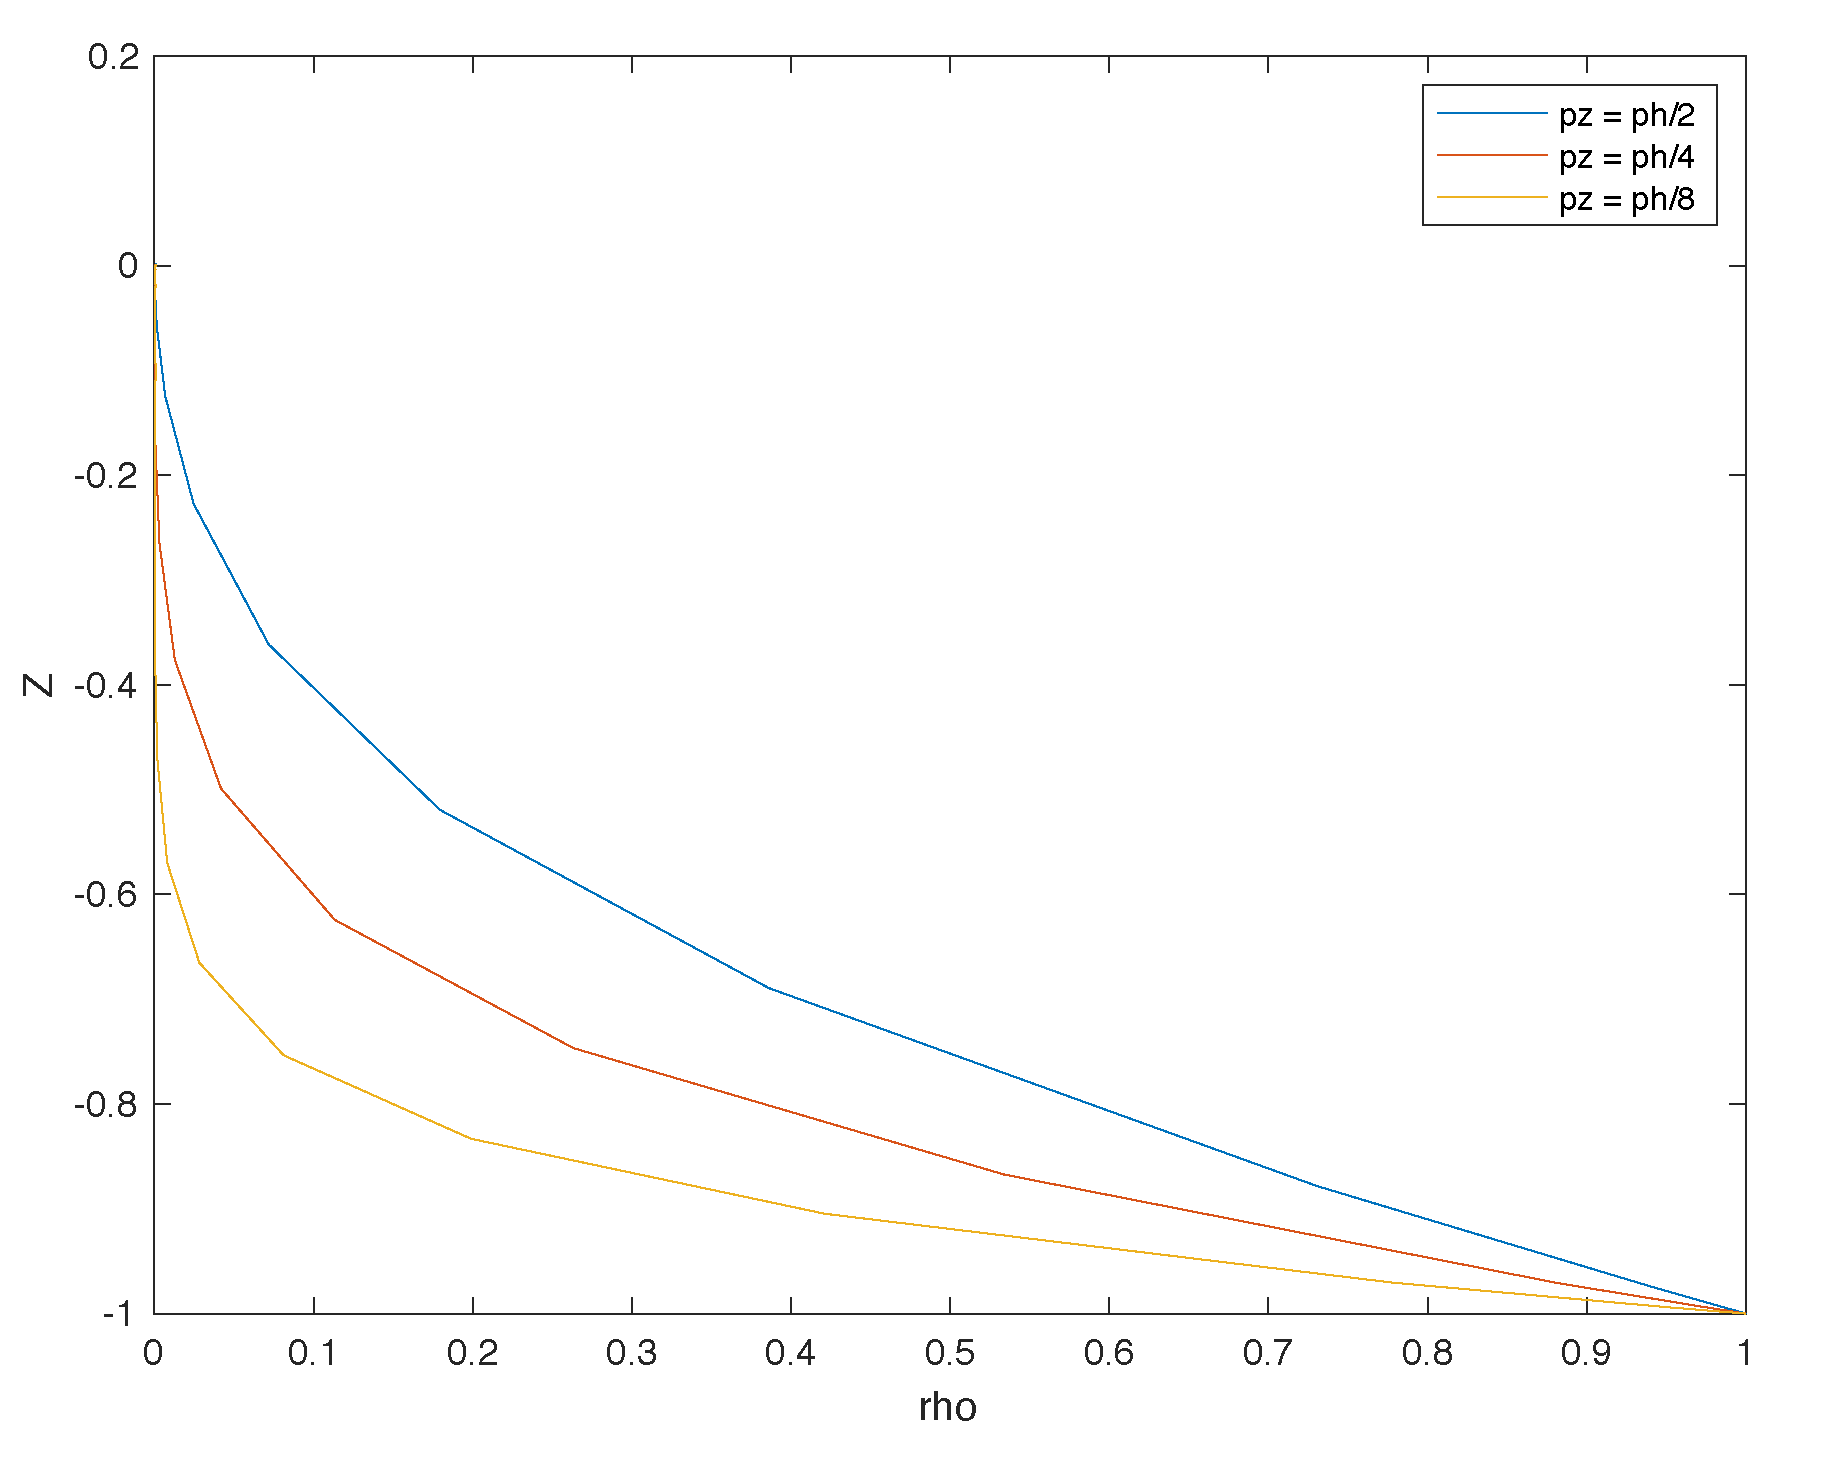
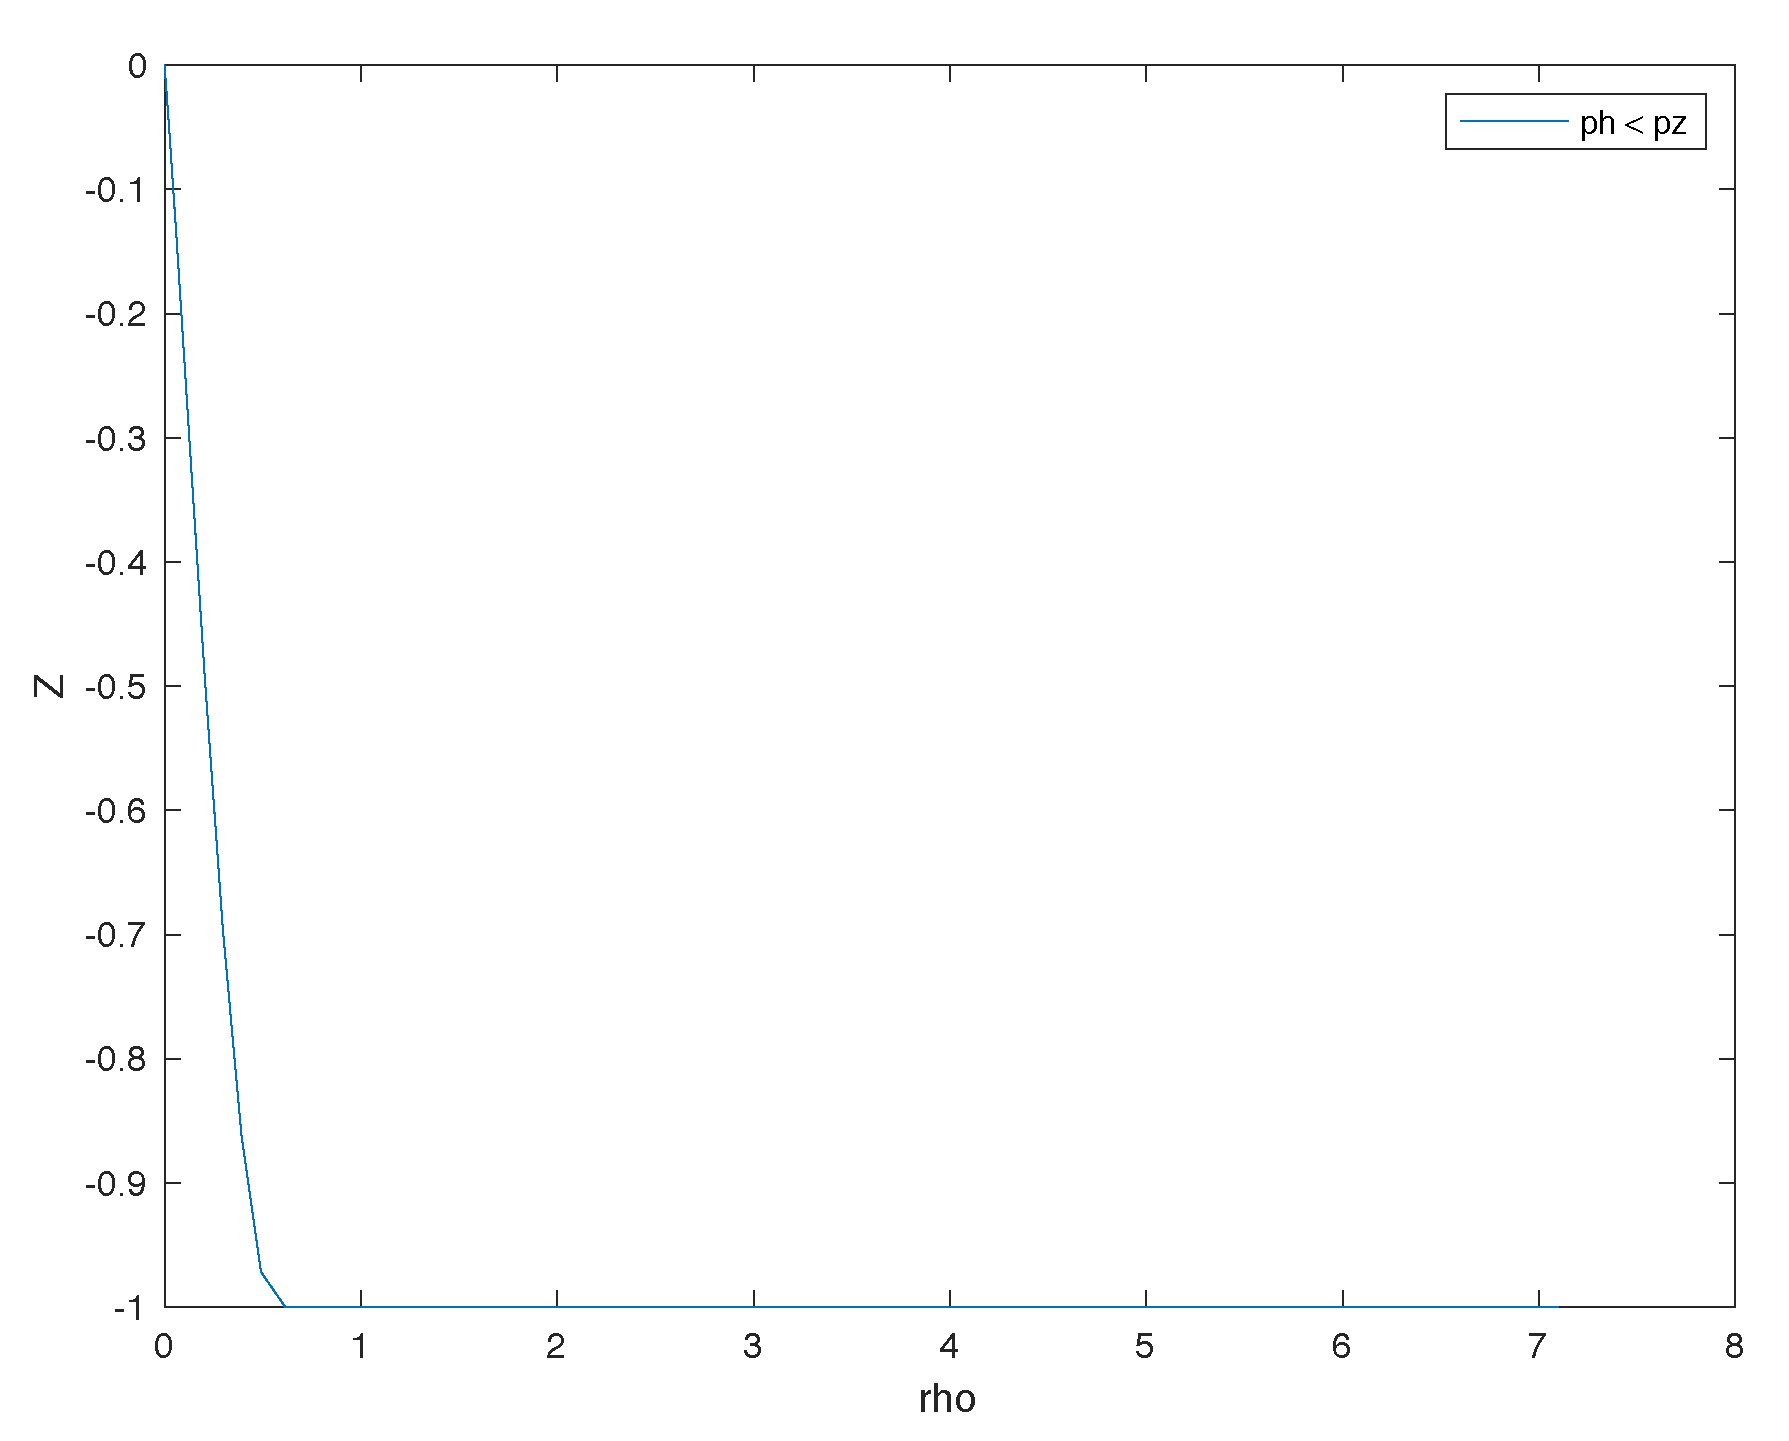
If instead we consider that the behaviour in the horizontal plane is faster than the vertical one, p z < p h , the resultant trajectories are those shown in the Figure 38 considering three different situations: p z = p h 2 ; p z = p h 4 ; p z = p h 8 .
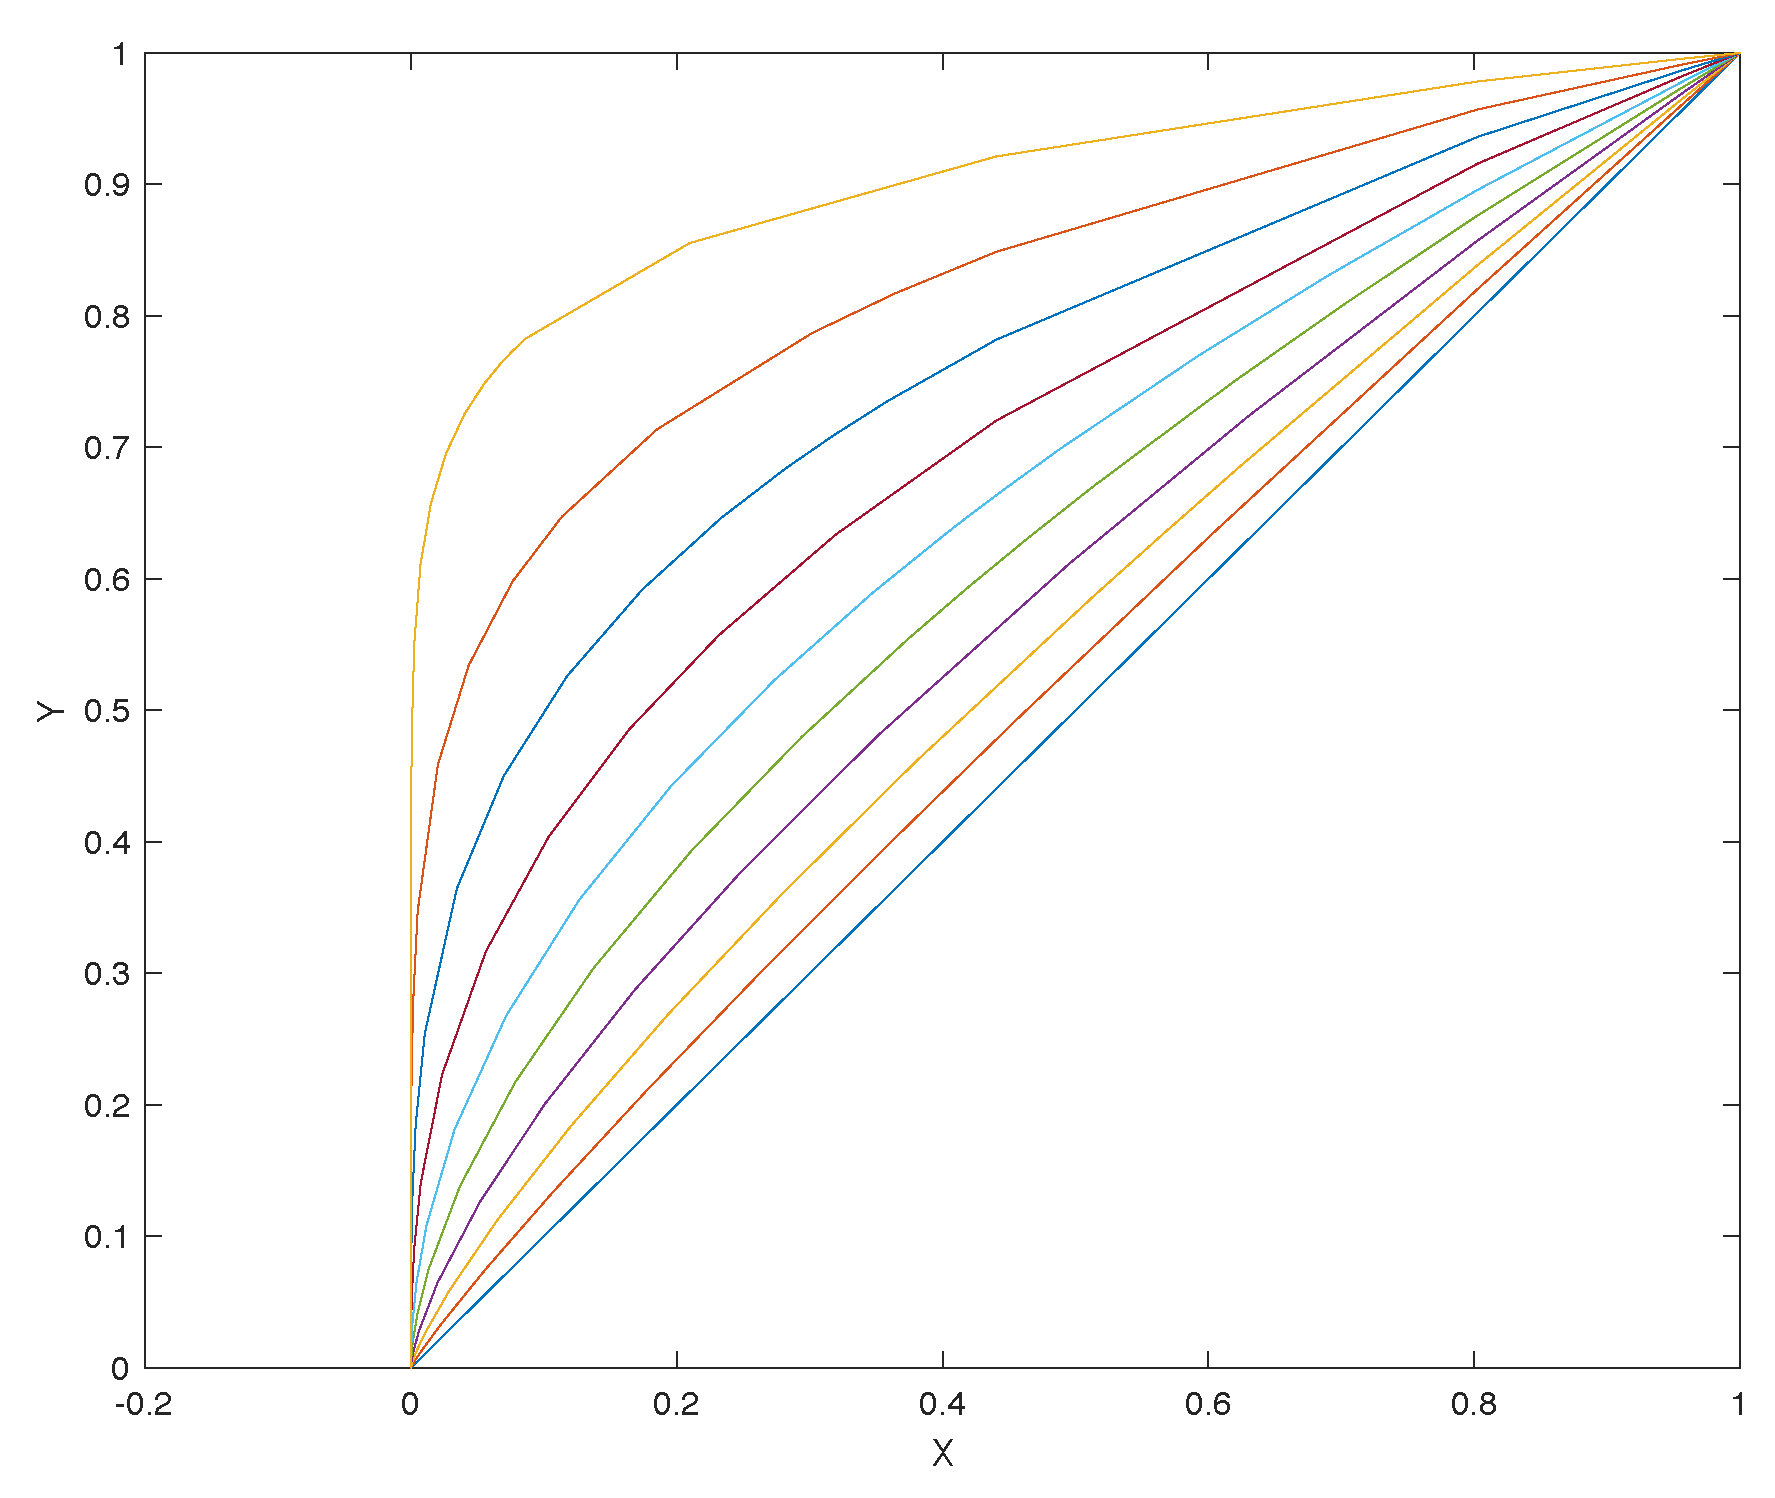
Going back to the case where p z > p x , if we considered that the initial r h o 0 is farther from the reference r h o r e f = 0 than the initial z 0 from reference z r e f = 0 , the resultant trajectory obtained is that shown in Figure 39.
Considering now a realistic hypothesis that motion in the horizontal plane presents behavioural differences between x axis and y axis. In this case, instead of assuming a single model for horizontal behaviour, P ( s ) P r e f ( s ) , different behaviours were assumed for x and y, and for that we used two first order models for the closed loop horizontal behaviour of the AUV, i.e.,
X ( s ) X r e f ( s ) = p x s + p x
Y ( s ) Y r e f ( s ) = p y s + p y .
In the horizontal plane, the result of assuming a slower behaviour in y coordinate than for x coordinate, i.e., p x > p y , is illustrated in Figure 40.
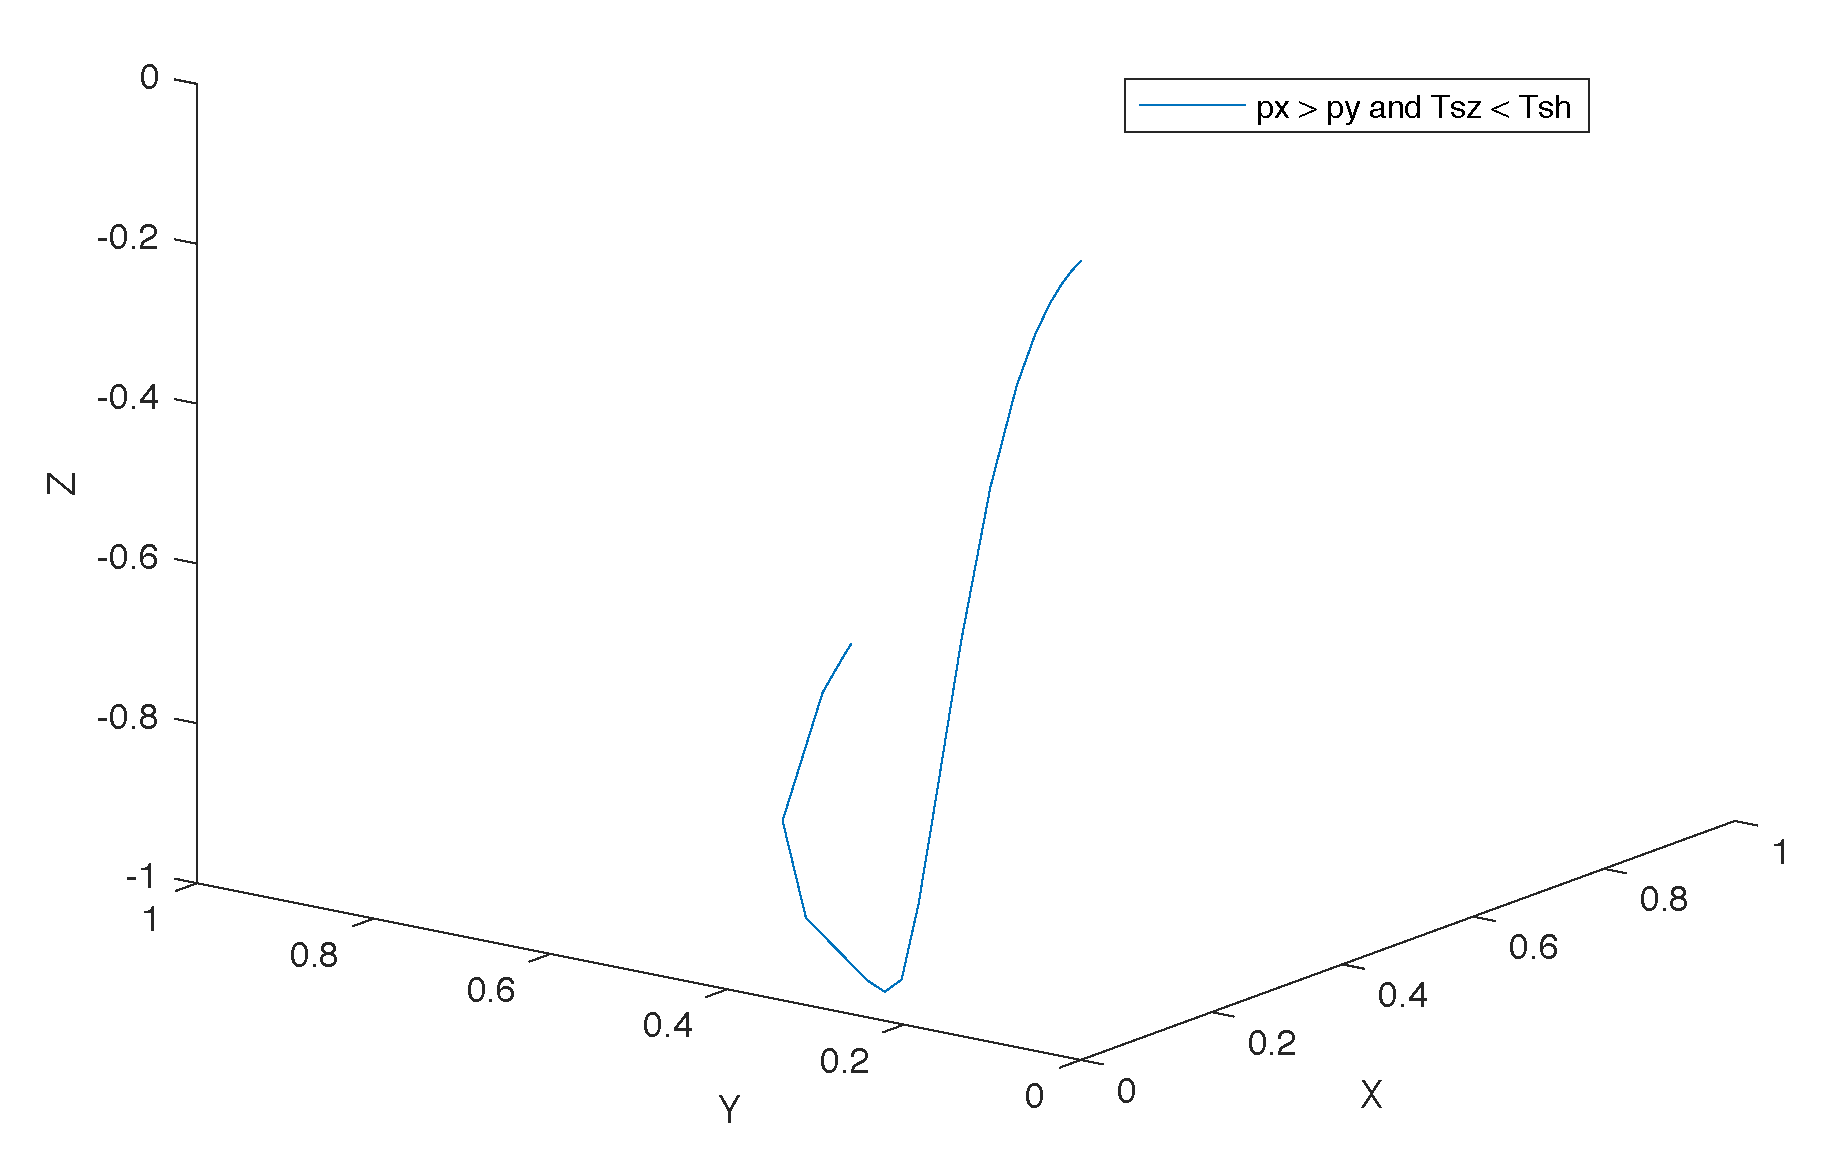
Applying the guidance law that we propose, in 3D space, and assuming now that there is a difference in behavior between the horizontal plane axes, where p x > p y , we obtain the trajectories presented in Figure 41. Note that in Figure 41 we considered that the behavior in the vertical coordinate z is faster than the behavior in the horizontal plane.
Analyzing the Figure 40 and Figure 41, when considering a slower behavior on the y coordinate, the vehicle behaves as if it is under the action of a disturbance in the direction of that coordinate. Even in the situation where a much slower dynamic is considered for the y-coordinate with respect to x, the vehicle remains within the visibility cone in the x y plane.

7. Discussion

7.1. Pose Estimator

A target was constructed whose physical characteristics maximize its observability. The three color markers are spherical in order to be observable from different perspectives. We chose to use different colors for each of the markers in order to avoid ambiguities in the relative pose estimation. The solution is based on passive visual markers, occasionally illuminated outside only in certain circumstances of visibility. The choice of dimensions for the target was related to three factors: the maximum operating distance W D , the field of view of the lens and the constructive characteristics of the dock. For the relative pose estimation, it was intended to explore as much as possible a minimum system, based only on visual information and with the minimum calculations processing time. The results obtained were more than satisfactory considering that, in the worst case, the accuracy for position estimation was around 7 cm for a working distance of 2.5 m, with the target rotated of 60 around the x axis. That working distance is higher than the intended maximum working distance of 2 m. The maximum average error in target rotation was less than four degrees for a critical situation where the target was rotated 60 degrees on the y axis. From the experimental characterization of the system, we can also conclude that there is an increase of the error as the target moves away from the camera, that is, as the working distance W D increases. This increase in the value of the error is due to four reasons:
  • a misalignment of the camera related to the rail: the nonexistence of a mechanical solution that guarantees the correct alignment between the center of the camera to the tube rail. This misalignment has influence especially on the Y axis, which means a yaw rotation of the camera related to the rail,
  • the increasing offset along the z-axis is related to the non-calibration of the value of the focal length of the cameras lens,
  • small variations in markers illumination that affect the accuracy in detecting the center of mass of each marker in the image,
  • the more the target is away from the camera, any small variation in the detection of the blobs in the image will imply a greater error in the pose estimation. The pinhole model shows that as the target moves away (any small variation on the sensor side (IMAGE) implies a greater sensitivity and a greater error on the SCENE side).
Despite these systematic observed errors that can be easily corrected, the results obtained for the markers detector and pose estimator are quite satisfactory, however, the pose estimator algorithm has an ambiguity: we know the amplitude of R x and R y estimated angles but we don’t know the signal. That is, when the camera is positioned in relation to the target as shown in Figure 21, it exists an ambiguity in the signal for the R x and R y rotations, however, in the context of our work, this is an ambiguous situation that does not happen considering the way the sea-floor docking station is approached (see Figure 1 and Figure 3) by a hovering AUV. This situation can be resolved by adding one more marker to the target. In this case, this fourth marker should be non-coplanar with the other three. In terms of robustness of relative pose estimates, we recognize that there would be an advantage in fusing the monocular vision information with inertial rate sensor measurements to generate an estimate of the relative position between a moving observer and a stationary object. This fusion would create redundancy and therefore increase the robustness of the estimates. That will be a future line of work.

7.2. Resilience to Occlusions and Outliers Rejection

We have developed an approach for visual tracking in a particle filtering framework in order to improve the performance of image markers detection, namely to make the algorithm less sensitive to outliers and to allow estimates even in occlusion situations. In order to improve the computational weight of the relative localization system, the image rectification step was not been considered. This option has increased the level of complexity of the noise model for the maker’s detectors. However the use of a particle filter-based approached with an adaptive color tracker has proved to be a good option and with high levels of accuracy on the positioning estimation, as can be seen in the Figure 34, Figure 35 and Figure 36. In detail we can conclude from the results, in situations of partial occlusion of the markers, the longer duration of the occlusion implies a dispersion of the particles, so the filter would eventually diverge. The inclusion of the geometric constraints in the filter solved this question and good results were obtained. On the other hand, our color-based markers detector, uses an oversized amplitude so that the detection can occur in a greater number of scenarios. This extended amplitude implies the occurrence of outliers detection. For that reason, and to avoid these outliers we add a color histogram in the filter that is adjusted along the tracking. This allows, in the presence of features with a similar color to our markers, to avoid a greater number of outliers and the weight of a particle of the filter has a more adjusted value which results in a more accurate estimation. To increase the cone of visibility of a single camera, it should be explored in future work the use of a pan-tilt based solution. This will imply the use of active perception systems for example when a UAV realizes Pitch roll this can be compensated by the pith tilt system.

7.3. Guidance Law

From the deep system characterization, we know the zone that guarantees the best observation of the target. Knowing that, our strategy has been to look for a way to make the target remain at this central zone of the pyramid (from the point of view of the camera) when the AUV approaches the docking station. We have proposed a strategy to lead the AUV from any point on the pyramid observation zone to the point where the cradle of the docking station is (in the vicinity of the apex of the pyramid), always keeping the target in line of sight. We show that by adequately choosing the references for the linear degrees of freedom (DOF) of the AUV it is possible to dock while keeping the target markers in the field of view of the on-board camera. The performance of the proposed law was tested on simulink/Matlab. A first order model for the closed-loop behavior of the AUV in the horizontal plane ρ and a first-order model for the closed-loop behavior of the AUV in the vertical coordinate z were considered for the first tests. Once we propose a guidance law that can ensures a much faster convergence of ρ to zero that of z to zero, the best way to test this law was to consider the horizontal behavior slower than the vertical one. From the mathematical point of view and from the simulated tests we can ensure that the AUV motion behavior in the vertical coordinate z is always faster than the behavior in the horizontal plane, ensuring always visibility of the markers and the AUV convergence to the docking point. In future work, we will extend the work presented here to more general closed-loop dynamics and acquire data from real experiments with the MARES AUV.

8. Conclusions

In our conceptualization and development of a system to aid autonomous docking of a hovering AUV, It was intended to realize how far we can get by using only a single camera and a dedicated processing unit small enough to be accommodated onboard the MARES. In this sense the results showed that this minimal system is a very capable system. We chose to explore the maximum capabilities of data provided by the image sensor in an environment where visibility is very low. The solutions found to work around this problem yielded very interesting results.
Since no target was found in the literature that would meet our needs, namely that it met the following requirements:
  • versatility (active in certain situations and passive in others)
  • be easily identifiable even in low visibility situations
  • allow to be seen from different points of view.
A 3D target was designed and built that meets the proposed requirements. The 3D hybrid target maximizes the observability of the markers from the point of view of the AUV camera and proved to be a successful solution.
Since an algorithm for estimating the relative attitude that fit our needs was not found in the literature, namely, a low computational cost algorithm, an algorithm was developed from the ground up. Together with the marker detection algorithm, the developed algorithm occupies 83 ms of processing time, which satisfies our requirements.
Not having been found in the literature a solution for situations of partial occlusion of the target and the presence of outliers (which affect the performance of the pose estimator), an innovative solution was developed that presented very satisfactory results. One of the challenges of this work was the persistence of tracking the target even in the case of partial or momentary occlusions of the markers, this challenge was met with good results as a consequence of the implementation of the filters that were designed. The particle filter-based solution also allowed a significant reduction in false detections, which improved pose estimator performance.
Regarding the need for a guidance law for docking the AUV, none of the works found in the literature takes into account our concern to never lose sight of the target until the AUV is fully anchored in the cradle. For that reason, it was necessary to find a solution to this problem. With the characterization of the system, it was possible to gain knowledge of the system as a whole, which allowed us to advance in choosing an approach to the problem of how to ensure that during docking maneuvers the vehicle is guided to the dock station without losing sight of the target markers. For this purpose, a guidance law was defined. Such law can ensure a much faster convergence in the horizontal mode to zero that of vertical to zero as intended. Our approach is pretty general and can be applied to any hovering vehicle.

Author Contributions

Conceptualization, A.B.F. and A.C.M.; methodology, A.B.F. and A.C.M.; software, A.B.F.; validation, A.C.M.; formal analysis, A.B.F. and A.C.M.; investigation, A.B.F.; resources, A.C.M.; data curation, A.B.F.; writing–original draft preparation, A.B.F.; writing–review and editing, A.B.F. and A.C.M.; funding acquisition, A.C.M. All authors have read and agreed to the published version of the manuscript.

Funding

A. Bianchi Figueiredo acknowledges the support of the Portuguese Foundation for Science and Technology (FCT) through grant SFRH/BD/81724/2011, supported by POPH/ESF funding. This work is financed by National Funds through the Portuguese funding agency, FCT—Fundação para a Ciência e a Tecnologia, within project UIDB/50014/2020. The authors also acknowledged the support of the INTENDU project (ref. MARTERA/0001/2017) funded by FCT within the scope of MarTERA ERA-NET (EU grant agreement 728053) for providing technical conditions to perform the work.

Conflicts of Interest

The authors declare no conflict of interest.

Abbreviations

The following abbreviations are used in this manuscript:
AUVAutonomous Underwater Vehicle
ASVAutonomous Surface Vehicle
MARESModular Autonomous Robot for Environment Sampling
MVOMonocular Visual Odometry
MViDOMonocular Vision-based Docking Operation aid
DOFdegrees of freedom
EKFextended Kalman filter
GPSglobal positioning system
IMUinertial measurement unit
FOVlens field of view
HFOVhorizontal field of view
AOVangle of view
Npixelsnumber of pixels

References

  1. Cruz, N.A.; Matos, A.C. The MARES AUV, a Modular Autonomous Robot for Environment Sampling. In Proceedings of the OCEANS 2008, Washington, DC, USA, 15–18 September 2008; pp. 1–6. [Google Scholar]
  2. Figueiredo, A.; Ferreira, B.; Matos, A. Tracking of an underwater visual target with an autonomous surface vehicle. In Proceedings of the Oceans 2014, St. John’s, NL, Canada, 14–19 September 2014; pp. 1–5. [Google Scholar] [CrossRef]
  3. Figueiredo, A.; Ferreira, B.; Matos, A. Vision-based Localization and Positioning of an AUV. In Proceedings of the Oceans 2016, Shangai, China, 10–13 April 2016. [Google Scholar]
  4. Vallicrosa, G.; Bosch, J.; Palomeras, N.; Ridao, P.; Carreras, M.; Gracias, N. Autonomous homing and docking for AUVs using Range-Only Localization and Light Beacons. IFAC-PapersOnLine 2016, 49, 54–60. [Google Scholar] [CrossRef]
  5. Maki, T.; Shiroku, R.; Sato, Y.; Matsuda, T.; Sakamaki, T.; Ura, T. Docking method for hovering type AUVs by acoustic and visual positioning. In Proceedings of the 2013 IEEE International Underwater Technology Symposium (UT), Tokyo, Japan, 5–8 March 2013; pp. 1–6. [Google Scholar] [CrossRef]
  6. Park, J.-Y.; Jun, B.-H.; Lee, P.-M.; Oh, J. Experiments on vision guided docking of an autonomous underwater vehicle using one camera. Ocean Eng. 2009, 36, 48–61. [Google Scholar] [CrossRef]
  7. Maire, F.D.; Prasser, D.; Dunbabin, M.; Dawson, M. A Vision Based Target Detection System for Docking of an Autonomous Underwater Vehicle. In Proceedings of the 2009 Australasian Conference on Robotics and Automation (ACRA 2009), Sydney, Australia, 2–4 December 2009; University of Sydney: Sydney, Australia, 2009. [Google Scholar]
  8. Ghosh, S.; Ray, R.; Vadali, S.R.K.; Shome, S.N.; Nandy, S. Reliable pose estimation of underwater dock using single camera: A scene invariant approach. Mach. Vis. Appl. 2016, 27, 221–236. [Google Scholar] [CrossRef]
  9. Gracias, N.; Bosch, J.; Karim, M.E. Pose Estimation for Underwater Vehicles using Light Beacons. IFAC-PapersOnLine 2015, 48, 70–75. [Google Scholar] [CrossRef]
  10. Palomeras, N.; Peñalver, A.; Massot-Campos, M.; Negre, P.L.; Fernández, J.J.; Ridao, P.; Sanz, P.J.; Oliver-Codina, G. I-AUV Docking and Panel Intervention at Sea. Sensors 2016, 16, 1673. [Google Scholar] [CrossRef] [PubMed]
  11. Lwin, K.N.; Mukada, N.; Myint, M.; Yamada, D.; Minami, M.; Matsuno, T.; Saitou, K.; Godou, W. Docking at pool and sea by using active marker in turbid and day/night environment. Artif. Life Robot. 2018. [Google Scholar] [CrossRef]
  12. Argyros, A.A.; Bekris, K.E.; Orphanoudakis, S.C.; Kavraki, L.E. Robot Homing by Exploiting Panoramic Vision. Auton. Robot. 2005, 19, 7–25. [Google Scholar] [CrossRef] [Green Version]
  13. Negre, A.; Pradalier, C.; Dunbabin, M. Robust vision-based underwater homing using self-similar landmarks. J. Field Robot. 2008, 25, 360–377. [Google Scholar] [CrossRef] [Green Version]
  14. Feezor, M.D.; Sorrell, F.Y.; Blankinship, P.R.; Bellingham, J.G. Autonomous underwater vehicle homing/docking via electromagnetic guidance. IEEE J. Ocean. Eng. 2001, 26, 515–521. [Google Scholar] [CrossRef]
  15. Singh, H.; Bellingham, J.G.; Hover, F.; Lerner, S.; Moran, B.A.; von der Heydt, K.; Yoerger, D. Docking for an autonomous ocean sampling network. IEEE J. Ocean. Eng. 2001, 26, 498–514. [Google Scholar] [CrossRef]
  16. Bezruchko, F.; Burdinsky, I.; Myagotin, A. Global extremum searching algorithm for the AUV guidance toward an acoustic buoy. In Proceedings of the OCEANS’11-Oceans of Energy for a Sustainable Future, Santander, Spain, 6–9 June 2011. [Google Scholar]
  17. Jantapremjit, P.; Wilson, P.A. Guidance-control based path following for homing and docking using an Autonomous Underwater Vehicle. In Proceedings of the Oceans’08, Kobe, Japan, 8–11 April 2008. [Google Scholar]
  18. Wirtz, M.; Hildebrandt, M.; Gaudig, C. Design and test of a robust docking system for hovering AUVs. In Proceedings of the 2012 Oceans, Hampton Roads, VA, USA, 14–19 October 2012; pp. 1–6. [Google Scholar] [CrossRef]
  19. Scaramuzza, D.; Fraundorfer, F. Tutorial: Visual odometry. IEEE Robot. Autom. Mag. 2011, 18, 80–92. [Google Scholar] [CrossRef]
  20. Jaegle, A.; Phillips, S.; Daniilidis, K. Fast, robust, continuous monocular egomotion computation. In Proceedings of the 2016 IEEE International Conference on Robotics and Automation (ICRA), Stockholm, Sweden, 16–21 May 2016; pp. 773–780. [Google Scholar]
  21. Aguilar-González, A.; Arias-Estrada, M.; Berry, F.; de Jesús Osuna-Coutiño, J. The fastest visual ego-motion algorithm in the west. Microprocess. Microsyst. 2019, 67, 103–116. [Google Scholar] [CrossRef]
  22. Li, S.; Xu, C.; Xie, M. A Robust O(n) Solution to the Perspective-n-Point Problem. IEEE Trans. Pattern Anal. Mach. Intell. 2012, 34. [Google Scholar] [CrossRef] [PubMed]
  23. Philip, N.; Ananthasayanam, M. Relative position and attitude estimation and control schemes for the final phase of an autonomous docking mission of spacecraft. Acta Astronaut. 2003, 52, 511–522. [Google Scholar] [CrossRef]
  24. Thrun, S.; Burgard, W.; Fox, D. Probabilistic Robotics (Intelligent Robotics and Autonomous Agents); The MIT Press: Cambridge, MA, USA, 2005. [Google Scholar]
  25. Arulampalam, S.; Maskell, S.; Gordon, N.; Clapp, T. A Tutorial on Particle Filters for On-line Non-linear/Non-Gaussian Bayesian Tracking. IEEE Trans. Signal Process. 2001, 50, 174–188. [Google Scholar] [CrossRef] [Green Version]
  26. Arnaud Doucet, N.d.F.N.G. (Ed.) Sequential Monte Carlo Methods in Practice; Springer: Berlin, Germany, 2001. [Google Scholar]
  27. Li, B.; Xu, Y.; Liu, C.; Fan, S.; Xu, W. Terminal navigation and control for docking an underactuated autonomous underwater vehicle. In Proceedings of the 2015 IEEE International Conference on Cyber Technology in Automation, Control, and Intelligent Systems (CYBER), Shenyang, China, 8–12 June 2015; pp. 25–30. [Google Scholar] [CrossRef]
  28. Park, J.Y.; Jun, B.H.; Lee, P.M.; Oh, J.H.; Lim, Y.K. Underwater docking approach of an under-actuated AUV in the presence of constant ocean current. IFAC Proc. Vol. 2010, 43, 5–10. [Google Scholar] [CrossRef]
  29. Caron, F.; Davy, M.; Duflos, E.; Vanheeghe, P. Particle Filtering for Multisensor Data Fusion With Switching Observation Models: Application to Land Vehicle Positioning. IEEE Trans. Signal Process. 2007, 55, 2703–2719. [Google Scholar] [CrossRef]
  30. Andersson, M. Automatic Tuning of Motion Control System for an Autonomous Underwater Vehicle. Master’s Thesis, Linköping University, Linköping, Sweden, 2019. [Google Scholar]
  31. Yang, R. Modeling and Robust Control Approach for Autonomous Underwater Vehicles. Ph.D. Thesis, Université de Bretagne occidentale-Brest, Brest, France, Ocean University of China, Qingdao, China, 2016. [Google Scholar]
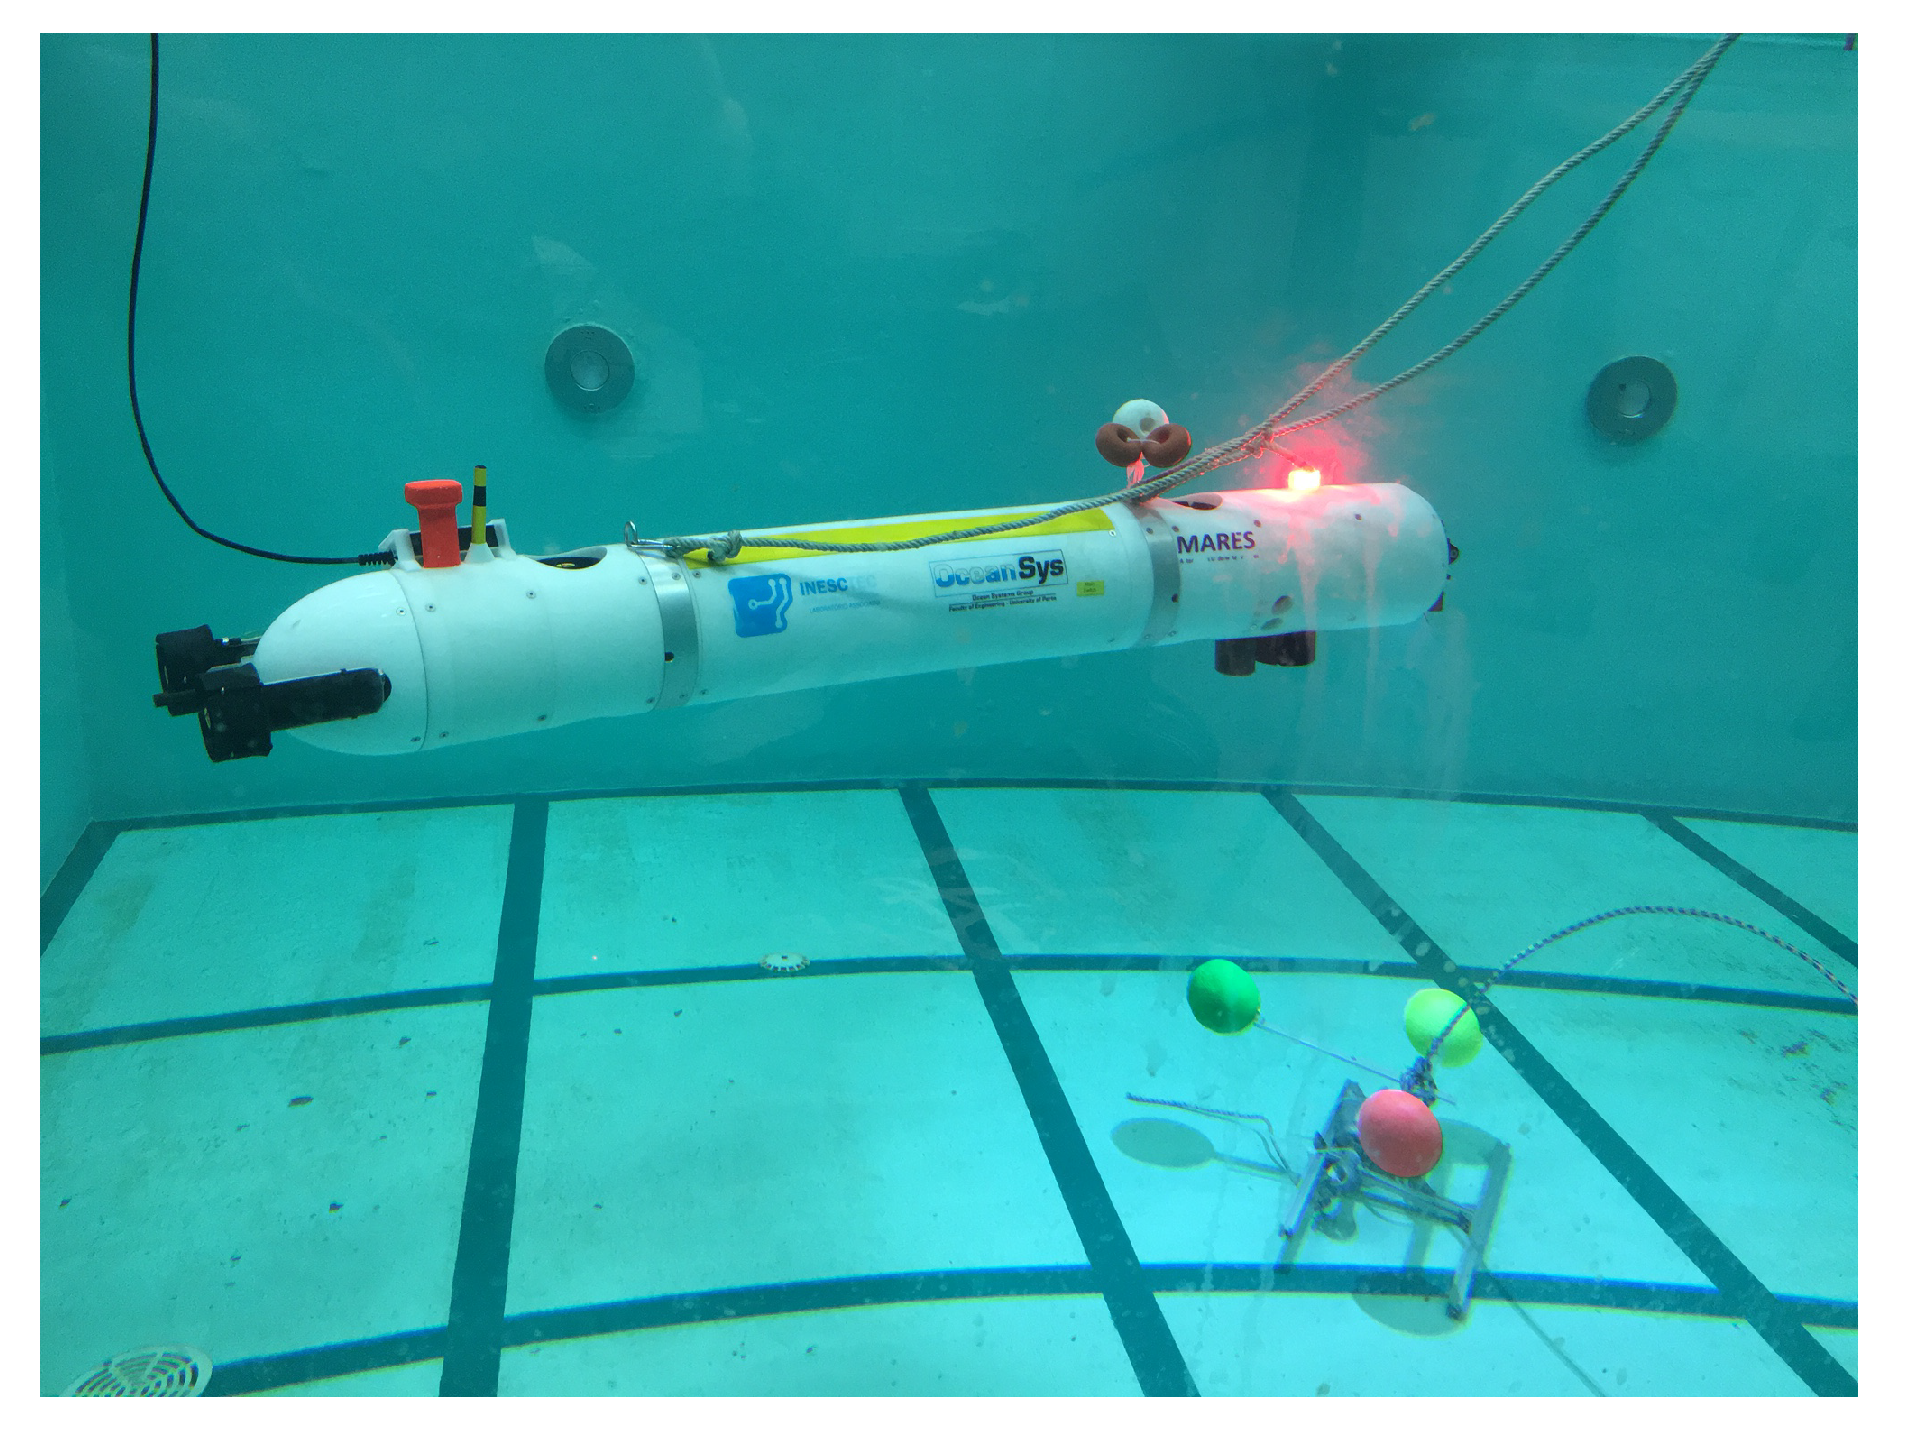
Figure 1. MARES tracking the visual target.
Applsci 10 02991 g001
Figure 2. The hybrid target. (a) The Target dimensions: different distances on the two axes. (b) The developed hybrid Target: the interior lighting intensity is controllable from the docking station.
Applsci 10 02991 g002
Figure 3. Docking station.
Applsci 10 02991 g003
Figure 4. Definitions of the camera and target reference frames for relative localization.
Applsci 10 02991 g004
Figure 5. Pinhole camera model.
Applsci 10 02991 g005
Figure 6. Pose estimator. In the figure, the ’plane r’ is the plane of the target and the ’plane c’ is a mirror plane of the sensor of the camera.
Applsci 10 02991 g006
Figure 7. Proposed approach for tracking the target in video captures and to estimate the relative pose of the AUV with regard to that target. In the Figure, the elements u , v and R are the position of the blob on the image and the blob radius on the image.
Applsci 10 02991 g007
Figure 8. Estimated distances for the target.
Applsci 10 02991 g008
Figure 9. Illustration of the proposed approach to the geometric constraint in the filter.
Applsci 10 02991 g009
Figure 10. description of a particle by the u , v and r d parameters.
Applsci 10 02991 g010
Figure 11. Reference range of the Hue, Saturation, Value (HSV) components.
Applsci 10 02991 g011
Figure 12. Occurrence histograms.
Applsci 10 02991 g012
Figure 13. Image sensor size and Target dimensions in xy.
Applsci 10 02991 g013
Figure 14. Relationship between horizontal field of view, horizontal sensor size and working distance for a given angle of view.
Applsci 10 02991 g014
Figure 15. Camera-target.
Applsci 10 02991 g015
Figure 16. Maximum angle.
Applsci 10 02991 g016
Figure 17. Maximum rotation of the camera in R x or R y .
Applsci 10 02991 g017
Figure 18. Linearize around a certain point:the red marker was centered at zero.
Applsci 10 02991 g018
Figure 19. Sensitivity analysis.
Applsci 10 02991 g019
Figure 20. Pose estimator: experimental validation.
Applsci 10 02991 g020
Figure 21. Experimental procedure for a characterization of the developed system.
Applsci 10 02991 g021
Figure 22. Testing the filter: in this figure, we can observe three images: the left one is an image of the target placed on the bottom of the tank, the tracking algorithm is running with a particle filter per each marker; the middle one is an image of the target placed on the bottom of the tank with an outlier (red point) located on the left hand; the image on the right is an image of the target placed on the bottom of the tank with an occlusion of the green marker
Applsci 10 02991 g022
Figure 23. Error and standard deviation in function of the working distance when the target was rotated of R x = 60 or not rotated R x = 0 . The points in the chart are the mean values of the error and each point is labelled with the respective value of standard deviation.
Applsci 10 02991 g023
Figure 24. Histogram of Z e error for W D = 0.5 m. The curve in blue is the curve estimated by R as the Gaussian curve that is closest to the obtained data.
Applsci 10 02991 g024
Figure 25. Histogram of Z e error for W D = 1.3 m. The curve in blue is the curve estimated by R as the Gaussian curve that is closest to the obtained data.
Applsci 10 02991 g025
Figure 26. Histogram of Z e error for W D = 2.5 m. The curve in blue is the curve estimated by R as the Gaussian curve that is closest to the obtained data.
Applsci 10 02991 g026
Figure 27. Histogram of Z e error when the target is placed within the limit of the field of view of the camera. The curve in blue is the curve estimated by R as the Gaussian curve that is closest to the obtained data.
Applsci 10 02991 g027
Figure 28. Histogram of R x for 60 of rotation. The curve in blue is the curve estimated by R as the Gaussian curve that is closest to the obtained data.
Applsci 10 02991 g028
Figure 29. Histogram of R y for 60 of rotation. The curve in blue is the curve estimated by R as the Gaussian curve that is closest to the obtained data.
Applsci 10 02991 g029
Figure 30. Histogram of R z for 90 of rotation. The curve in blue is the curve estimated by R as the Gaussian curve that is closest to the obtained data.
Applsci 10 02991 g030
Figure 31. Threads time: in the parametrization of the filter, the adjustment of the number of particles is made taking into account the processing time of each frame. It is intended to observe the target at a minimum rate of 10 frames per second (less than 100 ms). This is due to the fact that the control operates at 20 Hz and it is not desired that there is more than one estimation between two consecutive frames. That is, it is desired that the algorithm has a processing time of less than 10 ms. The processing time of the developed filter for 1000 particles occupies 13 ms of the total processing time. In addition to the detector/estimator processing time (83 ms) it is found that the goal of a total processing time of less than 100 ms has been achieved. The equipment used was the developed vision module (Camera Bowtech + Raspberry Pi) whose characteristics are described at the beginning of this chapter.
Applsci 10 02991 g031
Figure 32. Descent of the Autonomous Underwater Vehicle (AUV) MARES towards the target: estimation algorithm with and without a filter. The black curve is the estimation without filter and the red curve is the estimation with filter.
Applsci 10 02991 g032
Figure 33. Outlier zone: this graph is a detail of the graph of the Figure 32, from the frame 44 to frame 108, here we can compare the estimation in the outlier zone with and without the use of the filter. The black curve is the estimation without filter and the red curve is the estimation with filter. The frame 44 was renumbered with the number 1.
Applsci 10 02991 g033
Figure 34. Occlusion zone: this graph is a detail of the graph of the Figure 32, from the frame 124 to frame 284, here we can compare the estimation in the temporary occlusions zone with and without the use of the filter. The black curve is the estimation without filter and the red curve is the estimation with filter. The frame 124 was renumbered with the number 1.
Applsci 10 02991 g034
Figure 35. Occlusions zone: this graph is a detail of the graph of the Figure 32, from the frame 124 to frame 284, here we can compare the estimation in the temporary occlusions zone with and without the use of the filter and adding the geometric constraints to the filter. The black curve is the estimation without filter, the red curve is the estimation with filter and the green curve is the estimation using the filter with geometric constraints of the target. The frame 124 was renumbered with the number 1.
Applsci 10 02991 g035
Figure 36. Outlier zone: this graph is a detail of the graph of the Figure 32, from the frame 44 to frame 108, here we can compare the estimation in the outlier zone with and without the use of the filter and adding the color constraints to the filter. The black curve is the estimation without filter, the red curve is the estimation with filter and the green curve is the estimation using the filter with color constraints of the target. The frame 44 was renumbered with the number 1.
Applsci 10 02991 g036
Figure 37. Trajectories in the ( ρ , z ) plane for starting points ( ρ 0 , z 0 ) = ( 1 , 1 ) and considering p z = 2 p h ; p z = 4 p h ; p z = 8 p h . Even at the situation at which the horizontal behaviour is the slowest one there is a faster convergence from ρ 0 to zero than from z 0 to zero as intended.
Applsci 10 02991 g037
Figure 38. Trajectories in the ( ρ , z ) plane for starting points ( ρ 0 , z 0 ) = ( 1 , 1 ) and considering p z = p h 2 ; p z = p h 4 ; p z = p h 8 . Even at the situation at which the vertical behaviour is the slowest one, the motion remains tangent to the vertical axis.
Applsci 10 02991 g038
Figure 39. Trajectories in the ( ρ , z ) plane for starting points ( ρ 0 , z 0 ) = ( 7.1 , 1 ) and p z > p h . The trajectory illustrate the motion remains tangent to the vertical axis.
Applsci 10 02991 g039
Figure 40. Trajectories x , y assuming a slower behaviour in y coordinate than for x coordinate, p x > p y . The trajectories were generated considering that the poles start to be located at the same point in relation to the origin p x = p y and then p x moves away from the origin in percentages of 10 percent making the behaviour in coordinate x faster than the behaviour in y coordinate.
Applsci 10 02991 g040
Figure 41. Trajectories in the ( x , y , z ) plane considering p x > p y and that the the behaviour in the vertical coordinate z is faster than the behaviour in the horizontal plane. There is convergence for the reference ( 0 , 0 , 0 ) on all axes.
Applsci 10 02991 g041
Table 1. Camera sensor specifications.
Sensor Size (mm)3.2 × 2.4
Resolution (pixels)704 × 576
Pixel Size ( μ m)6.5 × 6.25
Table 2. Camera lens specifications.
Focal length (mm)3.15
Diagonal Field of View ( d e g r e e s )65
Maximum Aperture f 1.4