Abstract
Dam-break flows may change into debris flows if certain conditions are satisfied, such as abundant loose material and steep slope. These debris flows are typically characterized by high density and can generate strong impact forces. Due to the complexity of the materials that they are made of, it has always been very challenging to numerically simulate these phenomena and accurately reproduce experimentally debris flows’ processes. Therefore, to fill this gap, the formation-movement processes of debris flows induced by dam-break were simulated numerically, modifying the existing smoothed particle hydrodynamics (SPH) method. By comparing the shape and the velocity of dam break debris flows under different configurations, it was found that when simulating the initiation process, the number of particles in the upstream section is overestimated while the number of particles in the downstream area is underestimated. Furthermore, the formation process of dam-break debris flow was simulated by three models which consider different combinations of the viscous force, the drag force and the virtual mass force. The method taking into account all these three kinds of interface forces produced the most accurate outcome for the numerical simulation of the formation process of dam-break debris flow. Finally, it was found that under different interface force models, the particle velocity distribution did not change significantly. However, the direction of the particle force changed, which is due to the fact that the SPH model considers generalized virtual mass forces, better replicating real case scenarios. The modalities of dam failures have significant impacts on the formation and development of debris flows. Therefore, the results of this study will help authorities to select safe sites for future rehabilitation and relocation projects and can also be used as an important basis for debris flow risk management. Future research will be necessary to understand more complex scenarios to investigate mechanisms of domino dam-failures and their effects on debris flows propagation.
1. Introduction
Debris flows are among the most recurrent and damaging geological phenomena in mountainous areas across the world and have consistently caused loss of life, agricultural land, infrastructure, and buildings. China is the country affected by the majority of debris flows events and it has the most serious impact to date [1]. According to Zhang et al. [2], 10927 debris flow disasters have been recorded in 23 provinces and cities between 2005 and 2015, with a direct economic loss of 14.2 billion Chinese Yuan.
Debris flows can be divided into three types according to their formation process: frequent occurrence type, dam-break type and landslide type [3,4]. Dam-break debris flows are caused by a large number of solid materials transported by landslides, generated by earthquakes or volcanic lava and these debris flows are typically generated by heavy rainfall and erosion of dam systems [5,6]. The breaking of natural or constructed dams can cause disruptive floods that can pose a huge threat to the water conservancy facilities at the downstream section of the river as well as the safety of people’s lives and properties along the river-bank. This type of disaster is very intense and fast because once the dam breaks, the consequent formation of the debris flow or flood typically causes damages downstream that also affect the restoration of the entire area for a long time frame [7]. Therefore, it is of great theoretical value and practical significance to study the dynamic characteristics of debris flow induced by dam-break in order to provide technical support for the prevention and control of debris flow disasters caused by dam-breaks.
Previous studies on dam-break mainly focused on the prediction of peak discharge, evolution of the debris flows towards the downstream area and their propagation after a dam-break. From the insights made by Saint Venant equations in 1871 to Ritter’s first calculation formula of dam-breaking flow in 1892, Stoker extended Ritter’s formula investigating the debris flow propagation in the downstream area, and since then, several studies have been conducted to provide a better understanding of this phenomenon or to characterize single features typical of each region and environmental condition [8,9,10,11,12,13,14,15,16,17,18].
To date, studies have also been carried out to experimentally characterize dam-break simulation experiments to simulate the process of dam-break and consequent flood evolution [19,20]. Furthermore, field studies to observe this phenomenon and gather essential datasets have also been carried out [19,20,21,22,23]. Dam-break debris flows are characterized by complex formation mechanisms: they typically form due to the mixing of solid and liquid substances in the formation process, and are mainly affected by the type of terrain and geological conditions. Therefore, their properties depends on the particle size distribution, which consequently can generate uneven velocity distributions and large bulk densities. Based on this, the impact forces associated with debris flows induced by dam-break are much stronger and various, hence there is a significant need to expand our knowledge and further investigate these phenomena.
To the authors’ knowledge, research conducted to date on dam-break debris flow is limited, and only a few studies have obtained some preliminary results [6,23]. Other studies have focused on the characteristics of partially and fully submerged range of the dams, identifying the correspondent impact force, speed of propagation, and accumulation depth to identify protective measures [24,25]. However, to date, studies on the formation and the initiation process of debris flows induced by dam-break still remain limited to the quantitative description of the flows and sediments’ conditions and the estimation of the magnitude of debris flows, while the formation dynamic mechanisms are not completely clear yet. Most of the studies on the formation processes and the particle initiation mechanisms of debris flows apply the typical assumptions of the particle initiation theory in river dynamics, and the liquid-phase fluid characterization that promotes particle initiation as for uniform and stable flow. This generalization is reasonable for general debris flows, however for the study of debris flows induced by dam-breaks, there is obvious dissimilar conditions to take into consideration such as the strong pressure upstream the dam that can vary the release of debris flows or the steep gradient after the dam that may lead to much higher velocities for the debris flow propagation.
To fill this gap, an initiation model for dam-break processes based on the two-phase flow theory and particle initiation theory is established in this study, and the interfacial force is discretized with the smoothed particle hydrodynamics (SPH) theory, and the existing erosion module in the SPH model is modified. By simulating the erosion processes of dams under three different interfacial forces, the differences of dam-break process under different mechanical models are expounded. The results of these models could have important guiding significance for the planning and design of debris flow control strategies and the improvement of monitoring and implementation of early warning systems. In fact, these models could be incorporated into predictive hazard maps to include the risk of dam-break debris flows, driving land-use planning strategies instead of adapting urban developments based on the restoration of effects caused by past events.
2. Methodology
2.1. Theoretical Derivation: Interfacial Force
As shown in Figure 1, the initiation process of particles is a complex dynamic process including the gravity , horizontal thrust force , uplift force , viscosity force between particles and many other forces [26]. Among them, the horizontal thrust and uplift force are the forces exerted by the fluid phase on the solid particles to be moved, which are also affected by the drag force and the generalized virtual mass force .
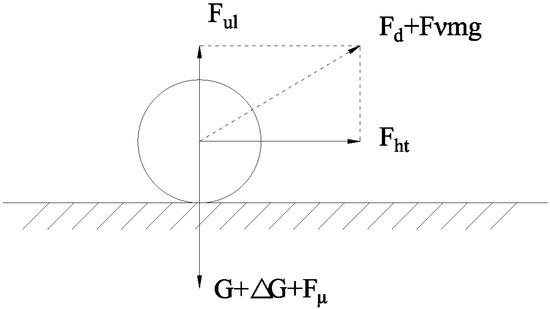
Figure 1.
Interfacial forces acting on a particle.
Pudasaini [27] has given the expression of the generalized interfacial force.
where F0 is the interfacial force, Cd is the drag coefficient, Cvmg is the generalized virtual mass coefficient, uf and us are the fluid and solid phase velocity, respectively. In Equation (1), the drag force term is square with the relative velocity between phases, and the second term is the generalized virtual mass force.
When the relative velocity between the solid and liquid phases has an acceleration over time, the fluid around the particles will be affected by an additional force, which is related to the time derivative of the relative velocity.
Based on previous research results [27,28,29], Equation (1) can be transformed into:
where Bd denotes the particle volume, αs and αf denote the volume fractions for the solid and the fluid constituents, ρs and ρf denote the density of the solid and the fluid, ω denotes the particle settling velocity through fluid, F(Rep) = γ(αf/αs)3Rep/180 depends linearly on the particle Reynolds number Rep, density ratio γ and the cube power of the ratio αf/αs between fluid and solid volume fractions. G(Rep) = αfM(Rep)−1 depends on the fluid volume fraction and the particle Reynolds number. For sediment particles in critical initiation state, , when we focus on the instantaneous state of particle initiation, the derivative of liquid velocity to time , therefore, Equation (2) can be simplified as follows:
2.2. Theoretical Derivation: Particle Initiation Model
Han [26] comprehensively considered the joint random action of water flow and particles, and gave the critical condition of particle initiation, displayed in Equation (4).
In Equation (4), , and are parameters related to the relative position of particles, and denotes the additional pressure caused by the layer of water.
As shown in Figure 2, the horizontal thrust generated by water flow has a positive moment on particle under investigation, which is also affected by the horizontal thrust , position parameters and , where denotes the relative height between the horizontal thrusting point and the center of particle gravity. When the horizontal thrusting point is higher than the center of particle gravity, is positive, otherwise is negative. denotes the angle between the center of the particle gravity and the connecting line of the contact point and the vertical direction. When , , the effect of the horizontal thrust on the particles hinders the initiation of the particles. The uplift force generated by the water flow has a positive moment on the particle, which is affected by the uplift force , position parameters and , where denotes the horizontal distance between the position of the uplift force and the center of particle gravity, when the uplift force is on the opposite side of the fulcrum, is positive, otherwise is negative.
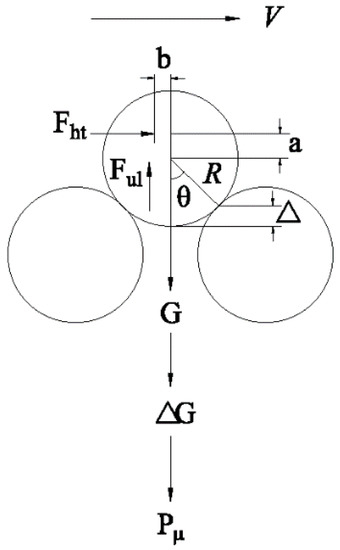
Figure 2.
Critical condition within the equilibrium of moment for the particle initiation.
In previous studies on initiation mechanisms of debris flows, the particle initiation theory, typically adopted in river dynamics, was usually used, and the critical velocity or shear stress corresponding to debris flow particles was regarded as the critical condition of debris flow particle initiation. However, in the calculation of critical velocity or shear stress, the flow is usually regarded as uniform without velocity gradient along its path. This generalization effectively simplifies the complexity of the problem, which is very suitable for the study of the initiation mechanism of the frequent occurrence of debris flow. However, in the formation process of debris flow induced by dam-break, the depth of the fluid in front of the dam decreases sharply, and the flow pattern in front of the dam can no longer be regarded as uniform flow. Hence, considering the change of the flow conditions, the critical assumption of particle initiation will also change, accordingly.
As shown in Figure 3, when velocities in regions A and B are approximately equal (), there is nearly no gradient along the flow velocity and the force of the water on the particles can be simplified as . When , the velocity gradient of the erosion particles is , the generalized mass force of the sediment is in the direction of dotted line in Figure 3, and the generalized mass force will prevent particles from starting to move. When , is the direction of solid line in Figure 3 and it will enable the initial movement of the particles.
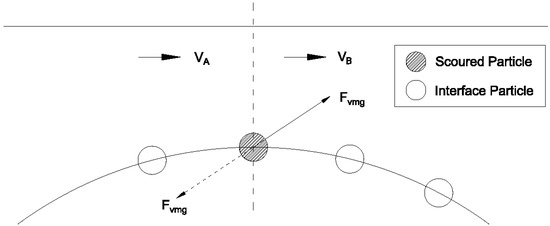
Figure 3.
Particle initiation process in response to the fluid velocity.
2.3. Model Establishment
In order to describe this phenomenon, we use smooth particle hydrodynamic (SPH) model to simulate the process of particle initiation and dam-break quantitatively. SPH is a method characterized by a mesh-free approach which is based on a pure Lagrangian description. This technique has been previously adopted for engineering and science studies [30,31,32,33,34,35,36]. By comparing this technique against the mesh method based on continuum theory, it is possible to state that the SPH method avoids the problem of mesh distortion in dealing with the flow since there is no connectivity between the particles considering that it is developed on a uniform smoothed particle hydrodynamic framework. Similarly, the dam-break debris flow will encounter the violent two-phase interactive movement of soil collapse in the formation process, so the SPH model has a natural advantage in simulating the process of dam-break debris flow.
2.3.1. Governing Equations
The principles of mass and momentum conservation are included within the governing equations for transient compressible fluid flows. These can be written as follows for a Lagrangian framework [37]:
where stands for pressure and D/Dt refers to the material derivative, t is time, is the particle velocity vector, g is the gravitational acceleration. The density has been intentionally kept in the equations to be able to enforce the incompressibility of the fluid. Using an appropriate constitutive equation to model the shear stress tensor , Equations (9) and (10) can be used to solve both Newtonian and non-Newtonian flows [37].
The momentum equations adopted for this study include three driving force terms (i.e., body force, forces due to divergence of stress tensor, and the pressure gradient) that have to be considered with the incompressibility constraint. Furthermore, the above system of governing equations was solved for each particle at each time-step (typical for a SPH formulation). Each algorithm implements these terms related to each force within the momentum equations by following a specific order that may vary from one method to another.
2.3.2. Viscous Terms
The dam-break debris flow studied in this paper is a typical two-phase fluid problem. The sediment concentration in the slurry at the initial stage is quite low, which can be approximately regarded as Newtonian fluid. Its constitutive equation meets the following requirements:
where is the dynamic viscosity coefficient of water, usually taken as. . When the particles are initiated by water and mixed with it, the non-Newtonian fluid with higher sediment concentration will become more viscous, and the deformation to the dam will produce greater shear stress.
where refers to the yield stress; refers to the coefficient of friction and refers to the coefficient of collision stresses.
Refer to [26] and deal with Equation (8), the viscous term in the x, y direction can be represented by the following discretization:
In this study, the slurry formed after the initiation of the sediment particles is collected through the flume experiment. The slurry rheology coefficient was measured by the MCR301 advanced rotary rheometer, which is an equipment manufactured by Anton Paar, Austria [27]. The viscosity parameters collected are the following ones: , , .
2.3.3. Erosion
This section describes the integration of an erosion model with SPH-based fluid simulation. Our simulation uses four kinds of particles (see in Figure 4): the interfacial particles on the dam boundary, the scoured particles in the critical initiation state, the sediment particles that have been started and the water particles that provide power for the initiation process.
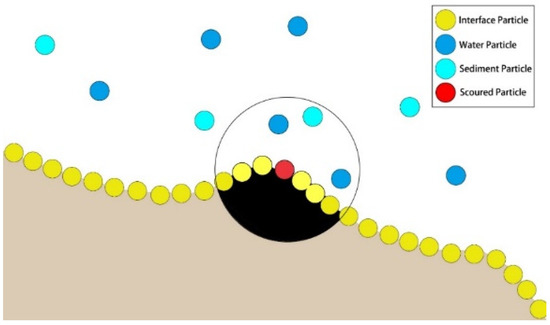
Figure 4.
Different particles involved in the initiation process.
According to Section 2.2, when the particles to be initiated are located on different sediment slopes, they will be subjected to different generalized mass force. The erosion algorithm applied in this study runs following these steps:
- It calculates the force of sediment particles on the scoured particles in the area affected. Water particles and sediment particles are respectively applicable to different constitutive equations.
- It calculates the velocity gradient of the sediment and water particles around the erosion particles, and gets the generalized mass force of the erosion particles.
- It quantifies the drag force on the eroded particles by counting the components provided by the velocity of the sediment and water particles around the eroded particles.
- It estimates the particles initiation by combining the viscosity force, the generalized mass force and shear force of particles.
At the end, it determines the terrain height according to the change in amount of sediment within the boundary conditions.
Compared with the previous sediment initiation models, this study considers the effects of the velocity on the incipient motion and the generalized mass force, both considered as important factors for the incipient motion, considering the non-uniformity of the flow velocity during the dam collapse. As shown in Figure 5a, on the upstream of the dam body, the flow velocity in region A is smaller than the velocity in region B.

Figure 5.
Particle initiation process on different slopes. (a) refers to the section upstream the dam body; (b) refers to the section downstream the dam body.
According to the theoretical derivation results in Section 2.2, the particles in the erosion area will be subject to the generalized mass force that hinders the particle initiation. On the downstream area of the dam body, the flow velocity in the region A is greater than that in region B, and the particles in the erosion area are subject to generalized mass force that promotes the particle initiation. Therefore, even at the same velocity, the particles in the erosion area in Figure 5a,b will have different initiation probability due to the difference of velocity gradient caused by the upstream and downstream slope.
2.3.4. Simulation Setting
The numerical simulation was carried out to generate the experimental conditions previously described (Figure 6). The numerical simulation replicated N = 113054 particles, particle spacing dp = 0.0025 m, water particle density ρw = 1000 kg/m3, solid particle density ρs = 1400 kg/m3. The dam body is isosceles trapezoid, the angle between the profile of the dam body and the horizontal direction is 20°, the height of the dam body is 0.2 m, the length of the bottom surface of the dam body is 1 m, and the length of the dam crest is 0.45 m.

Figure 6.
Initial state. The water level upstream maintained constant at h = 0.2 m.
In order to compare the effects of different interfacial forces on the formation process of dam-break debris flow, the following conditions were used to replicate different solid-liquid two-phase interaction forces.
3. Results and Discussion
3.1. Numerical Simulation Results
By simulating the formation processes of dam-break debris flow in different interfacial models, a series of experiments was completed. For each of these experiments, multiple parameters associated with the movement of the fluid were measured (surface heights, fluid velocities, pressures, and shear deformations). Figure 7 represent the free surface values for each of the tests conducted in Table 1. The x-axis represents the length L of the debris flow, and the y-axis represents the height H of the debris flow. There are three models: Figure 7a,d show model no. 1, the interfacial force only contains the viscous force; Figure 7b,e show model no. 2, the interphase force includes the viscous force and the drag force; Figure 7c,f show model no. 3, and this model takes into account the synergy of the viscous force, the drag force, and the virtual mass force.

Figure 7.
Debris flow free surface for tests 1, 2, 3 (Table 1), (a), (b) and (c) refer to the section upstream the dam body; (d), (e), and (f) refer to the section downstream the dam body.

Table 1.
Experimental conditions (viscosity values and interfacial force model) adopted for this study.
By comparing the free-surface flow, it is found that models no. 1 and no. 2 have similar free surface heights in the whole study area. The free surface slowly declines in the front section of the dam body, and begins to decline rapidly from x = 2.5 m. However, model no. 3 begins to decline rapidly from x = 2.15 m, showing more fluctuation characteristics in the area of x > 2.5 m compared to no. 1 and no. 2.
In addition, after 0.2 s of fluid start-up, particle initiation occurs in three different inter phase force models of dam-break debris flow. However, by comparing the particle initiation positions, it is found that the positions where most particle moved were x = 2.09 m, x = 2.10 m, and x = 2.91 m, respectively. Comparing model no. 1 and no. 2 in Table 1, the simulated initiation positions associated with the additional mass force are obviously further upstream.
The above phenomena show that the numerical model considering the general virtual mass force presents a difference in heights of the free surface flow. However, due to the inherent characteristics of the SPH method, it is also difficult for particles in different layers to fully mix. Therefore, it can be considered that this difference may be caused by the interaction between sediment particles and water particles at the interface. Through observations of the region between 2.5 and 3.0 m, it can be noticed that there is a certain correlation between the free surface and the particle initiation phenomenon, which indicates that there is a certain coupling effect between the particle initiation and the flow. The flow magnitude causes the erosion and the particle to move, and the shape of the dam body changes after particles starts to move producing some kind of response to the subsequent flow.
3.2. Model Validation and Analysis
Comparing the numerical simulation results of the three different interface force models displayed in Table 1, as shown in Figure 8, in the forepart (L = 2–2.2 m) of the dam body, the erosion of the three models to the dam body was observed to be very similar.

Figure 8.
Boundary layer curves under different initiation modes displayed in Table 1.
In the middle section (L = 2.2–2.6 m) of the dam body, no. 3 method starts with less sediment if compared with no. 1 and no. 2, and this is more consistent with the experimental results (similarly, in the back half of the dam body, the area between 2.6–3.0 m, due to the consideration of the generalized virtual mass force). The average errors of the three methods against experimental results were 0.022354, 0.03079, and 0.01086, respectively.
In order to further study the cause of the difference of dam breach location, the velocity of the particles at the interfacial location was analyzed, as shown in Figure 9.

Figure 9.
Particles velocity distribution within different initiation modes.
By analyzing the characteristics of the velocity distributions (Figure 9), it is possible to notice that the particles in the reservoir area (2.0–2.4 m) have low velocity, and that the particle velocity distribution is concentrated with most particles within the range of 0–0.2 m/s. However after the dam (2.5–3.0 m), because the particles are transforming into free outflow, their gravitational potential energy can be rapidly be converted into kinetic energy. In this region, the average velocity of the particles increases rapidly. Through careful observation, it can also be noticed that the particle velocity in the region of 2.5–3.0 m shows fluctuations, and this result is also consistent with previous research results, that is, SPH particles often propagate kinetic energy by wave conditions. Under the three different models, at t = 0.5 s, the velocity of the three groups did not show significant difference within the range of 2.0–3.0 m, which indicates that at this time, the difference of dam breach degree did not generate any variation in flow velocities; therefore, the difference of dam-break degree is not majorly affected by the flow velocity.
The force on the boundary particles of the dam was also calculated by pairing particles that had the greatest impact on the dam-break. It was found that in the section of the dam between 2.0–2.5 m, the force direction of the external particles on the dam body is more evenly distributed in the range of {−90°+90°}, which indicates that the particle turbulence in this area may be relatively high. Therefore, it could have a certain randomness for the initiation of particles on the boundary side of the dam. However, as shown in Figure 10, the average velocity of particles at the interface of the front section of the dam body is small and the variation range is small, so according to equation (1), even if the turbulence intensity of the particles in this section is large, it should not be the active area of where the particles starts to move. Nevertheless, due to the effect of the additional mass force not considered in the simulation process, both models 1 and 2 show multiple fluctuations even in the start-up region just after the dam body, which may be associated with the inaccuracy of the numerical simulation and assumptions assumed for these cases.

Figure 10.
Particles velocity direction distribution in different initiation modes.
However, the particle velocity distribution for model no. 3 compared with no. 1 and no. 2, is relatively lower {−90°+20°}. The reason is that the effect of additional mass force is taken into account, and some of the additional mass force acts as an obstacle to the initiation of the particles, which causes the dam body to break in a minor way for model no. 3, and this result is more consistent with the experimental results of flume [1,37]. However, in the section just after the dam (2.5–3.0 m), due to the slope effect, the direction of the particles’ force is more concentrated {−40°+0°} (Figure 10). Compared with models no. 1 and no. 2, the blue particles representing No.3 are more distributed in the area of θ < −20°, causing a stronger dam body scour, and this phenomenon is also consistent with the experimental results [1,37].
4. Conclusions
Debris flows are natural phenomena that typically lead to serious economic and human losses across the world. Debris flows induced by dam-break are even greater threats to people’s life and properties in downstream areas of the catchment and people’s safety strongly relies on the correct function of dam systems. Due to of its non-grid nature, the SPH method has inherent advantages in simulating dam-break. Thus, this method has been applied to provide a quantitative modelling of this phenomenon to help providing a better understanding as well as identifying design strategies that could be implemented to minimize the negative impacts induced by dam-break debris flows. This study focused on characterizing different models of interfacial forces response to the initiation of dam-break particles.
The SPH model has been adopted by multiple studies and it has demonstrated to have high accuracy in replicating properties (i.e., velocity of propagation, water heights) typical of debris flows and more importantly to be able to correctly simulate the time–space evolution of solid and liquid particles during the whole process (from initiation to propagation over an impervious/permeable bottom boundary). The interfacial forces in the SPH model were modified based on the theory of solid–liquid two phase flow. It was found that under different velocity gradients, even particles with the same velocity have different impact ability. The results obtained may be summarized as follows:
- By comparing the shape and velocity of debris flows under different configurations, it was found that in the simulation of particle initiation process, the number of particles in the upstream section are overestimated while the number of particles in the downstream area are underestimated. The reason for this phenomenon is that the influence of the velocity gradient along the direction of the fluid on the particle initiation is ignored in the generalization process of the initiation model.
- By considering the influence of generalized virtual mass force, the interface force in SPH model was modified. In this study, the formation process of dam-break debris flow was simulated by three models which considered different combinations of the viscous force, drag force, and virtual mass force. The simulation results show that the improved model considering these three kinds of interface forces together is the most accurate to simulate the formation process of dam-break debris flow after comparison with experimental results.
- In order to further study the internal mechanism of the model improvement, the velocity and direction of particles at the interface was investigated, and it was found that under different interface force models, the particle velocity distribution did not change significantly between the three methods. However, the direction of particle force changed, which is due to the fact that the SPH model considers generalized virtual mass forces, better replicating real case scenarios.
3D mathematical approaches could definitely be used to reduce the uncertainties within the results obtained in this study, especially if they can accurately take into account the variation of pore water pressures inside the propagating mass. Therefore, future research should target the development of these 3D mathematical models.
These results (which interfacial forces should be considered, expected velocity ranges and influence of slope gradients) should be incorporated with the preparation of natural hazard maps which are crucial for urban development because debris flows induced by dam-break are capable of producing damage to the natural and man-made environment, and their impact can have long term effects on human life and activities which need to be mitigated.
Author Contributions
All authors have read and agreed to the published version of the manuscript. Conceptualization, A.S. and S.W.; Methodology, A.S., S.W., and F.Z.; Software, A.S. and S.W.; Validation, A.S., S.W., and M.R.; Formal analysis, A.S., M.W., and S.W.; Investigation, A.S., S.W., F.Z., M.R., and J.Q.; Resources, A.S. and S.W.; Data curation, A.S., S.W., M.W., and M.R.; Writing—original draft preparation, A.S., S.W., and M.R.; Writing—review and editing, A.S., S.W., and M.R.; Visualization, A.S. and S.W.; Supervision, A.S., S.W., and M.R.; Project administration, A.S. and S.W.; Funding acquisition, A.S.
Funding
The research reported in this manuscript is funded by the National key research and development plan (grant no. 2018YFC1406400), the Key Project of National Natural Science Foundation (grant no. U1901212) and the Natural Science Foundation of China (grant no. 11372048).
Conflicts of Interest
The authors declare no conflict of interest.
References
- Shu, A.P.; Tian, L.; Wang, S.; Rubinato, M.; Zhu, F.Y.; Wang, M.Y.; Sun, J.T. Hydrodynamic characteristics of the formation processes for non-homogeneous debris-flow. Water 2018, 10, 452. [Google Scholar] [CrossRef]
- Zhang, N.; Fang, Z.W.; Han, X.; Chen, C.L.; Qi, X.B. The study on temporal and spatial distribution law and cause of debris flow disaster in Chinain recent years. Geosci. Front. 2018, 25, 299–308. (In Chinese) [Google Scholar]
- Wang, N.; Cheng, W.; Zhao, M.; Liu, Q.; Wang, J. Identification of the debris flow processes types within catchments of Beijing mountainous area. Water 2019, 11, 638. [Google Scholar] [CrossRef]
- Coussot, P.; Meunier, M. Recognition, classification and mechanical description of debris flows. Earth-Sci. Rev. 1996, 40, 209–227. [Google Scholar] [CrossRef]
- Shu, A.P.; Sun, J.T.; Zhang, X.; Wang, S.; Shi, Z.; Pan, H.L. Dynamical characteristics of formation processes for non-homogeneous debris flow. J. Hydraul. Eng. 2016, 47, 850–857. (In Chinese) [Google Scholar]
- Ni, H.Y.; Tang, C. Advances in the physical simulation experiment on debris flow initiation in China. Adv. Water Sci. 2014, 4, 606–613. (In Chinese) [Google Scholar]
- Niu, Z.P.; Xu, W.L.; Zhang, J.M.; Li, J.; Yue, C. Experimental Investigation of Scour and Dam-break of Landslide Dam. Adv. Eng. Sci. 2009, 3, 90–95. (In Chinese) [Google Scholar]
- Capart, H.; Young, D.L. Formation of jump by the dam-break wave over a granular bed. J. Fluid Mech. 1998, 372, 165–187. [Google Scholar] [CrossRef]
- Li, Y.; Su, P.C.; Cui, P.; Hu, K.H. A Probabilistic View of Debris Flow. J. Mt. Sci.-Engl. 2008, 5, 91–97. [Google Scholar] [CrossRef]
- Stoker, J.J. Water Wave; Interscience Publishers: New York, NY, USA, 1957; pp. 334–341. [Google Scholar]
- Dressler, R.F. Unsteady Non-Linear Waves in Sloping Channels. Proc. R. Soc. A 1958, 247, 186–198. [Google Scholar]
- Han, G.; Wang, D. Numerical modelling of Anhui debris flow. J. Hydraul. Eng. 1996, 122, 262–265. [Google Scholar] [CrossRef]
- Mangeney, A.; Heinrich, P.; Roche, R. Analytical solution for testing debris avalanche numerical models. Pure Appl. Geophys. 2000, 157, 1081–1096. [Google Scholar] [CrossRef]
- Di, B.; Zhang, H.; Liu, Y.; Li, J.; Chen, N.; Stamatopoulos, A.C.; Luo, Y.; Zhan, Y. Assessing susceptibility of debris flow in southwest China using gradient boosting machine. Sci. Rep. 2019, 9, 1–12. [Google Scholar] [CrossRef] [PubMed]
- Liu, J.; You, Y.; Chen, X.; Liu, J.; Chen, X. Characteristics and hazard prediction of large-scale debris flow of Xiaojia Gully in Yingxiu Town, Sichuan Province, China. Eng. Geol. 2014, 180, 55–67. [Google Scholar] [CrossRef]
- Yu, B.; Ma, Y.; Wu, Y. Case study of a giant debris flow in the Wenjia Gully, Sichuan Province, China. Nat. Hazards 2013, 65, 835–849. [Google Scholar] [CrossRef]
- Wang, L.H.; Hu, S.Y. Study on dam failure related problems. Adv. Sci. Technol. Water Resour. 2007, 27, 80–85. (In Chinese) [Google Scholar]
- Iverson, R.M.; Ouyang, C.J. Entrainment of bed material by Earth-surface mass flows: Review and reformulation of depth-integrated theory. Rev. Geophys. 2015, 53, 27–58. [Google Scholar] [CrossRef]
- Soares-Frazão, S.; Le Grelle, N.; Spinewine, B.; Zech, Y. Dam-break induced morphological changes in a channel with uniform sediments: Measurements by a laser-sheet imaging technique. J. Hydraul. Res. 2007, 45, 87–95. [Google Scholar] [CrossRef]
- Brooks, G.R.; Lawrence, D.E. The drainage of the Lake Ha!Ha! reservoir and downstream geomorphic impacts along Ha!Ha! River, Saguenay area, Quebec, Canada. Geomorphology 1999, 28, 141–167. [Google Scholar] [CrossRef]
- Spinewine, B.; Zech, Y. Small-scale laboratory dam-break waves on movable beds. J. Hydraul. Res. 2007, 45, 73–86. [Google Scholar] [CrossRef]
- Gardner, T.W. Experimental study of knickpoint and longitudinal profile evolution in cohesive, homogeneous material. Geol. Soc. Am. Bull. 1983, 94, 664–672. [Google Scholar] [CrossRef]
- Zhuang, J.Q.; Cui, P.; Hu, K.H.; Chen, X.Q.; Ge, Y.G. Research on Debris Flow Initiation Due to Bed Failure After Wenchuan Earthquake. Adv. Eng. Sci. 2010, 5, 230–236. (In Chinese) [Google Scholar]
- Liu, Y.; Qi, Q.L.; Zhang, L.T. Study on Evolution of Debris Flow from Dam Break and Protection Measures. Metal Mine 2015, 12, 139–143. (In Chinese) [Google Scholar]
- Jing, X.F.; Pan, C.S.; Xie, D.; Gong, X.L.; Zhang, X.S. Design and verification of similar simulation test bed for debris flow due to dam break of tailings pond. J. Saf. Sci. Technol. 2017, 13, 24–29. (In Chinese) [Google Scholar]
- Han, Q.W. Characteristics of incipient sediment motion and incipient velocity. J. Sediment Res. 1982, 2, 12–26. (In Chinese) [Google Scholar]
- Pudasaini, S.P. A general two-phase debris flow model. J. Geophys. Res. Earth Surf. 2012, 117, F03010. [Google Scholar] [CrossRef]
- Ishii, M.; Zuber, N. Drag coefficient and relative velocity in bubbly, droplet or particulate flows. Am. Inst. Chem. Eng. 1979, 25, 843–855. [Google Scholar] [CrossRef]
- Drew, D.A.; Lahey, R.T., Jr. The virtual mass and lift force on a sphere in rotating and straining inviscid flow. Int. J. Multiph. Flow 1987, 13, 113–121. [Google Scholar] [CrossRef]
- Xenakis, A.M.; Lind, S.J.; Stansby, P.K.; Rogersb, B.D. An incompressible SPH scheme with improved pressure predictions for free-surface generalised Newtonian flows. J. Non-Newton. Fluid Mech. 2015, 218, 1–15. [Google Scholar] [CrossRef]
- Springel, V.; Hernquist, L. Cosmological smoothed particle hydrodynamics simulations: A hybrid multiphase model for star formation. Mon. Not. R. Astron. Soc. 2003, 339, 289–311. [Google Scholar] [CrossRef]
- Gómez-Gesteira, M.; Dalrymple, R.A. Using a three-dimensional Smoothed Particle Hydrodynamics method for wave impact on a tall structure. J. Waterw Port Coast. 2004, 130, 63–69. [Google Scholar] [CrossRef]
- Flebbe, O.; Muenzel, S.; Herold, H.; Riffert, H. Smoothed Particle Hydrodynamics: Physical viscosity and the simulation of accretion disks. Astrophys. J. 1994, 431, 754–760. [Google Scholar] [CrossRef]
- Ran, Q.; Tong, J.; Shao, S.; Fu, X.; Xu, Y. Incompressible SPH scour model for movable bed dam break flows. Adv. Water Resour. 2015, 82, 39–50. [Google Scholar] [CrossRef]
- Zheng, X.; Shao, S.; Khayyer, A.; Duan, W.; Ma, Q.; Liao, K. Corrected first-order derivative ISPH in water wave simulations. Coast. Eng. J. 2017, 59, 1750010. [Google Scholar] [CrossRef]
- Yang, H.J.; Wei, F.Q.; Hu, K.H. Determination of the maximum packing fraction for calculating slurry viscosity of debris flow. J. Sediment Res. 2018, 3, 382–390. [Google Scholar]
- Wang, S.; Shu, A.P.; Rubinato, M.; Wang, M.Y.; Qin, J.P. Numerical simulation of non-homogeneous viscous debris-flows based on the smoothed particle hydrodynamics (SPH) method. Water 2019, 11, 2314. [Google Scholar] [CrossRef]
© 2020 by the authors. Licensee MDPI, Basel, Switzerland. This article is an open access article distributed under the terms and conditions of the Creative Commons Attribution (CC BY) license (http://creativecommons.org/licenses/by/4.0/).