Article

Performance Comparisons on Parallel Optimization of Atmospheric and Ocean Numerical Circulation Models Using KISTI Supercomputer Nurion System

1
Department of Oceanography, Inha University, 100 Inha-ro, Michuhol-gu, Incheon 22212, Korea
2
Korea Institute of Science and Technology Information, 245 Daehak-ro, Yuseong-gu, Daejeon 34141, Korea
3
Typhoon Research Center/Graduate School of Interdisciplinary Program in Marine Meteorology, Jeju National University, 102 Jejudaehak-ro, Jeju-si 63243, Korea
*
Author to whom correspondence should be addressed.
Appl. Sci. 2020, 10(8), 2883; https://doi.org/10.3390/app10082883
Submission received: 30 January 2020 / Revised: 10 April 2020 / Accepted: 16 April 2020 / Published: 21 April 2020

Abstract

:
The characteristics of the 5th Supercomputer Nurion Knights Landing (KNL) system of the Korea Institute of Science and Technology Information (KISTI) were analyzed by developing ultra-high resolution atmospheric and ocean numerical circulation models. These models include the Weather Research and Forecasting System (WRF), Regional Ocean Modeling System (ROMS), and Unstructured Grid Finite Volume Community Ocean Model (FVCOM). Ideal and real-case experiments were simulated for each model according to the number of parallelized cores used for comparing performances. Identical experiments were performed on a general multicore system (Skylake and a general cluster system) for a performance comparison with the Nurion KNL system. Although the KNL system has more than twice as many cores per node as the Skylake system, the KNL system demonstrated 1/3 of the performance rate of the Skylake system. However, the performance rate of the Nurion KNL system was approximately 43% for all experiments. Reducing the number of cores per node in the KNL system by half (36 cores) is the most efficient method when the total number of cores is less than 256 cores, while it is more economical to use all cores when using more than 256 cores. In all experiments, the performance was continuously improved even for a maximum core experiment (1024 cores), thereby indicating that the KNL system can effectively simulate ultra-high resolution numerical circulation models.
Keywords:
Nurion; KNL; SKL; WRF; ROMS; FVCOM

1. Introduction

The Korea Institute of Science and Technology Information (KISTI) recently installed the 5th supercomputer Nurion system, which exhibits theoretical and actual performances of 25.7 PF and 13.92 PF, respectively. Nurion has 8305 computing nodes (approximately 570,000 cores) and is 70 times faster than the performance of the 4th supercomputer which has approximately 30,000 cores and 3400 nodes. Nurion had the 15th highest performance rate (based on actual performance) out of the world’s TOP500 Supercomputers in November 2019 (https://www.top500.org/list/2019/06). The Nurion system is installed on an SSD layer to speed up data movement between its CPU, memory, and disk. Its storage capacity is approximately 21 PB. Nurion has two types of CPUs: an Intel Xeon Phi 7250 Knights Landing (KNL, 8305 nodes) processor and an Intel Xeon 6148 Skylake (SKL, 132 nodes) processor. The KNL processor was released to be fully compatible with Intel Xeon and run the operating system independently on manycore first generation products [1].
The Nurion KNL system has 68 cores per CPU and 96 GB of allocated memory, while the Nurion SKL system has 20 cores per CPU and 192 GB of allocated memory, thereby indicating that the KNL system has relatively low memory. In addition, the speed of the KNL is at 1.4 GHz frequency, which is slower than the speed (2.5–3 GHz) of the SKL system. Therefore, KNL’s performance may be less than 50% of SKL system.
The white paper [2] from DELL EMS in June 2018 compared the performances of the SKL and KNL systems with several numerical models. The Weather Research and Forecasting (WRF) model was also used to compare the performances of both systems in the paper. An experiment for the continental United States (CONUS) was conducted using WRF v3.6.1 as a benchmark model with a 2.5 km resolution, and it was applied to the inputs and outputs by the parallel-netcdf 1.8.1 library for parallel optimization. This configuration can improve the performance of a KNL system with many cores and low memory in distributing reading and writing model results. Although the white paper was intended to promote the superiority of the SKL system, the performance of the KNL system was nonetheless two to three times slower than the SKL system.
Cho et al. (2017) found that the performance of parallel MPI with the same nodes was improved by up to 272% when using on-package memory (Multi-Channel DRAM, MCDRAM), which is one of the features of the KNL system [3]. Butcher et al. (2018) studied optimization methods for data types that are not suitable for MCDRAM on a KNL system [4]. Rho et al. (2017) discussed a solution for performance bottlenecks that can occur when running MPI applications on a KNL system [5], and Yoon and Song (2019) analyzed the features of manycore architectures such as the KNL system [6]. However, these studies were not conducted using general numerical models used in real circumstances and did not include the effects of inputs and outputs.
In this study, the performance of the Nurion KNL system was compared with general cluster systems using three numerical models: the Weather Research and Forecasting System (WRF), Regional Ocean Modeling System (ROMS) and Unstructured Grid Finite Volume Community Ocean Model (FVCOM). Ideal and real experiments were simulated using the characteristics of each numerical model, and the performance rates were compared via wall-clock simulation time. All experiments were also performed on a general cluster system (a large-scale cluster system at Jeju University, referred to as CLS) to objectively compare its performance with that of the Nurion system.

2. Experimental Configuration

The specifications of Nurion and general cluster systems are summarized in Table 1. In this study, Intel Fortran v17.x and v19.x were used, which are the basic Fortran compilers installed on the Nurion system. OpenMPI v3.x and IMPI v19.x were used for the MPI library and NetCDF v4.x was used for accessing the inputs and outputs of the models’ data. However, IMPI v18.x was used in the CLS system; despite the different compiler versions being used in the CLS and Nurion systems, there was no difference in performance between versions in this study. Ideal and real experiments were configured by considering the characteristics of each model. The models were built with an ultra-high resolution for running parallel experiments using hundreds of cores. Initial Conditions (I.C.) and the Boundary Conditions (B.C.) were also created for the ultra-high resolution models.
The compiler option of “-xMIC-AVX512” was used to optimize the Many Integrated Cores (MIC) of the KNL system, while “-xCORE-AVX512” was used for the SKL system (Table 1, Compiler Options). For model performance analyses using hundreds of cores, the model grid resolution was required to be at least 100 (latitude) × 100 (longitude) = 10,000 grids per core. If the number of grids per core was too small, then the performance depended largely on the network performance between CPUs and nodes rather than the CPU speed. For example, an ultra-high resolution model should have a configuration of at least 1000 × 1000 for 100 CPU cores. In this study, ideal and real experiments were constructed for each model as shown in Table 2. Real cases are more difficult to simulate than ideal cases because topography and external forces must be considered in real situations. Additionally, accounting for the massive amounts of I/O data accessing and preventing model overflows are also necessary. The total grid numbers were configured for the different models by reflecting the characteristics of each experiment.
The Nurion KNL/SKL systems have one/two CPUs per node, respectively, and 68/40 cores per node, respectively. The CLS system has two CPUs per node and 36 cores per node. Therefore, 32 cores per node were used for the SKL and CLS systems while 64 cores per node were used for the KNL system for the objective performance evaluation. However, real experiments using all cores per node for ROMS and FVCOM could not be simulated on the KNL system because of its low memory and the requirement that systems must be able to read and write topography, initial fields, external forces, and large outputs for real experiments. Although applying and modifying the parallel I/O method of the models can account for the lack of memory in the KNL system, this solution is out of the scope of this study. To solve this problem, a simulation was attempted by reducing the number of cores per node by half and increasing the number of nodes (refer to Table 3). Additional experiments using the WRF were performed to analyze the performance according to the number of cores per node in the KNL system. The Nurion system is used concurrently by several users; therefore, the average performance speed was used for the objectivity analysis by simulating each experiment more than twice.

3. Performance Evaluation of WRF

WRF model uses the compressible, nonhydrostatic Euler equations, that are formulated in flux form to keep the conservation properties [7]. Advanced Research WRF (ARW) developed by NCAR has been widely used in the field of meteorology and atmospheric research and version 4.1 (released by 12 April 2019) is used in this study. Runge–Kutta time integration with time-split sequence scheme is used for temporal discretization and finite difference scheme with staggered C grid is used for spatial discretization [8].

3.1. Ideal Experiment: WRF-LES

The Large Eddy Simulation (LES) using WRF was constructed for analyzing ideal turbulence. LES was first developed by Smagorinsky (1963) [9] and has been continuously studied by Deardorff (1974) [10]. LES is an important tool for studying turbulence in the atmosphere and explicitly calculates the large turbulence vortex that carries most of the turbulent kinetic energy and flux. Thus, LES provides more accurate estimates of turbulence statistics than Planetary Boundary Layer (PBL) parameterization methods (Catalano et al., 2010) [11]. WRF-ARW is a non-hydrostatic model that is suitable for simulating micro and medium scale meteorological phenomena. WRF model provides a LES scheme that directly calculates turbulence near the surface for numerical simulations of high-resolution grids.
The WRF-LES experiment simulated large eddies in the free Convective Boundary Layer (CBL). The initial wind field was set to zero and the turbulence of the CBL was calculated by the heat flux of the surface, which was specified as tke_heat_flux = 0.24. Random perturbation was applied to the average temperature in the lowest four layers of the vertical grid for turbulent motion.
The LES grid had a 3200 × 3200 resolution divided by dx = dy = 1.25 m in the 4 km square domain, which is a considerably higher resolution than the general grid resolution of LES (dx = dy = 50 m). This ideal case uses Deardorff’s TKE system, which is set to the eddy viscosity (diff_opt = 2), eddy diffusion coefficient (km_opt = 2) for the turbulent mixing and Coriolis parameter (f = 10−4/s). Figure 1 shows the wind speed field at 10 m above the surface in the LES simulation. Figure 1a is the result of the ultra-high resolution model used in this study, and (b) is the result of the low-resolution model of the basic configuration (40 × 40 resolution, dx = dy = 100 m) officially provided by the WRF development team. Compared with (b), (a) reproduces large eddies in more detail, and a scientific analysis is presented in Meong et al., (2007) [12].
The benchmark experiment for the ideal case is suitable for comparing the performance rates of computational resources because of the smaller I/O loads for data. We used 128, 256, and 512 cores to compare the performance of parallel systems according to the experiment (ref. Table 3). In addition, a 1024 ultra-high resolution-experiment was performed on the KNL system for testing performance limits. This is difficult to simulate in general systems (SKL and CLS) due to their insufficient resources.
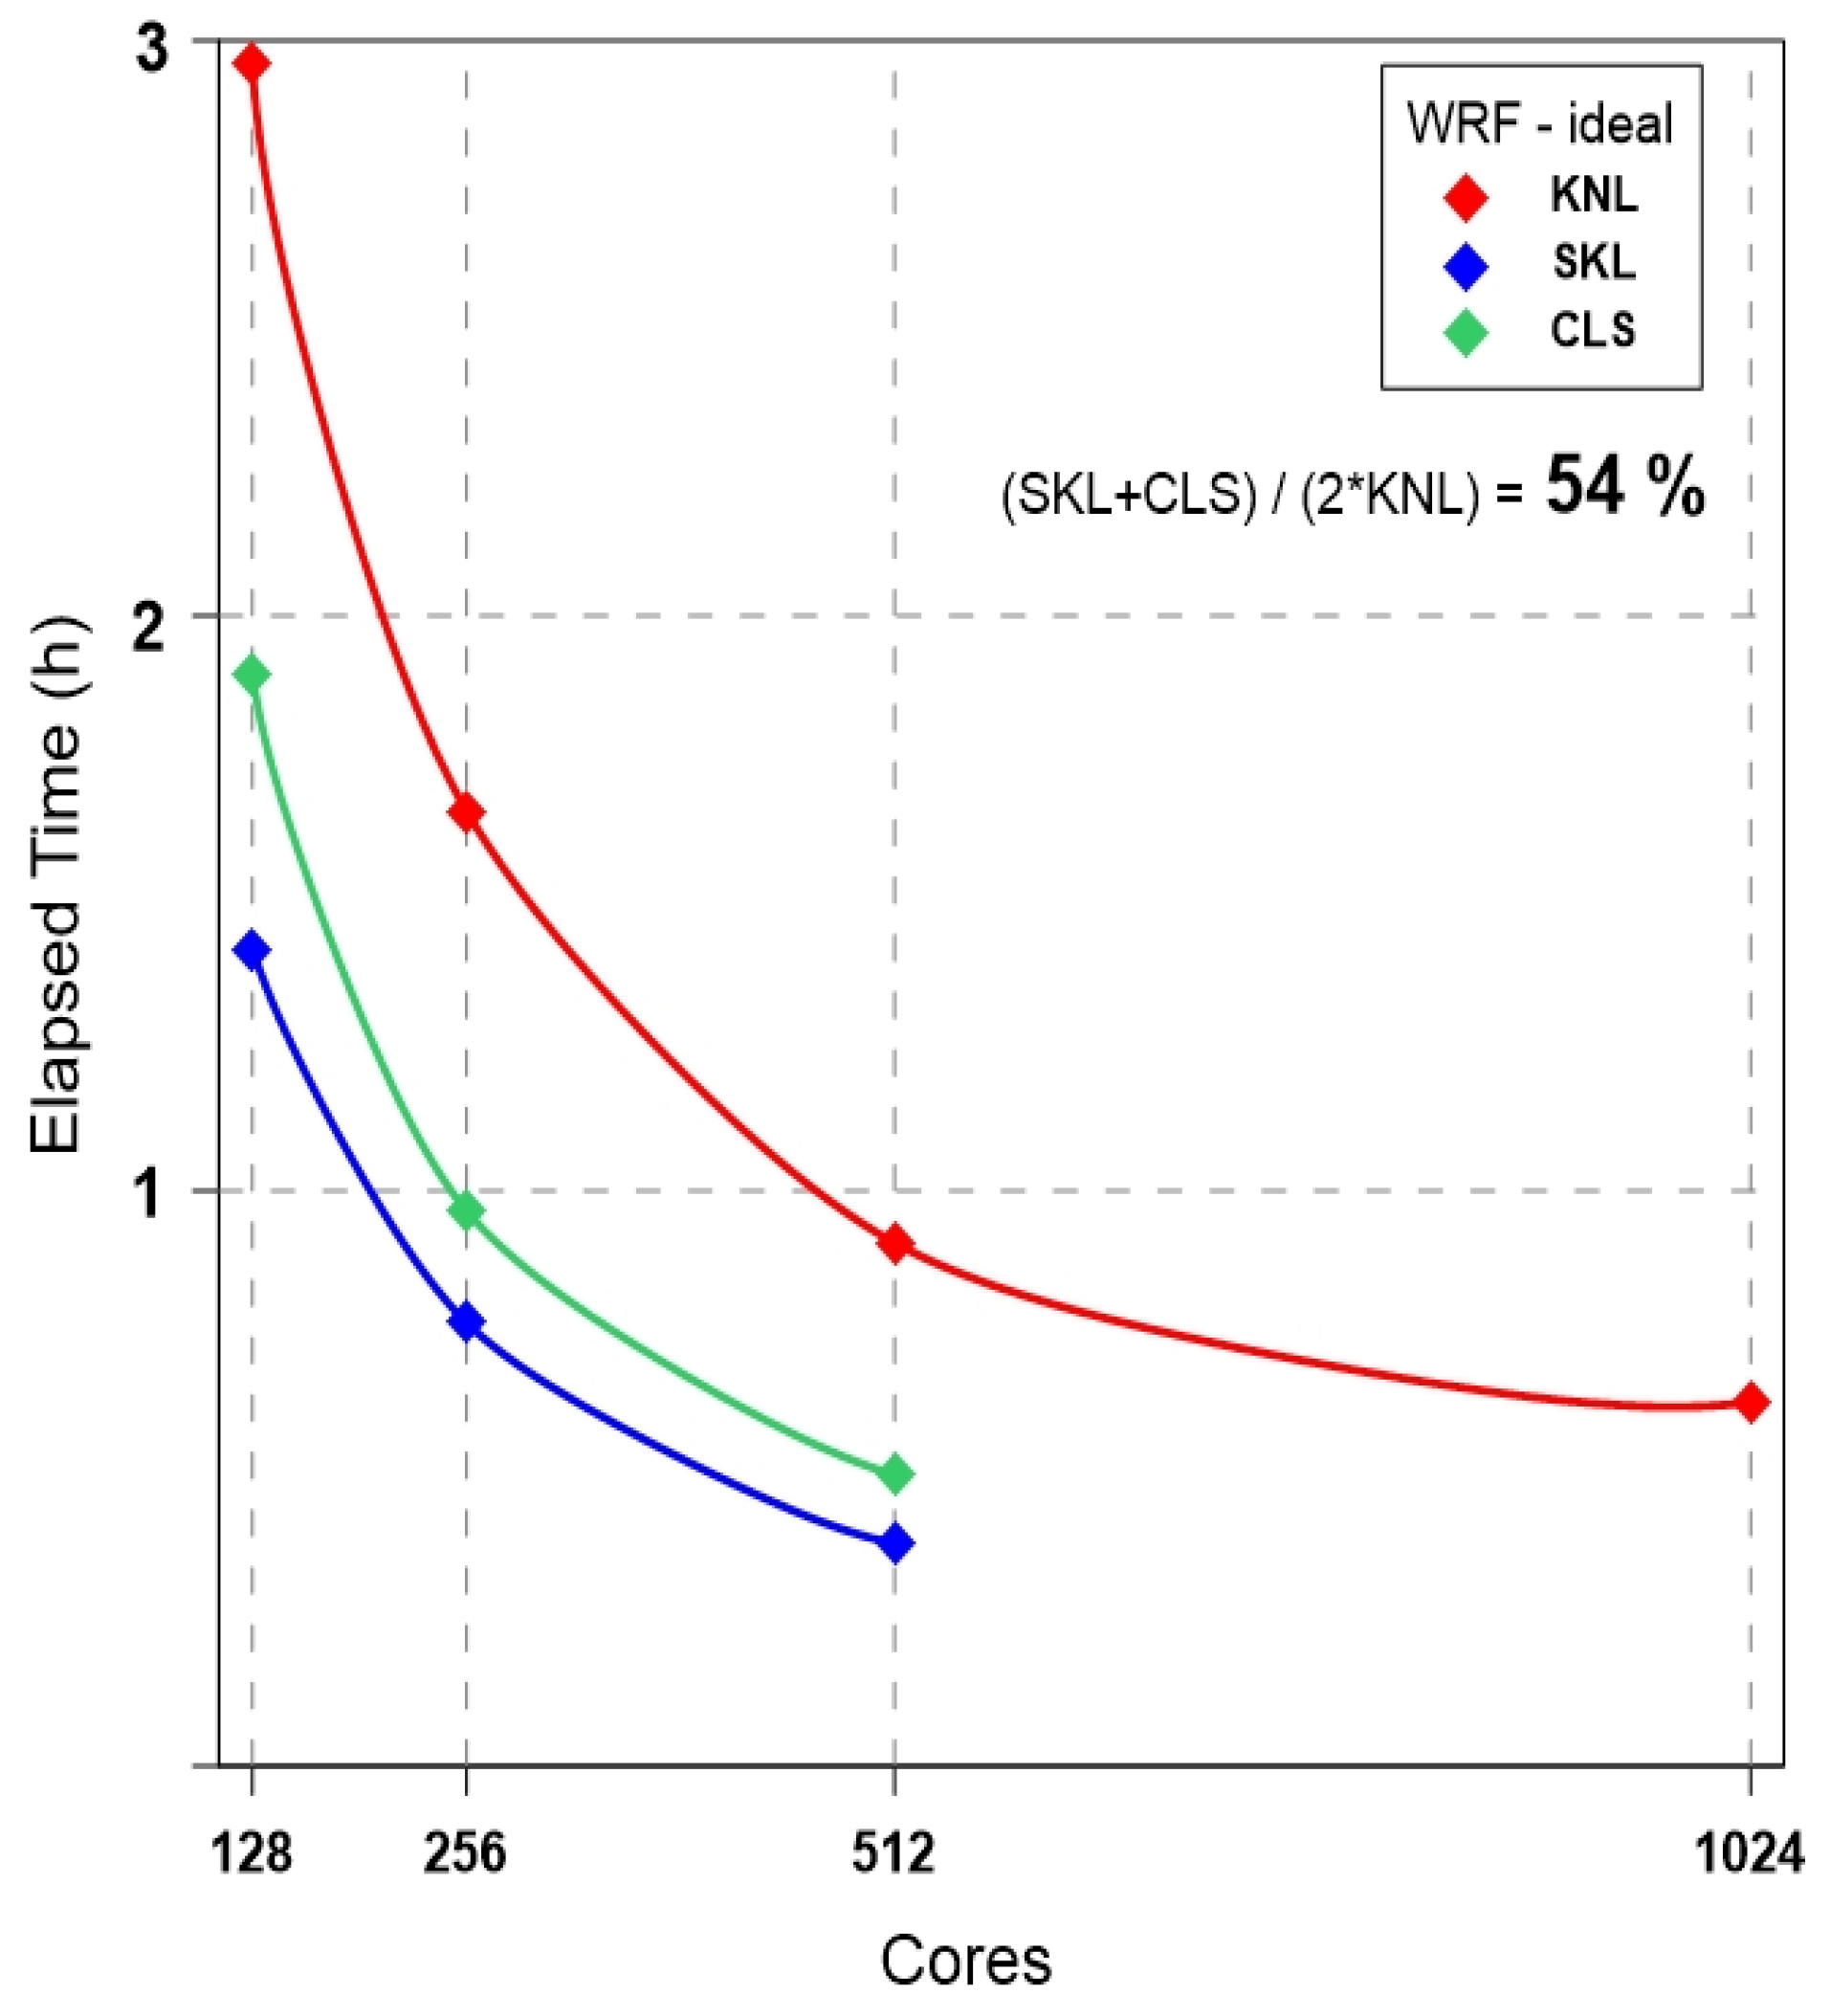
The results of each experiment are summarized in Figure 2. The performance rate of the KNL system was approximately 54%, compared to the SKL or CLS systems. The performance rate is defined as the sum of the simulation time of SKL and CLS divided by twice the simulation time of KNL. This performance is slightly higher than the result (approximately three times) shown in the white paper described in “Chapter 1.” Even the 1024 core experiment shows a continuous increase in the parallel performance of the KNL system. Therefore, the KNL is a more suitable system for simulating an ultra-high parallel numerical model.
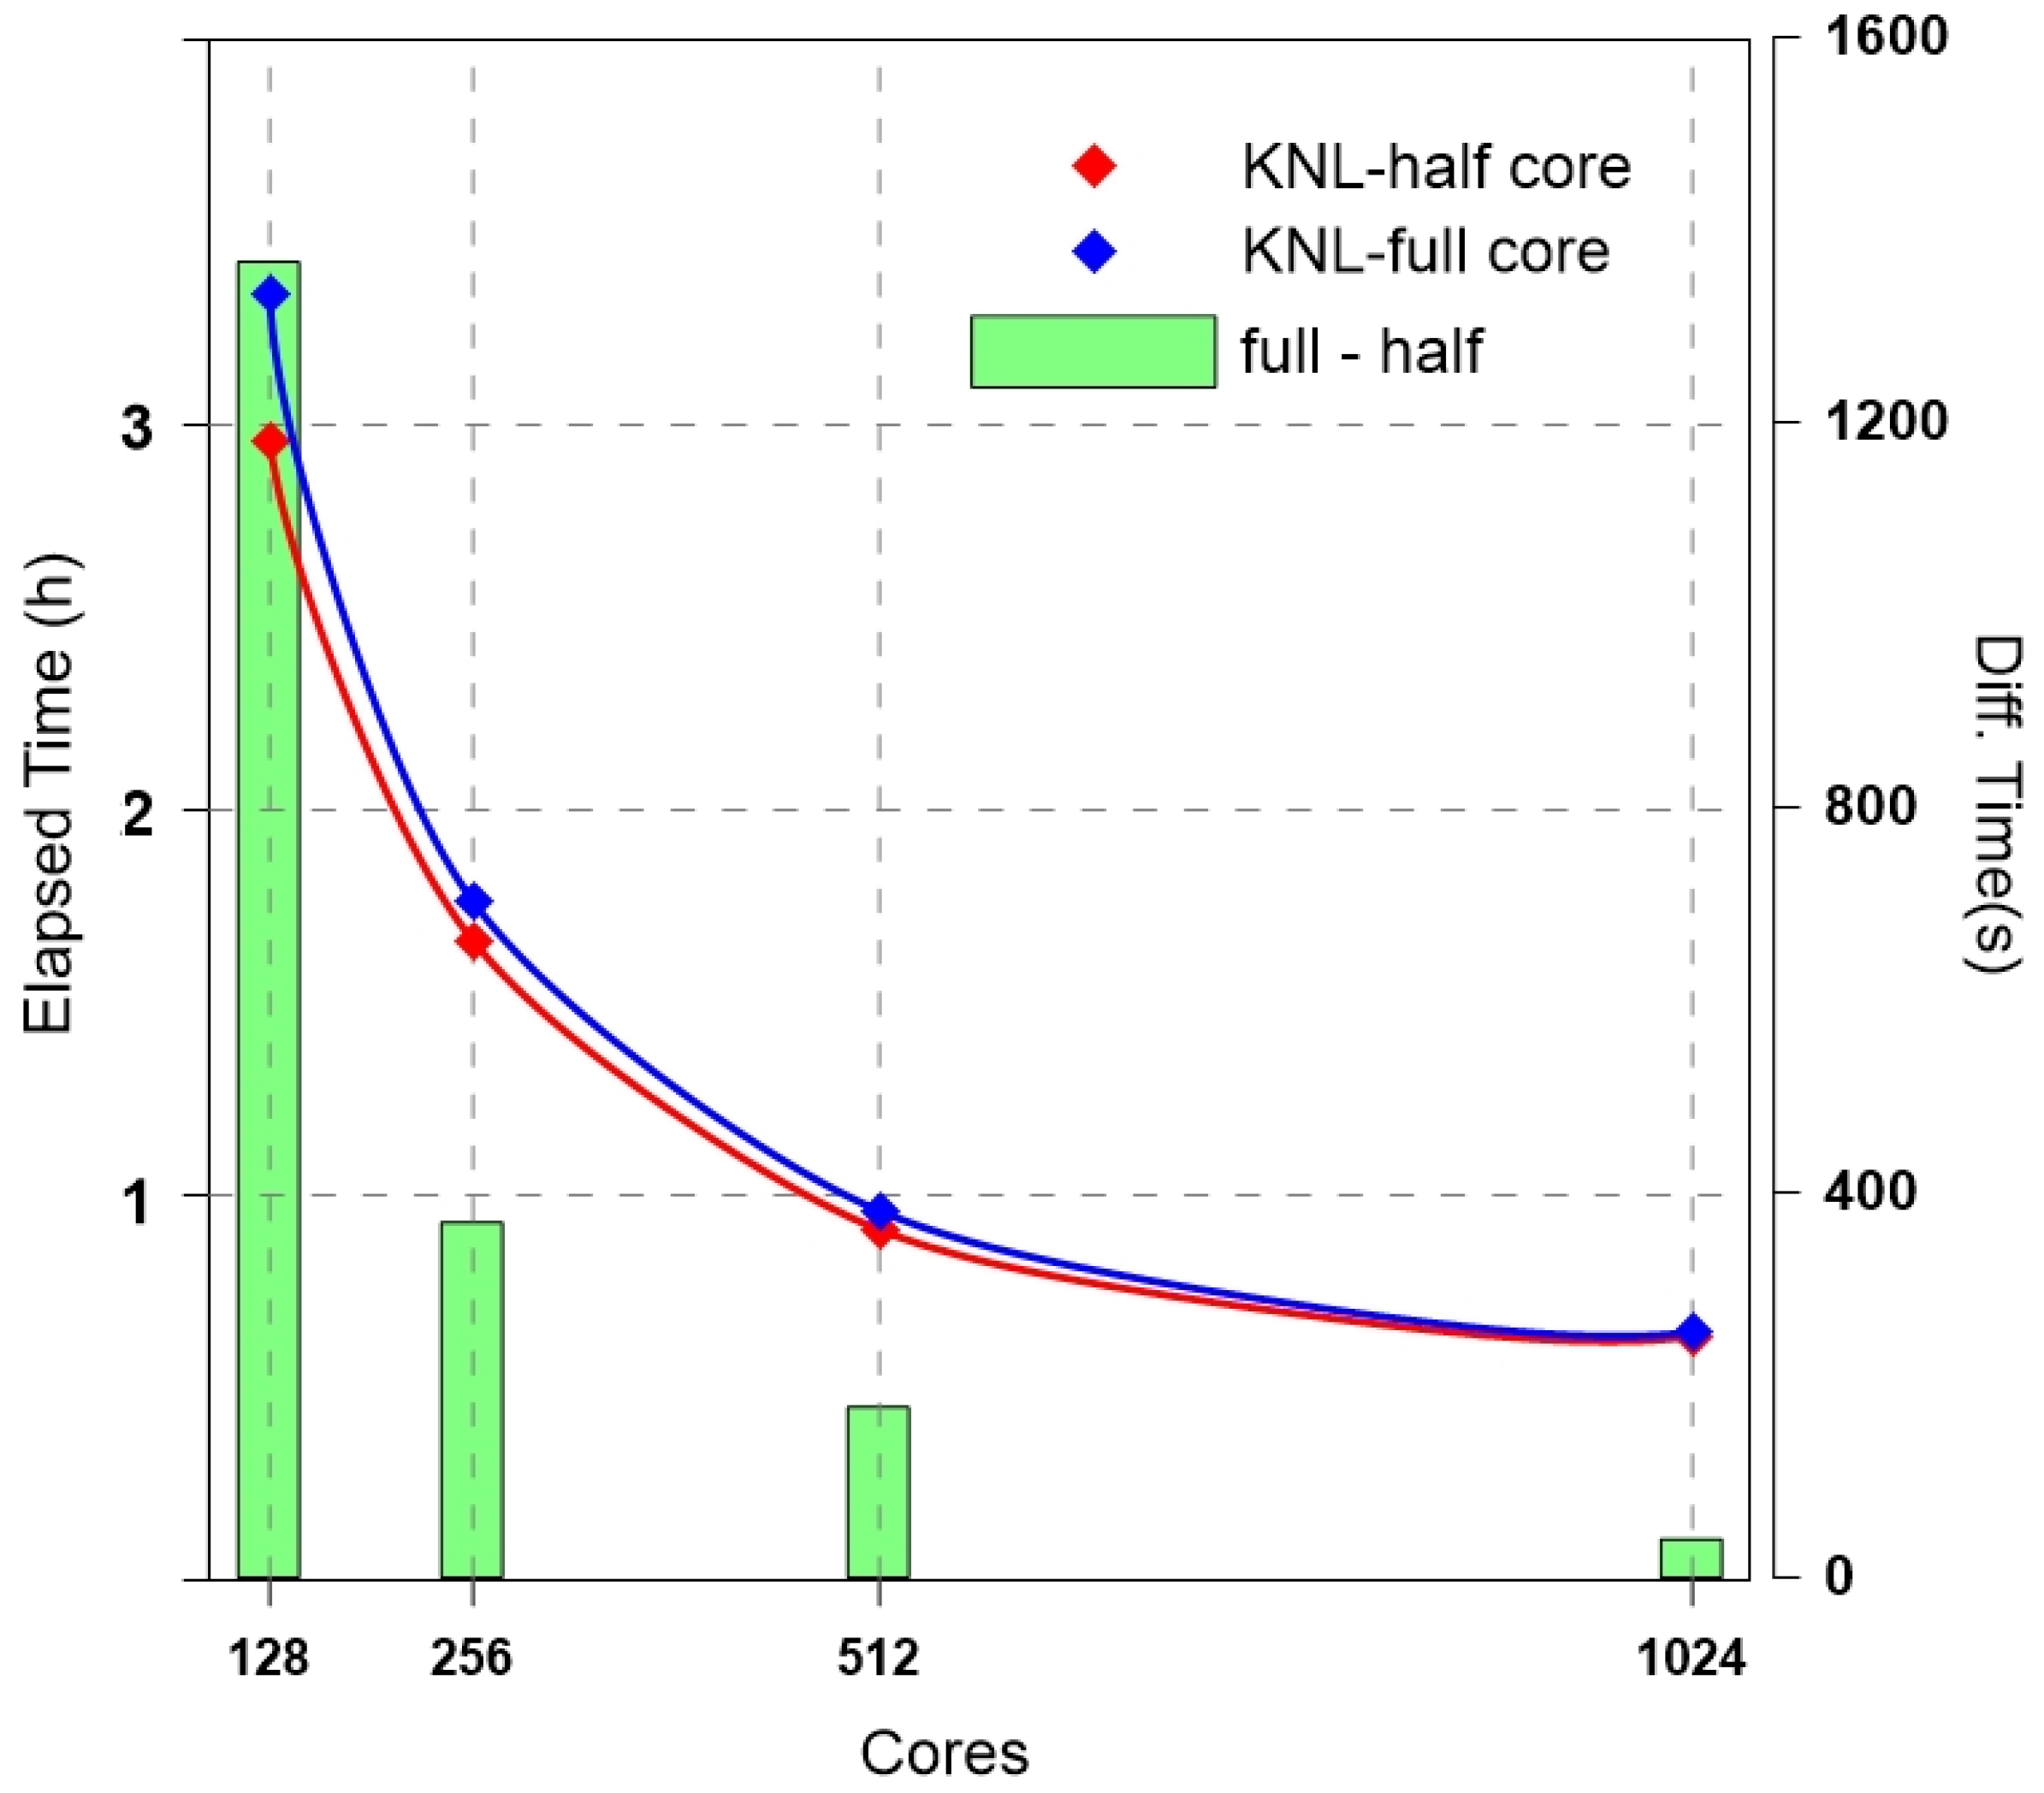
In the KNL system, the performance was also analyzed according to the number of cores (Figure 3 and Figure 4). Figure 3 shows that using half the number of cores per node in the KNL system is the most efficient method when the total number of cores is less than 256. However, there was no significant difference observed when more than 256 cores were used.
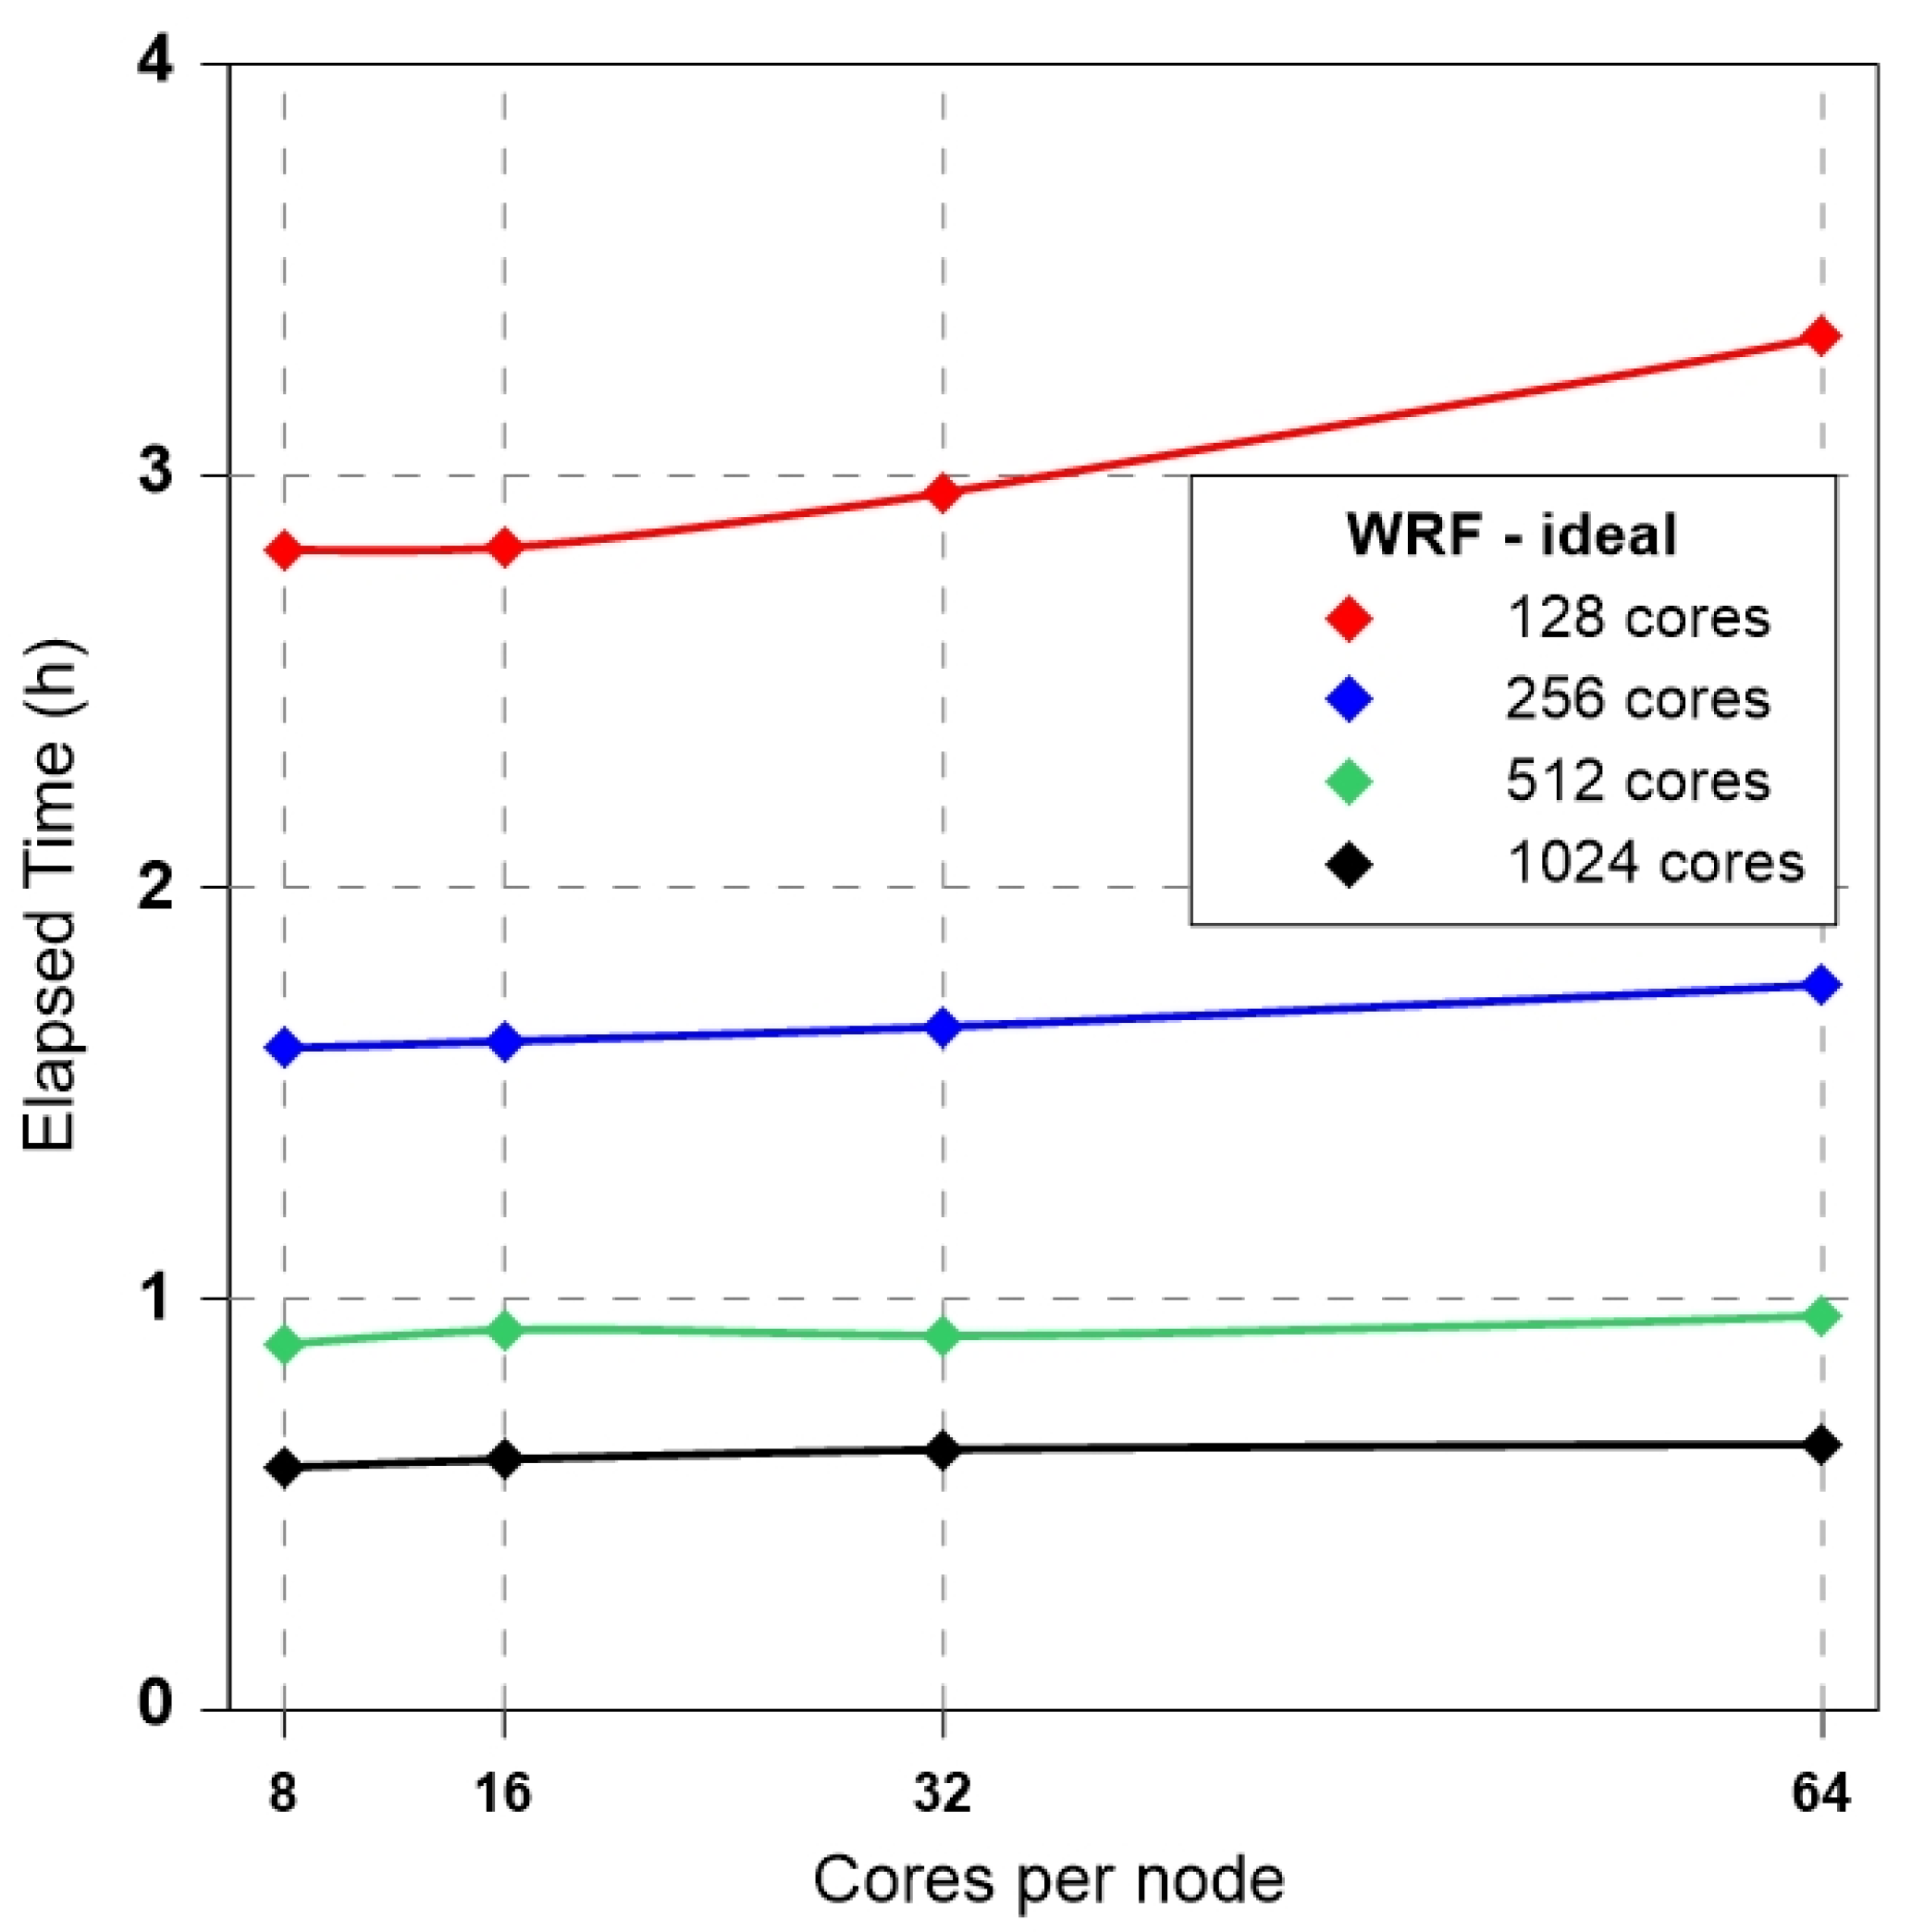
Figure 4 shows the differences in performance according to the number of cores with 8, 16, 32, and 64 per nodes for the same experiment. In the 128 cores experiment (red line), the cases using only 8 or 16 cores per node showed the highest performance and increasing the number of cores per node while reducing the number of nodes gradually decreased the performance. However, the performance difference was small enough to ignore when the total number of cores was higher than 256. This means that the most economical method is to use all the cores of a node and reduce the number of nodes for an ultra-high parallel model.

3.2. Real Experiment: WRF-NWP

We aim to simulate the realistic case in order to evaluate the computational performance of each model depending on the number of supercomputer cores. The realistic case selected is a typhoon occurred in August 2018, where two typhoons (Soulik and Cimaron) simultaneously affected the Korean Peninsula severely. Experiments were configured with real topography and external forces for the Northwestern Pacific Ocean (NWP). A 2048 × 2048 grid was constructed with an interval of approximately 1.35 minute in the region between 102° to 158° longitude and 15° to 53° latitude using the Lambert Conformal Conic projection, surrounding the Korean Peninsula (Figure 5). The vertical grid was divided into equal intervals of 33 layers up to 10 km height from surface.
Global Forecast System (GFS, ftp://nomads.ncdc.noaa.gov/GFS/Grid4) data was used for the initial fields and external forces. The experiment was simulated for 3 h from 0:00 to 3:00 a.m. on 28 August 2018. This is the period when the twin typhoons of Soulik and Cimaron severely damaged the Korean Peninsula and represents an appropriate integration time for performance analysis. The external forces data from GFS were interpolated to fit the ultra-high resolution model grid.
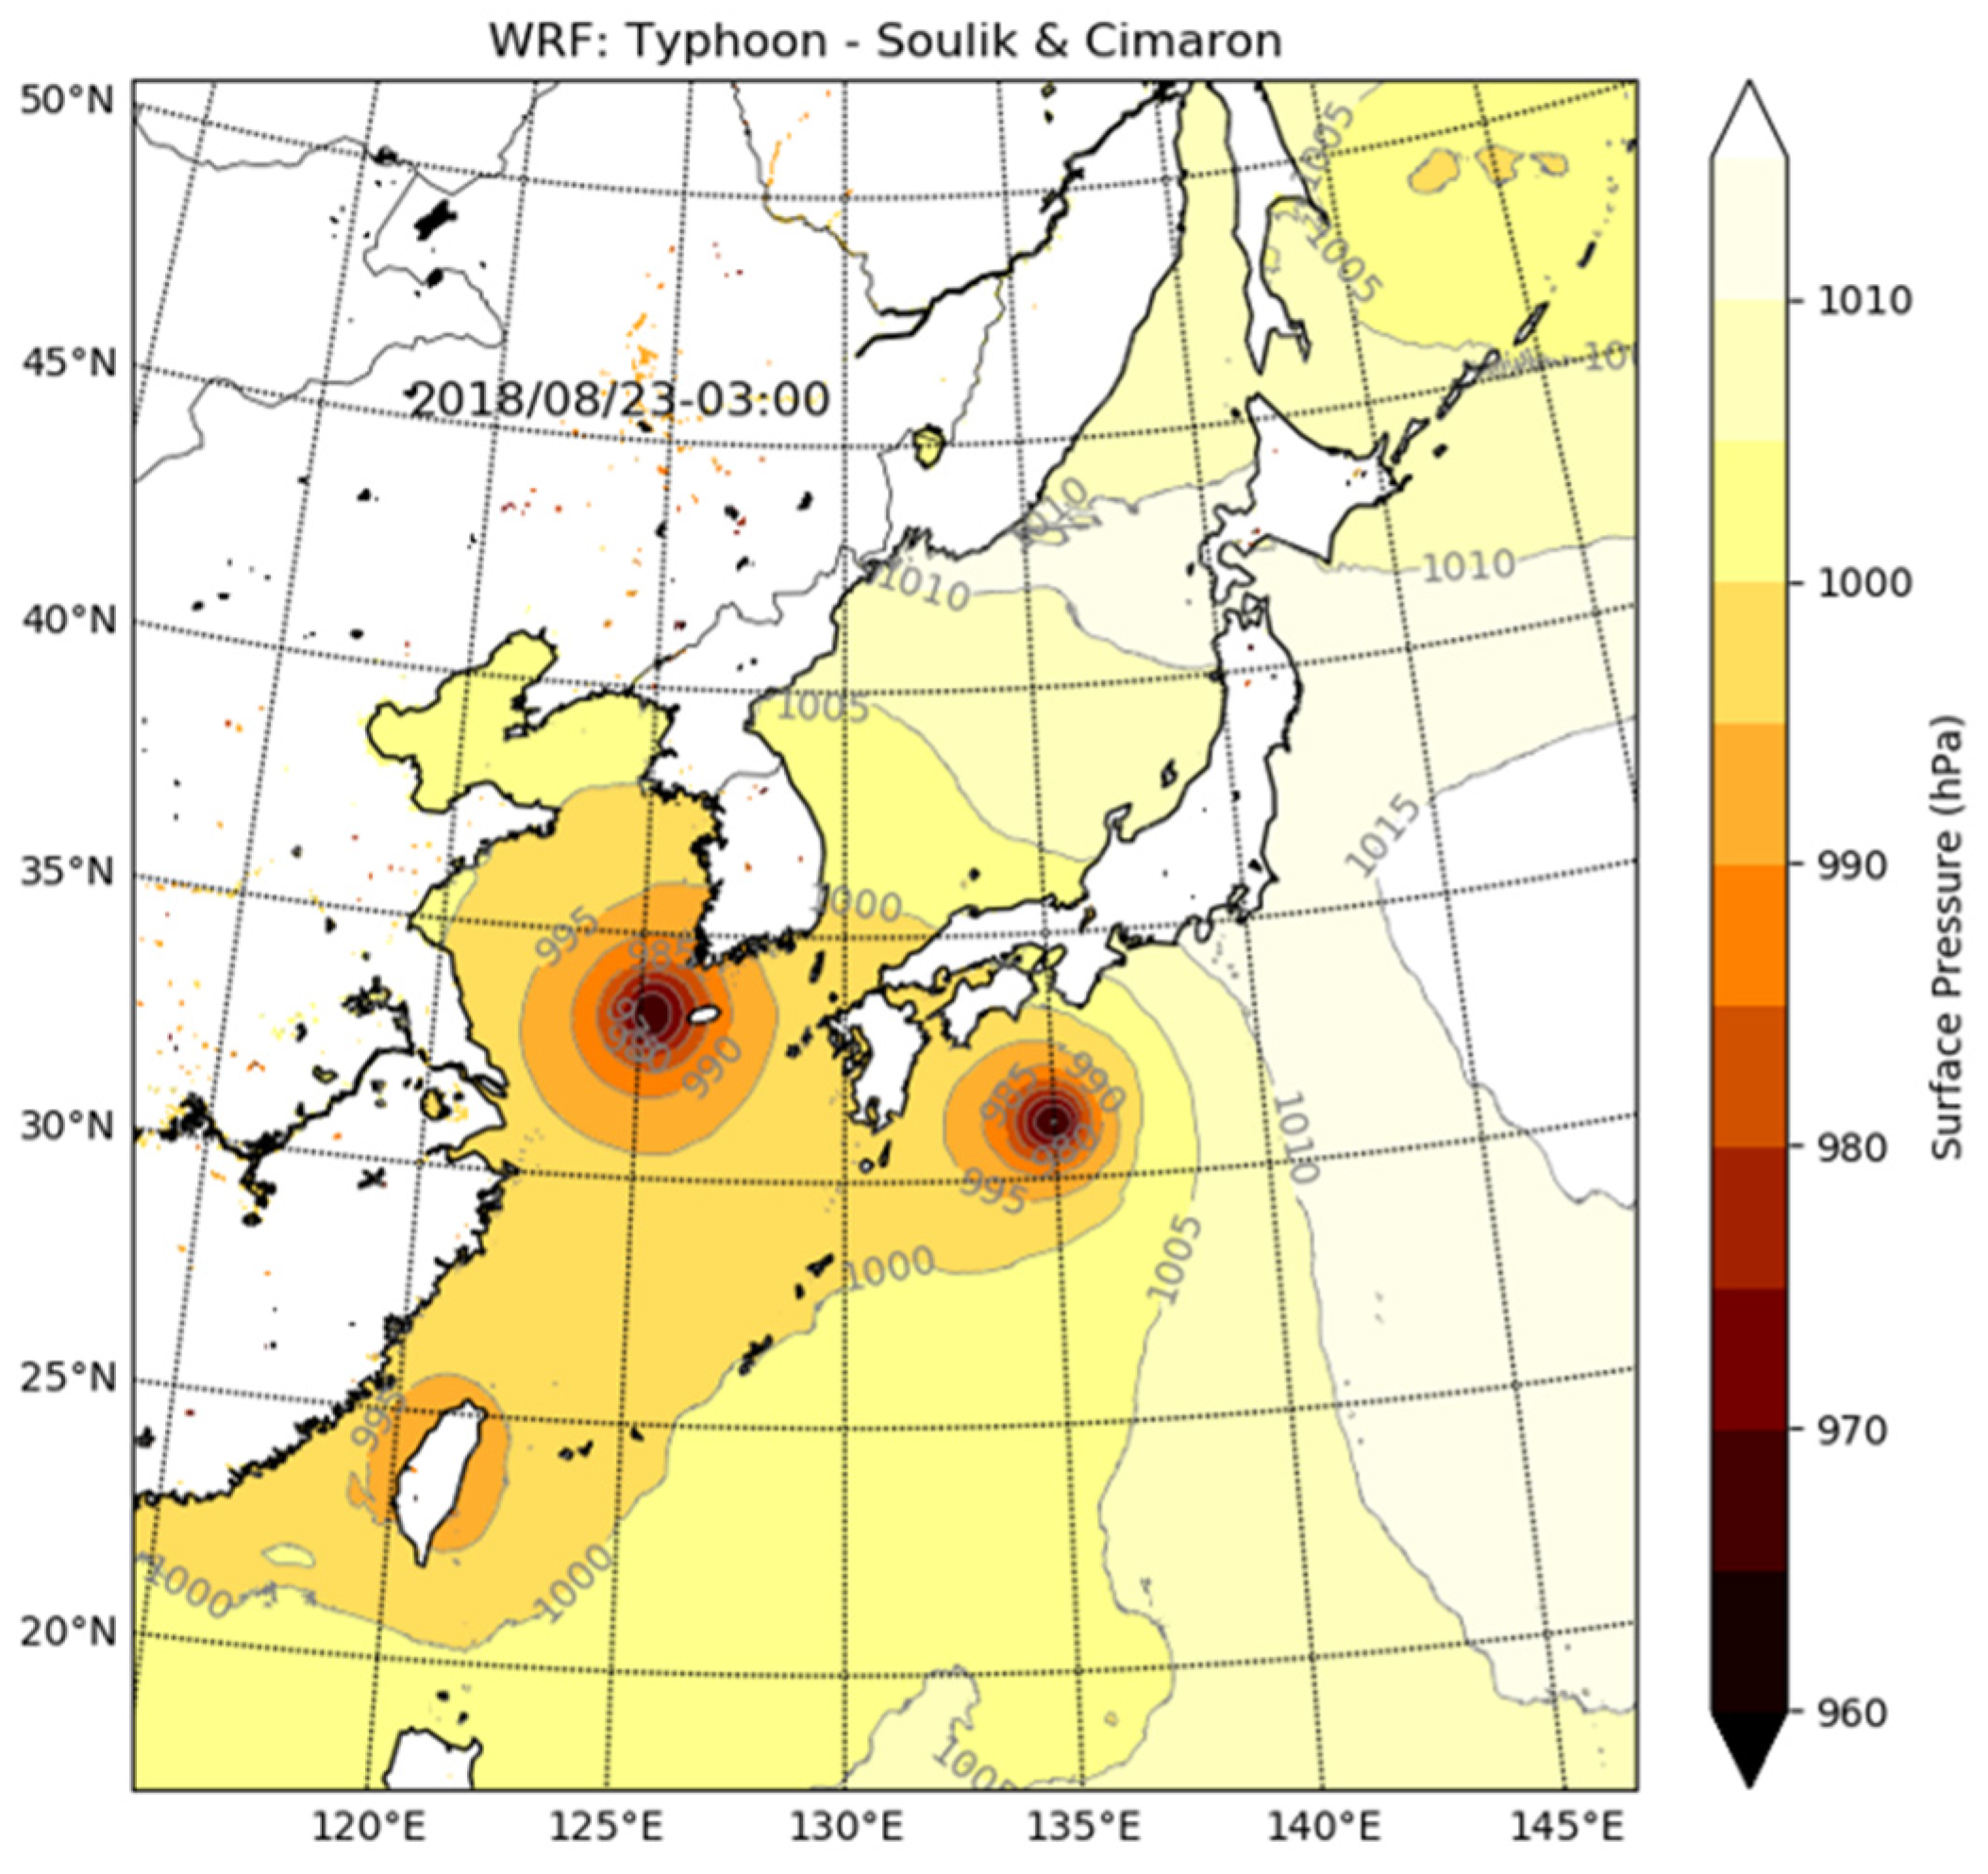
The time interval of the model integration was 5 s. Comparisons of accuracy with scientific results would not be useful since this experiment was simulated over a short period for performance analysis. Therefore, the computational performance was evaluated without analyzing the accuracy of the simulation results. In addition, a detailed description of how to simulate ultra-high resolution models has been omitted from this study as it falls beyond the scope of this study. Figure 6 shows the surface pressure field on the ocean from the results of the simulation in the KNL system. The surface pressure distribution is well simulated for the period when typhoon Soulik passed near South Korea.
NWP experiments were performed with a grid configuration of 2048 × 2048 × 33 (refer to Table 3). This configuration is suitable for evaluating the overall performance of the system because it considers the impact of the I/O performance on the system’s ability to read real topography and external forces. Instances of 128, 256, and 512 cores were used to compare the performances of the parallel systems according to the experiment. In addition, a 1024 ultra-high resolution experiment was performed on the KNL system to determine its performance limits.
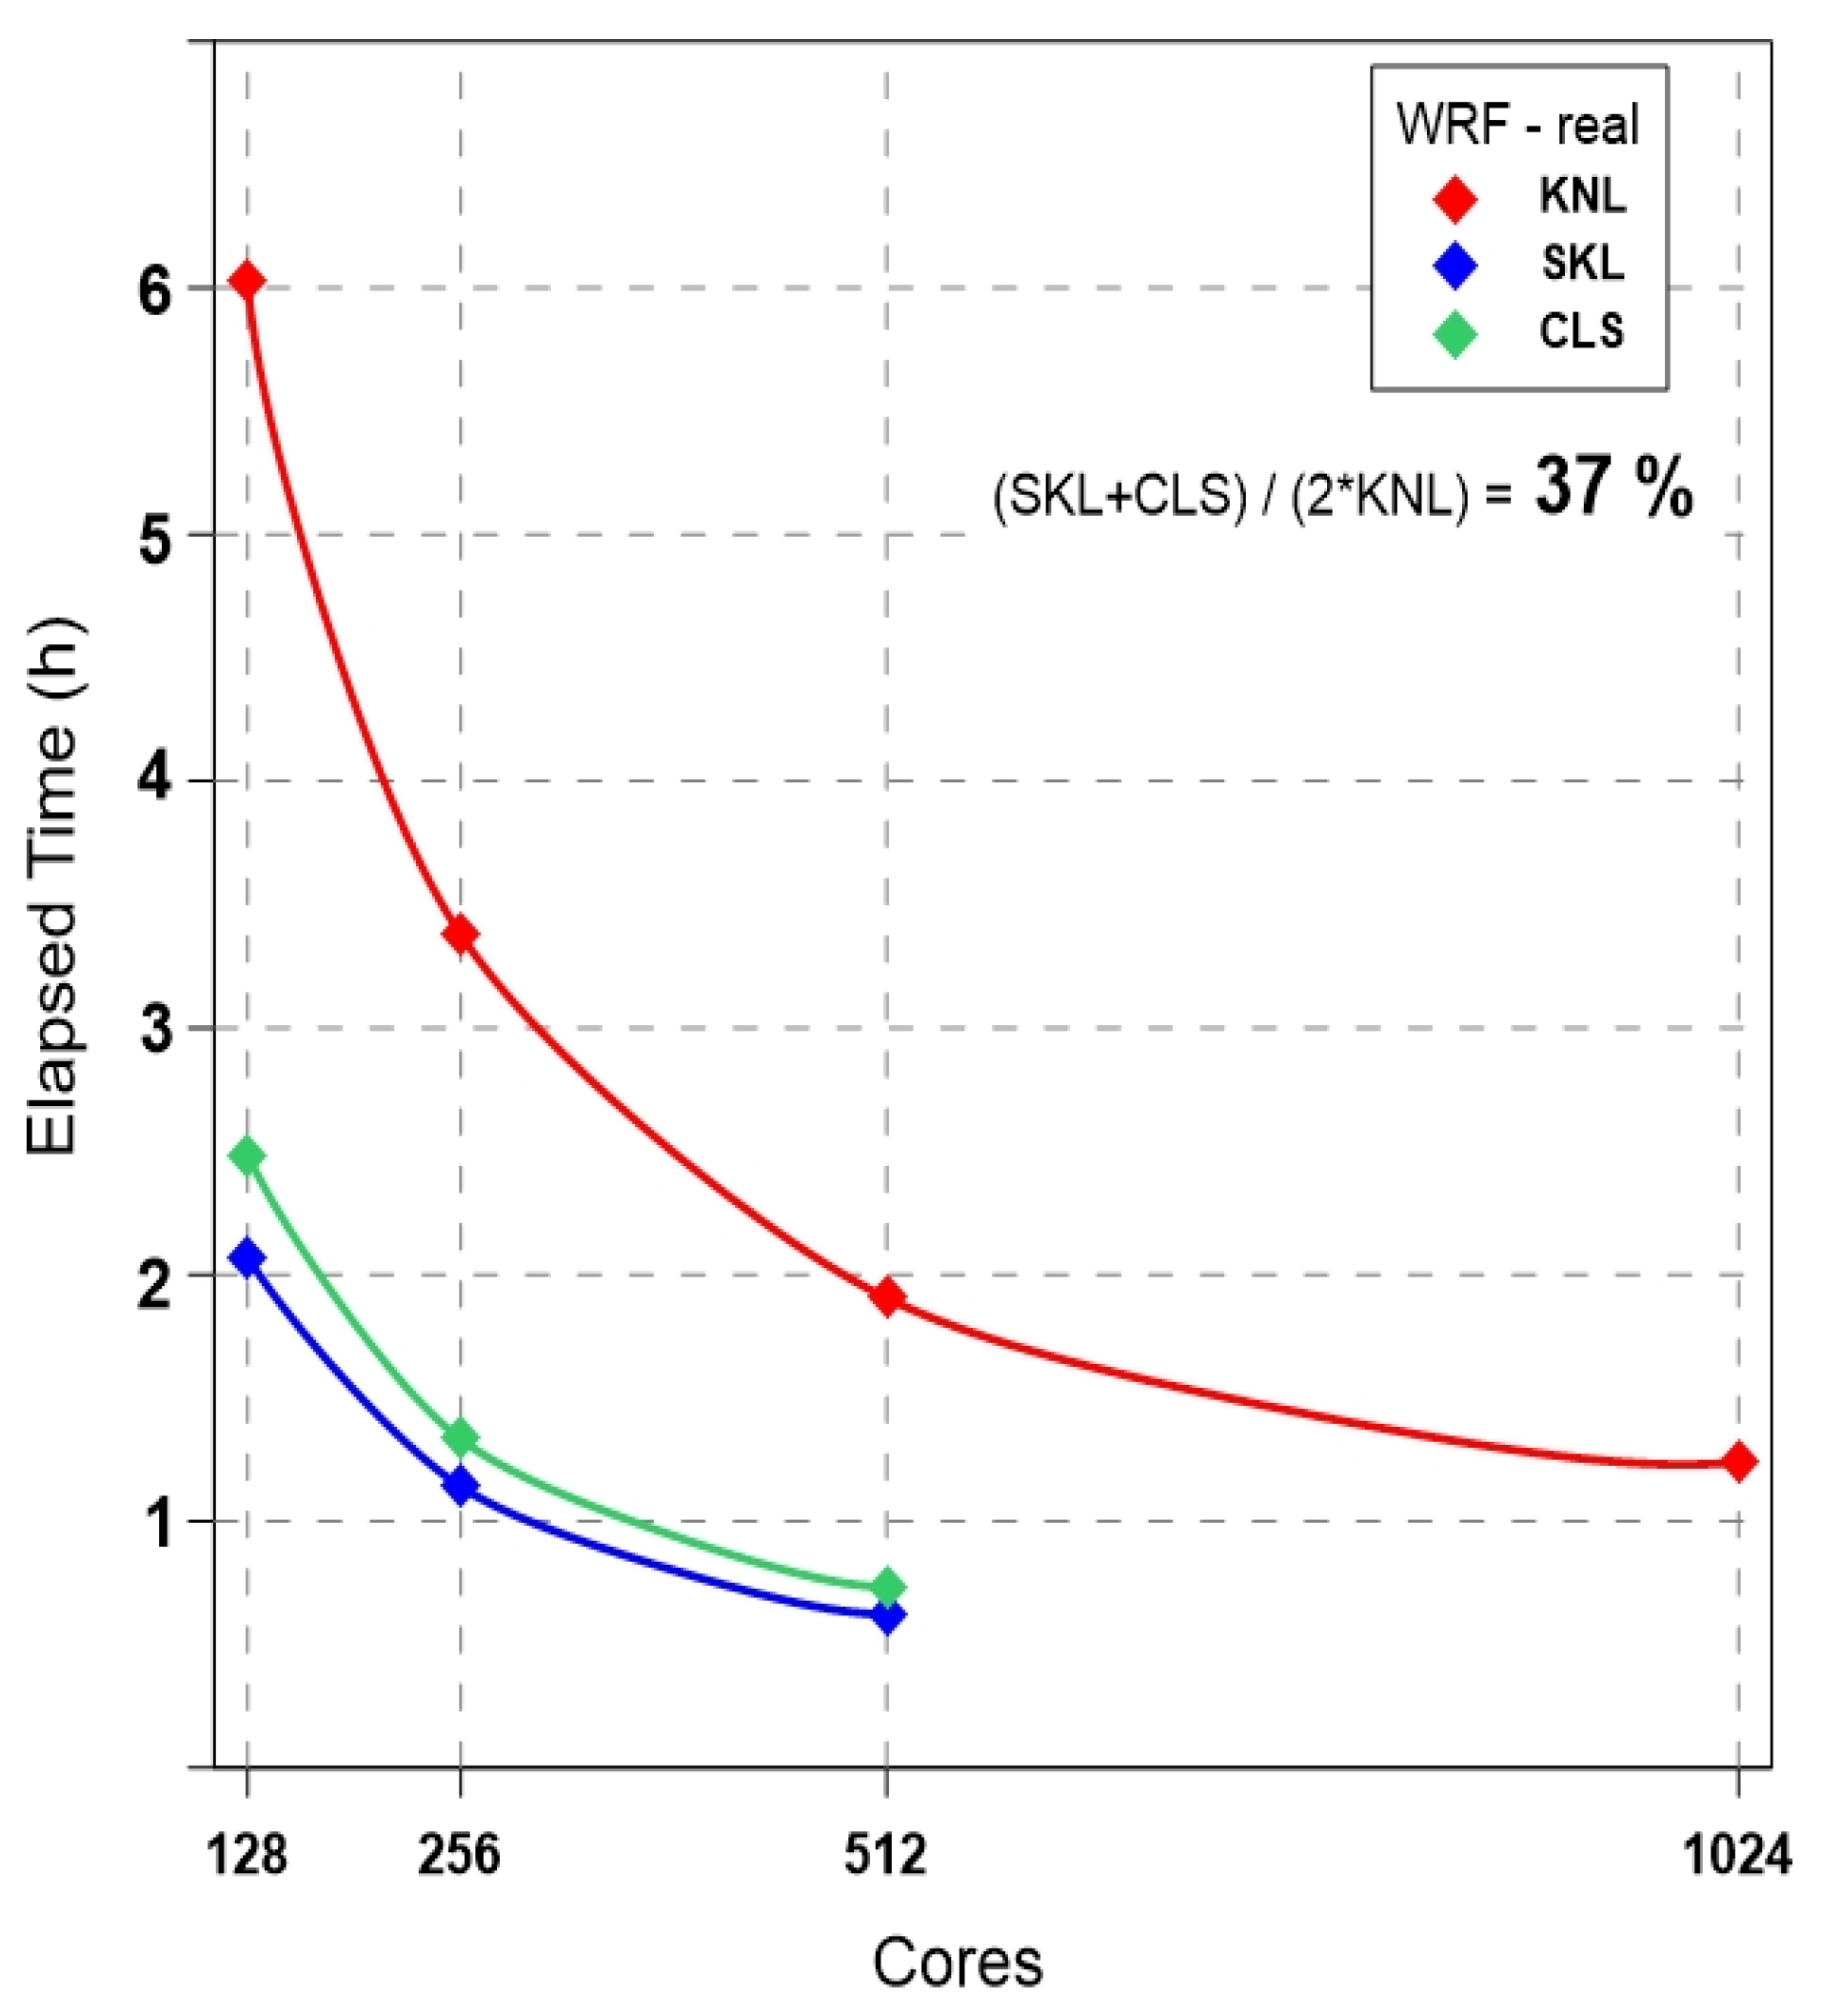
The results of each experiment are summarized in Figure 7. The KNL system exhibited an overall rate of 37% compared to the performances of SKL and CLS. This result is a little slower than the benchmark (LES) experiment due to the I/O access loads. Notably, the calculation amounts are different between cores because of the differing I/O loads. The CLS system shows a stable improvement in the performance depending on the number of cores used compared to the SKL system (see the performance slope of the green and blue lines in Figure 7). The CLS system can thus run a model exclusively and consists of a simple network of 16 nodes, whereas the SKL system consists of a complex network of 132 nodes with many users. Even the 1024 cores experiment shows a continuous increase in the parallel performance of the KNL system; thus, it is more suitable system for an ultra-high parallel numerical model.
In the KNL system, the performance was also analyzed according to the number of cores. Figure 8 shows that It is more efficient to use half the number of cores per node in KNL when the total number of cores is less than 256. However, there was no significant difference when more than 256 cores were used.

4. Performance Evaluation of ROMS

ROMS is a three-dimensional ocean circulation numerical model and is commonly used at a regional scale. ROMS uses free-surface, terrain-following, and primitive equations. In addition, it uses hydrodynamics and time step division techniques of barotropic/baroclinic modes for computational efficiency [13]. The latest version of ROMS, v3.6, was used for this study.

4.1. Ideal Experiment: ROMS-Benchmark

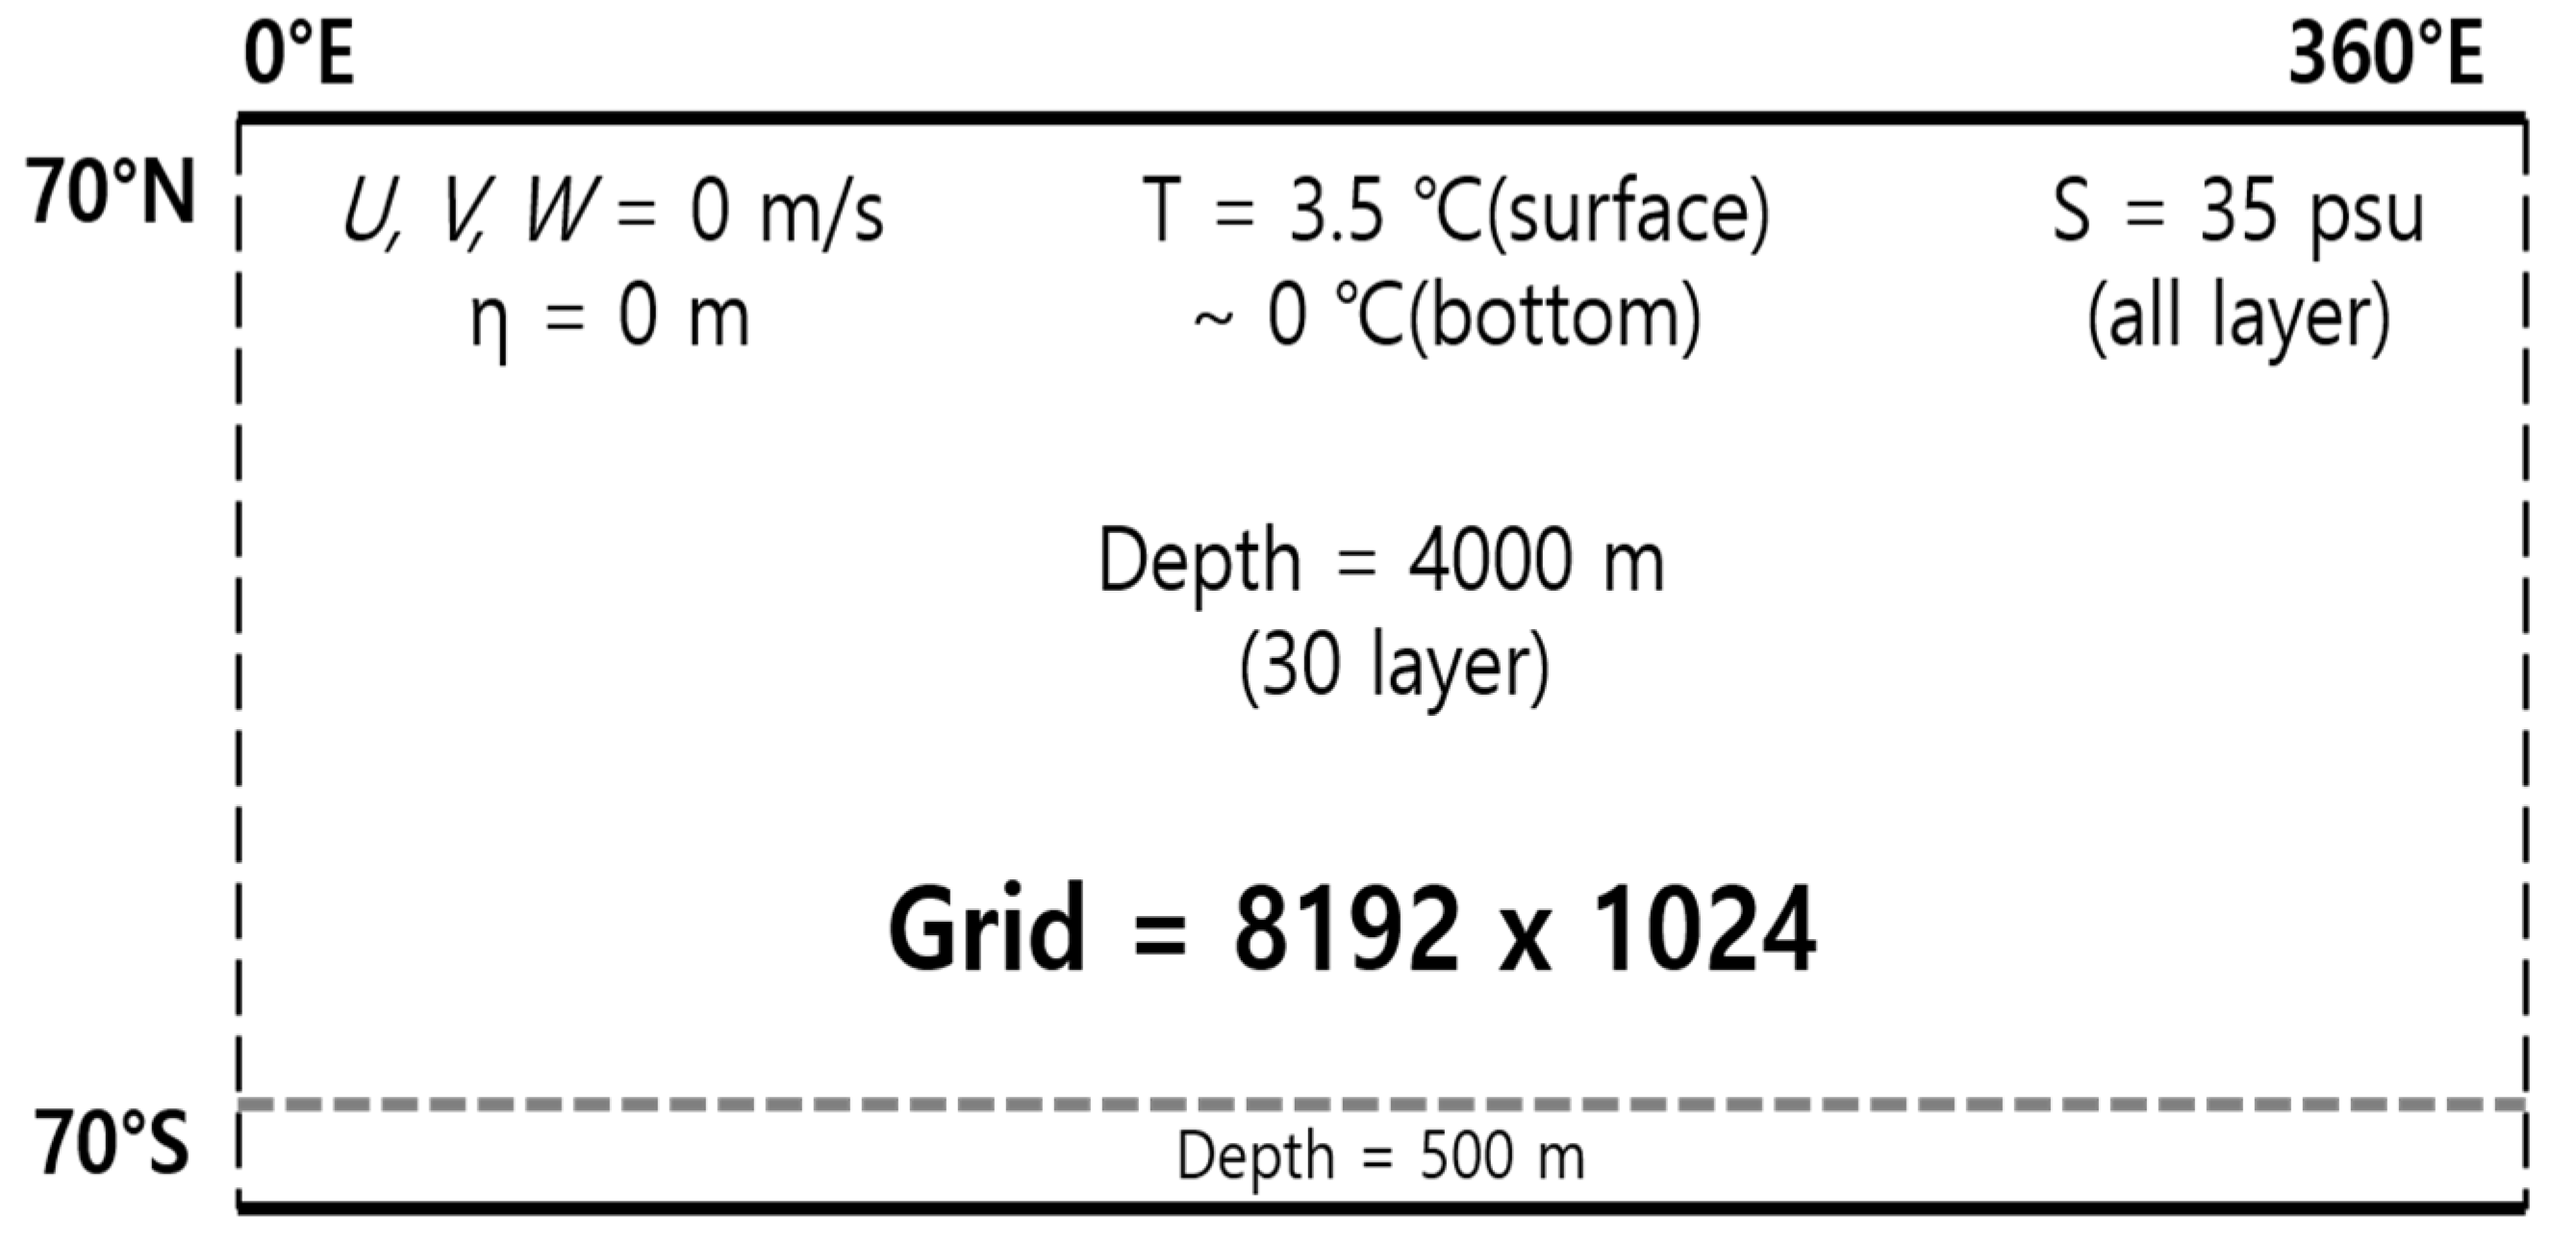
The ideal experiment consisted of an 8192 × 1024 grid in the global region in the range of 0°E ~ 360°E longitude and 70°S ~ 70°N latitude (Figure 9). The grid interval of the longitude/latitude direction is approximately 2.6/8.2 minute, respectively.
The overall depth of the model was set to 4000 m, and the depth of the Antarctic boundary was set to 500 m to represent a simple version of Antarctica. The lateral boundaries of the east and west side were set to be cyclic conditions and the vertical grid was divided into 30 layers. The initial sea surface height (SSH) and currents (U, V, W) were all set at zero, and salinity (S) was set to 35 psu. The vertical profile for temperature was set to decrease linearly from 3.5 °C at the surface to 0 °C at the bottom to represent density stratification. The time interval of model integration was 15 s.
Table 3 shows the configuration of benchmark experiments for the allocated cores and nodes. The benchmark experiment for the ideal case is suitable for comparing the performances of computational resources due to the smaller I/O loads of data. We used 128, 256, and 512 cores to compare the performance of parallel systems according to the experimental results. In addition, a 1024 ultra-high resolution experiment was performed on the KNL system to test its performance limits.
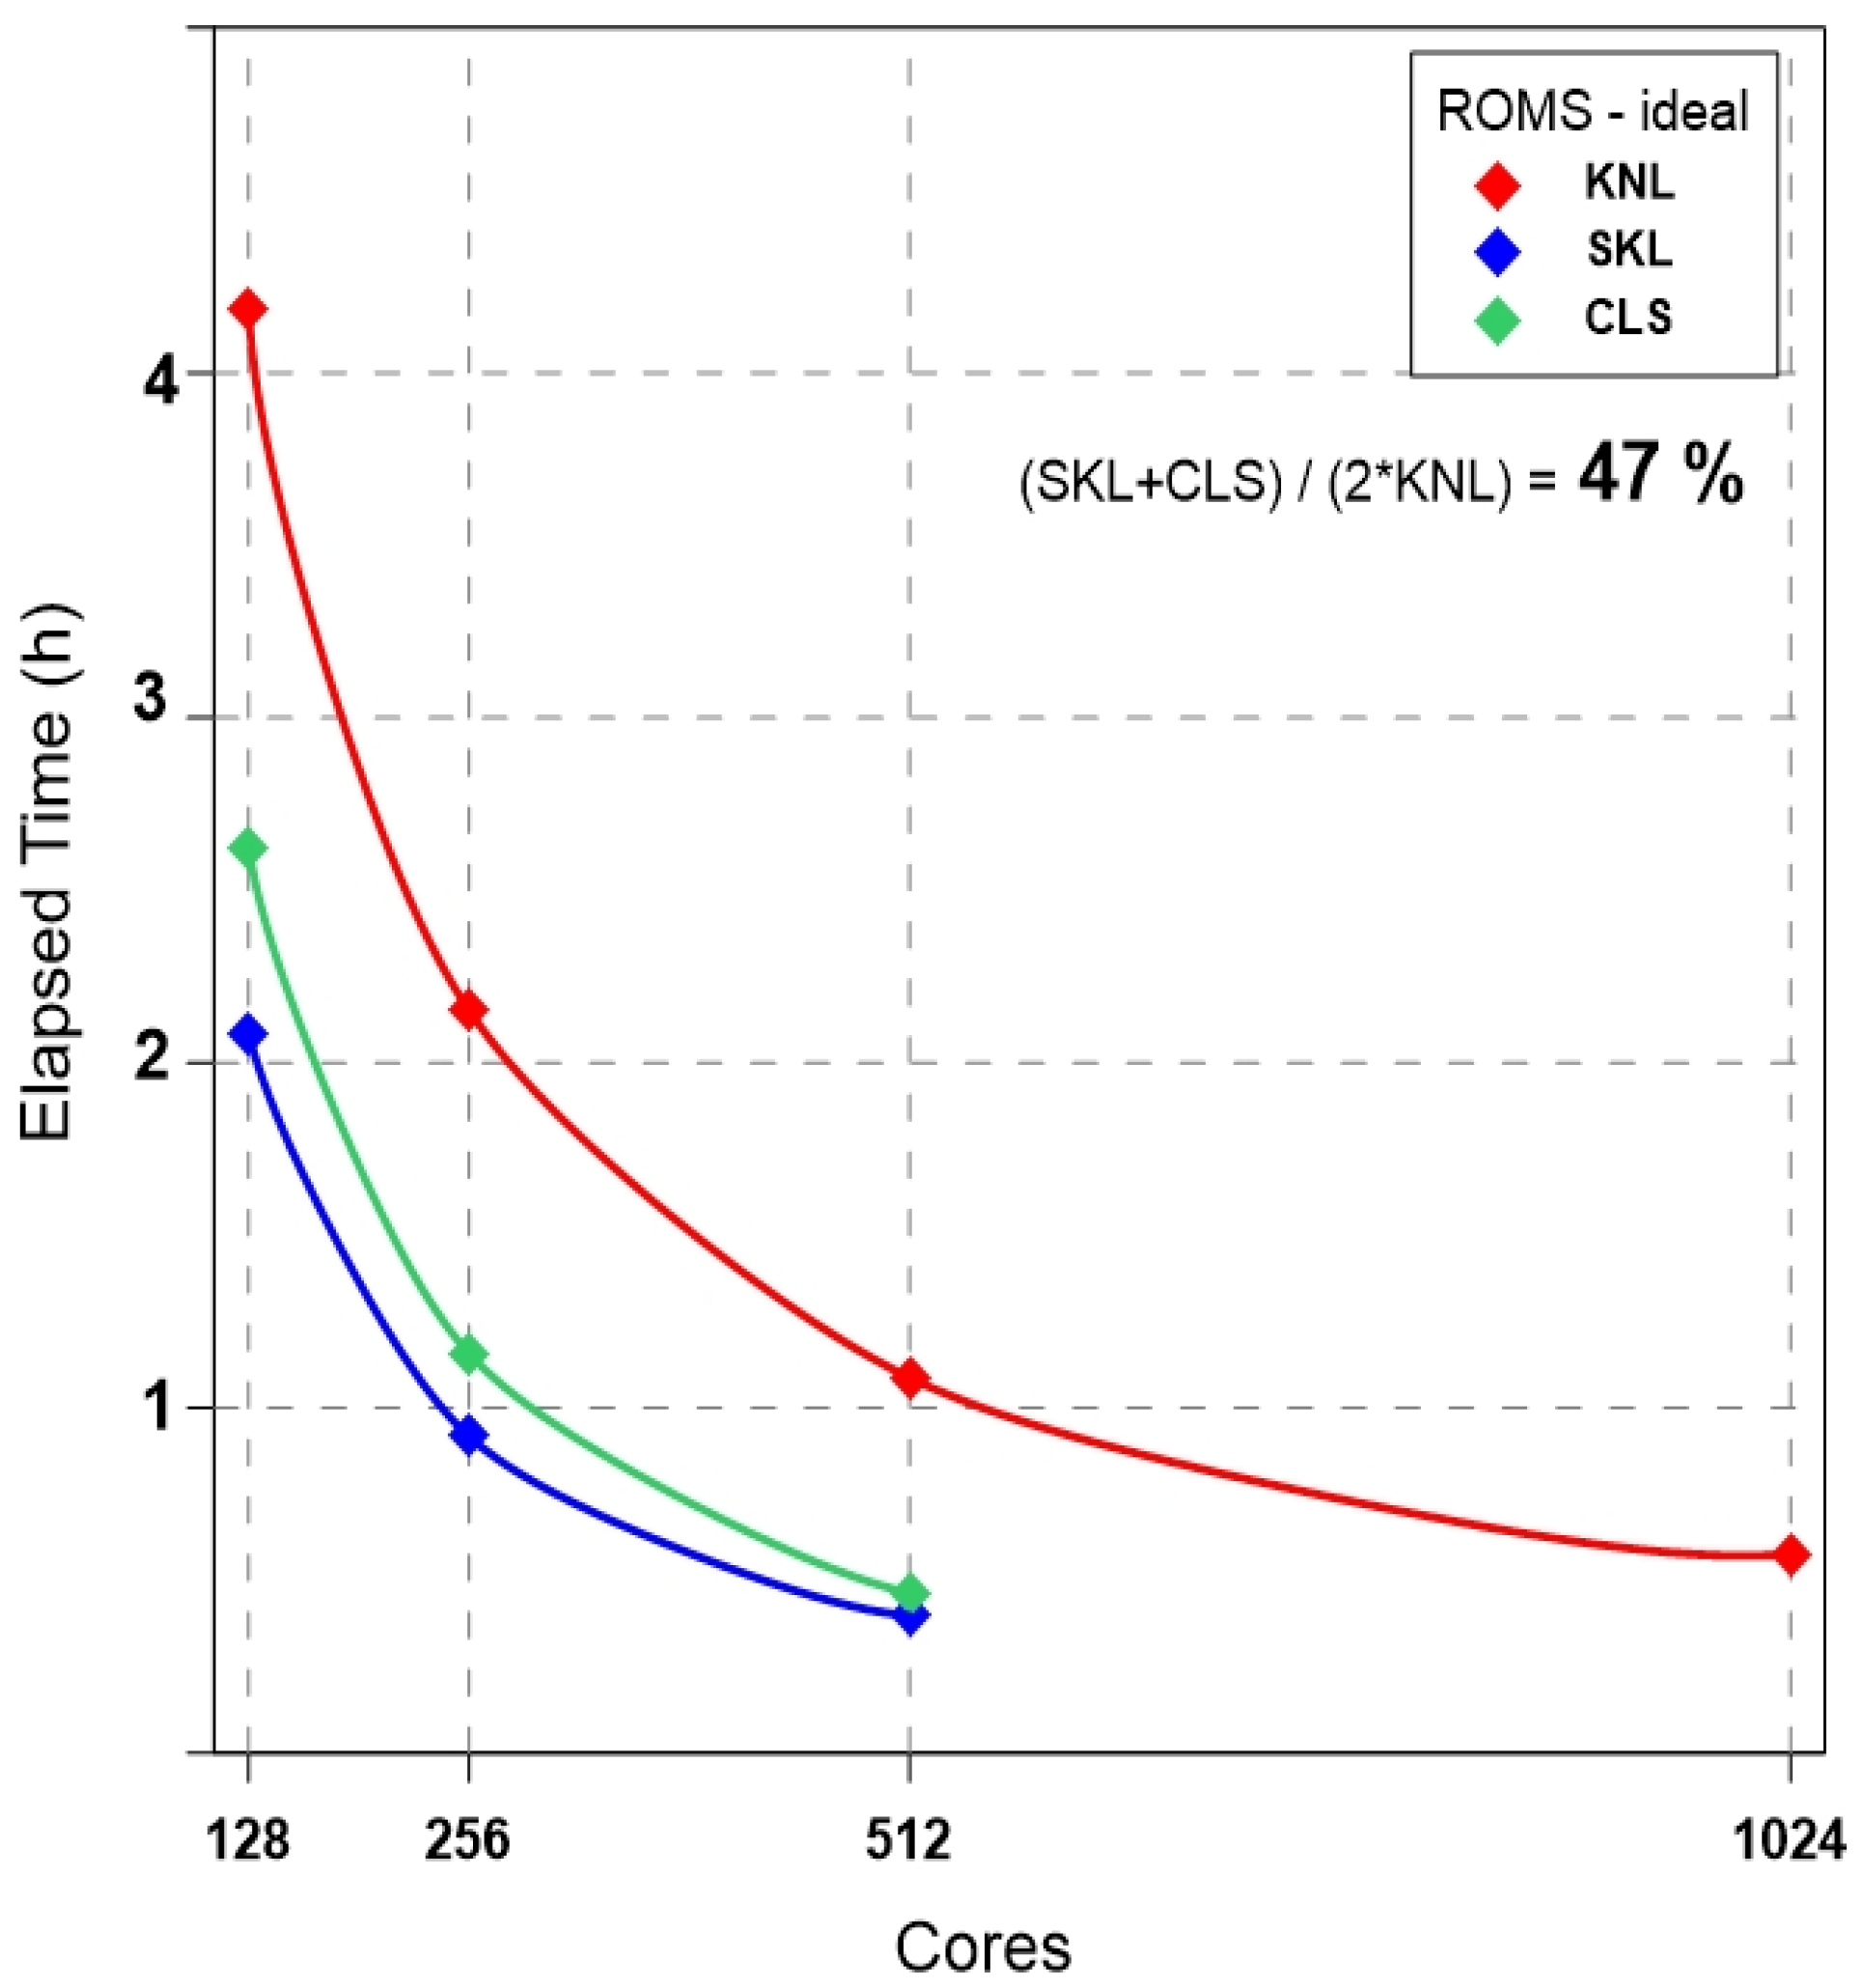
The results of each experiment are summarized in Figure 10. The KNL system performed at an overall rate of approximately 47% compared to the performances of SKL and CLS. This performance is slightly higher than the result (approximately three times) shown in the white paper [2] described in “Chapter 1”.
The 1024 cores experiment shows a continuous increase in the parallel performance of the KNL system. The CLS system shows a stable improvement in the performance depending on the number of cores used compared to the SKL system. The CLS system can run the model exclusively and consists of a simple network of 16 nodes, whereas the SKL system consists of a complex network of 132 nodes with many users.
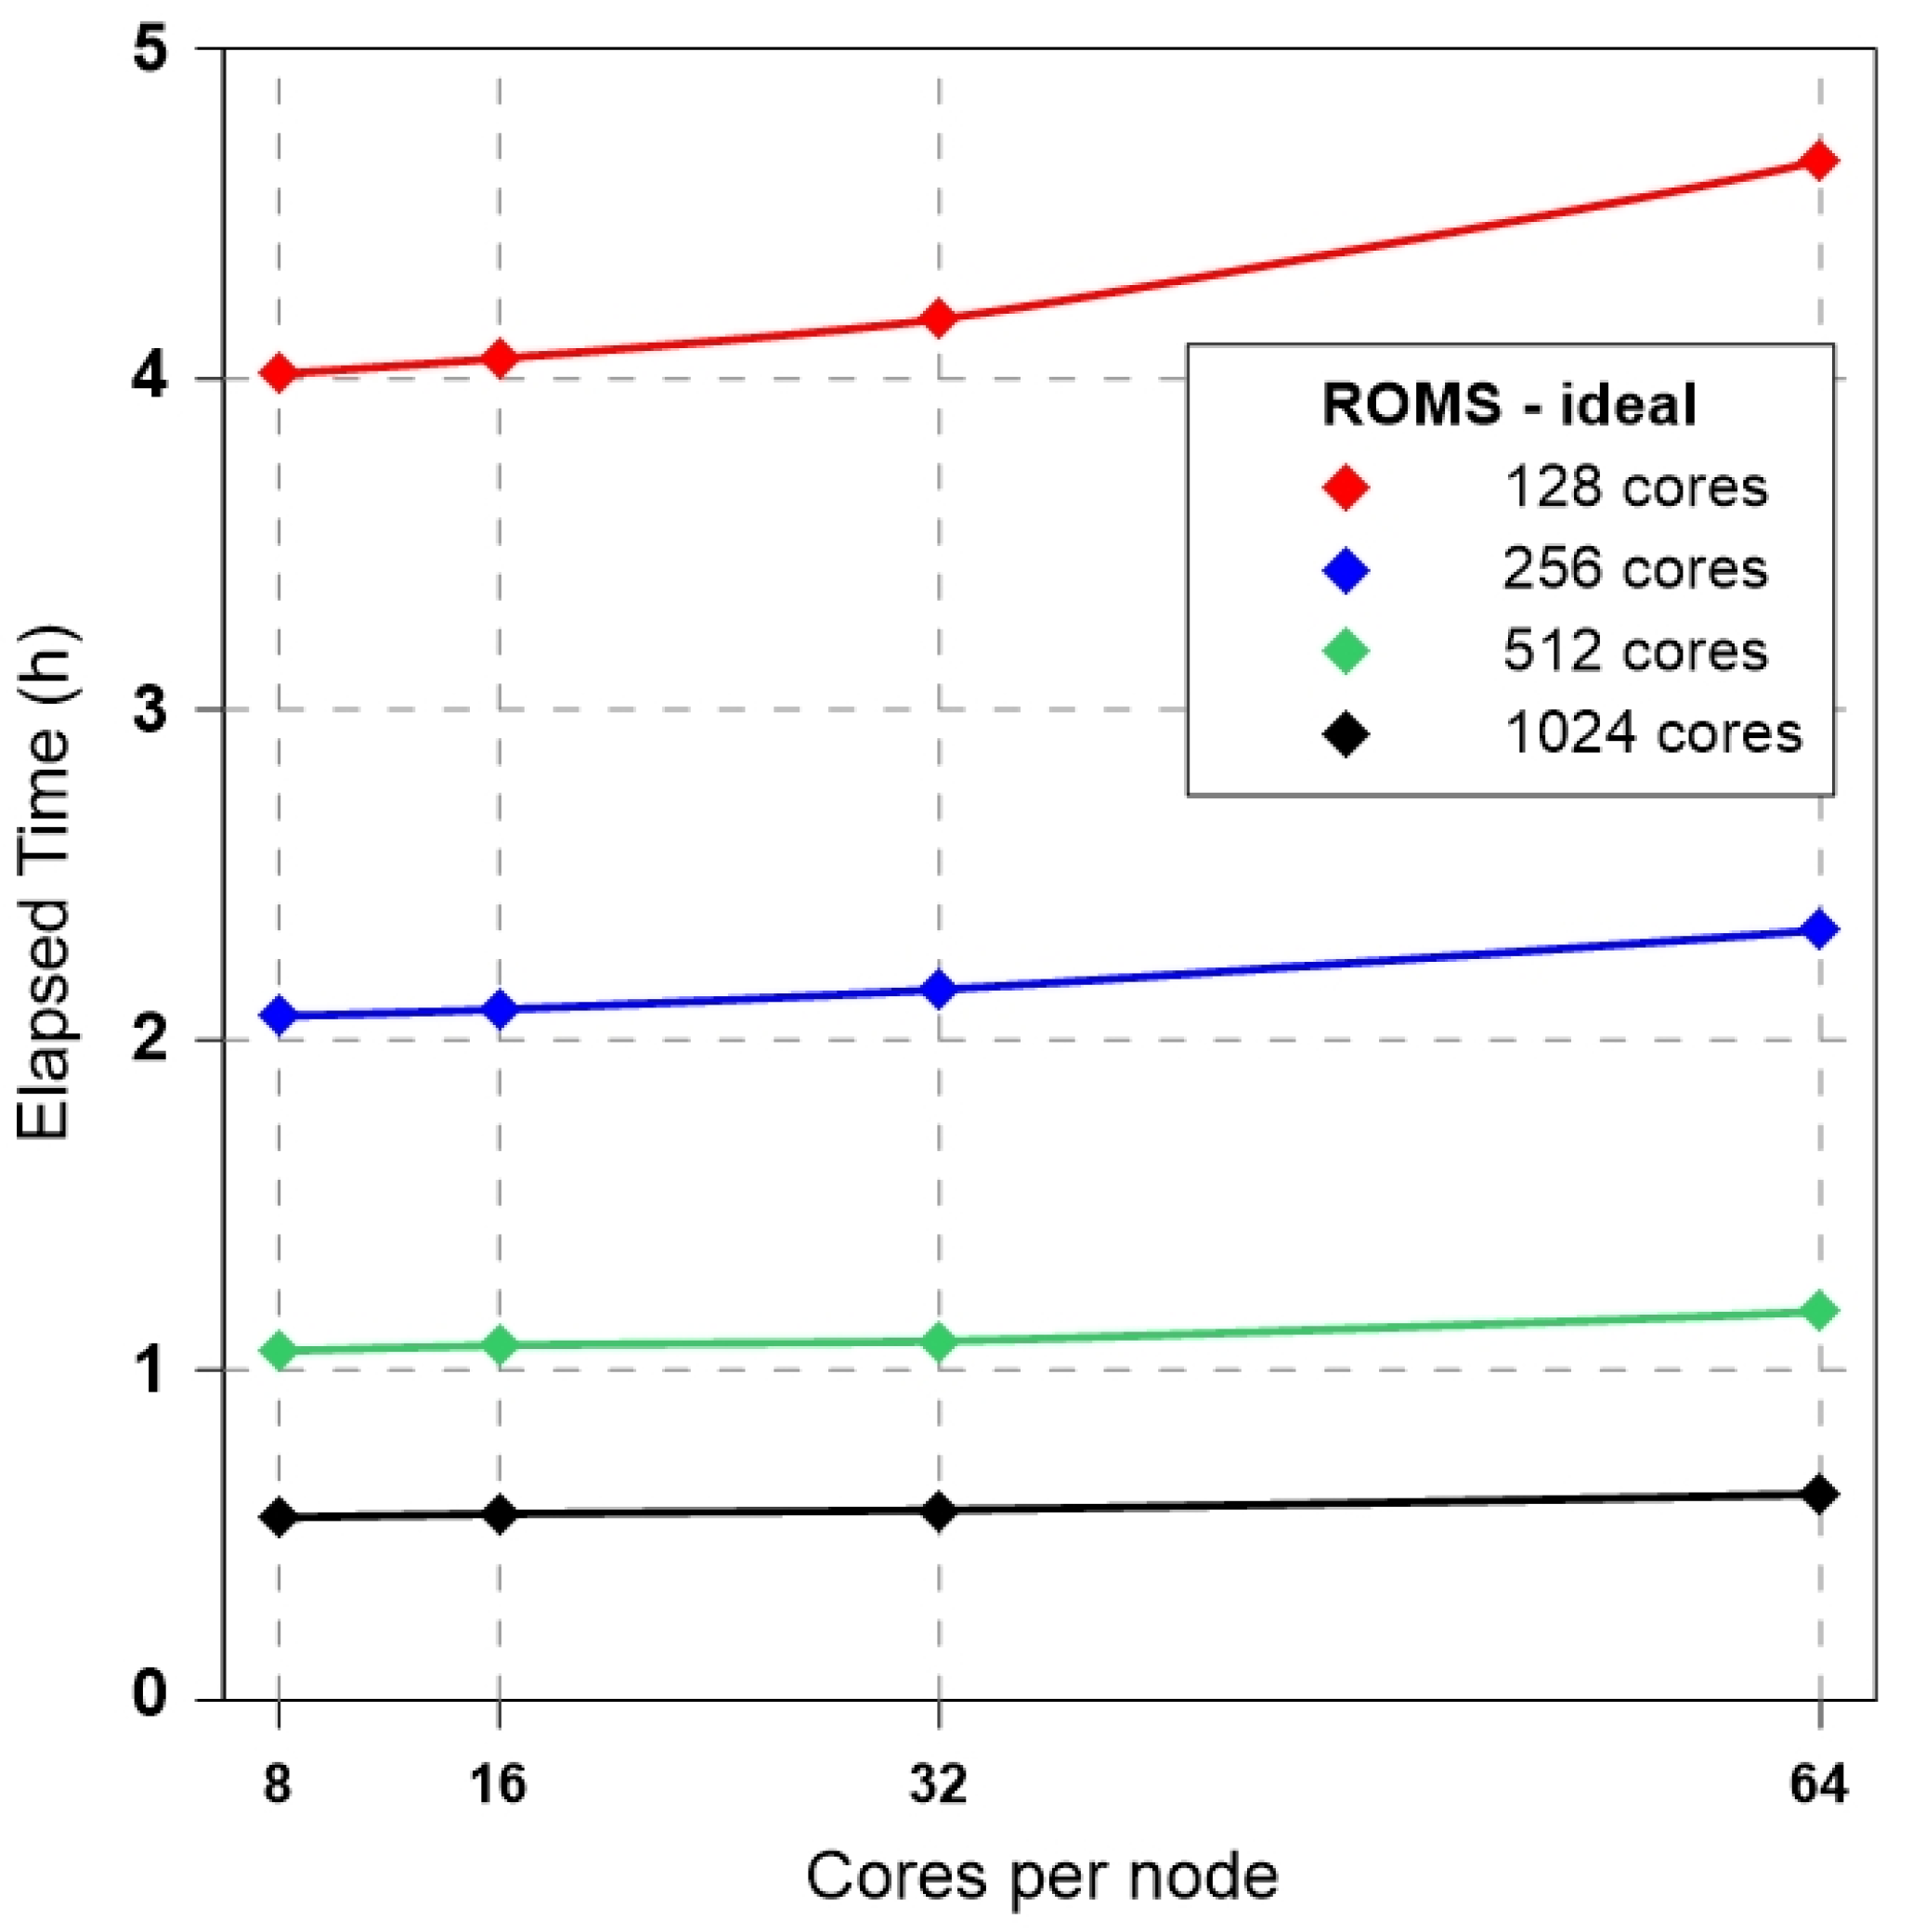
The KNL system’s performance was also analyzed according to the number of cores. Figure 11 shows the differences in performance according to the number of cores, with 8, 16, 32, and 64 cores per node. In the 128 cores experiment (red line), the case using only 8 or 16 cores per node shows the highest performance, and increasing the number of cores per node while reducing the number of nodes gradually decreased the performance. However, the performance difference was small enough to ignore when the total number of cores was more than 256. This means that the most economical method is to use all the cores of the node and reduce the number of nodes for an ultra-high parallel model.

4.2. Real Experiment: ROMS-NWP

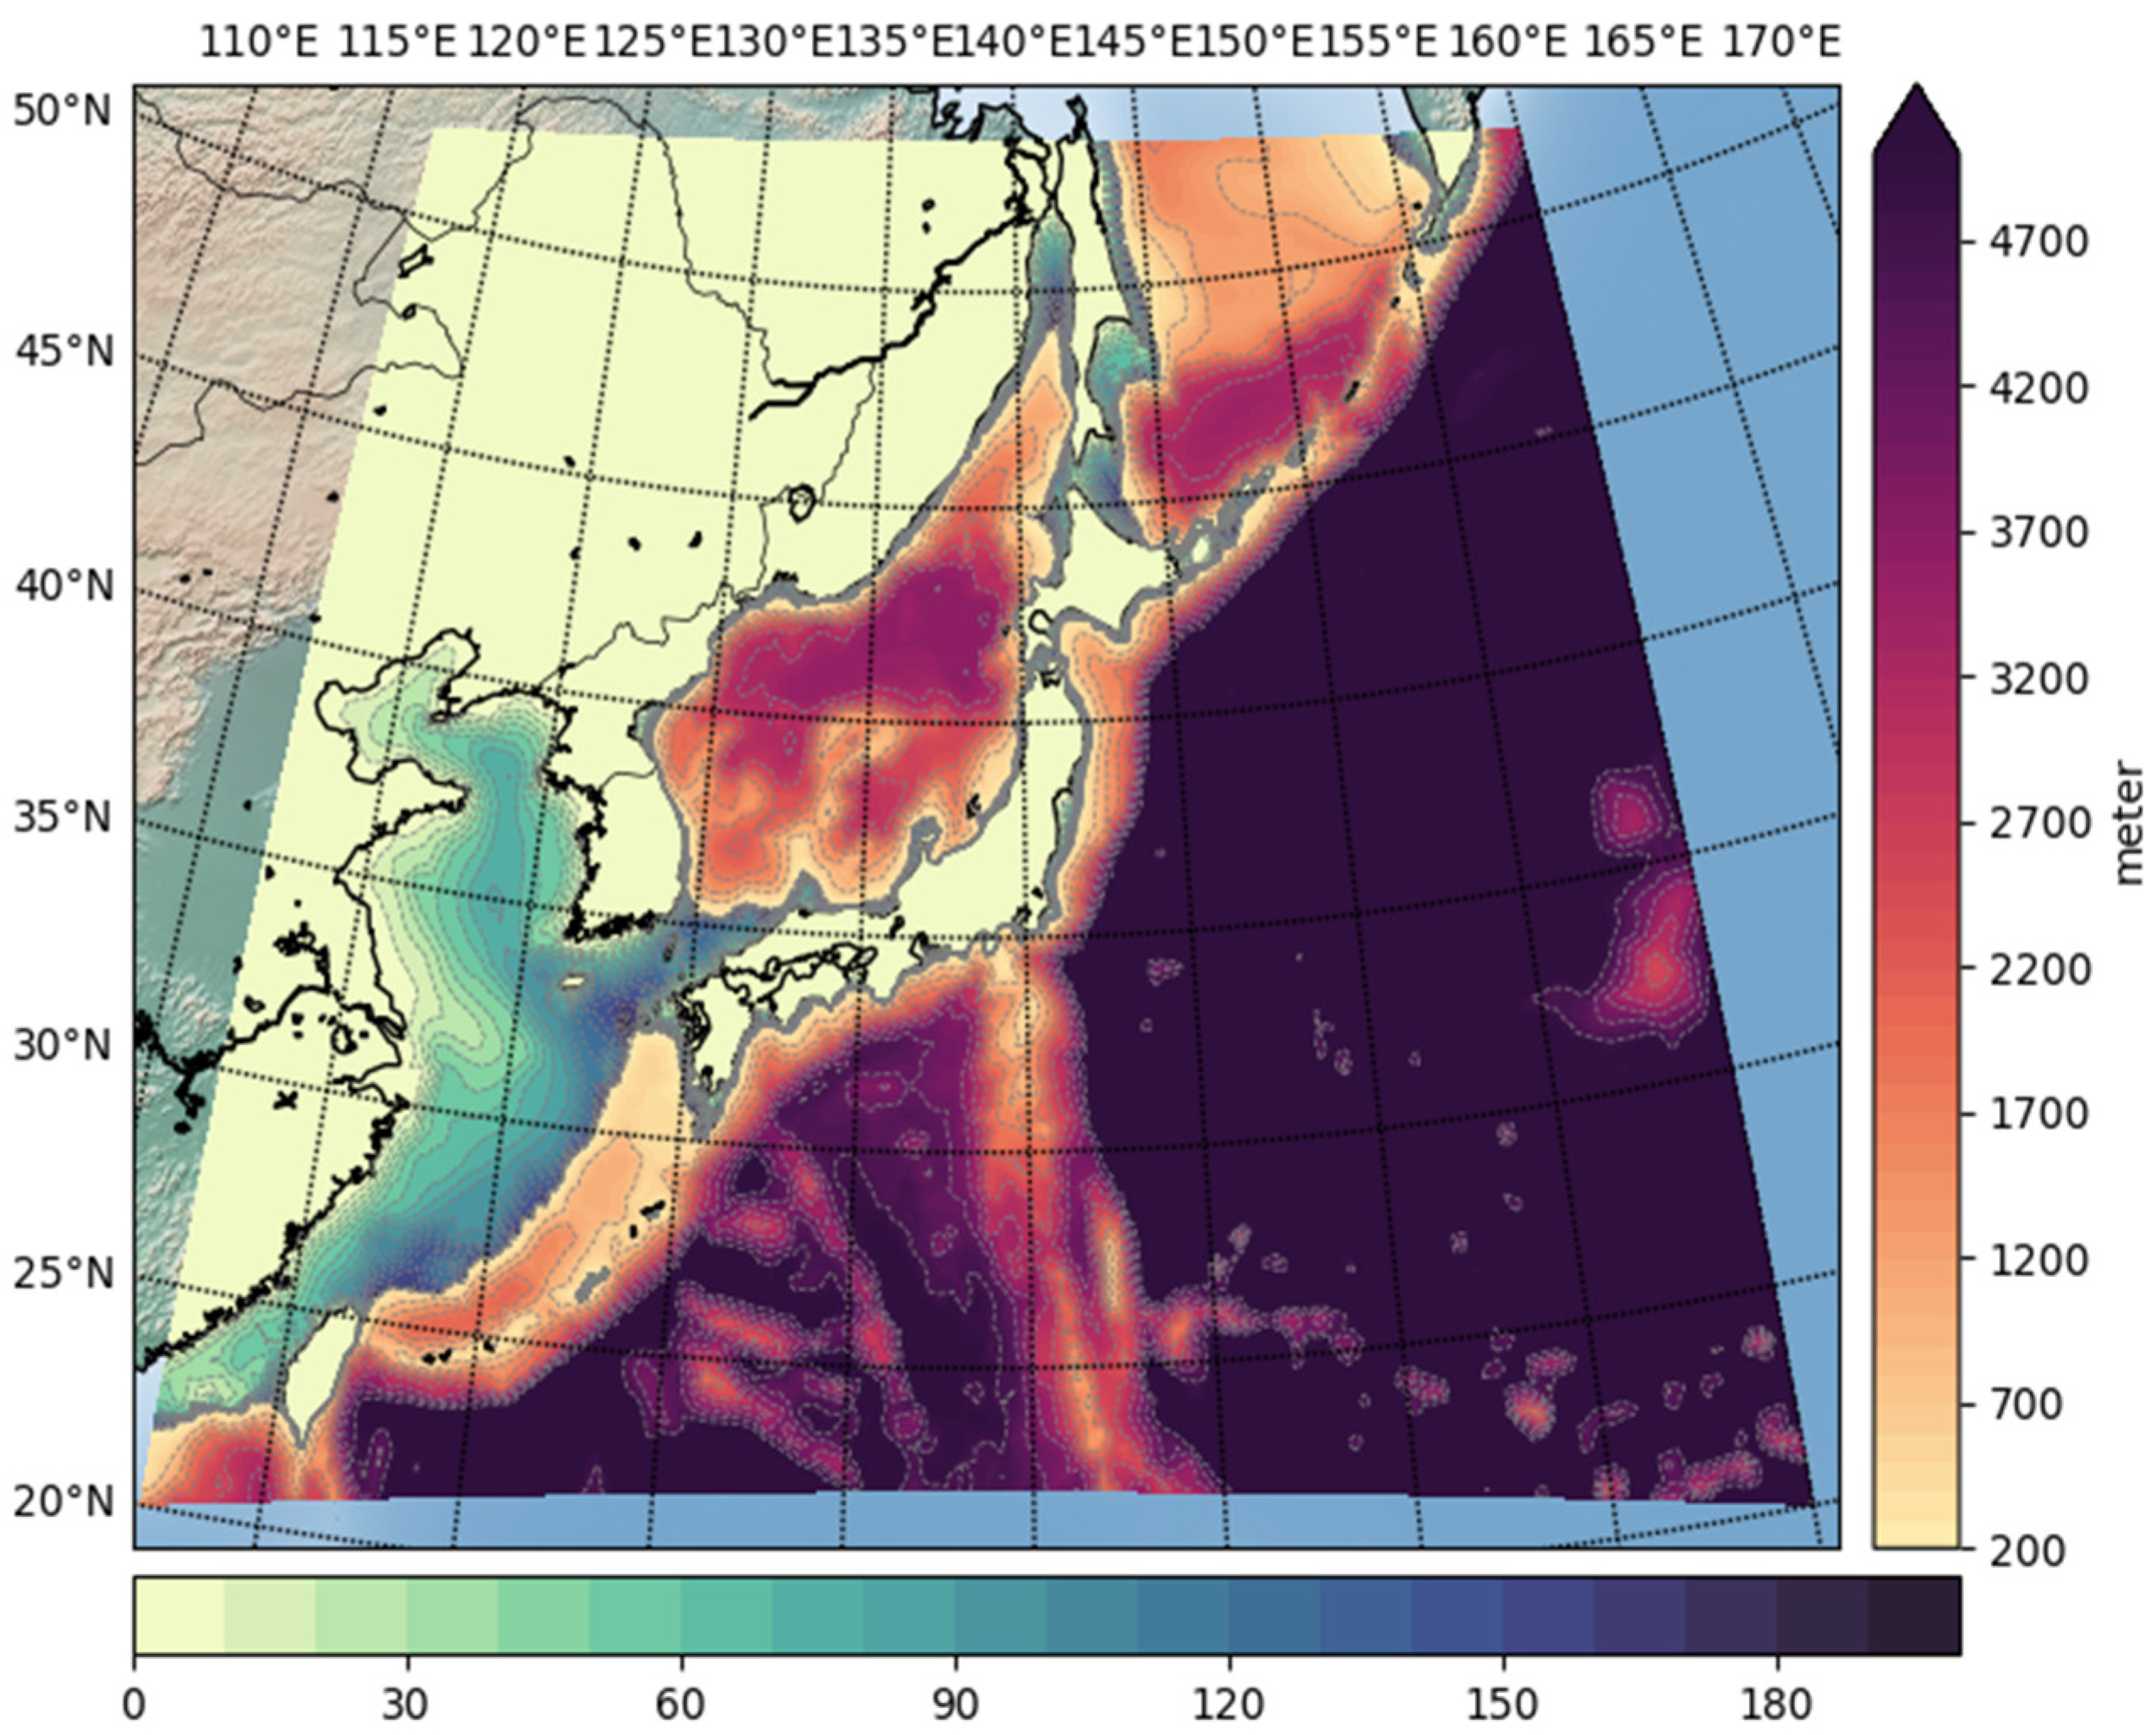
Experiments were conducted considering the real topography and external forces of the NWP. A 2048 × 2048 grid was constructed with an interval of approximately 1 minute in the region of 117° to 160° longitude and 20° to 52° latitude surrounding the Korean Peninsula (Figure 12). The depth of the model was interpolated to the ultra-high resolution grid using ETOPO2 [14] data, and the vertical grid was divided into equal intervals of 30 layers to 5000 m depth from surface.
GFS data and HYbrid Coordinate Ocean Model (HYCOM, https://ncss.hycom.org/thredds/ncss) data were used for the initial field and external forces. The experiment was simulated for 24 h from 0:00 to 24:00 on 23 August 2018. This is the period when the twin typhoons of Soulik and Cimaron severely damaged the Korean Peninsula and represents an appropriate integration time required for performance analysis. GFS data for surface wind, heat flux, freshwater flux, surface air pressure, cloud, albedo and so on were used for the surface external forces required by ROMS. HYCOM data was also used for an initial field and lateral forces of the U, V, SSH, T, and S were interpolated to fit the ultra-high resolution model grid.
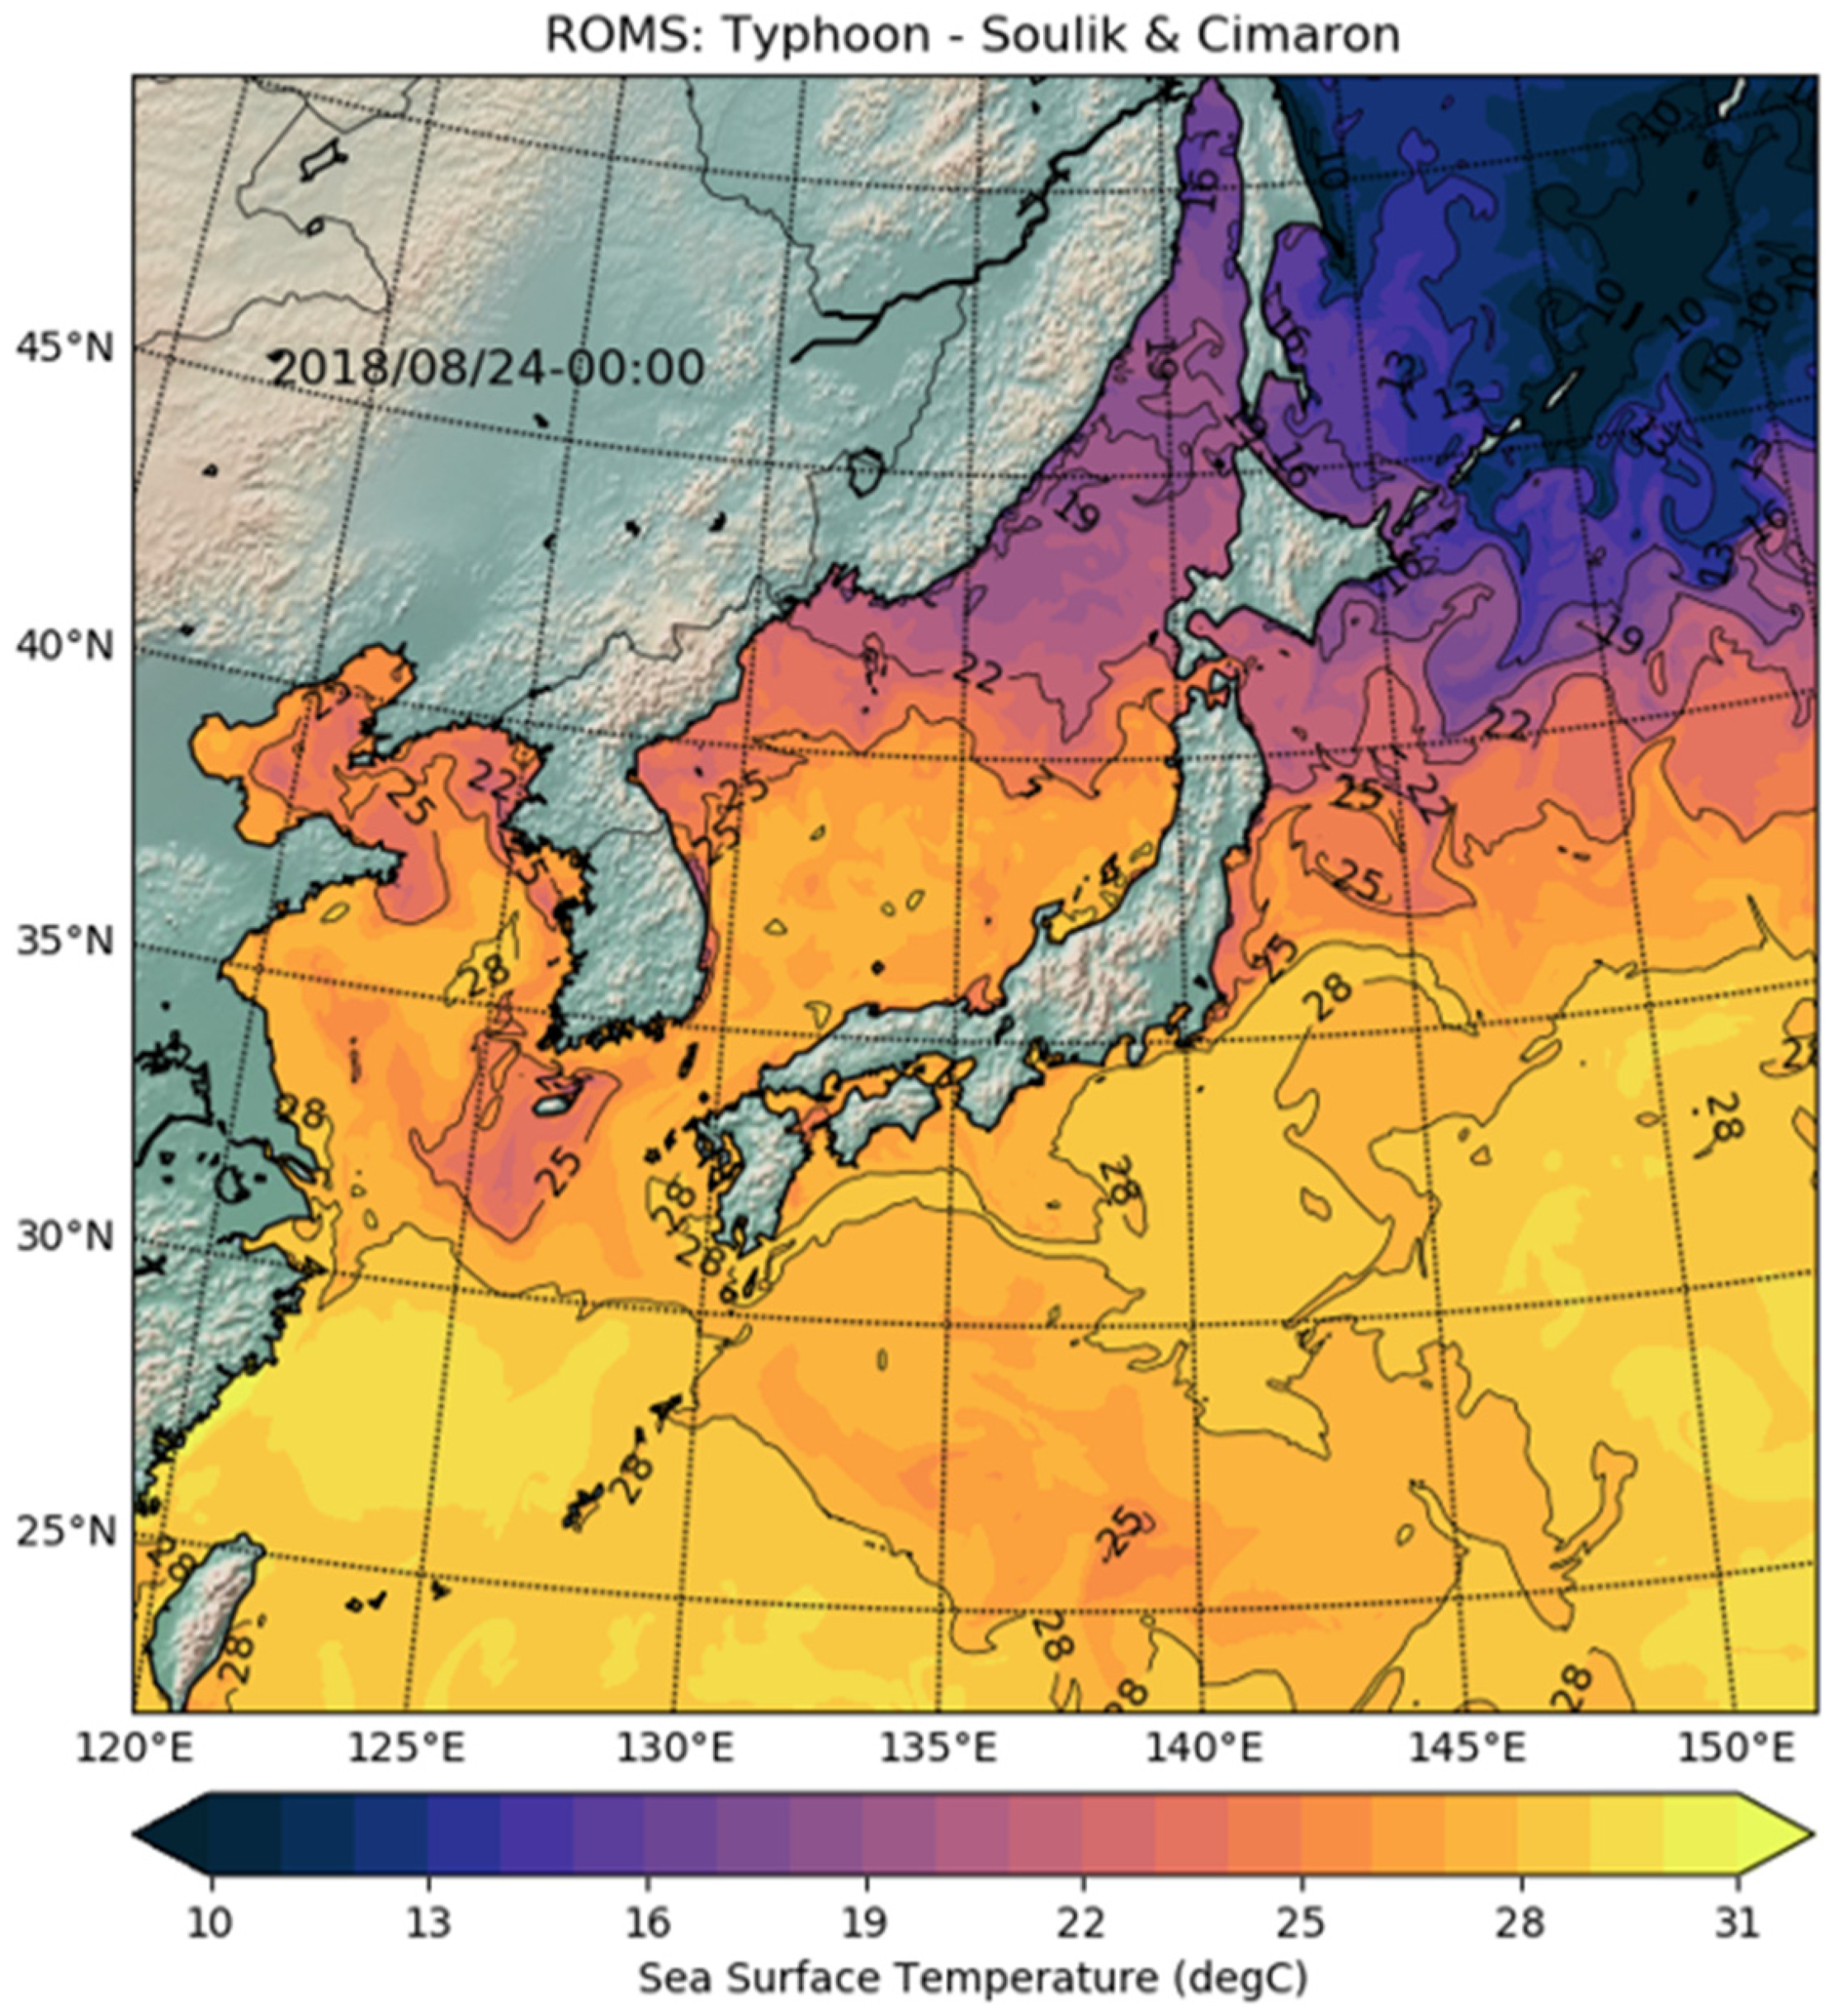
The time interval of the model integration was 20 s. Like the WRF-NWP experiment, the computational performance was evaluated without analyzing the accuracy of the simulation results due to the short simulation time. Figure 13 shows the sea-surface temperature field from the simulation results in the KNL system. The distribution of the sea-surface temperature is well simulated for the period when typhoon Soulik passed near the Jeju island of South Korea.
NWP experiments were performed with a 2048 × 2048 × 30 grid configuration (refer to Table 3). This configuration is suitable for evaluating the overall performance of the system because it considers the impact of the I/O performance to evaluate real topography and external forces. We used 128, 256, and 512 cores for comparing the performances of parallel systems according to the experimental results. In addition, a 1024 ultra-high resolution experiment was performed on the KNL system to test its performance limits.
The NWP ultra-high resolution experiment without the parallelization of I/O could not be simulated with over 60 cores per node in the KNL system due to the lack of system memory. Thus, only 32 cores per node were used in this case, but it showed a higher performance than that of 64 cores per node in the benchmark experiment of ROMS (see Figure 11).
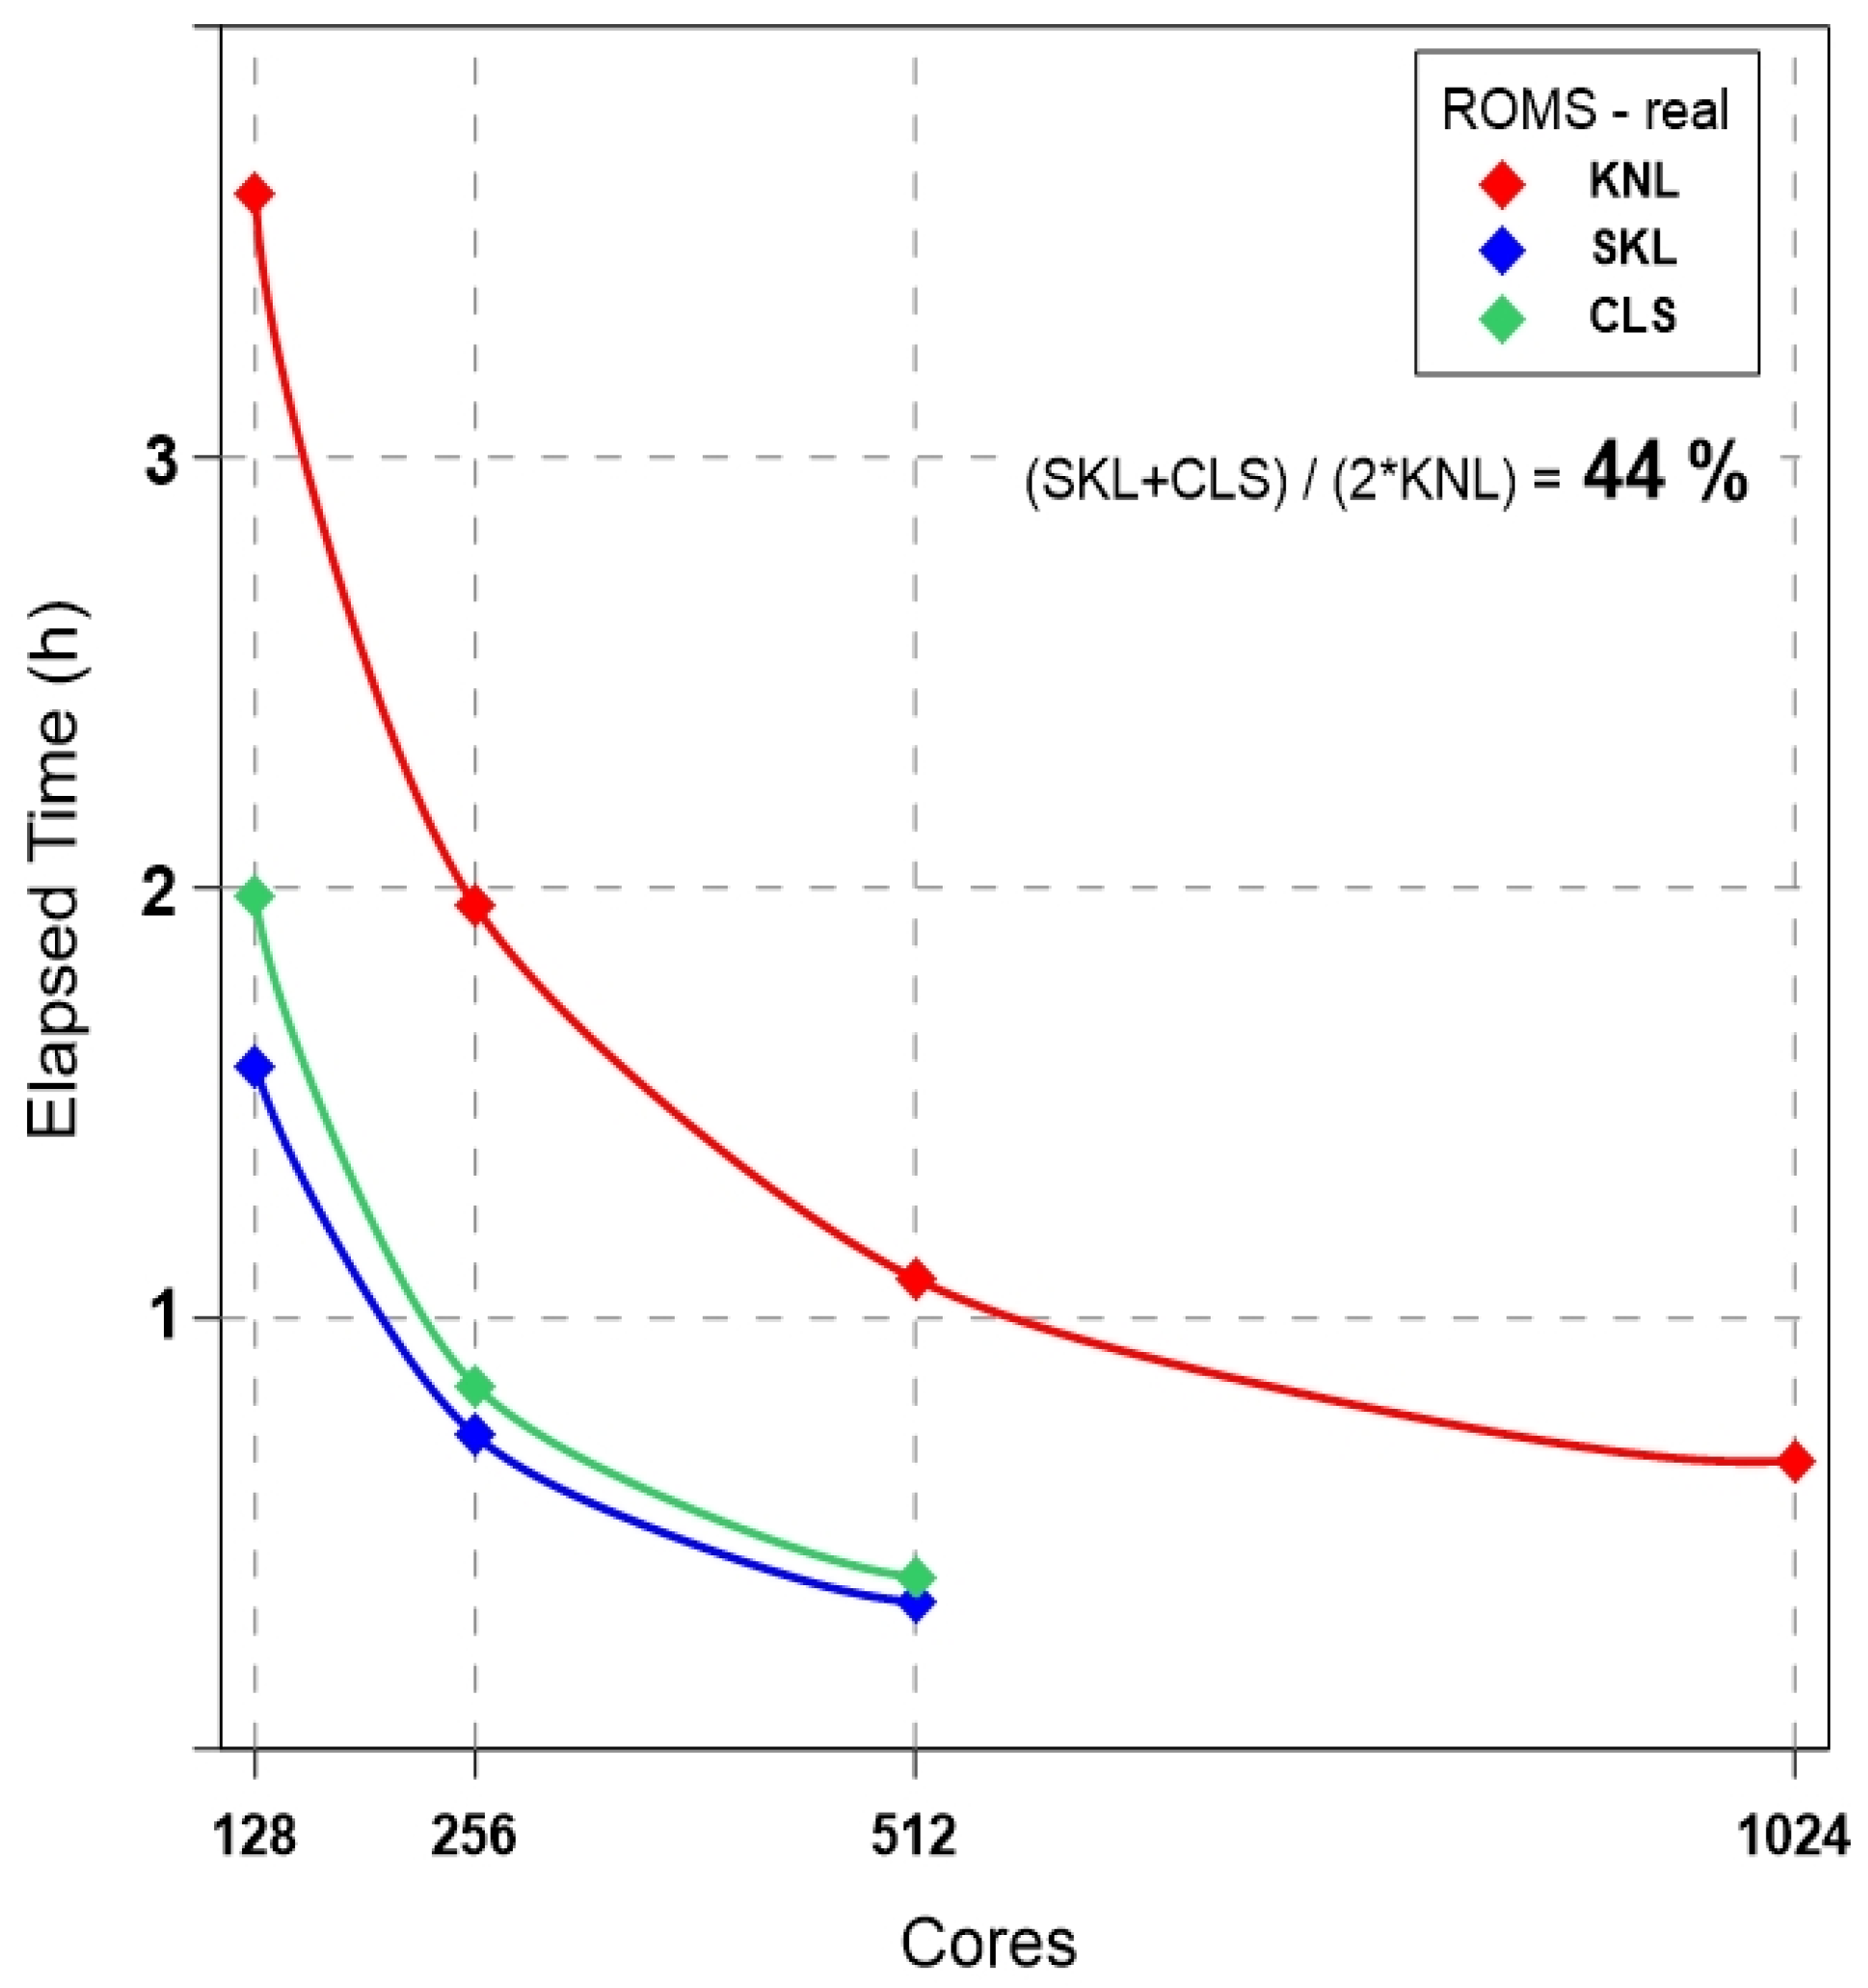
The results of each experiment are summarized in Figure 14. The KNL system performs at an overall rate of approximately 44% compared to the performances of SKL and CLS. This is slightly slower than the benchmark experiment of ROMS (47%) due to the loads of I/O accessing. However, the effect of the I/O loads on parallel performance is small in the ROMS experiments compared with the WRF ideal experiment (54%) and the real experiment (37%) in Chapter 2. Even the 1024 cores experiment shows a continuous increase in the parallel performance of the KNL system; thus, it is the more suitable system for an ultra-high parallel numerical model.

5. Performance Evaluation of FVCOM

FVCOM is a community numerical ocean circulation model developed by UMASSD-WHOI and it solves 3-D primitive free-surface equations using a finite-volume method. The horizontal grid is composed of unstructured triangular grids for horizontal space and terrain-following sigma grids for vertical space. This model has demonstrated excellent performance in coastal studies characterized by complex coastlines such as the western and southern coast of Korea. FVCOM is considered to be a good balance of computational efficiency and accuracy because it combines the best features of finite-element method (grid flexibility) and finite-difference methods (numerical efficiency and code simplicity) [15].

5.1. Ideal Experiment: FVCOM-Benchmark

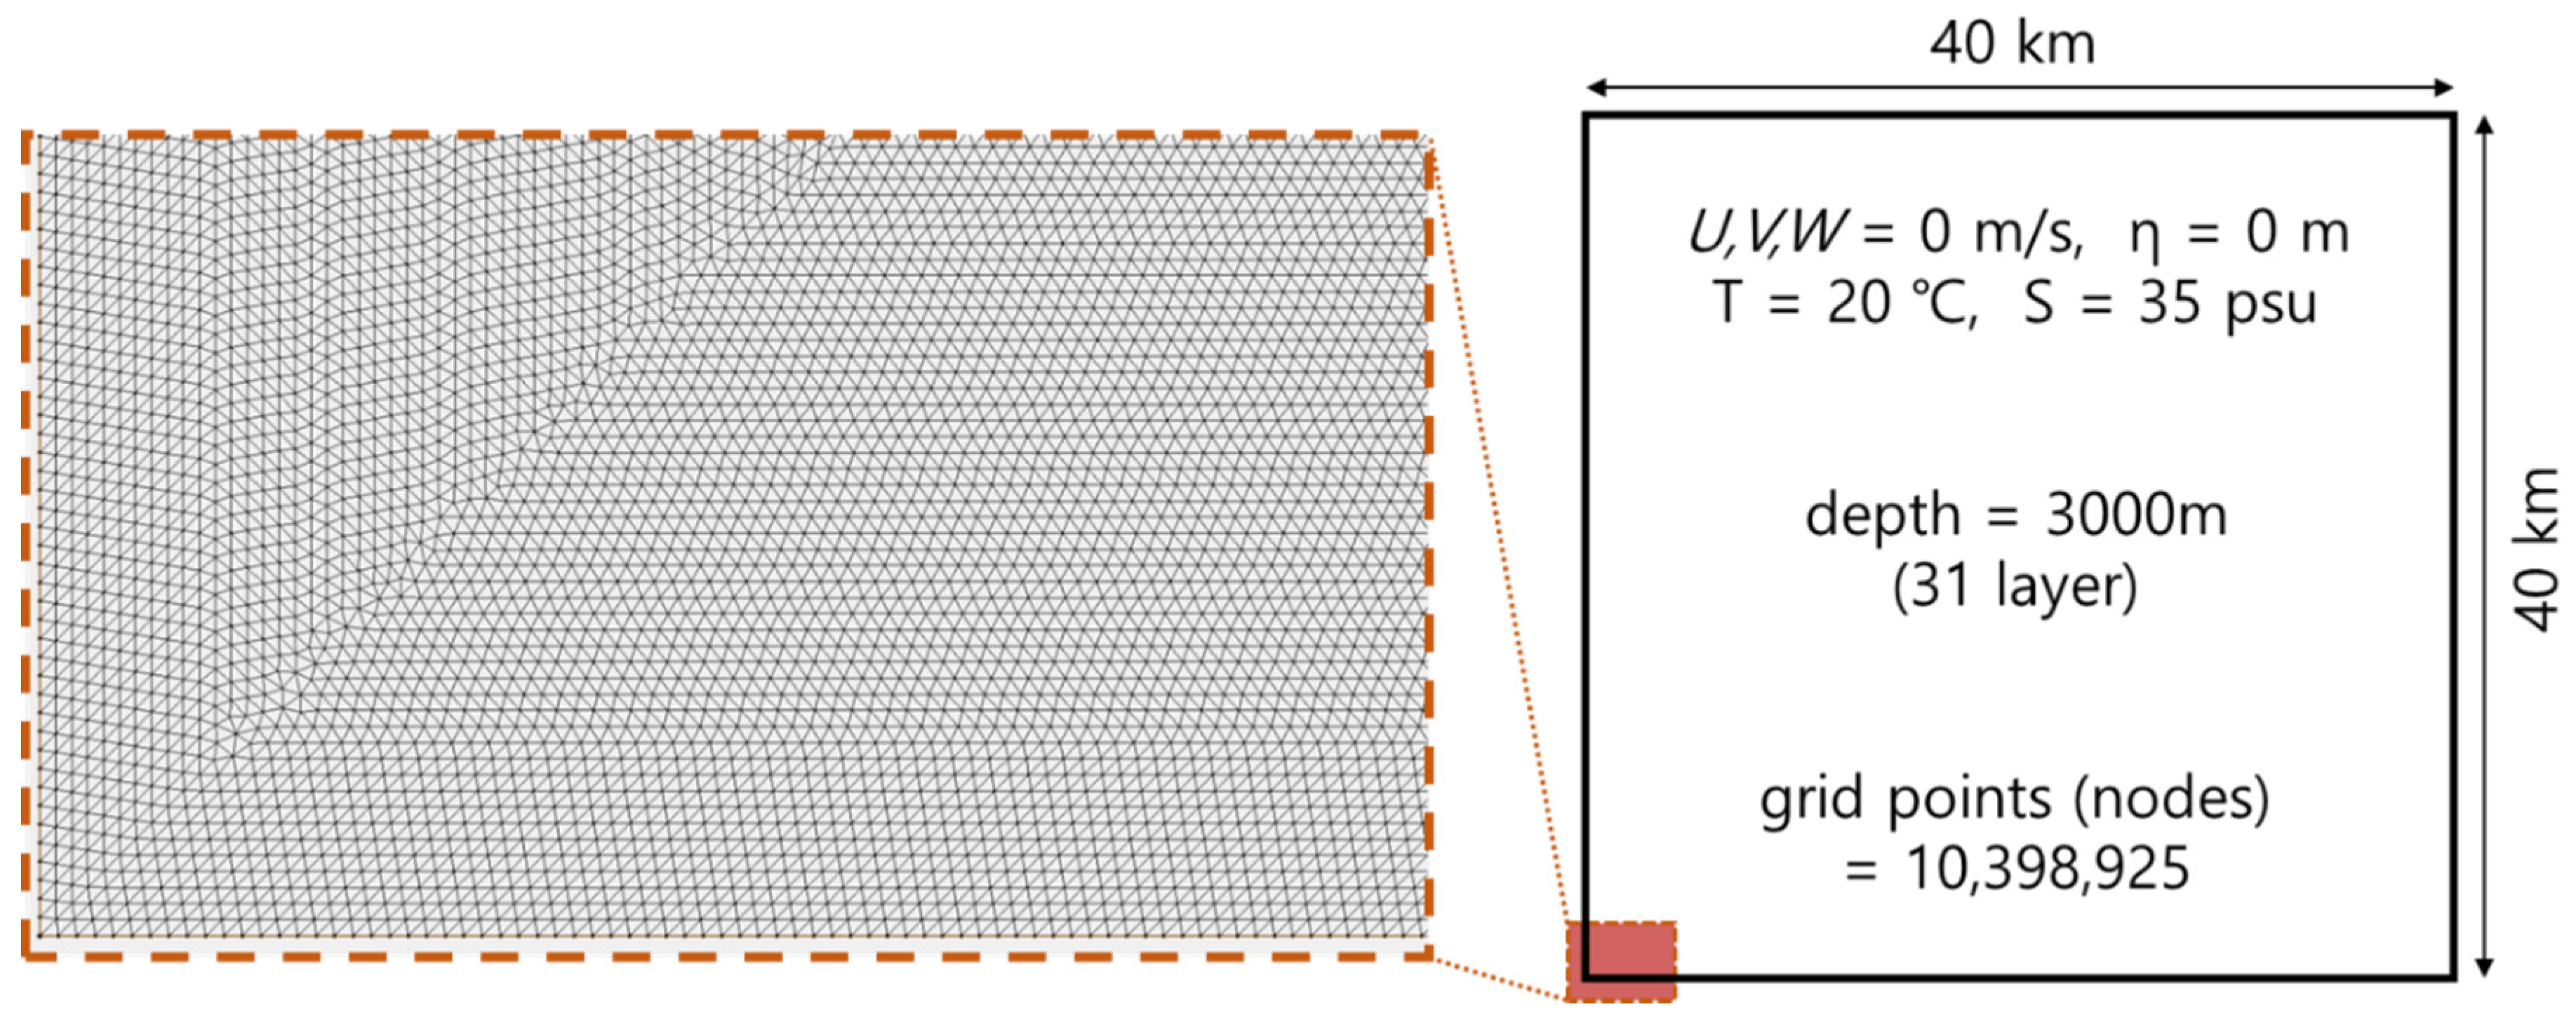
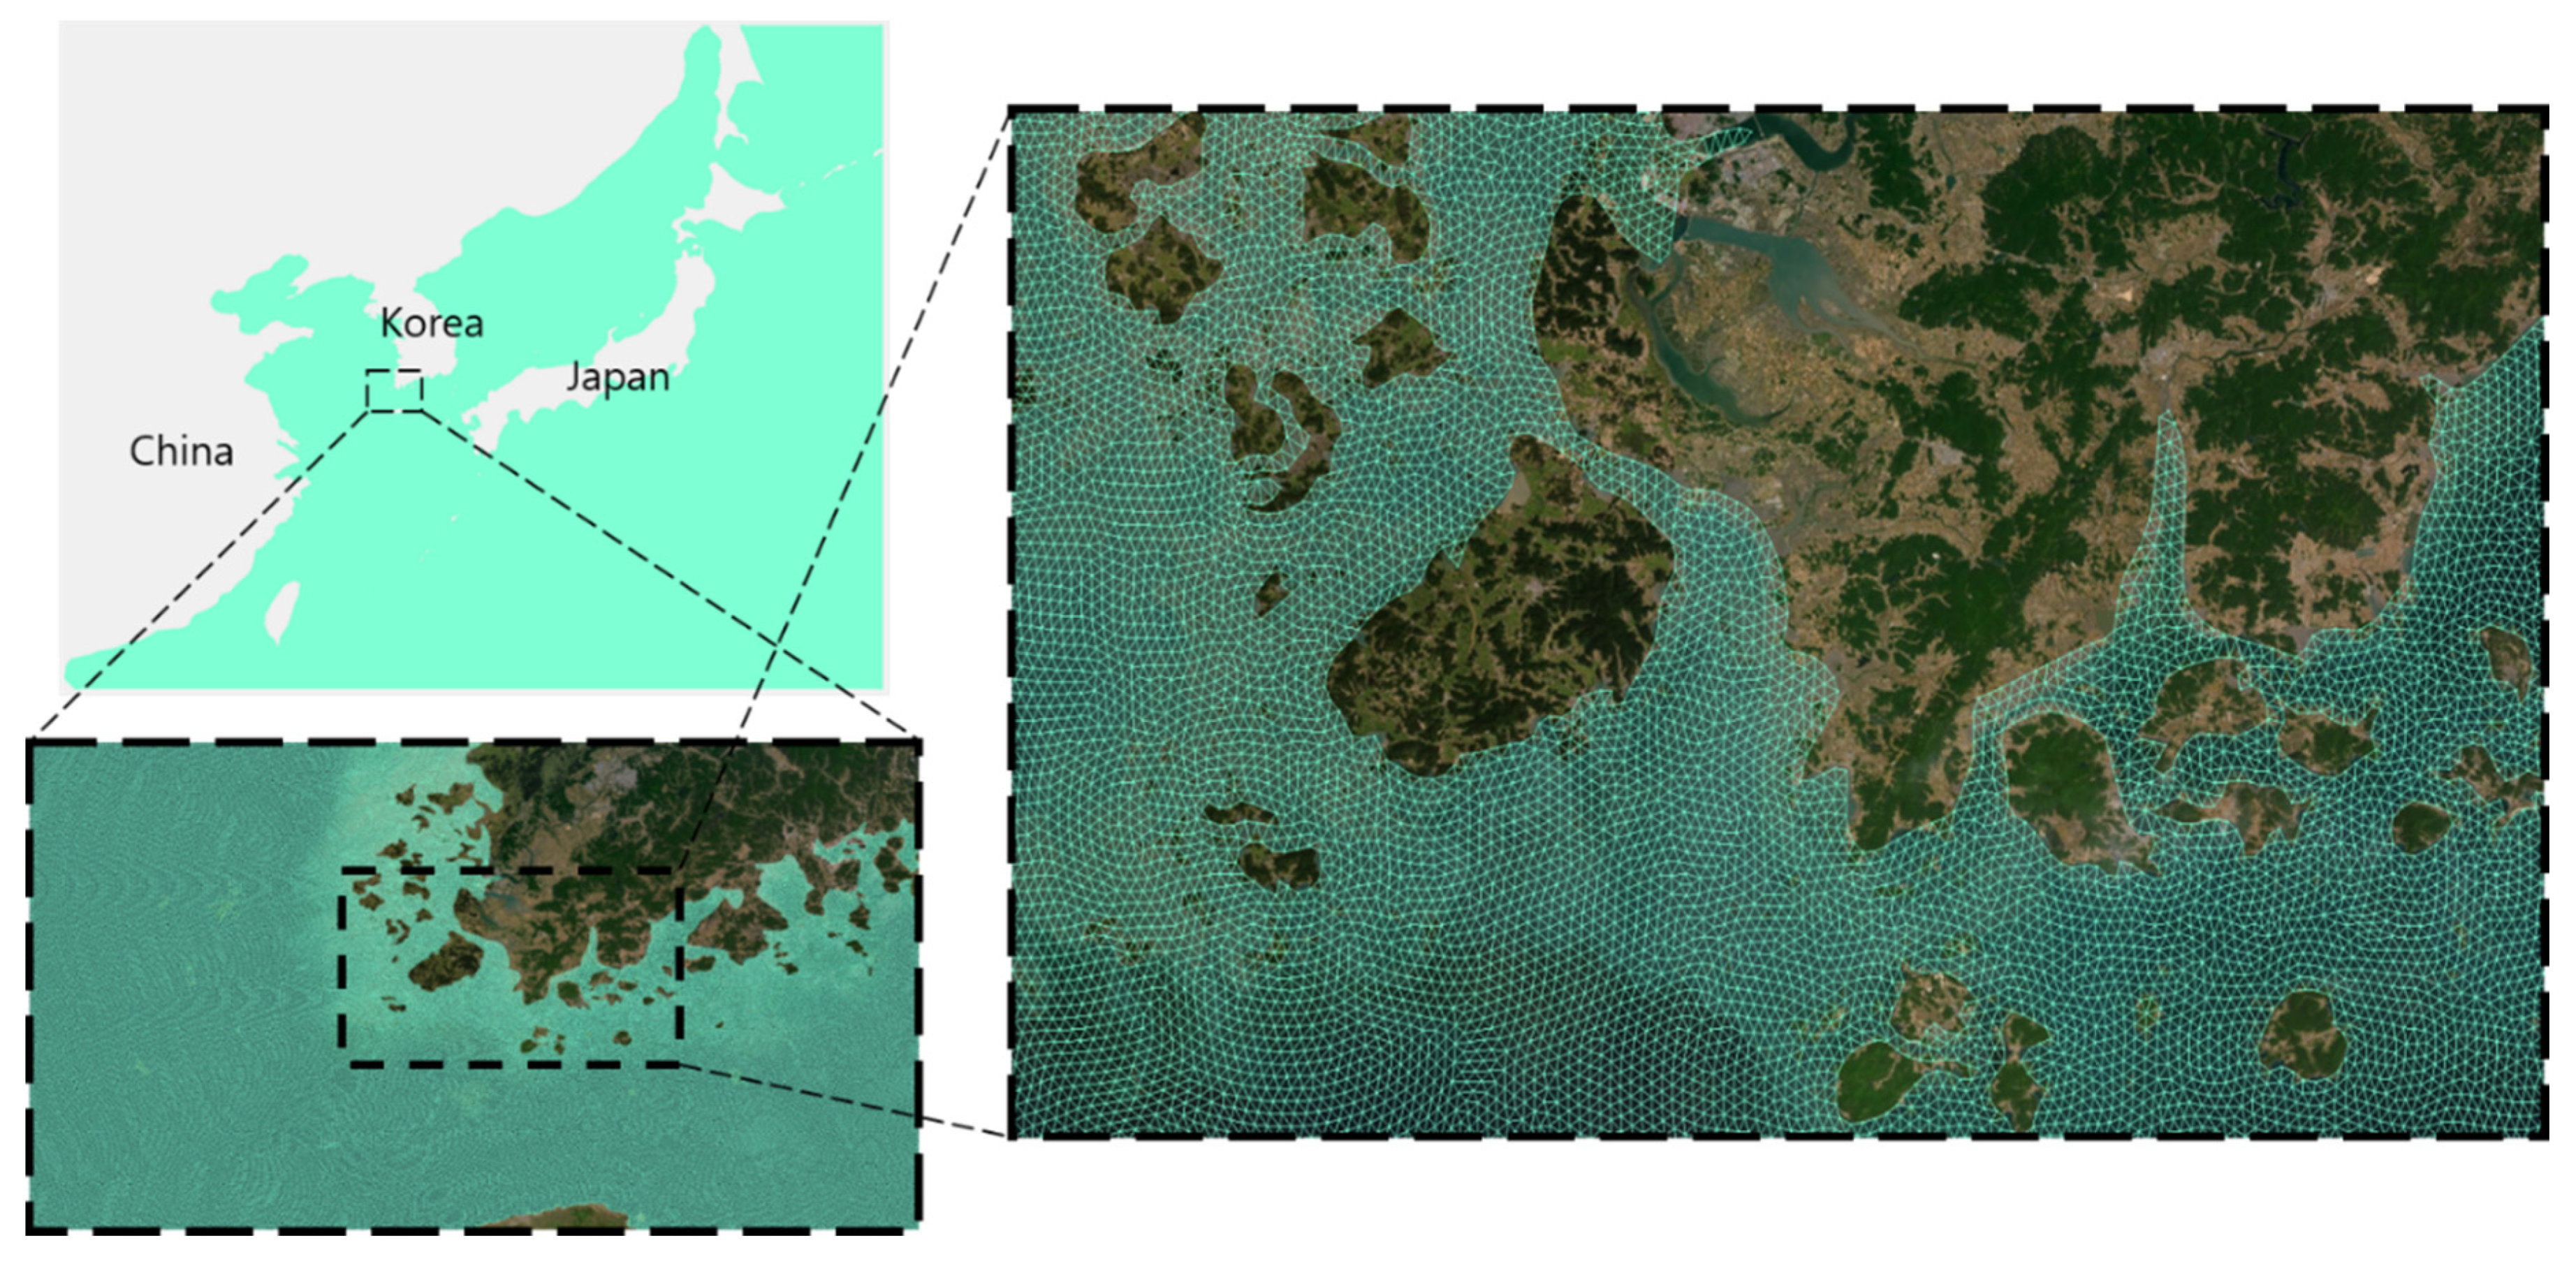
An ideal ultra-high resolution grid for the FVCOM-Benchmark experiment was constructed with approximately 10 million grid points (nodes = 10,398,925). The right image in Figure 15 shows the detailed experimental configuration. The interval of every grid node (= point) is about 10 m for the integration efficiency and stability of the simulation. The internal angles of the triangle grid elements were set close to the angles of an equilateral triangle, at approximately 60°, for a more stable simulation (see the left image in Figure 15). The ideal sea surface height (SSH), at 1 m, was set to the southern side of the grid for an open boundary condition (OBC).
The vertical grid was divided into 31 layers. The simulation period was 4 h with a time interval of 1 s in consideration of the grid size. FVCOM-Benchmark experiments were also configured for allocated cores and nodes (refer to Table 3). The benchmark experiment for an ideal case is suitable for comparing the performances of computational resources due to the low I/O data loads. We used 128, 256, and 512 cores to compare the performances of parallel systems according to the experimental results. In addition, a 1024 ultra-high resolution experiment was performed on the KNL system to test its performance limits.
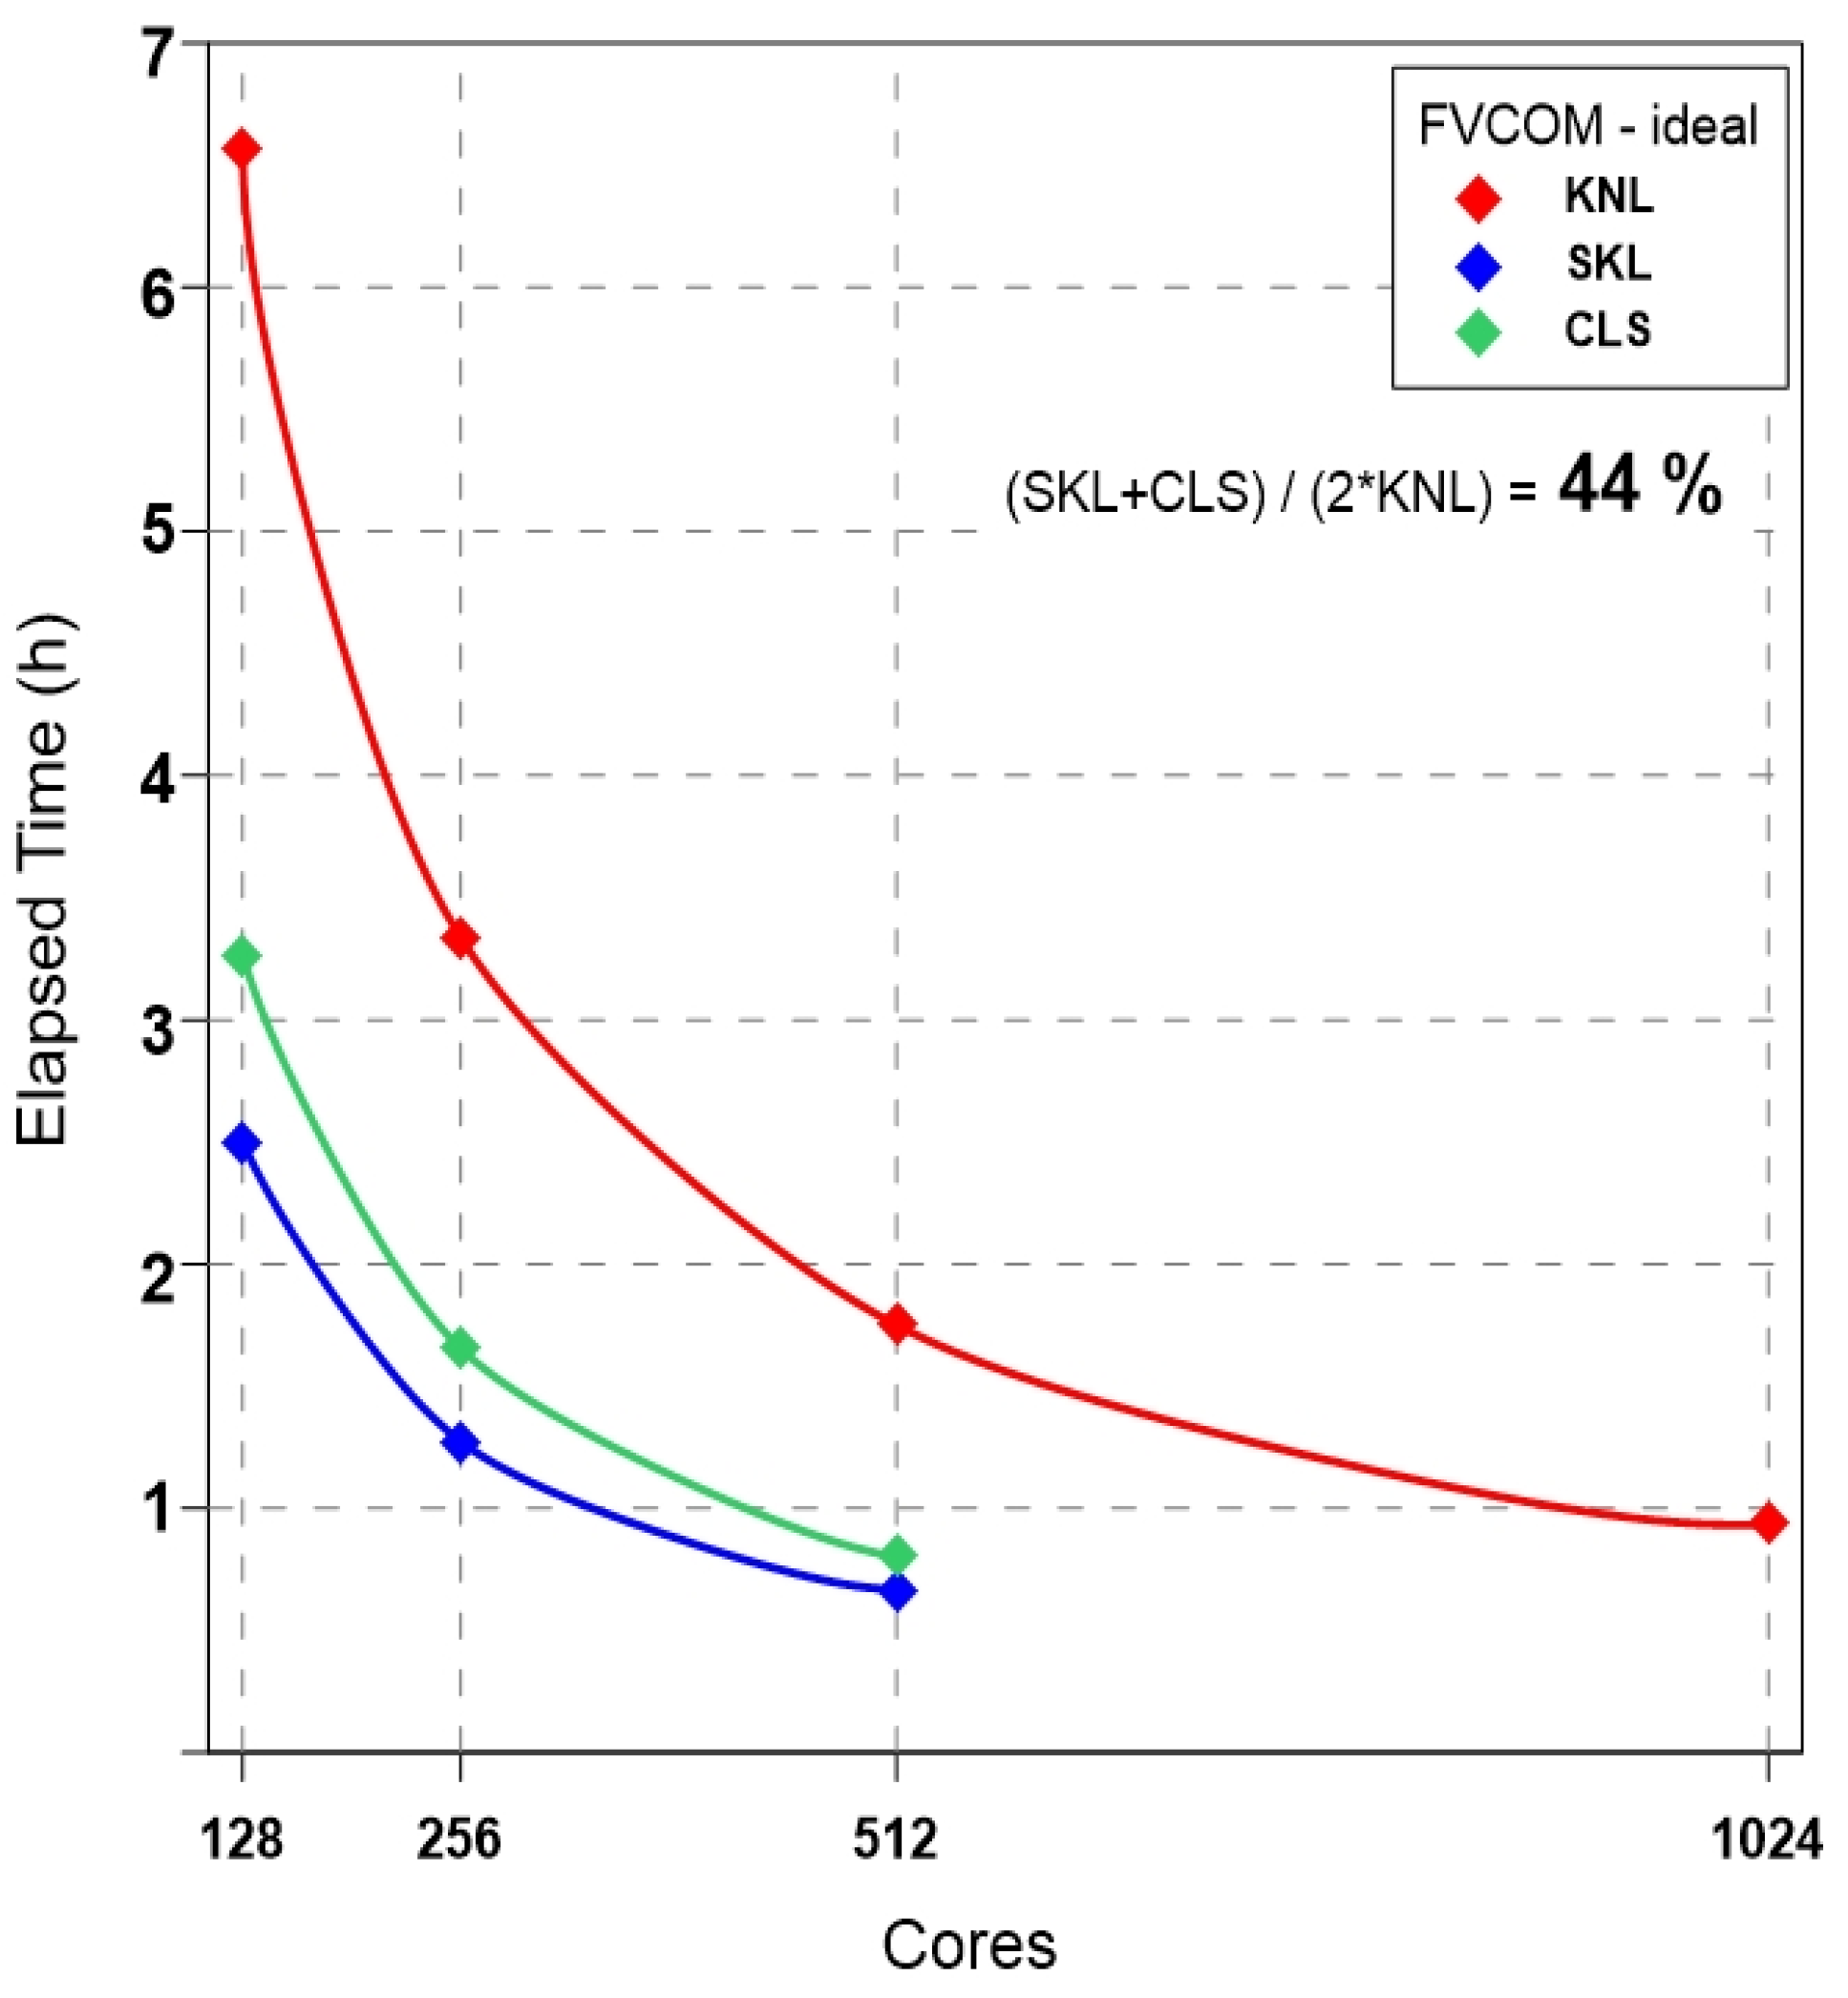
The results of each experiment are summarized in Figure 16. The KNL system performed at an approximate 44% rate compared to the performances of SKL and CLS. The 1024 core experiment showed a continuous increase in the parallel performance of the KNL system. FVCOM also clearly improved the performance of the 1024 core configuration compared to WRF and ROMS. The speed of the 1024 core experiment in KNL is close to those of the 512 core experiments in SKL and CLS.

5.2. Real Experiment: FVCOM-NWP

The grid for the real experiment of FVCOM-NWP was constructed with about eight million grid points (= 8,369,391) between 110° to 150° longitude and a 20° to 55° latitude centered on Korea. The depth for the ultra-high resolution grid was interpolated with combined data of KorBathy30s [16] and ETOPO1 [17]. KorBathy30s topography was used for the coastal areas of Korea, and ETOPO1 topography was used for the other broad areas. The grid was constructed to thoroughly represent complex coastlines and islands while considering the advantages of the unstructured grid model (Figure 17). The vertical grid was divided into 10 layers and optimized for a tide simulation.
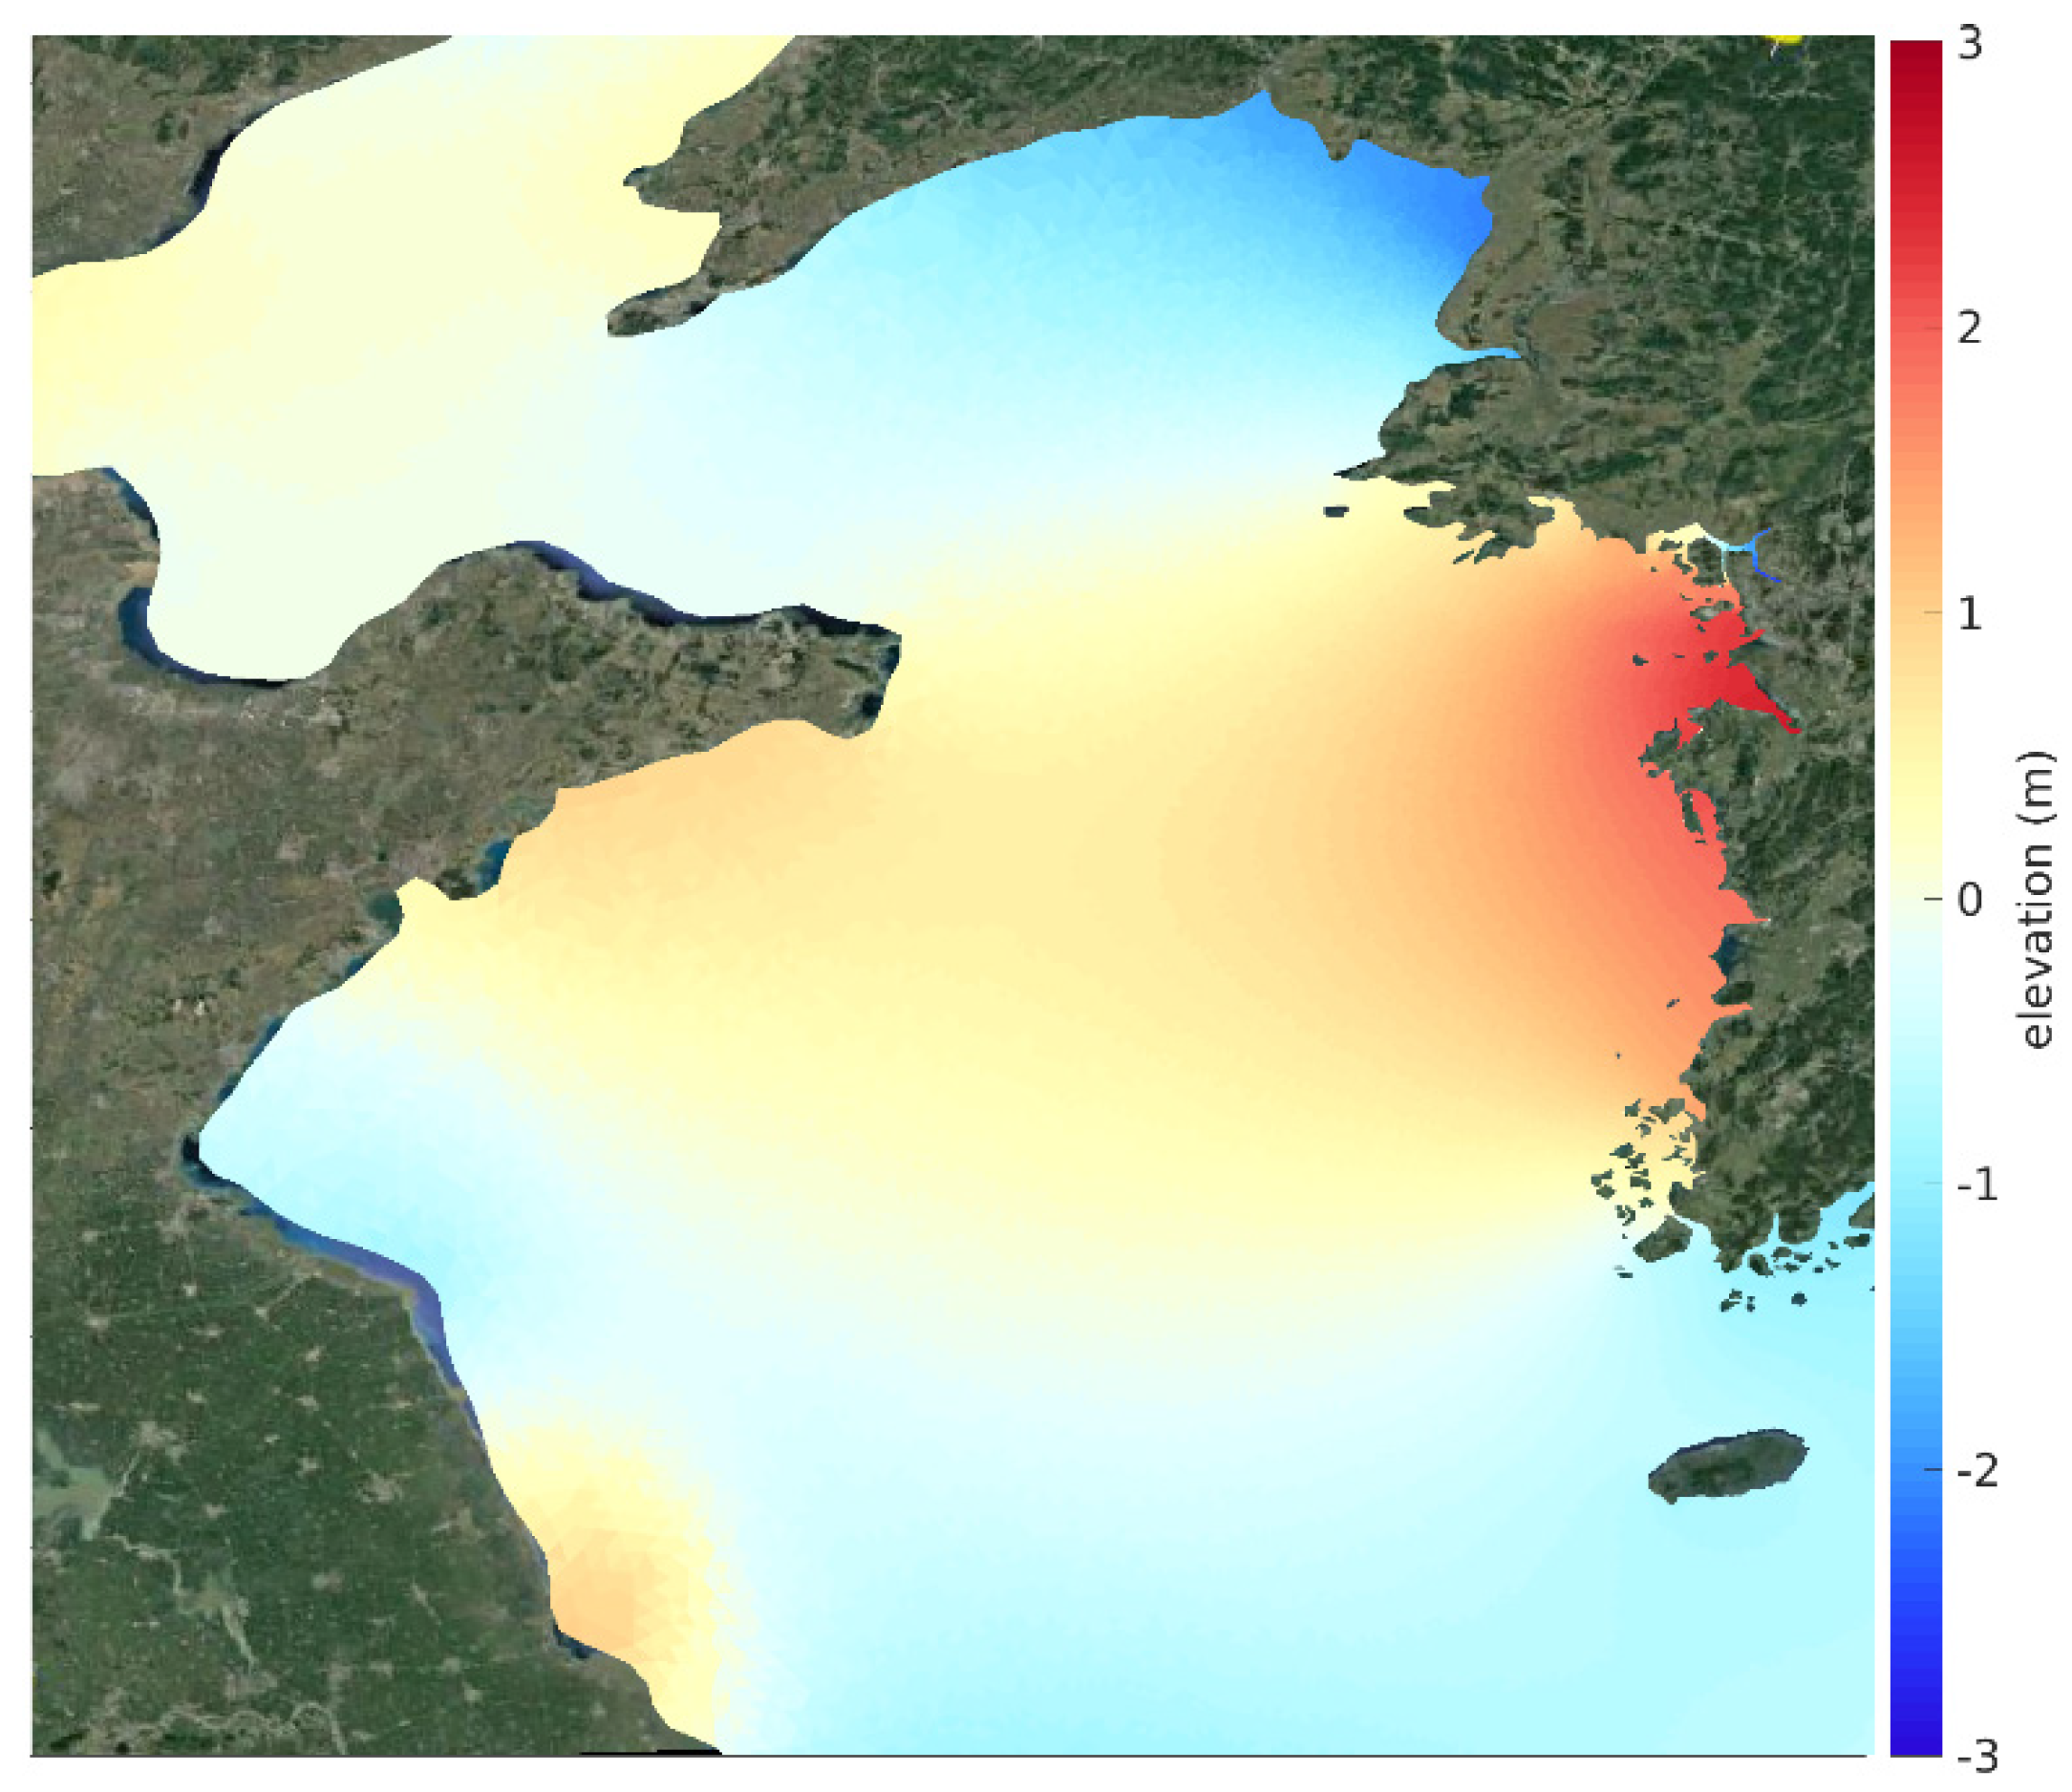
The time interval for the model integration was 1 s. Similarly to the other experiments, the computational performance was evaluated without analyzing the accuracy of the simulation results due to the short simulation time. Figure 18 shows the SSH field for the simulation results in the KNL system (using 256 cores). The high tide was prominently simulated near the west coast of Korea.
NWP experiments were performed via the unique configuration of the grid (8,369,391 nodes, 10 layers) (refer to Table 3). We used 128, 256, and 512 cores for comparing the performances of the parallel systems according to the experimental results. In addition, a 1024 ultra-high resolution experiment was performed on the KNL system for testing performance limits.
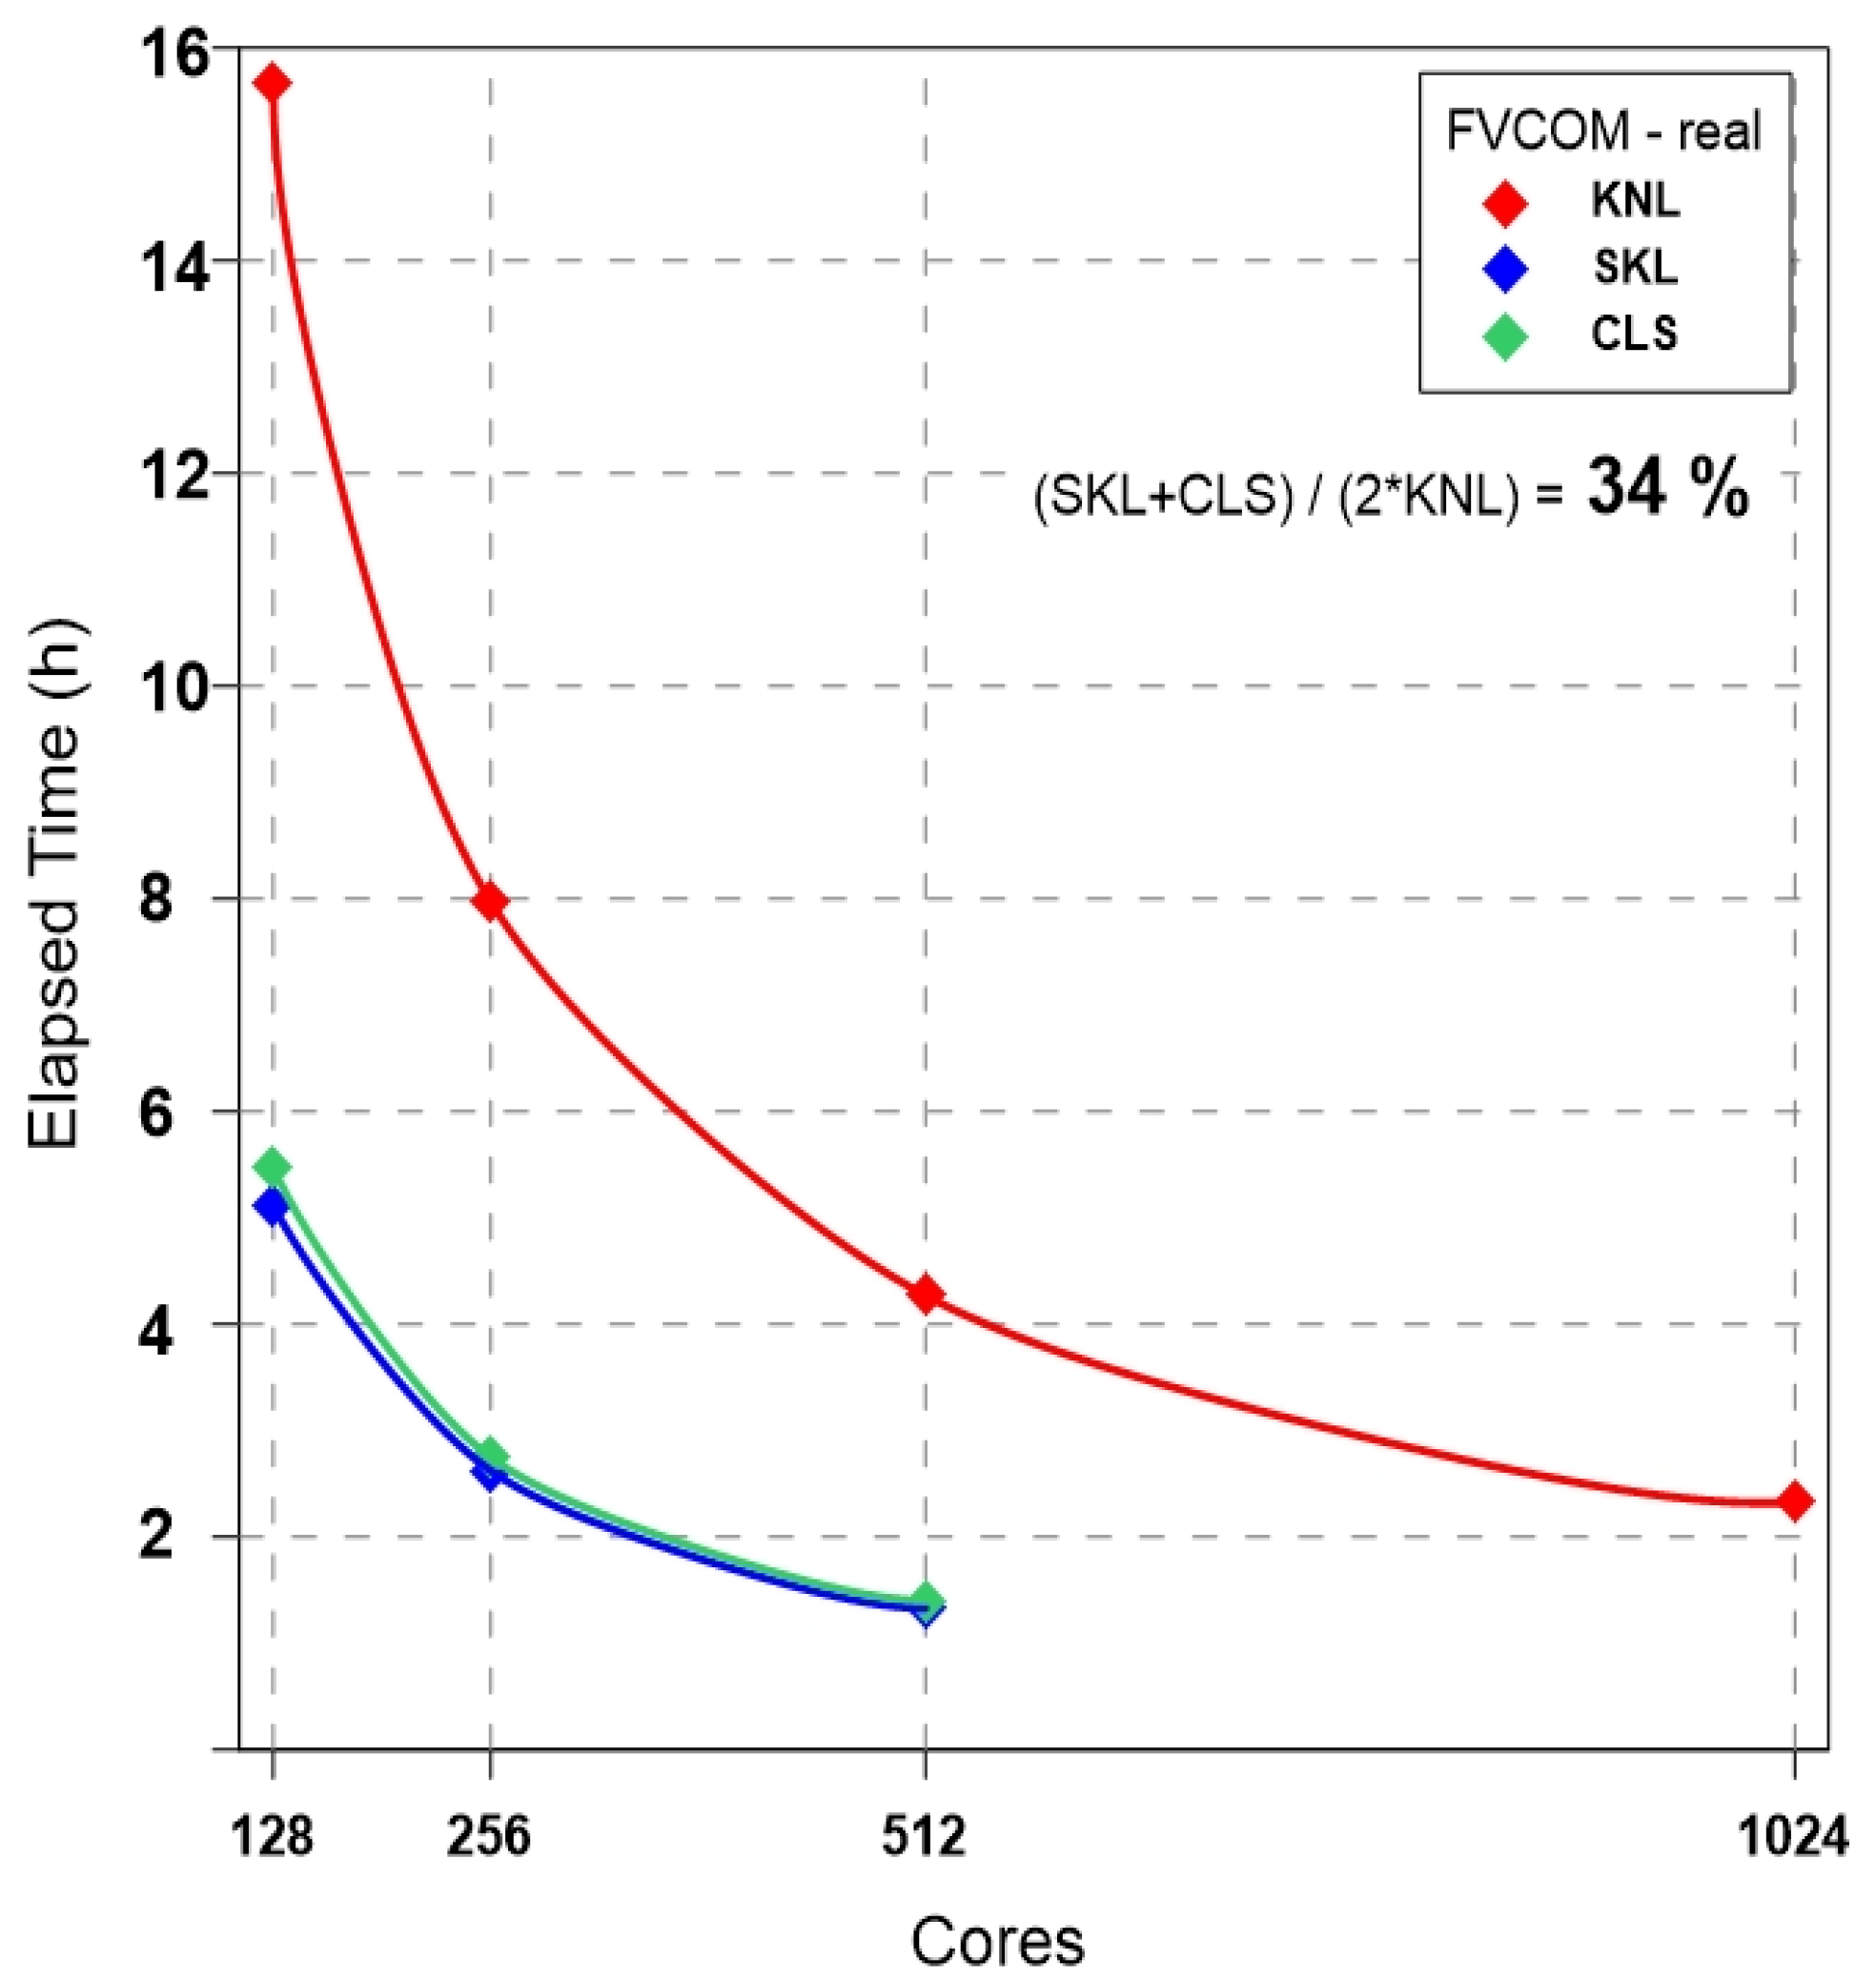
The results of each experiment are summarized in Figure 19. The KNL system performed at an overall rate of approximately 34% compared to the performances SKL and CLS. This is slightly slower than the benchmark experiment of FVCOM (44%) due to the loads of I/O accessing. The calculation amounts were different between cores because of the different I/O loads. The performances of FVCOM in the CLS and SKL systems were almost the same, unlike those of WRF and ROMS (see the green and blue lines in Figure 20). This is due to the evenly distributed I/O loads per computed node characterizing the unstructured grid model. This dynamic continuously increased the parallel performance of the KNL system.

6. Discussion and Conclusions

The KNL system was developed with the advantage of GPGPU having 68 cores per CPU. Although the KNL system has more than twice as many cores per node as the Skylake system, the KNL system performs at approximately 1/3 of the performance rate of the Skylake system due to slow CPU clock speed and low memory. However, the performance rate of the Nurion KNL system was approximately 43% for all experiments, indicating that Nurion KNL system’s excellence. There is almost no difference in performance in the several runs of experiments, thereby indicating that the KNL system is very stable.
WRF, ROMS, and FVCOM were tested for optimization by core configuration, MPI libraries, various compiler options, memory modes and so on. In conclusion, the best approach is to compile with only the “xMIC-AVX512” compilation option in the cache memory mode. All 32 cores were used for the real experiments of ROMS and FVCOM because a large access of I/O caused out of memory. The performances of the real experiments were lower than those of the ideal experiments because the distributions of the calculated amounts are different between cores due to the differing I/O loads. Performances were compared between the SKL and the CLS systems based on the KNL system (Figure 20). When the same numbers of cores were used, the average performance of the KNL system was about 43% (highest: 64%, lowest: 31%) of SKL or CLS (128 cores: 46%, 256 cores: 43%, 512 cores: 39%).
Based on our results, if the computation performance of each model is listed in order from high to low, then it would WRF, ROMS, and FVCOM, and if the parallel efficiency of core numbers is listed in order from high to low, then it would 128, 256, and 512 cores. Ideal experiments with a low I/O showed a higher performance than the real experiments. The ROMS model showed similar performances in both ideal and real experiments compared to the other models.
It is more efficient to reduce the number of cores per node in a KNL system by half (36 cores) when the total number of cores is less than 256 cores, and it is economical to use all cores when using more than 256. Therefore, it is economical to use all cores of nodes and reduce the number of nodes when simulating ultra-high resolution models. In all experiments, the performance was continuously improved, even in the maximum core experiment (1024 cores), thereby indicating that the KNL system can sufficiently simulate ultra-high resolution models.

Author Contributions

Conceptualization, D.-H.K. and C.L.; data curation, D.-H.K. and C.L.; funding acquisition, M.J., J.A. and I.-J.M.; methodology, D.-H.K. and C.L.; project administration, S.-B.W.; resources, M.J., J.A. and I.-J.M.; supervision, D.-H.K.; writing—original draft preparation, C.L.; writing—review and editing, D.-H.K., C.L. and S.-B.W. All authors have read and agreed to the published version of the manuscript.

Funding

This research was part of the project titled “Improvements of ocean prediction accuracy using numerical modeling and artificial intelligence technology,” funded by the Ministry of Oceans and Fisheries, Korea.

Acknowledgments

We thank the Korean Institute of Ocean Science and Technology (KIOST).

Conflicts of Interest

The authors declare no conflict of interest.

References

  1. Sodani, A. Knights Landing (KNL): 2nd Generation Intel Xeon Phi Processor. In Proceedings of the IEEE Symposium on Hot Chips, Cupertino, CA, USA, 22–25 August 2015; pp. 1–24. [Google Scholar]
  2. Dell EMC Solutions. Application Performance of Intel Skylake and Intel Knights Landing Processors on Stampede2; Dell EMC Solutions: Round Rock, TX, USA, 2018; pp. 1–11. [Google Scholar]
  3. Cho, J.-Y.; Jin, H.-W.; Nam, D. Using the On-Package Memory of Manycore Processor for Improving Performance of MPI Intra-Node Communication. J. Kiise 2017, 44, 124–131, (In Korean with English abstract). [Google Scholar] [CrossRef]
  4. Butcher, N.; Oliver, S.L.; Berry, J.; Hammond, S.D.; Kogge, P.M. Optimizing for KNL Usage Modes When Data Doesn’t Fit in MCDRAM. In Proceedings of the 47th International Conference on Parallel Processing, Eugene, OR, USA, 13–16 August 2018; pp. 1–10. [Google Scholar]
  5. Rho, S.; Kim, S.; Nam, D.; Park, D.; Kim, J.-S. Enhancing the Performance of Multiple Parallel Applications using Heterogeneous Memory on the Intel’s Next-Generation Many-core Processor. J. Kiise 2017, 44, 878–886, (In Korean with English abstract). [Google Scholar] [CrossRef]
  6. Yoon, J.W.; Song, U.-S. System Characteristics and Performance Analysis in Multi and Many-core Architectures. J. Digit. Contents Soc. 2019, 22, 597–603, (In Korean with English abstract). [Google Scholar] [CrossRef]
  7. Ooyama, K.V. A thermodynamic foundation for modeling the moist atmosphere. J. Atmos. Sci. 1990, 47, 2580–2593. [Google Scholar] [CrossRef] [Green Version]
  8. Skamarock, W.C.; Klemp, J.B.; Dudhia, J.; Gill, D.O.; Barker, D.M.; Duda, M.G.; Huang, X.Y.; Wang, W.; Powers, J.G. A Description of the Advanced Research WRF Version 3. NCAR Technical Note NCAR/TN/475+STR. 2008. Available online: http://dx.doi.org/10.5065/D68S4MVH (accessed on 1 July 2019).
  9. Smagorinsky, J. General circulation experiments with the primitive equations. I. The basic experiment. Mon. Weather Rev. 1963, 91, 99. [Google Scholar] [CrossRef]
  10. Deardorff, J.W. Three-dimensional numerical study of turbulence in an entraining mixed layer. Bound.-Layer Meteorol. 1974, 7, 81. [Google Scholar] [CrossRef]
  11. Catalano, F.; Moeng, C.-H. Large-Eddy Simulation of the Daytime Boundary Layer in an Idealized Valley Using the Weather Research and Forecasting Numerical Model. Bound.-Layer Meteorol. 2010, 137, 49–75. [Google Scholar] [CrossRef] [Green Version]
  12. Moeng, C.-H.; Dudhia, J.; Klemp, J. Examining Two-Way Nesting for Large Eddy Simulation of the PBL Using the WRF Model. Mon. Weather Rev. 2007, 135, 2295–2311. [Google Scholar] [CrossRef]
  13. Shchepetkin, A.F.; McWilliams, J.C. The regional oceanic modeling system (ROMS): A split explicit, free surface, topography following coordinate oceanic model. Ocean Model. 2005, 9, 347–404. [Google Scholar] [CrossRef]
  14. NOAA. ETOPO2, 2-Minute Gridded Global Relied Data; National Geophysical Data Center; NOAA: Boulder, CO, USA, 2006. Available online: http://www.ngdc.noaa.gov/mgg/global/etopo2.html (accessed on 1 July 2019).
  15. Chen, C.; Beardsley, R.C.; Cowles, G. An unstructured grid, finite-volume coastal ocean model (FVCOM) system. Oceanography 2006, 19, 78–89. [Google Scholar] [CrossRef] [Green Version]
  16. Seo, S.-N. Digital 30 sec gridded bathymetric data of Korea marginal seas—KorBathy30s. J. Korean Soc. Coast. Ocean Eng. 2008, 20, 110–120, (In Korean with English abstract). [Google Scholar]
  17. Amante, C.; Eakins, B. ETOPO1 1 Arc-Minute Global Relief Model: Procedures, Data Sources and Analysis; Technical Memorandum NESDIS NGDC-24; NOAA: Boulder, CO, USA, 2009. Available online: http://www.ngdc.noaa.gov/mgg/global/global.html (accessed on 1 July 2019).
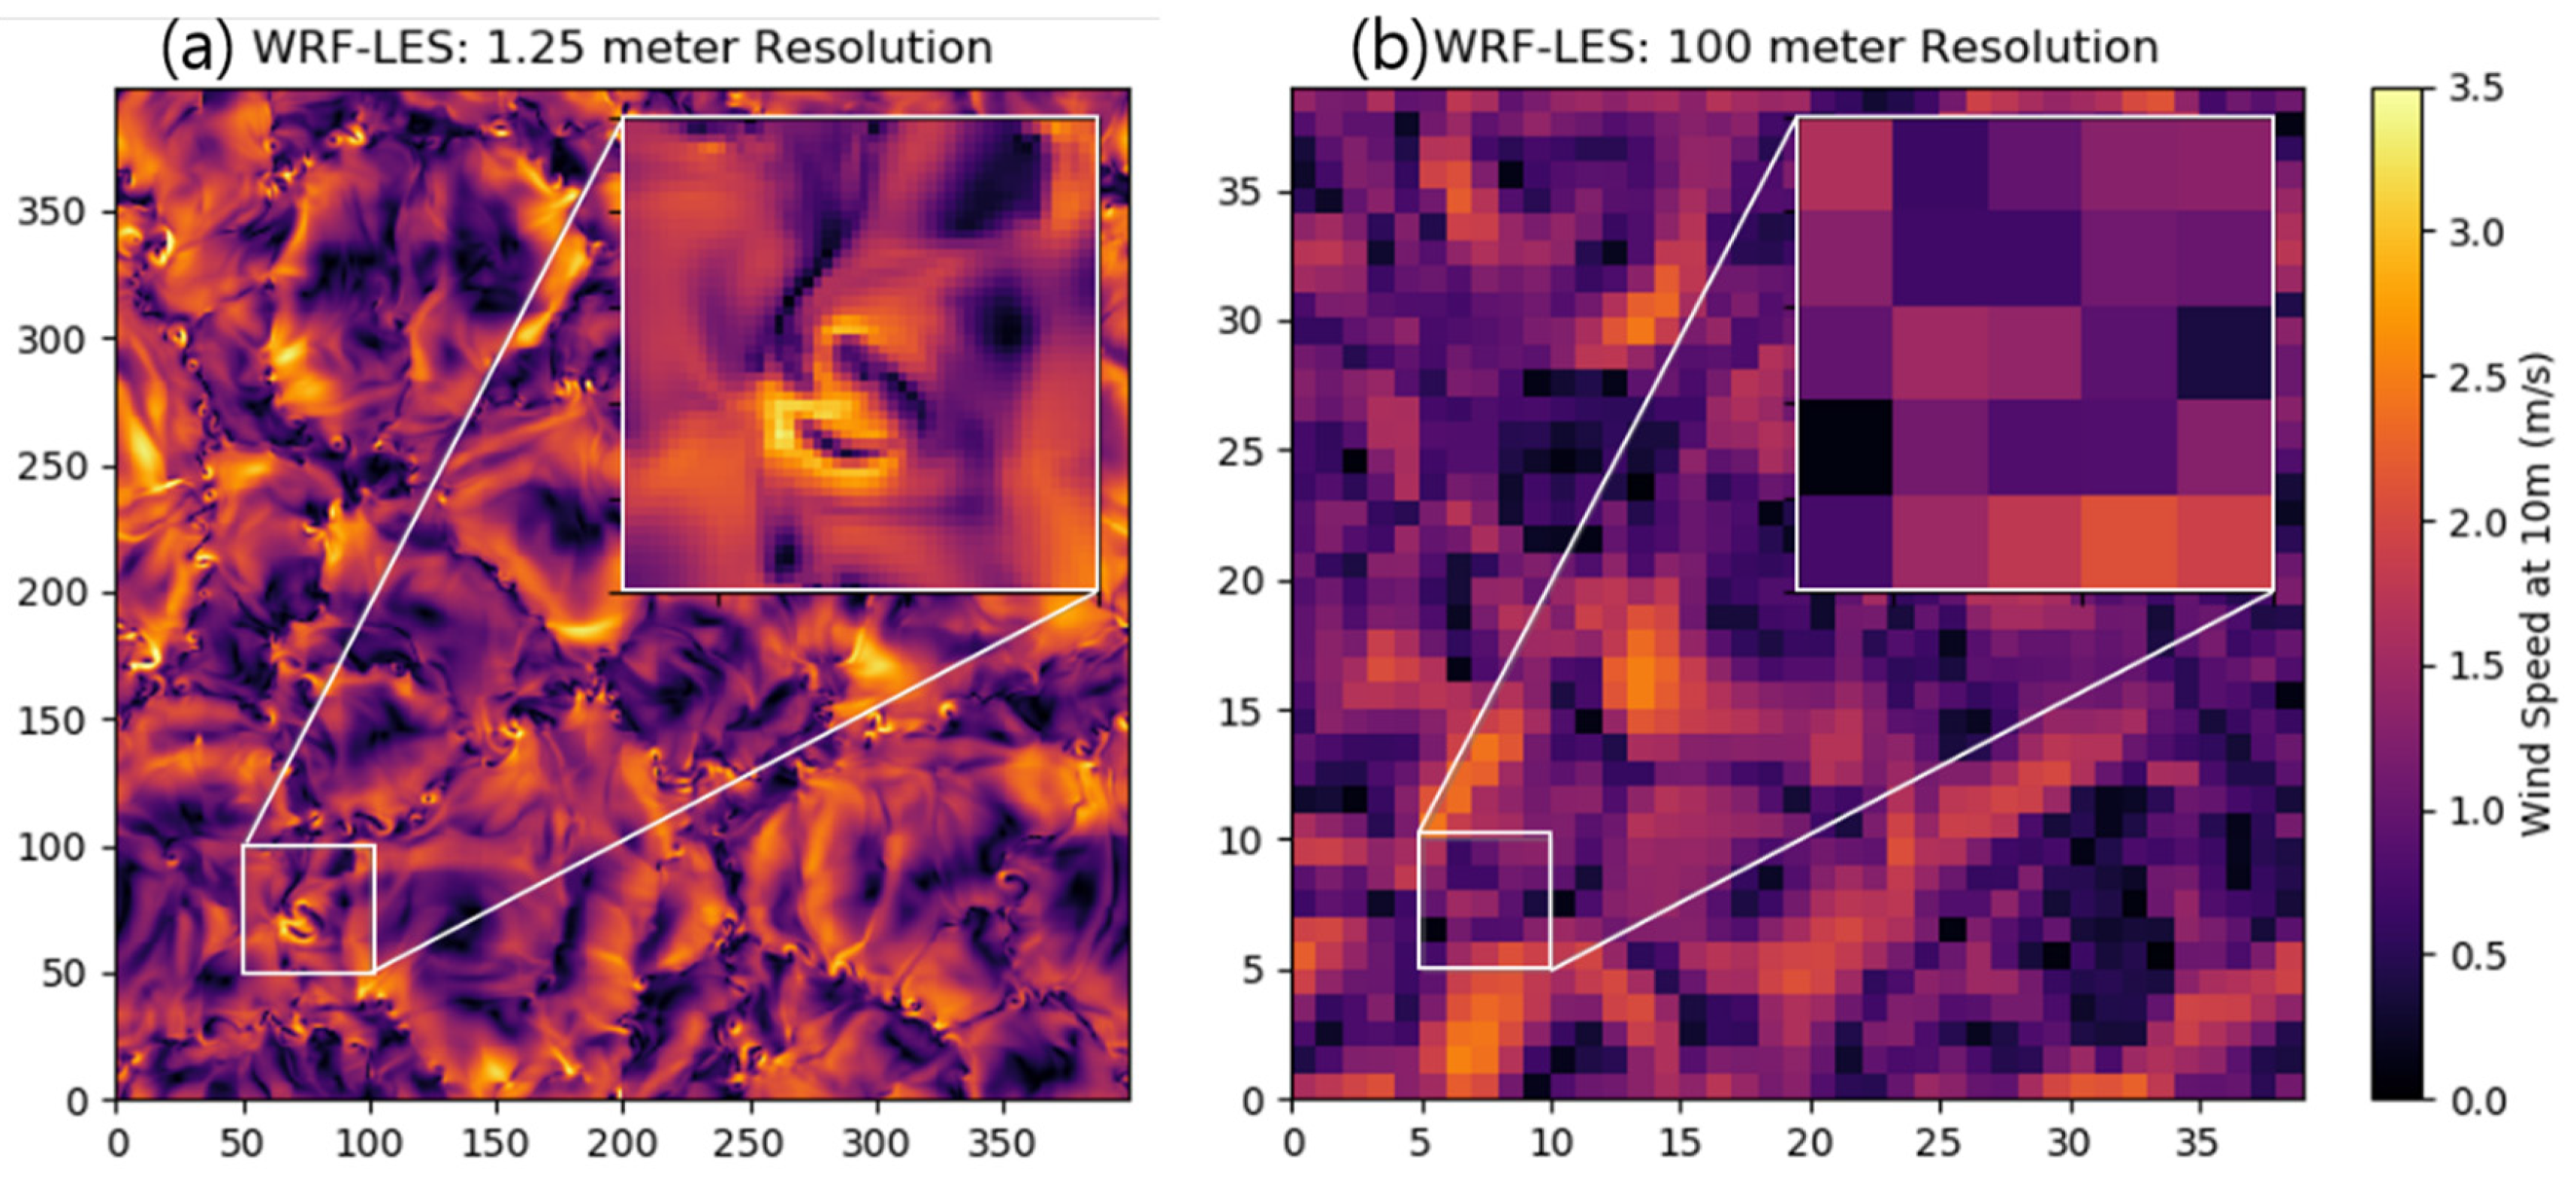
Figure 1. WRF-LES result: wind speed at 10 m. (a) dx = dy = 1.25 m (3200 × 3200 resolution), dt = 0.01 s. (b) dx = dy = 100 m (40 × 40 resolution), dt = 1 s.
Applsci 10 02883 g001
Figure 2. WRF-Large Eddy Simulation (LES) performances with respect to the number of cores for an ideal experiment: (SKL+CLS)/(2*KNL) = 54%.
Applsci 10 02883 g002
Figure 3. WRF-LES performances with respect to the number of cores per node in the KNL system for an ideal experiment (blue line: 64 cores, red line: 32 cores).
Applsci 10 02883 g003
Figure 4. WRF-LES performances using 8, 16, 32 and 64 cores per node while reducing the number of nodes in the KNL system.
Applsci 10 02883 g004
Figure 5. The simulation area of WRF-Northwestern Pacific Ocean (NWP); 2048 × 2048 resolution, dt = 5 s.
Applsci 10 02883 g005
Figure 6. Simulation results for Soulik and Cimaron typhoons using WRF-NWP. Colors: surface pressure, arrows: wind field at 10 m.
Applsci 10 02883 g006
Figure 7. Performances of WRF-NWP by the number of cores for the real experiment: (SKL+CLS)/(2*KNL) = 37%.
Applsci 10 02883 g007
Figure 8. WRF-LES performances with respect to the number of cores per node in the KNL system for the real experiment (blue line: 64 cores, red line: 32 cores).
Applsci 10 02883 g008
Figure 9. Ultra-high resolution experimental design using ROMS for an ideal case.
Applsci 10 02883 g009
Figure 10. Performances of the benchmark experiment by the number of cores using ROMS: (SKL+CLS)/(2*KNL) = 47%.
Applsci 10 02883 g010
Figure 11. ROMS benchmark performances using 8, 16, 32 and 64 cores per node while reducing node usage in the KNL system.
Applsci 10 02883 g011
Figure 12. Model area and depth of ROMS for the real experiment.
Applsci 10 02883 g012
Figure 13. Real experimental results using ROMS during the period of typhoons Soulik and Cimaron: colors = SST, arrows = sea surface currents.
Applsci 10 02883 g013
Figure 14. Performances of ROMS-NWP with respect to the number of cores for the real experiment: (SKL+CLS)/(2*KNL) = 44%.
Applsci 10 02883 g014
Figure 15. Enlarged unstructured triangular grids (left) and the experimental configuration (right) for the FVCOM ideal case. The total number of grid points (=nodes) is 10,392,925.
Applsci 10 02883 g015
Figure 16. Performances of FVCOM-Benchmark by the number of cores for the ideal experiment: (SKL+CLS)/(2*KNL) = 44%.
Applsci 10 02883 g016
Figure 17. Ultra-high resolution grid for FVCOM-NWP.
Applsci 10 02883 g017
Figure 18. Tide simulation results using an ultra-high resolution grid of FVCOM-NWP.
Applsci 10 02883 g018
Figure 19. Performances of FVCOM-NWP with respect to the number of cores for the real experiment: (SKL+CLS)/(2*KNL) = 34%.
Applsci 10 02883 g019
Figure 20. Parallelization efficiency by model (WRF, ROMS and FVCOM) depending on the number of cores (128, 256 and 512).
Applsci 10 02883 g020
Table 1. Summarized specifications for Nurion (Knights Landing (KNL) and Skylake (SKL)) and a general cluster system (CLS).
CategoryKNLSKLCLS
Manufacturer and modelIntel Xeon Phi 7250
KnightsLanding
Intel Xeon 6148
Skylake
Intel Xeon Gold 6140
Number of nodes830513216
CPU × cores per node1 × 68 = 682 × 20 = 402 × 18 = 36
Clock speed1.4 GHz2.4 GHz2.3 GHz
Main Memory16 GB (MCDRAM),
96 GB
192 GB252 GB
File SystemLustreLustreLustre
CompilerIntel v17.0.5
Intel v19.0.4
Intel v17.0.5
Intel v19.0.4
Intel 18.0.4
MPI Libraryopenmpi v3.1.0
impi v19.0.4
openmpi v3.1.0
impi v19.0.4
openmpi v3.1.1
NetCDF Librarynetcdf v4.6.1netcdf v4.6.1netcdf v4.4.4
Compiler Options-fp-model consistent
-ip–O3–no–prec–div
-static-intel
-xMIC-AVX512
-fp-model consistent
-ip–O3–no–prec–div
-static-intel
-xCORE-AVX512
-fp-model consistent
-ip–O3–no–prec–div
-static -intel
Table 2. Experimental model configurations.
Ideal Experiments
(Case: Grid Resolution)
Real Experiments
WRFLarge Eddy Simulation
: (3200 × 3200) grids × 10 layers
NWP, Typhoon Soulik and Cimaron
: (2048 × 2048) grids × 33 layers
ROMSBenchmark
: (8192 × 1024) grids × 30 layers
NWP, Typhoon Soulik and Cimaron
: (2048 × 2048) grids × 33 layers
FVCOMBenchmark
: 10,398,925 nodes × 31 layers
NWP, Tide case
: 8,369,391 nodes × 10 layers
Table 3. Experimental configuration by system (KNL, SKL and CLS) (n: node, c: core, W: Weather Research and Forecasting System (WRF), R: Regional Ocean Modeling System (ROMS), F: Unstructured Grid Finite Volume Community Ocean Model (FVCOM), i: ideal experiment, r: real experiment).
ExperimentKNLCLSSKL
128 cores16n × 8c (W-ir), 8n × 16c (W-ir)
4n × 32c (R&F-r), 2n × 64c (W-ir, R&F-i)
4n × 32c
(W&R&F-ir)
4n × 32c
(W&R&F-ir)
256 cores32n × 8c (W-ir), 16n × 16c (W-ir)
8n × 32c (R&F-r), 4n × 64c (W-ir, R&F-i)
8n × 32c
(W&R&F-ir)
8n × 32c
(W&R&F-ir)
512 cores64n × 8c (W-ir), 32n × 16c (W-ir)
16n × 32c (R&F-r), 8n × 64c (W-ir, R&F-i)
16n × 32c
(W&R&F-ir)
16n × 32c
(W&R&F-ir)
1024 cores128n × 8c (W-ir), 64n × 16c (W-ir)
32n × 32c (R&F-r), 16n × 64c (W-ir, R&F-i)
--