Article

Two-Color Quantum Correlation between Down-Conversion Beams at 1.5 and 3.3 μm from a Singly Resonant Optical Parametric Oscillator

1
State Key Laboratory of Quantum Optics and Quantum Optics Devices, Institute of Opto-Electronics, Shanxi University, Taiyuan 030006, China
2
Collaborative Innovation Center of Extreme Optics, Shanxi University, Taiyuan 030006, China
*
Author to whom correspondence should be addressed.
Appl. Sci. 2020, 10(8), 2698; https://doi.org/10.3390/app10082698
Submission received: 26 March 2020 / Revised: 10 April 2020 / Accepted: 11 April 2020 / Published: 14 April 2020
(This article belongs to the Section Quantum Science and Technology)

Abstract

:
We demonstrated a two-color quantum correlation between the down-conversion beams with a telecommunication wavelength at 1.5 μm and mid-infrared wavelength at 3.3 μm generated by a singly resonant optical parametric oscillator (SRO) operated above the pump threshold with a magnesium-oxide doped periodically-poled lithium niobate crystal in the cavity. A maximum of 1.8 dB noise reduction of the intensity difference of the twin beams was measured at the analysis frequency of 5 MHz. Based on a theoretical model for the quantum correlation between the twin beams given by a semi-classical approach, the influence of the analysis frequency and pump parameter on the quantum correlation between the twin beams was discussed theoretically and experimentally. The quantum correlation between the twin beams was degraded at the analysis frequencies above 5 MHz due to the limitation of the bandwidth of SRO cavity and was degraded at the analysis frequencies below 5 MHz due to the excess intensity noise of the pump. The two-color quantum correlated twin beams at 1.5 and 3.3 μm have potential applications in high-precision measurements beyond the shot noise level.

1. Introduction

Continuous wave (CW) light beams that exhibit nonclassical statistics and quantum correlation are of interest for fundamental tests of quantum physics, and potential applications including high-precision measurements beyond the shot-noise level (SNL) and quantum information such as quantum key distribution and quantum teleportation [1,2,3,4,5,6]. The common method to generate quantum correlated light beams is using an optical parametric oscillator (OPO) with a nonlinear crystal in the cavity [7,8,9,10,11,12]. In 1987, the quantum correlated twin beams generated by OPO was firstly proposed [7], and the intensity difference fluctuations of the twin beams below the corresponding SNL was experimentally observed [8]. Furthermore, with the help of high-quality nonlinear crystals, high-level quantum correlations between down-conversion beams from OPO could be obtained [9,10,11,12]. In these studies, the frequencies of quantum-correlated twin beams (the signal and idler beams) were degenerate, and polarizations of that were orthogonal. However, the quantum-correlated beams with different frequencies have significant advantages when they are used in the above-mentioned applications. As a matter of fact, the optical entangled state with different frequencies, which is an essential quantum source for constructing continuous variable (CV) quantum information networks and establishing connections between systems with different natures, consists of two sub-modes with quantum correlation at different frequencies between the quadrature amplitudes and between the quadrature phases [13,14,15]. In recent years, two-color, even three-color quantum correlations between signal-idler or pump-signal-idler beams were demonstrated using a non-degenerate optical parametric oscillator (NOPO) with doubly or triply resonant configurations [13,14,15,16,17]. The two-color quantum correlated beams at 0.8 and 1.5 μm can be utilized directly to make a connection between a quantum memory device based on alkaline atoms and a quantum communication device based on telecommunication optical fibers [16,17]. In addition, the quantum-correlated twin beams had been successfully employed to improve the sensitivity beyond the SNL for signal recovery, absorption measurement, two-photon absorption spectroscopy, and realize the sub-shot-noise imaging of weak absorbing objects [18,19,20,21,22,23,24]. When a light beam transmits an absorbing medium, the absorption spectroscopy can be directly recorded with light frequency scanning through resonance. The sensitivity of the measurement is limited by the intensity noise of the light beam, which is usually above or near the SNL. If one of the quantum correlated twin beams is used to transmit an absorbing medium, the quantum correlation between twin beams would be partially destroyed because the absorptions are regarded as kinds of losses. The absorption signal can be measured precisely according to the change of the quantum correlation between twin beams. Owing to the possibility of the intensity difference fluctuations of twin beams being reduced below the SNL, sub-shot-noise high-sensitivity absorption spectroscopy would be realized [18,19]. It is well known that the light beam at the telecommunication wavelength of 1.5 μm is particularly suitable for distribution over long-distance optical fibers because the attenuation of light beam at 1.5 μm is as low as 0.17 dB/km in optical fibers [25], while various hydrocarbons, hydrochlorides, soil pollutants, components of human breath, and some explosive agents display strong absorption features in the range of 3.3 μm [26,27,28]. So, the two-color quantum-correlated twin beams at 1.5 and 3.3 μm are of interest for high-precision measurements beyond the SNL using a 3.3 μm beam and for optical signal distribution over long-distance optical fiber using a 1.5 μm beam.
The two-color quantum correlation between twin beams was usually obtained using NOPO with doubly or triply resonant configurations [13,14,15,16,17]. However, stable operation and frequency tuning continuously without mode hopping are difficult to achieve using doubly or triply resonant NOPOs because simultaneous cavity resonance conditions should be fulfilled. In this case, the stability of system will be reduced, and the level of quantum correlation between twin beams will be limited. Two-color nonclassical states can be achieved experimentally using a singly resonant OPO (SRO) in which only the signal is resonant in the cavity [29,30]. Using this configuration of SRO, continuous tuning without mode hopping can be realized by locking the transmission peak of intra-cavity etalon to the oscillating mode of SRO [31,32,33,34]. SRO is a good choice to generate two-color quantum correlated twin beams that are large frequency separated.
In this paper, down-conversion beams with a telecommunication wavelength at 1.5 μm and a mid-infrared wavelength at 3.3 μm were generated experimentally from an SRO operated above the pump threshold with a magnesium-oxide doped periodically-poled lithium niobate (MgO:PPLN) crystal in the cavity. The two-color quantum correlation between the generated down-conversion beams was detected using home-made high-gain broad bandwidth detectors at 3.3 μm and 1.5 μm. A theoretical model for the two-color quantum correlation between the twin beams was given using a semi-classical approach. Then, the influence of the analysis frequency and pump parameter on the quantum correlation between twin beams was discussed theoretically and experimentally.

2. Theoretical Analysis

An SRO device, which is pumped by a fundamental wave (ωp), is shown in Figure 1. The two-color quantum correlation between the signal (ωs) and idler (ωi) can be observed when the SRO is operated above the pump threshold. A type-I phase matched periodical poled nonlinear crystal is employed in the cavity. The signal is resonant in a ring cavity. The idler and pump single pass through the nonlinear crystal. αp,in is the input mode operator of pump. αs,in and βs,in are the coupled vacuum mode operator introduced by the coupling mirror of the signal and other intra-cavity losses, respectively. αp (αs, αi) is the pump (signal, idler) mode operator in the cavity. αp,out (αs,out, αi,out) is the output mode operator of pump (signal, idler).
The fluctuation characteristics of the SRO emission can be computed simply using a semi-classical approach [35,36]. The quantum Langevin equations of motion for the intra-cavity modes can be expressed by
{ τ α ˙ s + ( γ + i φ ) α s = 2 χ α p α i * + 2 γ s α s , i n + 2 μ s β s , i n α i = χ α s * α p α p = α p , i n χ α s α i ,
where τ is the cavity round-trip time of the signal. γ is the total intra-cavity losses, γ = γs + μs, γs is the intra-cavity losses due to the output coupler transmission, γs = ts2/2, ts is the transmission of the output coupler of the signal, and μs is the other intra-cavity losses include crystal absorption, surface scattering, and imperfections of mirrors. χ is the second-order nonlinear coefficient of the nonlinear crystal. φ is the detuning between the round-trip phase of the signal and the cavity resonance. Generally, φ is assumed to be small.
The input–output relations of down-conversion modes are given by
{ α s , o u t = 2 γ s α s α s , i n α i , o u t = 2 γ i α i ,
where γi is the intra-cavity losses of the idler due to the output coupler transmission.
The stationary mean fields α ¯ j (j = p, s, i) can be calculated considering vacuum input α ¯ s , i n = β ¯ s , i n = 0 . α ¯ p , i n is the mean field of the pump. The stationary state equation for the intra-cavity modes can be written as
{ ( γ + i φ ) α ¯ s = 2 χ α ¯ p α ¯ i * α ¯ i = χ α ¯ s * α ¯ p α ¯ p = α ¯ p , i n χ α ¯ s α ¯ i .
The pump threshold of SRO is α p , t h = ( γ 2 + φ 2 ) 1 / 4 / 2 χ , which can be obtained using Equation (3). The pump parameter is defined as σ = α p , i n / α p , t h . The mean fields of signal and idler in the cavity can be written as
{ α ¯ s = ( σ 1 ) 1 / 2 / χ α ¯ i = ( σ 1 ) 1 / 2 ( γ 2 + φ 2 ) 1 / 4 / 2 χ .
In order to obtain the fluctuation dynamics, we linearize Equation (1) for small fluctuations δ α j (j = p, s, i) around the mean field value of α ¯ j , and the fluctuation equations of the signal and idler in the cavity can be obtained as
{ τ δ α ˙ s + ( γ + i φ ) δ α s = 2 χ α ¯ p δ α i * + 2 χ α ¯ i δ α p + 2 γ s δ α s , i n + 2 μ s δ β s , i n δ α i = χ α ¯ s δ α p , i n χ 2 α ¯ s α ¯ s δ α i χ 2 α ¯ s α ¯ i δ α s + χ α ¯ p δ α s .
Hence, combining Equations (4) and (5) leads to
{ τ δ α ˙ s + ( γ + i φ ) δ α s = 2 ( σ 1 ) 1 / 2 ( γ 2 + φ 2 ) 1 / 4 σ ( δ α p , i n * + δ α p , i n ) + 2 γ s δ α s , i n + 2 μ s δ β s , i n σ δ α i = ( σ 1 ) 1 / 2 δ α p , i n ( σ 1 ) ( γ 2 + φ 2 ) 1 / 4 2 δ α s + ( γ 2 + φ 2 ) 1 / 4 2 δ α s .
The fluctuations of amplitude and phase quadratures can be defined as δ X j = δ a j + δ a j * and δ Y j = i ( δ a j δ a j * ) . Taking the Fourier transform of Equation (6), the fluctuation equations of signal and idler in the cavity can be expressed by
{ ( ω τ + φ ) δ Y s ( ω ) + γ δ X s ( ω ) = 2 2 ( σ 1 ) 1 / 2 ( γ 2 + φ 2 ) 1 / 4 σ δ X p , i n ( ω ) + 2 γ s δ X α s , i n ( ω ) + 2 μ s δ X β s , i n ( ω ) ( ω τ + φ ) δ X s ( ω ) + γ δ Y s ( ω ) = 2 γ s δ Y α s , i n ( ω ) + 2 μ s δ Y β s , i n ( ω ) σ δ X i ( ω ) = ( σ 1 ) 1 / 2 δ X p , i n ( ω ) + ( γ 2 + φ 2 ) 1 / 4 2 ( 2 σ ) δ X s ( ω ) σ δ Y i ( ω ) = ( σ 1 ) 1 / 2 δ Y p , i n ( ω ) + ( γ 2 + φ 2 ) 1 / 4 2 ( 2 σ ) δ Y s ( ω ) ,
where ω is the analysis frequency with the unit of hertz. The fluctuations for the amplitude quadrature of signal and idler in the cavity can be expressed by
{ δ X s ( ω ) = 2 2 γ ( σ 1 ) 1 / 2 ( γ 2 + φ 2 ) 1 / 4 σ δ X p , i n ( ω ) + γ 2 γ s δ X α s , i n ( ω ) + γ 2 μ s δ X β s , i n ( ω ) ( ω τ + φ ) 2 + γ 2 + ( ω τ + φ ) 2 γ s δ Y α s , i n ( ω ) + ( ω τ + φ ) 2 μ s δ Y β s , i n ( ω ) ( ω τ + φ ) 2 + γ 2 δ X i ( ω ) = ( σ 1 ) 1 / 2 σ δ X p , i n ( ω ) + ( 2 σ ) ( γ 2 + φ 2 ) 1 / 4 2 δ X s ( ω ) ,
Using the input–output relation of Equation (2), the output variance for the amplitude quadrature of the output signal and idler can be deduced as
{ V a r ( δ X s , o u t ) = 1 + 16 γ 2 γ s A C 2 σ 2 D 2 V a r ( δ X p ) V a r ( δ X i , o u t ) = 2 γ γ i B 2 C 2 σ 2 D + ( 2 γ i A σ 2 + 8 γ γ i A B C 2 σ 3 D + 8 γ 2 γ i A B 2 C 4 σ 4 D 2 ) V a r ( δ X p ) ,
where A = ( σ 1 ) , B = ( 2 σ ) , C = ( γ 2 + φ 2 ) 1 4 , D = ( ω τ + φ ) 2 + γ 2 , and the variance of the vacuum mode introduced by the coupling mirror of signal and other intra-cavity losses is equal to 1, i.e., V a r ( δ X α s , i n ) = V a r ( δ X β s , i n ) = V a r ( δ Y α s , i n ) = V a r ( δ Y β s , i n ) = 1 . V a r ( δ X p ) is the variance for the amplitude quadrature of the pump.
The noise power spectrum of the intensity difference between the signal and idler can be written as
S o u t ( δ X s , o u t , δ X s , o u t ) = Δ 2 ( X s , o u t X i , o u t ) = 1 2 γ B C ( σ 2 γ i γ s γ i B C ) σ 2 D 8 γ A C [ 2 γ i γ s ( 2 γ σ B C 2 + σ 2 D ) γ i B C ( σ D + γ B C 2 ) 2 σ 2 γ s γ C ] 2 γ i σ 2 A D 2 σ 4 D 2 V a r ( δ X p )   ,
If the signal and idler are coherent states without quantum correlation, the intensity difference fluctuations of two beams is equal to the sum of their intensities; that is Δ 2 ( X s , o u t X i , o u t ) = X s , o u t + X i , o u t , which corresponds to the SNL. X s , o u t , X i , o u t are the intensity of the signal and idler, respectively. If the intensity difference fluctuations of the two beams satisfy the following relation of Δ 2 ( X s , o u t X i , o u t ) < X s , o u t + X i , o u t , the two beams are quantum correlated. According to Equation (10), the impact factors of spectrum of quantum correlation between the signal and idler include the pump parameter, the intra-cavity losses, the detuning, the analysis frequency, the cavity round-trip time of the signal, and the variance for the amplitude quadrature of the pump.

3. Experimental Setup

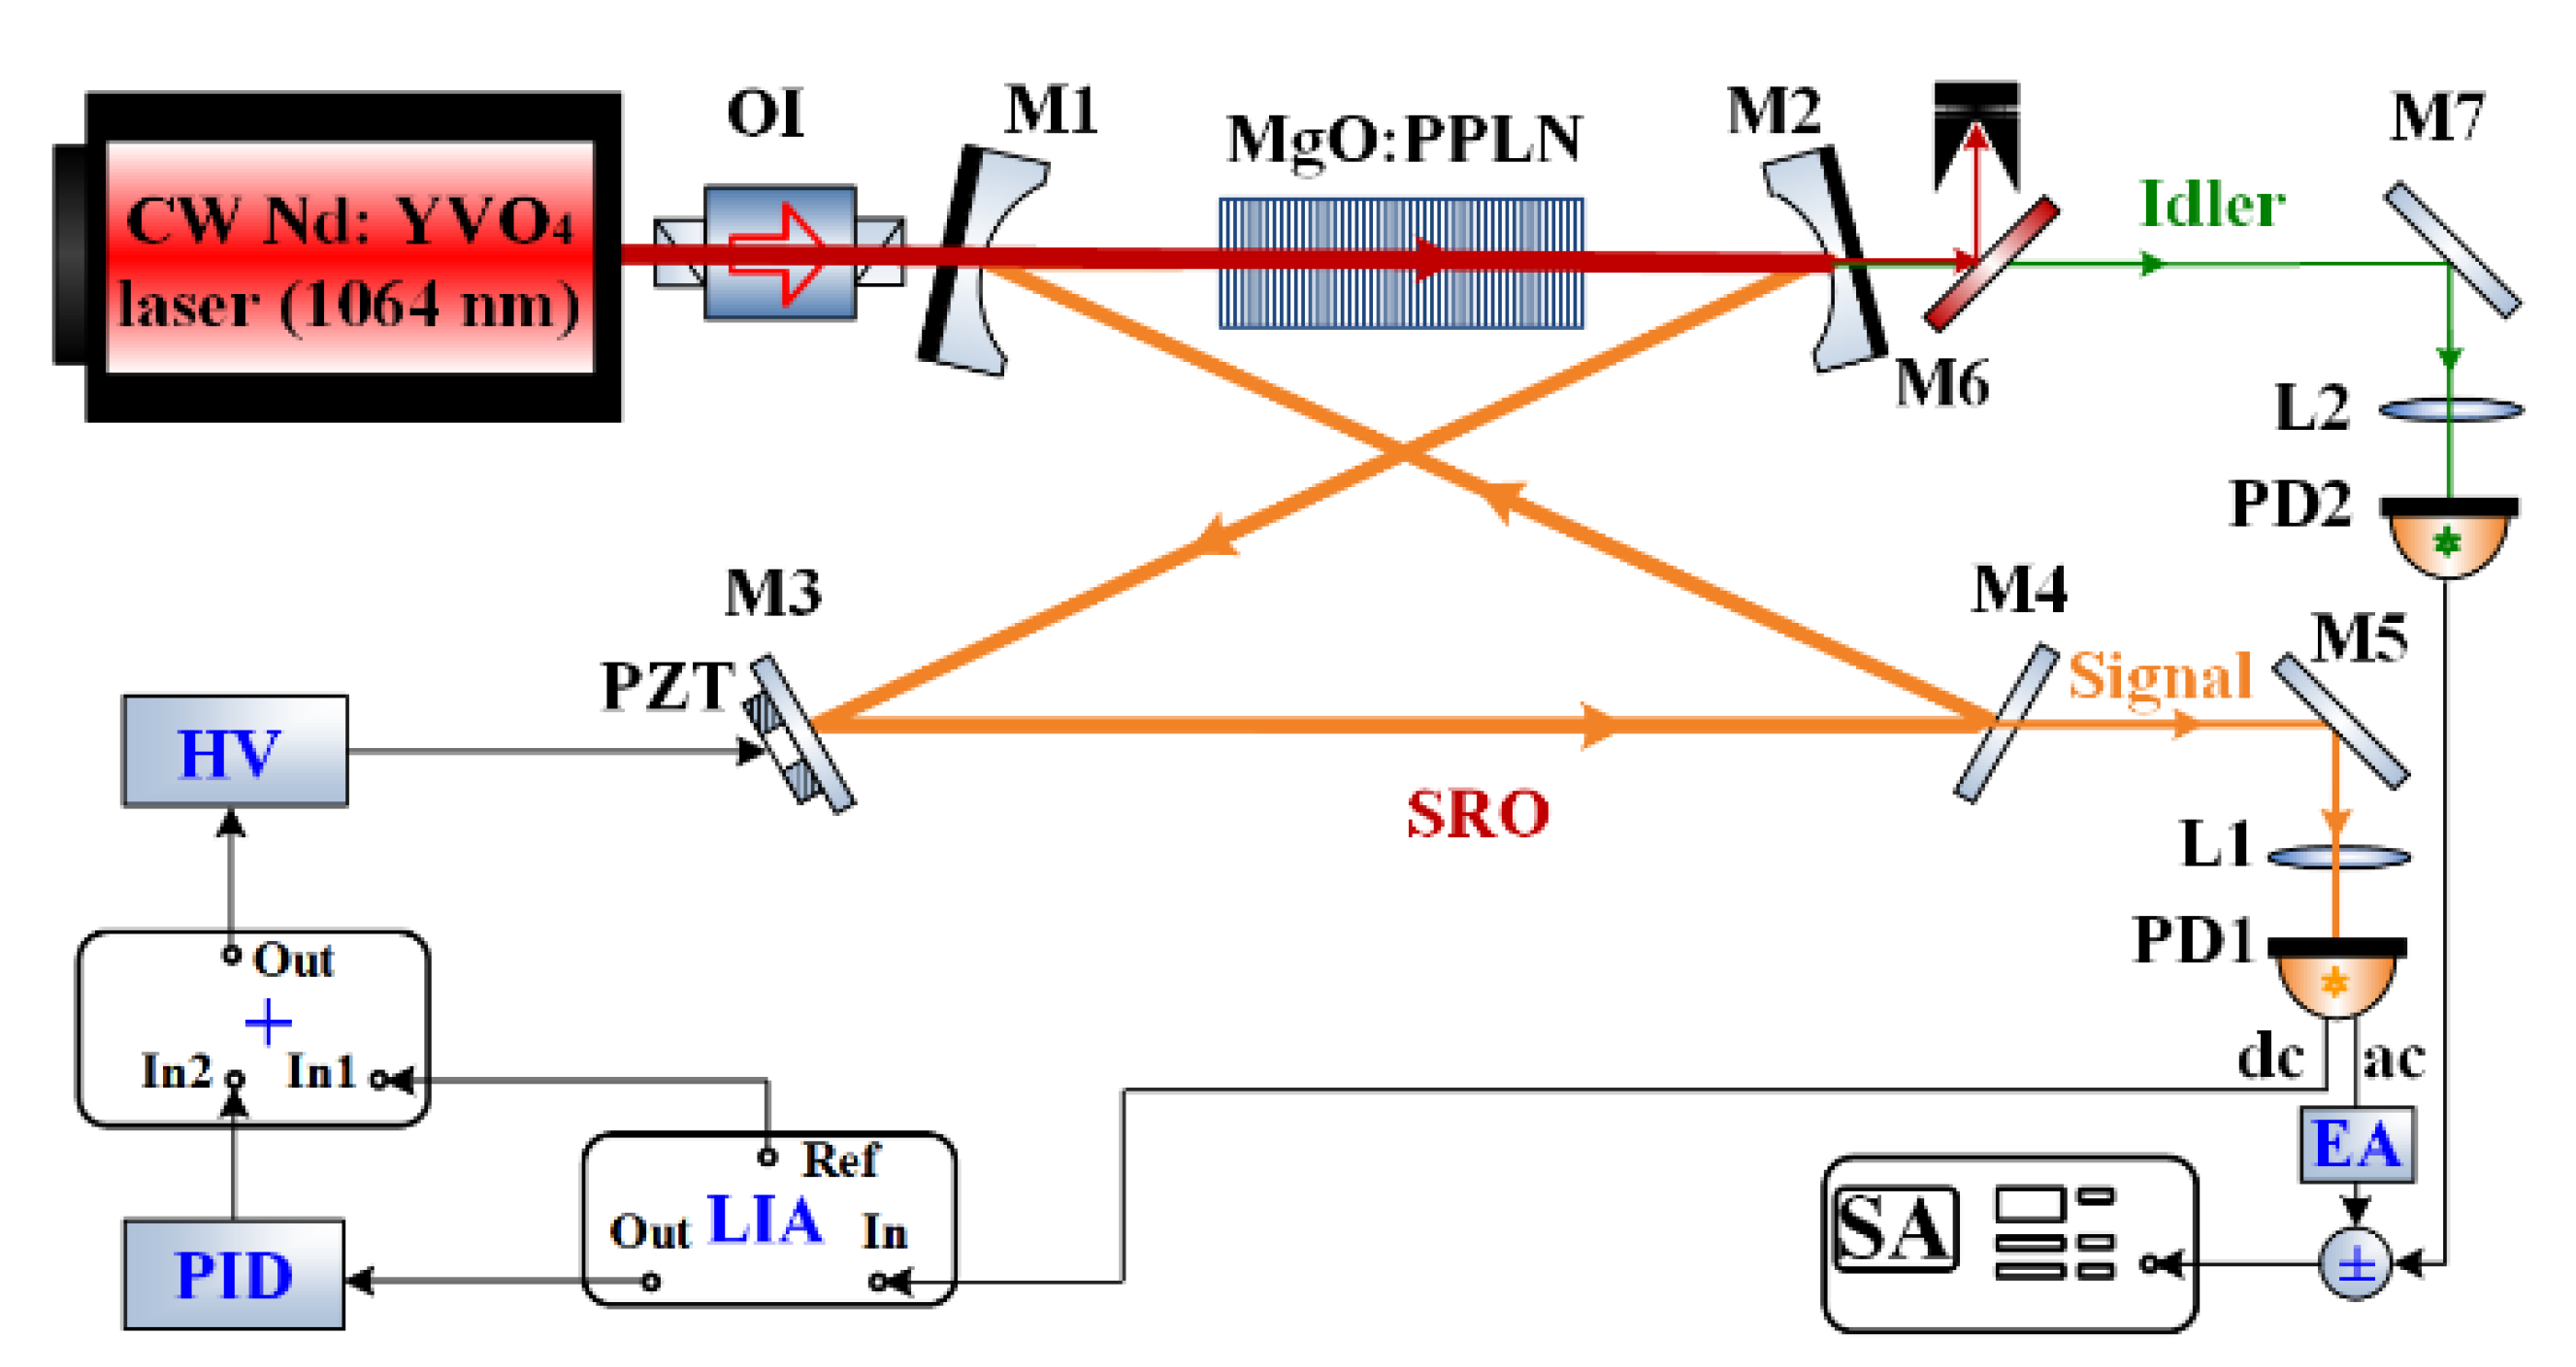
The schematic of the experimental setup used to generate the two-color quantum correlated down-conversion beams at 1.5 μm and 3.3 μm from an SRO is shown in Figure 2. The pump source was a home-made low noise CW single-frequency laser with output power of 30 watts at 1064 nm. An optical isolator (OI) was used to eliminate the back-reflection light of the infrared laser. The SRO was composed of two concave mirrors with a radii of 100 mm, two plane mirrors, and a type-I phase-matched MgO:PPLN crystal. Concave mirrors M1 and M2 provided high transmission (HT) for the pump and idler (T1064 nm & 3.3 μm > 95%) and high reflection (HR) for the signal (R1.5 μm > 99.8%). Plane mirror M3 was the HR for the signal (R1.5 μm > 99.8%). Plane mirror M4 was the output coupler for the signal, which provided partial transmission at 1.5 μm (T1.5 μm = 1.5%). Only the signal resonated in the ring cavity. The pump and idler single-passed MgO:PPLN crystal. Both end faces of MgO:PPLN were antireflection coated for 1.5 μm (R1.5 μm < 0.5%), 3.3 μm (R3.3 μm < 1%), and 1064 nm (R1064 nm < 2%). MgO:PPLN crystal, with dimensions of 30 mm (length) × 10 mm (width) × 1 mm (thickness) and a poling period of 30.6 μm, was housed in a copper oven and temperature-controlled by a homemade temperature controller with an accuracy of 0.01 °C. The concave mirror M3 was mounted on a piezo-electric transducer (PZT) to control the length of the SRO cavity. The optical cavity length of the SRO was 569 mm.
When the SRO was operated above the pump threshold, twin beams with two colors (1.5 and 3.3 μm) were generated. A dichroic beam splitter M6, coated for high reflectivity at 1064 nm and high transmissivity at 3.3 μm, was used to separate the two beams. The noise power of the signal at 1.5 μm and the idler at 3.3 μm was measured directly using the photodetectors (PD1 and PD2). The balance homodyne detection cannot be used because there were no suitable half-wave plates and polarization beam splitters for the 3.3 μm laser due to conventional silica-based glass having a high absorption at 3.3 μm. PD1 (ETX 500, Epitaxx) with a quantum efficiency of 90% was used to detect the signal at 1.5 μm. The photodiode works in photoconductive mode. The saturation power of PD1 can be increased by increasing the reverse bias, and the gain can be improved by fine tuning the feedback resistor. The measured saturation power of PD1 was 26 mW, and the clearance between the SNL and the electronic noise level (ENL) was more than 10 dB at a frequency range of 2–20 MHz with the incident power of 4 mW. PD2 (Lms-36PD-03-R, LED Microsensor NT) with a quantum efficiency of 60% was used to detect the idler at 3.3 μm. The working mode of the photodiode is photovoltaic mode. In this mode, the photodiode was used under no reverse bias, which means that there is no dark current. A high gain, low noise, and broad bandwidth detector for the 3.3 μm laser was designed by paralleling the feedback capacitor on the feedback resistor. The measured saturation power of PD2 was 8 mW, and the clearance between the SNL and ENL was more than 8 dB at a frequency range of 5–20 MHz with the incident power of 2 mW. The alternating currents (ac) from the two detectors were input with a positive/negative power combiner and recorded by a spectrum analyzer (SA). An electronic attenuator (EA) was used to attenuate the current output from PD1 to be equal to that from PD2 before the positive/negative power combiner. The direct currents (dc) from PD1 was used to lock the length of the SRO cavity employing the Pound–Drever–Hall (PDH) technique [37]. The intensity of the signal and idler are defined as I1 and I2, respectively. The noise of the intensity difference I = I1I2 between the two down-conversion beams is expected to be below the corresponding SNL. The corresponding SNL is the shot noise level for a beam with an intensity of I1 + I2 [8,9,10,11].

4. Experimental Results and Discussion

The measured pump threshold of the SRO was 7.3 W. When the pump power was 7.96 W, the SRO was operated above the threshold. The measured signal output was 10 mW and the idler output was 2 mW. The noise powers of the signal and idler were detected by PD1 and PD2 and recorded by an SA, respectively. The intensity noises of the signal and idler reach the SNL for analysis frequencies above 5 MHz, respectively.
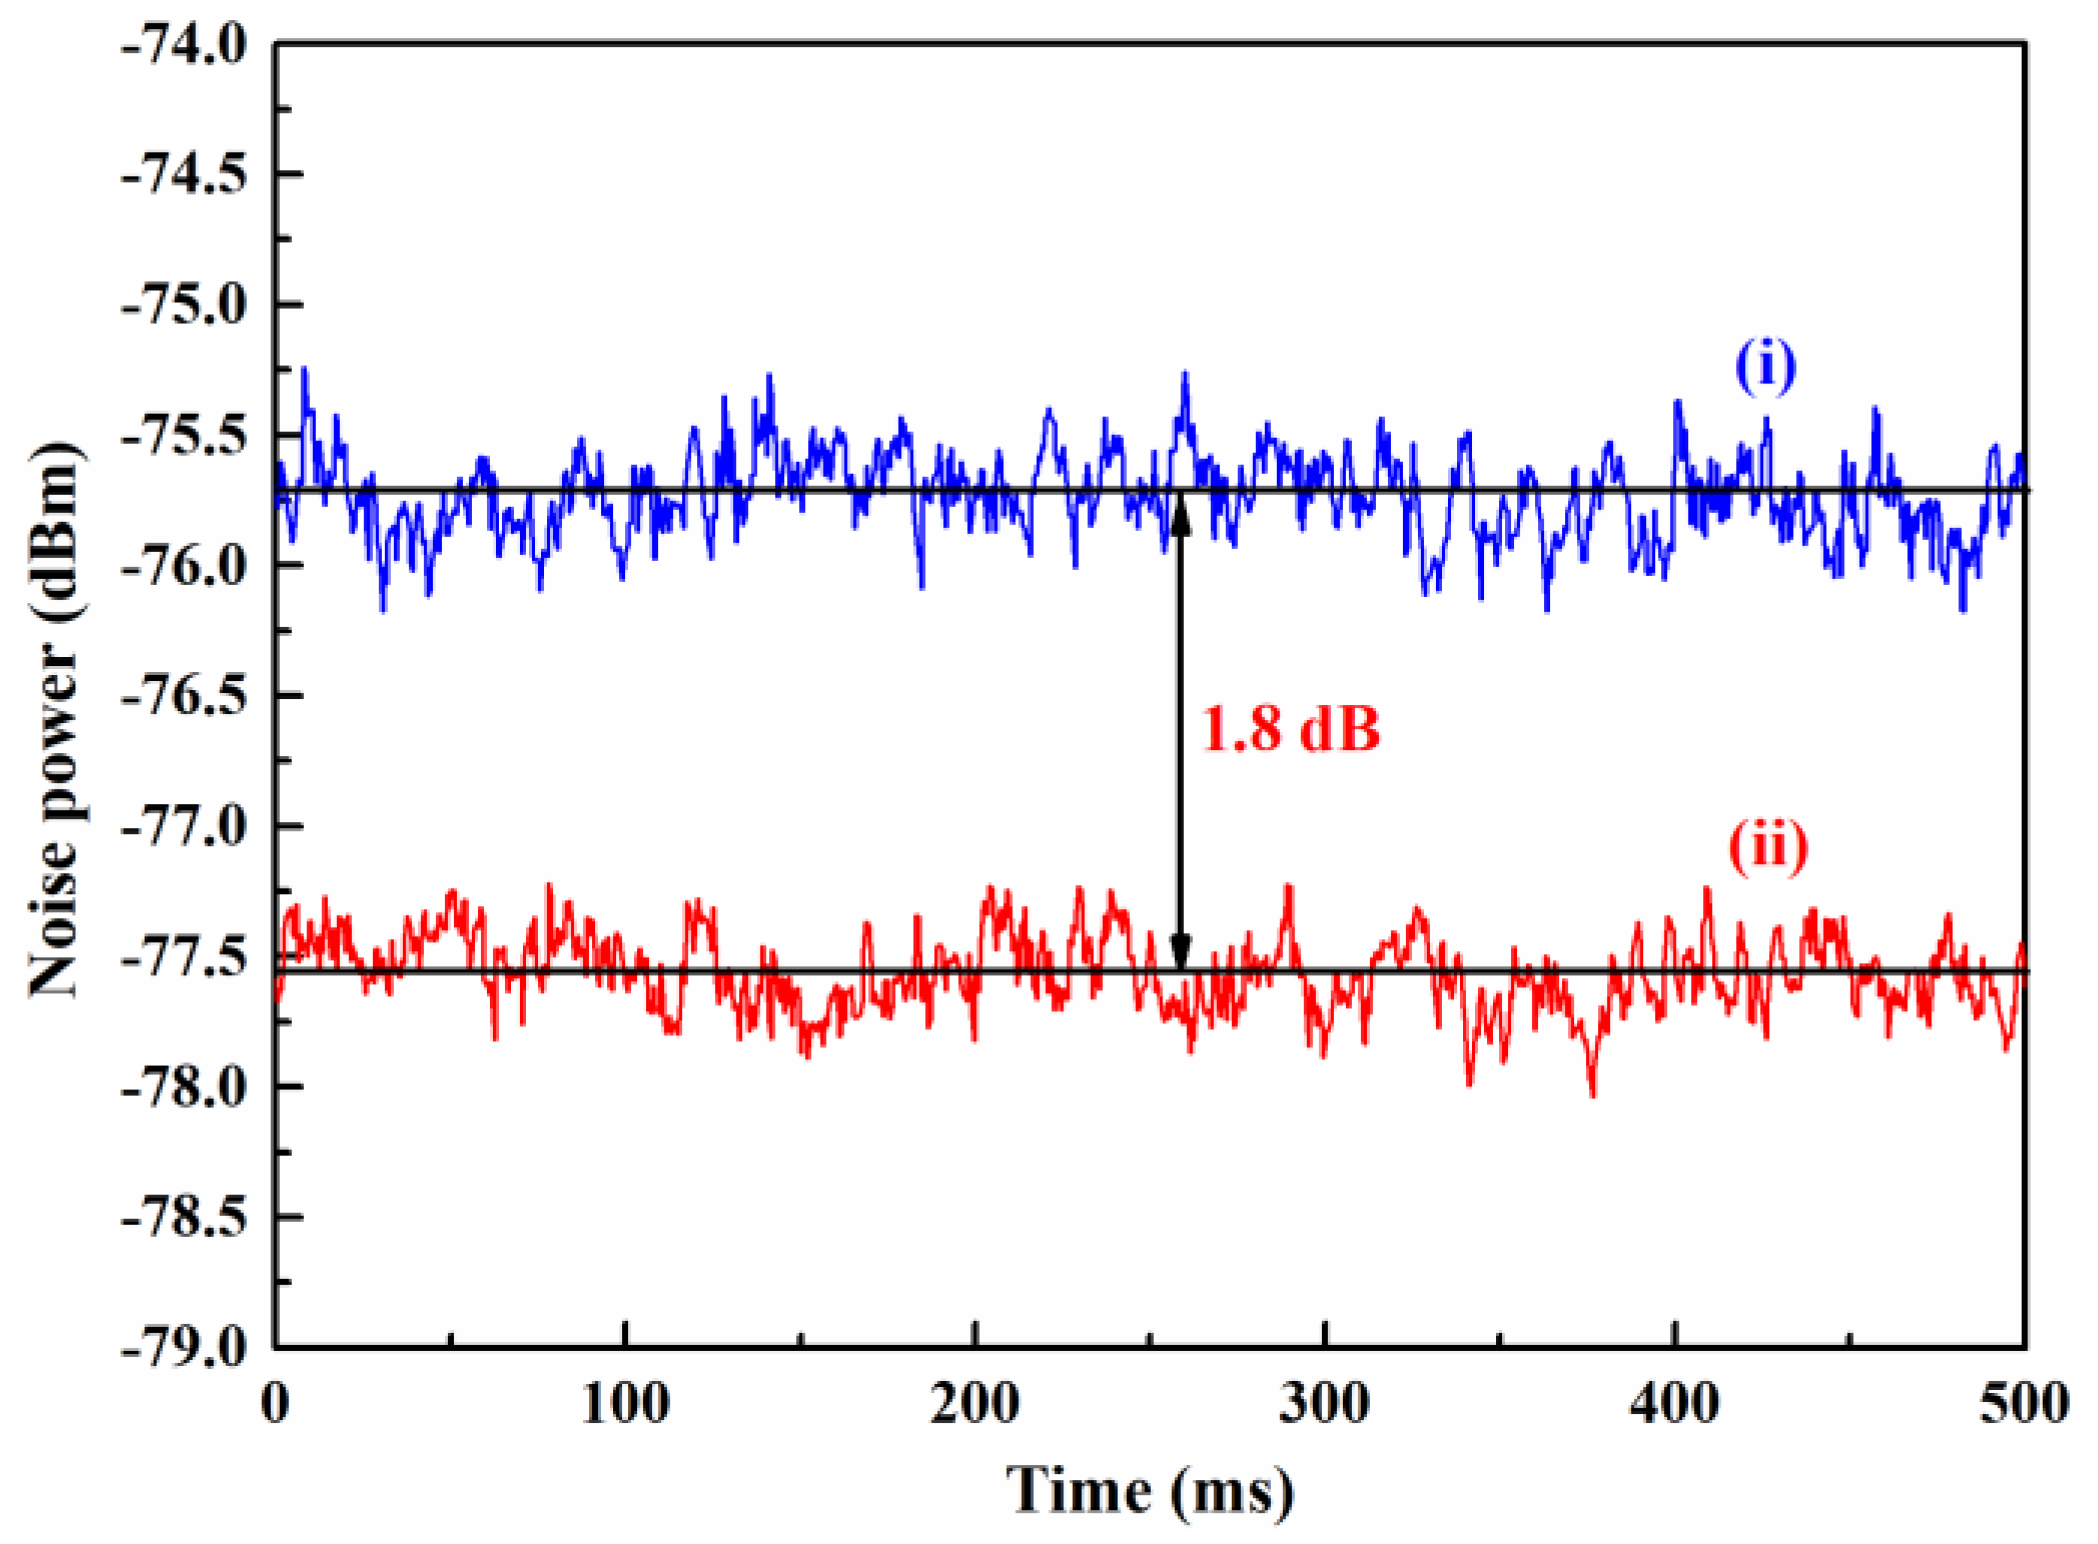
When the current output from PD1 was attenuated by an EA so that it was equal to the current output from PD2, the noise power of the intensity difference between two down-conversion beams at an analysis frequency of 5 MHz was measured and recorded by an SA with an resolution bandwidth (RBW) of 100 kHz, a video bandwidth (VBW) of 50 Hz, and the sweep time of 500 ms, as shown in Figure 3, curve (ii). Curve (i) in Figure 3 is the corresponding SNL that was given by the measured noise power of intensity sum of two down-conversion beams. It can be seen that the noise power of the intensity difference between the twin beams is 1.8 dB below the corresponding SNL. It is indicated that the two-color quantum correlation of 1.8 dB between down-conversion beams at 1.5 and 3.3 μm from the SRO was observed.
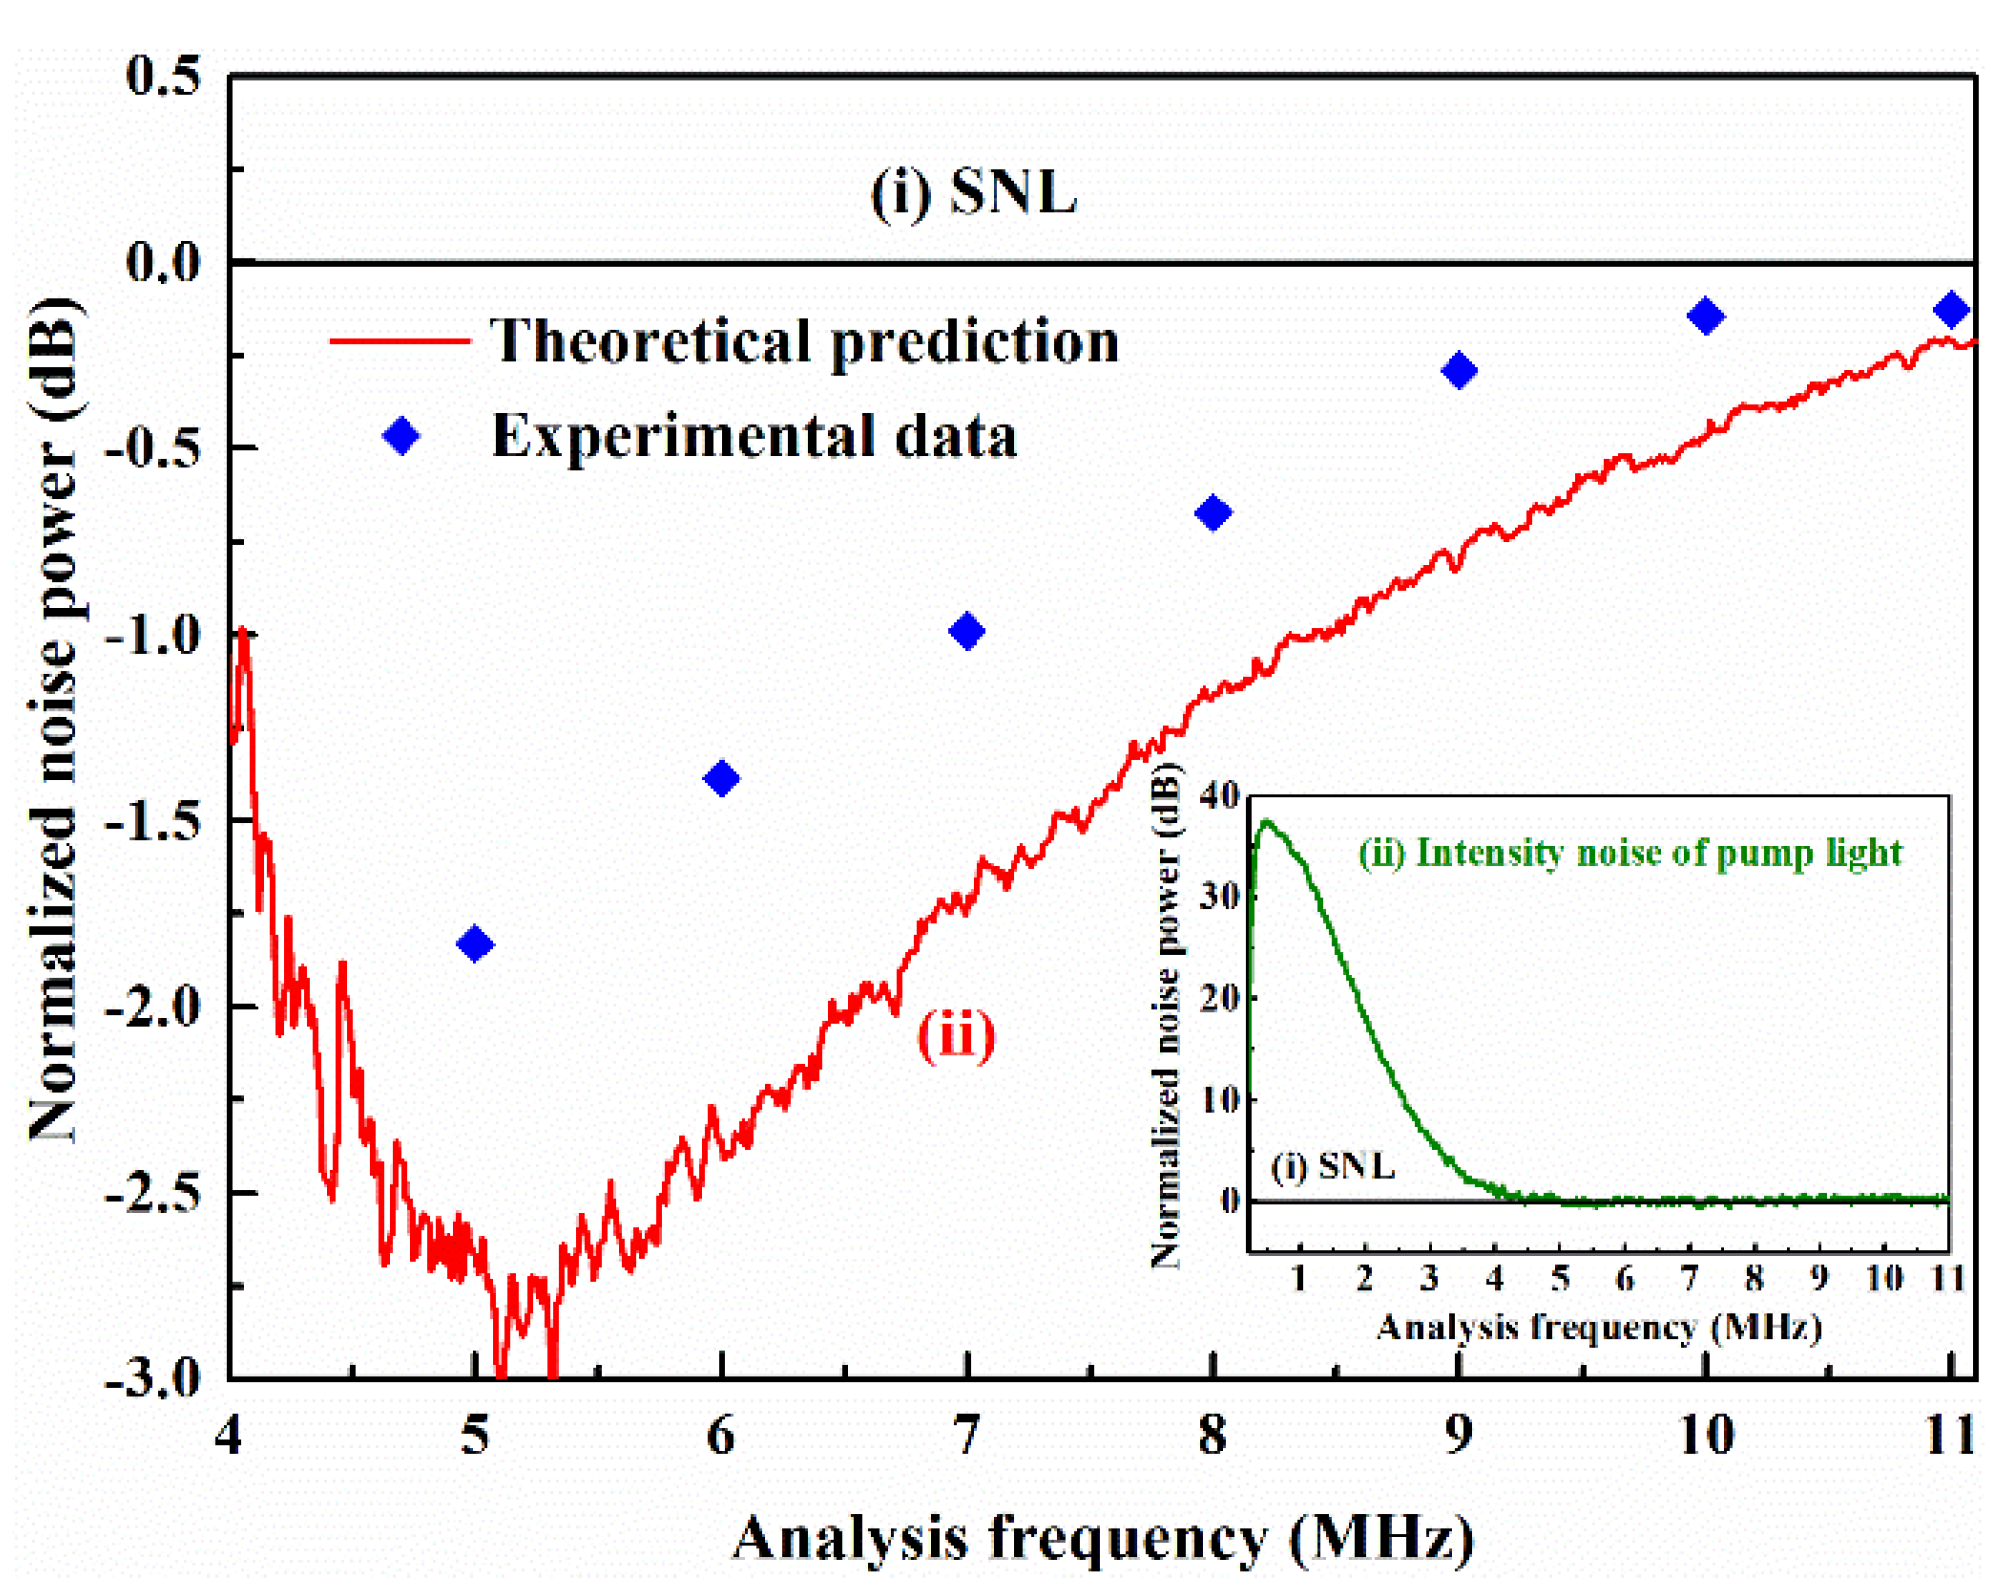
The normalized noise power spectrum of the intensity difference between two down-conversion beams is shown in Figure 4. Blue diamonds are experimental data. Curve (i) is the normalized SNL. Curve (ii) is the calculated normalized noise power spectrum of the intensity difference between the signal and idler using Equation (10) with experimental parameters of γ = 0.0135, γs = 0.0075, τ = 1.9 × 10⁻⁹, σ = 1.04, φ = 0 and the cavity length of 569 mm. The measured intensity noise of the pump (as shown in the inserted figure in Figure 4) was used in the calculation. Curve (i) and (ii) in the inserted figure in Figure 4 are the normalized SNL and the normalized intensity noise spectrum of the pump, respectively. The intensity noise of the pump reaches the SNL for analysis frequencies higher than 5 MHz. It can be seen that the normalized noise power of the intensity difference between the twin beams is below the normalized SNL at analysis frequencies from 4 to 11 MHz. It means that the two-color quantum correlation between down-conversion beams can be observed at the analysis frequency range. Obviously, the observed quantum correlation between the twin beams degraded when the analysis frequency increases from 5 MHz to 11 MHz, a maximum noise reduction can be observed at an analysis frequency of 5 MHz, and the noise reduction decreases with the decrease of the analysis frequency from 5 to 4 MHz. In principle, the noise reduction should be increased with the decrease of the analysis frequency. The fact of noise reduction decrease at the low analysis frequencies is due to the large excess intensity noise of the pump for analysis frequencies below 5 MHz. The quantum correlation between the twin beams at high frequencies is limited by the bandwidth of the SRO cavity. The measured finesse of SRO was 56 and the bandwidth of the cavity was 9.4 MHz. The discrepancy between the theoretical prediction and the experimental results could be induced by the extra noise caused experimentally by the effect of guided acoustic wave Brillouin scattering within MgO:PPLN crystal [38].
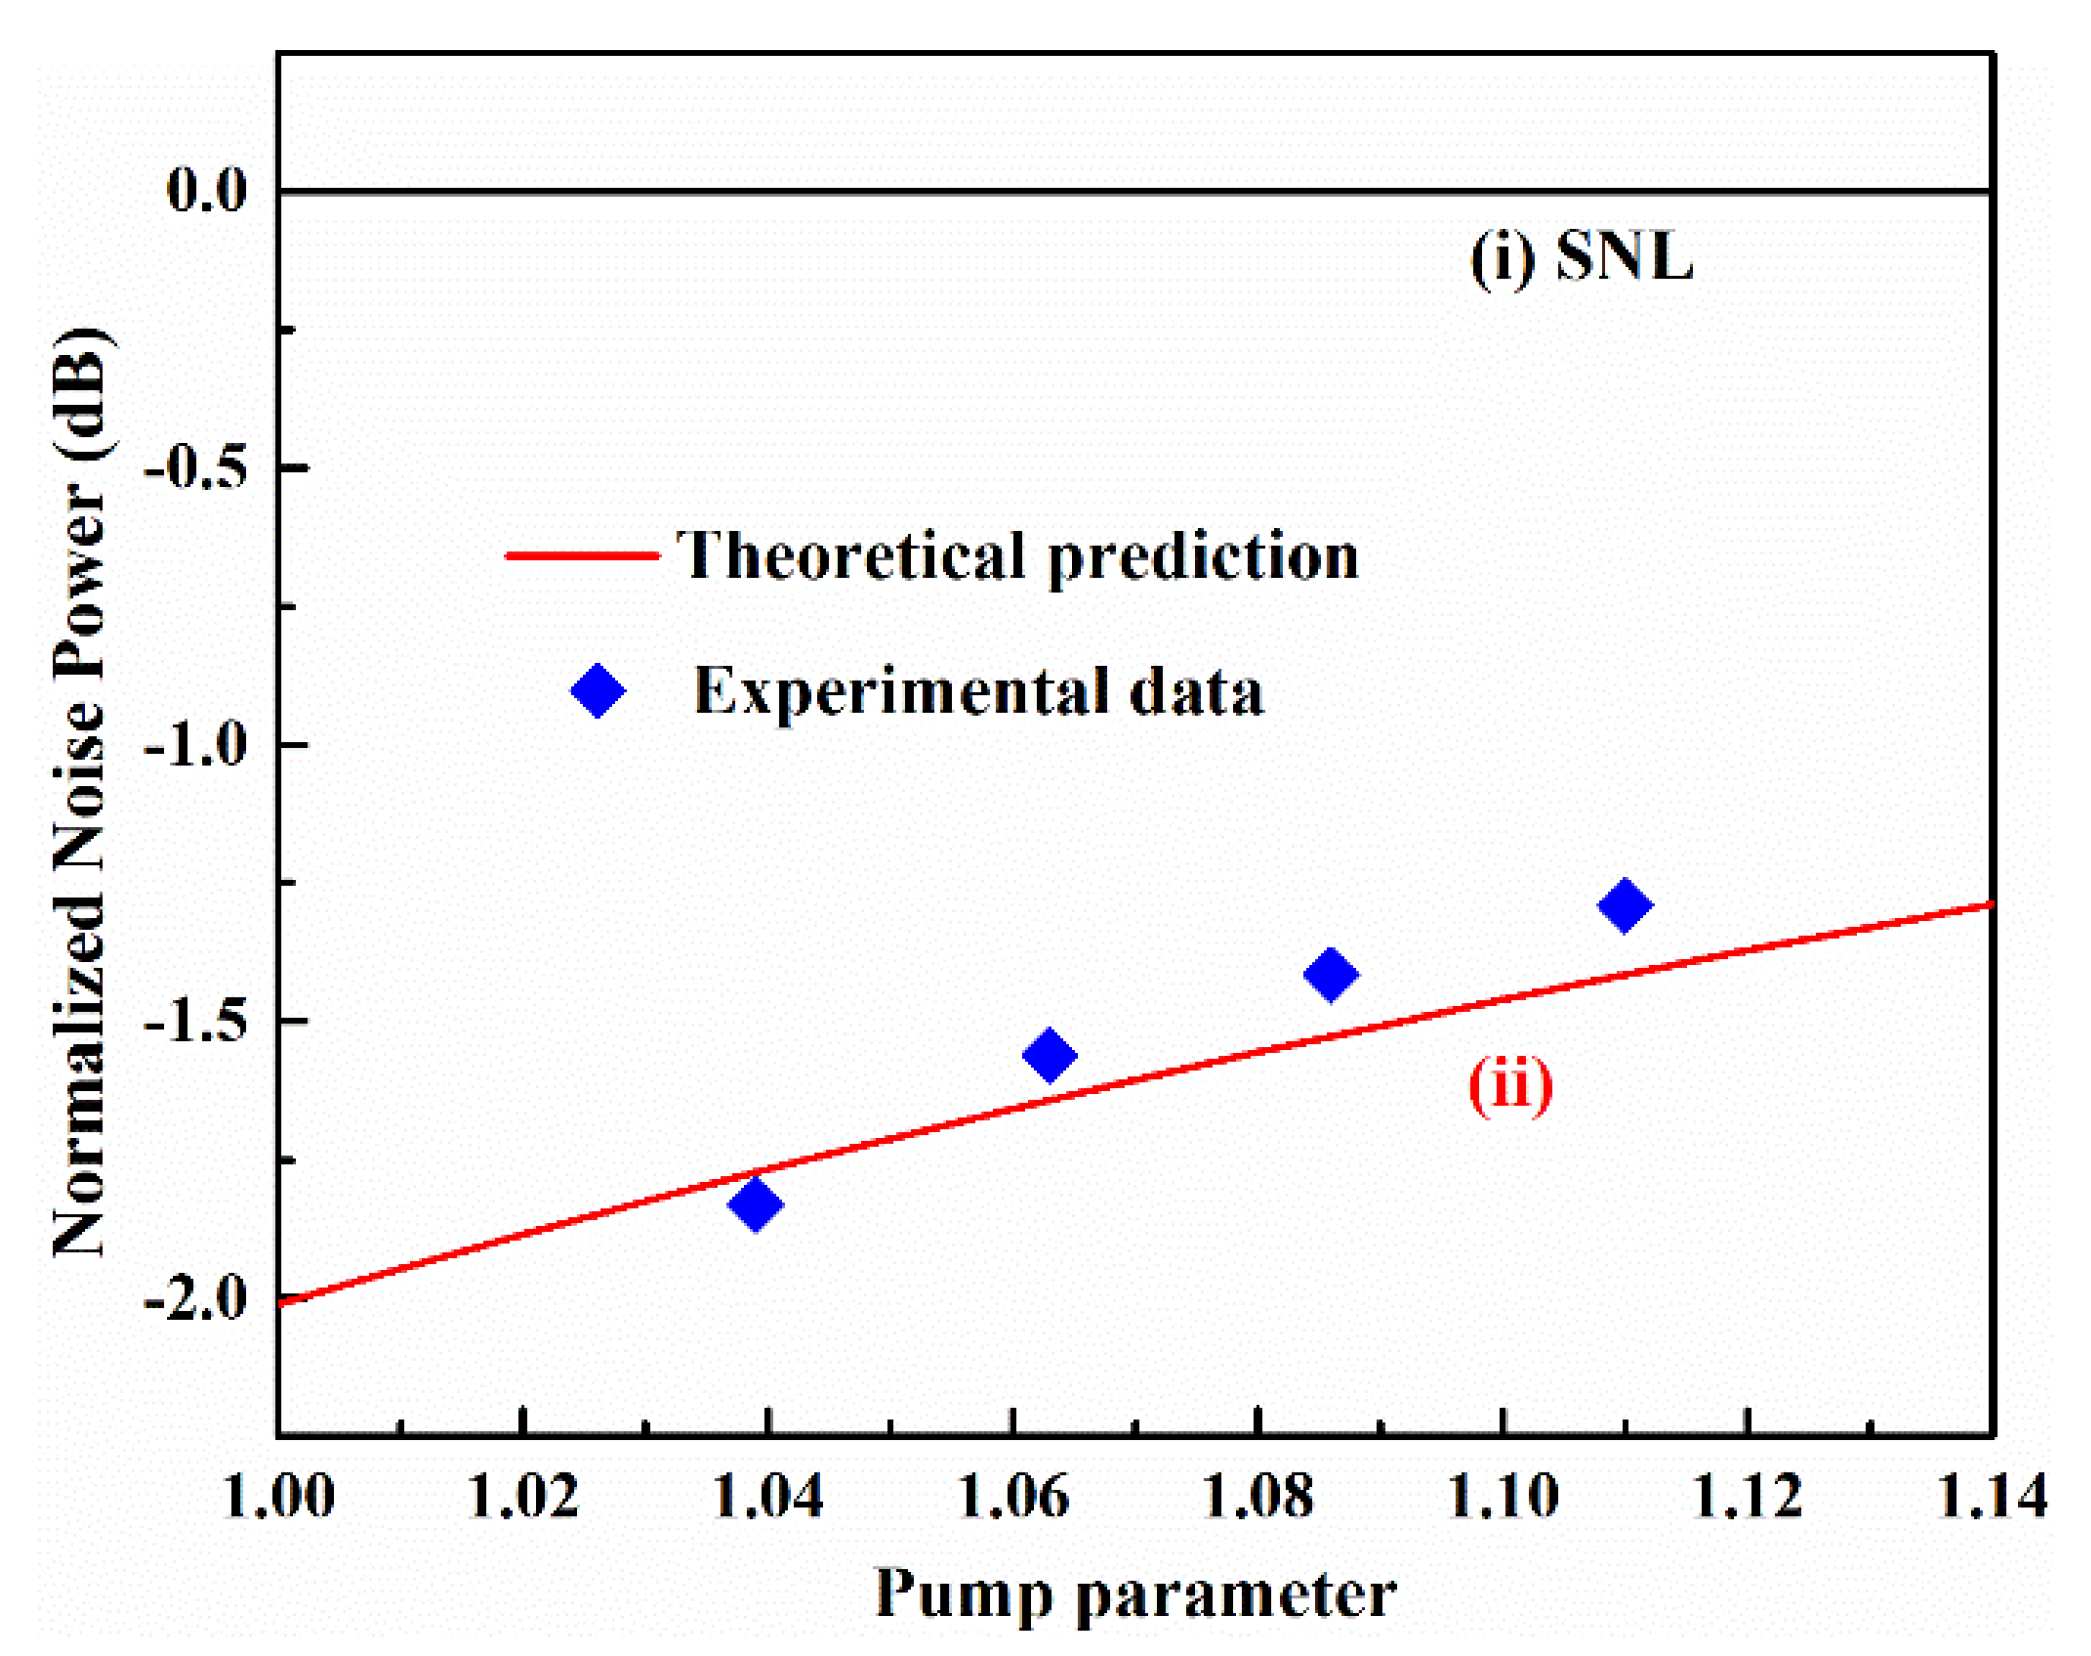
Figure 5 shows the normalized noise power of the intensity difference between the signal and idler at the analysis frequency of 5 MHz with different pump parameters. Curve (i) is the normalized SNL, and curve (ii) is the calculated normalized noise power of the intensity difference between the signal and idler using Equation (10) with the experimental parameters mentioned above and a different pump parameter σ. Blue diamonds are experimental data. The experimental results were recorded by an SA with an RBW of 100 kHz, a VBW of 50 Hz, and a sweep time of 500 ms. When σ was 1.04, the output power of the signal and idler was 10 mW and 2 mW, respectively, and a maximum noise reduction can be observed. Clearly, the quantum correlation between the signal and idler was stronger when the pump power was closer to the pump threshold of SRO. Increasing the pump power, the observed quantum correlation between the twin beams degraded. When σ was 1.11, the output power of the signal and idler was 25 mW and 6 mW, respectively, and a quantum correlation of 1.3 dB between the twin beams was observed. The noise power of the intensity difference between the signal and idler was not measured when σ was larger than 1.11, because photodetectors will be saturated with the larger incident powers of the signal and idler.

5. Conclusions

We demonstrated a two-color quantum correlation between the down-conversion beams with a telecommunication wavelength at 1.5 μm and mid-infrared wavelength at 3.3 μm from an SRO operated above the pump threshold with an MgO:PPLN crystal in the cavity. The noise powers of the signal and idler were measured directly using home-made high-gain broad bandwidth detectors at 3.3 μm and 1.5 μm, respectively. The intensity noises of the signal and idler reach the SNL for analysis frequencies above 5 MHz, respectively. The noise power of the intensity difference between two down-conversion beams was measured by the detectors and recorded by an SA. A maximum of 1.8 dB two-color quantum correlation between down-conversion beams at 1.5 and 3.3 μm was observed. A theoretical model for the two-color quantum correlation between the twin beams was given using a semi-classical approach, and the influence of the analysis frequency and pump parameter on the quantum correlation between the twin beams was discussed theoretically and experimentally. The maximum quantum correlation between the twin beams was observed at an analysis frequency of 5 MHz, which was degraded at the analysis frequencies above 5 MHz due to the limitation of the bandwidth of the SRO cavity and was degraded at the analysis frequencies below 5 MHz due to the excess intensity noise of the pump. The quantum correlation between the twin beams was stronger when the pump power was closer to the pump threshold of the SRO. If the balance homodyne detection system for 3.3 μm can be developed in the future and a high-quality optical HR coating at 3.3 μm can be also realized, a two-color CV quantum entanglement at 1.5 and 3.3 μm can be achieved in the same experimental system. The two-color quantum states at 1.5 and 3.3 μm have potential applications in high-precision measurements beyond the SNL such as in oil mining, gas pipeline leakage monitoring, industrial process monitoring, biomedicine, and so on.

Author Contributions

Conceptualization, D.N., Y.L., J.F. and K.Z.; investigation, D.N., Y.L. and J.F.; data curation, J.F. and K.Z.; writing—original draft preparation, D.N. and J.F.; writing—review and editing, J.F. and K.Z.; supervision, K.Z.; funding acquisition, K.Z. All authors have read and agreed to the published version of the manuscript.

Funding

This research was funded by National Key R&D Program of China (No. 2016YFA0301401).

Conflicts of Interest

The author declares no conflict of interest.

References

  1. Braunstein, S.L.; Loock, P.V. Quantum information with continuous variables. Rev. Mod. Phys. 2005, 77, 513–577. [Google Scholar] [CrossRef] [Green Version]
  2. Kimble, H.J. The quantum internet. Nature 2008, 453, 1023–1030. [Google Scholar] [CrossRef] [PubMed]
  3. Brida, G.; Genovese, M.; Berchera, I.R. Experimental realization of sub-shot-noise quantum imaging. Nat. Photon. 2010, 4, 227–230. [Google Scholar] [CrossRef]
  4. Ladd, T.D.; Jelezko, F.; Laflamme, R.; Nakamura, Y.; Monroe, C.; O’Brien, J.L. Quantum computers. Nature 2010, 464, 45. [Google Scholar] [CrossRef] [Green Version]
  5. Giovannetti, V.; Lloyd, S.; Maccone, L. Advances in quantum metrology. Nat. Photon. 2011, 96, 222–229. [Google Scholar] [CrossRef]
  6. Taylor, M.A.; Janousek, J.; Daria, V.; Knittel, J.; Hage, B.; Bachor, H.A.; Bowen, W.P. Biological measurement beyond the quantum limit. Nat. Photon. 2013, 7, 229–233. [Google Scholar] [CrossRef] [Green Version]
  7. Reynaud, S. Generation of Twin Photon Beams by a Nondegenerate Optical Parametric Oscillator. Europhys. Lett. 1987, 4, 427–432. [Google Scholar] [CrossRef]
  8. Heidmann, A.; Horowicz, R.J.; Giacobino, E.; Fabre, C. Observation of Quantum Noise Reduction on Twin Laser Beams. Phys. Rev. Lett. 1987, 59, 2555–2557. [Google Scholar] [CrossRef]
  9. Pan, Q.; Zhang, Y.; Zhang, T.C.; Xie, C.D.; Peng, K.C. Experimental investigation of intensity difference squeezing using Nd: YAP laser as pump source. J. Phys. D Appl. Phys. 1997, 30, 1588–1590. [Google Scholar] [CrossRef]
  10. Laurat, J.; Longchambon, L.; Fabre, C. Experimental investigation of amplitude and phase quantum correlations in a type II optical parametric oscillator above threshold: From nondegenerate to degenerate operation. Opt. Lett. 2005, 30, 1177–1179. [Google Scholar] [CrossRef] [Green Version]
  11. Takata, K.; Marandi, A.; Yamamoto, Y. Quantum correlation in degenerate optical parametric oscillators with mutual injections. Phys. Rev. A 2015, 92, 043821. [Google Scholar] [CrossRef] [Green Version]
  12. Li, J.Y.; Olsen, M.K. Quantum correlations across two octaves from combined up- and down-conversion. Phys. Rev. A 2018, 97, 043856. [Google Scholar] [CrossRef] [Green Version]
  13. Villar, A.S.; Cruz, L.S.; Cassemiro, K.N.; Martinelli, M.; Nussenzveig, P. Generation of bright two-color continuous variable entanglement. Phys. Rev. Lett. 2005, 95, 243603. [Google Scholar] [CrossRef] [PubMed] [Green Version]
  14. Cassemiro, K.N.; Villar, A.S.; Martinelli, M.; Nussenzveig, P. The quest for three-color entanglement experimental investigation of new multipartite quantum correlations. Opt. Express 2007, 15, 18236–18246. [Google Scholar] [CrossRef] [PubMed] [Green Version]
  15. Coelho, A.S.; Barbosa, F.A.S.; Cassemiro, K.N.; Villar, A.S.; Martinelli, M.; Nussenzveig, P. Three-Color Entanglement. Science 2009, 326, 823–826. [Google Scholar] [CrossRef] [Green Version]
  16. Li, Y.; Guo, X.; Bai, Z.; Liu, C. Generation of two-color continuous variable quantum entanglement at 0.8 and 1.5 μm. Appl. Phys. Lett. 2010, 97, 031107. [Google Scholar] [CrossRef]
  17. Wang, N.; Du, S.; Li, Y. Compact 6 dB Two-color continuous cariable entangled source based on a single ring optical resonator. Appl. Sci. 2018, 8, 330. [Google Scholar] [CrossRef] [Green Version]
  18. Lane, A.S.; Reid, M.D.; Walls, D.F. Quantum analysis of intensity fluctuations in the nondegenerate parametric oscillator. Phys. Rev. A 1988, 38, 788–799. [Google Scholar] [CrossRef]
  19. Ribeiro, P.H.S.; Schwob, C.; Matre, A.; Fabre, C. Sub-shot-noise high-sensitivity spectroscopy with optical parametric oscillator twin beams. Opt. Lett. 1997, 22, 1893–1895. [Google Scholar] [CrossRef]
  20. Wang, H.; Zhang, Y.; Pan, Q.; Su, H.; Porzio, A.; Xie, C.D.; Peng, K.C. Experimental realization of a quantum measurement for intensity difference fluctuation using a beam splitter. Phys. Rev. Lett. 1999, 82, 1414–1417. [Google Scholar] [CrossRef]
  21. Vasilyev, M.; Choi, S.K.; Kumar, P.; D’Ariano, M. Tomographic measurement of joint photon statistics of the twin-beam quantum state. Phys. Rev. Lett. 2000, 84, 2354–2357. [Google Scholar] [CrossRef] [PubMed] [Green Version]
  22. Brambilla, E.; Caspani, L.; Jedrkiewicz, O.; Lugiato, L.A.; Gatti, A. High sensitivity imaging with multi-mode twin beams. Phys. Rev. A 2008, 77, 053807. [Google Scholar] [CrossRef] [Green Version]
  23. Brida, G.; Genovese, M.; Meda, A.; Berchera, I.R. Experimental quantum imaging exploiting multimode spatial correlation of twin beams. Phys. Rev. A 2011, 83, 033811. [Google Scholar] [CrossRef] [Green Version]
  24. Eugene, K.; Farid, Y.K.; Maria, V.C. Overcoming inefficient detection in sub-shot-noise absorption measurement and imaging. Opt. Express 2019, 27, 7868–7885. [Google Scholar]
  25. Li, M.J.; Nolan, D.A. Optical transmission fiber design evolution. J. Lightwave Technol. 2008, 26, 1079–1092. [Google Scholar] [CrossRef]
  26. Peltola, J.; Vainio, M.; Hieta, T.; Uotila, J.; Sinisalo, S.; Metsälä, M.; Siltanen, M.; Halonen, L. High sensitivity trace gas detection by cantilever-enhanced photoacoustic spectroscopy using a mid-infrared continuous-wave optical parametric oscillator. Opt. Express 2013, 21, 10240–10250. [Google Scholar] [CrossRef]
  27. Cumis, M.S.; Viciani, S.; Borri, S.; Patimisco, P.; Sampaolo, A.; Scamarcio, G.; Natale, P.D.; D’Amato, F.; Spagnolo, V. Widely-tunable mid-infrared fiber-coupled quartz-enhanced photoacoustic sensor for environmental monitoring. Opt. Express 2014, 22, 28222–28231. [Google Scholar] [CrossRef] [Green Version]
  28. Cui, Y.; Huang, W.; Wang, Z.; Wang, M.; Zhou, Z.; Li, Z.; Gao, S.; Wang, Y.; Wang, P. 4.3 μm fiber laser in CO2-filled hollow-core silica fibers. Optica 2019, 6, 951–954. [Google Scholar] [CrossRef]
  29. Agafonov, I.N.; Chekhova, M.V.; Leuchs, G. Two-color bright squeezed vacuum. Phys. Rev. A 2010, 82, 011801. [Google Scholar] [CrossRef] [Green Version]
  30. Cuozzo, D.; Oppo, G.L. Two-color continuous-variable quantum entanglement in a singly resonant optical parametric oscillator. Phys. Rev. A 2011, 84, 043810. [Google Scholar] [CrossRef]
  31. Bosenberg, W.R.; Drobshoff, A.; Alexander, J.I. 93% pump depletion, 3.5-W continuous-wave, singly resonant optical parametric oscillator. Opt. Lett. 1996, 21, 1336–1338. [Google Scholar] [CrossRef] [PubMed] [Green Version]
  32. Vainio, M.; Siltanen, M.; Hieta, T.; Halonen, L. Continuous-wave optical parametric oscillator based on a Bragg grating. Opt. Lett. 2010, 35, 1527–1529. [Google Scholar] [CrossRef] [PubMed]
  33. Hong, X.P.; Shen, X.L.; Gong, M.L.; Wang, F. Broadly tunable mode-hop-free mid-infrared light source with MgO: PPLN continuous-wave optical parametric oscillator. Opt. Lett. 2012, 23, 4982–4984. [Google Scholar] [CrossRef] [PubMed]
  34. Wu, H.S.; Wang, P.; Song, J.S.; Ye, J.; Xu, J.M.; Li, X.; Zhou, P. High power tunable mid-infrared optical parametric oscillator enabled by random fiber Laser. Opt. Express 2018, 26, 6446–6455. [Google Scholar] [CrossRef]
  35. Reynaud, S.; Fabre, C.; Giacobino, E. Quantum fluctuations in a two-mode parametric oscillator. J. Opt. Soc. Am. B 1987, 4, 1520–1524. [Google Scholar] [CrossRef]
  36. Fabre, C.; Giacobino, E.; Heidmann, A.; Reynaud, S. Noise characteristics of a non-degenerate Optical Parametric Oscillator–Application to quantum noise reduction. J. Phys. Fr. 1989, 50, 1209–1225. [Google Scholar] [CrossRef]
  37. Black, E.D. An introduction to Pound-Drever-Hall laser frequency stabilization. Am. J. Phys. 2001, 69, 79–87. [Google Scholar] [CrossRef] [Green Version]
  38. Wan, Z.J.; Feng, J.X.; Li, Y.J.; Zhang, K.S. Comparison of phase quadrature squeezed states generated from degenerate optical parametric amplifiers using PPKTP and PPLN. Opt. Express 2018, 26, 5531–5540. [Google Scholar] [CrossRef]
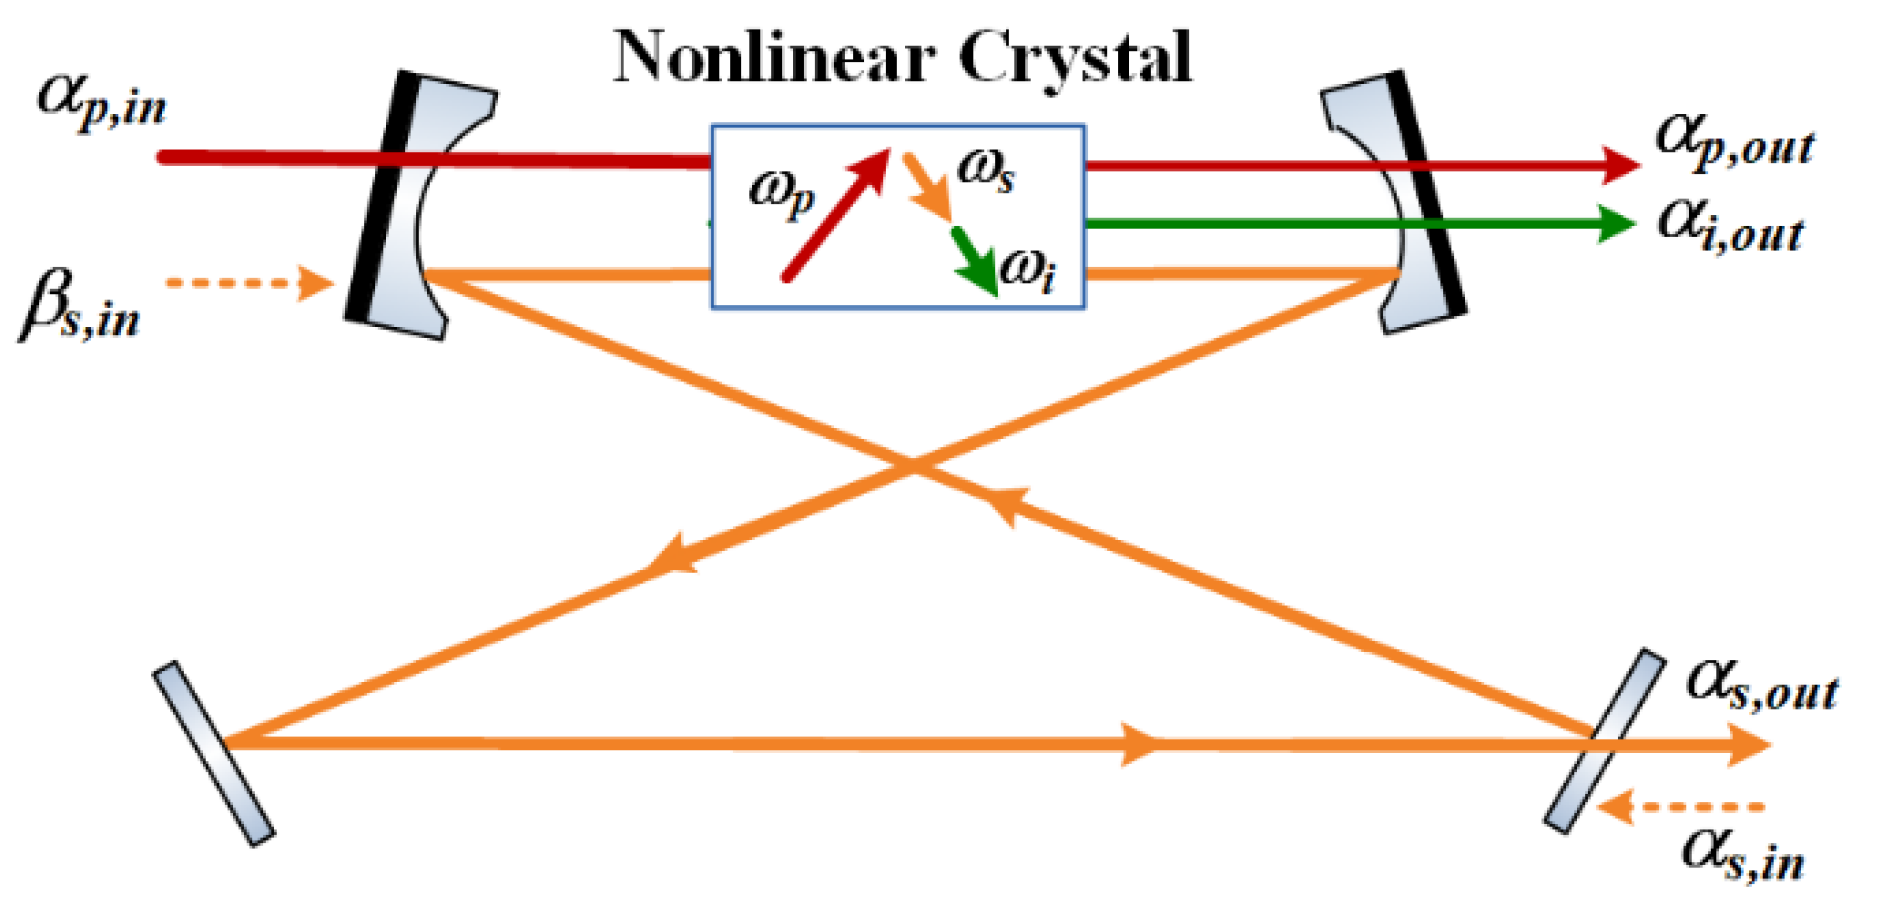
Figure 1. Schematic of the singly resonant optical parametric oscillator.
Applsci 10 02698 g001
Figure 2. Schematic of the experimental setup used to generate two-color quantum correlated twin beams at 1.5 μm and 3.3 μm. OI: optical isolator; SRO: singly resonant optical parametric oscillator; PZT: piezo-electric transducer; PD: photodetector; SA: spectrum analyzer; EA: electronic attenuator; +/−: positive/negative power combiner; LIA: lock-in amplifier; PID: proportional–integral–derivative; HV: high voltage amplifier; +: adder.
Applsci 10 02698 g002
Figure 3. Measured noise power of the intensity difference between two down-conversion beams. Curve (i): the corresponding shot-noise level (SNL), curve (ii): the noise power of the intensity difference between the twin beams. The analysis frequency is 5 MHz.
Applsci 10 02698 g003
Figure 4. Normalized noise power spectrum of the intensity difference between two down-conversion beams. Curves (i): normalized SNL, curve (ii): theoretical prediction, blue diamonds: experimental data. The inserted figure is the normalized intensity noise power spectrum of the pump.
Applsci 10 02698 g004
Figure 5. Normalized noise power of the intensity difference between the signal and idler at the analysis frequency of 5 MHz as a function of the pump parameter. Curves (i): normalized SNL, curve (ii): theoretical prediction, blue diamonds: experimental data.
Applsci 10 02698 g005