Article

Allothermal Gasification of Peat and Lignite by a Focused Light Flow

by
Alexandr S. Zaitsev
1,
Roman I. Taburchinov
1,
Irina P. Ozerova
1,
Amaro O. Pereira, Jr.
2 and
Roman I. Egorov
1,*
1
Tomsk Polytechnic University, Tomsk 634050, Russian
2
Institute of Graduate Studies in Engineering at Federal University of Rio de Janeiro, Rio de Janeiro 21941-901, Brazil
*
Author to whom correspondence should be addressed.
Appl. Sci. 2020, 10(8), 2640; https://doi.org/10.3390/app10082640
Submission received: 21 March 2020 / Revised: 4 April 2020 / Accepted: 6 April 2020 / Published: 11 April 2020
(This article belongs to the Special Issue Environmental Friendly Technologies in Power Engineering)

Abstract

:
Gasification of peat and lignite under a focused light flow was observed in a wide range of fuel moisture (up to 65 wt.%). The initial water content in the fuels under study had a different influence on the chemical composition of the synthesis gas (syngas). At the same time, the effect of light intensity was more predictable: in general, the production of gases grew with it. It was shown that the gasification of peat accelerated greatly when light intensity exceeded 100 W/cm2. Moreover, the conversion of peat and lignite required an order of magnitude lower intensity of the light flow than was necessary for the conversion of bituminous coal processing waste. The dynamics of the sample weight changes demonstrated that contrary to bituminous coals, the process was not purely allothermal for both peat and lignite. However, the fuel smoldering was not self-sustainable and stopped shortly after the pumping light was turned off.

Graphical Abstract

1. Introduction

Over recent years, human civilization has gone through a chain of energetic crises. Some of them were caused by the conflicts of interests between the world’s centers of power, when the availability of oil and gas decreased significantly for many countries. However, there were some objective reasons for that, as well: an increase in the global population and the depletion of numerous readily available deposits of fossil fuels that were in use for a long time [1]. The deficit of high-quality industrial fuels moves people to use widespread and low-demand fossil fuels (oil shale, peat, lignite) and other raw materials earlier classified as waste [2,3,4]. Using different types of domestic waste and biomass as fuel represents yet another way of replacing traditional fuels [5,6]. However, using such quasi-renewable fuels through direct burning calls for a complicated modification of heaters and involves additional processing stages (like esterification) of the fuel. A permanent increase in the atmospheric pollution causes climate changes. Therefore, the new fuels and corresponding techniques of their application have to be environmentally friendly.
However, replacing coals, oil, and natural gas by low-quality fuels on a permanent basis is quite expensive and only makes sense in a few industrial sites. A much more attractive option is to preprocess such fuels to a state when a sub-product is suitable for burners with the current design. This is implemented by the thermal conversion of a fuel (pyrolysis and/or gasification) to a combustible gas [5,6,7]. It typically produces synthesis gas (syngas)—a mixture of combustible and non-combustible gases (CO, CO2, H2, CH4, etc.) with the water steam.
Syngas can serve as an inexpensive replacement of natural gas for the power industry or as a good crude material for the chemical industry [8,9,10]. Therefore, it is a relevant task currently to develop efficient and inexpensive methods of converting fossil fuels into synthesis gas. The most well-known gasification techniques suggest the conversion of fuel through its partial combustion [11,12,13]. This method is good, but it requires special efforts to keep the efficiency at a high enough level when the fuel has low reactivity and high ash content [14,15]. In this case, the production of heat has low intensity, and an essential part of it is spent on heating the concomitant passive matter. The second argument for the development of a new gasification method is that a certain heat flow is required for the optimal conversion efficiency. Combustion gives us very few possibilities for heat flow manipulation (the maximum heating intensity is limited by the fuel reactivity, and even reducing the temperatures is not so easy for autothermal processes). Applying focused sunlight as a heat source of fuel gasification promises a relatively inexpensive industrial conversion technique. Taking into account that the light absorption coefficients of fossil fuels are much higher than those of high-quality photovoltaic devices, this approach looks quite promising. There are already some known attempts to use solar light for fuel processing [16,17,18]. However, these approaches are quite different from the ones proposed in this paper in terms of the types of fuels used, their moisture content, and the fuel particle sizes.
An important factor of solid fuel gasification is the reaction of carbon with water [11,12]. On the one hand, it rapidly produces CO and H2, and on the other hand, it suppresses the direct oxidation process, thus preventing the fuel ignition. Consequently, most of the gasification approaches deal with water-fuel compositions [13,19].
The existing allothermal (allothermal processes here are thermochemical processes where the heat needed for the transformation of precursors comes from the external heat sources) approaches are suitable for relatively pure carbon. They are mostly used in the gasification of high-grade bituminous coals (anthracite) and coal coke inside molten metal [20] or within another heat recuperation circuit [21]. Such approaches are unsuitable for peat and lignite due the large amount of passive mineral residue, which pollutes the heat transfer agent of the main heat-producing cycle. Meanwhile, peat is the most calorific type of natural biomass, which is widespread in the world. Peat and lignite are a very attractive class of fuels (or resources for the chemical industry) whose potential can be fully discovered just with an efficient and inexpensive utilization technique.
On the contrary, the said technique of the light-induced gasification of coal-derived fuel compositions [22,23,24] does not have such downsides. It allows a flexible adjustment of the heat flow, as well as ignores the presence of non-combustible admixtures in the fuel. Extending the previously developed approach to fossil fuels of low-level metamorphism is very interesting both scientifically and practically.
The main task of this work is to determine the light intensity levels required for the efficient conversion of peat and lignite into syngas, as well as to estimate the effect of fuel moisture content on the chemical composition of gas products.

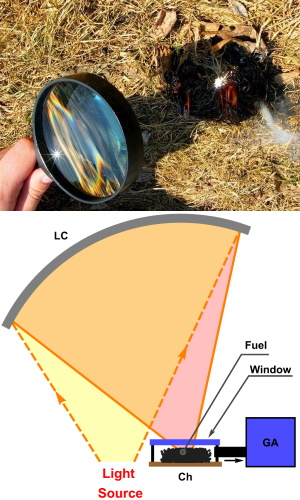
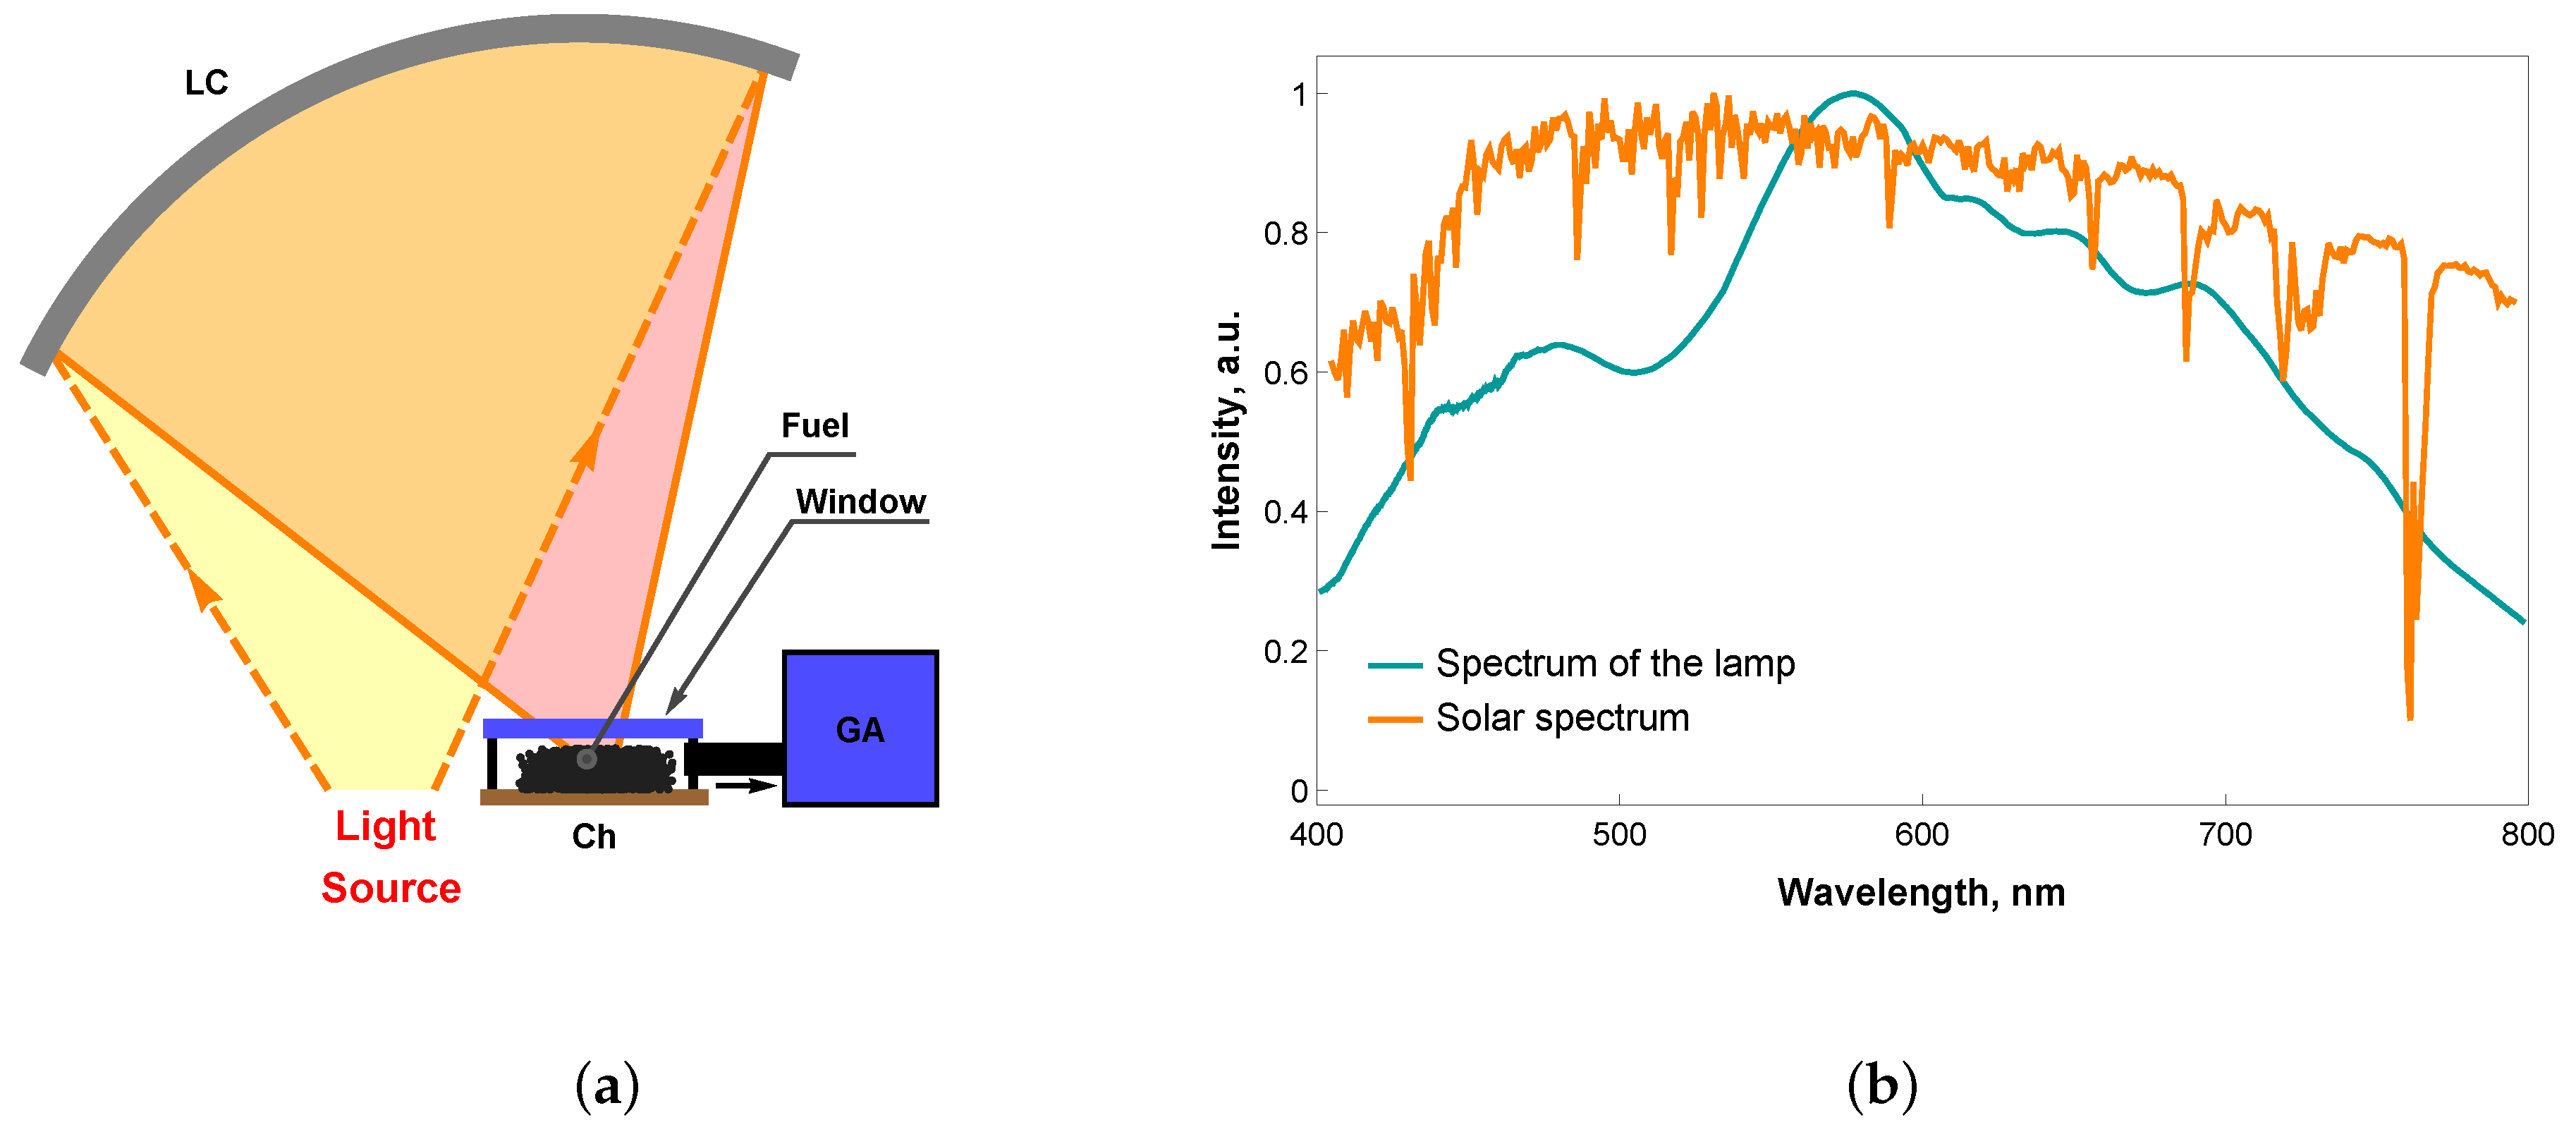
2. Materials and Methods

A fuel layer can be heated by a light flow in different ways. Using solar light has an obvious economic benefit. However, the main parameters of gasification can be determined using artificial incoherent light sources (different lamps, LEDs, etc.) whose spectrum is quite close to certain solar spectrum segments.
The absorption of the fuel is not uniform along the visible light spectrum. This fact is easily proven by the color of the fuel powder (both peat and lignite have perceptible reflection in the orange-red region). However, the wet powder of both peat and lignite becomes closer to black, which means higher unification of the absorption spectrum.
The samples of both peat (from the Arkadievskoe peat deposit in the Tomsk region of Russia) and lignite (Class B2 by the Russian standards) were dried at 45 and milled into a powder with a particle size under 120 μm. The powder was stored in a sealed container up to the final preparation of the sample before each experiment. This allowed high uniformity of the bulk density and heat conductivity of the composition with different water content. A higher concentration of water increases the threshold value of light intensity above which the fuel ignites, turning gasification into trivial combustion. At the same time, the water content determines the chemical composition of syngas due to changes in the operating temperature and the contribution of the steam-carbon reactions. The total moisture content of samples was varied in the range from 10 to 60 wt.% for peat and from 15 to 65 wt.% for lignite with 10 wt.% steps. The natural moisture content of peat and lignite was 9.9 wt.% and 15 wt.%, respectively. The ash content of peat and lignite was about 22 wt.% and 13.5 wt.%, respectively. Peat contained more than 70 wt.% of bound volatiles, whereas lignite had more than 27 wt.%. Due to such differences in the physical and chemical composition of the fuels, the amount of combustibles in them was different.
The sample was placed inside a cylindrical chamber with a window on the top side. The volume of the chamber was about 3.5 cm3, and most of it was free. Therefore, the chamber had some spare air, which was actually enough to gasify a few milligrams of fuel. The chamber was high enough to prevent the window from being polluted by adhering gasification products. The gasification products were permanently pumped out from the chamber by a gas-analyzer pump whose branch pipe was placed below the middle of the chamber height, thus detecting most of the volatile gasification products. The process was done at the normal atmospheric pressure.
We used a halogen lamp (total power 490 W and light flow power 12.5 W) with a collimator and focusing optics to heat the fuel. The scheme of the experimental setup and the irradiation spectrum of the lamp are shown in Figure 1. The light was focused on a spot with an average diameter (FWHM) of about 2.5 mm. It allowed the light flow intensity in the focal plane up to 130 W/cm2. Lower intensities were achieved by limiting the electrical current through the lamp circuit. The changes of the lamp spectrum (in a visible range) with a decrease in the electrical current were not significant.
The chemical composition of the fuel conversion products was analyzed using a Bonner Test-1 gas analyzer (Bonner, Novosibirsk, Russian Federation). Syngas was dried, when going through the condensate collector, and filtered by a PTFE-membrane filter (with a pore size of about 0.45 μm) to remove solid micro-particles and micro-droplets of tar. Such filtering was sufficient to remove tar from syngas due to a small-scale gas production (provided that filters were regularly changed). The analyzer measured the concentrations of the following gases: CO, CO2, CH4, H2, O2, SO2, NO using the electro-chemical and optical detectors sensitive to the target gases. It was adjusted to measure small concentrations of the target gases in the air flow. The systematic error of the gas concentration measurement was below 5%.
The changes of the sample weight during gasification were controlled in real time by a ViBRA AF 225 DRCE analytical balance (Shinko Denshi Co. Ltd., Tokyo, Japan). The chamber with a fuel was placed onto the platform of the balance, and the light flow was introduced through the hole in the top window of the balance shell. The pipes of the gas analyzer were disconnected in this experiment to keep the precision of the measurements at about 10 5 g. The initial weight of the samples was about 300 mg.
The typical temperature of the fuel surface during the conversion was measured by a Thermal Imaging System (TIS) Testo-885-2 (Testo SE & Co. KGaA, Lenzkirch, Germany). The glass window of the chamber was removed in this experiment to prevent data distortion. The TIS was calibrated for the fuel gray factor by the co-measurement of the fuel surface temperature using TIS and a fast thermocouple. The determined gray factor was in the range of 0.8–0.83. The average value 0.81 was used for measurements.
In general, the measurement procedures in this study were similar to the ones used in [23,24] for coal processing waste. However, the light flow required for the conversion of peat and lignite is much smaller than that for the conversion of bituminous coals because the heat conductivity of low-grade fuels is 3–5 times as low as that of coals. The overall exposition time was about 6 min (up to the moment when gas productions decayed due to the oxidation of all fuel available in hot area). All the experiments were repeated 5 times to allow for minimum random errors.
Applying the localized radiation heating meant that the hottest fuel layers were located near the illuminated fuel surface. The depth D to which the temperature had significantly changed to the moment t could be easily calculated with Equation (1) derived from the heat transfer equation. The heat penetration using the heat conduction mechanism (at the beginning of heating when the oxidation heat was negligibly small) generally depends on the thermal conductivity of the fuel.
D λ · t
where t is the time of heat transfer and λ is thermal conductivity [25].
The heat penetration depth (HPD) of peat and lignite with natural moisture content was approximately 0.56 mm and 0.27 mm, when heated for one second. The difference between the heat transmission of these fuels and the previously investigated coal processing waste (0.7 mm) was considerable. There were big differences in the chemical composition, as well (see Table 1).
These facts suggested that the heating of peat and lignite, using an external source and oxidation reactions, was implemented not in the same way as it was with bituminous coals and the corresponding processing waste. Therefore, the first step of this research was to define the intensity of the light flow required for a successful heating of the fuel up to the temperatures when gasification started.

3. Results and Discussion

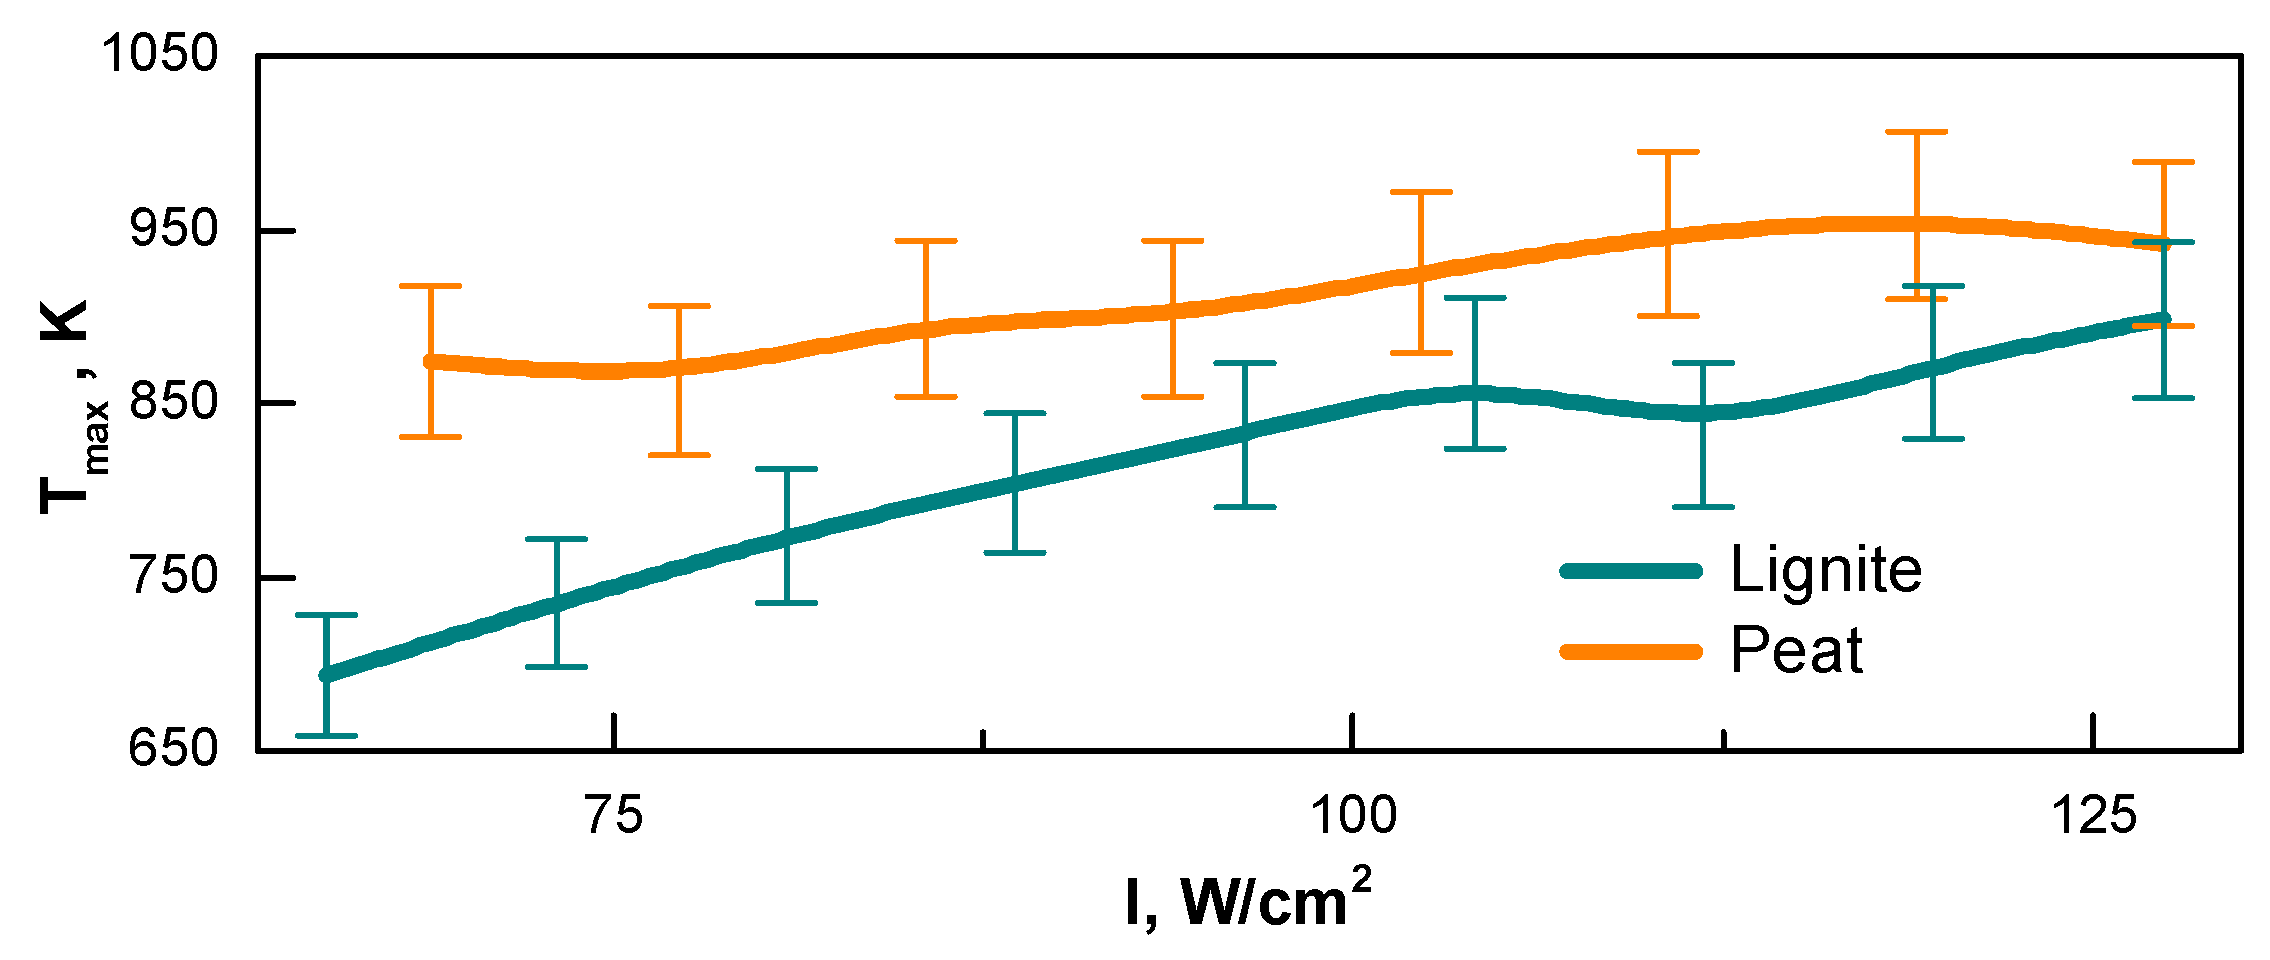
3.1. Fuel Surface Temperature under the Effect of Focused Light Flow

The TIS was directed at the irradiated fuel surface keeping a small angle to the surface normal vector through the hole on the top side of the chamber (the glass was removed from the window). The operating wavelength range of the TIS was in the LWIR region; thus, the lamp light did not have a considerable influence on the results. The surface temperature was measured for 30 s at different light flow intensities. The saturation of temperature dependence occurred after 5–10 s, and these steady-state values fully characterized the heating regime during the fuel conversion. The dependence of the steady-state temperature on the intensity of light flow is shown in Figure 2. The water content of peat and lignite here was 25 wt.% and 35 wt.%, respectively.
The spatial temperature distribution inside the illuminated spot was very close to Gaussian. Its shape repeated the spatial distribution of the light intensity of the beam focused by a spherical lens. Taking into account that the carbon oxidation rate depends on the temperature according to the Arrhenius law, it could be assumed that the spatial distribution of the reaction heat along the surface had a quasi-Gaussian profile as well (with much stronger inclination of the slopes).
As seen from Figure 2, peat could be heated to rather high temperatures at relatively low light flow intensities. A further increase in the light intensity accelerated the total oxidation reaction (with the growing production of CO2).
Heating lignite by visible light had a bit lower efficiency, but it provided temperatures above 800 K when the light intensity was above 100 W/cm2. The thermal conductivity of water-fuel compositions could be calculated using the values for water and dry fuel by employing additive ratios (relative to the content of water in the sample) [26]. The effective HPDs of peat and lignite with the said moisture content were about 0.27 mm and 0.31 mm, respectively. These values were much closer to one another than those for the fuels with natural moisture. This meant that by varying the fuel moisture, both the rate of chemical reactions and the heat transfer dynamics could be changed. Therefore, there were two driving factors that could be used for an effective adjustment of the gasification process: the intensity of the light flow and the initial water concentration.

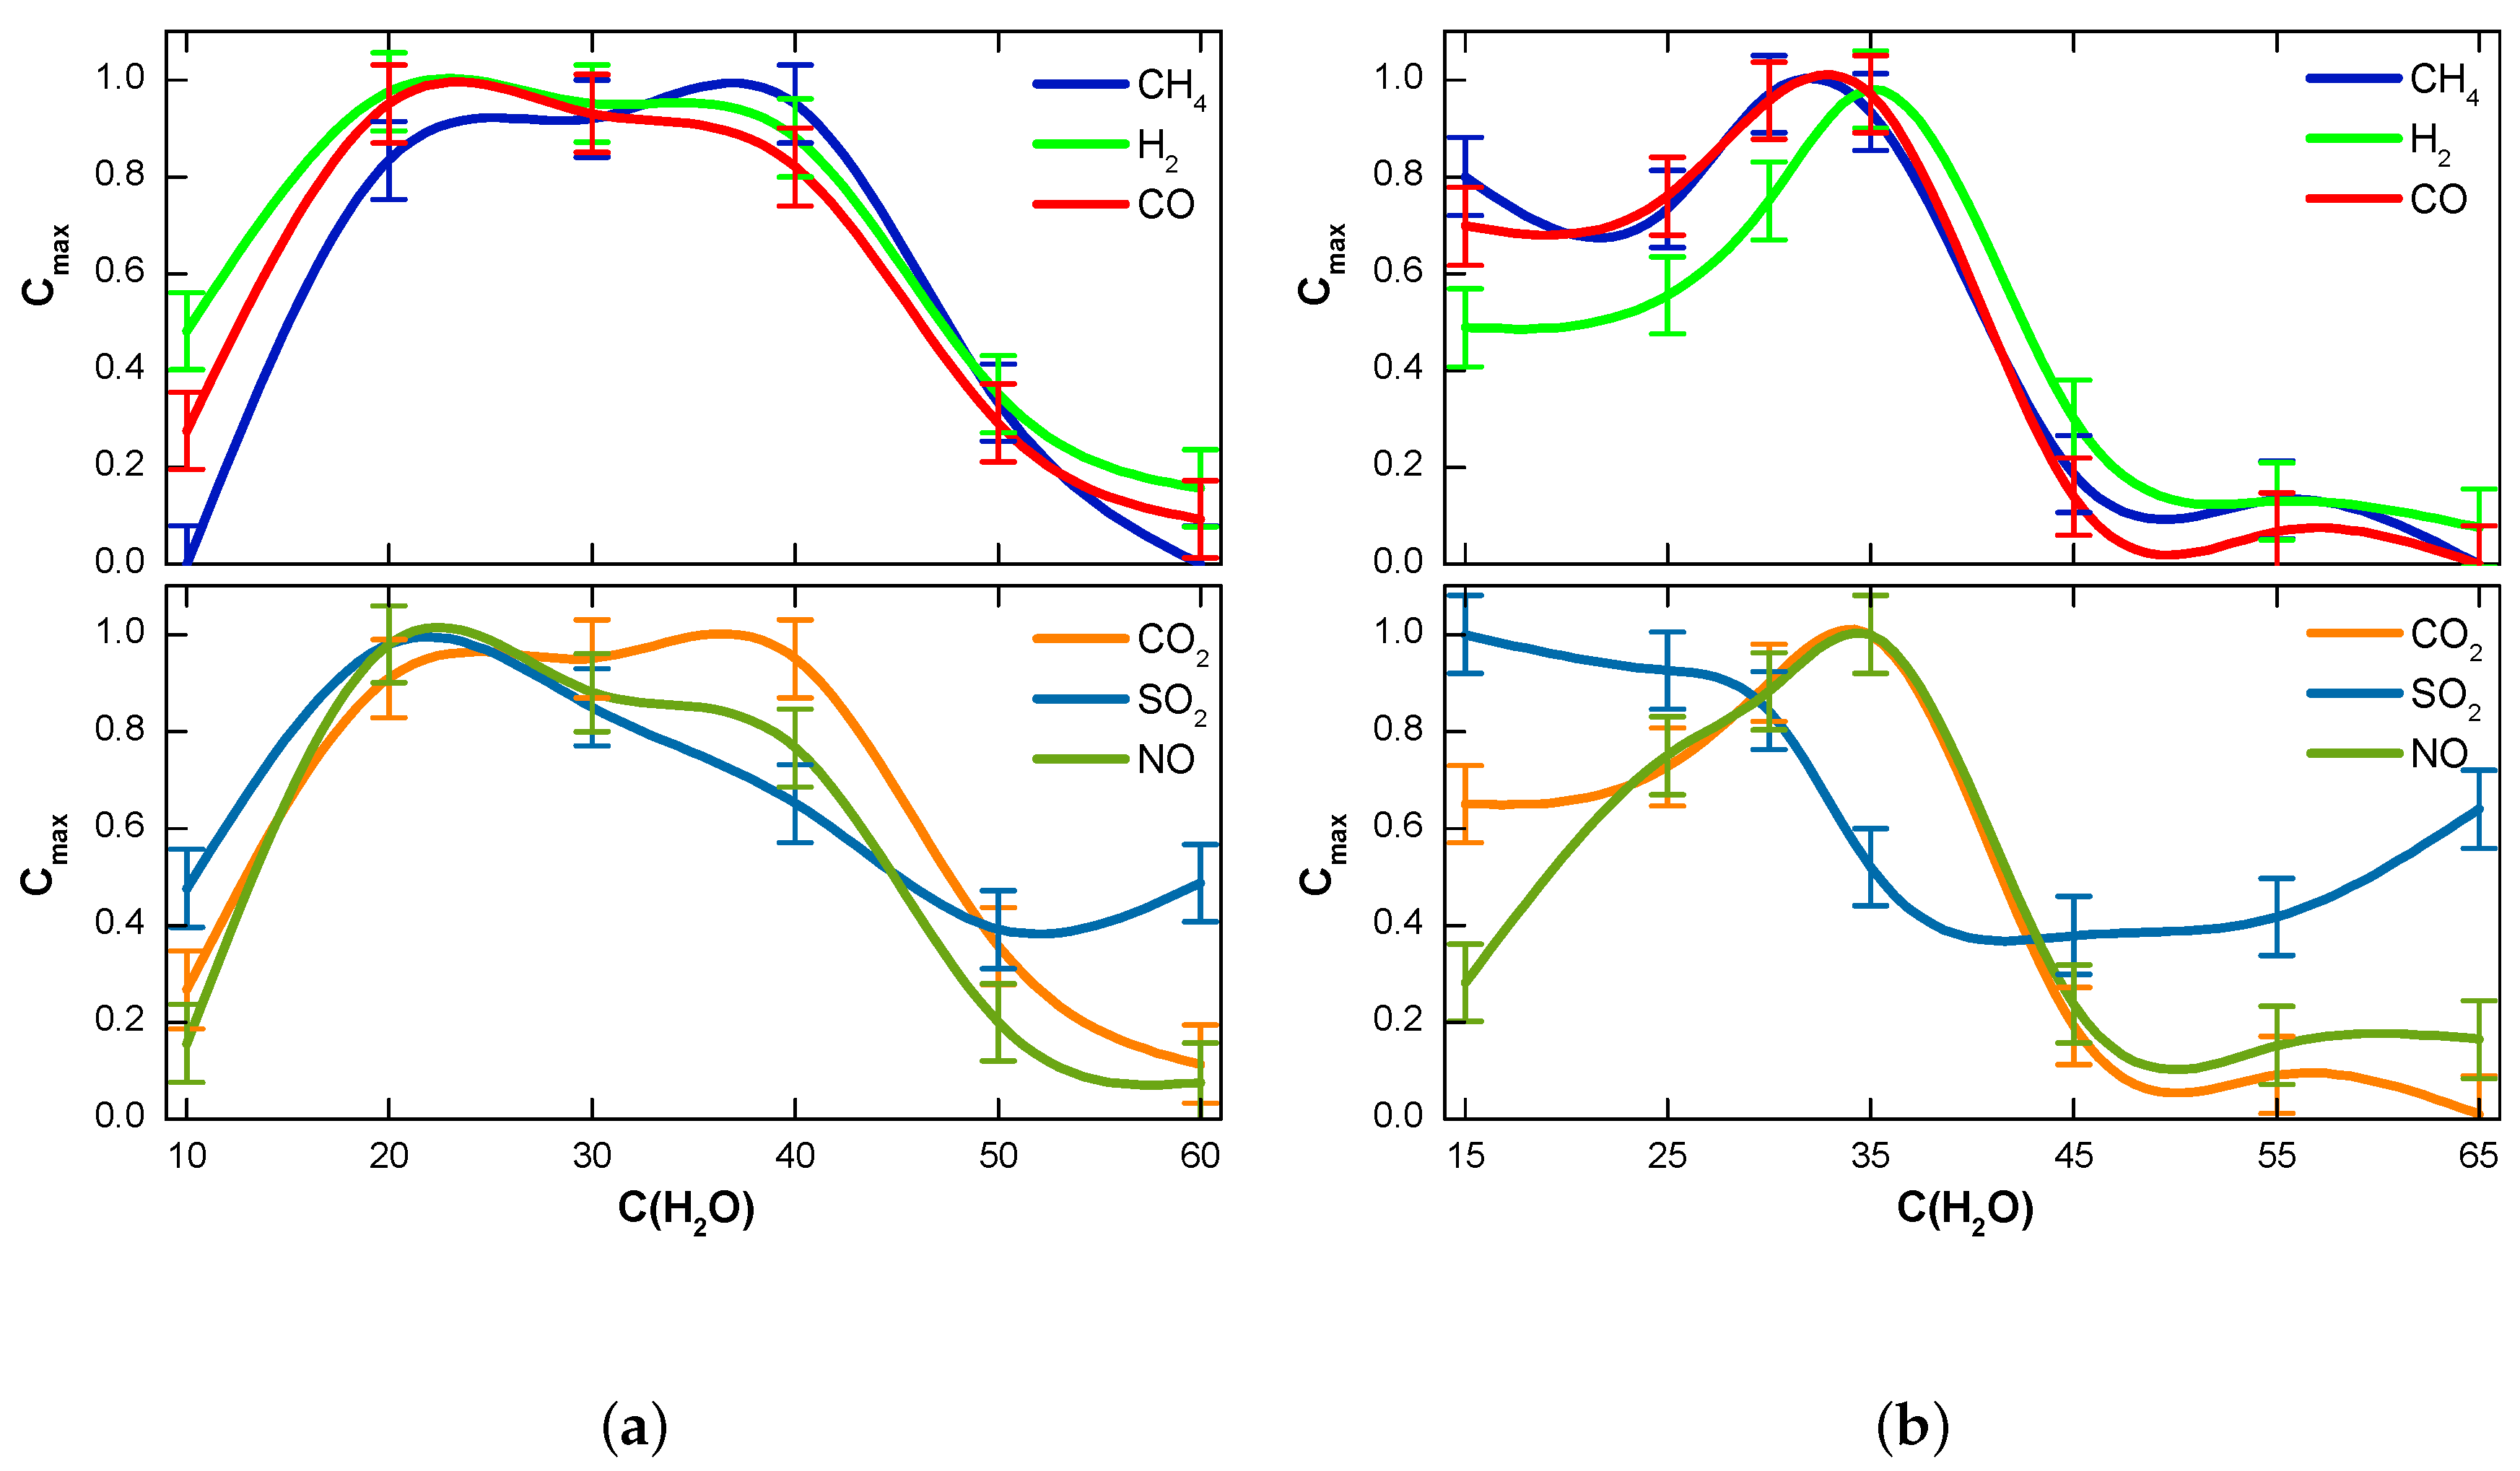
3.2. Influence of Fuel Moisture on the Chemical Composition of Syngas

Heating the fuel by a high-intensity light flow accelerated the temperature increase, which was much faster than it was during the heating by partial combustion of the fuel (like in autothermal gasification). This meant that most of the water from the fuel evaporated through a layer of hot carbon, facilitating steam-carbon reactions. They slightly decreased the fuel temperature growth, suppressing the ignition. However, the fuel layers that were close to the surface could still ignite, producing CO2. Their combustion was weak and unstable, occurring mostly as smoldering and ending quickly when the incoming light flow was switched off. Nevertheless, the presence of smoldering supplied considerable heat to the fuel. Therefore, the gasification of peat and lignite was not purely allothermal. The contribution of combustion heat to the process dynamics was not decisive, but it noticeably affected the rate of syngas production.
The changes in the chemical composition of syngas, when varying the fuel moisture, are shown in Figure 3. The light flow intensity was about 100 W/cm2 in this set of experiments. The gas concentrations were normalized here for a better joint representation of the curves with the values, differing by an order of magnitude or even more. The normalization factor meant the maximum value of the concentration of certain gas that corresponded to C = 1 on the curve. The values of the normalization factors are shown in Table 2.
As seen from Figure 3a, the concentration of combustible gases significantly increased with the water concentration growth from 10 wt.% to 20 wt.%. This fact reflected the acceleration of steam-carbon reactions, as well as an almost twofold decrease in the HPD in the bulk of the fuel. A decrease in HPD meant that the temperature was redistributed, and the near-surface layer was heated more rapidly with a lower temperature in the deep layers. It accelerated combustion in near-surface layers with the corresponding growth of the CO2, SO2, and NO production. A further increase in the water content up to 40 wt.% did not significantly affect the production of combustible gases and CO2 with NO. However, the production of sulfur dioxide gradually went down. This indicated that the evaporation of water facilitated the fuel cooling.
An even further increase in the water concentration led to a considerable decrease in the fuel temperature inside the illuminated area with a corresponding reduction in the production of all the gases. However, the ratio of the dominating combustible component (CO) to the dominating passive gas (CO2) changed here, showing a way to increase the calorific value of syngas. The next step of the water concentration increase was followed by a decrease in the production of gases and made no sense in terms of the fuel conversion.
Figure 3b shows the curves of gasification results vs. lignite moisture. An increase in the water concentration from 15 wt.% to 35 wt.% intensified the production of most gases (excluding SO2). However, the production of carbon oxides did not grow so sharply as in the case of the peat-based mixture. A further increase in the water content by 10 wt.% lead to a substantial decrease in the production of all gases. The fuel composition with such a big amount of water could not be gasified using the proposed method within a reasonable time because of the long duration of drying of extra water. The fuel moisture range from 35 to 45 wt.% was interesting in terms of experimenting with the ratio of the main combustible and non-combustible conversion products.
The total volume of the produced gases was quite small. Knowing the capacity of the gas-analyzer pump, the volume of the main gasification products could be calculated. It was about 100 mm3 for lignite and less than 50 mm3 for peat. In both cases, approximately 55% of the gases was CO2, 35–38% CO, and 7–8% H2. Of course, these numbers represented a very rough estimate because many factors influenced the gas flow (like atmospheric pressure, the cleanliness of the pipe walls, the pump residual life, etc.).

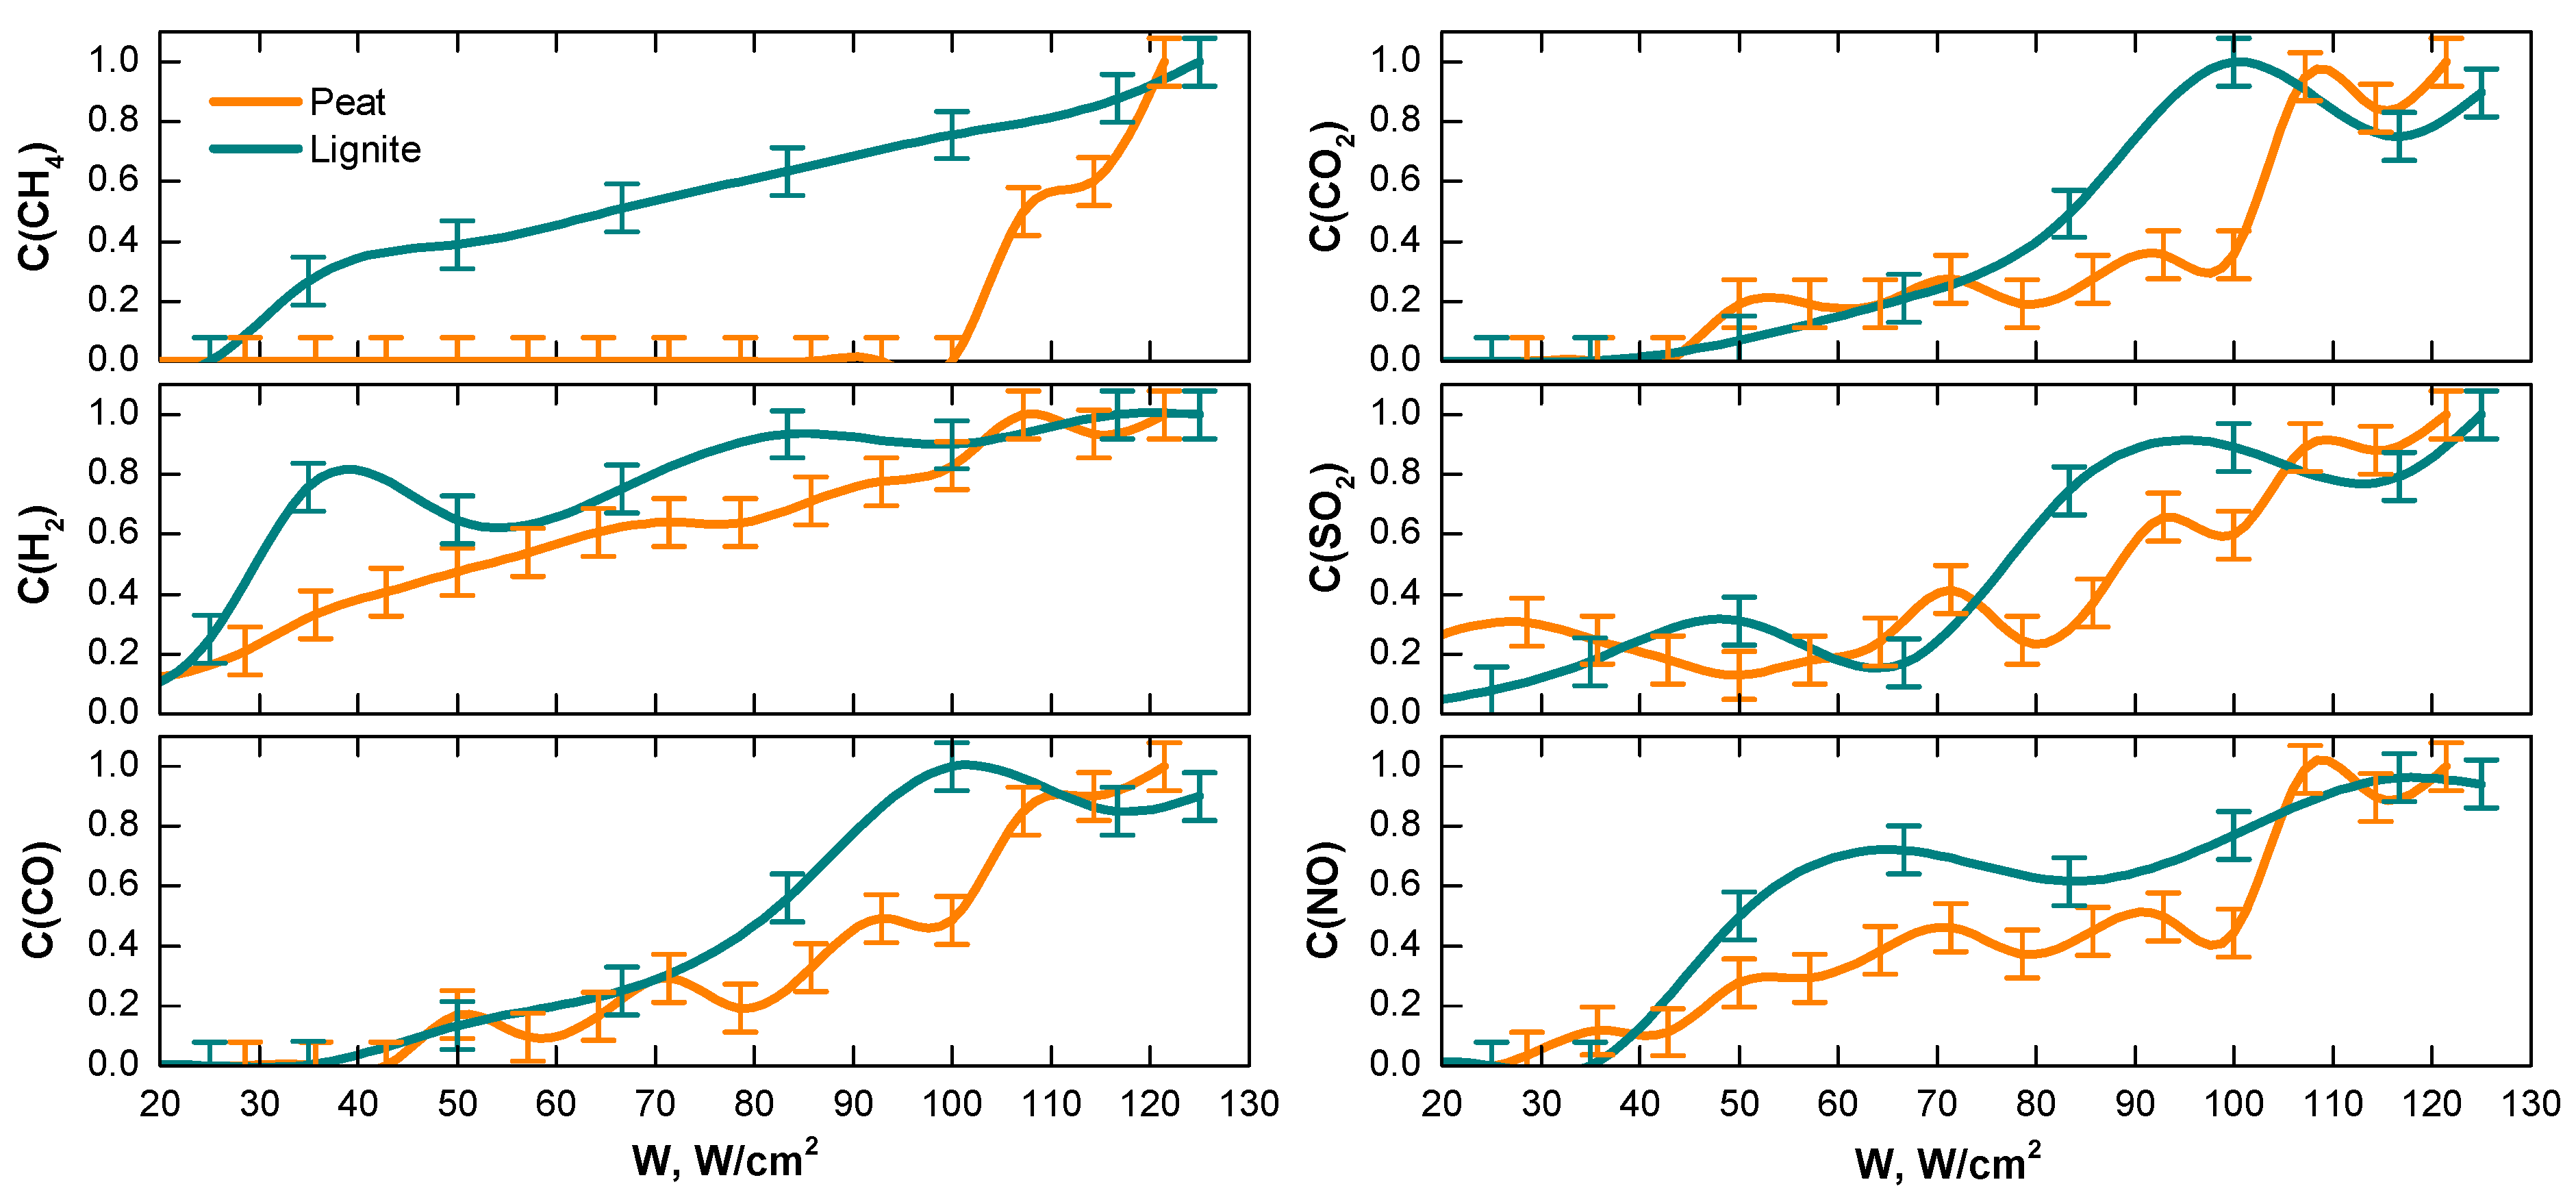
3.3. Fuel Gasification at Various Light Flow Intensities

As was shown above, the intensity of the light flow that pumped heat into the reaction volume determined the temperature of the fuel surface. This had a considerable effect on the heat dissipation inside the fuel layer, which was also conditioned by the fuel properties. Using the findings from the previous section, the fuel moisture content could be determined that provided the highest ratio of CO and CO2 concentrations, that is the fuel composition with the highest calorific value of syngas. These fuels were peat with a moisture content of about 25 wt.% and lignite with a water content of about 30 wt.%. The gasification of such compositions using different light flow intensities had some specific aspects. Figure 4 shows the maximum concentrations of different syngas components vs. the incoming light intensity. The concentration values were normalized according to the procedure described above, using the normalization factors presented in Table 3.
As one can see, the concentrations of most gases were growing steadily with a higher light flow intensity. However, there were some obvious jumps in concentrations for peat conversion when the light intensity was about 100 W/cm2. The sharpest jumps were for methane, CO2, CO, and NO. This was very similar to what was observed during the light-induced gasification of coal processing waste [22,23,24] when efficient gasification started just after the light intensity exceeded a certain threshold value. The same was true for the current case: low-intensity heating initiated the fuel pyrolysis with some smoldering centers, and gasification started when heating was strong enough. It is clear from Figure 2 that such intensity corresponded to the surface temperature of approximately 900 K. Thus, we could calculate this surface temperature as an effective temperature threshold for peat conversion.
The curves for lignite showed that there was a certain acceleration of CO, CO2, and SO2 production when the light flow intensity was above 80 W/cm2. However, this increase was much more gradual than in the case of peat conversion. The corresponding surface temperature was about 800 K. Taking into account that the HPD for this fuel mixture was 15–20% higher than for peat, it could be concluded that the fuel surface became colder because heat penetrated into the sample depth. This clearly explained the faster increase in the production of some gases as compared with peat samples. This meant that lignite conversion had a greater effective depth than peat conversion.
A further increase in the light flow intensity accelerated the combustion of both peat and lignite. It was clear that such an increase made no sense in terms of allothermal fuel conversion.
Changes in the weight of the fuel sample, when heated by the light flow, are shown in Figure 5. These changes were equal to the weight of the gasified matter. It was clear that the curves corresponding to higher intensities looked essentially non-linear at the beginning for both peat and lignite. This meant that the weight of the gasified fuel was not proportional to the absorbed energy of the light flow. The duration of this non-linear stage was 5–10 times as long as it was in the gasification of coal processing waste [24]. The contribution of carbon oxidation heat here was comparable with the heat income from an external source.
The second difference from the previous observations was the fact that an increase in the light intensity did not directly increase the slope of the curves (i.e., the gasification acceleration was different from that of bituminous coals). It was clear that some curves coincided although the intensity of heat pumping was increasing. This suggested that the oxidation heat even at the previous light intensity value exceeded the corresponding increase in the external heat flow. Thus, the heat effect of the fuel smoldering had a significant influence on the peat and lignite conversion dynamics. This fact also meant that the conversion was not purely allothermal. However, switching off the external light flow led to a fast decay of the expansion of fuel smoldering. The main part of the hot zone cooled down for some seconds, and the residual islands of the fuel smoldering disappeared within 10–15 s.
The light spot with a diameter of approximately 2–2.5 mm allowed the gasification of about 3 mm3 of the fuel (∼1% of the sample weight) in a hundred seconds. A rather low conversion rate was conditioned by a relatively low density of the heat flow, as well as by the high ash content of the fuel. The ash deposited in the oxidized area reduced the heat penetration into the depth due to lower thermal conductivity.
The process dynamics showed that the proposed technique could be applied when a thin layer of the fuel was fed into the reactor. This layer should continuously move under a spot of focused light at a certain velocity that depends on the thickness of the layer and the actual content of the fuel. In this case, an optimal conversion rate with good usability could be estimated.
The obtained findings indicated that the allothermal gasification processes of peat and lignite developed in a similar way. Identical intensity of light energy pumping and similar conversion rates showed the similarity of the undergoing processes. However, the essential differences in the chemical composition of syngas together with the surface temperatures meant that these fuels differed greatly. One of the important differences was the dependence of the surface temperature on the light flow intensity. As can be seen, the heating of lignite was less efficient due to the difference in the light absorption even in a wet state.
A very different dependence of the concentrations of syngas components on the initial concentration of water showed that the contribution of steam-carbon reactions to gasification was quite different for these two fuel types. The excess of water led to a dramatic decrease in the syngas production, but this fall was much sharper for lignite.
Varying both the initial moisture content of the fuel and the light flow intensity, gasification could be optimized in accordance with the established goals (maximum gas production, minimum amount of non-combustible gases, etc.). Such flexibility of manipulation of the process performance is almost impossible with autothermal processes. It can serve to investigate the fundamental properties of the fuel gasification or to optimize the industrial applications of the proposed approach.
In contrast to the well-known autothermal techniques, the light-induced gasification had some specific aspects:
-
Very low inertia of the undergoing processes that started and stopped within seconds.
-
Easy adjustment of operating parameters for a chosen type of fuel.
-
High efficiency of using solar light (the absorption coefficient of water-fuel mixtures was above 60% for a wide range of fossil fuels).
-
Convenient scaling that allowed the creation of table-sized scientific setups, as well as big solar concentrators.
Of course, the upscaling of the gasifier performance required a proportional increase in the heat source power, when using the allothermal approach. In the case of solar light, it meant an increase in the active area of light concentrator mirrors. The biggest heliothermal plants occupy more than 40 km2 of the Earth’s surface. A simple estimation showed that 1 km2 of mirrors would allow the conversion of 20–30 tons of peat per solar day even in West Siberia. The places with better insolation promise higher performance, but the fuel feeding systems for such gasifiers will be essentially more complicated than the coolant transportation infrastructure of the existing heliothermal plants.

4. Conclusions

The research presented the main aspects of the allothermal gasification of peat and lignite under a focused flow of incoherent light.
  • The required light flow intensities were an order of magnitude lower than for the conversion of bituminous coals and their waste.
  • The effect of the initial moisture content of the fuel was compared with the influence of the light flow intensity. The intensity threshold for peat conversion was shown to be (∼100 W/cm2); above this value, the process accelerated. The fuel moisture content above 50 wt.% and 45 wt.% for peat and lignite, respectively, caused gasification to stop nearly at such an intensity within the reasonable time term.
  • The dynamics of the sample weight changes showed an essential contribution of partial combustion to the fuel conversion. The processes were not purely allothermal, but the observed smoldering of the fuel was not self-sustaining. It stopped in some seconds after the pumping light flow was turned off.
A detailed analysis of the practical application of the proposed approach both technically and economically can be the subject of future investigations.

Author Contributions

Conceptualization, R.I.E.; methodology, A.S.Z. and I.P.O.; software, R.I.E. and R.I.T.; validation, A.S.Z. and I.P.O.; formal analysis, I.P.O. and A.O.P.J.; investigation, A.S.Z. and R.I.T.; resources, I.P.O.; data curation, I.P.O. and A.O.P.J.; writing, original draft preparation, R.I.E. and A.O.P.J.; writing, review and editing, R.I.E., A.O.P.J., and I.P.O.; visualization, A.S.Z. an R.I.T.; supervision, R.I.E.; project administration, R.I.E.; funding acquisition, R.I.E. All authors read and agreed to the published version of the manuscript.

Funding

The study of peat gasification was funded by the Russian Foundation for Basic Research, the National Council of Brazil for Scientific and Technological Development, and the Ministry of Science & Technology Government of India according to the research project No. 19-53-80019. The investigation of the lignite conversion was partially supported by the Tomsk Polytechnic University Competitiveness Enhancement Program.

Conflicts of Interest

The authors declare no conflict of interest.

Abbreviations

The following abbreviations are used in this manuscript:
FWHMFull width at half maximum
HPDHeat penetration depth
LWIRLong-wavelength infrared (8–15 μm)
TISThermal imaging system

References

  1. BP Statistical Review of World Energy, 68th ed.; BP: London, UK, 2019; Available online: bp.com/statisticalreview (accessed on 8 April 2020).
  2. Toftegaard, M.B.; Brix, J.; Jensen, P.A.; Glarborg, P.; Jensen, A.D. Oxy-fuel combustion of solid fuels. Prog. Energy Combust. Sci. 2010, 36, 581–625. [Google Scholar] [CrossRef]
  3. Toporov, D.; Abraham, R. Gasification of low-rank coal in the High-Temperature Winkler (HTW) process. J. S. Afr. Inst. Min. Metall. 2015, 115, 589–597. [Google Scholar] [CrossRef]
  4. Bharathiraja, B.; Sudharsanaa, T.; Bharghavi, A.; Jayamuthunagai, J.; Praveenkumar, R. Biohydrogen and Biogas: An overview on feedstocks and enhancement process. Fuel 2016, 185, 810–828. [Google Scholar] [CrossRef]
  5. Tchapda, A.H.; Pisupati, S.V. A review of thermal co-conversion of coal and biomass/waste. Energies 2014, 7, 1098–1148. [Google Scholar] [CrossRef] [Green Version]
  6. Ni, M.; Leung, D.Y.C.; Leung, M.K.H.; Sumathy, K. An overview of hydrogen production from biomass. Fuel Proc. Technol. 2006, 87, 461–472. [Google Scholar] [CrossRef]
  7. Abdoulmoumine, N.; Adhikari, S.; Kulkarni, A.; Chattanathan, S. A review on biomass gasification syngas cleanup. Appl. Energy 2015, 155, 294–307. [Google Scholar] [CrossRef]
  8. Beller, M.; Cornils, B.; Frohning, C.D.; Kohlpaintner, C.W. Progress in hydroformylation and carbonylation. J. Mol. Catal. A Chem. 1995, 104, 17–85. [Google Scholar] [CrossRef]
  9. Sheldon, R.A. Green and sustainable manufacture of chemicals from biomass: State of the art. Green Chem. 2014, 16, 950–963. [Google Scholar] [CrossRef]
  10. Cheng, G.; Niu, Z.; Zhang, C.; Zhang, X.; Li, X. Extraction of humic acid from lignite by KOH-hydrothermal method. Appl. Sci. 2019, 9, 1356. [Google Scholar] [CrossRef] [Green Version]
  11. Adanez, J.; Abad, A.; Garcia-Labiano, F.; Gayan, P.; De Diego, L.F. Progress in chemical-looping combustion and reforming technologies. Prog. Energy Combust. Sci. 2012, 38, 215–282. [Google Scholar] [CrossRef] [Green Version]
  12. Hosseini, S.E.; Wahid, M.A. Hydrogen production from renewable and sustainable energy resources: Promising green energy carrier for clean development. Renew. Sustain. Energy Rev. 2016, 57, 850–866. [Google Scholar] [CrossRef]
  13. Chen, M.-H.; Chyou, Y.-P.; Wang, T. Simulation of coal gasification in a low-temperature, high-pressure entrained-bed reactor with a volatiles condensation and re-evaporation model. Appl. Sci. 2019, 9, 510. [Google Scholar] [CrossRef] [Green Version]
  14. Amelin, I.I.; Salgansky, E.A.; Volkova, N.N.; Zholudev, A.F.; Alekseev, A.P.; Polianchik, E.V.; Manelis, G.B. Region of the stationary filtration combustion wave in the charge with a low carbon content. Russ. Chem. Bull. Int. Ed. 2011, 60, 1150–1157. [Google Scholar] [CrossRef]
  15. Salganskaya, M.V.; Glazov, S.V.; Salganskii, E.A.; Kislov, V.M.; Zholudev, A.F.; Manelis, G.B. Filtration combustion of humid fuels. Russ. J. Phys. Chem. B 2008, 2, 71–76. [Google Scholar]
  16. Sobek, S.; Werle, S. Comparative Review of Artificial Light Sources for Solar-Thermal Biomass Conversion Research Applications. Ecol. Chem. Eng. S 2019, 26, 443–453. [Google Scholar] [CrossRef] [Green Version]
  17. Gregg, D.W.; Taylor, R.W.; Campbell, J.H.; Taylor, J.R.; Cotton, A. Solar gasification of coal, activated carbon, coke and coal and biomass mixtures. Sol. Energy 1980, 25, 353–364. [Google Scholar] [CrossRef]
  18. Batenin, V.M.; Zalkind, V.I.; Kovbasyuk, V.I.; Rogov, B.V. Power Plants with a Biotechnological Fuel Cycle. Ther. Eng. 1997, 44, 291–295. [Google Scholar]
  19. Pal, D.B.; Chand, R.; Upadhyay, S.N.; Mishra, P.K. Performance of water gas shift reaction catalysts: A review. Renew. Sustain. Energy Rev. 2018, 93, 549–565. [Google Scholar] [CrossRef]
  20. Barati, M.; Esfahani, S.; Utigard, T.A. Energy recovery from high temperature slags. Energy 2011, 36, 5440–5449. [Google Scholar] [CrossRef]
  21. Pramanik, S.; Ravikrishna, R.V. A review of concentrated solar power hybrid technologies. Appl. Ther. Eng. 2017, 127, 602–637. [Google Scholar] [CrossRef]
  22. Egorov, R.I.; Strizhak, P.A. The light-induced gasification of waste-derived fuel. Fuel 2017, 197, 28–30. [Google Scholar] [CrossRef]
  23. Zaitsev, A.S.; Egorov, R.I.; Strizhak, P.A. Light-induced gasification of the coal-processing waste: Possible products and regimes. Fuel 2018, 212, 347–352. [Google Scholar] [CrossRef]
  24. Egorov, R.I.; Zaitsev, A.S.; Li, H.; Gao, X.; Strizhak, P.A. Intensity dependent features of the light-induced gasification of the waste-derived coal-water compositions. Renew. Energy 2020, 146, 1667–1675. [Google Scholar] [CrossRef]
  25. Bergman, T.L.; Incropera, F.P.; DeWitt, D.P.; Lavine, A.S. Fundamentals of Heat and Mass Transfer, 7th ed.; Wiley: Hoboken, NJ, USA, 2011. [Google Scholar]
  26. Ortiz, M.; Gonzales, N.; Guzman, C.; Paiva, E.; Bello, E. Thermal Conductivity of Mixtures. Ther. Cond. 1985, 18, 213–223. [Google Scholar]
Figure 1. Scheme of the experimental setup (a) and the normalized emission spectrum of the lamp vs. the standard solar spectrum ASTM G173-03 (b). (a) presents a chamber (Ch) with a fuel, a gas analyzer (GA), and a light concentrating mirror (LC).
Applsci 10 02640 g001
Figure 2. Fuel surface temperature vs. light flow intensity during gasification.
Applsci 10 02640 g002
Figure 3. Chemical composition of syngas vs. moisture content of fuel composition. The products of peat and lignite conversion are shown in (a,b), respectively. The normalization factors for the concentrations of each gas are shown Table 2.
Applsci 10 02640 g003
Figure 4. Chemical composition of syngas vs. light flow intensity. The normalization factors of concentrations of each gas are shown in Table 3.
Applsci 10 02640 g004
Figure 5. Weight of syngas vs. conversion time of gasification of peat (a) and lignite (b) at different light flow intensities.
Applsci 10 02640 g005
Table 1. Results of the chemical analysis of peat and lignite.
FuelC daf , %H daf , %N daf , %S daf , %O daf , %
Lignite74.523.080.730.8520.8
Peat52.066.313.580.237.85
Table 2. Normalization factors for the concentrations of syngas components presented in Figure 3.
FuelCH4, ppmH2, ppmCO, ppmCO2, ppmSO2, ppmNO, ppm
Peat1421410609095304353
Lignite356261315,17022,6103326
Table 3. Normalization factors for the concentrations of syngas components presented in Figure 4.
FuelCH4, ppmH2, ppmCO, ppmCO2, ppmSO2, ppmNO, ppm
Peat951314441156002539
Lignite10576142405100109

