1. Introduction
The seismic response mitigation and seismic protection of structures have been discussed in recent decades [
1,
2,
3,
4,
5,
6,
7,
8,
9,
10,
11,
12,
13,
14,
15,
16,
17]. For tunnels, coating with soft seismic isolation materials has been studied by many researchers. The seismic isolation effect of a rectangular-shaped tunnel was investigated by Shimamura et al. (1999). In their work, the seismic isolation layers were installed in two patterns. An isolation layer wasused around a new tunnel, or the vertical isolation walls were equipped at both sides of an existing tunnel [
1]. Kim and Konagai (2000), Kim and Konagai (2001), and Konagai and Kim (2001) showed that materials with a low Poisson’s ratio and a low shear modulus were preferable for enhancing the seismic efficiency of an isolation layer. They studied the influence of key material properties, such as the reduction factor (TF
coat/TF
uncoat), on the seismic isolation effect. TF
coat and TF
uncoat are the transferring factorsin the cases with and without coating [
2,
3,
4]. Takemine (2004) combined the 3D finite element method and centrifuge model to demonstrate the effectiveness of the isolation layer and cement solidification surrounding the tunnel [
5]. Kiryu et al. (2012) used a polymer isolation method to reduce the seismic effect on the tunnel, and the influences of shear stiffness and thicknesses of soil covering the tunnel were studied [
6]. Zhao et al. (2013, 2018) and Ma et al. (2018) retrofitted the tunnel with foamed concrete, andthe subsequent effectiveness of seismic isolation was evaluated by both numerical and experimental methods [
7,
8,
9]. Xu et al. (2016) investigated the dynamic earth pressure on the tunnel via a shaking table test. They pointed out that when a geo-foam isolation layer was utilized, the earth pressure decreased to 10%–30% of that without a seismic isolation layer [
10]. Chen et al. (2018) conducted two dynamic centrifuge tests to demonstrate the isolation effectiveness of rubber under seismic loads. The test results showed that the rubber isolation layer effectively decreased dynamic bending moments for tunnels with various diameters [
11]. According to the numerical results of Roy et al. (2019), a significant reduction of axial forces and bending moments of the lining was observed when Expanded Polystyrene Geo-foam was utilized to coat the lining [
12]. Furthermore, Li (2012) went through the investigations and damage features of tunnels after the Wenchuan earthquake, and he concluded that the isolation layers were able to enhance the seismic isolation performance [
13].
Implementing an isolation layer is a typical passive seismic isolation method. As mentioned before, the effectiveness of seismic isolation layers using rubber, foamed concrete, asphalt-based grouting materials [
14], aluminum foam [
15], or polymeric materials has been verified, but these materials have some disadvantages. The strength of rubber is easily affected by changesin temperature and is weak at preventing corrosion. The strength of foam concrete is affected by freezing and thawing when water goes into the fissure of foam concrete, and it lacks the ability to provide consistent compressive strength. Asphalt-based grouting materials are sensitive to temperature [
14]. Aluminum foamis prone to having slight cracks after cooling due to the characteristics of thermal expansion and cold contraction [
15].
According to the work of Guo and Wang (2009), Wang et al. (2011a), Wang et al. (2011b), and Shi (2012), the non-water reacted two-component polymeric material (NRTCPM) is composed ofpolyol and polymethylene polyphenyl isocyanate. When mixed together in a specific proportion, the foamed NRTCPM is formed [
18]. This material is more corrosion-resistant than rubber, and can achieve adequate strength earlier than foam concrete [
18,
19,
20,
21,
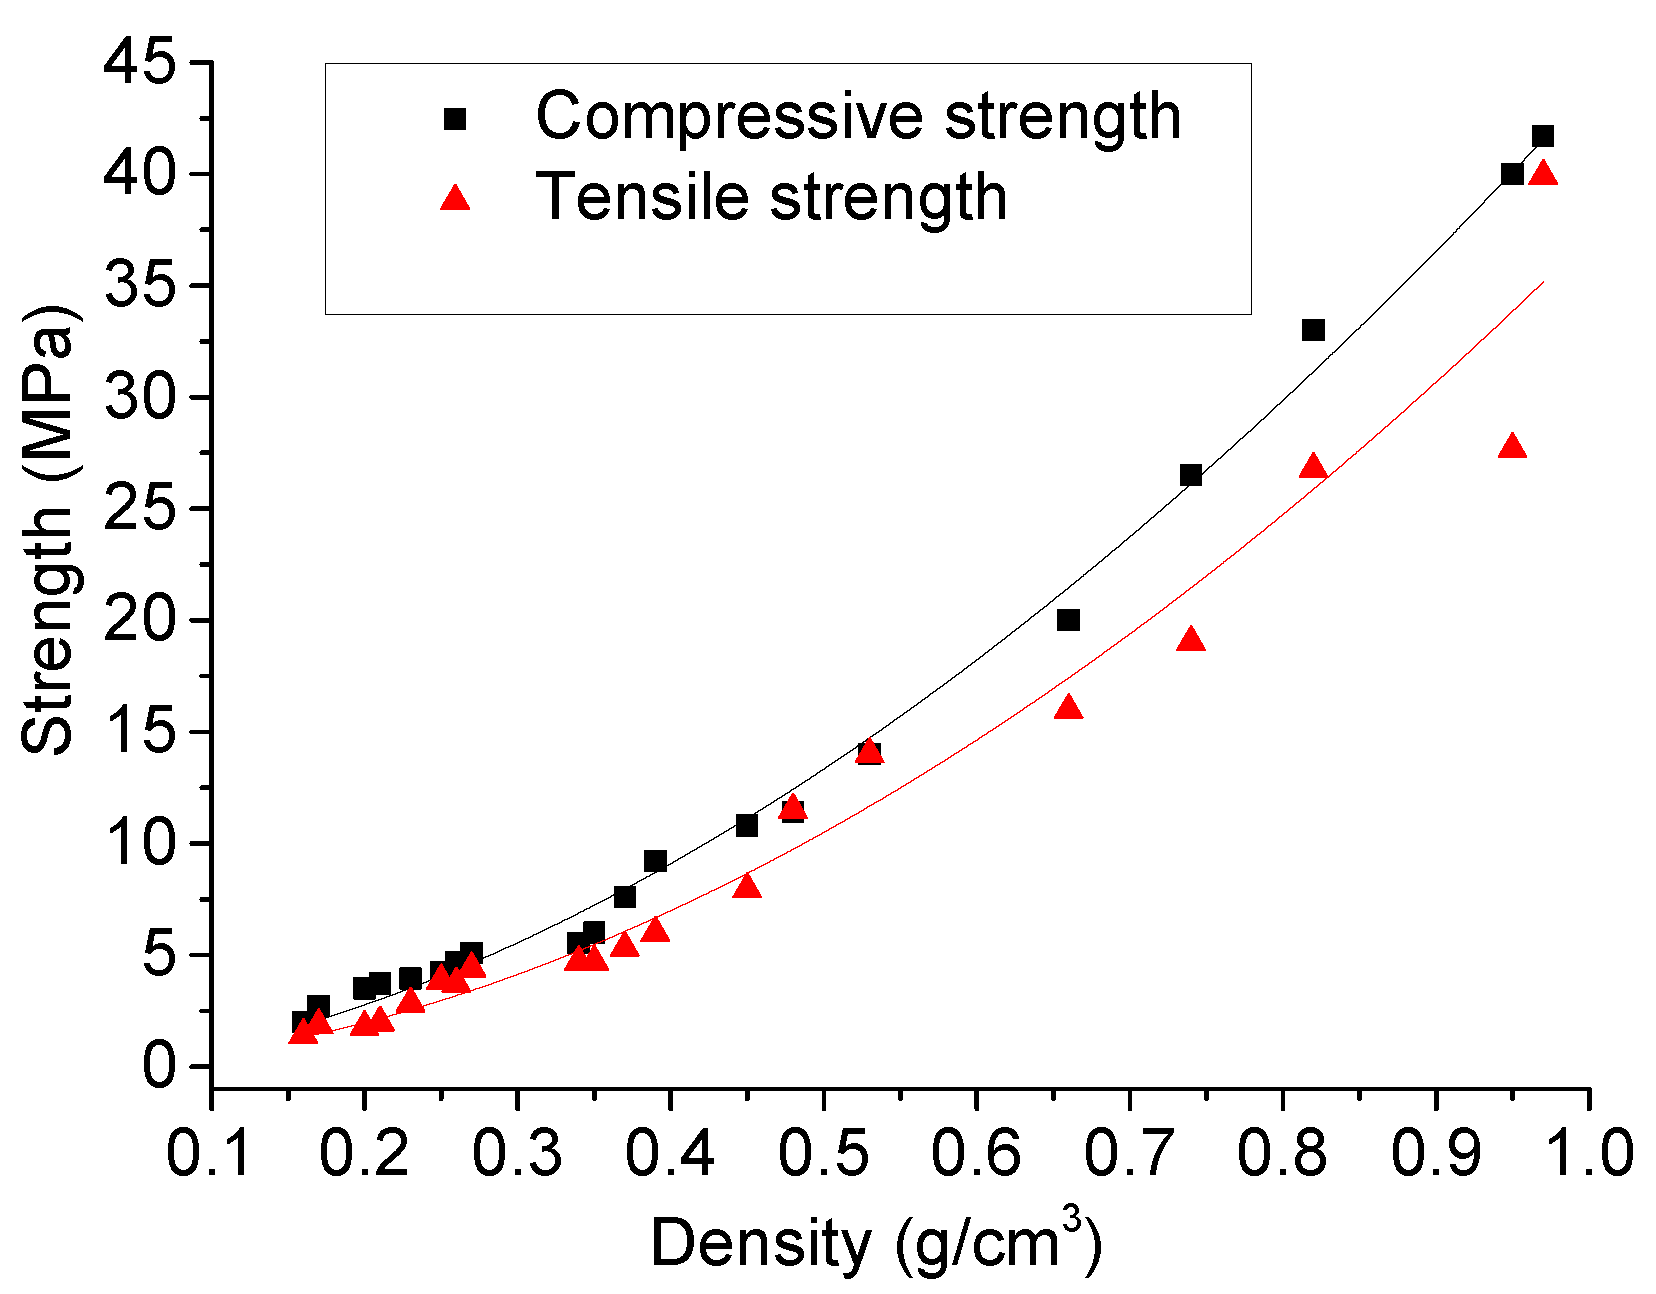
22]. As shown in
Figure 1, the tensile strength and compressive strength of NRTCPM are one order ofmagnitude, and the tensile strength has a much better performance than cement [
22]. In terms of the mechanical and tribological properties, scanning electron microscope (SEM) [
23] and the atomic force microscopy method (AFM) [
24] have been applied to measure the mechanical and tribological properties of polymer and copoly. Gao Xiang et al. (2017) applied SEM to test NRCPM specimens with different densities. The higher the density of the specimen is, the more stable the microstructure is. Specimens with a lower density are polyhedrons, and their contact area is large [
24]. Based on the mechanical properties and microstructure of NRTCPM, it has many advantages.To be specific, NRTCPM has a better waterproof performance and durability than traditional expansive polymer. It can expand rapidly (up to 10 to 20 times its initial volume) and immediately after injection, therefore saving time in the construction process. Furthermore, it does not shrink or cause additional load on the structure, and it is environmentally-friendly. The equipment for injecting NRTCPM is movable, convenient, and affordable. Li et al. (2016) studied the effectiveness of the seismic response mitigation of NRTCPM for a dam via a centrifuge test [
25]; however, to the best knowledge of the authors, this material has never been utilized for the seismic isolation of tunnels.
Within this framework, this paper aims to apply this novel NRTCPM as the isolation layer material to cover the tunnel. The compressive and tensile strength of this polymeric material is investigated, and the damping ratios and dynamic elastic moduli are obtained by an Impact Resonance Test (IRT). Furthermore, a parametric study is conducted to evaluate the influence of material properties (e.g., densities, Poisson’s ratio, shear modulus, elastic modulus, etc.) on the seismic response of the lining.
5. Conclusions
The main conclusions are as follows:
An impact resonance test is a reasonable and effective method to gain a damping ratio and dynamic elastic modulus of NRTCPM. When NRTCPM’s density is approximately 0.2 g/cm3, the average damping ratio is 0.0375, and the average dynamic elastic modulus is 359.025 MPa from the results of IRT. In future studies, IRT can be used to gain the damping ratios and dynamic elastic moduli of other densities’ NRTCPM.
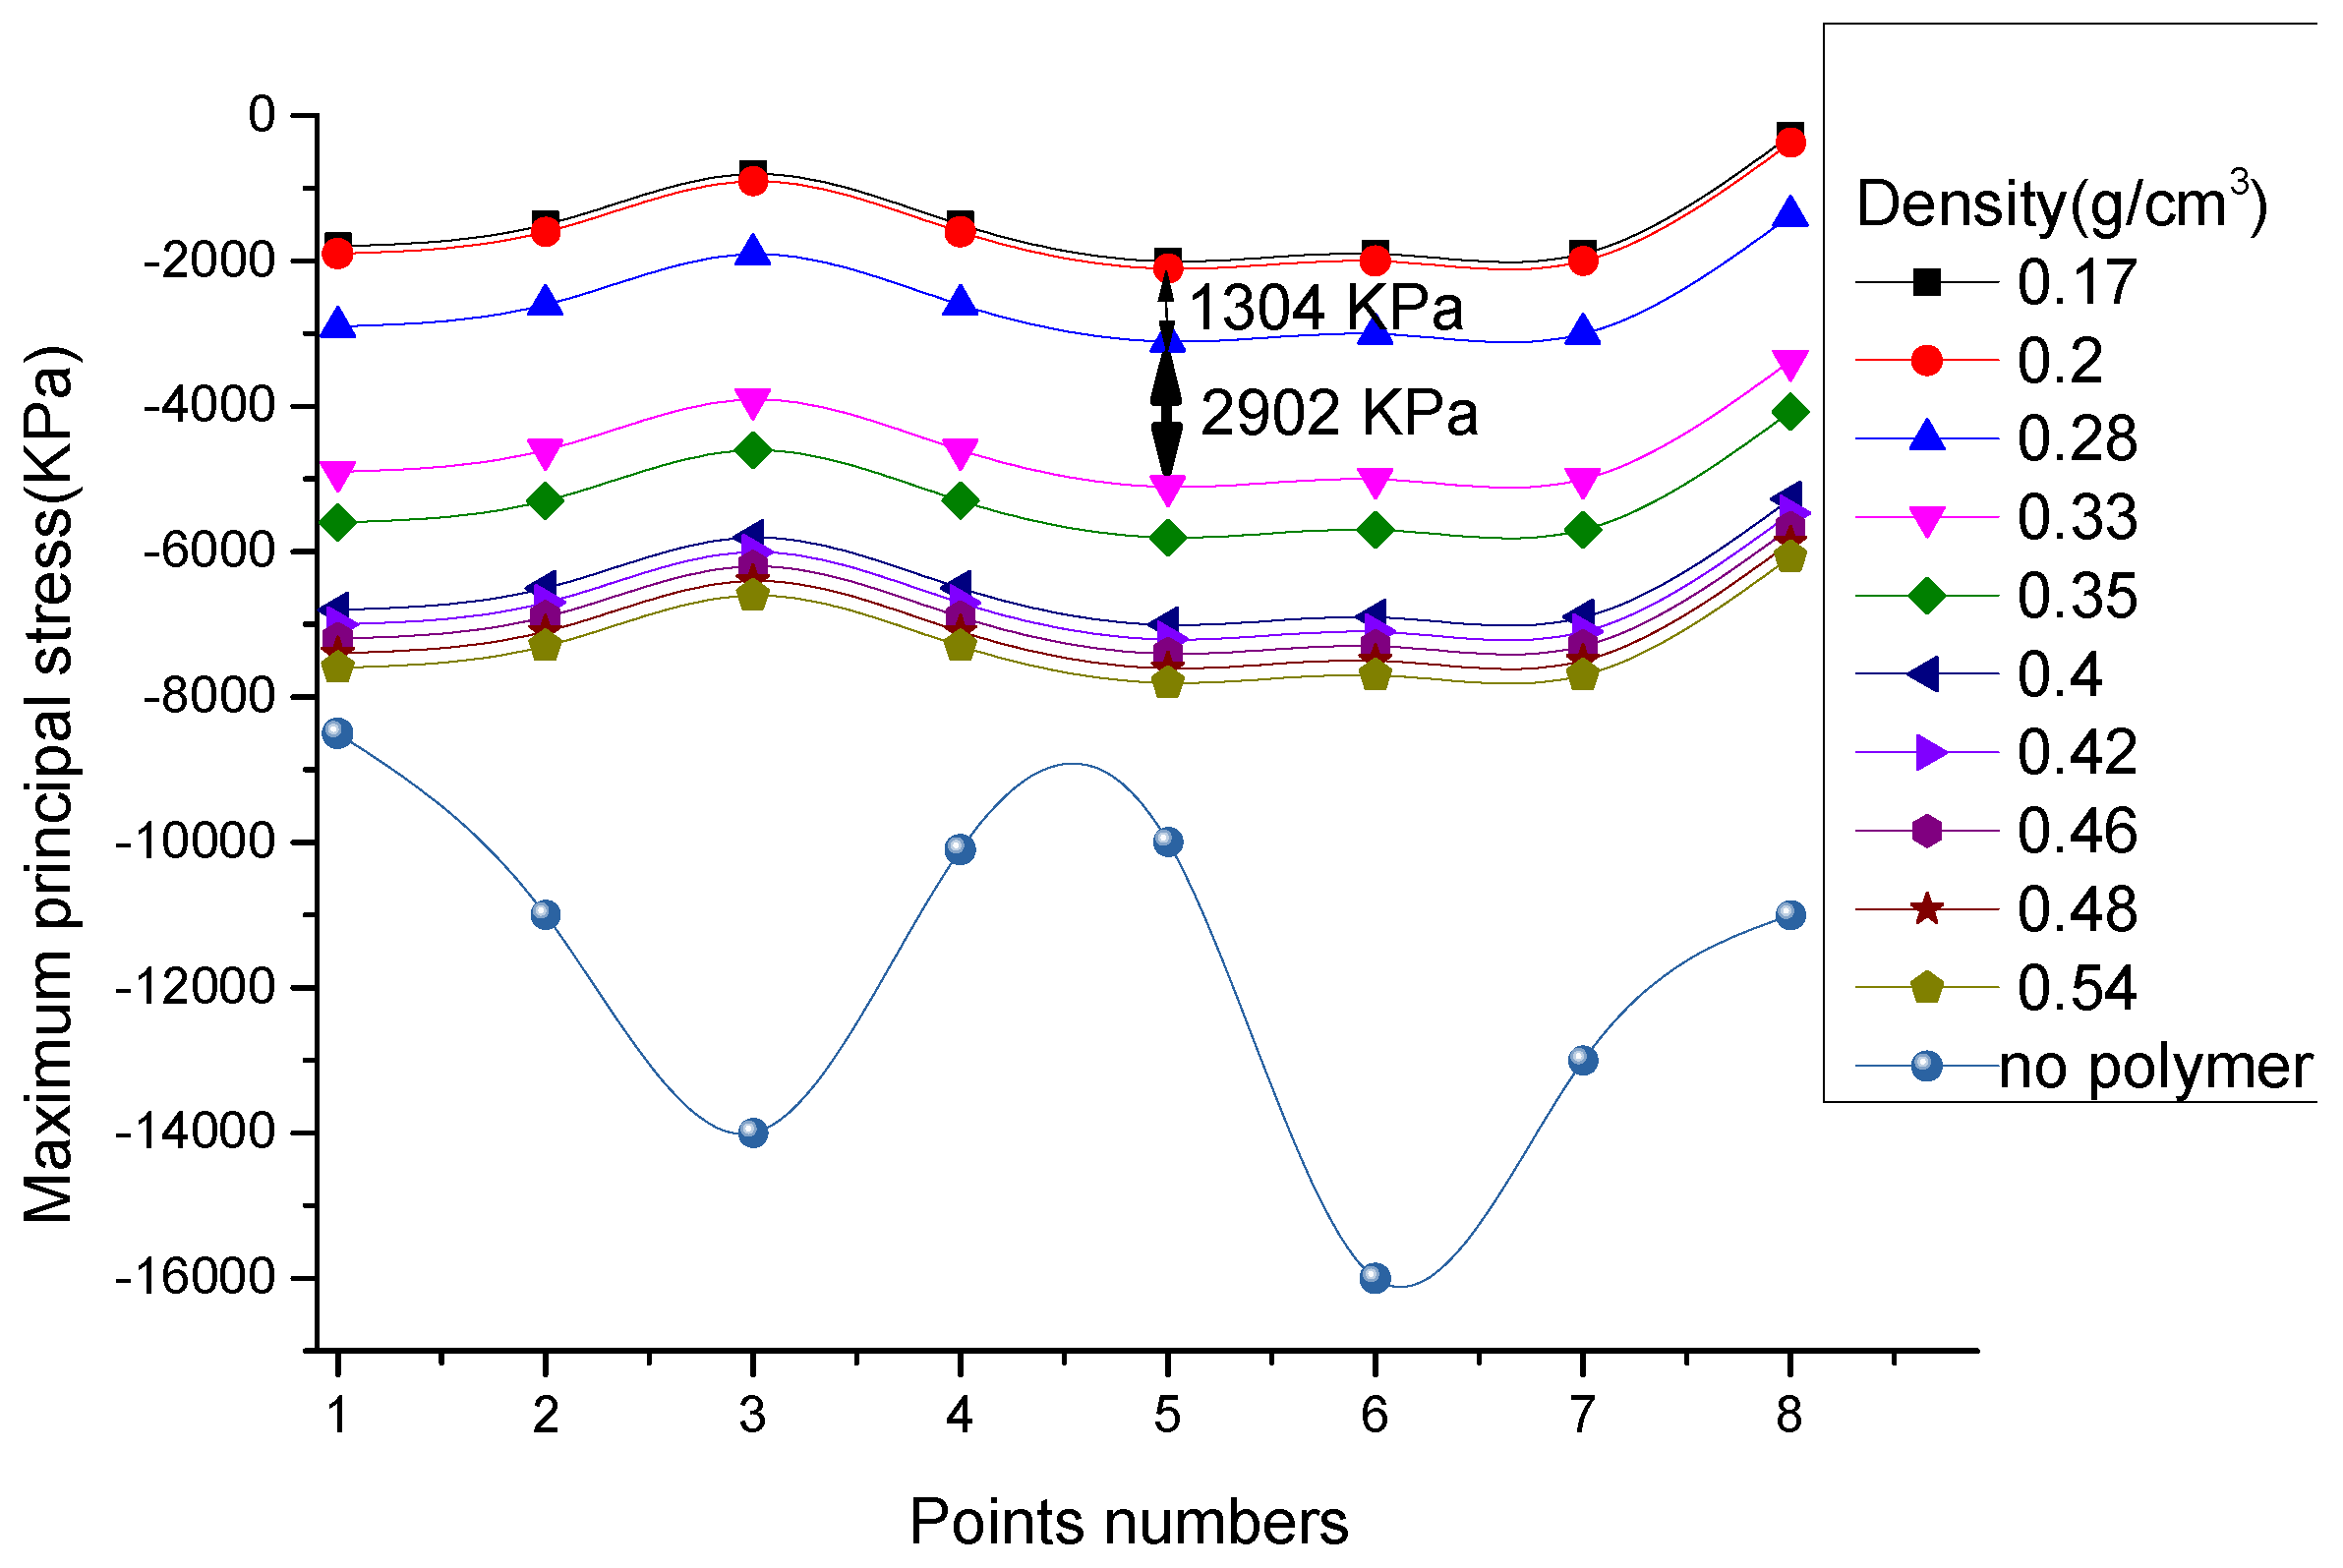
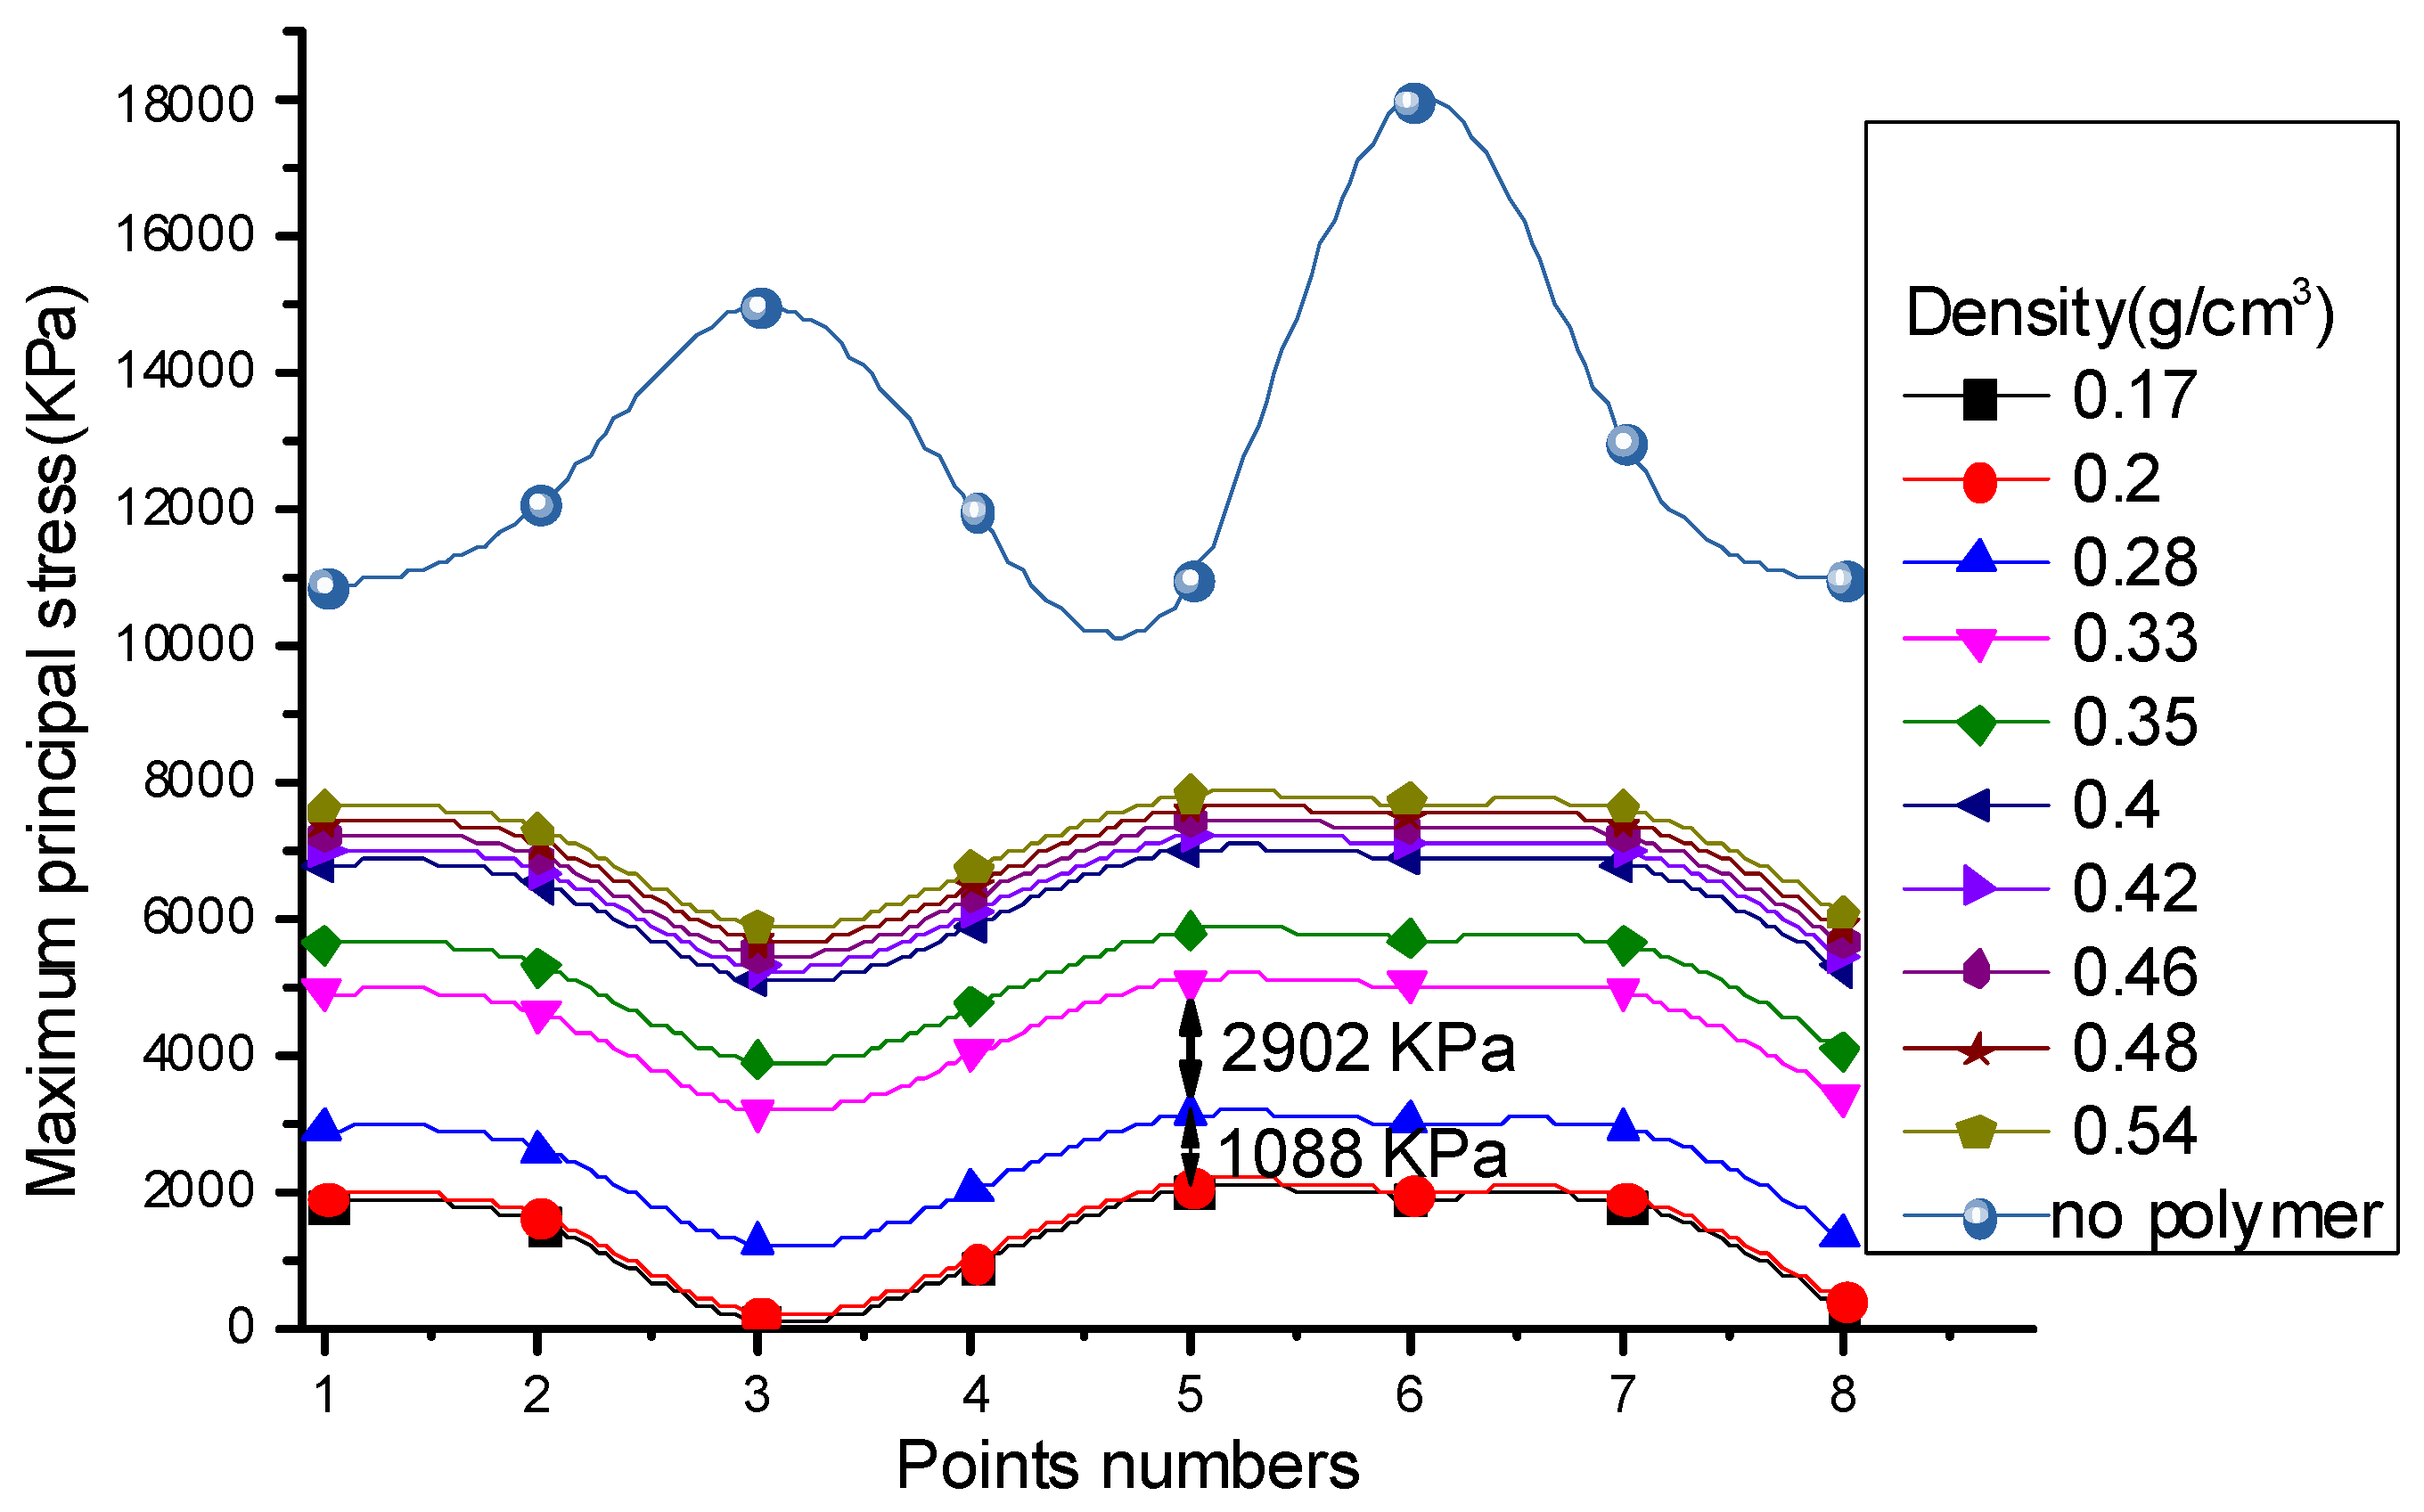
The NRTCPM is found to have good capabilities to reduce the seismic demand and attenuate the seismic load. It offers superior capabilities to protect tunnels under seismic load.
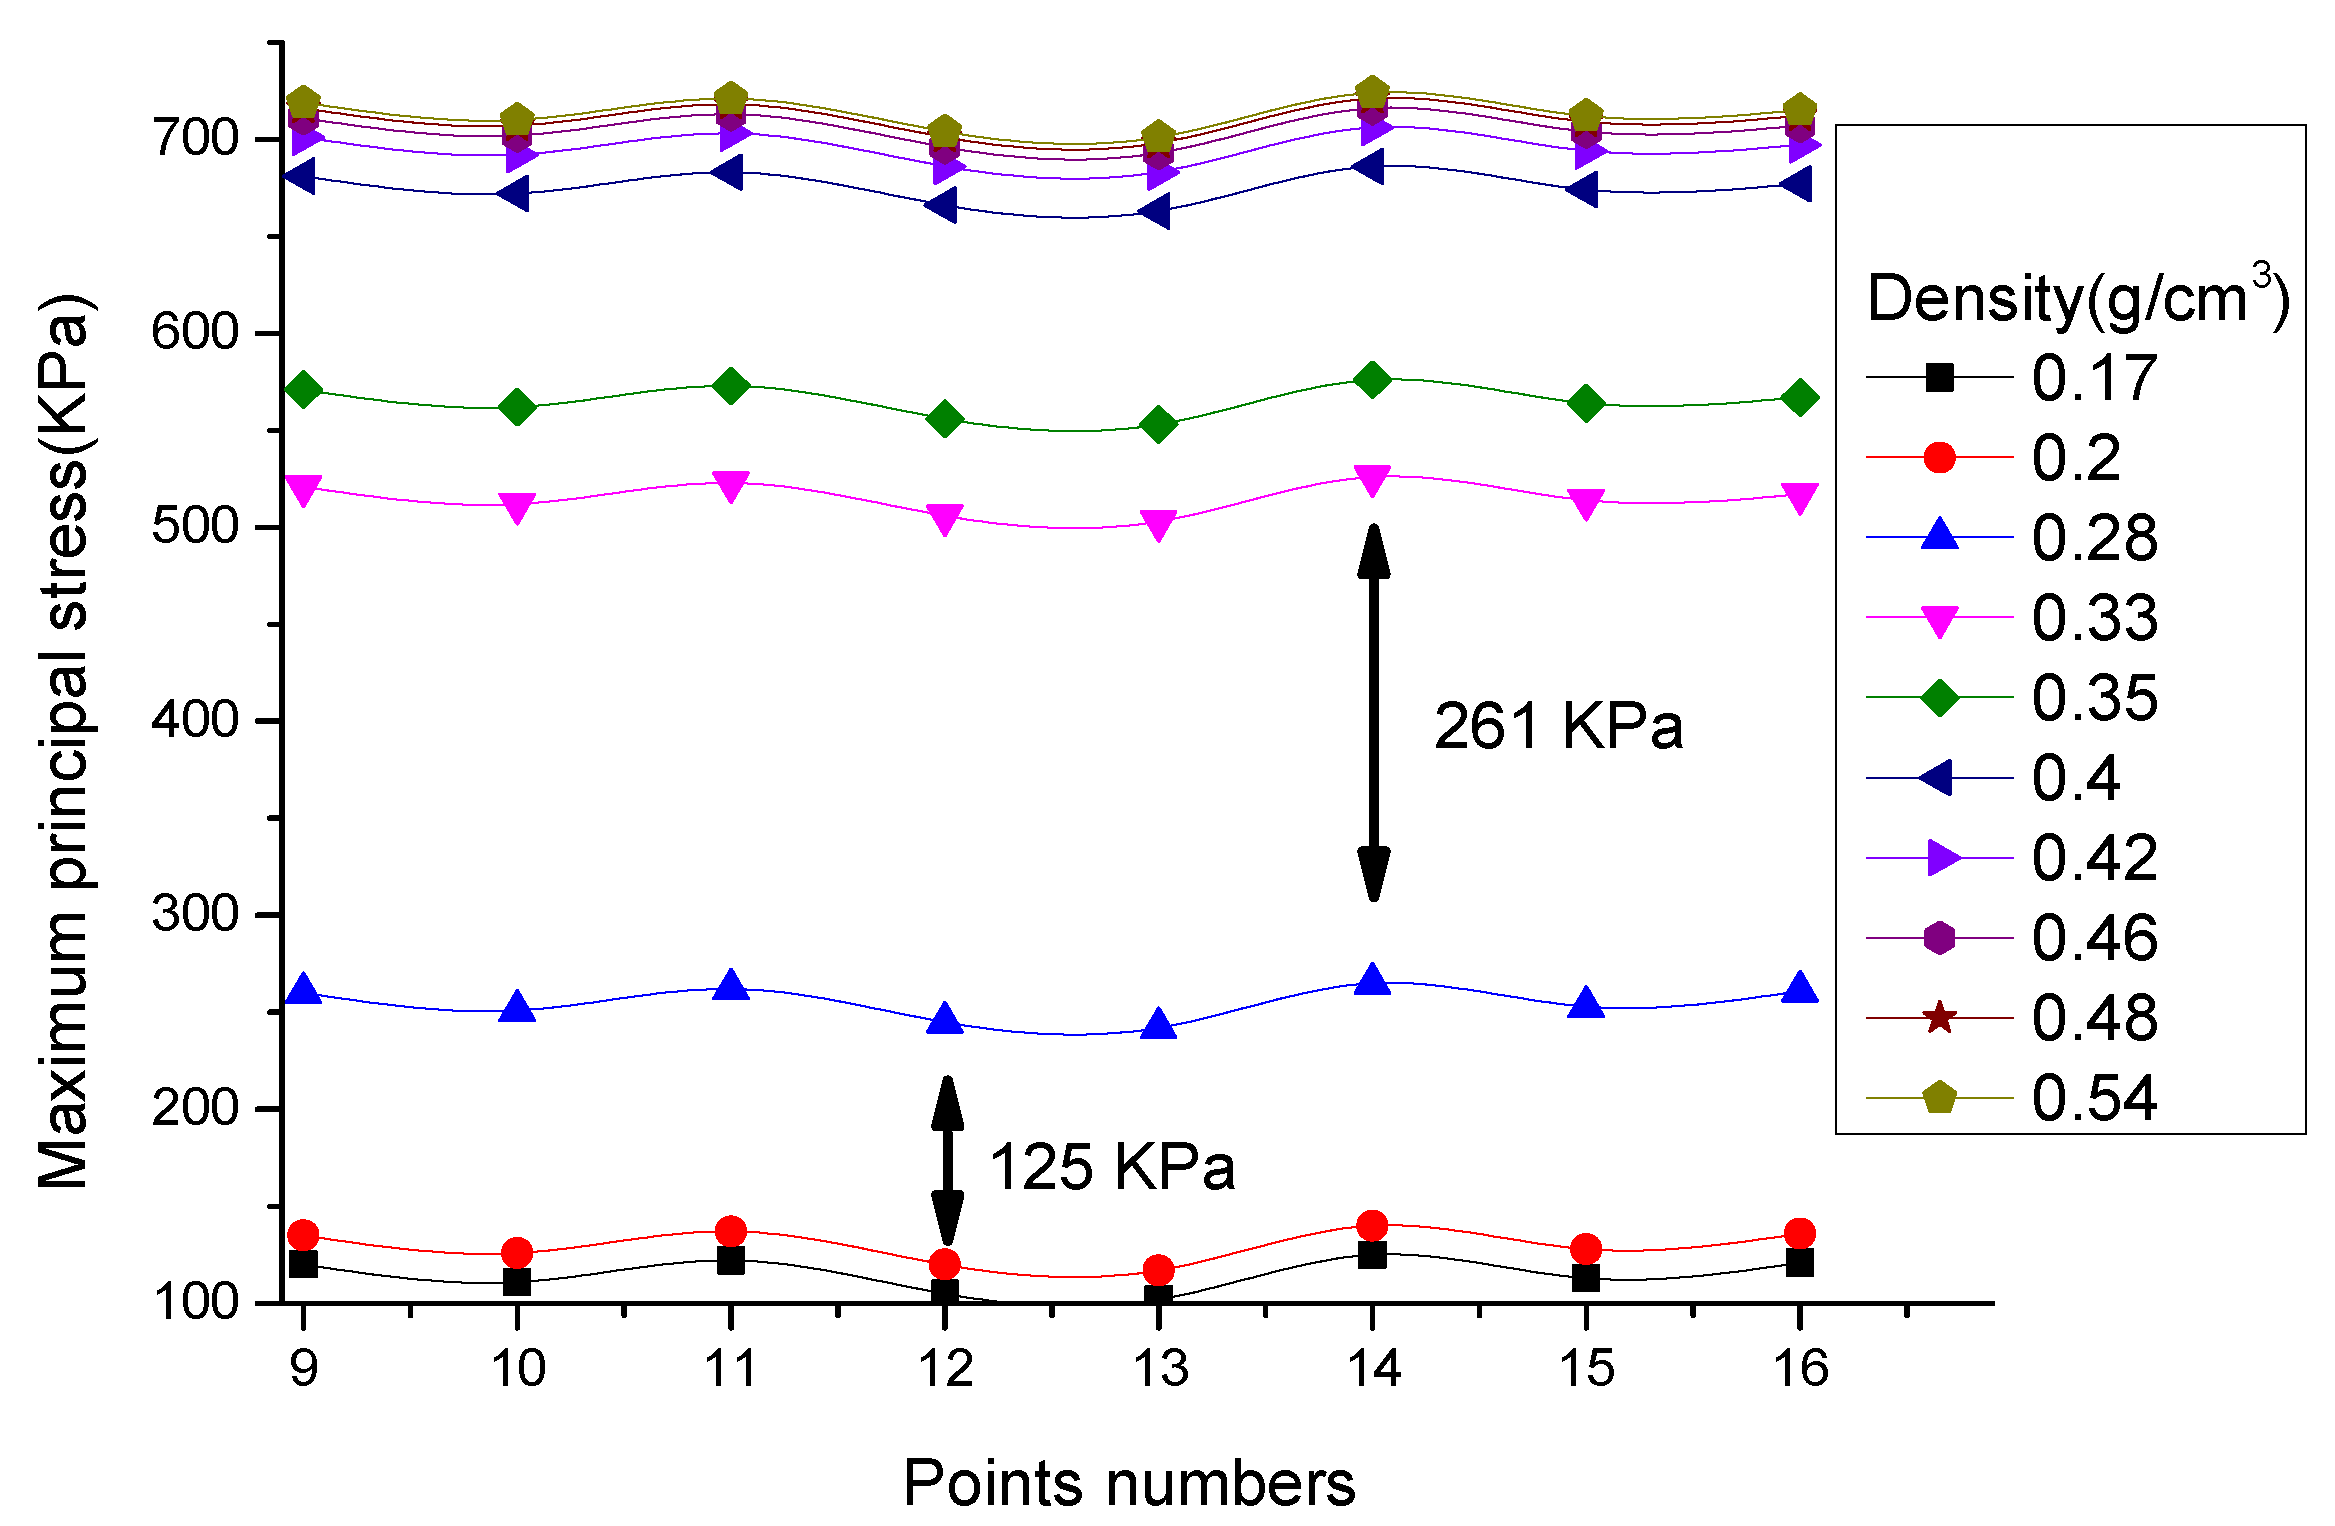
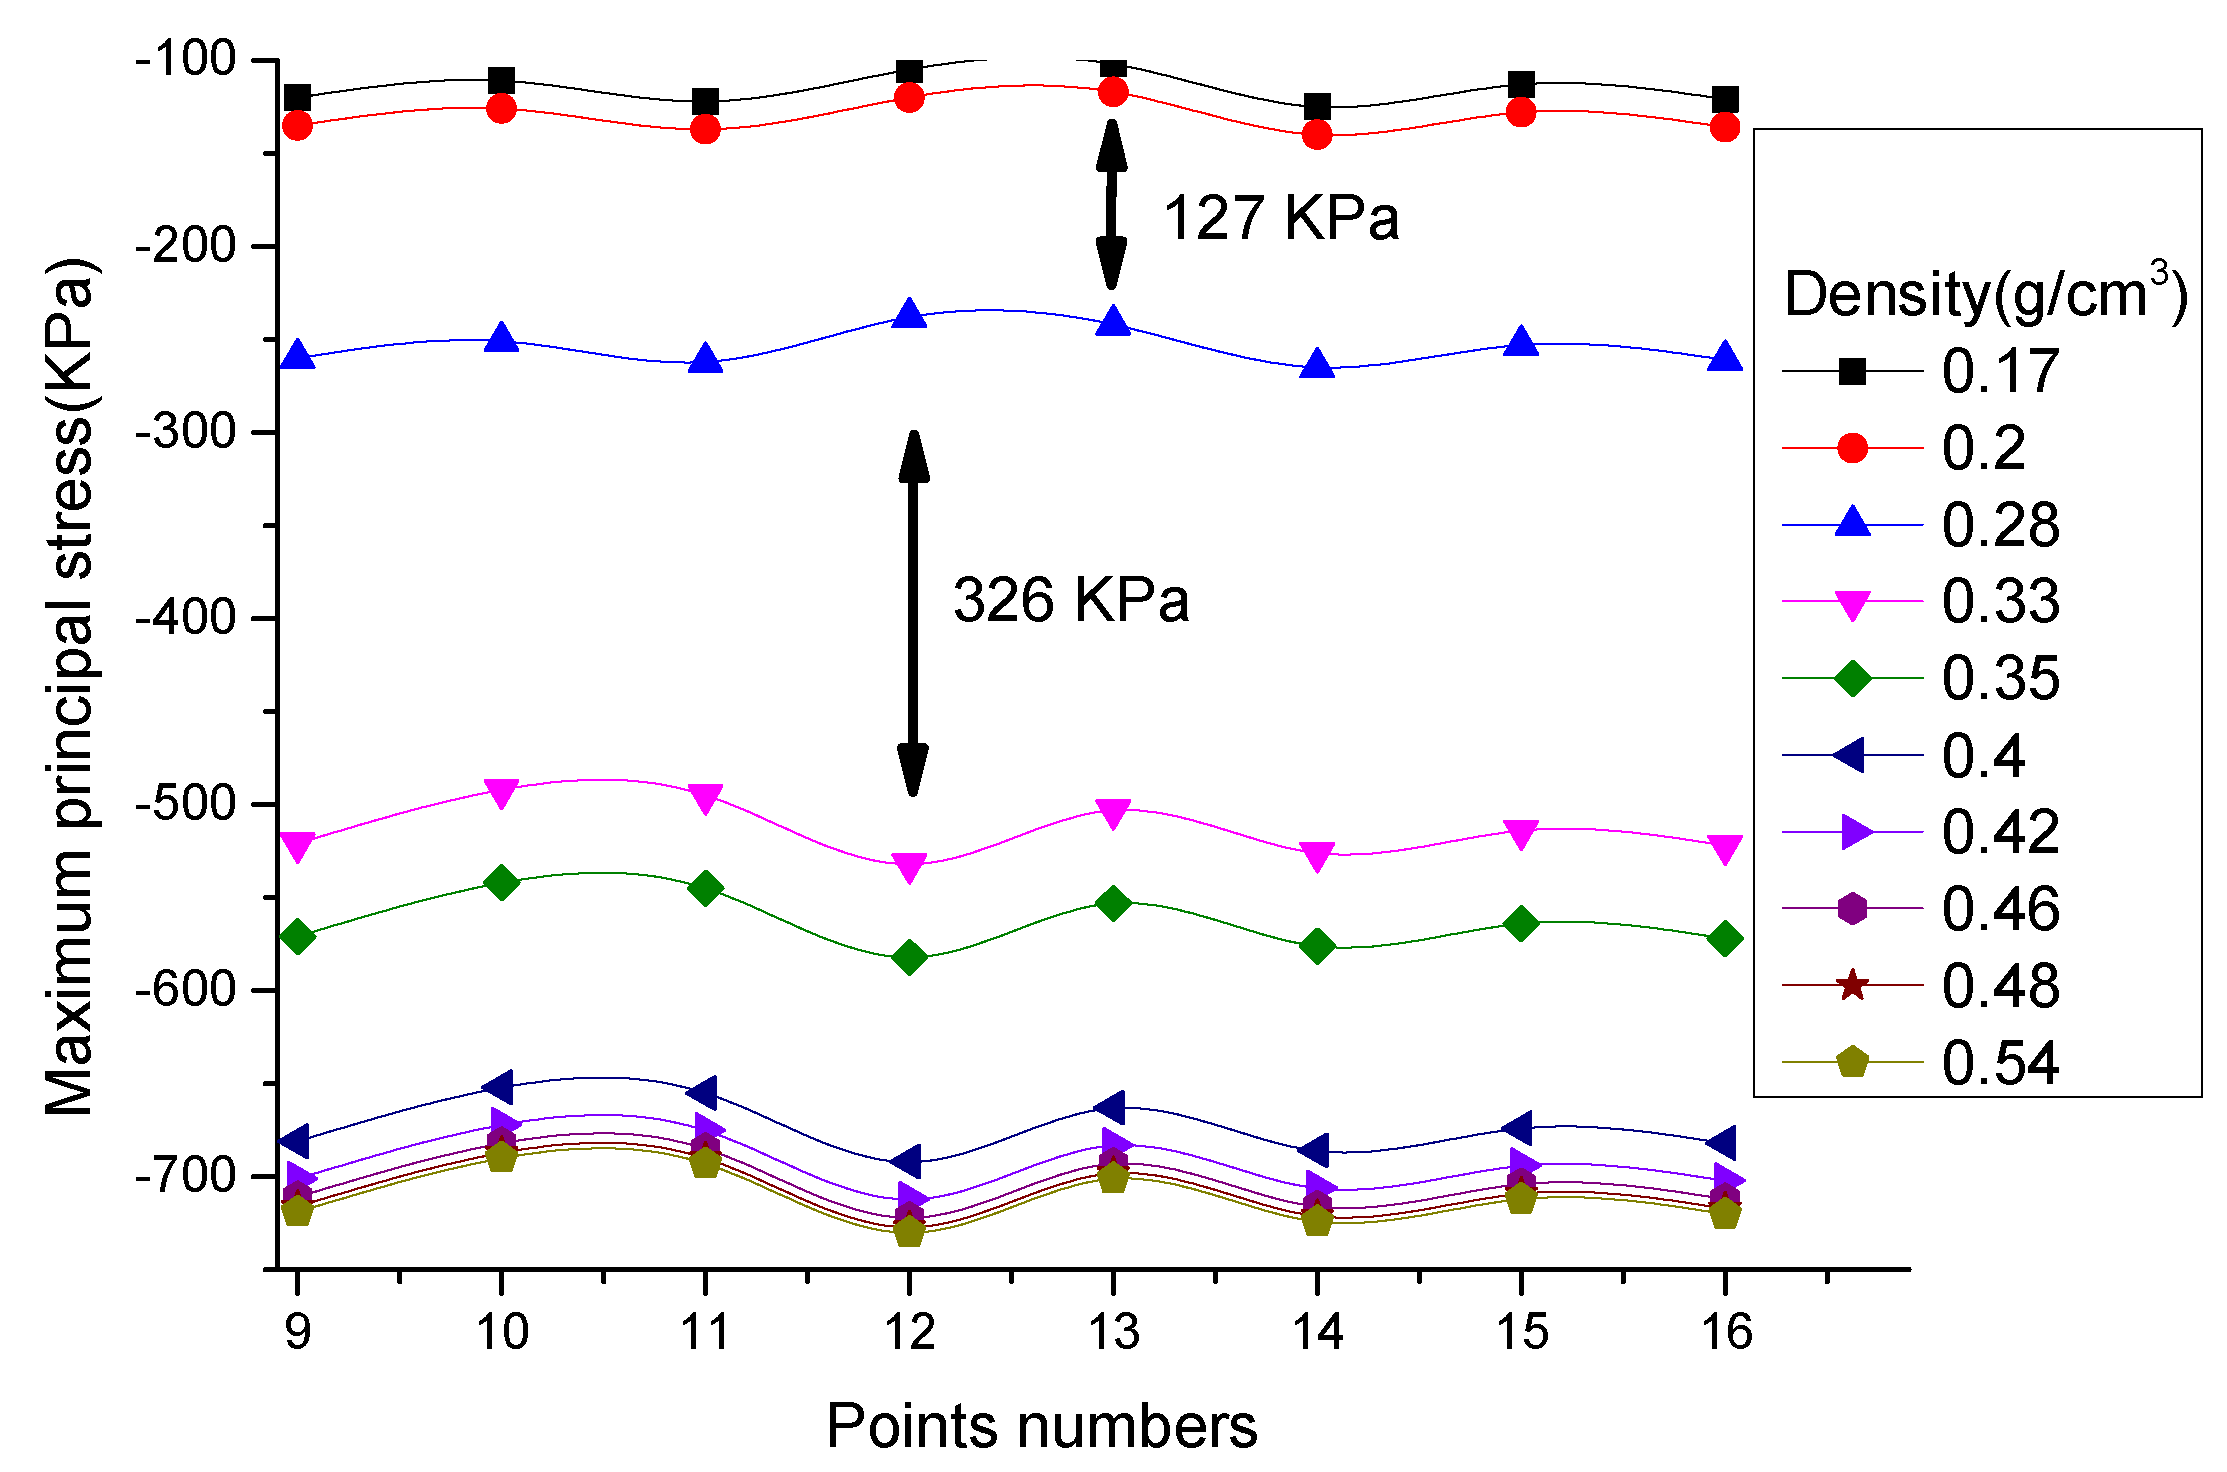
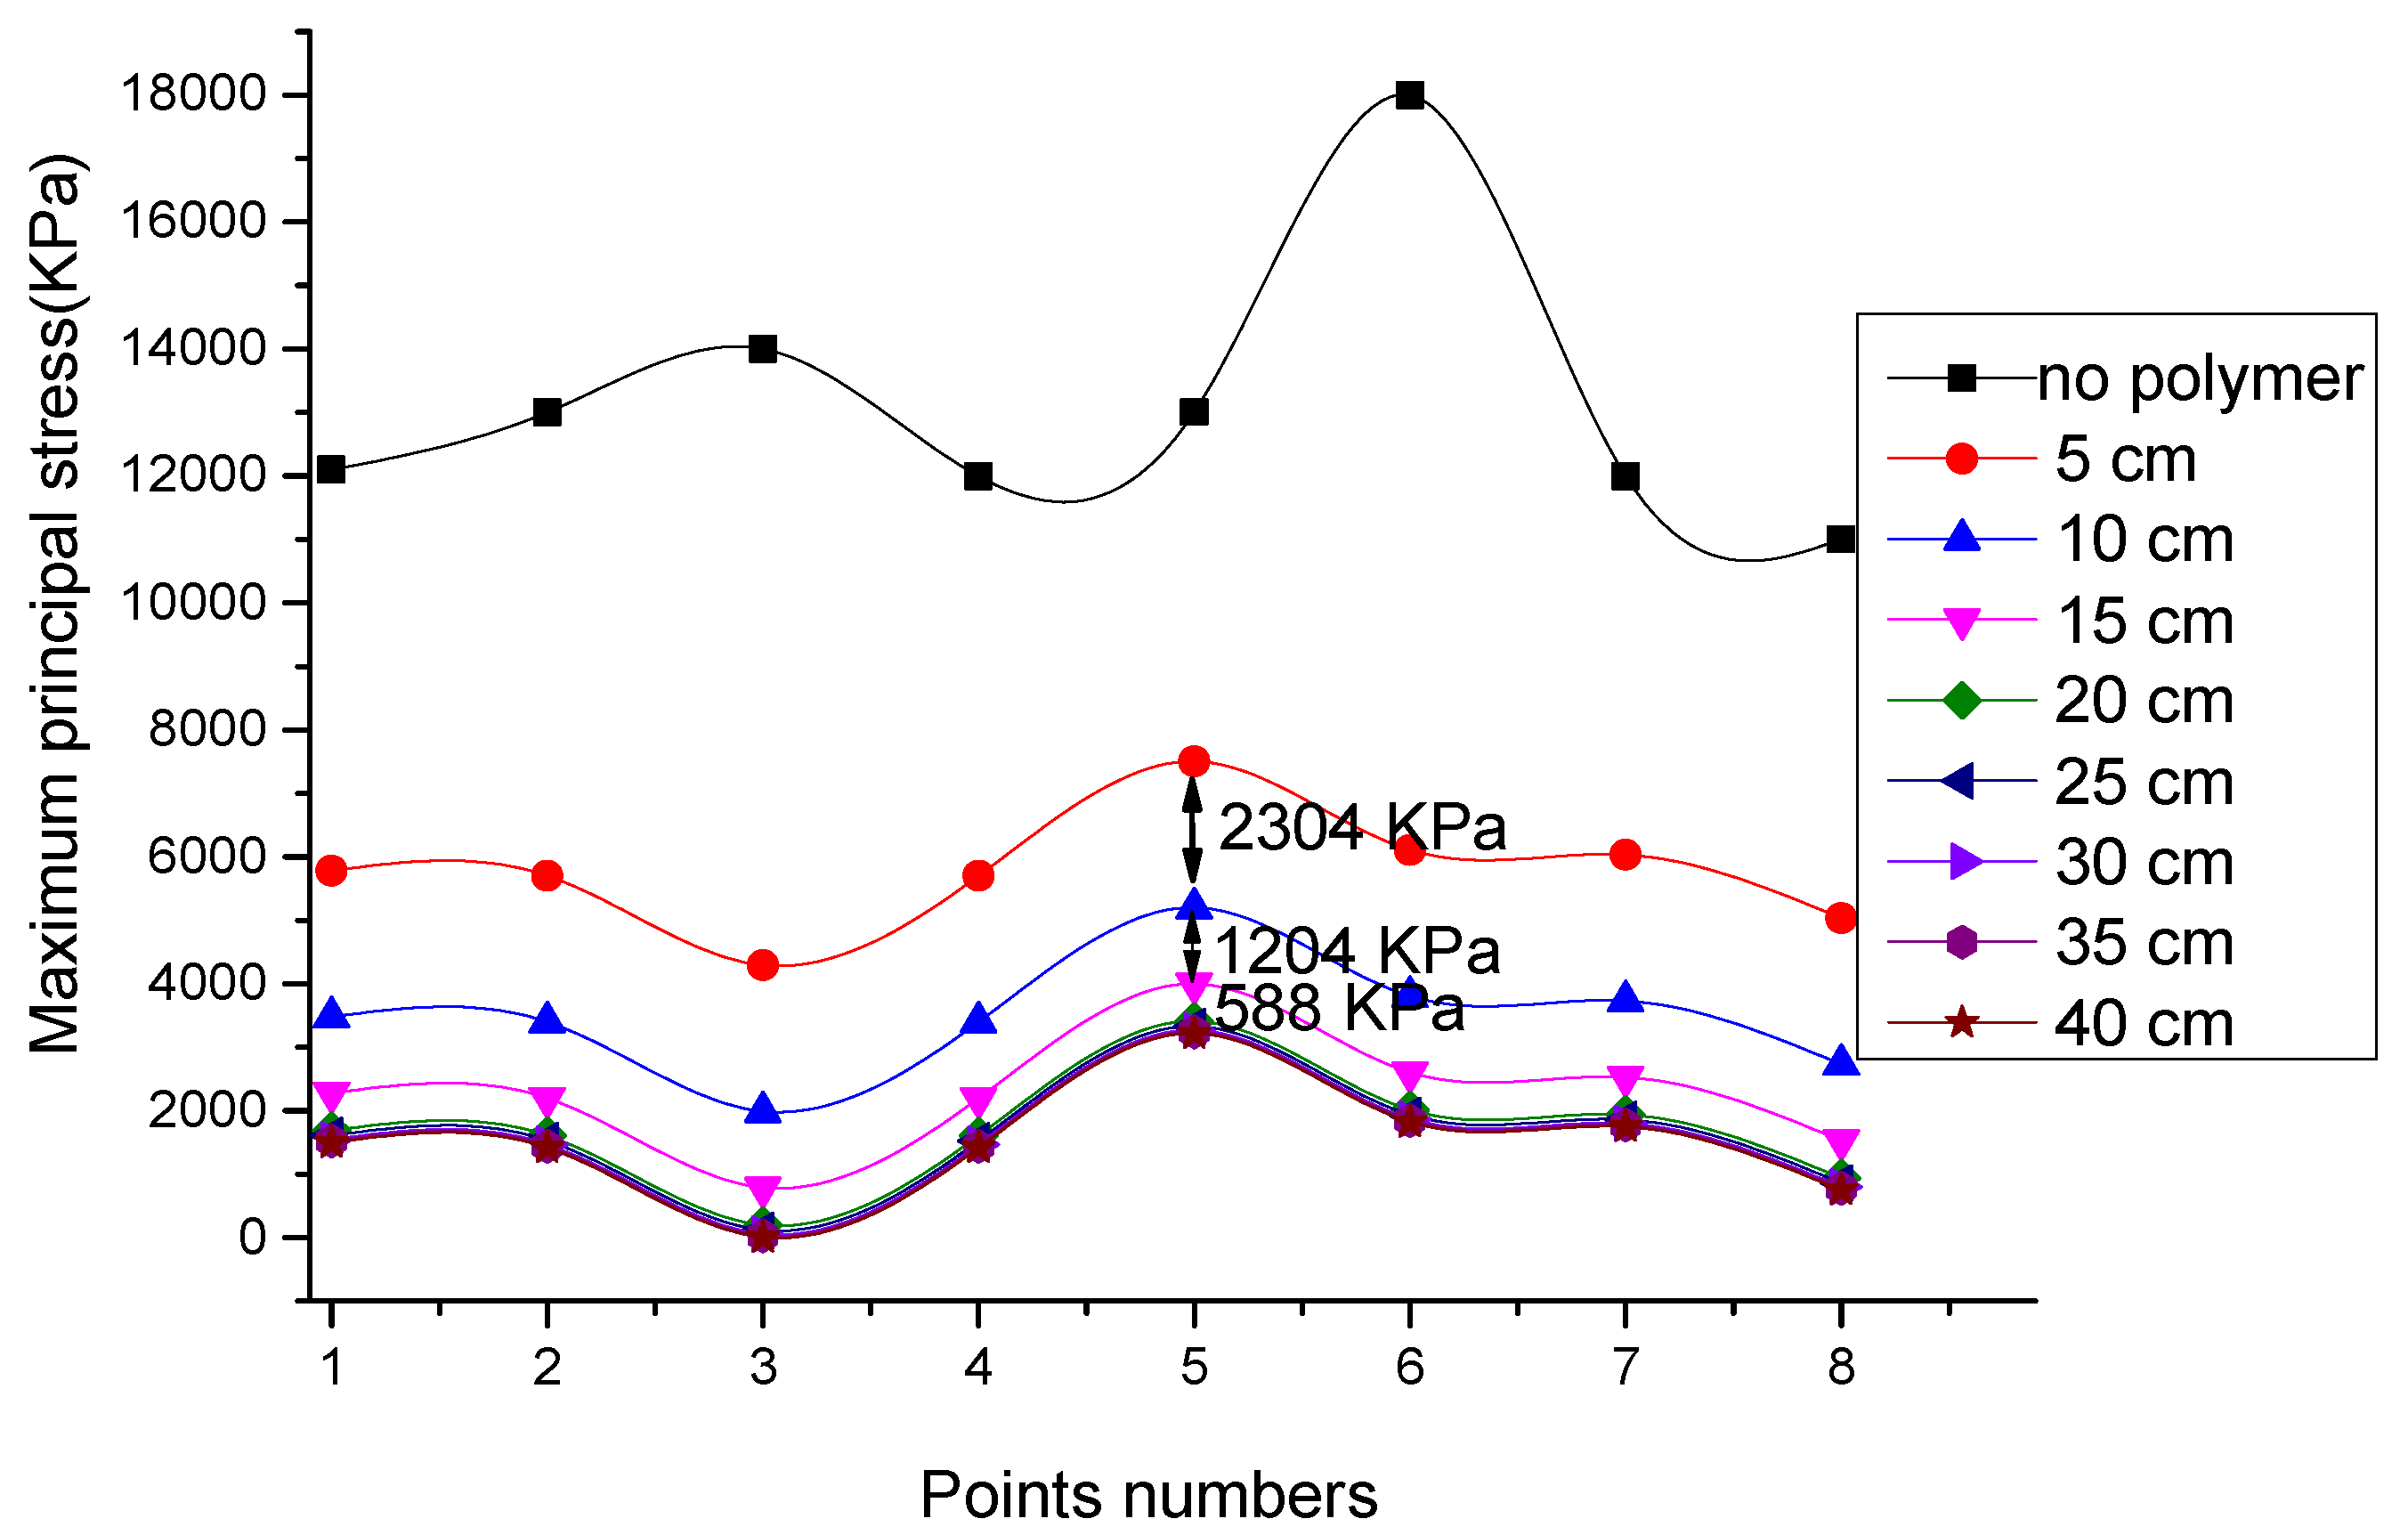
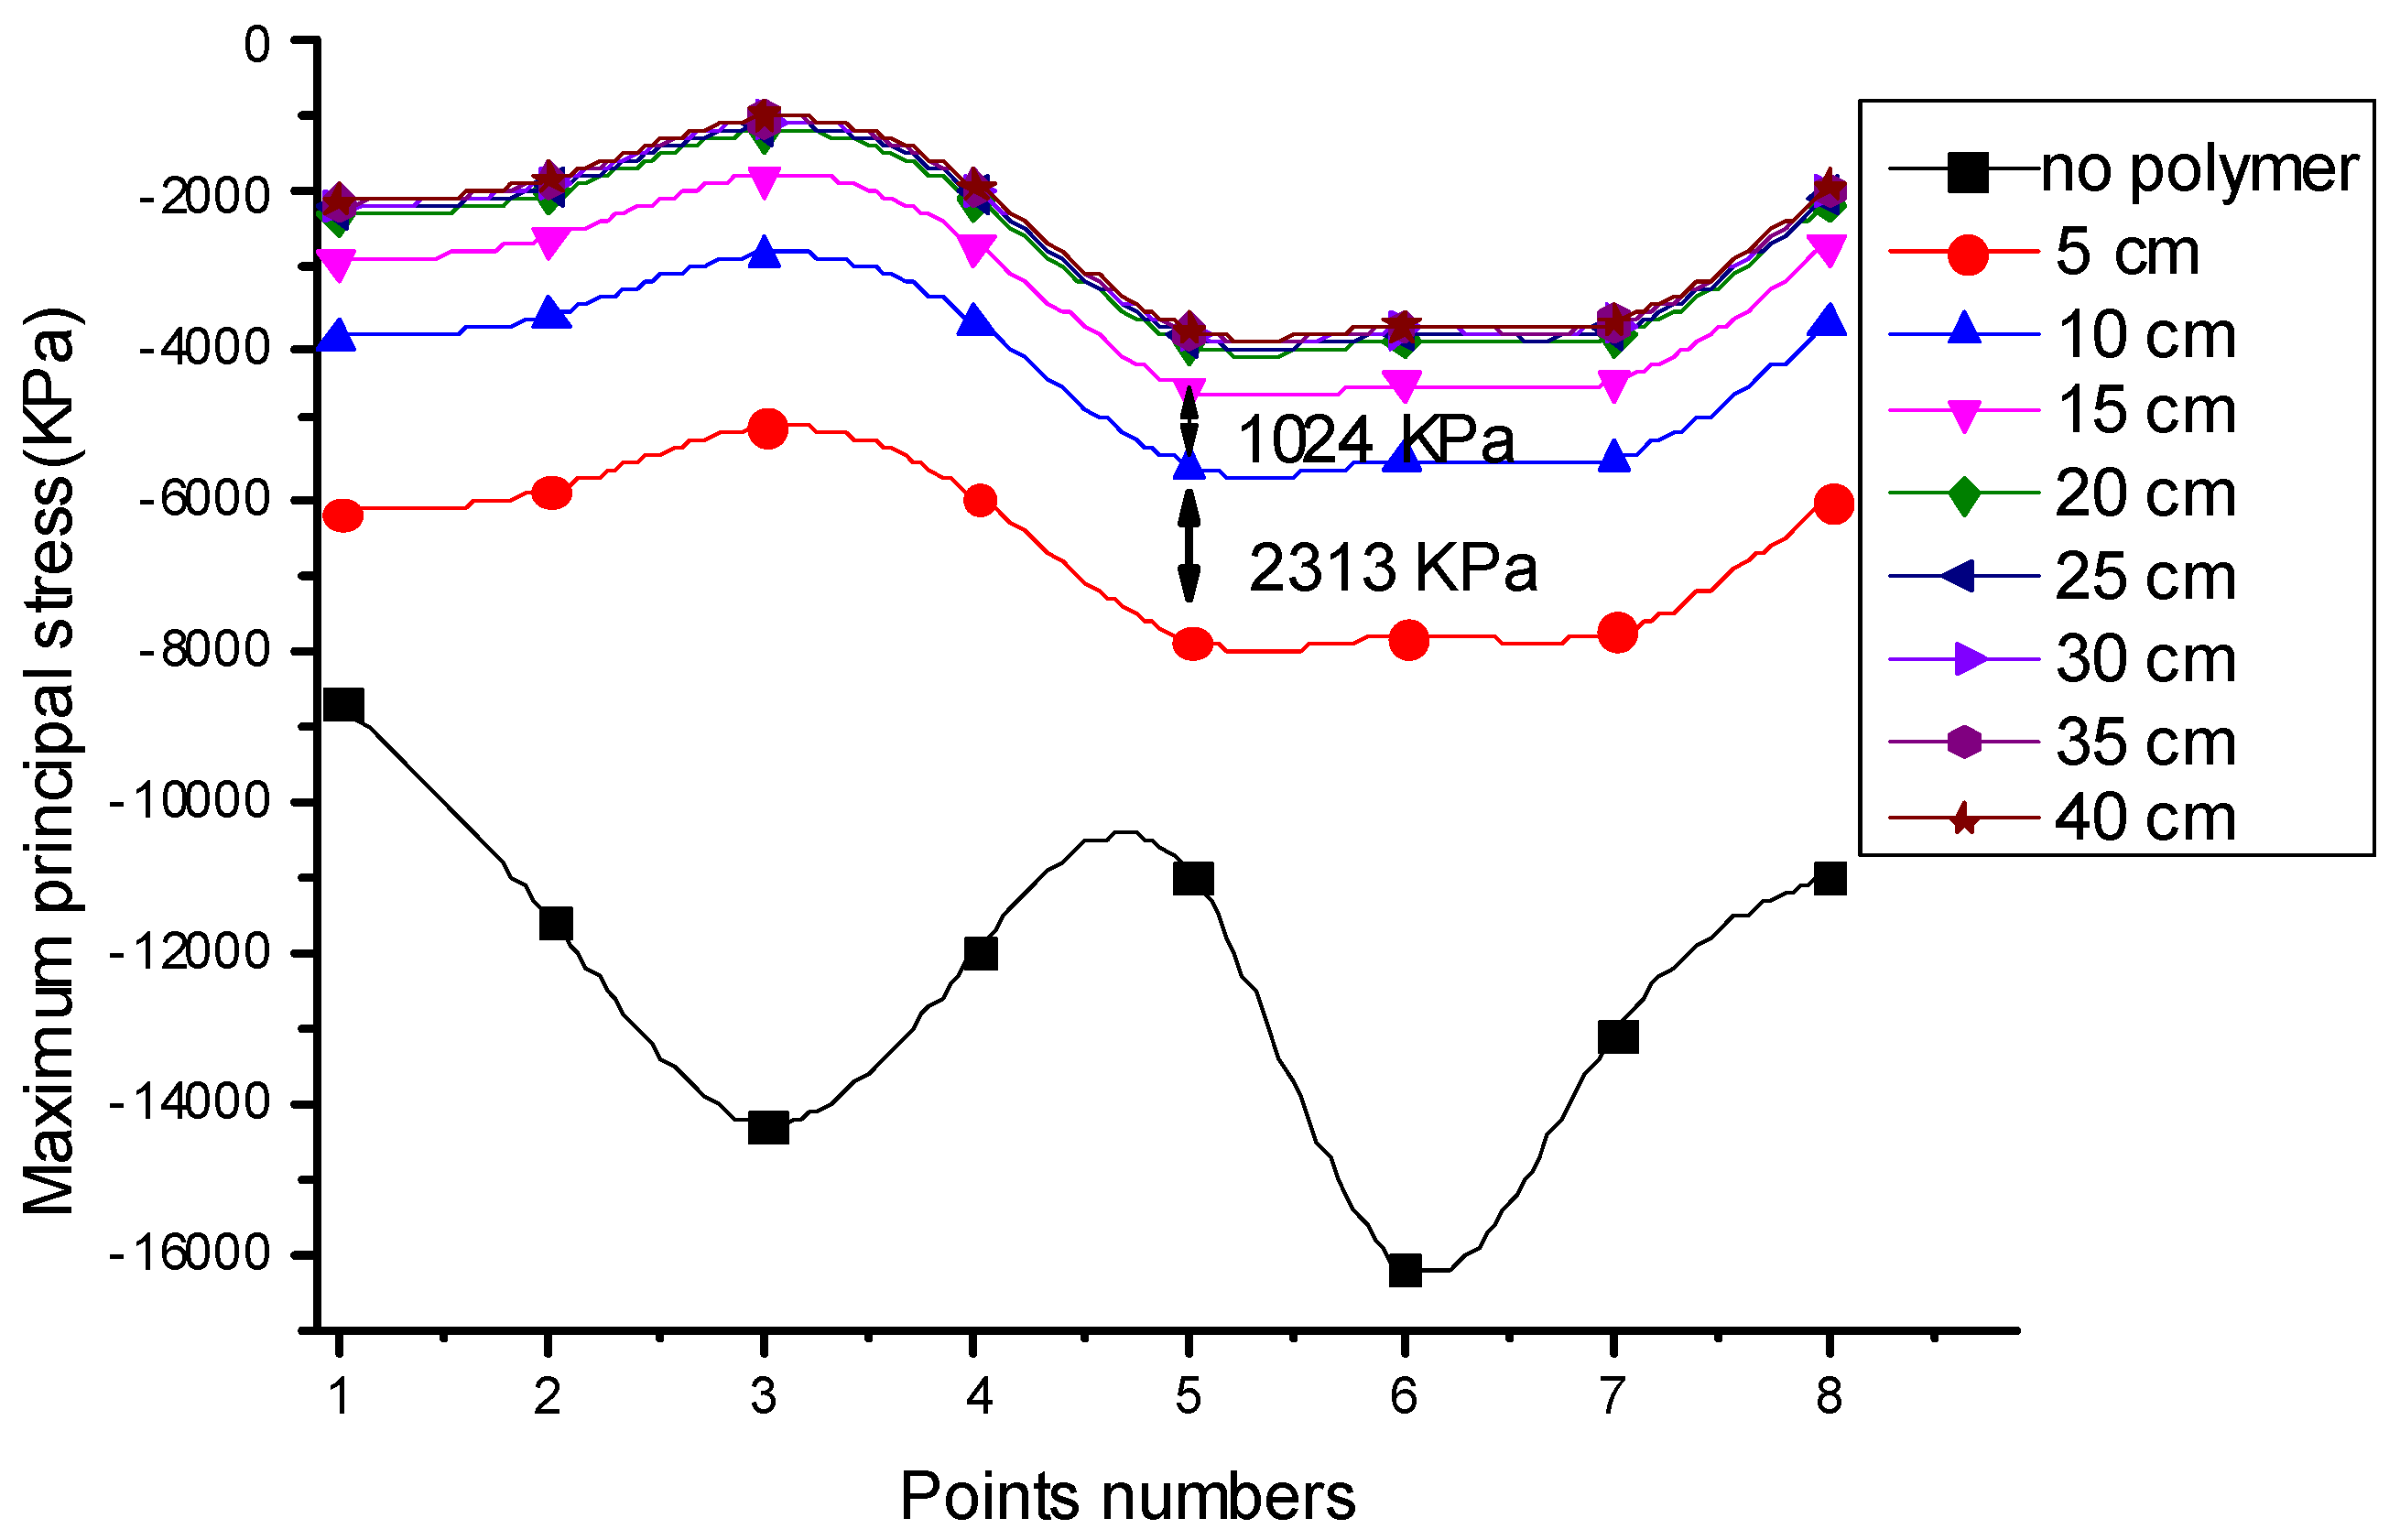
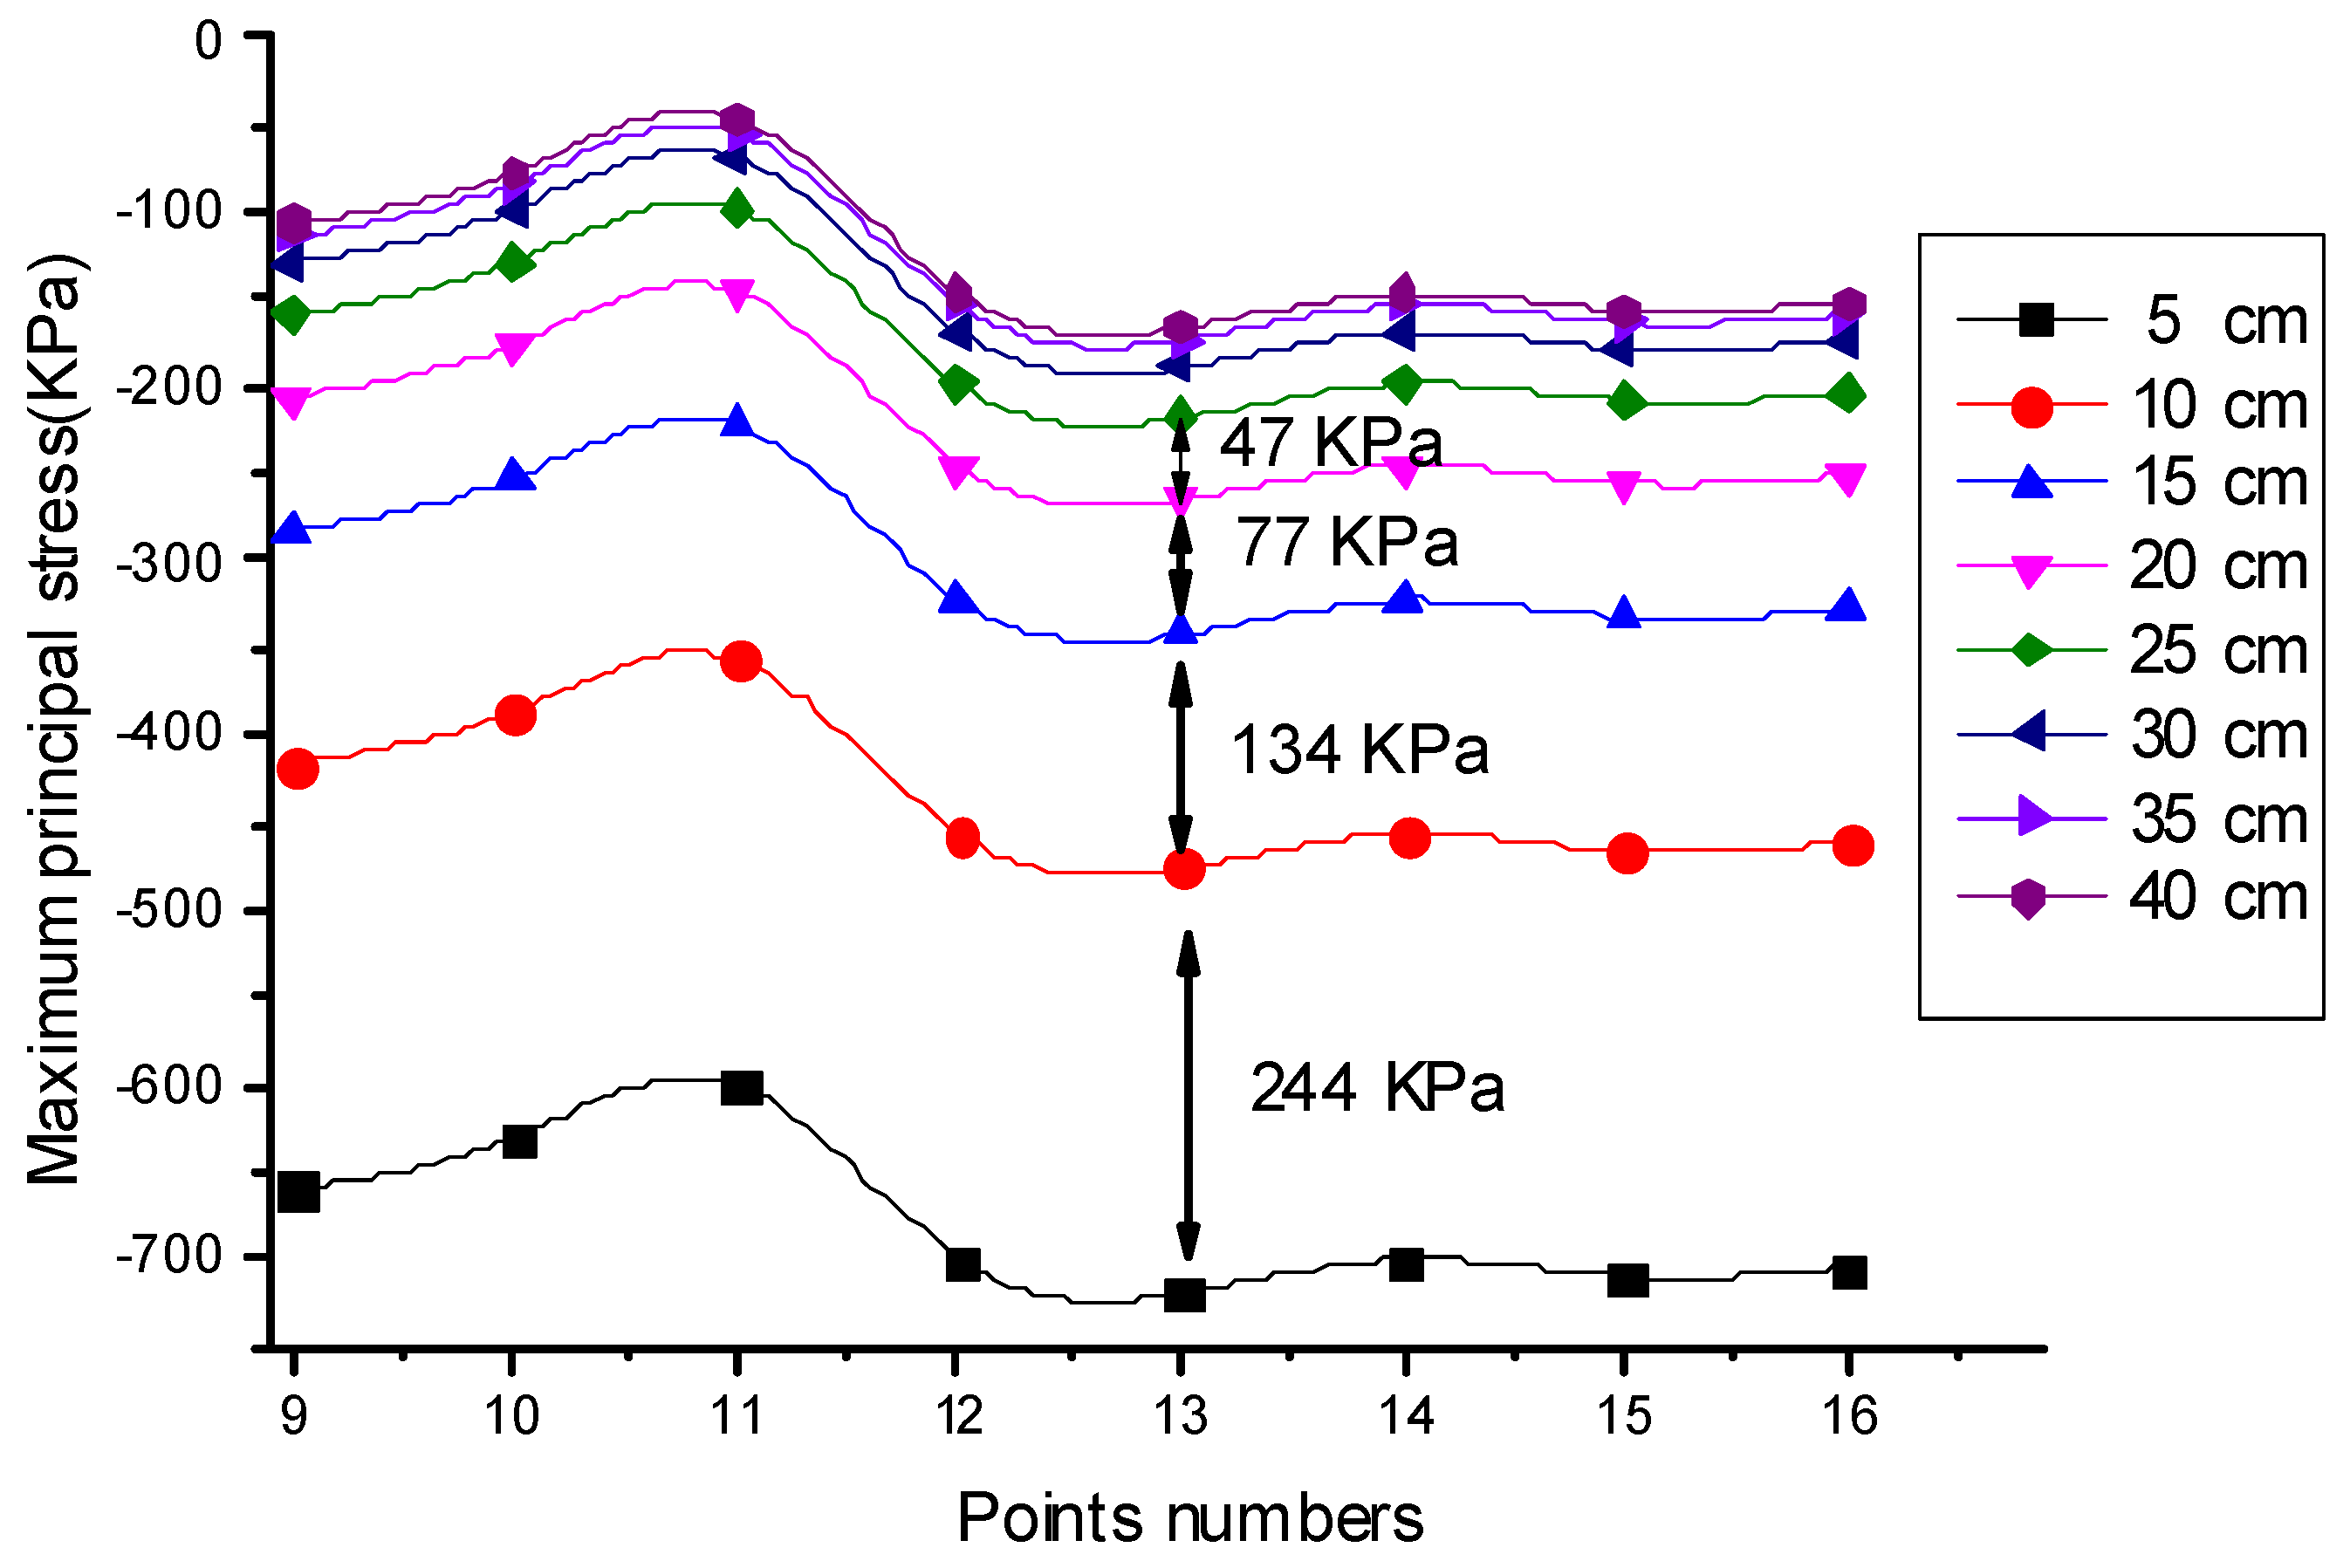
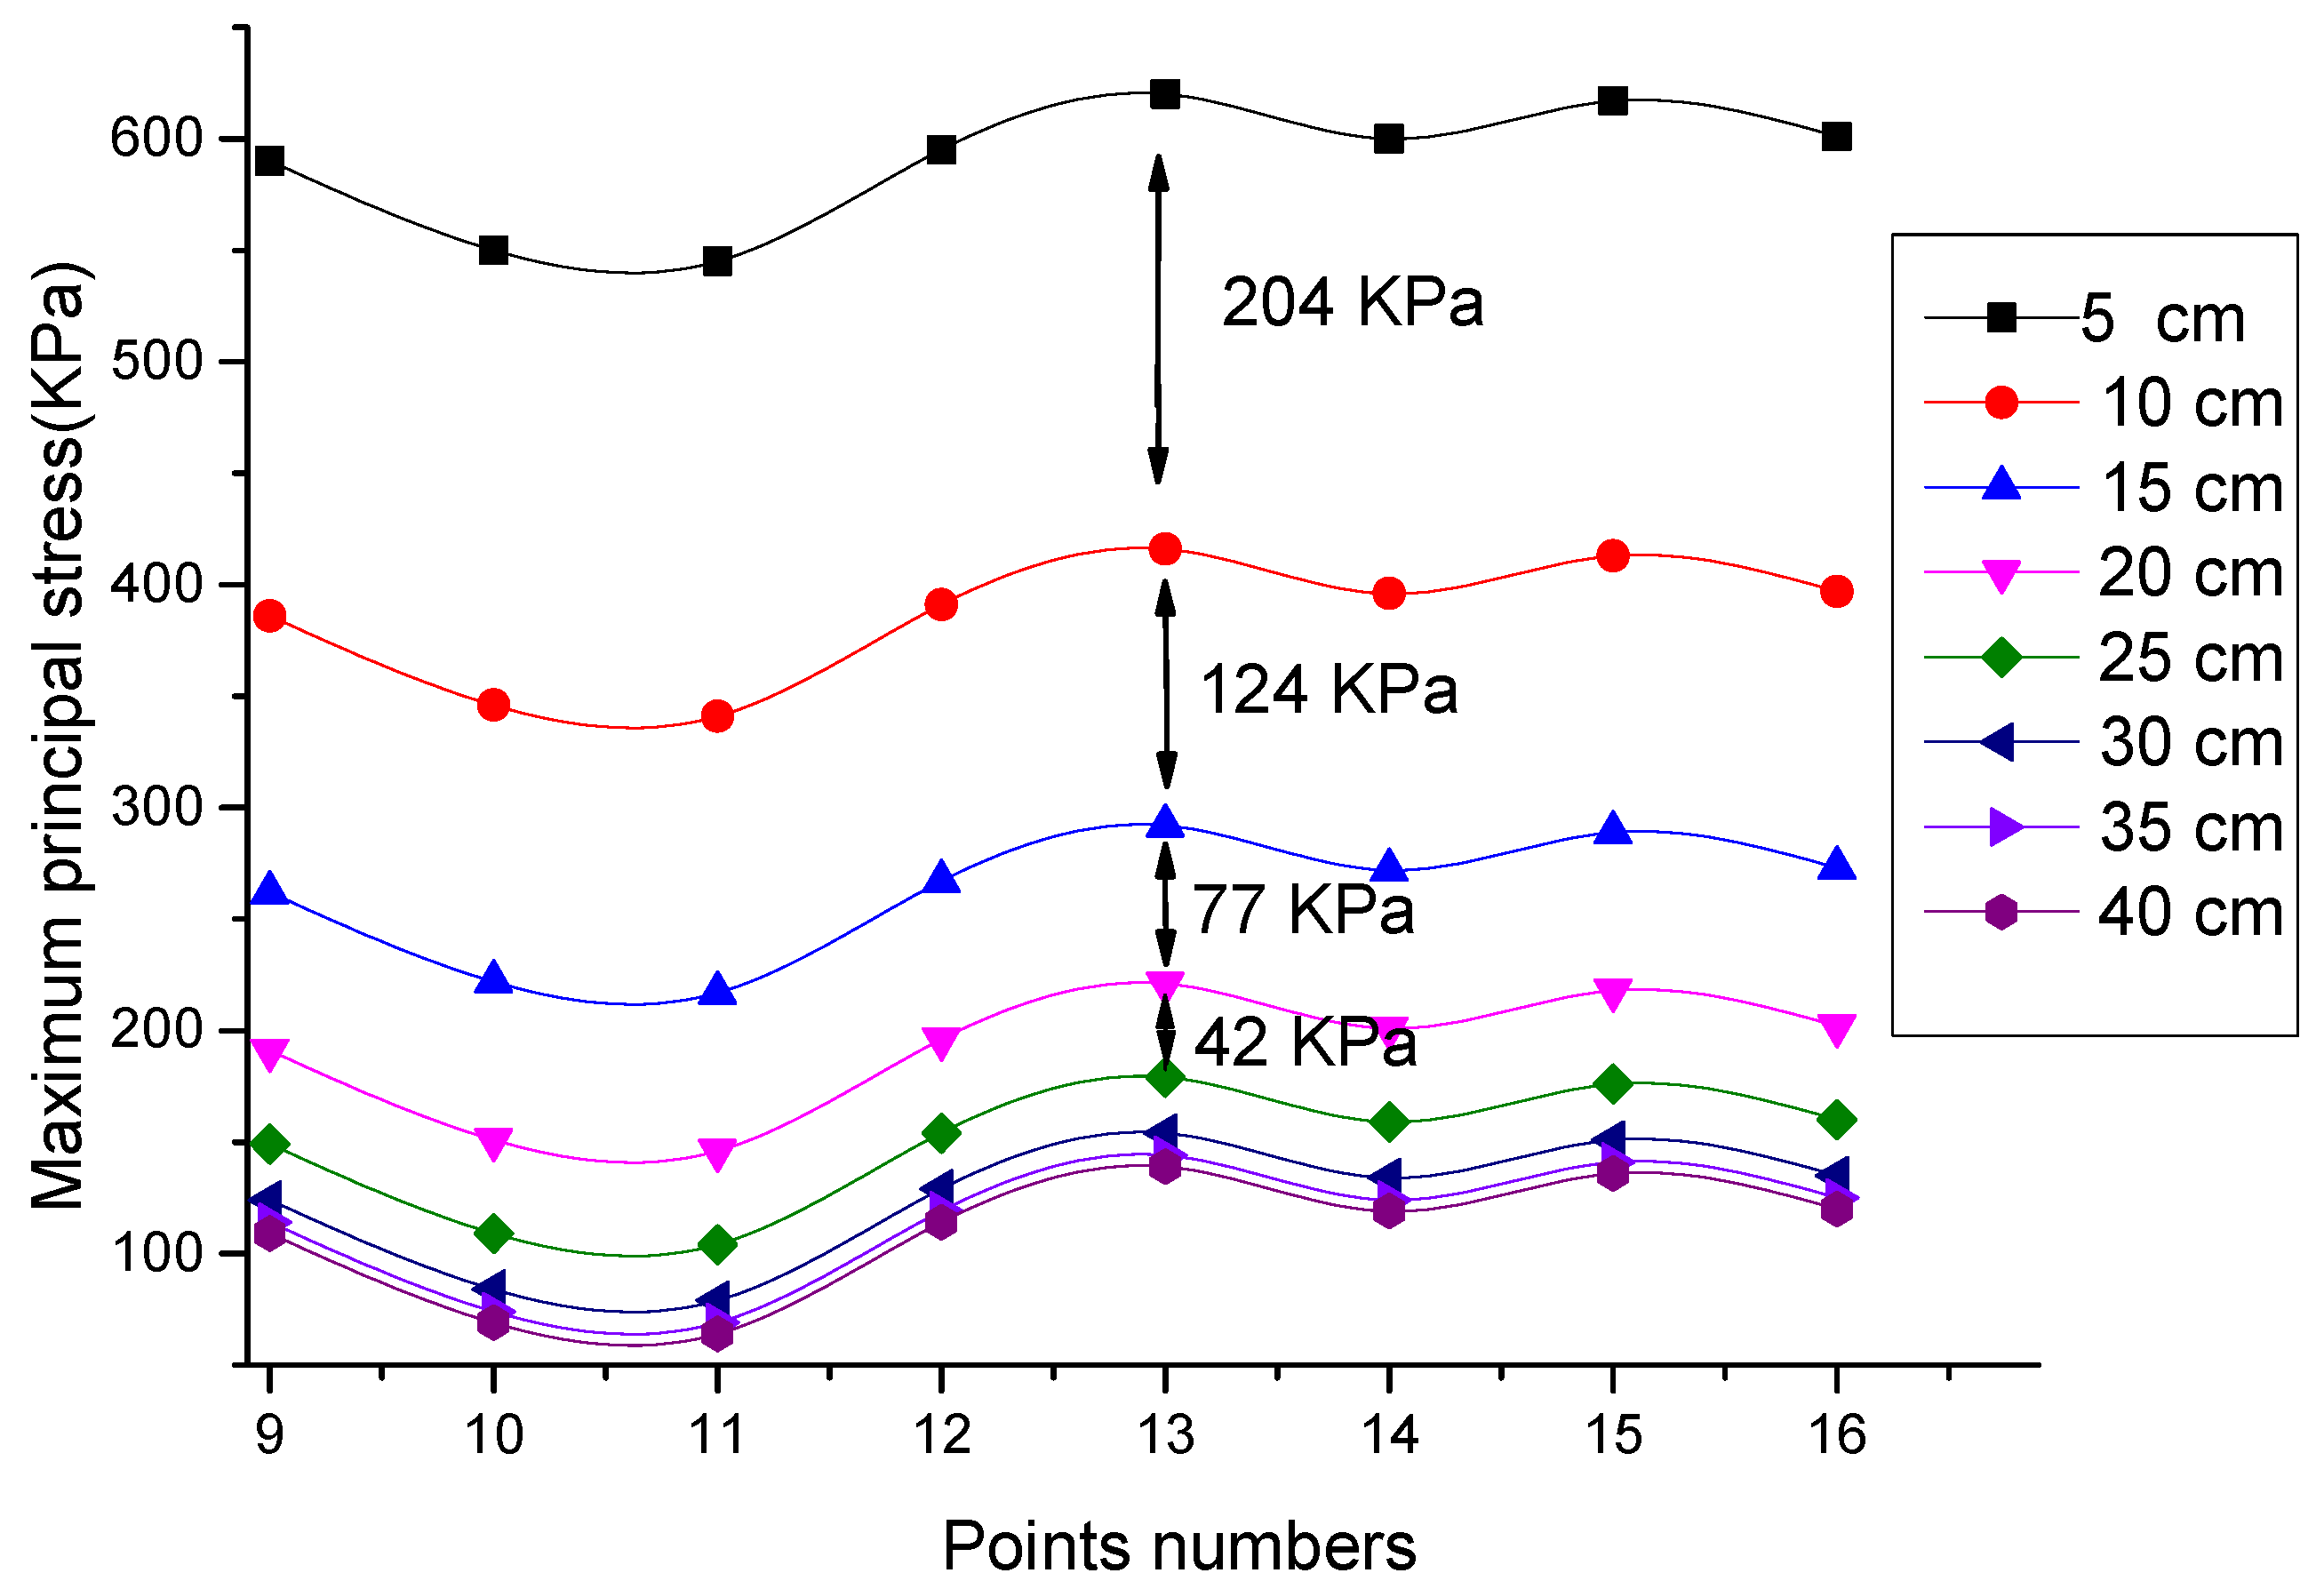
The compressive and tensile strength of NRTCPM increases as its density increases. The seismic response of NRTCPM is highly influenced by its density, elastic modulus, Poisson’s ratio, and thickness. To be specific, the tensile stresses and absolute values of the compressive stress on a NRTCPM layer can be reduced by about 90% as the density decreases from 0.54 g/cm3 to 0.17g/cm3 and the elastic modulus from 228 MPa to 17.2 MPa, and the tensile stresses and absolute values of the compressive stress on the lining can be reduced by 75%. When the density decreases, the elastic modulus decreases at the same time and the Poisson’s ratio increases steadily. By retrofitting NRTCPM layers from 5 cm to 40 cm, the tensile stresses and the absolute values of the compressive stress on the NRTCPM layer and lining can be reduced by 80% on average.
The NRTCPM layer properties, including the layer density, thickness, dynamic elastic modulus, and Poisson’s ratio, are determinative factors for the seismic isolation effects of tunnels. Ultimately, the seismic isolation effect performs better at a lower density, smaller elastic modulus, and higher Poisson’s ratio and thicker layer. The influences of these parameters are all significant for seismic isolation. The optimum density is 0.2 g/cm3 and thickness is 20 cm under the consideration of cost and strength.


