Article

Biomethane Potential Test: Influence of Inoculum and the Digestion System

1
State Institute of Agricultural Engineering and Bioenergy, University of Hohenheim, 70599 Stuttgart, Germany
2
Leibniz Institute for Agricultural Engineering and Bioeconomy, Max-Eyth-Allee 100, 14469 Potsdam, Germany
3
Institute of Agricultural Engineering, Tropics and Subtropics Group, University of Hohenheim, 70599 Stuttgart, Germany
*
Author to whom correspondence should be addressed.
Appl. Sci. 2020, 10(7), 2589; https://doi.org/10.3390/app10072589
Submission received: 5 March 2020 / Revised: 30 March 2020 / Accepted: 1 April 2020 / Published: 9 April 2020
(This article belongs to the Special Issue Renewable Energy in Agriculture)

Abstract

:
High precision of measurement of methane potential is important for the economic operation of biogas plants in the future. The biochemical methane potential (BMP) test based on the VDI 4630 protocol is the state-of-the-art method to determine the methane potential in Germany. The coefficient of variation (CV) of methane yield was >10% in several previous inter-laboratory tests. The aim of this work was to investigate the effects of inoculum and the digestion system on the measurement variability. Methane yield and methane percentage of five substrates were investigated in a Hohenheim biogas yield test (D-HBT) by using five inocula, which were used several times in inter- laboratory tests. The same substrates and inocula were also tested in other digestion systems. To control the quality of the inocula, the effect of adding trace elements (TE) and the microbial community was investigated. Adding TE had no influence for the selected, well- supplied inocula and the community composition depended on the source of the inocula. The CV of the specific methane yield was <4.8% by using different inocula in one D-HBT (D-HBT1) and <12.8% by using different digestion systems compared to D-HBT1. Incubation time between 7 and 14 days resulted in a deviation in CV of <4.8%.

1. Introduction

Biogas plants in Germany receive a bonus payment for power generation, which is guaranteed by the German Renewable Energy Source Act (EEG) for a period of 20 years after installation [1]. Many biogas plants will run out of this bonus payment during the next ten years. Thus, biogas plants have to work more efficiently for economic reasons. The biochemical methane potential (BMP) test is a common method to determine the maximum theoretical methane yield of a substrate. It has already been used for several years for dimensioning biogas plants [2]. High accuracy of the BMP test will be necessary to precisely predict economic viability in the future.
Various protocols are available, all with the aim of achieving a high reproducibility of the BMP test. Besides the European standards (Angelidaki et al. [3] and Holliger et al. [4]), the VDI Standard 4630 [5] is the most commonly used protocol. These protocols show the same basic structure: (i) performing three technical repetitions, (ii) applying prescribed inoculum/substrate ratio (ISR), (iii) measuring methane yield of pure inoculum as a blank, and (iv) measuring methane yield of standard substrates as positive control. In each of the protocols it is pointed out, how important the inoculum, the digestion system, and the working precision are to achieve a high reproducibility.
Various inter-laboratory tests were conducted to check the accuracy of the BMP by using different digestion systems, inocula, and protocols. Raposo et al. [2] conducted an inter-laboratory test with 17 laboratories using starch, cellulose, and gelatin as substrates. The results showed a coefficient of variation (CV) of around 8%–11%. Similar results were reported by a German inter- laboratory test of KTBL/VDLUFA based on VDI Standard 4630. This test was done with different substrates and around 30 laboratories over several years. The CV excluding outliers was 8%–12% [6]. The impact of repeating BMP tests over several years was small, it only helped to reduce the number of outliers [7]. The Ècole Polytechnique Fèdèrale de Lausanne carried out inter- laboratory-tests with stricter specifications and a repetition after a few months [4]. The results without eliminating the outliners revealed a CV of 15%–17% [8]. Cresson et al. [9] investigated differences in the CV when using different BMP measuring protocols. Free choice of the used protocol was compared to the fix protocol for each laboratory, using a mineral substrate, NaHCO3 as pH buffer and an ISR > 2. The results showed a deviation of about 20% between the free and the fixed protocol. The measurement variability was not affected by different measuring protocols. Pham et al. [10] reported similar differences by comparing protocols of VDI 4630 [5] and Sommer et al. [11].
Several studies were carried out to find reasons for deviations in measurement results (Table 1). Special focus was laid on the effect of the used inoculum. One of the main categorization criteria was the origin of the inoculum. Vrieze et al. [12] and Regueiro et al. [13] reported differing microbial community composition for different inocula from full scale biogas plants. Thus, inocula from different origins might affect the methane yield depending on their microbial community composition. Li et al. [14] tested sludge from chicken manure and municipal wastewater treatment plants as inocula using similar substrates. The inoculum from wastewater treatment led to a higher biodegradability of the inoculum/substrate mixture. Pozdniakova et al. [15] revealed converse behavior, they detected a higher methane yield for inocula from a municipal solid waste landfill plant compared to inocula from wastewater treatment and other origins, when using animal by-products as substrate. Elbeshbishy et al. [16] investigated the methane yields of two different inocula. Higher methane yields were also achieved with inocula taken from anaerobic digesters. Dechrugsa et al. [17] reported a significant difference in methane yields by using inocula from two different full-scale biogas plants. Another impact was reported by Chamy and Ramos [18], where a well-adapted inoculum from digested turkey manure produced a higher methane yield when using turkey manure as a substrate. Vrieze et al. [12] measured the methane yield of four substrates using four inocula from different origins. The effects of inocula on the results depended strongly on the substrates. Koch et al. [19] reported similar results. A comparison of three inocula from different origins revealed repeatedly no significant effects in methane yield for three substrates. Only for cellulose—a common substrate standard—significant effects were observed, leading to the conclusion that the methane production rate was affected by the used inoculum.
Beside the source of the inoculum, there are more possibilities influencing the methane yield, such as the incubation time and the trace elements (TE). VDI 4630 [5] prescribes the incubation of the inoculum to limit the methane production of the blanks. Other studies report no effect of incubation on their results [12,14]. Angelidaki et al. [3] recommend adding TE and vitamins.
Further effects on BMP were investigated by Strömberg et al. [20]. They examined the influence of experimental conditions and their correction to standard conditions. The biggest effect was found for samples with low methane yield, because of the high impact of the size of headspace, which determines the volume relation between produced biogas and flushing gas. The use of standard temperature showed a deviation of about 10% compared to results without correction. Also, the ambient pressure shows an impact on the biogas yield potential. It is shown that the ambient pressure can differ between 63.1 kPa (La Paz) and 103.6 kPa (sea level) [20,21].
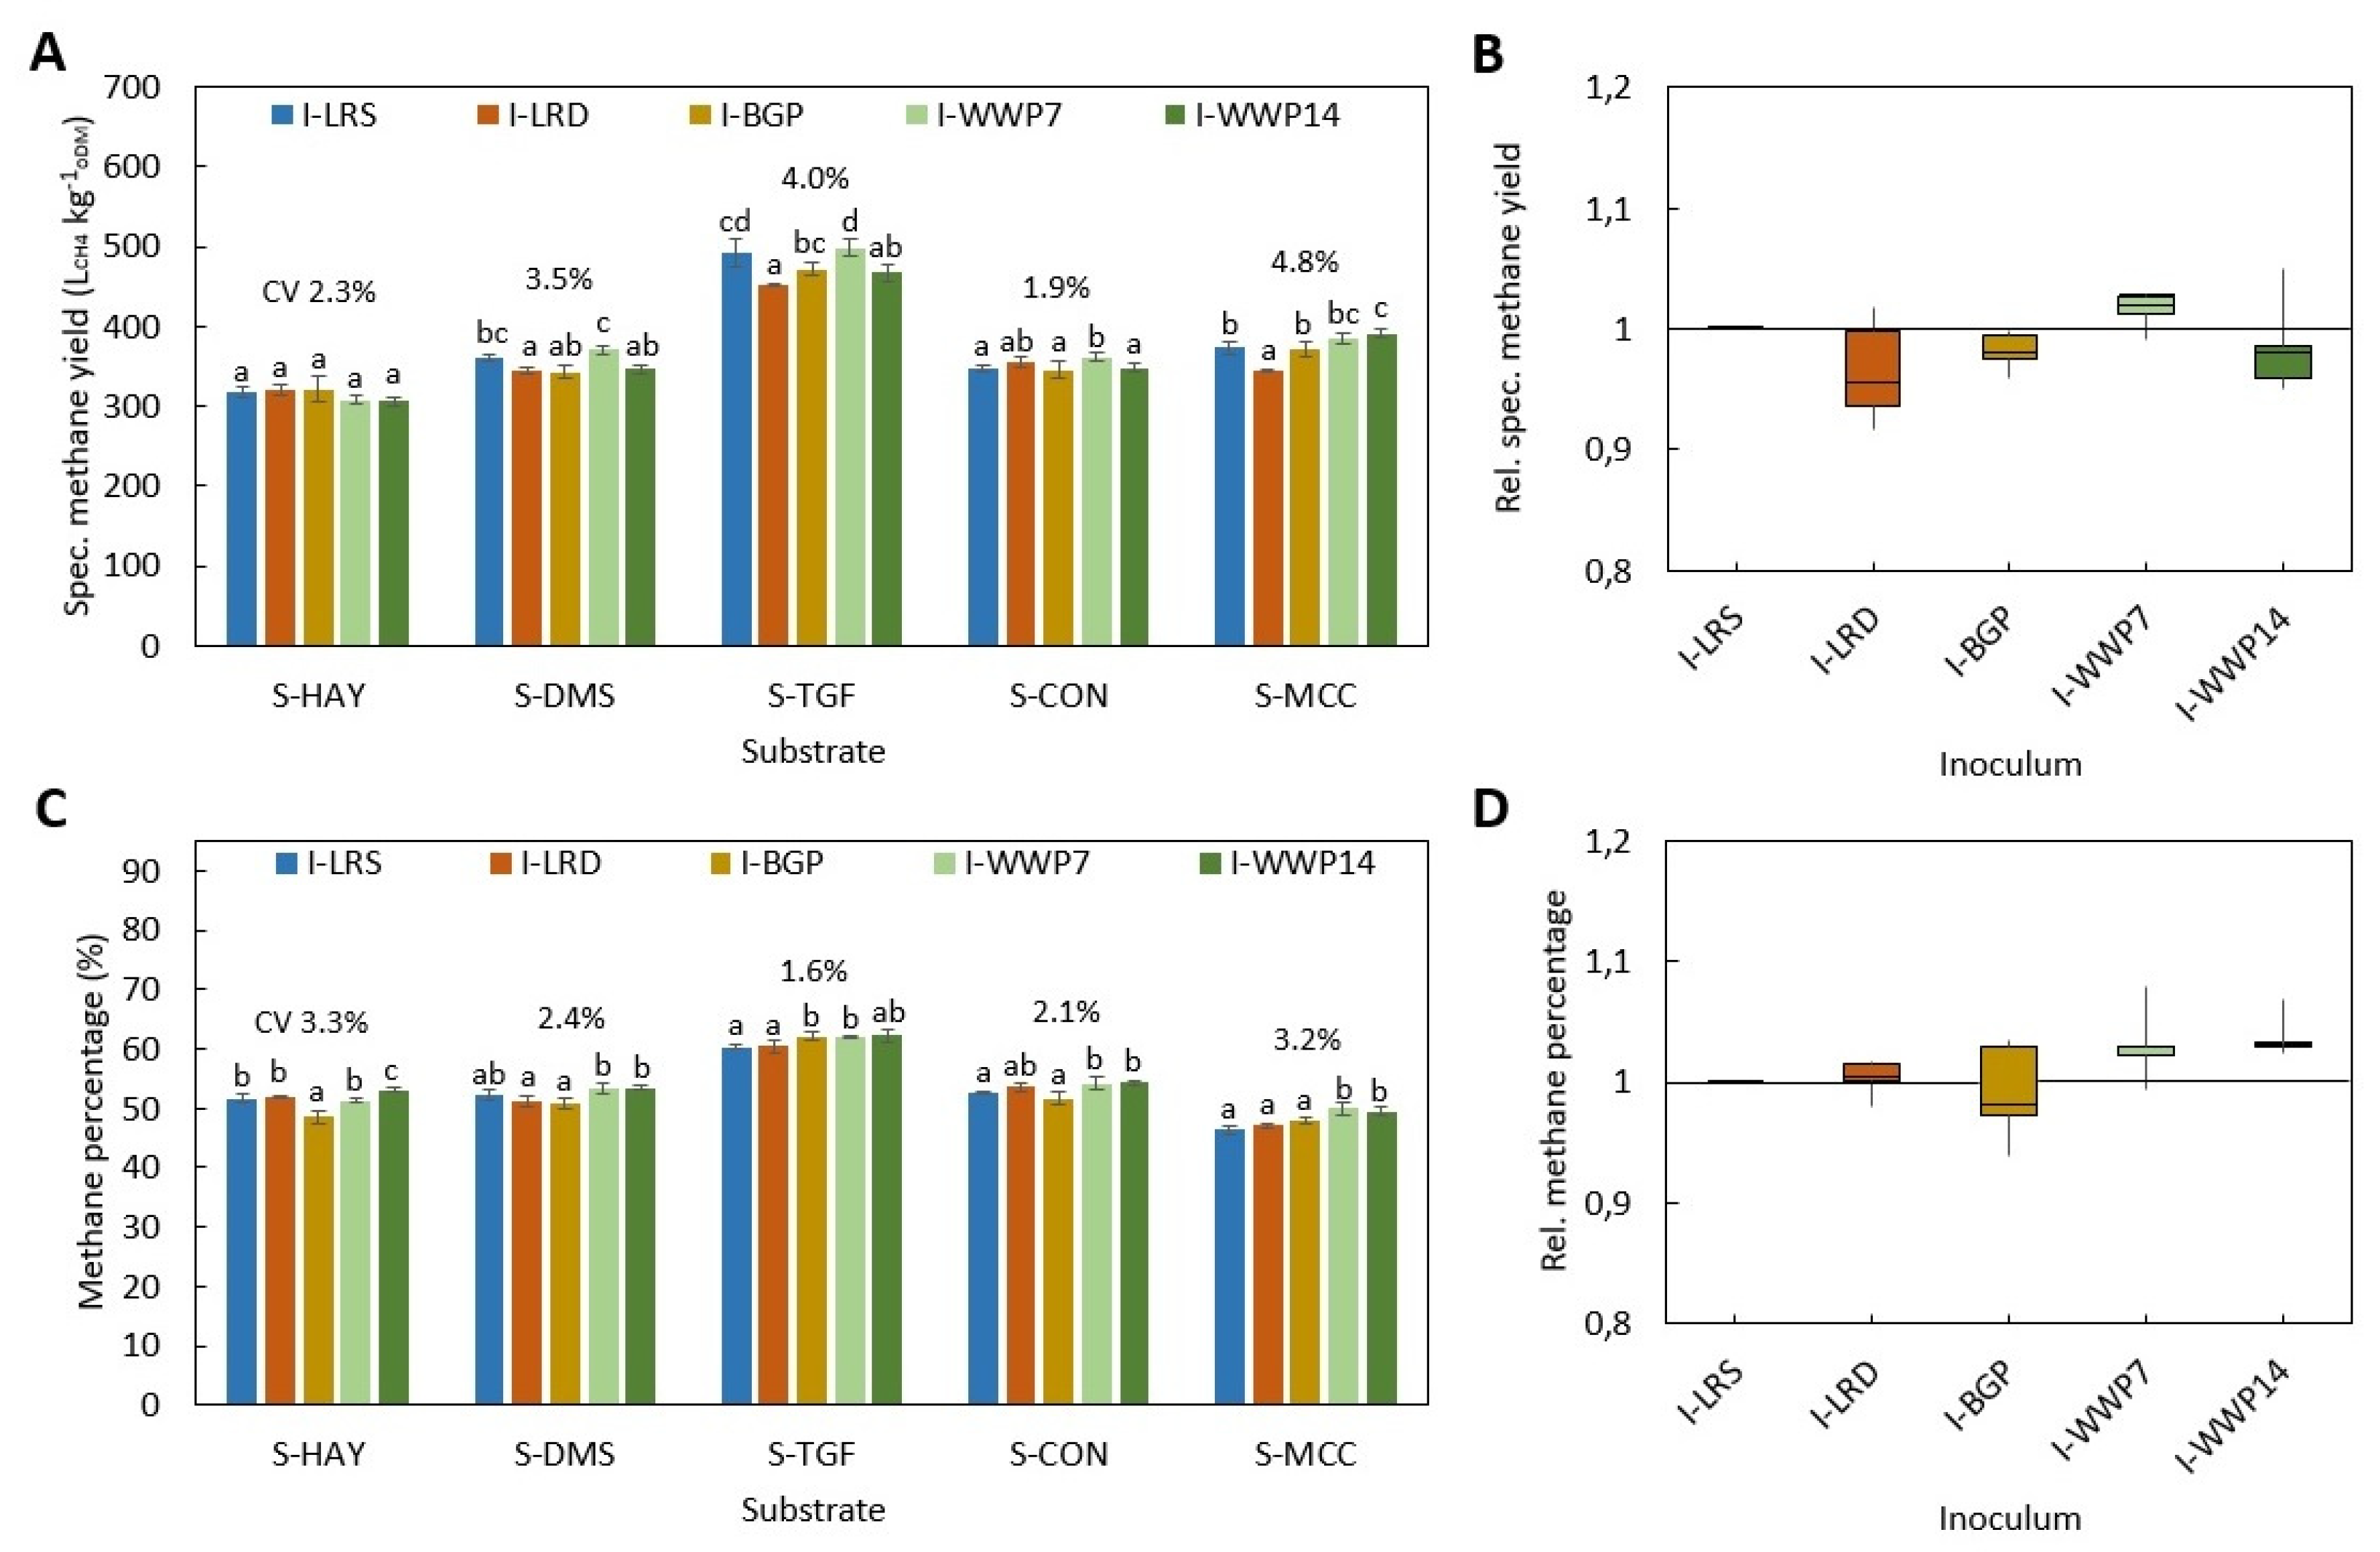
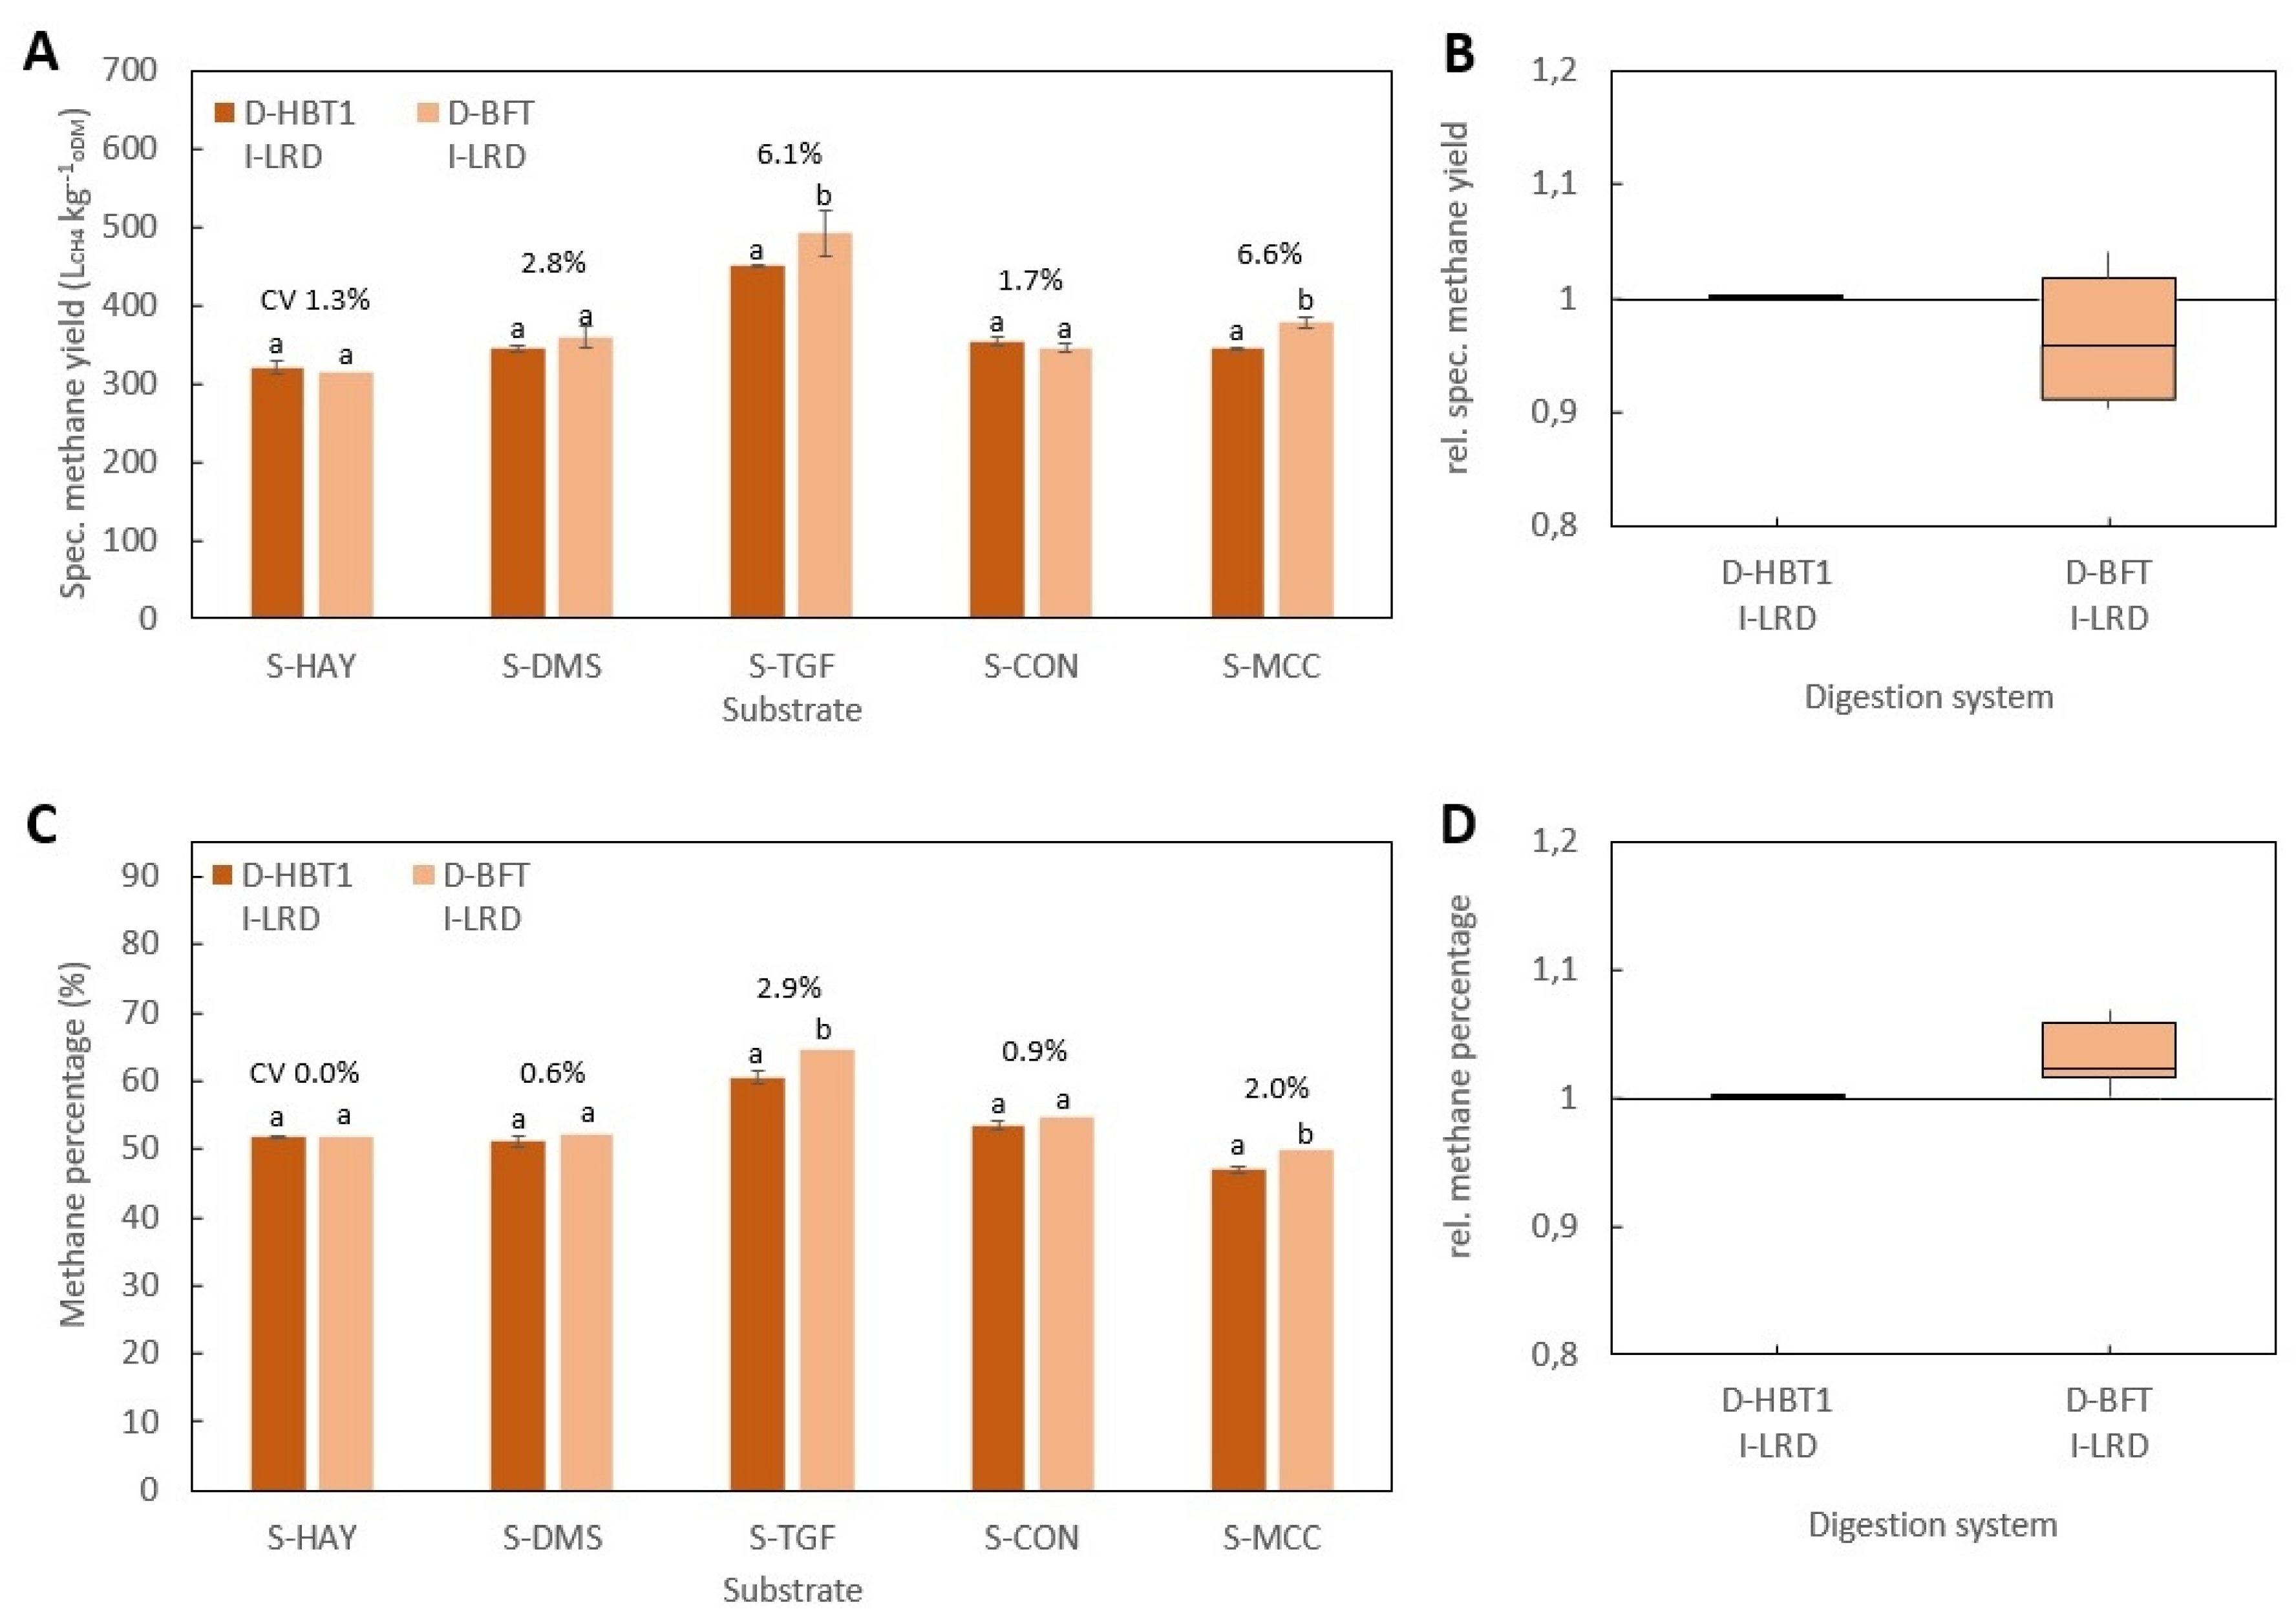
The aim of this study was to investigate the effects of different inocula and digestion systems on the specific methane yield and methane percentage of different substrates using VDI 4630 as a protocol. Unlike other publications, all investigated inocula were cultivated for several years and have been used in a national inter-laboratory test in Germany. Five long-term cultivated inocula and five substrates were tested using equipment and procedure of the standardized Hohenheim biogas yield test (D-HBT1) in comparison to four other digestion systems. To the best of our knowledge, such an extensive comparison of inocula and digestion systems has not been performed before.

2. Materials and Methods

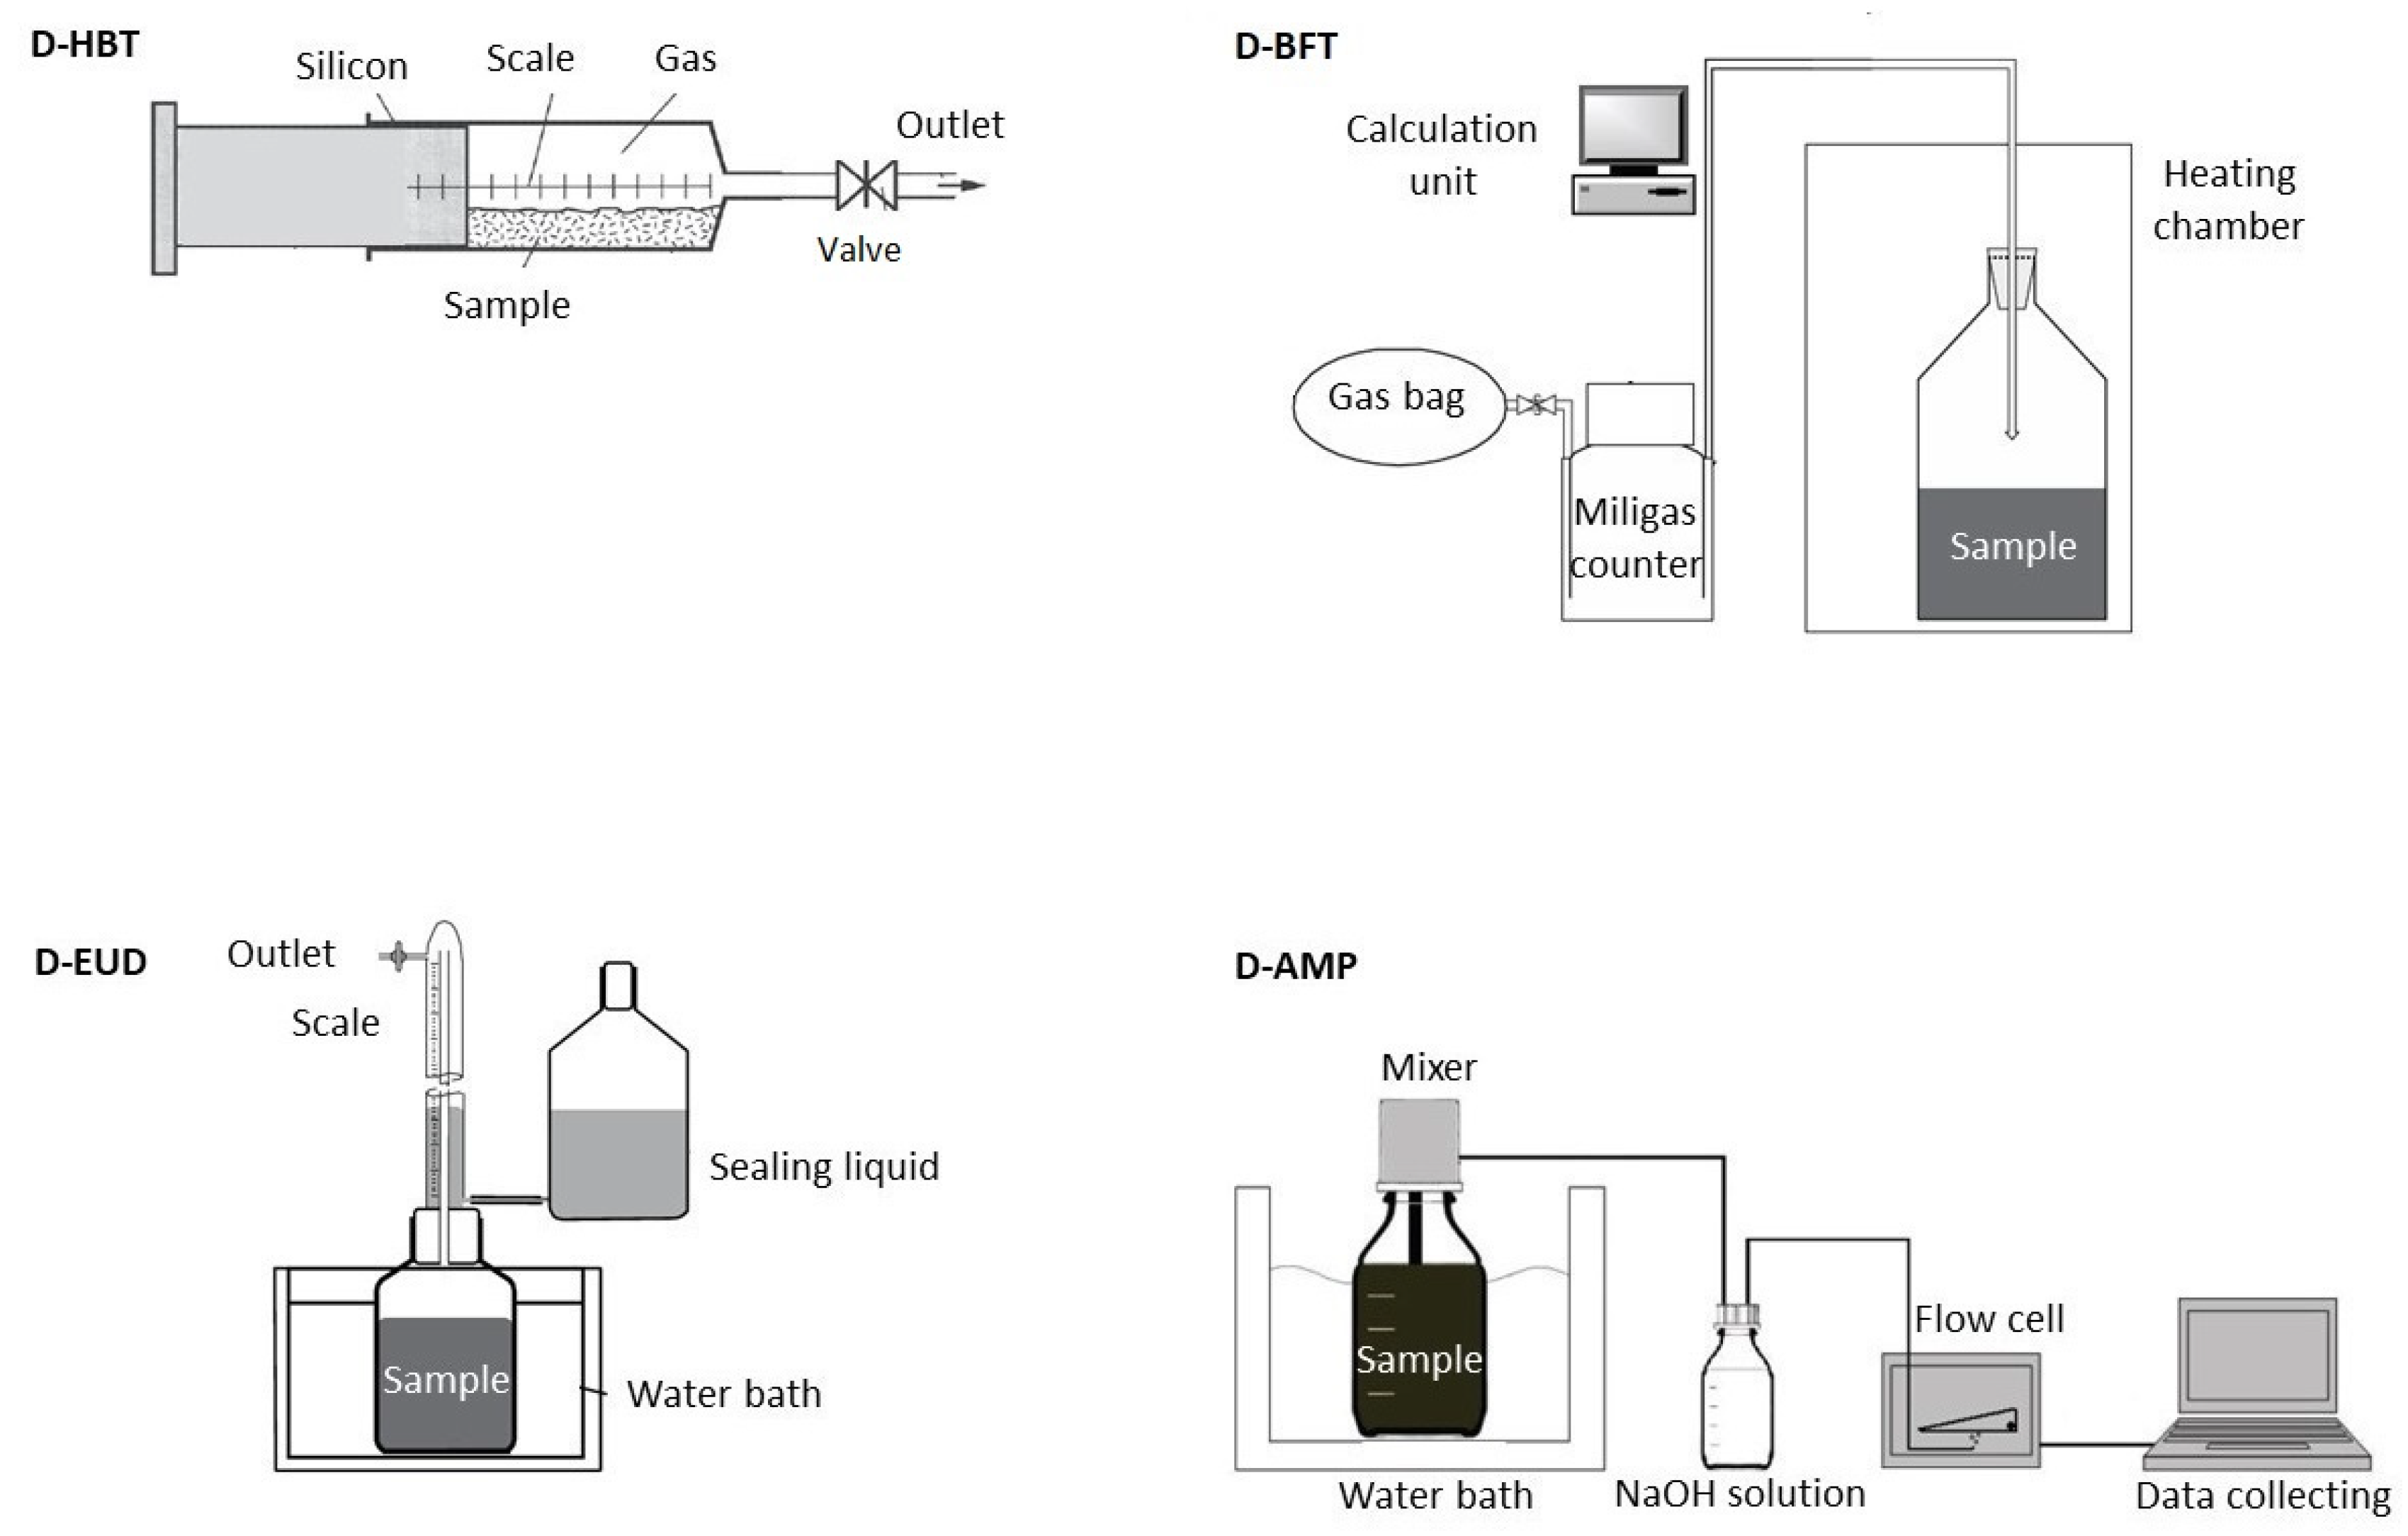
2.1. Digestion Systems

Four different digestion systems for performing the standardized BMP test according to VDI4630 [5] were compared (Table 2 and 
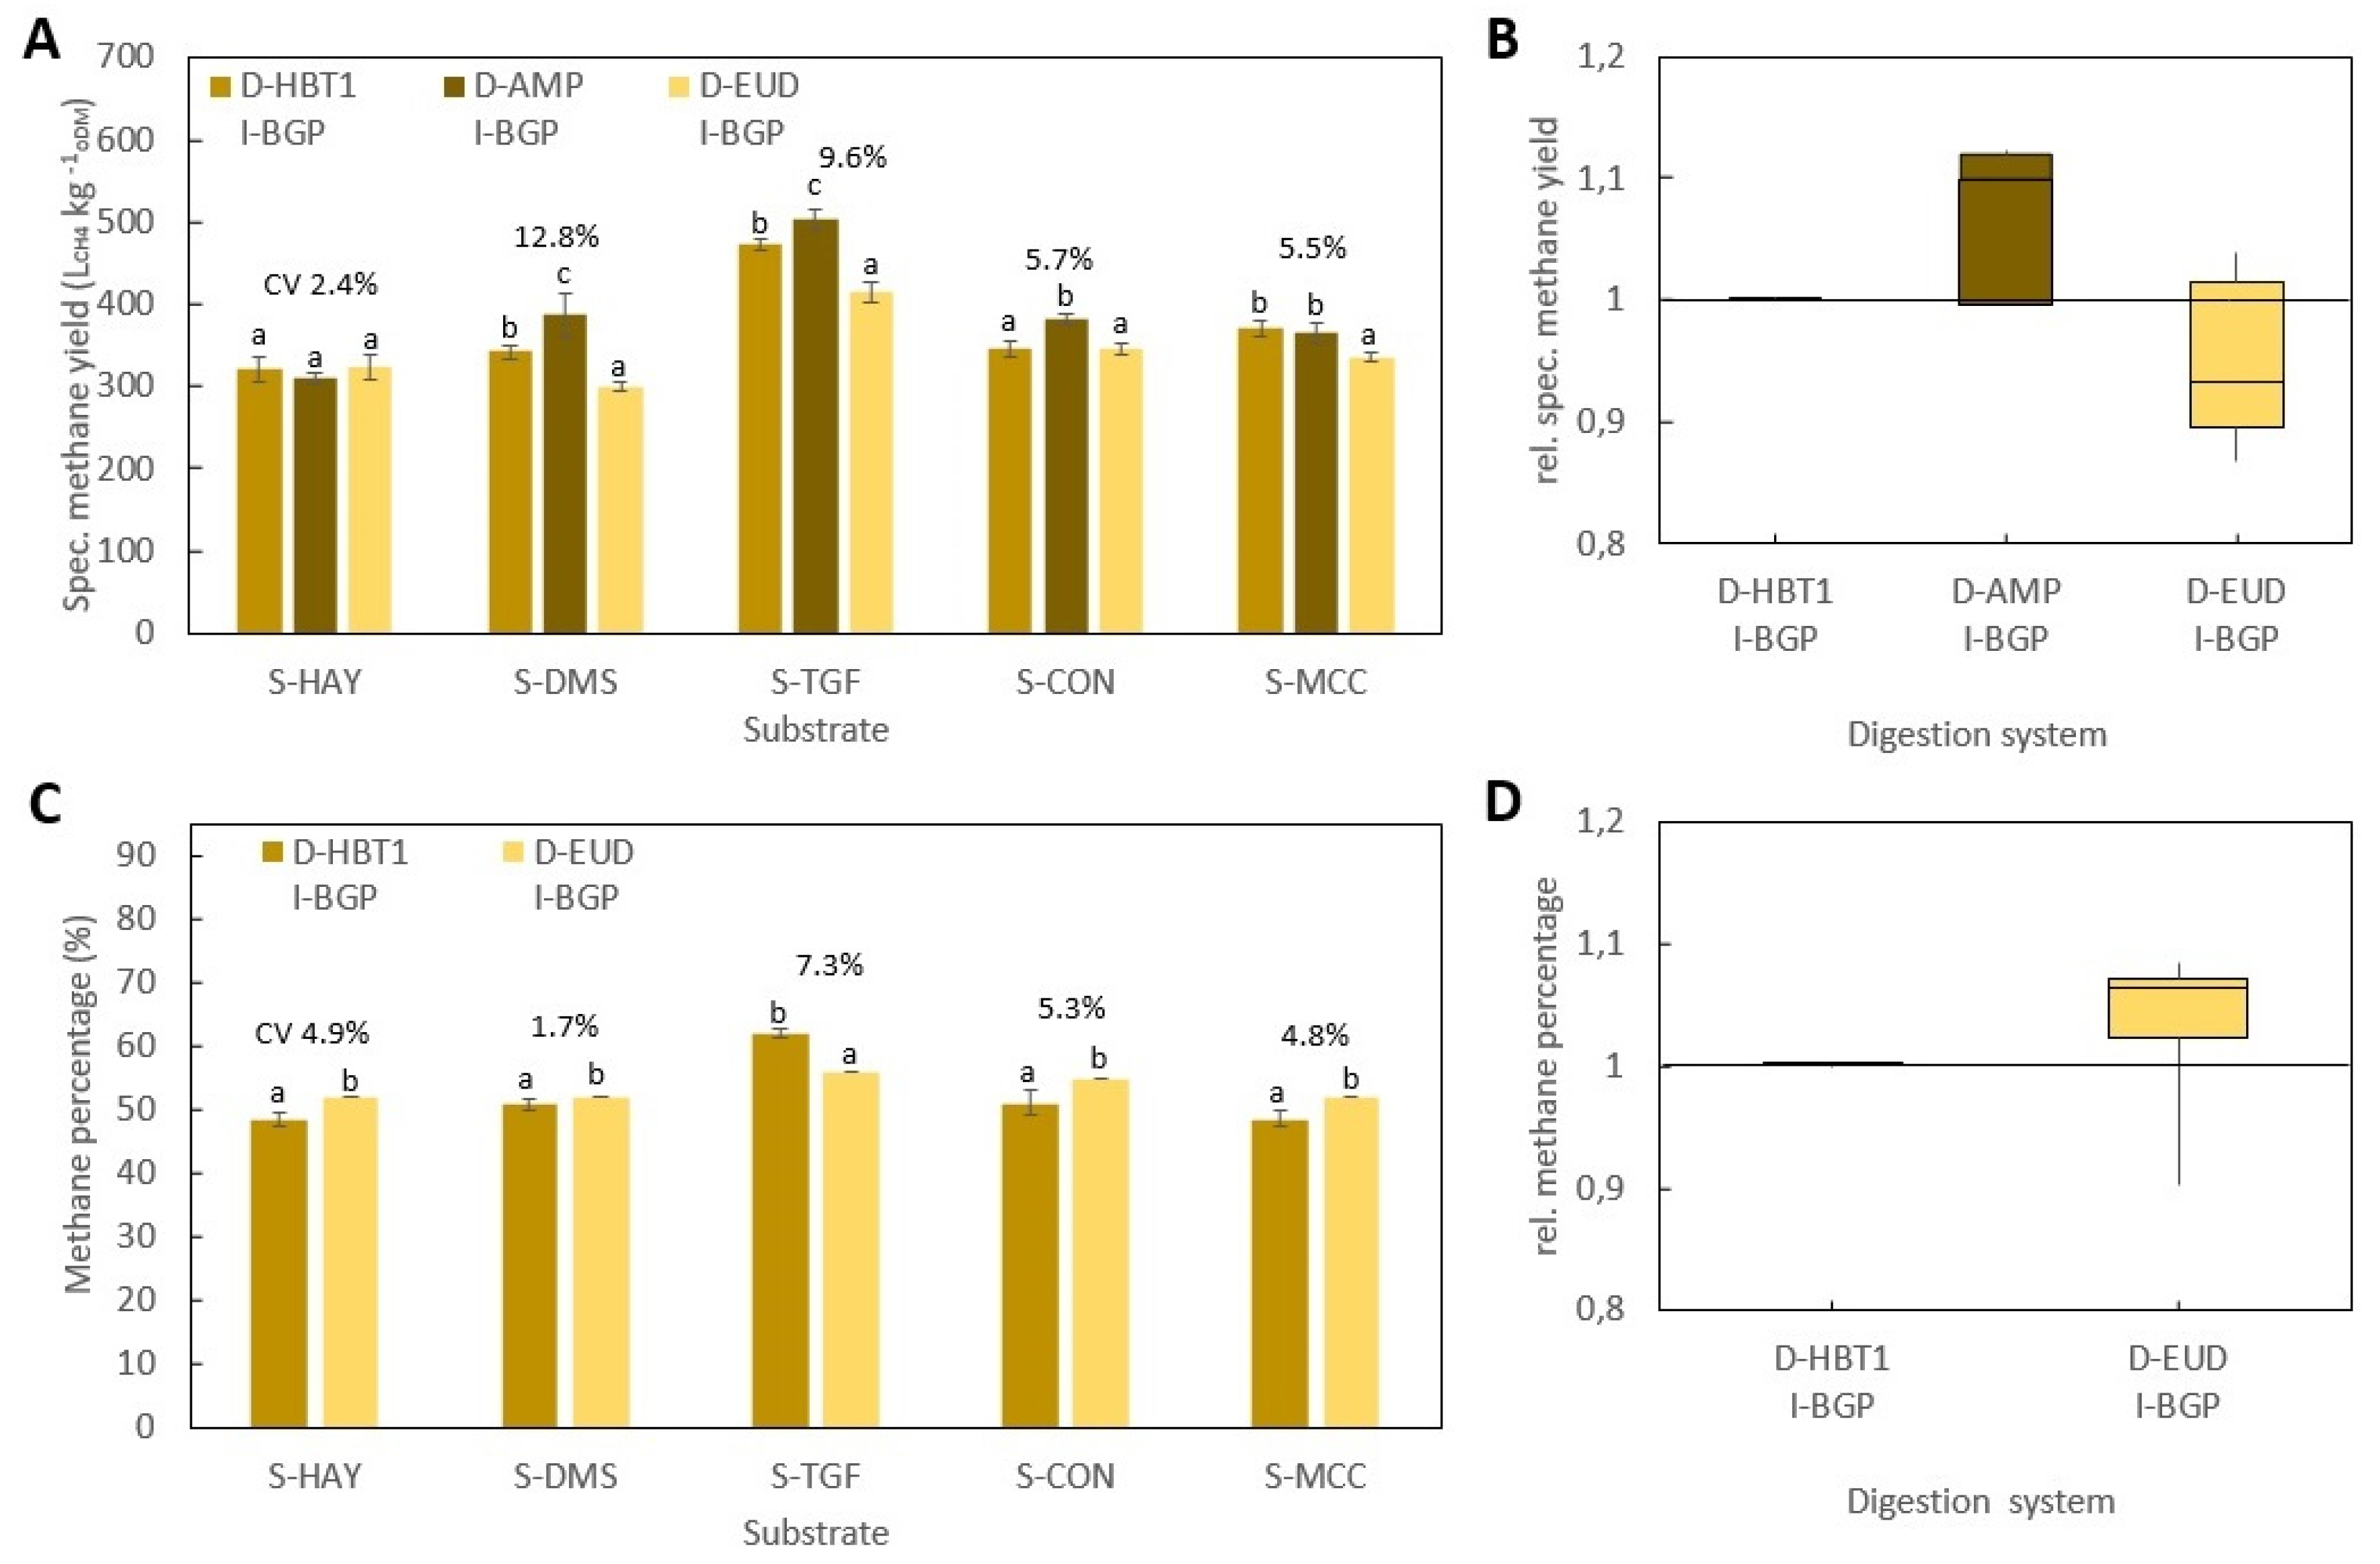
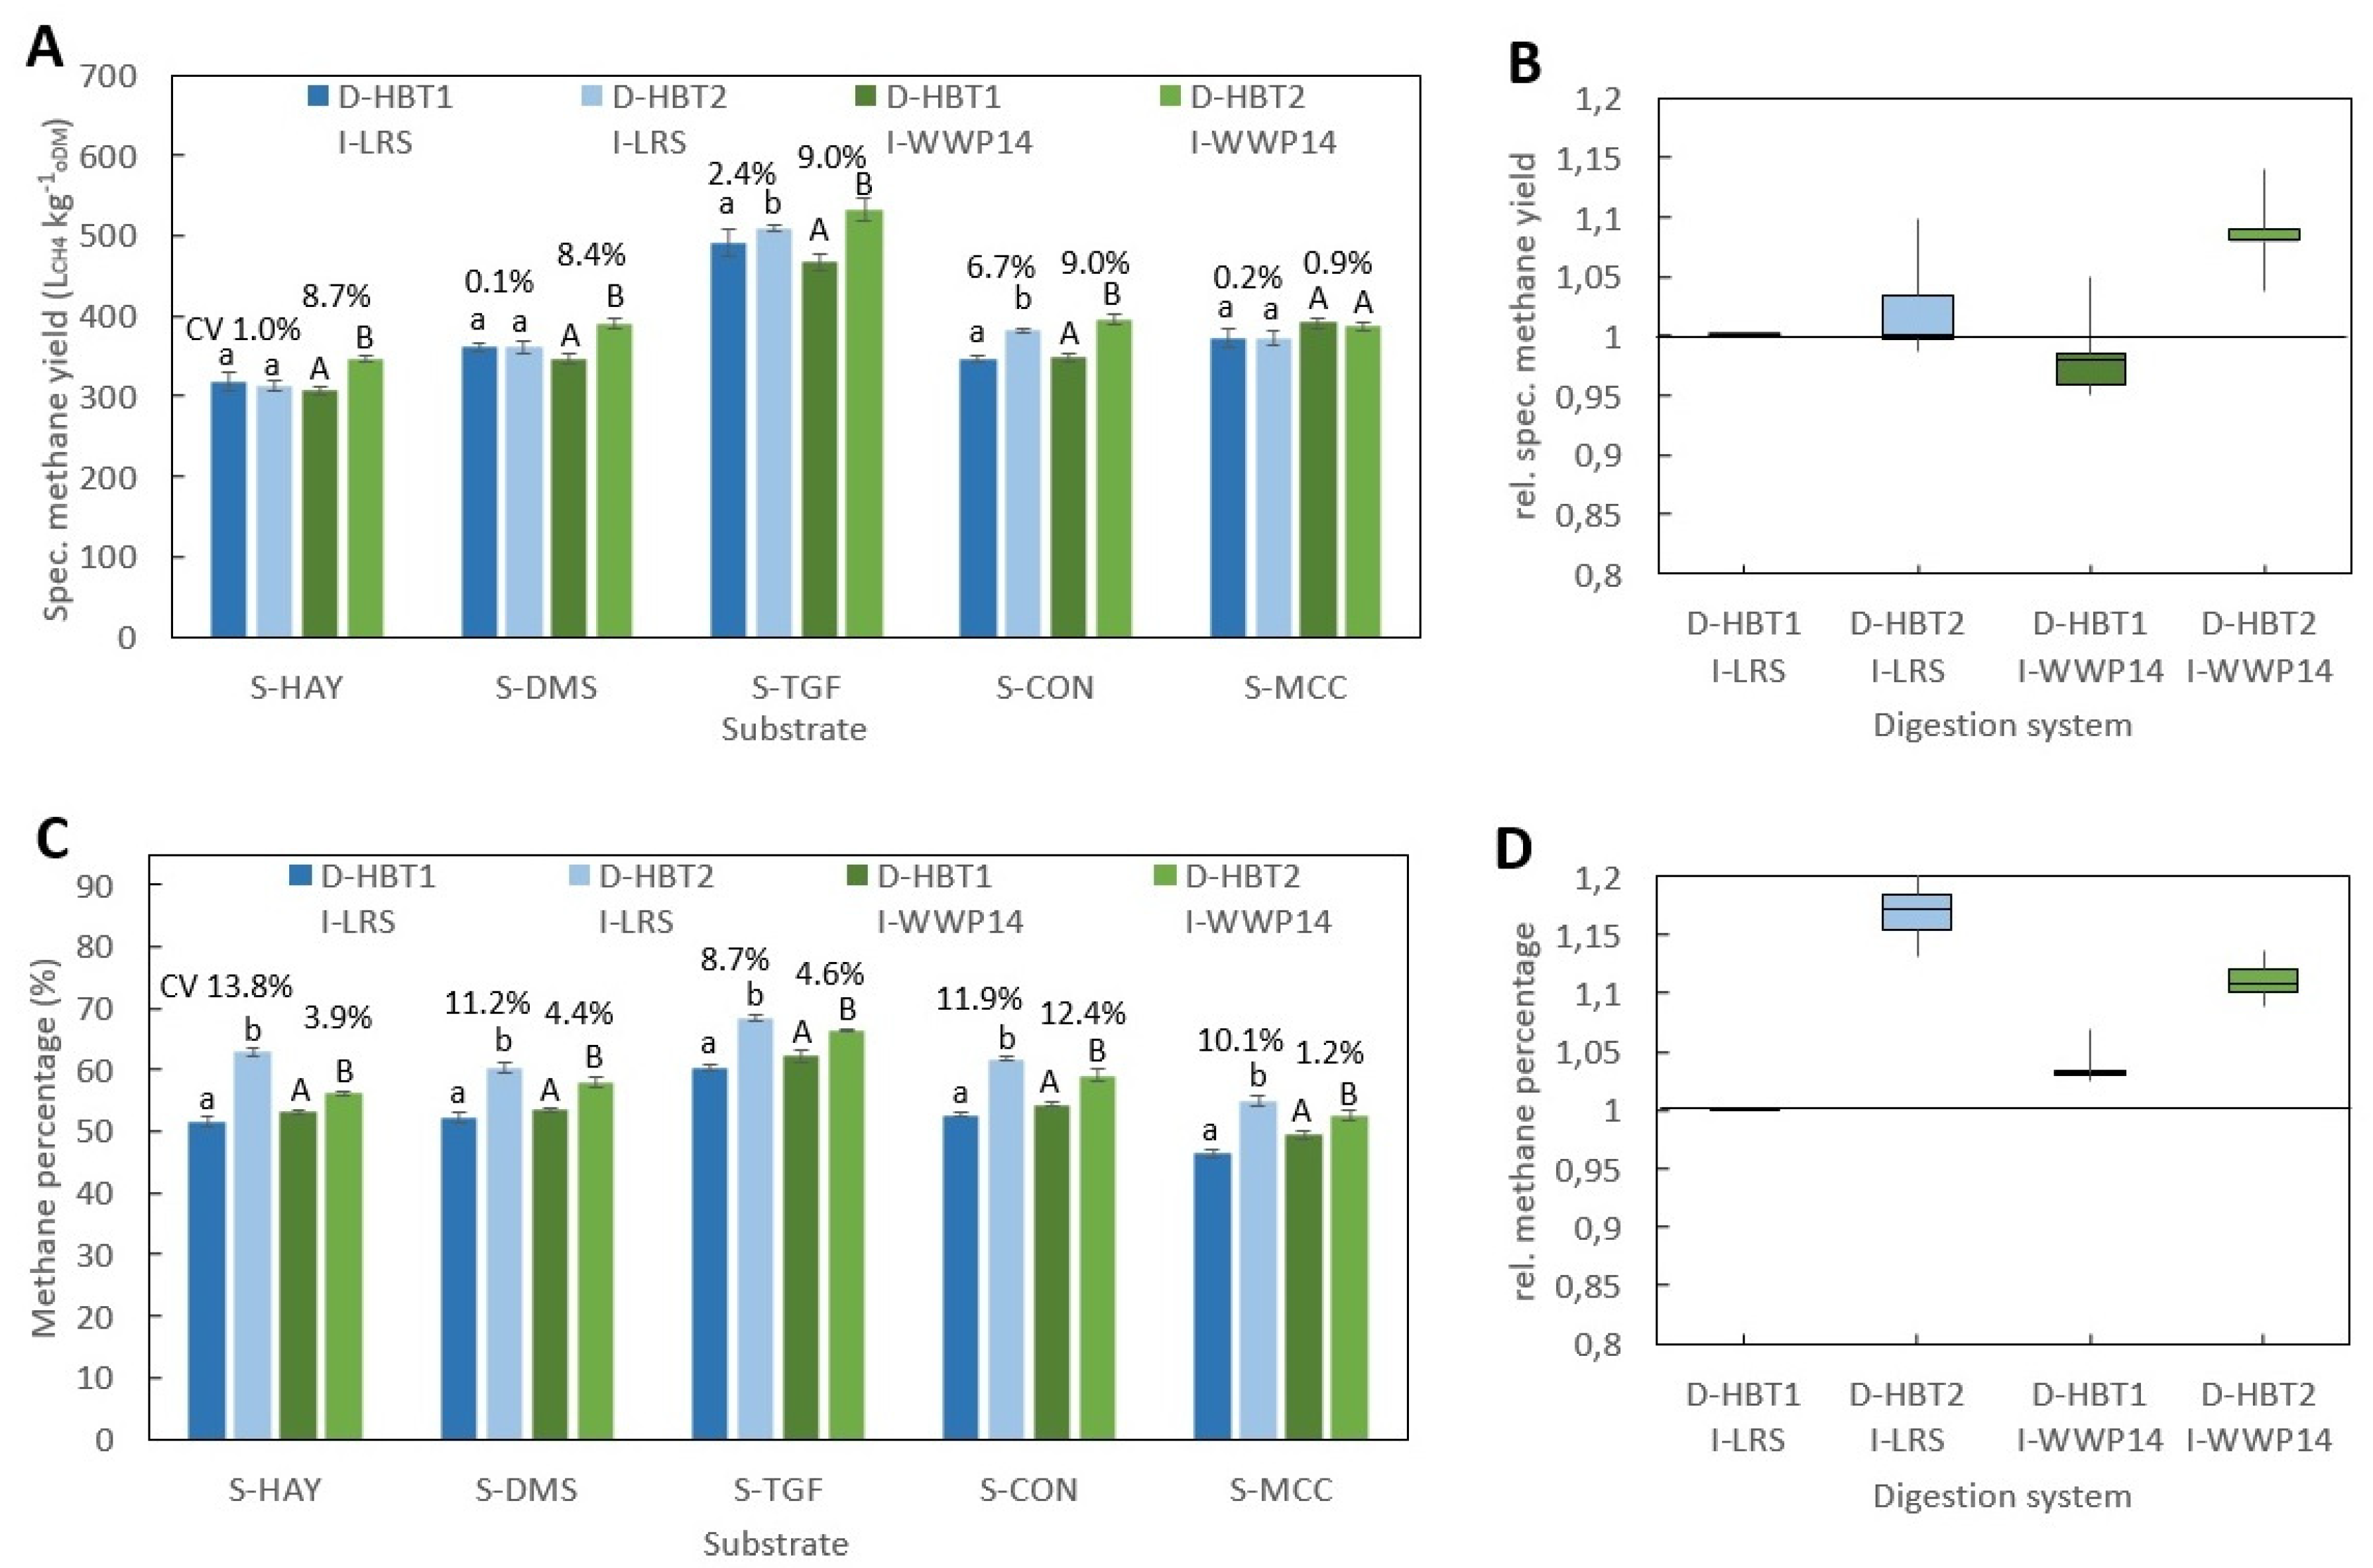
Figure 1): Hohenheim biogas yield test (D-HBT), Bergedorf fermentation test (D-BFT), Eudiometer (D-EUD) and an Automatic methane potential test system (D- AMP).

2.1.1. Hohenheim Biogas Yield Test (D-HBT)

D-HBT consisted of 100 mL syringes, which are placed in a continuously rotating drum with 129 places for syringes placed in an incubator [22]. The substrates in the syringes are agitated by the rotation of the drum at a speed of 1.2 rpm. The volume was measured manually by reading from a scale on the syringes. The methane percentage was measured by an infrared-spectrometric methane- sensor (“Advanced Gasmitter”, Pronova Analysetechnik, Berlin, Germany) [23]. The sensor was calibrated directly before and after each measurement with a calibration gas mixture of 40% CO2 and 60% CH4 (G325792, Westfalen AG, Münster, Germany). The tests were performed in two variants: in dry gas (D-HBT1) and in wet gas (D-HBT2). For dry gas measurements in D-HBT1 the gas was dried with an absorbent (SICAPENT®, Merck, Darmstadt, Germany). For the wet gas measurement, the water content of the gas was considered—by a correction of the gas volume V0 (mL) according VDI 4360 [5] Equation (1).
V 0 = V · ( p p W )   T 0 p 0 · T
where V (mL) and p (hPa) are the measured volume and pressure, pW (hPa) is the water vapor pressure at operation temperature T (K), and p0 (hPa) and T0 (K) the standard pressure and temperature (1013.3 hPa, 273.15 K).

2.1.2. Bergedorf Fermentation Test (D-BFT)

The D-BFT reactor had a volume of 1.5 L and was frequently agitated manually. The gas volume was measured by a tipping cell counter (MilligasCounter, Ritter Apparatebau GmbH, Bochum, Germany). Gas was collected in a gasbag and gas quality was measured in a combined sample as soon as 1.5 L of gas was produced. The methane percentage was measured by an infrared sensor (Awite Bioenergie GmbH, Langenbach, Germany) [24].

2.1.3. Eudiometer (D-EUD)

D-EUD (Neubert Glas GbR, Geschwenda, Germany) had a volume of 1.5 L. The headspace was flushed with nitrogen gas once a day and agitated continuously by a magnetic stirrer. The gas was collected in a tube, which was surrounded by a sealing fluid. In this tube the volume could be read by a scale bar. The gas composition was determined once at the end of the experiment with a land fill gas monitor (GA2000, Ansyco, Karlsruhe, Germany) [25].

2.1.4. Automatic Methane Potential Test System (D-AMP)

D-AMP (AMPTS II, Bioprocess Control AB, Lund, Sweden) had a volume of 0.5 L and was agitated by a mechanical stirrer. The CO2 and H2S was stripped by using 3 M NaOH solution and then the volume of methane was measured by a flow cell. The gas lifted the flow cell, which lowered back down afterwards. The digital impulse was registered by a computer. Since the volume of biogas in this digestion system was not measured, the percentage of methane could not be determined either.

2.2. Inocula

Five different inocula were used in this study (Table 3). All inocula were cooled down to 3–4 °C before being sent to avoid bias due to shipping. The dilutions and degassing were done after shipping.

2.2.1. Inoculum from Laboratory Reactor (I-LRS)

I-LRS was taken from a 400 L laboratory reactor, where bacteria were cultivated continuously. The inoculum was fed with maize silage, shredded wheat, soybean meal, rapeseed oil, and digestate from biogas plants in Baden-Württemberg, Germany. The organic loading rate (OLR) in terms of organic dry matter (oDM) was 0.3 kgoDM m−3 d−1 and temperature was 37 °C [23]. The hydraulic retention time (HRT) was 200 ± 25 d. Before using the inoculum, it was sieved using a mesh size of 0.5 mm.

2.2.2. Inoculum Diluted from Laboratory Reactor (I-LRD)

I-LRD was taken from a 2500 L laboratory reactor, which was fed by 80% cattle manure and 20% of a maize and grass silage mixture. OLR was 3.0 kgoDM m−3 d−1, temperature was 38 ± 1 °C and HRT was 19 d [24]. Before using, the inoculum was diluted with water in an inoculum/water ratio of 2:1 and stored at 37 °C for 7 d for degassing.

2.2.3. Inoculum from a Biogas Plant (I-BGP)

I-BGP was from a 942 m3 biogas plant, fed with maize silage and cattle manure. HRT was 103 d, the operating temperature was 37 °C and OLR was 2.7 kgoDM m−3 d−1. Prior to use, the inoculum was sieved using a mesh size of 5 mm and degassed for 5 d [26].

2.2.4. Inoculum from Wastewater Treatment Plant (I-WWP)

I-WWP was taken from a wastewater treatment plant in northern Germany and sieved at <1 mm [27]. I-WWP7 was stored afterwards for 7 days and I-WWP14 for 14 d, both at 37 °C for degassing.
Chemical characteristics and TE contents of the tested inocula are shown in Table 4 and Table 5, respectively.

2.3. Substrates

Five substrates with different nutrient compositions were chosen, where hay (S-HAY) and dried maize silage (S-DMS) represent widely used substrates and triglyceride fodder (S-TGF), concentrated fodder (S-CON) and microcrystalline cellulose (S-MCC) represent model feedstock with high content of fat, protein and fiber, respectively (Table 6).
Hay (S-HAY) (marstall Wiesen-Cobs, marstall GmbH, Oberstaufen, Germany) is a mixture of more than 50 different grass and herb species from the first cut from Allgäu (South Germany) in the year 2012. S-HAY was dried by hot air, chopped to 16 mm, milled with a laboratory mill (Pulverisette 19, Fritsch GmbH, Markt Einersheim, Germany) and stored at −20 °C.
Maize silage (S-DMS) was taken from Unterer Lindenhof (Eningen unter Achalm, Germany). S- S-DMS was dried and milled with the laboratory mill.
Triyglyceride fodder (S-TGF) was provided as a homogenous standard material with well-known molecular structure (C18H32O8N) and a known theoretical biogas yield of 609 L kgoDM−1 [8]. S-TGF was stored at 4 °C.
Concentrated fodder (S-CON) (Raiffeisen Kraftfutterwerke Süd GmbH, Würzburg, Germany) was milled with the laboratory mill and stored at −20 °C.
Microcrystalline cellulose (S-MCC) (CAS: 9004-34-6, Acros Organics, Pittsburgh, PA, USA) was used as standard substrate with known biogas yield of 745 L kg−1oDM with a methane percentage of 50% [5]. S-MCC had an average particle size of 50 µm and was stored at room temperature.

2.4. Measurement Procedure

All BMP tests were performed according to VDI 4630 at ISR > 2 and a temperature of 38 ± 0.5 °C. In all digestion systems, beside D-HBT1 and D-HBT2, tests were performed in three replicates and digestion was terminated according to the 0.5% criteria, i.e., when the increase in gas production was less than 0.5% d−1 for three days. In both D-HBT, tests were performed in six replicates. Digestion time was terminated after 35 d, whereby the 0.5% criterion was met in each test run. Specific methane yield was calculated for biogas yield and methane percentage that were measured for each test run. Gas volume was corrected to standard conditions of 101.33 kPa and 0 °C.
Investigated combinations of digestion systems, substrates and inocula are listed in Table 7. All substrates were tested in all digestion systems. However, the full range of inocula was only tested in D-HBT1, which was chosen because of the low sample volume (30 mL) required and its high repeatability. With the other digestion systems only one or two inocula could be tested due to the limited number of reactors for parallel tests (Table 7). Additionally, trials with supplementation of TE for all inocula in D-HBT1 on substrate S-DMS were performed by adding a TE solution as described by Angelidaki et al. [3]. In this test series, blanks for all inocula were also tested.

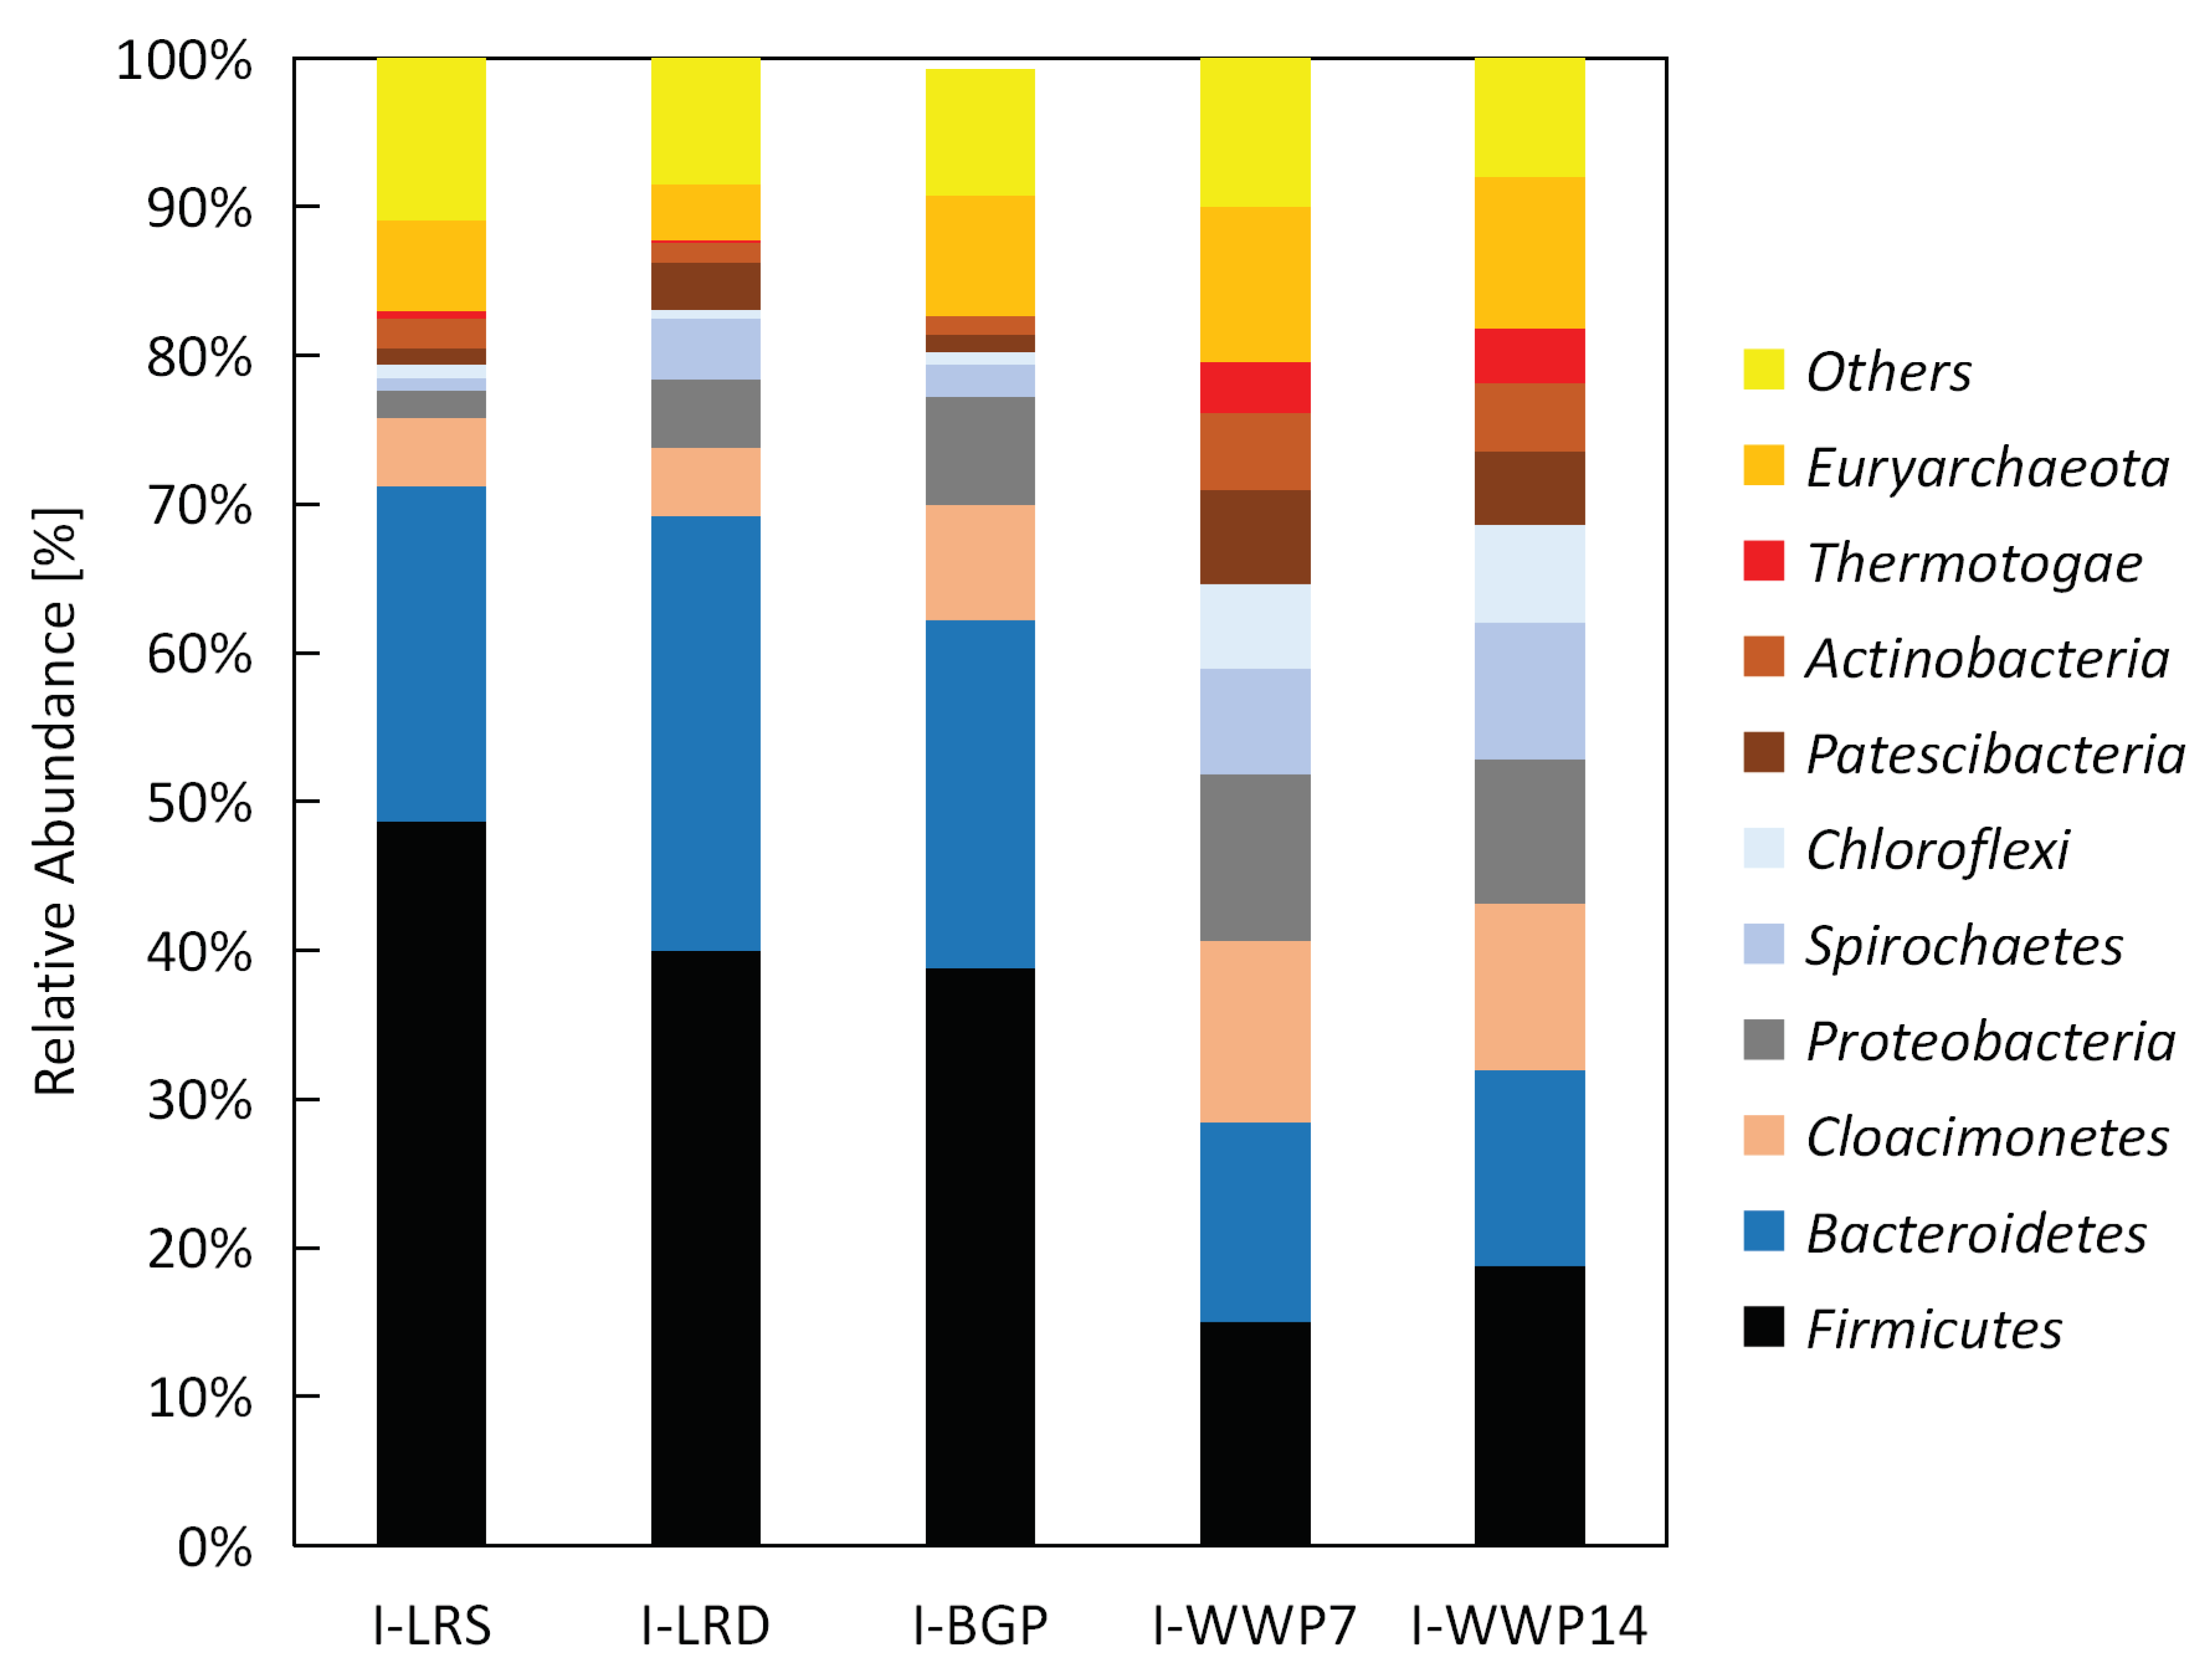
2.5. Taxonomic Profiling and Statistical Analysis

Taxonomic profiles of the microbial community within the analyzed inocula were determined by 16S RNA amplicon-sequencing. Microbial DNA was extracted with the FastDNA ® SPIN Kit for Soil (MP Biomedicals, Illkirch-Graffenstaden, France) and cleaned with Genomic DNA Clean & Concentrator TM Kit (Zymo Research, Irvine, CA, USA). The 16S RDNA gene amplicon-library was constructed by using the “16S Metagenomic Sequencing Library Preparation” protocol (Illumina, San Diego, CA, USA) and the primer pairs Pro341F and Pro805R [29]. The sequencing was done on the Illumina MISeq platform applying the 300x bp paired-end protocol. Afterwards bioinformatics preprocessing of the sequencing data was done. Forward and reverse reads were merged with FLASH [30], primer were removed with cutadapt [31], while quality trimming of reads was done with sickle [32]. Taxonomic classification was done by using the QIIME platform [33] in combination with the SILVA 16S rDNA reference database (Release 132, 10.04.2018). Taxonomic profiles were presented as a bar chart for each inoculum. More detailed information is given in Hassa et al. [34].
The statistical analysis of specific methane yield was performed by ANOVA post-hoc Tukey test at α = 0.05 using Microsoft Excel 2016.

3. Results and Discussion

3.1. Microbial Community Composition

In Figure 2 the composition of the microbial communities of all analyzed inocula before starting the BMP test are shown. Differences in the microbial composition between the inoculum from wastewater sludge and the inocula from other origins were observed. The microbiome can be categorized into bacteria and archaeal populations.

3.1.1. Bacteria

The inocula I-LRS, I-BGP, and I-LRD showed a high abundance of Firmicutes within the bacterial population. I-LRS had the highest ratio with 49%, followed by I-LRD with 40% and I-BGP with 39%. Desvaux et al. [35] described the capability of Firmicutes to degrade complex materials like cellulose. It was also shown, that Firmicutes grow when fed with maize silage [36,37]. Additionally, all inocula contained a high number of Clostridia. As much as 40.5% of all bacteria in I-LRS were classified as Clostridia, as well as 33% in I-BGP and I-LRD. The classes Clostridia and Bacilli (phylum Firmicutes) are able to decompose protein, cellulose, fat, and carbohydrates to acetic, propionic, and butyric acids [38,39].
However, members of the class Clostridiales are also reported to replace bacteria of the phylum Bacteroidetes. Most Bacteroidetes are acid producers and are capable of performing acidogenic-, acetogenic-, and syntrophic acetate oxidation breakdown [40]. A reduction of activity caused by self- inhibition of produced acid can occur. The high ratio of Bacteroidetes for I-LRS, I-BGP, and I-LRD (22.5%–29.2%) could reveal a condition without high volatile fatty acid (VFA) as reported from Alsouleman et al. [40] for increasing the amount of poultry manure on feeding.
Inocula WWP showed a different bacteria composition and a higher diversity. Members of the phylum Firmicutes (15%–19%) and Bacteroidetes (13%) were less abundant and additionally the phyla Cloacimonetes (11%–12%), Patescibacteria (5%–6%), Spirochaetes (7%–9%), Proteobacteria (10%–11%), Actinobacteria (5%), Chloroflexi (6%–7%) and Thermotogae (3%–4%) were identified. Members of the phylum Cloacimonetes are responsible for acetogenesis, and the degradation of amino acids, sugars, and alcohol. A lower abundance of this phylum could result in fewer educts of acetogenesis. The abilities of the phyla Atescibacteriam and Spirochaetes have not yet been described in the literature [41,42]. Campanaro et al. [43] showed that some members of the phylum Patescibacteria are more abundant in wastewater sludge compared to the digestate of agricultural feedstock. Proteobacteria are described as secondary degraders of polysaccharides [44]. The availability of more complex substrates should increase their population, which are common in wastewater sludge. The phyla Actinobacteria and Chloroflexi were previously described as highly abundant in wastewater sludge [41]. Thermotogae are found in several habitats. They can resist high temperatures and degrade a large diversity of organic sources [45].

3.1.2. Archaea

Large differences were observed in the ratios of the archaeal part of the microbial community microbiota. The archaea ratio was 10.4% for I-WWP7 and 10.2% for I-WTT14, which was almost 2.5 times higher than the ratio of I-LRD (4.1%) as well as higher than that of I-LRS (6.3%) and I-BGP (8.3%). De Vierze et al. [17] recommend a high abundance of methanogens for a good performance of the inocula.
The majority of archaea (93%) were members of the phylum Euryarchaeota. The I-BGP and I-LRD were dominated by members of the genus Methanosaeta (I-BGP 88% and I-LRD 73%). This reveals that within both inocula the acetoclastic methanogenesis pathway is favored and that both inocula seem to have a low VFA and ammonium (NH4+–N) concentration. It was shown, that the genus Methanosaeta decreases with high VFA and NH4+–N concentration [19,42]. In contrast, the archaeal community of I-LRS consisted of the genera Methanoculleus (43%) and Methanosarcina (8%). Both species could also be found in smaller ratios (1%–11%) in all of the other inocula. The high abundance in I-LRS is probably due to the high NH4+–N concentration within this inoculum (Table 6). Members of the genera Methanoculleus and Methanosarcina can replace those of to the genus Methanosaeta in habitats with higher VFA and NH4+–N concentrations. Kougias et al. [46] described the occurrence of Methanoculleus sp. in many biogas plants with different feedstocks and that this genus uses the hydrogenotrophic methanogensis pathway. Member of the genus Methanosarcina are described as stress resistant, hydrogentrophic archaea [38].
In I-WWP7 and I-WWP14, the archaeal community composition was similar. Both communities consisted of 80% Methanomicrobia. The genus of this archaeal class could not be detected.

3.1.3. Effects of Pre-Incubation

Based on the data of inocula I-WWP7 and I-WWP14, it is possible to determine the influence of pre-incubation on the microbial community composition. The ratio of the phylum Firmicutes was enhanced after 14 days of pre-incubation. Compared to only 7 days of incubation, the ratio was 3.7% ± 0.5% higher. One possible explanation for this is the higher degradation of complex material. However, the Proteobacteria ratio decreased by 1.4% ± 0.3% after 14 days compared to 7 days of pre- incubation. It was expected, that the higher amount of complex material would increase the Proteobacteria population. Luo et al. [47] found a similar behavior for the batch test. Additionally, there was no effect regarding the ratio of the phylum Bacteroidetes, which was expected to be lower when more complex material was used.
The phyla Cloacimonetes, Patescibacteria, Verrucomicrobia, and Tenericutes showed an increased ratio when the pre-incubation time was longer. The lower abundance of Cloacimonetes may be a result of fewer educts of acetogenesis. The functions of Patescibacteriam, Tenericutes, and Verrucomicrobia are not yet described in the literature [41]. The increase of the phylum Spirochaetes of 2.1% cannot be explained as its function is not yet known.
The different incubation times did not show any effect on the population of the phylum Actinobacteria. During incubation, the ratio of the phylum Chloroflexi showed a slow increase (0.9%).

3.2. Impact on Specific Methane Yield and Methane Percentage

3.2.1. Trace Element Addition

The results of TE supplementation are presented in Table 8. There were no significant differences in the specific methane yield of blanks and the substrate S-DMS with and without adding TE (CV between 0%–3%) according to the results of ANOVA post-hoc Tukey test. Values for S-DMS are also in the range of dried maize silage of Mukengele et al. [48]. In contrast to a recommendation of Angelidaki et al. [3], the addition of TE was not necessary for the tested inocula. The TE concentration without adding additionally TE shows already, that inocula I-BGP, I-LRS, and I-LRD were in the optimal range for biogas plants reported by Oechsner et al. [28] (Table 5). The exception was Cu where the concentration was higher for all inocula. The inoculum I-WWP had higher concentrations of Fe and Zn whereas the concentration of Se was lower. To achieve optimal TE concentrations, the use of digestate is recommended. However, other papers also show a good performance for inoculum from wastewater treatment plants [13,14]. The values of I-WWP7 and I-WWP14 for S-DMS did not show any inhibition in methane production compared to the other inocula (Table 8).

3.2.2. Effect of the Inoculum

Figure 3A shows the specific methane yield for all inoculum/substrate combinations tested in digestion system D-HBT1. In Figure 3B, inoculum I-LRS is used as a reference and the specific methane yield of all the other inocula is related to the mean value of I-LRS.
The deviation of the specific methane yield when using different inocula differed for each substrate as also shown in other publications [17,18]. The CV differed between 1.9% and 4.8%.
Substrate S-HAY is the only substrate that showed no statistical differences for different inocula in the results.
Substrates S-HAY and S-CON had the lowest CV, both with 2.3% and 1.9%. Both substrates were homogenous standard substrates, which could be the reason for the small CV.
Substrates S-DMS has two well adapted inocula, namely I-BGP and I-LRD, characterized by a higher percentage of Firmicutes. However, both produced a significantly lower yield than I-WWP7. Other studies report that inocula, which have already adapted to the feedstock, produce a higher methane yield [16,18]. This cannot be confirmed by our data and more research will be needed to clarify the reasons.
Results of S-MCC showed statistical differences between I-WWP and all other inocula, which is also reflected in the highest CV (4.8%). Koch et al. [18] also reveals the biggest CV for S-MCC (around 5%). Yields achieved with I-LRS and I-BGP were around 370 LCH4 kg−1oDM. This value is expected as it falls within the range of average values between 363 and 371 LCH4 kg−1oDM determined by calculation and inter-laboratory tests [7]. It is also 99% of the theoretical value [5]. Inocula I-WWP7 and I-WWP14 produced more methane, reaching 384 and 393 LCH4 kg−1oDM, respectively, which is 103–105% of the theoretical value. However, Czepuck et al. [49] also report such a high spec. methane yield (392 LCH4 kg−1oDM) for substrate S-MCC. One possible reason could be the lack of carbon in inocula I-WWP7 and I-WWP14. Adding S-MCC as a source of carbon might improve the C/N-ratio and lead to a higher degradation of the inoculum.
Values of CV up to 4.8% can be explained by various influences. All the inocula had different microbial community compositions. This can result in a variance of substrate consumption for microbial growth [17]. Additionally, a stimulation of inocula by adding a carbon-rich substrate can result in a higher methane potential of the inoculum than measured in the blanks. An overestimation of the methane yield is a possible consequence [18].
The methane percentage of the different inocula is presented in Figure 3C. The CV between the inocula was less than 3.3%. The methane percentage showed an almost similar behavior for all substrates.
Inocula I-LRS and I-LRD did not show statistically significant differences to each other.
I-BGP was only significantly higher than I-LRS and I-LRD for substrate S-TGF (1.2%CH4 below average) and S-HAY (0.6%CH4 above average), but in every case lower than for I-WWP7 and I-WWP14.
Inocula I-WWP7 and I-WWP14 had the highest methane percentage, as shown in Figure 3D. A statistically significant difference between I-WWP7 and I-WWP14 was only reported for S-HAY. For all other substrates I-WWP7 and I-WWP14 performed similarly. Thus, in case of I-WWP7 and I-WWP14, a dependency of the methane percentage on inoculum was shown. One possible reason for this can be the larger diversity of bacteria and a higher abundance of archaea, which results in a shorter hydrolysis time with a low methane percentage at the beginning.

3.2.3. Effect of the Degassing

The effect of degassing on specific methane yield and methane percentage can be seen by the differences between inocula I-WWP7 and I-WWP14 (Figure 3). I-WWP7 and I-WWP14 were statistically significantly different for all substrates except S-MCC. I-WWP7 had a 7 to 15 LCH4 kg−1oDM higher methane yield (CV 0.3%–4.8%) compare to I-WWP14. These results differ from literature, where no effect of the degassing time was shown [12,14]. One reason might be that within I-WWP7 a smaller amount of substrate was used for the growth of the microorganisms, because of higher activity of microbiological populations by shorter degassing time. A longer degassing time resulted in a higher abundance of members of the phylum Firmicutes, which degrade complex material. This resulted in a higher methane yield of substrates with high fiber content like S-MCC and S-HAY. The German protocol VDI 4630 recommends pre-incubation for at least seven days. Based on our results a longer pre-incubation time should be recommended.

3.2.4. Effects of the Digestion System

The inoculum I-LRD was tested in digestion system D-HBT1 and D-BFT (Figure 4). The CV for the digestion systems differed for the specific methane yield between 1.3% and 6.6% and for the methane percentage between 0.0% and 2.9%.
However, differences between D-HBT1 and D-BFT were only significant for substrates S-TGF and S-MCC. By using I-LRD in D-BFT, the methane yield of S-MCC is 101% of the theoretical methane yield.
The inocula I-BGP was used in three different digestion systems (D-HBT1, D-AMP, and D-EUD) (Figure 5). The CV for the specific methane yield was between 2.4% and 12.8% and for the methane percentage between 1.7% and 7.3%.
The specific methane yields of the digestion systems were significantly different for all substrates beside S-HAY Figure 5A.
The digestion system D-EUD showed in most cases the lowest methane yield (e.g., for S-MCC only 90% of the theoretical value). This could be explained by the fact that D-EUD has long pipes and could therefore be vulnerable to gas leaks.
D-AMP showed a higher methane yield than D-HBT1 and D-EUD for most substrates. The D-AMP measures automatically and consequently avoids manual mistakes. Another reason for random differences could be, that the D-EUD and D-AMP have a headspace, which can result in a deviation of up to 15% to 25% as described in Strömberg et al. [20].
The methane percentage could only be presented for D-HBT1 and D-EUD because it is not possible to measure the methane percentage in D-AMP Figure 5C.
D-HBT1 and D-EUD showed statistically significant differences for all substrates, even when the difference was small.

3.2.5. Effects of the Way in Which Water Vapor Is Taken into Account

Although the digestion system is the same, D-HBT1 showed for most of the substrates a lower methane yield and also a lower methane percentage Figure 6. The differences are because of the way in which water vapor was taken into account by the two laboratories. In D-HBT1 the methane content was measured in dried gas and in D-HBT2 it was measured in wet gas and mathematically corrected according to VDI 4630. It seems that these differences in the measurement procedure and calculation affect the results. A cooling down of the syringes and condensation of water before gas analysis might lead to an overestimation of the methane percentage. Strömberg et al. [20] also reported measurement errors in this respect of up to 10%. Therefore, the drying of the gas is preferable to a mathematical correction.

4. Conclusions

Several bio-chemical parameters determine the performance of the used inocula in biomethane potential tests. The microbial community composition strongly depends on the origin of the inoculum. The inoculum from a wastewater treatment plant showed a high diversity of the microbial community, which was completely different to the community composition of inocula from biogas plants and laboratory reactors. The adding of trace elements to well supplied inocula did not affect the results. An impact of different incubation times (7 and 14 d) to a coefficient of variation of up of 4.8% was measured. The coefficient of variation for the specific methane yield was up to 4.8% for different inocula using the same digestion system. The coefficient of variation for the impact of the used digestion systems was maximum 12.8%. The digestion systems showed a higher effect, but the deviation strongly depends on the substrate. A clear effect of the digestion system cannot be identified due to missing data of one inocula in all the digestion systems. This point needs further research. The way in which water vapor is taken into account seems to be important and the drying of the gas is preferable compared to a mathematical correction.

Author Contributions

Conceptualization, B.H. and H.O.; methodology, B.H.; validation, B.H., H.O., W.M., J.M., and J.H.; formal analysis, B.H., L.Z., and W.M.; investigation, B.H. and J.H.; resources, H.O. and J.M.; data curation, B.H.; writing—original draft preparation, B.H.; writing—review and editing, B.H., H.O. W.M., and J.M. L.Z., J.H.; visualization, B.H.; supervision, H.O., J.M.; project administration, H.O.; funding acquisition, H.O. All authors have read and agreed to the published version of the manuscript.

Funding

This work was done in the project biogas measurement program III. It was funded by the Fachagentur Nachwachsende Rohstoffe (FNR) and the Federal Ministry of Food and Agriculture (BMEL) (FKZ: 22403715).

Acknowledgments

Thanks goes to the project partners German Biomass Reasearch Centre (DBFZ), Bavarian State Research institute for Agriculture (LfL) and Competence Centre Renewable Energies and Climate Protection Schleswig-Holstein (EEK.SH) and in person Susanne Theuerl, Jan Postel, Tino Barchmann, Marcel Pohl, Jan Liebetrau, Torsten Stefan, Susanne Ohl, Christian Moschner, Rober Kliche and Matthias Effenberger. Thanks for English correction to Antje Hülsemann and Natasha Burzynski. D-HBT1 measurements were done by Ezgi Küver and students of the University of Hohenheim. We express our gratitude for this accurate work and also a big thanks to Jacqueline Kindermann for determining the quality parameters of inoculum.

Conflicts of Interest

The funders had no role in the design of the study; in the collection, analyses, or interpretation of data; in the writing of the manuscript, or in the decision to publish the results.

References

  1. BMU. Renewable Energy Sources Act (EEG); Federal Ministry of Enviroment, Nature Conservation and Nuclear Safety: Berlin, Germany, 2009. [Google Scholar]
  2. Raposo, F.; Fernández-Cegrí, V.; De La Rubia, M.; Borja, R.; Béline, F.; Cavinato, C.; Demirer, G.; Fernández, B.; Fernández-Polanco, M.; Frigon, J.-C.; et al. Biochemical methane potential (BMP) of solid organic substrates: Evaluation of anaerobic biodegradability using data from an international interlaboratory study. J. Chem. Technol. Biotechnol. 2011, 86, 1088–1098. [Google Scholar] [CrossRef]
  3. Angelidaki, I.; Alves, M.; Bolzonella, D.; Borzacconi, L.; Campos, J.L.; Guwy, A.; Kalyuzhnyi, S.; Jenicek, P.; Van Lier, J.B. Defining the biomethane potential (BMP) of solid organic wastes and energy crops: A proposed protocol for batch assays. Water Sci. Technol. 2009, 59, 927–934. [Google Scholar] [CrossRef] [Green Version]
  4. Holliger, C.; Alves, M.; Andrade, D.; Angelidaki, I.; Astals, S.; Baier, U.; Bougrier, C.; Buffière, P.; Carballa, M.; De Wilde, V.; et al. Towards a standardization of biomethane potential tests. Water Sci. Technol. 2016, 74, 2515–2522. [Google Scholar] [CrossRef]
  5. VDI 4630. Fermentation of Organic Materials—Characterisation of the Substrate, Sampling, Collection of Material Data, Fermentation Tests; Verlag des Vereins Deutscher Ingenieure: Düsseldorf, Germany, 2016. [Google Scholar]
  6. Paterson, M.; Oechsner, H.; Tilmann, P. KTBL/VDLUFA-Proficiency Test Biogas. In Value of Batch Tests for Biogas Potential Analysis, Method Comparison and Challenges of Substrate and Efficiency Evaluation of Biogas Plants; Murphy, J.D., Ed.; IEA Bioenergy Task: Copenhagen, Denmark, 2018; Volume 37. [Google Scholar]
  7. Weinrich, S.; Schäfer, F.; Bochmann, G.; Liebetrau, J. Value of Batch Tests for Biogas Potential Analysis, Method Comparison and Challenges of Substrate and Efficiency Evaluation of Biogas Plants; Murphy, J.D., Ed.; IEA Bioenergy Task: Copenhagen, Denmark, 2018; Volume 37. [Google Scholar]
  8. Holliger, C.; Fruteau de Laclos, H.; Hafner, S. Report on International Inter-Laboratory Study on BMP Tests. In Proceedings of the 15th IWA World Conference on Anaerobic Digestion, Beijing, China, 17–20 October 2017. [Google Scholar]
  9. Cresson, R.; Pommier, S.; Béline, F.; Bouchez, T. Results from a French Inter-Laboratory Campaign on the Biological Methane Potential of Solid Substrates. In Proceedings of the World Congress on Anaerobic Digestion, Vina del Mar, Chile, 15–18 November 2015. [Google Scholar]
  10. Pham, C.H.; Triolo, J.M.; Cu, T.T.T.; Pedersen, L.; Sommer, S.G. Validation and recommendation of methods to measure biogas production potential of animal manure. Asian Australas. J. Anim. Sci. 2013, 26, 864–873. [Google Scholar] [CrossRef] [Green Version]
  11. Sommer, S.G.; Petersen, S.O.; Møller, H.B. Algorithms for calculating methane and nitrous oxide emissions from manure management. Nutr. Cycl. Agroecosyst. 2004, 69, 143–154. [Google Scholar] [CrossRef]
  12. De Vrieze, J.; Raport, L.; Willems, B.; Verbrugge, S.; Volcke, E.; Meers, E.; Angenent, L.T.; Boon, N. Inoculum selection influences the biochemical methane potential of agro-industrial substrates. Microb. Biotechnol. 2015, 8, 776–786. [Google Scholar] [CrossRef]
  13. Regueiro, L.; Veiga, P.; Figueroa, M.; Alonso-Gutierrez, J.; Stams, A.J.M.; Lema, J.M.; Carballa, M. Relationship between microbial activity and microbial community structure in six full-scale anaerobic digesters. Microbiol. Res. 2012, 167, 581–589. [Google Scholar] [CrossRef]
  14. Li, Y.; Feng, L.; Zhang, R.; He, Y.; Liu, X.; Xiao, X.; Ma, X.; Chen, C.; Liu, G. Influence of Inoculum Source and Pre-incubation on Bio-Methane Potential of Chicken Manure and Corn Stover. Appl. Biochem. Biotechnol. 2013, 171, 117–127. [Google Scholar] [CrossRef]
  15. Pozdniakova, T.A.; Costa, J.C.; Santos, R.J.; Alves, M.M.; Boaventura, R.A.R. Anaerobic biodegradability of Category 2 animal by-products: Methane potential and inoculum source. Bioresour. Technol. 2012, 124, 276–282. [Google Scholar] [CrossRef] [Green Version]
  16. Elbeshbishy, E.; Nakhla, G.; Hafez, H. Biochemical methane potential (BMP) of food waste and primary sludge: Influence of inoculum pre-incubation and inoculum source. Bioresour. Technol. 2012, 110, 18–25. [Google Scholar] [CrossRef]
  17. Dechrugsa, S.; Kantachote, D.; Chaiprapat, S. Effects of inoculum to substrate ratio, substrate mix ratio and inoculum source on batch co-digestion of grass and pig manure. Bioresour. Technol. 2013, 146, 101–108. [Google Scholar] [CrossRef]
  18. Chamy, R.; Ramos, C. Factors in the determination of methanogenic potential of manure. Bioresour. Technol. 2011, 102, 7673–7677. [Google Scholar] [CrossRef]
  19. Koch, K.; Lippert, T.; Drewes, J.E. The role of inoculum’s origin on the methane yield of different substrates in biochemical methane potential (BMP) tests. Bioresour. Technol. 2017, 243, 457–463. [Google Scholar] [CrossRef]
  20. Strömberg, S.; Nistor, M.; Liu, J. Towards eliminating systematic errors caused by the experimental conditions in Biochemical Methane Potential (BMP) tests. Waste Manag. 2014, 34, 1939–1948. [Google Scholar] [CrossRef]
  21. Walker, M.; Zhang, Y.; Heaven, S.; Banks, C. Potential errors in the quantitative evaluation of biogas production in anaerobic digestion processes. Bioresour. Technol. 2009, 100, 6339–6346. [Google Scholar] [CrossRef] [Green Version]
  22. Helffrich, D.; Oechsner, H. The Hohenheim biogas yield test. Landtechnik 2003, 58, 148–149. [Google Scholar]
  23. Mittweg, G.; Oechsner, H.; Hahn, V.; Lemmer, A.; Reinhardt-Hanisch, A. Repeatability of a laboratory batch method to determine the specific biogas and methane yields. Eng. Life Sci. 2012, 12, 270–278. [Google Scholar] [CrossRef]
  24. Dandikas, V.; Heuwinkel, H.; Lichti, F.; Drewes, J.E.; Koch, K. Correlation between biogas yield and chemical composition of energy crops. Bioresour. Technol. 2014, 174, 316–320. [Google Scholar] [CrossRef]
  25. Gallegos, D.; Wedwitschka, H.; Moeller, L.; Zehnsdorf, A.; Stinner, W. Effect of particle size reduction and ensiling fermentation on biogas formation and silage quality of wheat straw. Bioresour. Technol. 2017, 245, 216–224. [Google Scholar] [CrossRef]
  26. Janke, L.; Leite, A.; Batista, K.; Weinrich, S.; Sträuber, H.; Nikolausz, M.; Nelles, M.; Stinner, W. Optimization of hydrolysis and volatile fatty acids production from sugarcane filter cake: Effects of urea supplementation and sodium hydroxide pretreatment. Bioresour. Technol. 2016, 199, 235–244. [Google Scholar] [CrossRef]
  27. Hagenkamp-Korth, F.; Ohl, S.; Hartung, E. Effects on the biogas and methane production of cattle manure treated with urease inhibitor. Biomass Bioenergy 2015, 75, 75–82. [Google Scholar] [CrossRef]
  28. Oechsner, H.; Lemmer, A.; Ramhold, D.; Mathies, E.; Mayrhuber, E.; Preissler, D. Method for Producing Biogas in Controlled Concentrations of Trace Elements. U.S. Patent 20,100,304,457A1, 2 December 2010. [Google Scholar]
  29. Takahashi, S.; Tomita, J.; Nishioka, K.; Hisada, T.; Nishijima, M. Development of a prokaryotic universal primer for simultaneous analysis of Bacteria and Archaea using next-generation sequencing. PLoS ONE 2014, 9, e105592. [Google Scholar] [CrossRef] [Green Version]
  30. Magoč, T.; Salzberg, S.L. FLASH: Fast length adjustment of short reads to improve genome assemblies. Bioinformatics 2011, 27, 2957–2963. [Google Scholar] [CrossRef]
  31. Martin, M. Cutadapt removes adapter sequences from high-throughput sequencing reads. EMBnet J. 2011, 17, 10–12. [Google Scholar] [CrossRef]
  32. Joshi, N.A.; Fass, J.N. A Sliding-Window, Adaptive, Quality-Based Trimming Tool for FastQ Files. Available online: https://github.com/najoshi/sickle (accessed on 15 May 2019).
  33. Caporaso, J.G.; Kuczynski, J.; Stombaugh, J.; Bittinger, K.; Bushman, F.D.; Costello, E.K.; Fierer, N.; Peña, A.G.; Goodrich, J.K.; Gordon, J.; et al. QIIME allows analysis of high-throughput community sequencing data. Nat. Methods 2010, 7, 335–336. [Google Scholar] [CrossRef] [Green Version]
  34. Hassa, J.; Maus, I.; Off, S.; Pühler, A.; Scherer, P.; Klocke, M.; Schlüter, A. Metagenome, metatranscriptome, and metaproteome approaches unraveled compositions and functional relationships of microbial communities residing in biogas plants. Appl. Microbiol. Biotechnol. 2018, 102, 5045–5063. [Google Scholar] [CrossRef] [Green Version]
  35. Desvaux, M.; Guedon, E.; Petitdemange, H. Cellulose Catabolism by Clostridium cellulolyticum Growing in Batch Culture on Defined Medium. Appl. Environ. Microbiol. 2000, 66, 2461–2470. [Google Scholar] [CrossRef] [Green Version]
  36. Klang, J.; Theuerl, S.; Szewzyk, U.; Huth, M.; Tölle, R.; Klocke, M. Dynamic variation of the microbial community structure during the long-time mono-fermentation of maize and sugar beet silage. Microb. Biotechnol. 2015, 8, 764–775. [Google Scholar] [CrossRef] [Green Version]
  37. Theuerl, S.; Klang, J.; Heiermann, M.; de Vrieze, J. Marker microbiome clusters are determined by operational parameters and specific key taxa combinations in anaerobic digestion. Bioresour. Technol. 2018, 263, 128–135. [Google Scholar] [CrossRef]
  38. Carballa, M.; Regueiro, L.; Lema, J.M. Microbial management of anaerobic digestion: Exploiting the microbiome-functionality nexus. Curr. Opin. Biotechnol. 2015, 33, 103–111. [Google Scholar] [CrossRef]
  39. Cibis, K.G.; Gneipel, A.; König, H. Isolation of acetic, propionic and butyric acid-forming bacteria from biogas plants. J. Biotechnol. 2016, 220, 51–63. [Google Scholar] [CrossRef]
  40. Alsouleman, K.; Linke, B.; Klang, J.; Klocke, M.; Krakat, N.; Theuerl, S. Reorganisation of a mesophilic biogas microbiome as response to a stepwise increase of ammonium nitrogen induced by poultry manure supply. Bioresour. Technol. 2016, 208, 200–204. [Google Scholar] [CrossRef]
  41. Treu, L.; Kougias, P.G.; Campanaro, S.; Bassani, I.; Angelidaki, I. Deeper insight into the structure of the anaerobic digestion microbial community; the biogas microbiome database is expanded with 157 new genomes. Bioresour. Technol. 2016, 216, 260–266. [Google Scholar] [CrossRef] [Green Version]
  42. Wang, W.; Xie, L.; Luo, G.; Zhou, Q.; Angelidaki, I. Performance and microbial community analysis of the anaerobic reactor with coke oven gas biomethanation and in situ biogas upgrading. Bioresour. Technol. 2013, 146, 234–239. [Google Scholar] [CrossRef] [Green Version]
  43. Campanaro, S.; Treu, L.; Kougias, P.G.; Luo, G.; Angelidaki, I. Metagenomic binning reveals the functional roles of core abundant microorganisms in twelve full-scale biogas plants. Water Res. 2018, 140, 123–134. [Google Scholar] [CrossRef]
  44. Hanreich, A.; Schimpf, U.; Zakrzewski, M.; Schlüter, A.; Benndorf, D.; Heyer, R.; Rapp, E.; Pühler, A.; Reichl, U.; Klocke, M. Metagenome and metaproteome analyses of microbial communities in mesophilic biogas-producing anaerobic batch fermentations indicate concerted plant carbohydrate degradation. Syst. Appl. Microbiol. 2013, 36, 330–338. [Google Scholar] [CrossRef]
  45. Maus, I.; Cibis, K.G.; Wibberg, D.; Winkler, A.; Stolze, Y.; König, H.; Pühler, A.; Schlüter, A. Complete genome sequence of the strain Defluviitoga tunisiensis L3, isolated from a thermophilic, production-scale biogas plant. J. Biotechnol. 2015, 203, 17–18. [Google Scholar] [CrossRef]
  46. Kougias, P.G.; Campanaro, S.; Treu, L.; Zhu, X.; Angelidaki, I. A novel archaeal species belonging to Methanoculleus genus identified via de-novo assembly and metagenomic binning process in biogas reactors. Anaerobe 2017, 46, 23–32. [Google Scholar] [CrossRef]
  47. Luo, G.; Angelidaki, I. Analysis of bacterial communities and bacterial pathogens in a biogas plant by the combination of ethidium monoazide, PCR and Ion Torrent sequencing. Water Res. 2014, 60, 156–163. [Google Scholar] [CrossRef]
  48. Mukengele, M.; Oechsner, H. Effect of ensiling on the specific methane yield of maize. Landtechnik 2007, 62, 20–21. [Google Scholar]
  49. Czepuck, K.; Oechsner, H.; Schumacher, B.; Lemmer, A. Hohenheim biogas yield test—Comparing theoretical yields with actual batch yields. Landtechnik 2006, 61, 82–83. [Google Scholar]
Figure 1. Scheme of Hohenheim biogas yield test (D-HBT), Bergedorf fermentation test (D-BFT), Eudiometer (D-EUD), and Automatic methane potential test (D-AMP). Reproduced with permission from VDI 4630 [5].
Applsci 10 02589 g001
Figure 2. Microbial community of inoculum from laboratory reactor (I-LRS), laboratory reactor, diluted (I-LRD), biogas plant (I-BGP), and wastewater treatment plant 7 d and 14 d degassed (I- WWP7, I-WWP14).
Applsci 10 02589 g002
Figure 3. Specific methane yield (A) and methane percentage (C) of various substrates digested with different inocula in the digestion system D-HBT1 (error bars indicate standard deviation, different letters indicate significant differences within substrates at p ≤ 0.05); rel. specific methane yield (B) and rel. methane percentage (D) of the different inocula compared to inoculum I-LRS (boxplots show divergence of the average values of the inoculum/substrate-combination); for code of digestion systems, inocula, and substrates see Table 2, Table 3 and Table 6, respectively.
Applsci 10 02589 g003
Figure 4. Specific methane yield (A) and methane percentage (C) of various substrates digested with inoculum I-LRD in the digestion systems D-HBT1 and D-BFT (error bars indicate standard deviation, different letters indicate significant differences within substrates at p ≤ 0.05); rel. specific methane yield (B) and rel. methane percentage (D) of the different inocula compared to digestion system D- HBT1 (boxplots show divergence of the average values of the digestion system/substrate- combination); for code of digestion systems, inocula and substrates see Table 2, Table 3 and Table 6, respectively.
Applsci 10 02589 g004
Figure 5. Specific methane yield (A) and methane percentage (C) of various substrates digested with inoculum I-BGP in the digestion systems D-HBT1, D-AMP, and D-EUD (A) respectively D-HBT1 and D-EUD (B) (error bars indicate standard deviation, different letters indicate significant differences within substrates at p ≤ 0.05); rel. specific methane yield (B) and rel. methane percentage (D) of the different inocula compared to digestion system D-HBT1 (boxplots show divergence of the average values of the digestion system/substrate-combination); for code of digestion systems, inocula, and substrates see Table 2, Table 3 and Table 6, respectively.
Applsci 10 02589 g005
Figure 6. Specific methane yield (A) and methane percentage (C) of various substrates digested with inocula I-LRS and I-WWP14 in the digestion system D-HBT1 and D-HBT2 (error bars indicate standard deviation, different letters indicate significant differences within substrates and same used inocula at p ≤ 0.05, lower case letters for I-LRS and capital letters for I-WWP14); rel. specific methane yield (B) and rel. methane percentage (D) of the different inocula compared to inoculum I-LRS (boxplots show divergence of the average values of the digestion system/substrate/inoculum- combination); for code of digestion system, inocula and substrates see Table 2, Table 3 and Table 6, respectively.
Applsci 10 02589 g006
Table 1. Overview on studies on the effect of different inoculum/substrate combinations on the methane yield compared by the coefficient of variation (CV) of measurement results.
InoculumSubstrateCV %Reference
Brewery wastewater, animal manure, biological waste, upflow anaerobic sludge blanketMolasses, bio-refinery waste, manure, A-sludge3–33 *Vrieze et al. [12]
Wastewater treatment plant, sludge chicken manureChicken manure, Corn stover10–19Li et al. [14]
Wastewater treatment plant, slaughterhouse lagoon, municipal solid waste, upflow anaerobic sludge blanketAnimal by products17Pozdniakova et al. [15]
Wastewater treatment plant, biogas plant Food waste, wastewater12–74Elbeshbishy et al. [16]
Biogas plantsPig manure, para grass2–128Dechrugsa et al. [17]
Digestate one adapted to turkey manure, one without adaptionTurkey manure1–8Chamy and Ramos [18]
Wastewater treatment plant, biogas plant, biowaste plantCellulose, food waste, maize, sewage sludge1–5 *Koch et al. [19]
* According to Weinrich [7].
Table 2. Digestion systems used for biochemical methane potential test: digestion volume, frequency of agitation and method for determining the gas quality.
CodeSystemVolume LAgitationGas Quality
D-HBTHohenheim biogas yield test0.1ContinuousInfrared
D-BFTBergedorf fermentation test1.5FrequentlyInfrared
D-EUDEudiometer1.5ContinuousInfrared
D-AMPAutomatic methane potential test0.5ContinuousNone
Table 3. Characterization of inocula from different sources in terms of feedstock, fermentation temperature (T), hydraulic retention time (HRT), organic loading rate (OLR), and processing.
CodeSourceFeedstockT °CHRT dOLR kgoDM m−3 d−1Processing
I-LRS400 L reactorMaize silage, shredded wheat, soybean meal, rapeseed oil, digestate372000.3Sieving <5 mm
I-LRD2500 L reactorCattle manure, maize silage38193.0Diluting i/w 2:1
I-BGPBiogas plantCattle manure, maize silage371032.7Sieving <5 mm
I-WWP7Wastewater treatment plantWastewater37nanaSieving <1 mm Degassing (7 d)
I-WWP14Wastewater treatment plantWastewater37nanaSieving <1 mm Degassing (14 d)
Table 4. Dry matter (DM), organic dry matter (oDM), ash, pH, nitrogen, ammonium (NH4+–N), volatile fatty acid (VFA) and alkalinity with standard deviation for inoculum from a 400 L laboratory reactor (I-LRS), a 2.5 m3 laboratory reactor (I-LRD), a biogas plant (I-BGP) and a wastewater treatment plant 7 d degassing and 14 d degassing (I-WWP7, I-WWP14).
CodeDM %oDM %Ash %FMpHNitrogen mg kg−1NH4+–N mg kg−1VFA mg kg−1Alkalinity mg kg−1
I-LRS4.4 ± 0.061.7 ± 0.11.7 ± 0.08.284280 ± 303747 ± 2230 ± 215.8
I-BGP6.8 ± 0.068.0 ± 0.22.2 ± 0.07.784620 ± 02811 ± 6023 ± 213.5
I-LRD2.9 ± 0.171.9 ± 0.30.8 ± 0.08.232115 ± 51472 ± 1031 ± 27.1
I-WWP72.6 ± 0.057.5 ± 0.61.1 ± 0.08.273040 ± 401659 ± 19103 ± 235.0
I-WWP142.3 ± 0.358.7 ± 0.91.0 ± 0.18.273155 ± 651961 ± 18321 ± 25.0
Table 5. Trace element (TE) concentration (dry matter base) of inoculum from a 400 L laboratory reactor (I-LRS), a 2.5 m3 diluted from laboratory reactor (I-LRD), a biogas plant (I-BGP) and a wastewater treatment plant (I-WWP) together with the recommend range according to [28].
CodeTrace Element Concentration, mg kg−1DM
FeNiCoMoWMnCuSeZn
I-LRS324415372316911378
I-BGP2710223623864182362
I-LRD113151101177981284
I-WWP92,0961856202207970643
Reco-mended [28]750–50004–300.4–100.05–160.1–30100–150010–800.05–430–400
Table 6. Characterization of the substrates in percentage of dry matter content (DM), ash, fat, protein, and fiber in percentage of fresh matter.
CodeName of SubstrateDM %Ash %Fat %Protein %Fiber %
S-HAYHay94.25.41.09.231.8
S-DMSDried maize silage92.84.32.37.418.7
S-TGFTriglyceride fodder93.010.424.419.88.5
S-CONConcentrated fodder92.87.12.618.47.4
S-MCCMicrocrystalline cellulose96.8<0.3<0.6<0.559.4
Table 7. Investigated digestion system/Inoculum/Substrate-combination.
Digestion Systems
D-HBT1D-HBT2D-BFTD-EUDD-AMP
SubstrateS-HAYXXXXX
S-CON XXXXX
S-TGF XXXXX
S-MCC XXXXX
S-DMSXXXXX
S-DMS + TEX
InoculumI-LRSXX
I-BGPX XX
I-LRDX X
I-WWP7X
I-WWP14XX
Table 8. Specific methane yield and methane percentage tested with and without adding trace elements (TE) to blanks and dry maize silage (S-DMS) using inoculum from laboratory reactor (I-LRS), diluted from laboratory reactor (I-LRD), biogas plant (I-BGP), wastewater treatment plant 7 d and 14 d degassed (I-WWP7, I-WWP14). ANOVA post-hoc Tukey test was done for each pair with and without TE. The letters “a” indicate significant differences.
I-LRSI-BGPI-LRDI-WWP7I-WWP14
Specific methane yield, L kg−1
Blank22 ± 1a48 ± 1a77 ± 3a66 ± 1a60 ± 3a
Blank + TE20 ± 1a49 ± 1a81 ± 4a65 ± 2a58 ± 4a
S-DMS 361 ± 4a342 ± 8a346 ± 4a354 ± 7a354 ± 10a
S-DMS + TE357 ± 10a343 ± 10a341 ± 9a371 ± 11a349 ± 11a
Methane percentage, %
Blank 64 ± 2a56 ± 1a58 ± 0a73 ± 1a78 ± 1a
Blank + TE 68 ± 2a56 ± 1a59 ± 1a72 ± 0a79 ± 1a
S-DMS 52 ± 1a50 ± 1a52 ± 1a54 ± 1a54 ± 0a
S-DMS + TE52 ± 1a51 ± 1a51 ± 1a53 ± 0a53 ± 0a

