Exploring the Patterns of Job Satisfaction for Individuals Aged 50 and over from Three Historical Regions of Romania. An Inductive Approach with Respect to Triangulation, Cross-Validation and Support for Replication of Results


Abstract
1. Introduction
2. Literature Review
3. Data and Methods
- SHARE-ERIC Wave 7 dataset (only 8 categories of variables in 8 different files merged and used; only responses of respondents aged 50 or more, from Romania and with the declared country region for their residence);
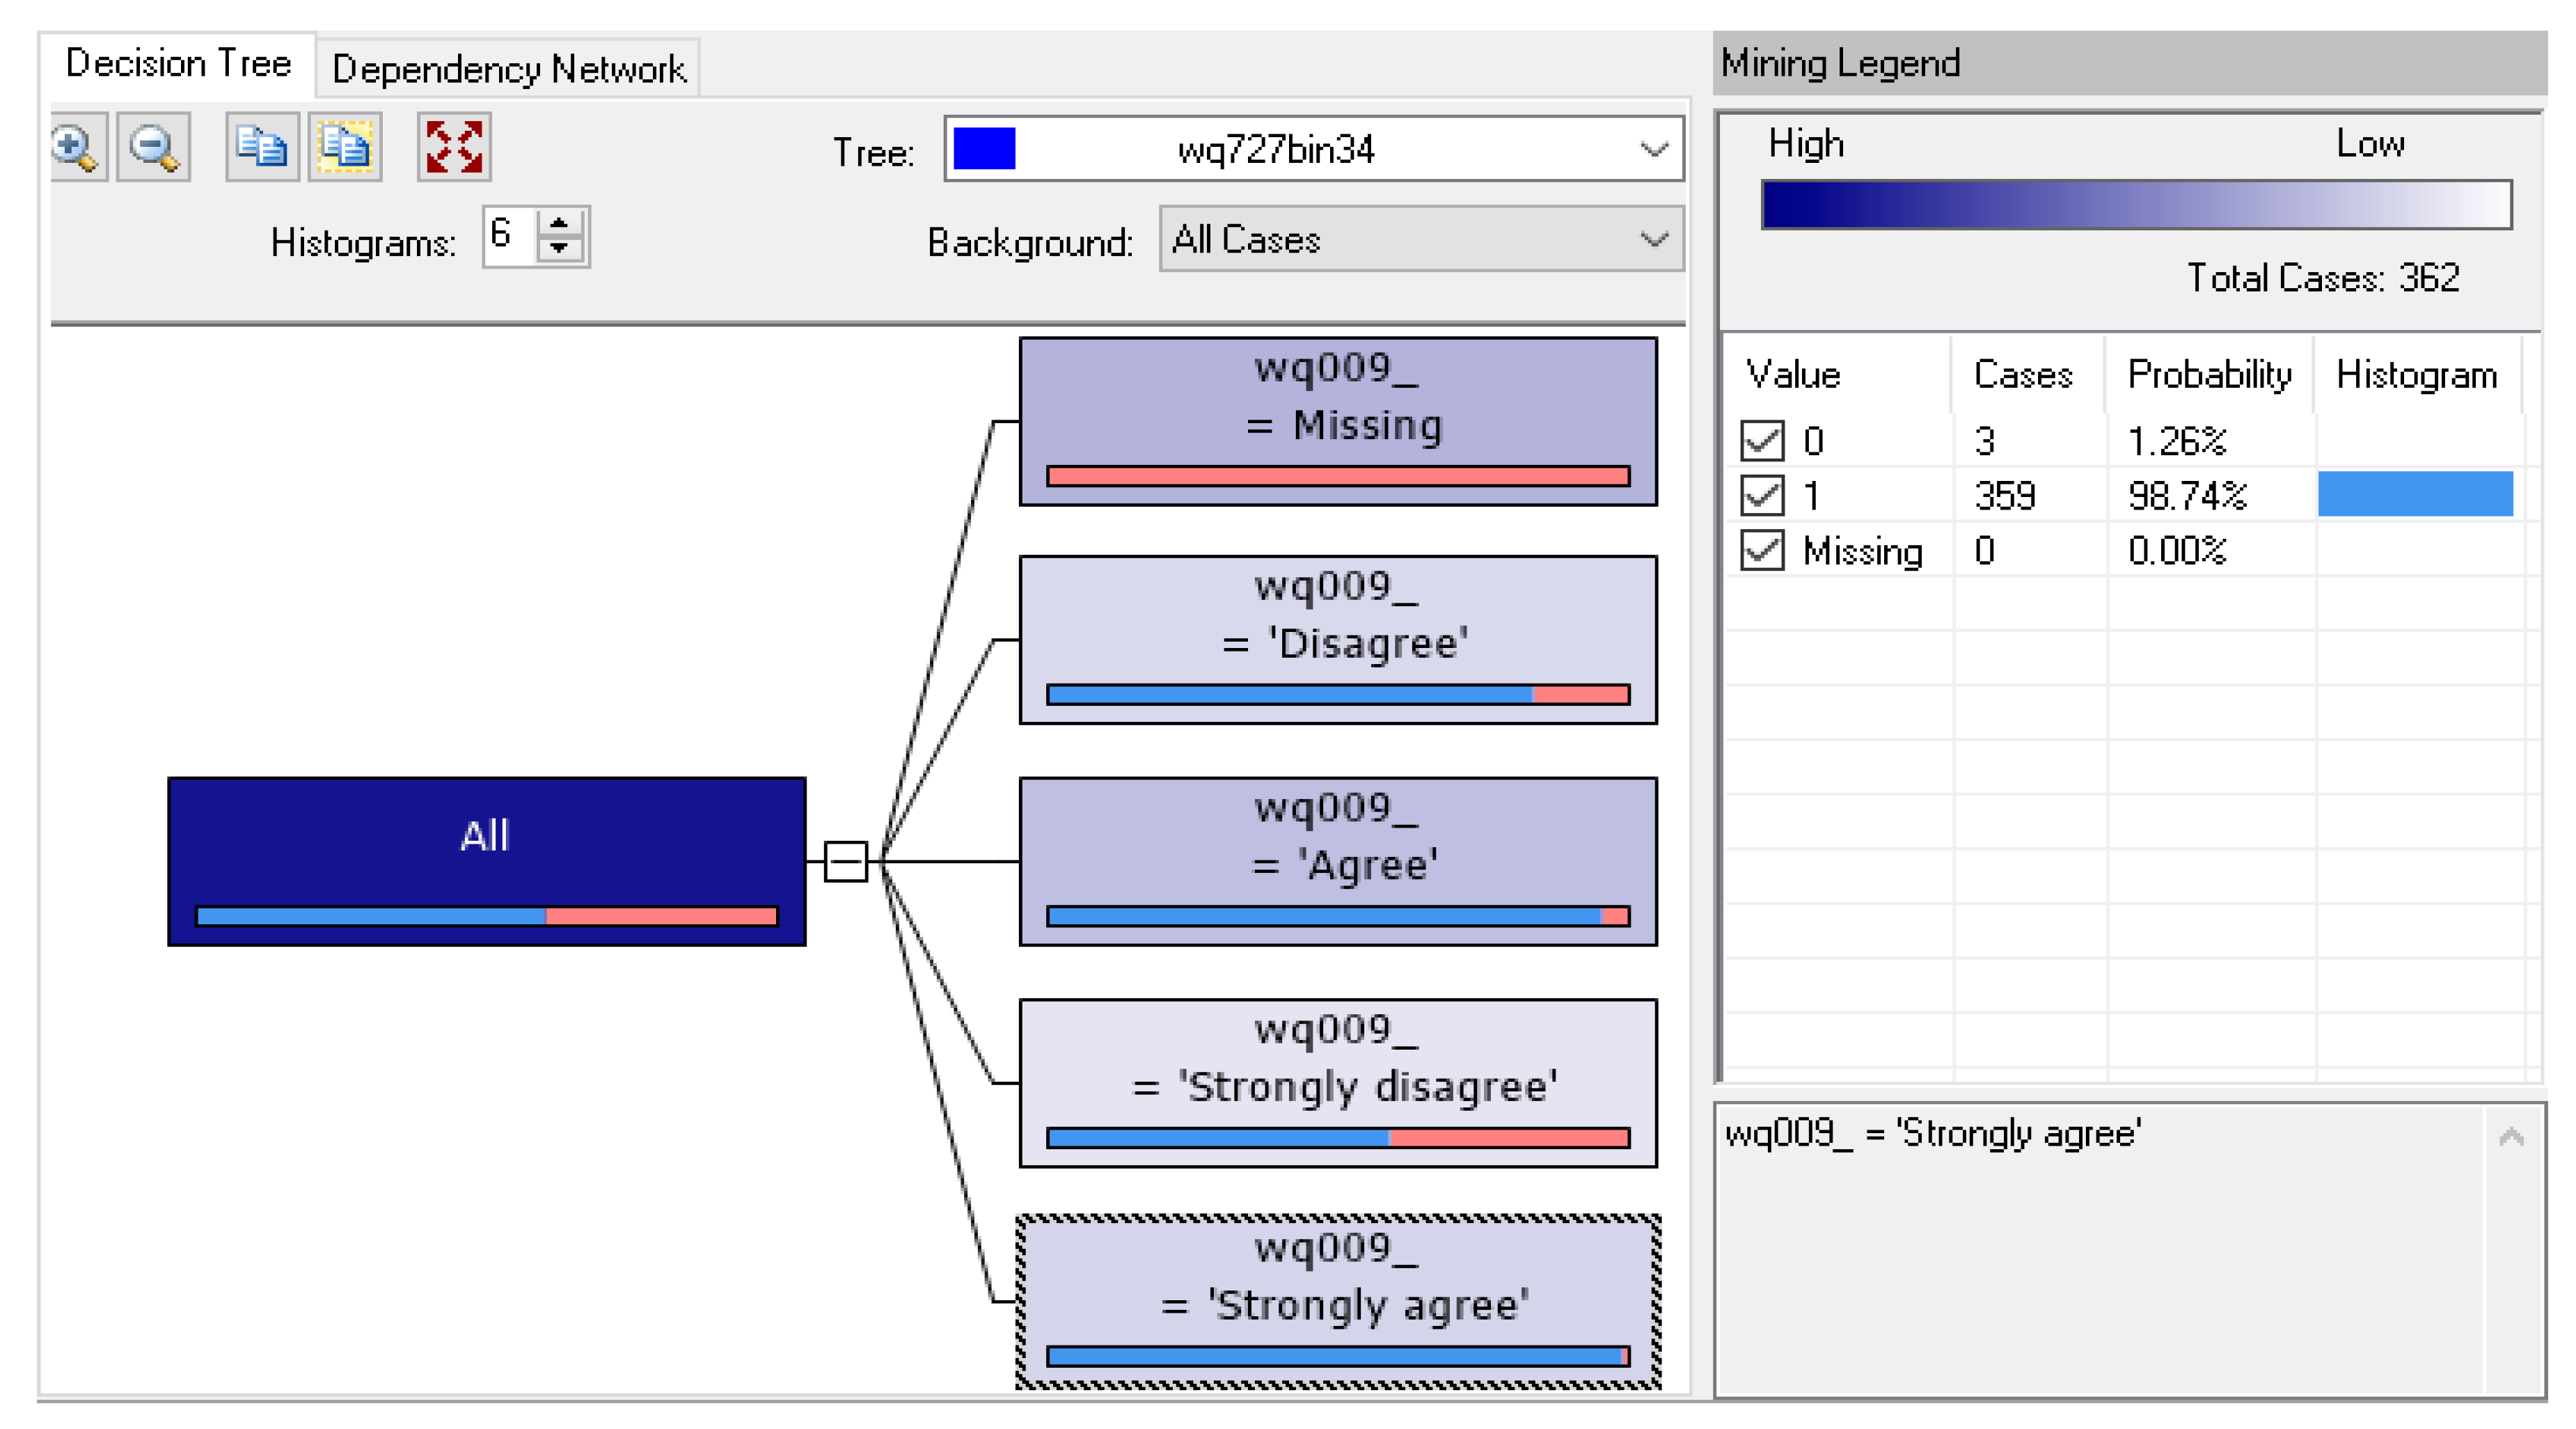
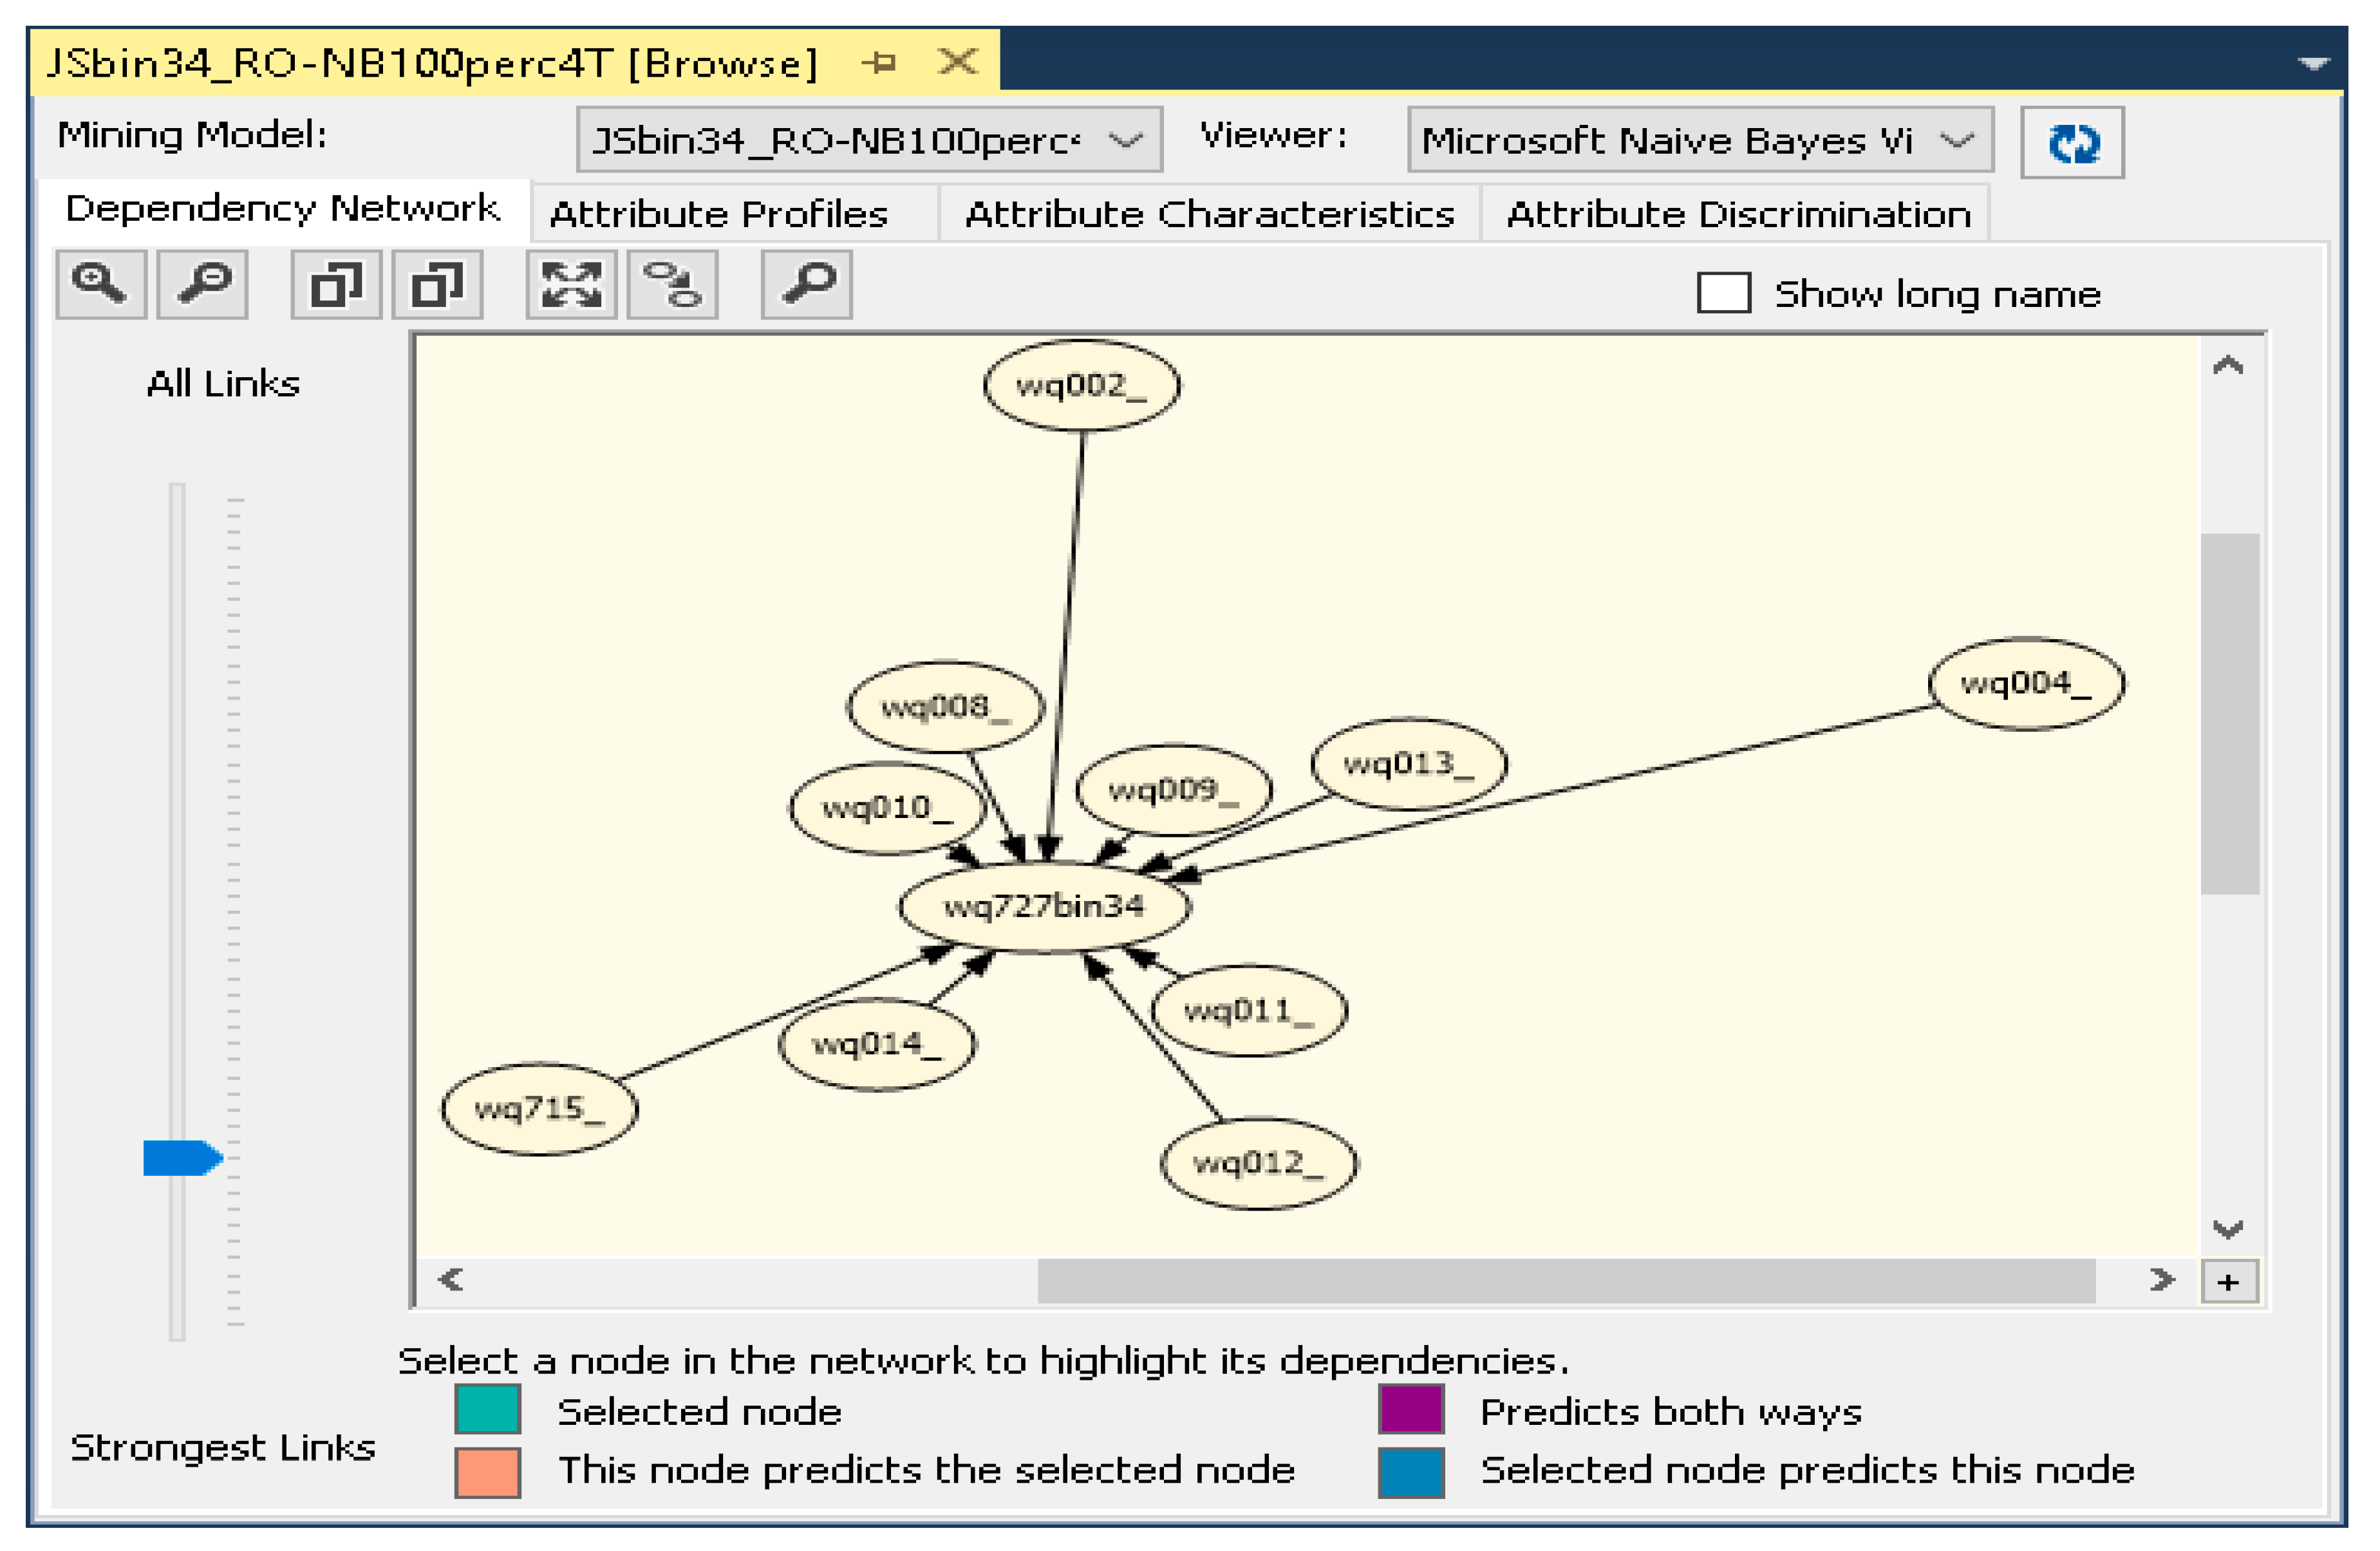
- Both decision trees and naive Bayes (NB) approaches have been used in Microsoft SQL Server Analysis Services (only the primary outcome was pre-processed: wq727_ became wq727bin34—Table A1, Appendix A); NB’s dependency network in this first round mining acted as support for variables pre-selection;
- Variables selected at previous steps and some others of interest (mostly individual traits) have been processed (Table A1, Appendix A) based on a balanced approach of treating missing responses;
- Different regional splits and some meant for robustness checks have been done;
- Second round mining was applied (LASSOPACK package in Stata) on the processed variables (previous steps);
- Logistic and Poisson regressions with robust standard errors have been used and further robustness confirmations of the dual-core and additional selections for regional models have been performed based on p, VIF, R-squared, ROC and GOF test values;
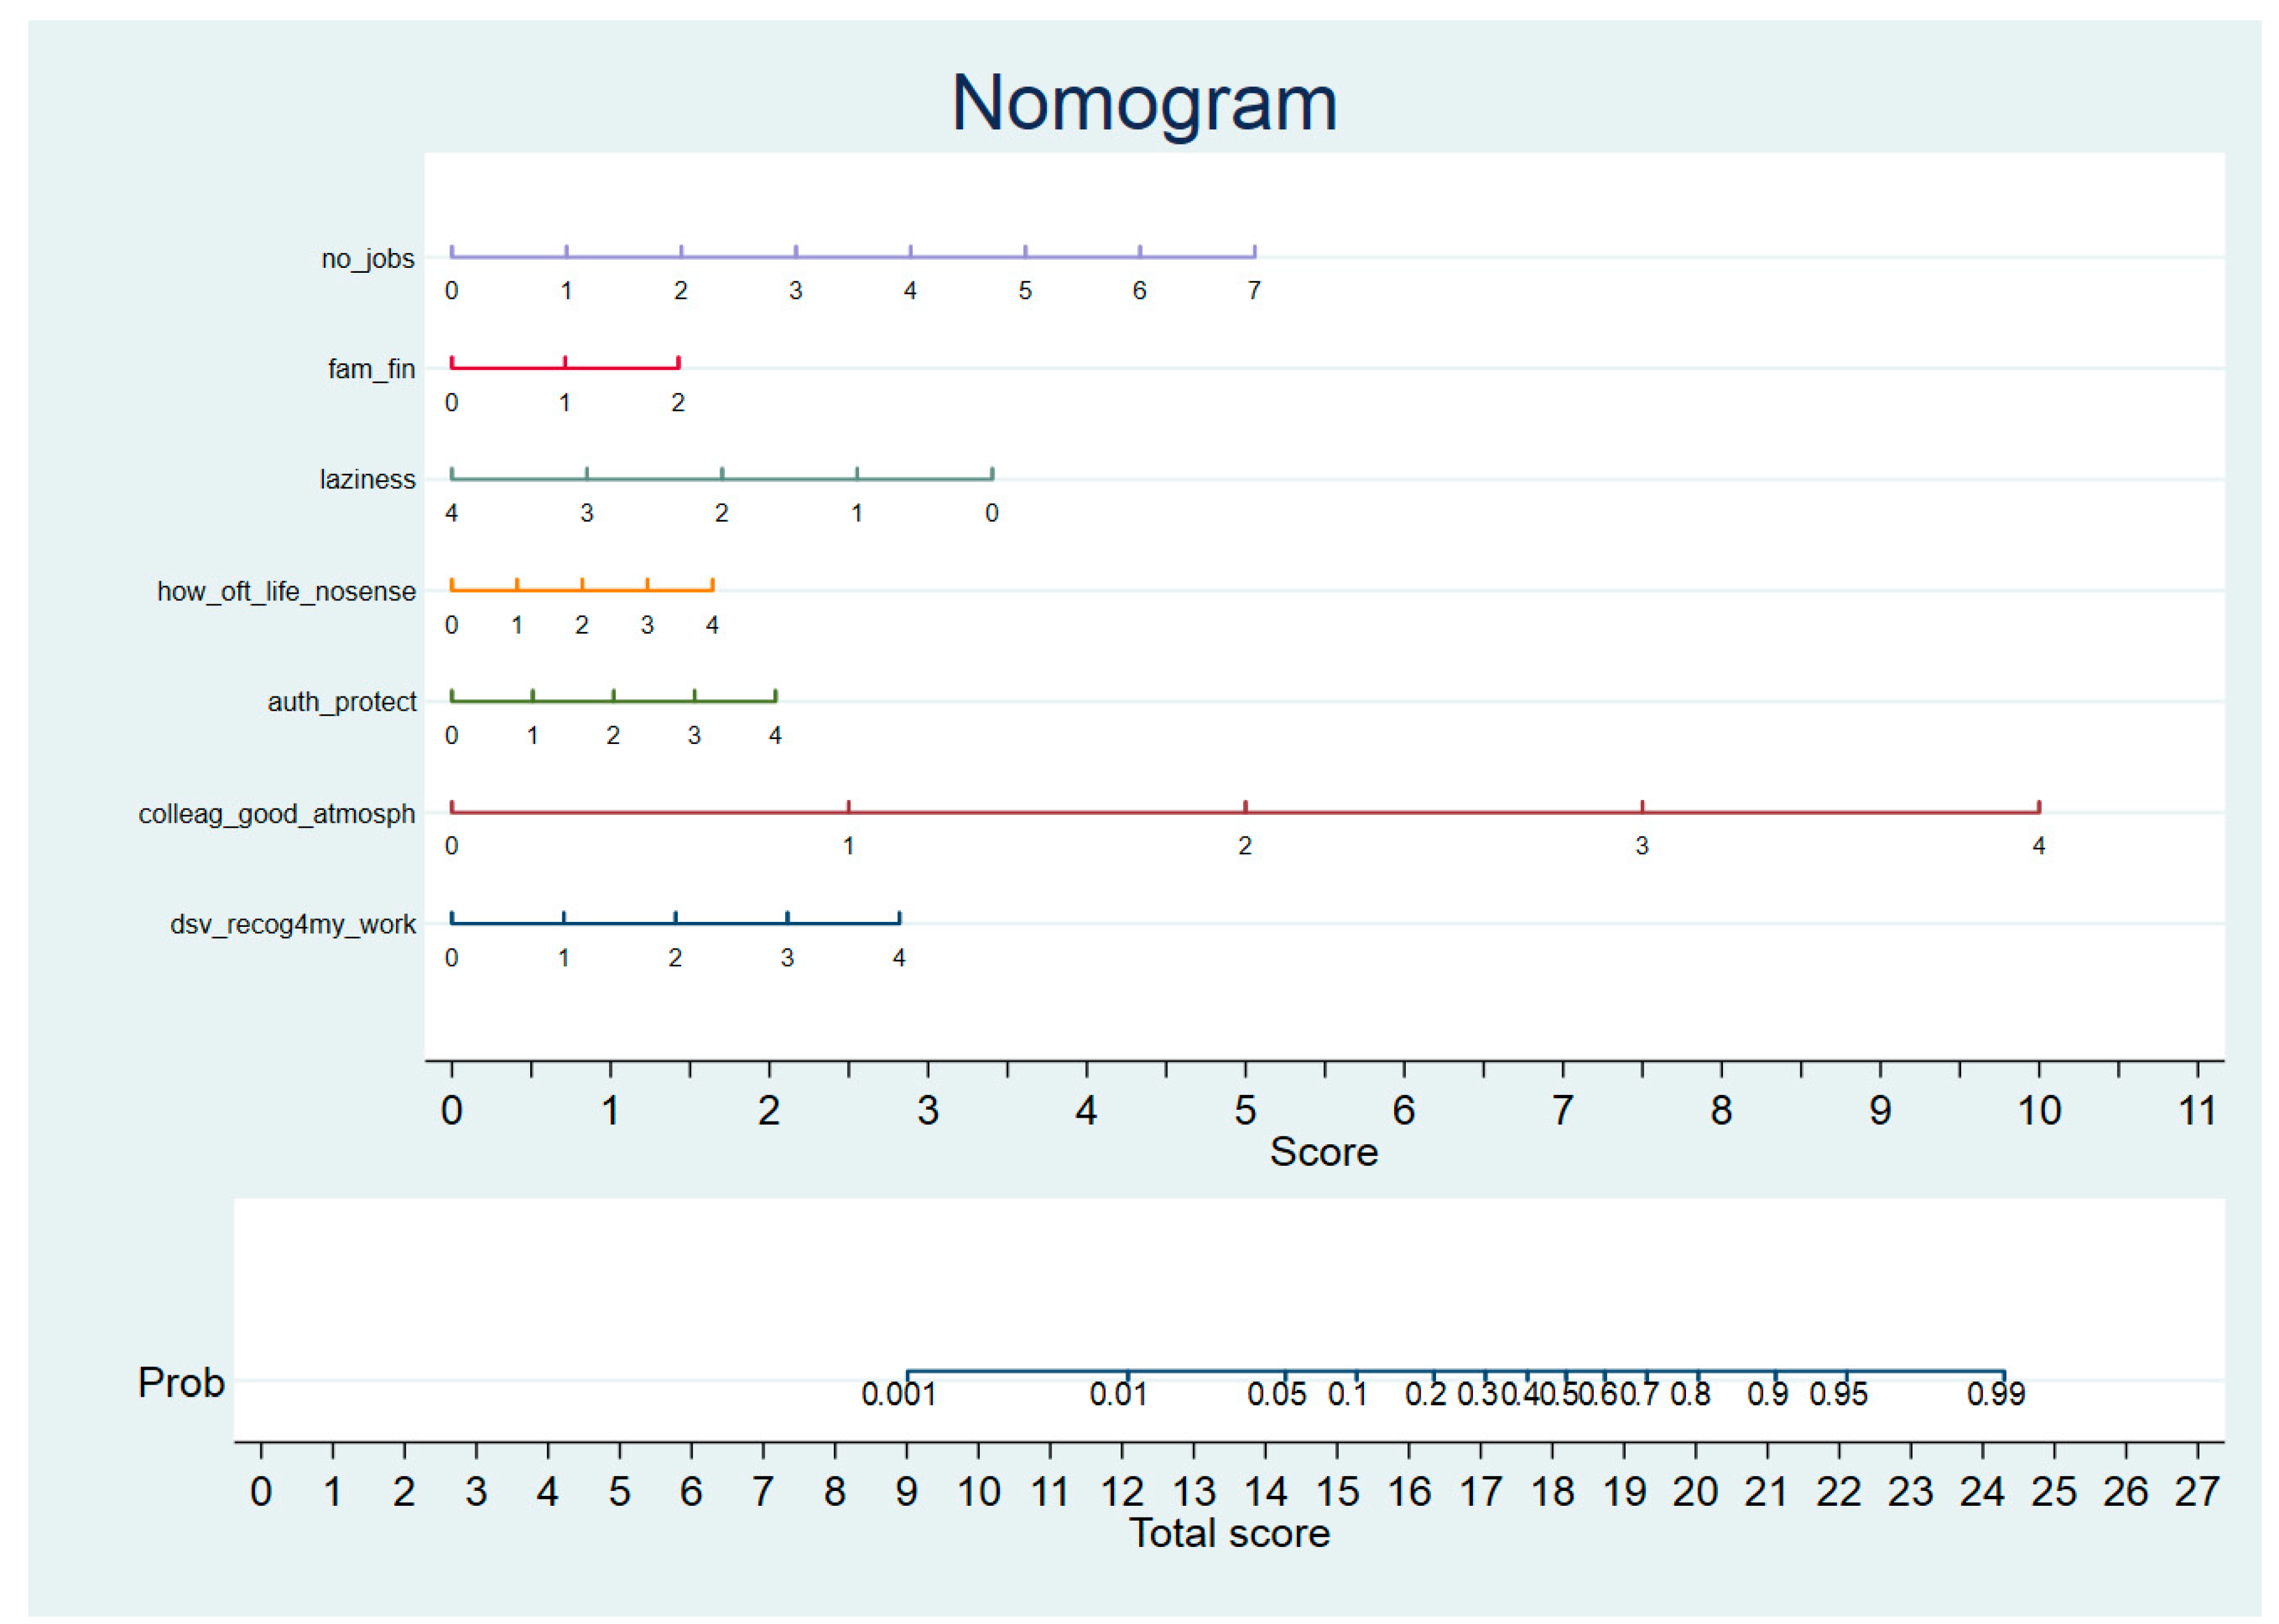
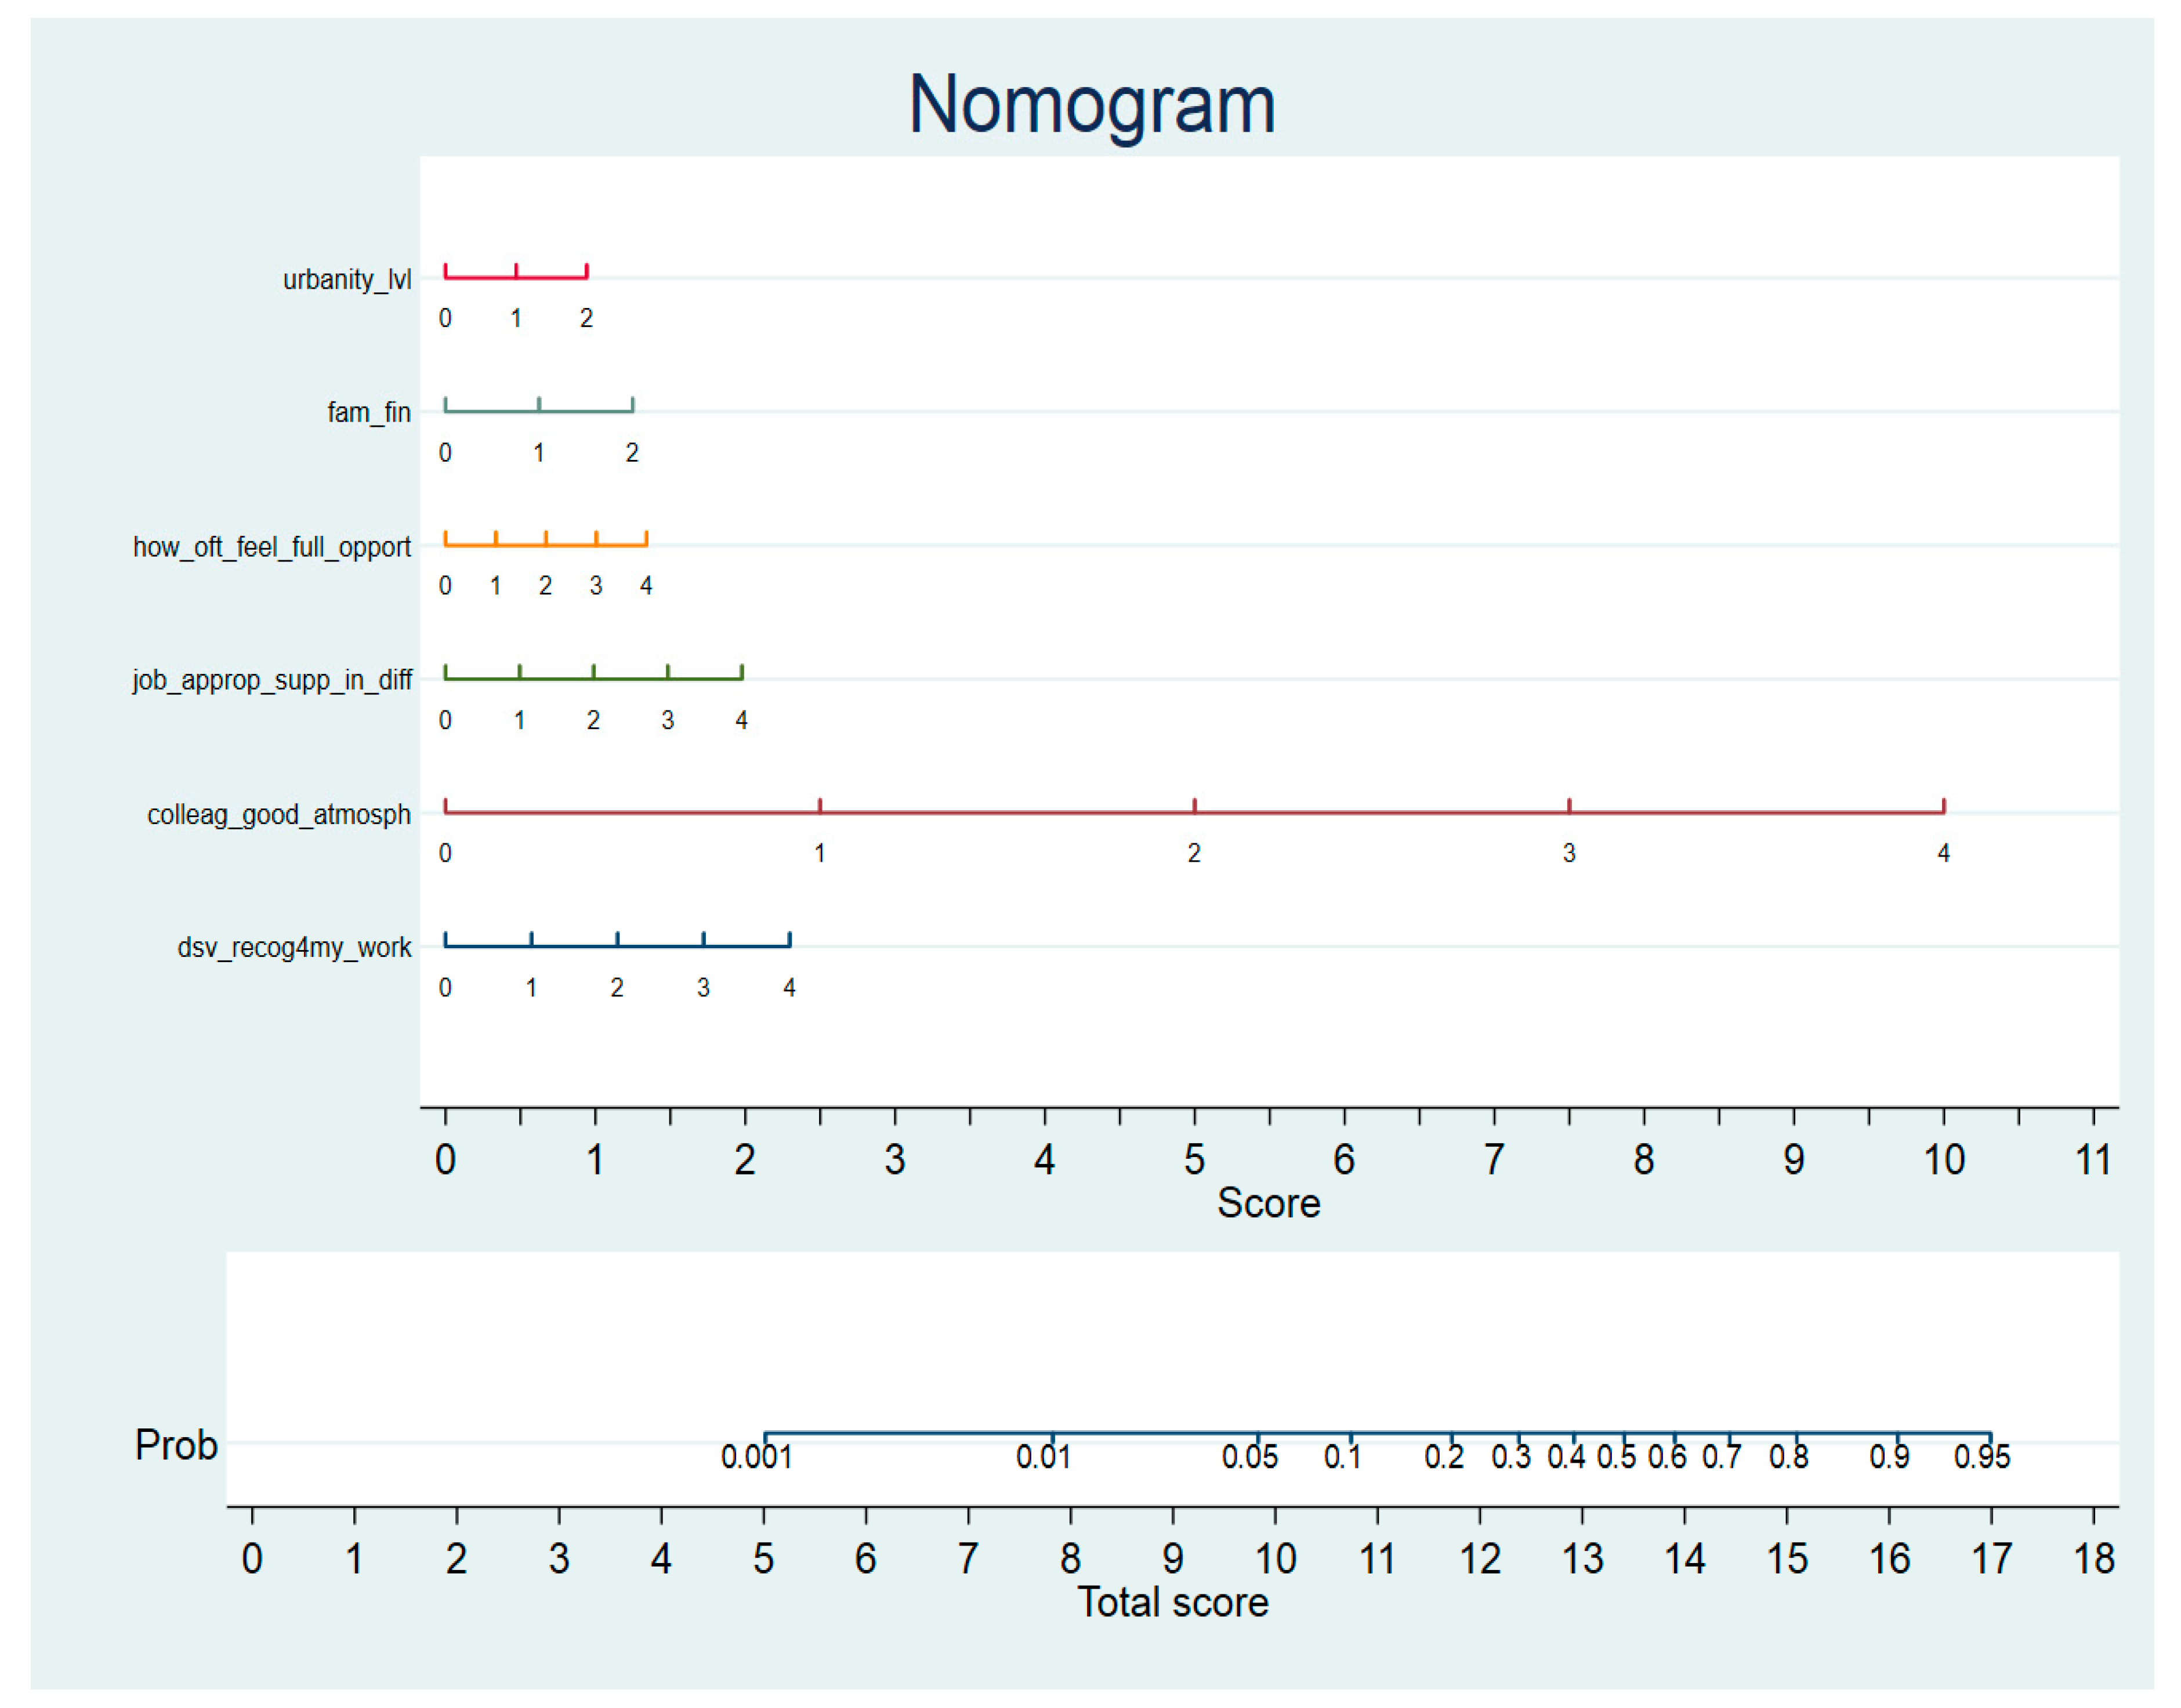
- Average marginal effects have been computed and Zlotnik probability prediction nomograms were generated for the regional models;
- Third round mining using WEKA was performed only for an additional validation;
- Additional regressions to confirm the already identified dual-core at a higher level (almost all European countries) have been performed by following an inductive approach.
- -
- CV LASSO (a time-consuming approach based on cross-validation; we have used it with 10 folds, elastic net with alpha = 1 and two options for post-estimation: lopt—lambda that minimizes the mean squared prediction error/MSPE and lse—largest lambda for which MSPE is within one standard error of the minimal MSPE);
- -
- LASSO 2 (a faster approach centred on information criteria; we have used it with alpha = 1, followed by a post-estimation to select the best value of lambda when considering the Extended Bayesian Information Criteria—EBIC);
- -
- R LASSO (an even faster but more rigorous/penalizing approach focused on controlling over-fitting; we have used it on default settings).
- p is the probability of being satisfied with the job;
- (1 − p) is the probability of not being satisfied with it;
- p/(1 − p) represents the odds of being satisfied with the job;
- i = 2,.., n and n is the total number of independent variables;
- ß0 is the bias (intercept) term;
- ßi measures the effect of a change in variable Xi on the probability of being satisfied with the job;
- Xi is one explanatory variable from the array (∑) of features selected after using LASSO;
- Ɛ represents the error term.
4. Results and Discussion
5. Conclusions
Author Contributions
Funding
Acknowledgments
Conflicts of Interest
Appendix A

| VARIABLE 1ST NAME | VARIABLE NAME AFTER PROCESSING | QUESTIONNAIRE ITEM | CODING |
|---|---|---|---|
| PRIMARY OUTCOME (JOB SATISFACTION) | |||
| wq727_ | how_satisf_job | Overall, were you satisfied with your job? (completely agree:4; agree:3; blanks, undecided and unwilling:2; disagree:1 and completely disagree:0) | 0–4 scale |
| wq727_ | satisf_with_my_job (wq727bin34) | Overall, were you satisfied with your job? (3,4:1; 0–2:0) | 1-yes,0-no |
| wq727_ | compl_satisf_with_my_job (wq727bin4) | Overall, were you satisfied with your job? (4:1; 0–3:0) | 1-yes,0-no |
| OUTCOME ASSUMED AS RELATED (LIFE SATISFACTION) | |||
| ac012_ | how_satisf_life | How satisfied are you with your life? (on a scale from 0 to 10, completely dissatisfied:0, completely satisfied:10; blanks, undecided and unwilling:5) | 11-point scale |
| ac012_ | satisf_with_my_life (ac012bin89X) | How satisfied are you with your life? (0–7:0; 8–10:1) | 1-yes,0-no |
| ac012_ | compl_satisf_with_my_life (ac012bin9X) | How satisfied are you with your life? (0–8:0; 9–10:1) | 1-yes,0-no |
| FILTER VARIABLES FOR ROBUSTNESS CHECKS | |||
| dn003_ | birth_y | What is your year of birth? | year |
| dn014_ | married | Is your marital status "married"? | 1-yes,0-no |
| dn042_ | female_gender | What is your gender? | 1-female,0-male |
| isced2011_r | grad_high_sch | Have you graduated the high school based on your highest educational degree converted into a number of graduated classes? (ISCDE2011>=3 and NOT for blanks/Still in school:1) | 1-yes,0-no |
| ra015c_1 .. 17 | last_country_region (ra015c_derivation for last residence with imbricated IFs) | What is the last country region in which you have resided? | regions |
| TOP 10 FROM THE JOB CATEGORY IDENTIFIED USING THE NAIVE BAYES TECHNIQUE IN MICROSOFT SSAS | |||
| wq002_ | phys_demand_job | Was your job physically demanding? (same scale as for how_satisf_job) | 0–4 scale |
| wq004_ | alw_ag_stopw_wvol | Have you always been against the stopwatch because of a high volume of work? (same scale as for how_satisf_job) | 0–4 scale |
| wq008_ | opp2dev_new_skills | Have you had the opportunity to develop new skills? (same scale as for how_satisf_job) | 0–4 scale |
| wq009_ | dsv_recog4my_work | Did you receive the recognition you consider you deserved for your work? (same scale as for how_satisf_job) | 0–4 scale |
| wq010_ | sal_in_line_eff_achiev | Related to your efforts and achievements, was your salary in line with them? (same scale as for how_satisf_job) | 0–4 scale |
| wq011_ | job_approp_supp_in_diff | Have you received appropriate support in difficult situations at your job? (same scale as for how_satisf_job) | 0–4 scale |
| wq012_ | colleag_good_atmosph | Was there a good atmosphere between you and your colleagues? (same scale as for how_satisf_job) | 0–4 scale |
| wq013_ | emp_prop_treatm | In general, have the employees been treated fairly at your job? (same scale as for how_satisf_job) | 0–4 scale |
| wq014_ | auth_protect | Have the authorities taken appropriate measures to protect you from health hazards at work? (same scale as for how_satisf_job) | 0–4 scale |
| wq715_ | resp_not_proxy_assist | Is it true that the respondent was not assisted by a so-called proxy respondent to complete the interview, e.g., cognitive limits? (same scale as for how_satisf_job) | 1-yes,0-no |
| TOP 10 FROM OTHER CATEGORIES EXCEPT JOB IDENTIFIED USING THE SAME TECHNIQUE IN SSAS | |||
| re005_ | evr_done_paid_work | Have you ever done paid work? (yes:2; blanks:1; no:0) | 0–2 scale |
| re015_1 | pub_sect_emp | Have you worked in the public sector? | 1-yes,0-no |
| re016_1 | full_time_job | Did you work full time at this job? | 1-yes,0-no |
| re031_1 | ret_cause_left_1st_job | Was retirement the reason for leaving the 1st job? | 1-yes,0-no |
| re035_1 | ret_work_aft_1st_job | Was your situation “retired from work” after 1st job? | 1-yes,0-no |
| re035a_1 | recv_retir_benef_1st_job | Did you received retire benefits after 1st job? (yes:2; blanks:1; no:0) | 0–2 scale |
| re038_1 | paid_job_aft_retir | Did you have a paid job after retirement? (yes:2; blanks, undecided:1; no:0) | 0–2 scale |
| re039_1 | sit_chg_aft_last_job | Has the situation changed after last job? (yes:2; blanks:1; no:0) | 0–2 scale |
| TOP 10 FROM THE LIFE CATEGORY IDENTIFIED USING THE NAÏVE BAYES TECHNIQUE IN MICROSOFT SSAS | |||
| ac014_ | how_oft_age_prev_do | How often do you think age prevents you from doing the things you would like to do? (Often:4; Sometimes:3; blanks, undecided and unwilling:2; Rarely:1; Never:0) | 0–4 scale |
| ac015_ | how_oft_no_ctrl | How often do you feel that you have no control over what is happening to you? (same scale as for how_oft_age_prev_do) | 0–4 scale |
| ac016_ | how_oft_feel_nglctd | How often do you feel neglected? (same scale as for how_oft_age_prev_do) | 0–4 scale |
| ac017_ | how_oft_feel_do_things | How often do you think you can do the things you want to do? (same scale as for how_oft_age_prev_do) | 0–4 scale |
| ac20_ | how_oft_next_d_enth | How often do you think about the next day with enthusiasm? (same scale as for how_oft_age_prev_do) | 0–4 scale |
| ac021_ | how_oft_life_nosense | How often do you think your life makes no sense? (same scale as for how_oft_age_prev_do) | 0–4 scale |
| ac022_ | how_oft_bck_life_happy | How often, as a whole, do you look back on your life with a sense of happiness? (same scale as for how_oft_age_prev_do) | 0–4 scale |
| ac023_ | how_oft_feel_full_energ | How often do you feel full of energy these days? (same scale as for how_oft_age_prev_do) | 0–4 scale |
| ac024_ | how_oft_feel_full_opport | How often do you feel that life is full of opportunities? (same scale as for how_oft_age_prev_do) | 0–4 scale |
| ac025_ | how_oft_feel_future_good | How often do you feel the future looks good for you? (same scale as for how_oft_age_prev_do) | 0–4 scale |
| TOP 10 FROM OTHER CATEGORIES EXCEPT LIFE IDENTIFIED USING THE SAME TECHNIQUE IN SSAS | |||
| cc010a_ | rel_pos_oth_lang | What do you consider to be your relative position to others in terms of language? (Much worse:0; Worse:1; same and blanks:2; Better:3; Much better:4) | 0–4 scale |
| cc722_1 | rel_with_mother | How would you rate the relationship with your mother? Poor:0; blanks, undecided and unwilling or Fair:1; Good:2; Very Good:3; Excellent:4) | 0–4 scale |
| cc733_ | fam_fin | Was your family well off financially, above average or poor? (poor:0; above average, blanks and other:1; well off: 2) | 0–2 scale |
| dn040_ | part_out_hh | Is your partner outside the household? (yes:2; blanks:1; no:0) | 0–2 scale |
| re701_ | ev_used_comp_work | Have you ever used a computer at work? (yes:2; blanks:1; no:0) | 0–2 scale |
| bfi10_neuro | neuroticism | Do you consider yourself as a neurotic person in terms of Big5 personality inventory? (1.5,2, 2.5 or low:0; blanks or 3:1; 3.5,4,4.5 or high:2) | 0–2 scale |
| OTHER ITEMS OF INTEREST CONSIDERED FOR FURTHER ANALYSIS IN ADDITION TO THE RESULTS OF THE FIRST ROUND MINING ABOVE | |||
| bfi10_extra | extraversion | Do you consider yourself as an extraverted person in terms of Big5 personality inventory? (same scale as for neuro_big5) | 0–2 scale |
| bfi10_agree | agreeableness | Do you consider yourself as an agreeable person in terms of Big5 personality inventory? (same scale as for neuro_big5) | 0–2 scale |
| bfi10_consc | consciousness | Do you consider yourself as a conscientious person in terms of Big5 personality inventory? (same scale as for neuro_big5) | 0–2 scale |
| bfi10_open | openness | Do you consider yourself as a open person in terms of Big5 personality inventory? (same scale as for neuro_big5) | 0–2 scale |
| ac701_ | reserved | Do you consider yourself a reserved person? (Disagree strongly:0; Disagree a little:1; Neither agree nor disagree, do not know, blanks:2; Agree a little:3; Strongly agree:4) | 0–4 scale |
| ac702_ | interpersonal_trust | Do you consider yourself a person who generally trusts others? (same scale as for reserved) | 0–4 scale |
| ac703_ | laziness | Do you consider yourself a person who tends to be lazy? (same scale as for reserved) | 0–4 scale |
| ac704_ | stress_resist | Do you consider yourself a relaxed person, who has a high resistance to stress? (same scale as for reserved) | 0–4 scale |
| ac705_ | artistic_interests | Do you consider yourself a person who has some few artistic interests? (same scale as for reserved) | 0–4 scale |
| ac706_ | sociable | Do you consider yourself an open, sociable person? (same scale as for reserved) | 0–4 scale |
| ac707_ | critical_spirit | Do you consider yourself a person who tends to look for the defects of others? (same scale as for reserved) | 0–4 scale |
| ac708_ | perseverance | Do you consider yourself a person who is persevering, taking everything from beginning to the end? (same scale as for reserved) | 0–4 scale |
| ac709_ | nervous | Do you consider yourself a person who becomes restless/worried/nervous easily? (same scale as for reserved) | 0–4 scale |
| ac710_ | rich_imagination | Do you consider yourself a person with a rich imagination? (same scale as for reserved) | 0–4 scale |
| ac711_ | kind_caring | Do you consider yourself a person who is attentive and caring with others? (same scale as for reserved) | 0–4 scale |
| cc729_ | loneliness | In your childhood (6–16 years), how often did you feel alone because you did not have friends? (same scale as for how_oft_age_prev_do) | 0–4 scale |
| re014_1 .. 20 | no_jobs (re014_ derivation after counting non-blanks using COUNTA) | How many jobs did you have? | 0–7 scale |
| ra017_1 .. 17 | urbanity_lvl (ra017_ derivation to find the urbanity level of last residence using imbricated IFs) | What is your urbanity level considering last area of residence? (Rural area or village:0; small town or blanks:1; big, large town, suburbia of a metropolis:2) | 0–2 scale |
| Variable | Obs. MB | Mean | Std. Dev. | Min | Max | Obs. TBCM | Mean | Std. Dev. | Min | Max | Obs. OMD | Mean | Std. Dev. | Min | Max |
|---|---|---|---|---|---|---|---|---|---|---|---|---|---|---|---|
| job satisfaction on a scale (how_satisf_job) | 330 | 2.65 | 0.95 | 0 | 4 | 793 | 2.92 | 0.99 | 0 | 4 | 929 | 2.83 | 0.97 | 0 | 4 |
| partial job satisfaction (satisf_with_my_job) | 330 | 0.54 | 0.50 | 0 | 1 | 793 | 0.63 | 0.48 | 0 | 1 | 929 | 0.59 | 0.49 | 0 | 1 |
| complete job satisfaction (compl_satisf_with_my_job) | 330 | 0.21 | 0.41 | 0 | 1 | 793 | 0.36 | 0.48 | 0 | 1 | 929 | 0.31 | 0.46 | 0 | 1 |
| life satisfaction on a scale (how_satisf_life) | 330 | 7.44 | 2.10 | 0 | 10 | 793 | 7.17 | 2.32 | 0 | 10 | 929 | 7.49 | 2.02 | 0 | 10 |
| partial life satisfaction (satisf_with_my_life) | 330 | 0.62 | 0.49 | 0 | 1 | 793 | 0.54 | 0.50 | 0 | 1 | 929 | 0.62 | 0.48 | 0 | 1 |
| complete life satisfaction (compl_satisf_with_my_life) | 330 | 0.30 | 0.46 | 0 | 1 | 793 | 0.27 | 0.44 | 0 | 1 | 929 | 0.31 | 0.46 | 0 | 1 |
| year of birth (birth_y) | 330 | 1951 | 10.15 | 1920 | 1967 | 793 | 1950 | 9.24 | 1921 | 1967 | 929 | 1952 | 9.25 | 1917 | 1967 |
| married as marital status (married) | 330 | 0.73 | 0.45 | 0 | 1 | 793 | 0.66 | 0.47 | 0 | 1 | 929 | 0.74 | 0.44 | 0 | 1 |
| feminine gender (female_gender) | 330 | 0.56 | 0.50 | 0 | 1 | 793 | 0.59 | 0.49 | 0 | 1 | 929 | 0.53 | 0.50 | 0 | 1 |
| graduated from high school (grad_high_sch) | 330 | 0.50 | 0.50 | 0 | 1 | 793 | 0.44 | 0.50 | 0 | 1 | 929 | 0.56 | 0.50 | 0 | 1 |
| physically demanding job (phys_demand_job) | 330 | 2.68 | 0.97 | 0 | 4 | 793 | 2.72 | 1.20 | 0 | 4 | 929 | 2.62 | 1.07 | 0 | 4 |
| always against stopwatch due to high volume of work (alw_ag_stopw_wvol) | 330 | 2.43 | 1.08 | 0 | 4 | 793 | 2.51 | 1.19 | 0 | 4 | 929 | 2.49 | 1.07 | 0 | 4 |
| opportunity to develop new skills (opp2dev_new_skills) | 330 | 1.89 | 1.09 | 0 | 4 | 793 | 2.34 | 1.19 | 0 | 4 | 929 | 2.33 | 1.10 | 0 | 4 |
| own work recognition (dsv_recog4my_work) | 330 | 2.13 | 1.01 | 0 | 4 | 793 | 2.44 | 1.14 | 0 | 4 | 929 | 2.43 | 1.08 | 0 | 4 |
| salary consistent with efforts (sal_in_line_eff_achiev) | 330 | 2.14 | 1.08 | 0 | 4 | 793 | 2.18 | 1.19 | 0 | 4 | 929 | 2.28 | 1.10 | 0 | 4 |
| support for difficulties -job (job_approp_supp_in_diff) | 330 | 2.16 | 1.01 | 0 | 4 | 793 | 2.35 | 1.13 | 0 | 4 | 929 | 2.34 | 1.08 | 0 | 4 |
| workplace atmosphere (colleag_good_atmosph) | 330 | 2.76 | 0.98 | 0 | 4 | 793 | 3.02 | 0.93 | 0 | 4 | 929 | 2.94 | 0.87 | 0 | 4 |
| employees fairly treated at your job (emp_prop_treatm) | 330 | 2.54 | 1.02 | 0 | 4 | 793 | 2.72 | 1.00 | 0 | 4 | 929 | 2.67 | 0.96 | 0 | 4 |
| authorities’ protection -work (auth_protect) | 330 | 2.34 | 0.99 | 0 | 4 | 793 | 2.51 | 1.16 | 0 | 4 | 929 | 2.52 | 1.06 | 0 | 4 |
| respondent not assisted by a proxy one (resp_not_proxy_assist) | 330 | 0.59 | 0.49 | 0 | 1 | 793 | 0.68 | 0.46 | 0 | 1 | 929 | 0.65 | 0.48 | 0 | 1 |
| ever done paid work (evr_done_paid_work) | 330 | 1.64 | 0.77 | 0 | 2 | 793 | 1.76 | 0.65 | 0 | 2 | 929 | 1.76 | 0.65 | 0 | 2 |
| worked in the public sector (pub_sect_emp) | 330 | 0.72 | 0.45 | 0 | 1 | 793 | 0.82 | 0.38 | 0 | 1 | 929 | 0.81 | 0.39 | 0 | 1 |
| had a full time job (full_time_job) | 330 | 0.78 | 0.42 | 0 | 1 | 793 | 0.86 | 0.34 | 0 | 1 | 929 | 0.86 | 0.35 | 0 | 1 |
| retirement as reason for leaving 1st job (ret_cause_left_1st_job) | 330 | 0.21 | 0.41 | 0 | 1 | 793 | 0.24 | 0.43 | 0 | 1 | 929 | 0.23 | 0.42 | 0 | 1 |
| retired -work after 1st job (ret_work_aft_1st_job) | 330 | 0.28 | 0.45 | 0 | 1 | 793 | 0.42 | 0.49 | 0 | 1 | 929 | 0.37 | 0.48 | 0 | 1 |
| received retire benefits after 1st job (recv_retir_benef_1st_job) | 330 | 1.38 | 0.51 | 0 | 2 | 793 | 1.49 | 0.54 | 0 | 2 | 929 | 1.45 | 0.52 | 0 | 2 |
| paid job after retirement (paid_job_aft_retir) | 330 | 0.46 | 0.61 | 0 | 2 | 793 | 0.37 | 0.60 | 0 | 2 | 929 | 0.41 | 0.60 | 0 | 2 |
| situation changed after last job (sit_chg_aft_last_job) | 330 | 0.48 | 0.63 | 0 | 2 | 793 | 0.38 | 0.61 | 0 | 2 | 929 | 0.49 | 0.66 | 0 | 2 |
| age preventing from doing things on a scale (how_oft_age_prev_do) | 330 | 2.28 | 1.54 | 0 | 4 | 793 | 2.62 | 1.45 | 0 | 4 | 929 | 2.24 | 1.57 | 0 | 4 |
| feeling of not controlling own life on a scale (how_oft_no_ctrl) | 330 | 1.67 | 1.55 | 0 | 4 | 793 | 1.62 | 1.48 | 0 | 4 | 929 | 1.56 | 1.53 | 0 | 4 |
| feeling of neglect on a scale (how_oft_feel_nglctd) | 330 | 1.03 | 1.43 | 0 | 4 | 793 | 1.12 | 1.40 | 0 | 4 | 929 | 0.95 | 1.33 | 0 | 4 |
| feeling of being able to do anything on a scale (how_oft_feel_do_things) | 330 | 2.36 | 1.45 | 0 | 4 | 793 | 2.51 | 1.37 | 0 | 4 | 929 | 2.71 | 1.34 | 0 | 4 |
| think about next day with enthusiasm on a scale (how_oft_next_d_enth) | 330 | 2.74 | 1.28 | 0 | 4 | 793 | 2.64 | 1.33 | 0 | 4 | 929 | 2.98 | 1.22 | 0 | 4 |
| life makes no sense (how_oft_life_nosense) | 330 | 1.10 | 1.48 | 0 | 4 | 793 | 1.14 | 1.43 | 0 | 4 | 929 | 0.95 | 1.32 | 0 | 4 |
| look happily back on your life on a scale (how_oft_bck_life_happy) | 330 | 2.91 | 1.26 | 0 | 4 | 793 | 2.68 | 1.28 | 0 | 4 | 929 | 2.98 | 1.22 | 0 | 4 |
| feel full of energy on a scale (how_oft_feel_full_energ) | 330 | 2.52 | 1.31 | 0 | 4 | 793 | 2.49 | 1.32 | 0 | 4 | 929 | 2.72 | 1.33 | 0 | 4 |
| life full of opportunities (how_oft_feel_full_opport) | 330 | 2.43 | 1.32 | 0 | 4 | 793 | 2.23 | 1.35 | 0 | 4 | 929 | 2.51 | 1.33 | 0 | 4 |
| how often future looks good (how_oft_feel_future_good) | 330 | 2.53 | 1.36 | 0 | 4 | 793 | 2.17 | 1.39 | 0 | 4 | 929 | 2.41 | 1.35 | 0 | 4 |
| relative position to others in terms of language (rel_pos_oth_lang) | 330 | 2.51 | 0.85 | 0 | 4 | 793 | 2.55 | 0.91 | 0 | 4 | 929 | 2.53 | 0.90 | 0 | 4 |
| relationship with mother (rel_with_mother) | 330 | 3.26 | 0.86 | 0 | 4 | 793 | 3.09 | 0.86 | 0 | 4 | 929 | 3.25 | 0.88 | 0 | 4 |
| family financial well-being (fam_fin) | 330 | 0.96 | 0.74 | 0 | 2 | 793 | 0.74 | 0.69 | 0 | 2 | 929 | 0.91 | 0.72 | 0 | 2 |
| partner outside household (part_out_hh) | 330 | 0.75 | 0.44 | 0 | 2 | 793 | 0.71 | 0.47 | 0 | 2 | 929 | 0.77 | 0.43 | 0 | 2 |
| ever used a computer at work (ev_used_comp_work) | 330 | 0.35 | 0.62 | 0 | 2 | 793 | 0.27 | 0.59 | 0 | 2 | 929 | 0.32 | 0.65 | 0 | 2 |
| being neurotic as personality trait (neuroticism) | 330 | 1.04 | 0.84 | 0 | 2 | 793 | 0.86 | 0.83 | 0 | 2 | 929 | 0.78 | 0.85 | 0 | 2 |
| extraverted as personality trait (extraversion) | 330 | 1.56 | 0.68 | 0 | 2 | 793 | 1.56 | 0.66 | 0 | 2 | 929 | 1.55 | 0.67 | 0 | 2 |
| being agreeable as personality trait (agreeableness) | 330 | 1.24 | 0.83 | 0 | 2 | 793 | 1.52 | 0.70 | 0 | 2 | 929 | 1.53 | 0.69 | 0 | 2 |
| being conscientious as personality trait (consciousness) | 330 | 1.85 | 0.41 | 0 | 2 | 793 | 1.71 | 0.58 | 0 | 2 | 929 | 1.78 | 0.52 | 0 | 2 |
| openness as personality trait (openness) | 330 | 1.26 | 0.78 | 0 | 2 | 793 | 1.17 | 0.79 | 0 | 2 | 929 | 1.09 | 0.82 | 0 | 2 |
| reserved person (reserved) | 330 | 1.76 | 1.20 | 0 | 4 | 793 | 1.76 | 1.49 | 0 | 4 | 929 | 1.82 | 1.37 | 0 | 4 |
| person who trusts others (interpersonal_trust) | 330 | 2.46 | 1.17 | 0 | 4 | 793 | 2.82 | 1.23 | 0 | 4 | 929 | 2.64 | 1.16 | 0 | 4 |
| tendency to be lazy (laziness) | 330 | 0.56 | 1.06 | 0 | 4 | 793 | 1.01 | 1.40 | 0 | 4 | 929 | 0.60 | 0.97 | 0 | 4 |
| high resistance to stress (stress_resist) | 330 | 2.45 | 1.22 | 0 | 4 | 793 | 2.64 | 1.30 | 0 | 4 | 929 | 2.50 | 1.27 | 0 | 4 |
| person with artistic interests (artistic_interests) | 330 | 2.01 | 1.33 | 0 | 4 | 793 | 2.34 | 1.52 | 0 | 4 | 929 | 2.15 | 1.40 | 0 | 4 |
| open, sociable person (sociable) | 330 | 3.22 | 1.01 | 0 | 4 | 793 | 3.44 | 0.93 | 0 | 4 | 929 | 3.25 | 1.04 | 0 | 4 |
| tendency to criticize (critical_spirit) | 330 | 1.81 | 1.27 | 0 | 4 | 793 | 1.19 | 1.41 | 0 | 4 | 929 | 1.18 | 1.23 | 0 | 4 |
| persevering person (perseverence) | 330 | 3.25 | 0.97 | 0 | 4 | 793 | 3.40 | 0.97 | 0 | 4 | 929 | 3.10 | 1.14 | 0 | 4 |
| restless/worried/nervous person (nervous) | 330 | 2.54 | 1.21 | 0 | 4 | 793 | 2.24 | 1.49 | 0 | 4 | 929 | 1.92 | 1.32 | 0 | 4 |
| person with a rich imagination (rich_imagination) | 330 | 2.46 | 1.14 | 0 | 4 | 793 | 2.79 | 1.21 | 0 | 4 | 929 | 2.33 | 1.26 | 0 | 4 |
| attentive and caring person (kind_caring) | 330 | 3.48 | 0.88 | 0 | 4 | 793 | 3.55 | 0.82 | 0 | 4 | 929 | 3.34 | 0.95 | 0 | 4 |
| loneliness in childhood (loneliness) | 330 | 0.74 | 1.32 | 0 | 4 | 793 | 0.57 | 1.10 | 0 | 4 | 929 | 0.68 | 1.18 | 0 | 4 |
| number of previous jobs (no_jobs) | 330 | 1.45 | 1.18 | 0 | 7 | 793 | 1.68 | 1.21 | 0 | 7 | 929 | 1.68 | 1.24 | 0 | 6 |
| residence’s urbanity level (urbanity_lvl) | 330 | 0.28 | 0.54 | 0 | 2 | 793 | 0.41 | 0.65 | 0 | 2 | 929 | 0.55 | 0.78 | 0 | 2 |
Appendix B

References
- Rainey, H.G. Understanding and Managing Public Organizations; John Wiley & Sons: San Francisco, CA, USA, 2009; p. 298. [Google Scholar]
- Spector, P.E. Industrial and Organizational Psychology: Research and Practice; John Wiley & Sons: New York, NY, USA, 1996. [Google Scholar]
- Judge, T.A.; Thoresen, C.J.; Bono, J.E.; Patton, G.K. The job satisfaction–job performance relationship: A qualitative and quantitative review. Psychol. Bull. 2001, 127, 376–407. [Google Scholar] [CrossRef] [PubMed]
- Herzberg, F. Work and the Nature of Man; World Publishing Company: Cleveland, OH, USA, 1966. [Google Scholar]
- Hackman, R.; Oldham, G.R. Motivation through the design of work: Test of a theory. Org. Behav. Hum. Perform. 1976, 16, 250–279. [Google Scholar] [CrossRef]
- Locke, E.A. The nature and causes of job satisfaction. In Handbook of Industrial and Organizational Psychology; Dunnette, M.D., Ed.; Rand McNally: Chicago, IL, USA, 1976; pp. 1297–1349. [Google Scholar]
- Wilczynska, A.; Batorski, D.; Torrent-Sellens, J. Employment flexibility and job Security as determinants of job Satisfaction: The case of polish knowledge workers. Soc. Indic. Res. 2016, 126, 633–656. [Google Scholar] [CrossRef]
- Westbrook, T.M.; Ellis, J.; Ellet, A.J. Improving retention among public child welfare workers: What can we learn from the insights and experiences of committed survivors? Admin. Soc. Work. 2006, 30, 37–62. [Google Scholar] [CrossRef]
- Auerbach, C.; McGowan, B.G.; Ausberger, A.; Strolin-Goltzman, J.; Schudrich, W. Differential factors influencing public and voluntary child welfare workers’ intention to leave. Child. Yth. Serv. Rev. 2010, 32, 1396–1402. [Google Scholar] [CrossRef]
- Koys, D.J. The effects of employee satisfaction, organizational citizenship behavior, and turnover on organizational effectiveness: A unit-level, longitudinal study. Pers. Psychol. 2001, 54, 101–114. [Google Scholar] [CrossRef]
- Mafini, C.; Pooe, D.R.I. The relationship between employee satisfaction and organisational performance: Evidence from a South African government department. Sa J. Ind. Psychol. 2013, 39. [Google Scholar] [CrossRef]
- Chandrasekar, K. Workplace environment and its impact on organisational performance in public sector organisations. Int. J. Enterp. Comput. Buss. Sys. 2011, 1, 1–16. [Google Scholar]
- Calculator Venituri. Available online: https://www.calculatorvenituri.ro/cat-muncesc-romanii-comparativ-cu-locuitorii-altor-tari (accessed on 27 February 2020).
- Steel, P.; Schmidt, J.; Bosco, F.; Uggerslev, K. The effects of personality on job satisfaction and life satisfaction: A meta-analytic investigation accounting for bandwidth–fidelity and commensurability. Hum. Rel. 2019, 72, 217–247. [Google Scholar] [CrossRef]
- Catalyst. Talent & Employer Branding. Available online: https://www.catalyst.ro/project/the-most-desired-employers-the-employer-branding-survey-in-romania (accessed on 27 February 2020).
- Bianchi, M. Financial development, entrepreneurship and job Satisfaction. Rev. Econ. Stat. 2012, 94, 273–286. [Google Scholar] [CrossRef]
- De Bustillo Llorente, R.M.; Macıas, E.F. Job satisfaction as an indicator of the quality of work. J. Soc. Econ. 2005, 34, 656–673. [Google Scholar] [CrossRef]
- Blanchflower, D.G. Self-employment in OECD countries. Lab. Econ. 2000, 7, 471–505. [Google Scholar] [CrossRef]
- Cook, J.; Hepworth, S.; Wall, T.; Warr, P. The Experience of Work: A Compendium and Review of 249 Measures and Their Use; Academic Press: New York, NY, USA, 1981. [Google Scholar]
- Cranny, C.; Smith, P.; Stone, E. Job Satisfaction: How People Feel About Their Jobs and How It Affects Their Performance; Lexington: New York, NY, USA, 1992. [Google Scholar]
- Cherniss, C. Staff Burnout: Job Stress in the Human Services; Sage: Beverly Hills, CA, USA, 1980. [Google Scholar]
- Whitehead, J.T. Burnout in Probation and Corrections; Praeger: New York, NY, USA, 1989. [Google Scholar]
- Joyce, C.; Veitch, C.; Crossland, L. Professional and social support networks of rural general practitioners. Aust. J. R. Health 2003, 11, 7–14. [Google Scholar] [CrossRef] [PubMed]
- Lynn, M.R.; Redman, R. Faces of the nursing shortage: Influences on staff nurses’ intentions to leave their positions or nursing. J. Nurs. Admin. 2005, 35, 264–270. [Google Scholar] [CrossRef]
- Shen, J.; Cox, A.; McBride, A. Factors influencing turnover and retention of midwives and consultants: A literature review. Health Serv. Manag. Res. 2004, 17, 249–262. [Google Scholar] [CrossRef]
- Lu, H.; While, A.E.; Barriball, K.L. Job satisfaction among nurses: A literature review. Int. J. Nurs. Stud. 2005, 42, 211–227. [Google Scholar] [CrossRef]
- Franco, L.M.; Bennett, S.; Kanfer, R.; Stubblebine, P. Determinants and consequences of health worker motivation in hospitals in Jordan and Georgia. Soc. Sci. Med. 2004, 58, 343–355. [Google Scholar] [CrossRef]
- Mathauer, I.; Imhoff, I. Health worker motivation in Africa: The role of nonfinancial incentives and human resources management tools. Hum. Res. Health 2006, 4, 24. [Google Scholar] [CrossRef]
- Manongi, R.N.; Marchant, T.; Bybjerg, C. Improving motivation among primary health care workers in Tanzania: A health worker perspective. Human Res. Health 2006, 4, 6. [Google Scholar] [CrossRef]
- Williams, M.; McDaniel, M.A.; Nguyen, N. A meta-analysis of the antecedents and consequences of pay satisfaction. J. Appl. Psychol. 2006, 9, 392–413. [Google Scholar] [CrossRef]
- Boughn, S.; Lentini, A. Why Do Women Choose Nursing? J. Nurs. Educ. 1999, 38, 151–161. [Google Scholar]
- Long, R. Strategic Compensation in Canada; Nelson: Toronto, ON, Canada, 2005. [Google Scholar]
- Curtis, E.A. Job satisfaction: A survey of nurses in the republic of Ireland. Int. Nurs. Rev. 2007, 52, 92–99. [Google Scholar] [CrossRef] [PubMed]
- Dochery, A.; Barns, A. Who’d be a nurse? Some evidence on career choice in Australia. Aust. Bull. Lab. 2005, 31, 350–383. [Google Scholar]
- Seymour, E.; Buscherhof, J.R. Sources and consequences of satisfaction and dissatisfaction in nursing: Findings from a national sample. Int. Nurs. Stud. 1991, 28, 109–124. [Google Scholar] [CrossRef]
- Westover, J.; Taylor, J. International differences in job satisfaction: The effects of public service motivation, rewards and work relations. Int. J. Prod. Perform. Manag. 2010, 59, 731–751. [Google Scholar] [CrossRef]
- Mount, M.; Ilies, R.; Johnson, E. Relationship of personality traits and counterproductive work behaviors: The mediating effects of job satisfaction. Pers. Psychol. 2006, 59, 591–622. [Google Scholar] [CrossRef]
- Hardy, G.E.; Woods, D.; Wall, T.D. The impact of psychological distress on absence from work. J. Appl. Psychol. 2003, 88, 306–314. [Google Scholar] [CrossRef]
- Pugliesi, K. The consequences of emotional labor: Effects on work stress, job satisfaction, and well-being. Motiv. Emot. 1999, 23, 125–154. [Google Scholar] [CrossRef]
- Griffeth, R.W.; Hom, P.W.; Gaertner, S. A meta-analysis of antecedents and correlates of employee turnover: Update, moderator tests, and research implications for the next millennium. J. Manag. 2000, 26, 463–488. [Google Scholar] [CrossRef]
- Wang, M. Profiling retirees in the retirement transition and adjustment process: Examining the longitudinal change patterns of retirees’ psychological well-being. J. Appl. Psychol. 2007, 92, 455–474. [Google Scholar] [CrossRef]
- Lim, S.; Cortina, L.M.; Magley, V.J. Personal and workgroup incivility: Impact on work and health outcomes. J. Appl. Psychol. 2008, 93, 95–107. [Google Scholar] [CrossRef] [PubMed]
- Watson, D.; Slack, A.K. General factors of effective temperament and their relation to job satisfaction over time. Org. Behav. Hum. Dec. Proc. 1993, 54, 181–202. [Google Scholar] [CrossRef]
- Bruk-Lee, V.; Khoury, H.A.; Nixon, A.E.; Goh, A.; Spector, P.E. Replicating and extending past personality/job satisfaction meta-analyses. Hum. Perform. 2009, 22, 156–189. [Google Scholar] [CrossRef]
- Steel, P.; Schmidt, J.; Shultz, J. Refining the relationship between personality and subjective well-being. Psychol. Bull. 2008, 134, 138–161. [Google Scholar] [CrossRef]
- Judge, T.A.; Heller, D.; Mount, M.K. Five-factor model of personality and job satisfaction: A meta-analysis. J. Appl. Psychol. 2002, 87, 530–541. [Google Scholar] [CrossRef]
- Triandis, H.C.; Suh, E.M. Cultural influences on personality. Ann. Rev. Psychol. 2002, 53, 133–160. [Google Scholar] [CrossRef]
- Templer, K.J. Five-factor model of personality and job satisfaction: The importance of agreeableness in a tight and collectivistic Asian society. Appl. Psychol. 2011, 61, 114–129. [Google Scholar] [CrossRef]
- Berglund, V.; Sevä, I.J.; Strandh, M. Subjective well-being and job satisfaction among self-employed and regular employees: Does personality matter differently? J. Small Buss Entrep. 2015, 28, 55–73. [Google Scholar] [CrossRef]
- Törnroos, M.; Jokela, M.; Hakulinen, C. The relationship between personality and job satisfaction across occupations. Pers. Indiv. Diff. 2019, 145, 82–88. [Google Scholar] [CrossRef]
- Flisi, S.; Goglio, V.; Meroni, E.C.; Rodrigues, M.; Vera-Toscano, E. Measuring occupational mismatch: Overeducation and overskill in europe-evidence from PIAAC. Soc. Ind. Res. 2016, 131, 1–39. [Google Scholar] [CrossRef]
- Boswell, W.R.; Shipp, A.J.; Payne, S.C.; Culbertson, S.S. Changes in newcomer job satisfaction over time: Examining the pattern of honeymoons and hangovers. J. Appl. Psychol. 2009, 94, 844–858. [Google Scholar] [CrossRef] [PubMed]
- Akerlof, G.A.; Rose, A.K.; Yellen, J.L. Job switching and job satisfaction in the US labor market. Brook. Pap. Econ. Act. 1988, 2, 495–594. [Google Scholar] [CrossRef]
- Chadi, A.; Hetschko, C. The magic of the new: How job changes affect job satisfaction. J. Econ. Manag. Strat. 2017, 27, 1–17. [Google Scholar] [CrossRef]
- Kambourov, G.; Manovskii, I. Occupational mobility and wage inequality. Rev. Econ. Stud. 2009, 76, 731–759. [Google Scholar] [CrossRef]
- Fisher, C.D. Happiness at work. Int. J. Manag. Rev. 2010, 12, 384–412. [Google Scholar] [CrossRef]
- Choudhury, R.R.; Gupta, V. Impact of age on pay satisfaction and job satisfaction leading to turnover intention: A study of young working professionals in India. Manag. Lab. Stud. 2011, 36, 353–363. [Google Scholar] [CrossRef]
- Dalal, R.S. A meta-analysis of the relationship between organizational citizenship behavior and counterproductive work behavior. J. Appl. Psychol. 2005, 90, 1241–1255. [Google Scholar] [CrossRef]
- Bidewell, J.; Griffin, B.; Hesketh, B. Timing of retirement: Including a delay discounting perspective in retirement models. J. Vocat. Behav. 2006, 68, 368–387. [Google Scholar] [CrossRef]
- Kalokerinos, E.K.; Von Hippel, C.; Henry, J.D. Job attitudes are differentially associated with bridge employment and phased retirement among older Australian employees. Work Aging. Retir. 2015, 1, 190–201. [Google Scholar] [CrossRef]
- Bratt, M.M.; Baernholdt, M.; Pruszynski, J. Are rural and urban newly licensed nurses different? A longitudinal study of a nurse residency programme. J. Nurs. Manag. 2014, 22, 779–791. [Google Scholar] [CrossRef]
- Anderson, C.A. Attributional style, depression, and loneliness: A cross-cultural comparison of American and Chinese students. Personal. Soc. Psychol. Bull. 1999, 25, 482–499. [Google Scholar] [CrossRef]
- Ernst, J.; Cacioppo, J. Lonely Hearts: Psychological Perspectives on Loneliness. Appl. Prev. Psychol. 1999, 8, 1–22. [Google Scholar] [CrossRef]
- Peplau, L.A.; Perlman, D. Blueprint for a social psychological theory of loneliness. In Love and Attraction; Cook, M., Wilson, G., Eds.; Pergamon: Oxford, UK, 1979; pp. 101–110. [Google Scholar]
- Bhagat, R.S. Conditions under which stronger job performance-job satisfaction relationships may be observed. Acad. Manag. J. 1982, 29, 772–789. [Google Scholar]
- Aytac, S. Loneliness as mediator between job satisfaction and intention to leave: A study on prison staff in Turkey. Arab. J. Buss. Manag. Rev. 2015, 5, 1–4. [Google Scholar]
- Wright, S.L.; Burt, C.D.B.; Strongman, K.T. Loneliness in the workplace: Construct, definition and scale Development. N. Z. J. Psychol. 2006, 35, 59–68. [Google Scholar]
- Chan, S.H.; Qiu, H.H. Loneliness, job satisfaction, and organizational commitment of migrant workers: Empirical evidence from China. Int. J. Hum. Res. Manag. 2011, 22, 1109–1127. [Google Scholar] [CrossRef]
- Landry, M.B. The effects of life satisfaction and job satisfaction on reference librarians and their work. Ref. User Serv. Q 2000, 40, 166–168. [Google Scholar]
- Petrovski, P.; Gleeson, G. The relationship between job satisfaction and psychological health in people with an intellectual disability in competitive employment. J. Intellect. Dev. Disab. 2007, 22, 199–211. [Google Scholar] [CrossRef]
- Lam, L.W.; Lau, D.C. Feeling lonely at work: Investigating the consequences of unsatisfactory workplace relationships. Int. J. Hum. Res. Manag. 2012, 23, 4265–4282. [Google Scholar] [CrossRef]
- Neto, R.A. Teachers Feel Lonely Too: A Study of Teachers’ Personal and Professional Characteristics Associated with Loneliness. Psico P Alegre 2005, 46, 321–330. [Google Scholar]
- Dussault, M.; Deaudelin, C. Loneliness and self-efficacy in education majors. Psychol. Rep. 2001, 89, 285–289. [Google Scholar] [CrossRef]
- Wei, M.; Russell, D.W.; Zakalik, R.A. Adult attachment, social self-efficacy, self-disclosure, loneliness, and subsequent depression for freshman college students: A longitudinal study. J. Couns. Psychol. 2005, 52, 602–614. [Google Scholar] [CrossRef]
- Ozcelik, H.; Barsade, S. Work loneliness and employee performance. Acad. Manag. Proceed. 2011, 1, 1–6. [Google Scholar] [CrossRef]
- Cardina, C.; Wicks, D. The changing roles of academic reference librarians over a ten-year period. Ref. User Serv. Q 2004, 44, 133–142. [Google Scholar]
- Gaszynska, E.; Stankiewicz-Rudnicki, M.; Szatko, F.; Wieczorek, A.; Gaszynski, T. Life satisfaction and work-related satisfaction among anesthesiologists in Poland, Hindawi Publishing Corporation. Sci. World J. 2014, 2014, 1–9. [Google Scholar]
- Bacopanos, E.; Edgar, S. Identifying the factors that affect the job satisfaction of early career Notre Dame graduate physiotherapists. Aust. Health Rev. 2016, 40, 538–543. [Google Scholar] [CrossRef]
- Kinicki, A.J.; McKee-Ryan, F.J.; Schriesheim, C.A.; Carson, K.P. Assessing the construct validity of the Job Descriptive Index: A review and meta-analysis. J. Appl. Psychol. 2002, 87, 14–32. [Google Scholar] [CrossRef]
- Nyberg, A. Retaining your high performers: Moderators of the performance–job satisfaction–voluntary turnover relationship. J. Appl. Psychol. 2010, 95, 440–453. [Google Scholar] [CrossRef]
- Aiken, L.H.; Sloane, D.M.; Bruyneel, L.; Van den Heede, K.; Sermeus, W. Nurses’ reports of working conditions and hospital quality of care in 12 countries in Europe. Int. J. Nurs. Stud. 2012, 50, 143–154. [Google Scholar] [CrossRef]
- Prasad, M.A.; Verma, N.; Jain, K.; Dewangan, P. Assessment of work-related health hazards, personal hygiene and utilization of personal protective equipment’s among stone quarry workers: A cross sectional study in central India. Int. J. Commun. Med. Pub. Health 2019, 6, 3520–3526. [Google Scholar] [CrossRef]
- Kularathna, W.; Perera, G.D.N. The impact of safety and health on job satisfaction in selected branches of utility service supply organization in western province north in Sri Lanka. In Proceedings of the 3rd International HRM Conference, Gangodawila, Sri Lanka, 10 September 2016. [Google Scholar]
- Clark, A.; Postel-Vinay, F. Job security and job protection. Oxf. Econ. Pap. 2009, 61, 207–239. [Google Scholar] [CrossRef]
- Kim, J.-G.; Lee, S.-Y. Effects of transformational and transactional leadership on employees’ creative behaviour: Mediating effects of work motivation and job satisfaction. Asian J. Technol. Innov. 2011, 19, 233–247. [Google Scholar] [CrossRef]
- Wiley, J.W. The High-Performance Organizational Climate: How Workers Describe Top-Performing Units; Sage: Thousand Oaks, CA, USA, 2000. [Google Scholar]
- Schneider, B.; Salvaggio, A.N.; Subirats, M. Climate strength: A new direction for climate research. J. Appl. Psychol. 2002, 87, 220–229. [Google Scholar] [CrossRef] [PubMed]
- Mumford, M.D.; Scott, G.M.; Gaddis, B.; Strange, J.M. Leading creative people: Orchestrating expertise and relationships. Lead. Q. 2002, 13, 705–750. [Google Scholar] [CrossRef]
- Flynn, G. Is your recognition program understood? Workforce 1998, 77, 30–35. [Google Scholar]
- Kiviniemi, M.T.; Snyder, M.; Omoto, A.M. Too many good things? The effect of multiple motivations on stress. Pers. Soc. Psychol. Bull.ull. 2002, 28, 732–743. [Google Scholar] [CrossRef]
- Zaini, A.; Nilufar, A.; Syed, S.A. The effect of human resource management practices on business performance among private companies in Malaysia. Int. J. Buss. Manag. 2009, 4, 65–72. [Google Scholar]
- Chew, Y.T. Achieving organizational prosperity through employee motivation and retention: A comparative study of strategic HRM practices in Malaysian institutions. Res. Pr. Hum. Res. Manag. 2005, 13, 87–104. [Google Scholar]
- Sanchez, L.C.; Briseno, A.P.; Valdovinos Rosas, R.M.; Sanchez Garreta, J.S.; Garcia Jimenez, V.; Camacho-Nieto, O.; Perez-Meana, H.; Nakano-Miyatake, M. Estudio emp’ırico del enfoque asociativo en el contexto de los problemas de clasificacion. Comput. Sist. 2019, 23, 601–617. [Google Scholar]
- Acuña, E.; Rodriguez, C. The treatment of missing values and its effect on classifier accuracy. In Classification, Clustering, and Data Mining Applications. Studies in Classification, Data Analysis, and Knowledge Organisation; Banks, D., McMorris, F.R., Arabie, P., Gaul, W., Eds.; Springer: Berlin/Heidelberg, Germany, 2004; pp. 639–647. [Google Scholar]
- Levy, S.; Fullagar, P.K. Reconstruction of a sparse spike train from a portion of its spectrum and application to high-resolution deconvolution. Geophysics 1981, 46, 1235–1243. [Google Scholar] [CrossRef]
- Santosa, F.; Symes, W.W. Linear Inversion of Band-Limited Reflection Seismograms. Siam J. Sci. Stat. Comput. 1986, 7, 1307–1330. [Google Scholar] [CrossRef]
- Tibshirani, R. Regression shrinkage and selection via the lasso. J. R. Stat. Soc. Ser. B Method. 1996, 58, 267–288. [Google Scholar] [CrossRef]
- Bewick, V.; Cheek, L.; Ball, J. Review. Statistics review 14: Logistic regression. Crit. Care 2005, 9, 112–118. [Google Scholar] [CrossRef] [PubMed]
- Long, S.J.; Freese, J. Regression Models for Categorical Dependent Variables Using Stata, 3rd ed.; Stata Press: College Station, TX, USA, 2014; p. 390. [Google Scholar]
- Salmerón, R.; García, C.B.; García, J. Variance inflation factor and condition number in multiple linear regression. J. Stat. Comput. Simul. 2018, 88, 2365–2384. [Google Scholar] [CrossRef]
- Allison, P.D. Measures of fit for logistic regression. In Proceedings of the SAS Global Forum, Washington, WA, USA, 23–26 March 2014; pp. 1485–2014. [Google Scholar]
- Jiménez-Valverde, A. Insights into the area under the receiver operating characteristic curve (AUC) as a discrimination measure in species distribution modelling. Glob. Ecol. Biogeogr. 2012, 21, 498–507. [Google Scholar] [CrossRef]
- Zlotnik, A.; Abraira, V. A general-purpose nomogram generator for predictive logistic regression models. Stata. J. 2015, 15, 537–546. [Google Scholar] [CrossRef]
- Stillwell, J.; Duke-Williams, O.; Dennett, A. Technologies for Migration and Commuting Analysis: Spatial Interaction Data Applications; IGI Global: Hershey, PA, USA, 2010; pp. 261–279. [Google Scholar]
- Zou, G.A. Modified poisson regression approach to prospective studies with binary data. Am. J. Epidemiol. 2004, 159, 702–706. [Google Scholar] [CrossRef]
- Plopeanu, A.-P.; Homocianu, D.; Bodea, G.; Crișan, E.L.; Mihăilă, A.A. Assessing the imprint of the long-gone hapsburg empire’s border on the romanian students’ migration intentions. Int. Mig. 2020. [Google Scholar] [CrossRef]
- Plopeanu, A.-P.; Homocianu, D.; Mihăilă, A.A.; Crișan, E.L.; Bodea, G.; Bratu, R.-D.; Airinei, D. Exploring the influence of personal motivations, beliefs and attitudes on students’ post-graduation migration intentions: Evidence from three major romanian universities. Appl. Sci. 2018, 8, 2121. [Google Scholar] [CrossRef]
- Plopeanu, A.-P.; Homocianu, D.; Florea, N.; Ghiuță, O.A.; Airinei, D. Comparative patterns of migration intentions: Evidence from eastern european students in economics from Romania and Republic of Moldova. Sustainability 2019, 11, 4935. [Google Scholar] [CrossRef]
- Moawed, S.A.; Osman, M.M. The robustness of binary logistic regression and linear discriminant analysis for the classification and differentiation between dairy cows and buffaloes. Int. J. Stat. Appl. 2017, 7, 304–310. [Google Scholar]
- St-Pierre, A.P.; Shikon, V.; Schneider, D.C. Count data in biology—Data transformation or model reformation? Ecol. Evol. 2018, 8, 3077–3085. [Google Scholar] [CrossRef] [PubMed]
- Munafò, M.R.; Smith, G.D. Robust research needs many lines of evidence. Nature 2018, 553, 399–401. [Google Scholar] [CrossRef] [PubMed]


| Outcome | Dataset/Subset | Married | Graduated High School | Gender | |||
|---|---|---|---|---|---|---|---|
| Variables | (a) - Yes | (b) - No | (c) - Yes | (d) - No | (e) - Female | (f) - Male | |
| Full job satisfaction (4 from the 0–4 scale) | own work recognition | 0.0829 **** | 0.081 **** | 0.0919 **** | 0.0694 **** | 0.0616 **** | 0.11 **** |
| (dsv_recog4my_work) | (0.0069) | (0.0095) | (0.0086) | (0.0072) | (0.0071) | (0.0090) | |
| workplace atmosphere | 0.2139 **** | 0.2127 **** | 0.2158 **** | 0.2076 **** | 0.2108 **** | 0.2104 **** | |
| (colleag_good_atmosph) | (0.0095) | (0.0139) | (0.0121) | (0.0102) | (0.0088) | (0.0142) | |
| Pseudo R-square | 0.3679 | 0.426 | 0.3567 | 0.4065 | 0.4031 | 0.3567 | |
| AUROC | 0.8824 | 0.9062 | 0.8744 | 0.9019 | 0.9012 | 0.8758 | |
| Job satisfaction (3 or 4 from the 0–4 scale) | own work recognition | 0.0892 **** | 0.0769 **** | 0.0791 **** | 0.0905 **** | 0.0735 **** | 0.0962 **** |
| (dsv_recog4my_work) | (0.0086) | (0.0137) | (0.0102) | (0.0104) | (0.0096) | (0.0108) | |
| workplace atmosphere | 0.2548 **** | 0.2682 **** | 0.241 **** | 0.2715 **** | 0.2724 **** | 0.2289 **** | |
| (colleag_good_atmosph) | (0.0033) | (0.0051) | (0.0040) | (0.0046) | (0.0049) | (0.0034) | |
| Pseudo R-square | 0.4978 | 0.5239 | 0.482 | 0.5226 | 0.5245 | 0.4668 | |
| AUROC | 0.9384 | 0.9326 | 0.9311 | 0.9308 | 0.9346 | 0.9336 | |
| Max VIF | 5.94 | 5.74 | 6.63 | 5.21 | 5.71 | 6.08 | |
| Observations | 1455 | 597 | 1039 | 1013 | 1151 | 901 | |
| Outcome | Dataset/Subset | Overall | MB | TBCM | OMD |
|---|---|---|---|---|---|
| Variables | (a) | (b) | (c) | (d) | |
| Full job satisfaction (4 from the 0–4 scale) | own work recognition | 0.0825 **** | 0.0708 **** | 0.0906 **** | 0.0767 **** |
| (dsv_recog4my_work) | (0.0056) | (0.0144) | (0.0090) | (0.0083) | |
| workplace atmosphere | 0.2137 **** | 0.1843 **** | 0.2118 **** | 0.2228 **** | |
| (colleag_good_atmosph) | (0.0079) | (0.0193) | (0.0128) | (0.0115) | |
| Pseudo R-square | 0.3839 | 0.3546 | 0.3709 | 0.3982 | |
| AUROC | 0.8893 | 0.8873 | 0.8798 | 0.8961 | |
| Job satisfaction (3 or 4 from the 0–4 scale) | own work recognition | 0.0859 **** | 0.0607 *** | 0.077 **** | 0.0953 **** |
| (dsv_recog4my_work) | (0.0073) | (0.0233) | (0.0115) | (0.0100) | |
| workplace atmosphere | 0.2589 **** | 0.272 **** | 0.2431 **** | 0.2572 **** | |
| (colleag_good_atmosph) | (0.0028) | (0.0095) | (0.0037) | (0.0060) | |
| Pseudo R-square | 0.505 | 0.3673 | 0.4841 | 0.5914 | |
| AUROC | 0.9309 | 0.9004 | 0.9251 | 0.9573 | |
| Max VIF | 5.88 | 5.21 | 5.63 | 6.43 | |
| Observations | 2052 | 330 | 793 | 929 |
| Regression Type | Binary LOGISTIC | POISSON with Robust Standard Errors | ||||
|---|---|---|---|---|---|---|
| Dataset/Subset | MB | TBCM | OMD | MB | TBCM | OMD |
| Variables/Scenarios | (a) | (b) | (c) | (d) | (e) | (f) |
| own work recognition | 0.0462 *** | 0.0836 **** | 0.0496 **** | 0.0535 *** | 0.0975 **** | 0.0599 **** |
| (dsv_recog4my_work) | (0.0149) | (0.0086) | (0.0096) | (0.0195) | (0.0157) | (0.0154) |
| workplace atmosphere | 0.164 **** | 0.2035 **** | 0.216 **** | 0.2516 **** | 0.3496 **** | 0.3576 **** |
| (colleag_good_atmosph) | (0.0199) | (0.0141) | (0.0108) | (0.0383) | (0.0353) | (0.0252) |
| support for difficulties -job | 0.0427 **** | 0.0421 **** | ||||
| (job_approp_supp_in_diff) | (0.0094) | (0.0114) | ||||
| authorities’ protection -work | 0.0334 ** | 0.0367 * | ||||
| (auth_protect) | (0.0156) | (0.0213) | ||||
| life full of opportunities | 0.029 **** | 0.0281 *** | ||||
| (how_oft_feel_full_opport) | (0.0082) | (0.0094) | ||||
| life makes no sense | 0.0269 ** | 0.0298 *** | ||||
| (how_oft_life_nosense) | (0.0118) | (0.0108) | ||||
| openness as personality trait | 0.0525 **** | 0.0549 **** | ||||
| (openness) | (0.0154) | (0.0168) | ||||
| loneliness in childhood | −0.0551 **** | −0.0622 **** | ||||
| (loneliness) | (0.0116) | (0.0179) | ||||
| tendency to be lazy | −0.0558 *** | 0.0347 **** | −0.0705*** | 0.0455 **** | ||
| (laziness) | (0.0180) | (0.0089) | (0.0244) | (0.0096) | ||
| family financial well-being | 0.0468 ** | 0.0492 *** | 0.0539 **** | 0.0579 *** | 0.0493 *** | 0.0468 *** |
| (fam_fin) | (0.0230) | (0.0176) | (0.0149) | (0.0221) | (0.0191) | (0.0166) |
| number of previous jobs | 0.0474 **** | 0.0412 **** | ||||
| (no_jobs) | (0.0143) | (0.0124) | ||||
| retired-work after 1st job | 0.0923 **** | 0.1271 **** | ||||
| (ret_work_aft_1st_job) | (0.0246) | (0.0333) | ||||
| residence’s urbanity level | 0.0407 *** | 0.0419 *** | ||||
| (urbanity_lvl) | (0.0137) | (0.0140) | ||||
| Pseudo R-square | 0.45 | 0.4327 | 0.4553 | 0.2911 | 0.2205 | 0.2471 |
| AUROC | 0.9173 | 0.905 | 0.9157 | N/A | N/A | N/A |
| Max VIF | 9.29 | 7.71 | 9.33 | 9.29 | 7.71 | 9.33 |
| Observations | 330 | 793 | 929 | 330 | 793 | 929 |
| Regression Type | Binary LOGISTIC | POISSON with Robust Standard Errors | |||||
|---|---|---|---|---|---|---|---|
| Outcome | 1st, 2nd, or Both Part/Parts of the Core | 1st, 2nd, or Both Part/Parts of the Core | |||||
| Variables/Scenarios | (a) | (b) | (c) | (d) | (e) | (f) | |
| Full job satisfaction (4 from the 0–4 scale) | own work recognition | 0.2061 **** | 0.0713 **** | 0.2233 **** | 0.0788 **** | ||
| (dsv_recog4my_work) | (0.0012) | (0.0012) | (0.0020) | (0.0021) | |||
| workplace atmosphere | 0.2264 **** | 0.1809 **** | 0.3036 **** | 0.2579 **** | |||
| (colleag_good_atmosph) | (0.0007) | (0.0012) | (0.0022) | (0.0029) | |||
| Pseudo R-square | 0.207 | 0.3197 | 0.36 | 0.1313 | 0.2046 | 0.222 | |
| AUROC | 0.802 | 0.8629 | 0.8844 | N/A | N/A | N/A | |
| Job satisfaction (3 or 4 from the 0–4 scale) | own work recognition | 0.2462 **** | 0.063 **** | 0.2425 **** | 0.0411 **** | ||
| (dsv_recog4my_work) | (0.0015) | (0.0013) | (0.0021) | (0.0016) | |||
| workplace atmosphere | 0.3151 **** | 0.2802 **** | 0.4283 **** | 0.4064 **** | |||
| (colleag_good_atmosph) | (0.0007) | (0.0011) | (0.0019) | (0.0023) | |||
| Pseudo R-square | 0.1615 | 0.5339 | 0.5555 | 0.066 | 0.1818 | 0.184 | |
| AUROC | 0.7817 | 0.9305 | 0.9373 | N/A | N/A | N/A | |
| Max VIF | 1 | 1 | 8.25 | 1 | 1 | 8.25 | |
| Observations | 75,674 | 75,674 | 75,674 | 75,674 | 75,674 | 75,674 | |
| Regression Type | Binary LOGISTIC | POISSON with Robust Standard Errors | |||||
|---|---|---|---|---|---|---|---|
| Outcome | 1st, 2nd, or Both Part/Parts of the Core | 1st, 2nd, or Both Part/Parts of the Core | |||||
| Variables/Scenarios | (a) | (b) | (c) | (d) | (e) | (f) | |
| Full job satisfaction (3 from the 0–3 scale) | own work recognition | 1.6339 **** | 0.095 **** | 0.2471 **** | 0.1198 **** | ||
| (dsv_recog4my_work) | (0.0118) | (0.0013) | (0.0013) | (0.0023) | |||
| workplace atmosphere | 1.6118 **** | 0.109 **** | 0.27 **** | 0.1882 **** | |||
| (colleag_good_atmosph) | (0.0125) | (0.0014) | (0.0016) | (0.0026) | |||
| Pseudo R-square | 0.3906 | 0.3981 | 0.4478 | 0.2436 | 0.2635 | 0.2882 | |
| AUROC | 0.886 | 0.8853 | 0.9094 | N/A | N/A | N/A | |
| Job satisfaction (2 or 3 from the 0–3 scale) | own work recognition | 0.1886 **** | 0.0594 **** | 0.3523 **** | 0.1192 **** | ||
| (dsv_recog4my_work) | (0.0011) | (0.0009) | (0.0013) | (0.0019) | |||
| workplace atmosphere | 0.122 **** | 0.0638 **** | 0.3992 **** | 0.3158 **** | |||
| (colleag_good_atmosph) | (0.0010) | (0.0007) | (0.0013) | (0.0020) | |||
| Pseudo R-square | 0.7037 | 0.752 | 0.8024 | 0.2227 | 0.2728 | 0.2835 | |
| AUROC | 0.9596 | 0.9698 | 0.9823 | N/A | N/A | N/A | |
| Max VIF | 1 | 1 | 6.18 | 1 | 1 | 6.18 | |
| Observations | 75,674 | 75,674 | 75,674 | 75,674 | 75,674 | 75,674 | |
© 2020 by the authors. Licensee MDPI, Basel, Switzerland. This article is an open access article distributed under the terms and conditions of the Creative Commons Attribution (CC BY) license (http://creativecommons.org/licenses/by/4.0/).
Share and Cite
Homocianu, D.; Plopeanu, A.-P.; Florea, N.; Andrieș, A.M. Exploring the Patterns of Job Satisfaction for Individuals Aged 50 and over from Three Historical Regions of Romania. An Inductive Approach with Respect to Triangulation, Cross-Validation and Support for Replication of Results. Appl. Sci. 2020, 10, 2573. https://doi.org/10.3390/app10072573
Homocianu D, Plopeanu A-P, Florea N, Andrieș AM. Exploring the Patterns of Job Satisfaction for Individuals Aged 50 and over from Three Historical Regions of Romania. An Inductive Approach with Respect to Triangulation, Cross-Validation and Support for Replication of Results. Applied Sciences. 2020; 10(7):2573. https://doi.org/10.3390/app10072573
Chicago/Turabian StyleHomocianu, Daniel, Aurelian-Petruș Plopeanu, Nelu Florea, and Alin Marius Andrieș. 2020. "Exploring the Patterns of Job Satisfaction for Individuals Aged 50 and over from Three Historical Regions of Romania. An Inductive Approach with Respect to Triangulation, Cross-Validation and Support for Replication of Results" Applied Sciences 10, no. 7: 2573. https://doi.org/10.3390/app10072573
APA StyleHomocianu, D., Plopeanu, A.-P., Florea, N., & Andrieș, A. M. (2020). Exploring the Patterns of Job Satisfaction for Individuals Aged 50 and over from Three Historical Regions of Romania. An Inductive Approach with Respect to Triangulation, Cross-Validation and Support for Replication of Results. Applied Sciences, 10(7), 2573. https://doi.org/10.3390/app10072573