Article

DC Microgrid System Modeling and Simulation Based on a Specific Algorithm for Grid-Connected and Islanded Modes with Real-Time Demand-Side Management Optimization

Sorbonne University, Université de Technologie de Compiègne, EA 7284 AVENUES, 60203 Compiègne, France
*
Author to whom correspondence should be addressed.
Appl. Sci. 2020, 10(7), 2544; https://doi.org/10.3390/app10072544
Submission received: 30 January 2020 / Revised: 3 April 2020 / Accepted: 6 April 2020 / Published: 7 April 2020
(This article belongs to the Section Energy Science and Technology)

Abstract

:
This paper presents an algorithm considering both power control and power management for a full direct current (DC) microgrid, which combines grid-connected and islanded operational modes, with real-time demand-side management optimization. The full microgrid is a hybrid dynamic system model consisting of two interacting parts: continuous-time dynamics and discrete-event dynamics. Such a full microgrid consists of photovoltaic sources, a DC load, battery storage systems, supercapacitor storage, a diesel generator, and a public grid connection, all connected on a DC common bus. This full microgrid is more reliable than a microgrid with only renewable sources or with only traditional energy sources, considering the power constraints imposed by the public grid as well as the sluggish dynamic of the diesel generator, self-discharging characteristic of the supercapacitor, and load shedding optimization. Meanwhile, this algorithm can automatically switch between grid-connected and islanded operational modes to optimize the power of the load shedding, take advantage of renewable energy, and keep the power balance in the full DC microgrid. The results under MATLAB/Simulink verify that the real-time control algorithm can maintain the power balance in real-time for the whole day and satisfy the power management strategy.

1. Introduction

To increase power supply efficiency and save costs, distributed renewable energy generation has been proposed. However, power generated using renewable sources is strongly influenced by weather, which produces intermittent power, and it cannot be directly used by the load and is also not easy to be fully stored. Thus, a microgrid becomes a good technology to solve the problem [1]. A microgrid is a power supply grid, which works in a small power range in comparison to a public grid. It can support decentralized power management and a liberalized electricity market to save wholesale costs [2,3].
Renewable energy sources such as photovoltaic (PV) sources can directly produce direct current (DC) power to supply most electric appliances, and a DC microgrid [4,5] can increase the efficiency of the power supply by decreasing the number of AC/DC converters. A hybrid microgrid can satisfy different electric appliances, but it is complex to control and to keep power balanced [6,7].
According to the system architecture, microgrid control can be divided into decentralized control and centralized control, which can reach the same goal in different ways. However, decentralized control has an intrinsic advantage in flexibility. An example of decentralized control is using the multi-agent system [8,9] consisting of many intelligent agents, which are composed of different architectures with different goals and communicate with each other to reach global goals [10]. As a classic control method, centralized control can make a power supply system comply with the design in detail [11,12].
In order to distribute the power well to keep the power balanced among every component, power management for self-consumption, including source management, storage management, and load management, plays an important role in a microgrid with a fast calculation time. Mostly, renewable energy sources have the innate characteristic of intermittent power generation due to severe changes of the weather condition, which leads to difficult power generation and usage. Thus, reference [13] proposes a comprehensive control and power management system for PV-battery-based hybrid microgrids to be successful in regulating the DC and AC bus voltages and frequency stably for systems automatically under different operating circumstances, regardless of disturbances from switching operating modes and fluctuations of irradiance and temperature. However, the battery is regarded as storage that has a limited capacity, and limited charging and discharging current, which can lead to renewable power shedding, resulting in reducing the renewable energy usage rate. Thus, the public grid is mostly considered as an important power exchange interface to sell/buy power from the microgrid to achieve a low-cost operation between the microgrid and the public grid. The biggest advantage is the ability to achieve a low-cost power network grid when the multiply microgrid can be linked. Reference [14] developed a power control and management technique based on the bus signaling method to govern sources, storage, and loads to achieve effective coordination and energy management between microgrids. When the local public grid is not available or broken, the battery and renewable energy sources cannot afford the load demand power, and a backup source can be the emergency power source to support the important load. In [15], a dynamic power management scheme is proposed for a standalone hybrid AC/DC microgrid, which constitutes a PV-based renewable energy source, a proton exchange membrane fuel cell as a secondary power source, and a battery and a supercapacitor (SC) as hybrid energy storage to satisfy the different power exchange. In [16], the authors present a battery energy management system for a microgrid, in which PVs and diesel generators (DG) are the primary sources of electricity; the novelty of the proposed battery energy management system lies within the energy management of multiple types of batteries’ characteristics and the reduction of the DGs’ operating hours simultaneously. However, demand-side management does not consider the characteristics of every load demand and the available power, so it cannot give a good power service for users. Paper [17] presents a mathematical model of smart loads in demand-response schemes that is integrated into centralized unit commitment. The goal is to obtain an optimal power flow coupled with an energy management system for isolated microgrids for optimal generation and peak load dispatch. The smart loads are modeled with a neural network load estimator as a function of the ambient temperature, time of day, time of use price, and the peak demand imposed by the microgrid operator. However, the power management above only considers part of the sources, storage, and load management. Thus, it is imperative to propose a complete power microgrid management system considering the constraints of all the physical components to achieve safe and long-life equipment.
The contributions of this paper mainly involve three points: this paper proposes an algorithm for both power control and power management of a full DC microgrid; the constraints of all physical components are considered in the full microgrid; a real-time load shedding optimization method is applied. The three points are described in detail below:
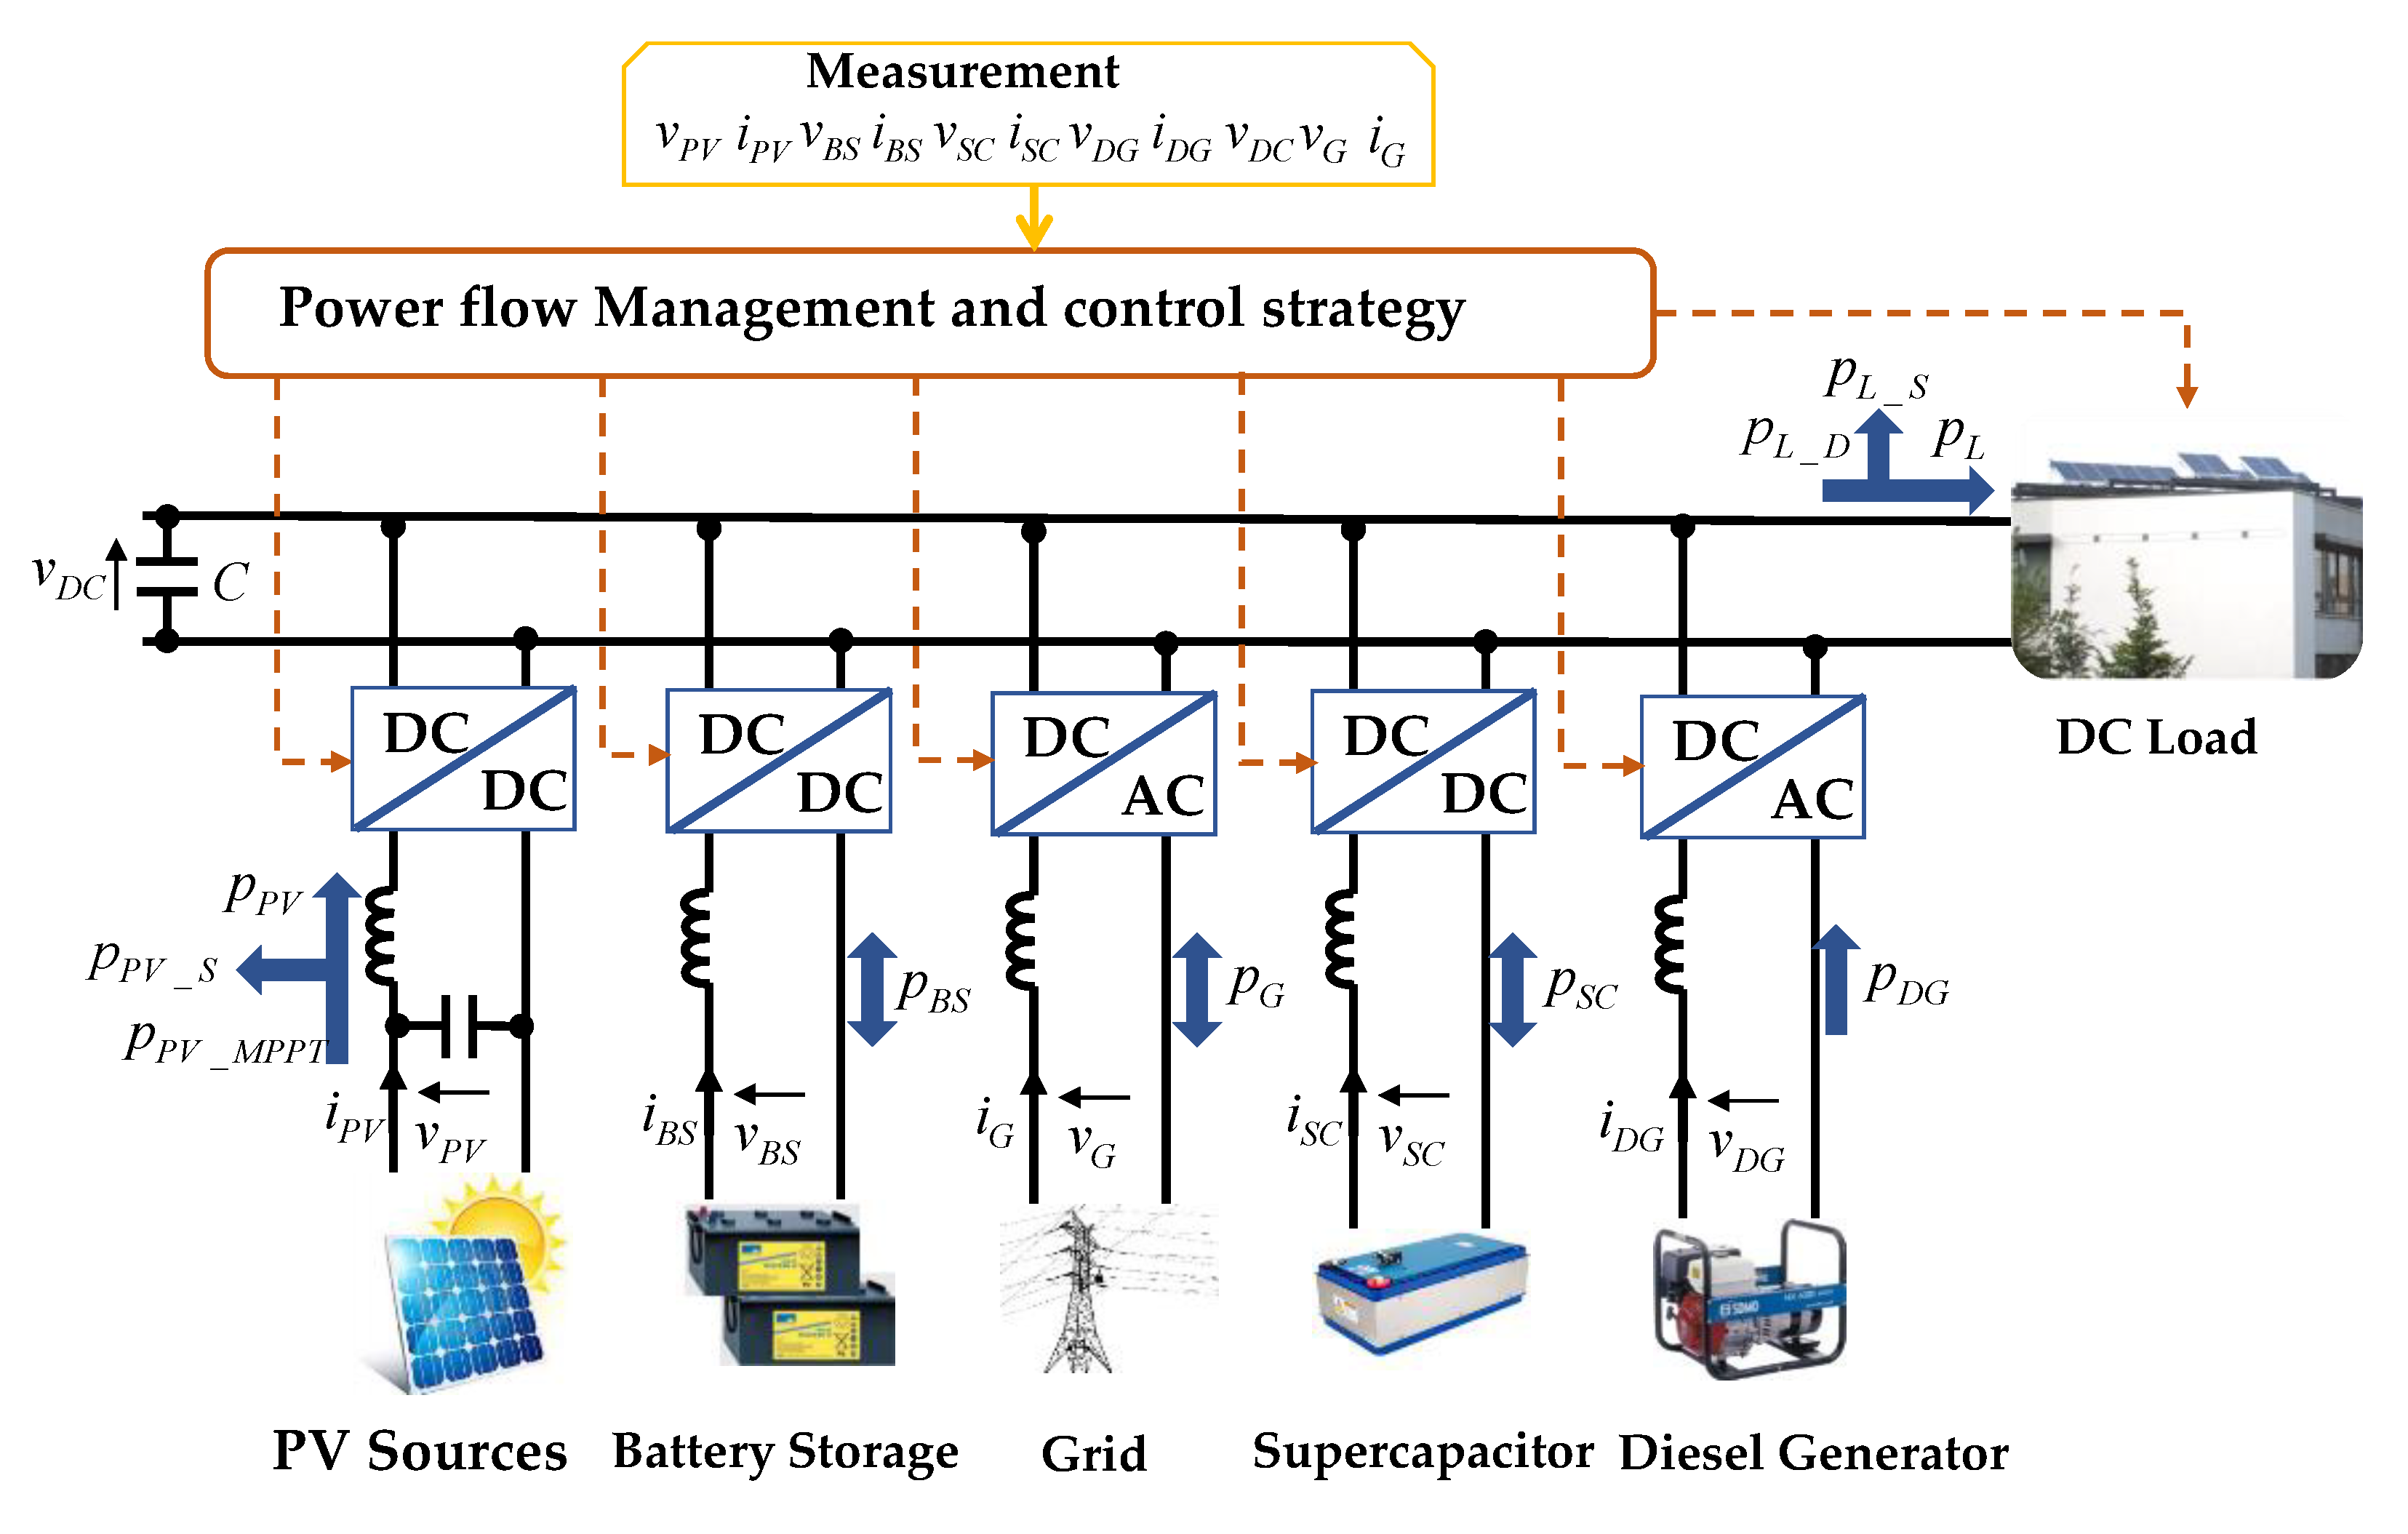
  • This paper proposes an algorithm for both the power control and power management of a full DC microgrid building, integrated under the ruled based decision according to non-linear system modeling. The produced energy is dedicated to the self-consumption of the building’s electrical appliances, aiming to reach the maximal usage rate of renewable energy and to reduce the usage of the public grid. A battery storage (BS) system, a single phrase public grid connection, a group of PV panels, a DG-like backup source, an SC, and a load seen like a group of pre-defined controllable appliances are integrated into the full DC microgrid. The BS and the public grid can be the controllable sources to supply power deficiency and to absorb the excess power during the on-grid operation of the full DC microgrid. Furthermore, the BS has a higher priority than the public grid to supply the full DC microgrid, which can reduce the stress on the public grid by making full use of the local BS. The DG can make the microgrid more reliable in cases of a high load demand, insufficient PV power generation, exhausted BS power, and low power limitation or failure of the public grid.
  • The constraints of PV sources, public grid, BS, DG, and SC are considered and defined according to the mathematical modeling of each component. The PV production capacity is considered according to the maximal load demand, and the PV power constraints can make it work at two operation modes: PV maximum power point tracking (MPPT) mode and the PV power shedding mode. The BS is constrained by its power limitation and state of charge to keep it working normally and safely for a long lifetime. The public grid is constrained by the power limitation received from the public grid distribution system operator to increase the stability and thus to reduce the cost. The DG can be turned on and turned off, respecting the constraints of its rated power and a duty time cycle, aiming to protect its lifetime and to reduce the usage and energy cost. The low dynamic power during the DG start-up can lead to power deficiency in the microgrid and this power is compensated for by the SC. The SC is limited by its state of charge and power to keep its lowest power to compensate for the DG. The SC can operate at power charging mode, power discharging mode, or self-discharging mode.
  • A real-time load optimization method is applied in this paper. The controllable load is controlled by the user and the microgrid operator. The user can randomly turn on the load when the user needs the load to work. The microgrid power control decides automatically and optimally the load state by using the real-time load optimization algorithm based on the load priority, load time constraints, and load power characteristics. Moreover, the load optimization algorithm can operate in real-time to increase the decision efficiency, as well as to provide adequate time for the convergence time of the local controller.
The rest of this paper is organized as follows. The full DC microgrid modeling is presented in Section 2. The specific algorithm for power control and power management is described in Section 3. The performance of the algorithm is verified using simulation, and the results and analyses are discussed in Section 4. The conclusions are given in Section 5.

2. Full DC Microgrid System Modeling

The DC microgrid system assumes PV sources as renewable energy sources. Due to the characteristic of the intermitted PV power generation, a BS system is added. The DC microgrid system also assumes the power exchange with the public grid to sell or buy the renewable power. If the BS and the public grid cannot deal with the problem of deficient PV power generation, load shedding will occur, and the worst condition is the critical load to be shed. Thus, the backup source DG is necessarily assumed to connect with the proposed DC microgrid system. The DG starts operating thanks to the SC power that compensates for the DC bus-required power. The load is assumed to be controllable by both the user and the microgrid operator. Moreover, the optimization real-time algorithm based on the optimal load combination considering the load characteristics will achieve load optimization. A power management strategy is assumed to manage the power flow aiming to achieve the power balance between power generation and power consumption considering the physical constraints of each component.
The physical components of a DC microgrid are shown in Figure 1. It consists of PV sources, a BS system, a public grid connection, a DG, an SC, and a DC load. All parts are connected to the common DC bus of the microgrid through their power converters. In order to simplify the DC microgrid system, the converters’ efficiency is not considered in the power management strategy.

2.1. Microgrid System Modeling

To keep the power balance and common DC bus voltage stable, a proportional-integral (PI) controller is introduced to calculate the power needed to be compensated for by the public grid and BS for the on-grid operating mode and by the DG and BS for the off-grid operating mode. The power balance expressed by Equations (1)–(3) is introduced to keep the common DC bus voltage v D C at the reference voltage represented by v D C . The stability of the v D C represents the power quality to supply the DC load directly. One notes that the load can also be assumed, such as a predefined load integrated with the DC/DC or DC/AC converter.
Δ p = p P V p L p P I
p P I = K P ( v D C v D C ) + K I ( v D C v D C )
Δ p = p B S + p G p D G + p S C
where p P V is the power of PV sources; p L is the DC load power; K P and K I are the PI controller coefficients; Δ p is the compensation power by the public grid, BS, DG, and SC; p G is the public grid power, which represents the power injection when p G is positive and the power supply when p G is negative; p B S is the storage power that represents BS charging when p B S is positive and BS discharging when p B S is negative; p D G is the DG supply power which is only zero or positive; p S C is the SC power that represents SC charging when p S C is positive and SC discharging when p S C is negative.
In Equations (1) and (2) the PV sources generate power, the load consumes the power from the PV, and the PI controller power keeps the common DC bus stable. The excess or insufficient power Δ p is compensated for by the public grid, BS, DG, and SC in Equation (3). When Δ p is positive, representing that the PV sources generate excess power in Equation (1), the excess power should be injected into the BS, the public grid, or the SC in Equation (3). When Δ p is negative, representing that the PV power generation is not enough to supply the load and to compensate for the common DC bus in Equation (1), the insufficient power should be supplied by the public grid, BS, DG, and SC in Equation (3). The DG only supplies power, therefore, the p D G should be subtracted in Equation (3).

2.2. PV Sources

The PV model comes from [18], where mathematical modeling of a PV source is introduced. To gain the most economic benefits, the PV source should be driven by an MPPT method [7]. To reach the maximum power point, searching algorithms are required, and the mostly used are the perturb and observe algorithm and the incremental conductance algorithm. Furthermore, when the PV power is more than the microgrid needs, the system will not be stable and the devices will be broken if outside of their tolerances. Thus, a limit controller is proposed in [7], whose goal is to operate PV shedding in case the PV power generation is above the consumption of the microgrid. Thus, the PV sources can operate in two modes as in Equation (4): PV maximum power point mode and the PV power shedding mode.
p P V = p P V _ M P P T p P V _ S
where p P V _ M P P T is the maximum power of PV at the current weather condition and p P V _ S is the shed power of PV. One notes that the p P V _ S cannot be greater than the p P V _ M P P T , and the p P V is always positive, representing the fact that the PV can only generate power.

2.3. Public Grid Connection

The public grid is a large-scale and complex power supply system. In a microgrid, the public grid connection is seen as a source that can supply or absorb power representing buying or selling from/to the microgrid. To reduce the negative impact on the public grid induced by the intermittency of the PV sources, the distribution system operator may introduce power limitations in real-time for the power injection and power supply, as in Equation (5):
P G _ M A X p G ( t ) P G _ M A X
where p G is the public grid power, which represents the power injection when p G is positive and power supply when p G is negative. The public grid power injection is limited by P G _ M A X . The public grid power supply is limited by P G _ M A X . Therefore, when the public grid power injection and power supply are limited, it is required to operate the load shedding or PV shedding when the public grid reaches its limitations.

2.4. Battery Storage System

The BS system can supply and absorb power to keep the microgrid power balance. Due to low cost and a high recycling rate, a lead-acid battery is most commonly used in a small power microgrid. To avoid over-charging and over-discharging, it is necessary to limit its state of charge represented as s o c B S . The s o c B S is calculated according to Equation (6), where C R E F is the BS reference capacity, v B S is the BS voltage, and s o c B S is limited between S O C B S _ M I N and S O C B S _ M A X as in Equation (7). The BS power noted as p B S represents BS charging when p B S is positive and BS discharging when p B S is negative. The BS charging and discharging powers are limited by P B S _ M A X and P B S _ M A X respectively, as in Equation (8), to protect the BS from operating at a large current state.
s o c B S ( t + Δ t ) = s o c B S ( t ) + 100 % 3600 C R E F v B S t t + Δ t p B S ( t ) d t
S O C B S _ M I N s o c B S ( t ) S O C B S _ M A X
P B S _ M A X p B S ( t ) P B S _ M A X

2.5. Diesel Generator and Supercapacitor

DG is a backup source that can provide long-term support for the microgrid. However, the DG start-up stage presents slow dynamic behavior. Therefore, during the period of the DG starting up, an SC has been suggested to compensate for the power balance because of its fast response and high-power density [19,20]. In addition, it is assumed that the DG works at duty cycle mode as in [21], where the duty cycle mode is proved to be better than a load-following mode, and one-hour is proposed as a good trade-off between fuel consumption and start-up frequency. The DG power p D G is limited by the maximal DG supply power P D G _ M A X , as given in Equation (9). Due to the slow dynamic behavior of the DG start-up stage, the DG cannot support the microgrid until it satisfies the conditions expressed by Equation (10), which can also prevent the converter from being broken by the peak power of the DG start-up stage. During the period between DG start-up and DG stable state given by Equation (10), the SC compensates the microgrid to keep its power balance.
0 p D G ( t ) P D G _ M A X
{ 310   V < v < 340   V 48   Hz < f D G < 52   Hz
The SC power p S C is limited to its maximal SC charging power P S C _ M A X and maximal SC discharging power P S C _ M A X , as in Equation (11). The energy of SC E S C is calculated according to SC capacitance C S C and SC voltage v S C as expressed by Equation (12). The E S C ( t ) and E S C _ R a t e d provide the s o c S C ( t ) , which can be simplified as in Equation (13).
P S C _ M A X p S C ( t ) P S C _ M A X
E S C = C S C v S C 2 2
s o c S C ( t ) = E S C ( t ) E S C _ R a t e d = C S C v S C 2 ( t ) 2 C S C v S C _ R a t e d 2 2 = v S C ( t ) v S C _ R a t e d 100 %
As to the SC model given in [19], the SC is naturally self-discharging. It should be recharged at a certain time to keep its lowest energy for DG start-up compensation, and thus, it is necessary to define the SC recharge period. Therefore, the following SC state of charge s o c S C limitations are introduced: S O C S C _ M I N _ M I N , S O C S C _ M I N _ M A X , S O C S C _ M A X _ M I N , and S O C S C _ M A X _ M A X . When PV power is enough for load power demand, the recharging start-time and recharging end-time are the time when s o c S C reaches S O C S C _ M A X _ M I N and S O C S C _ M A X _ M A X , respectively. The s o c S C minimal limitation for the SC is S O C S C _ M I N _ M I N and the s o c S C minimal limitation for DG start-up compensation is S O C S C _ _ M I N _ M A X . When PV power is insufficient for load demand power, the recharging start-time is the time when s o c S C reaches S O C S C _ M I N _ M A X , which can keep the SC energy supporting the DG start-up.

2.6. DC Load

The DC load power changes according to the demand of the electrical appliances of buildings. Therefore, in order to operate the demand-side management, i.e., to allow load shedding optimization, it is necessary to assign the priority of each electrical appliance, to define the time duration of load shedding, and to define the power based on the real electrical appliances and critical loads. The purpose is to define the load power closing to the real load power by applying a load shedding real-time optimization [22], which is described in detail in [23] and is formulated to the load optimization problem based on the knapsack problem and solved using mixed-integer linear programming with IBM CPLEX [24]. The load power p L and the load shedding power p L _ S are given respectively by Equations (14) and (15), where p L _ O P T is the load power after the load real-time optimization, p A V A I L is the total DC microgrid available power, and p L _ D is the load demand power.
p L = { p L _ O P T   i f   p A V A I L < p L _ D   p L _ D   i f   p A V A I L p L _ D
p L _ S = p L _ D p L
The coefficient k L _ C R I T represents the percentage rate defined by the user as the minimum amount of load power demand that must be attended; it is defined by the p L _ C R I T and Equation (16) where p L _ C R I T is the minimum power of load demand that must be attended.
k L _ C R I T = p L _ C R I T / p L _ D ,   k L _ C R I T [ 0 % , 100 % ]

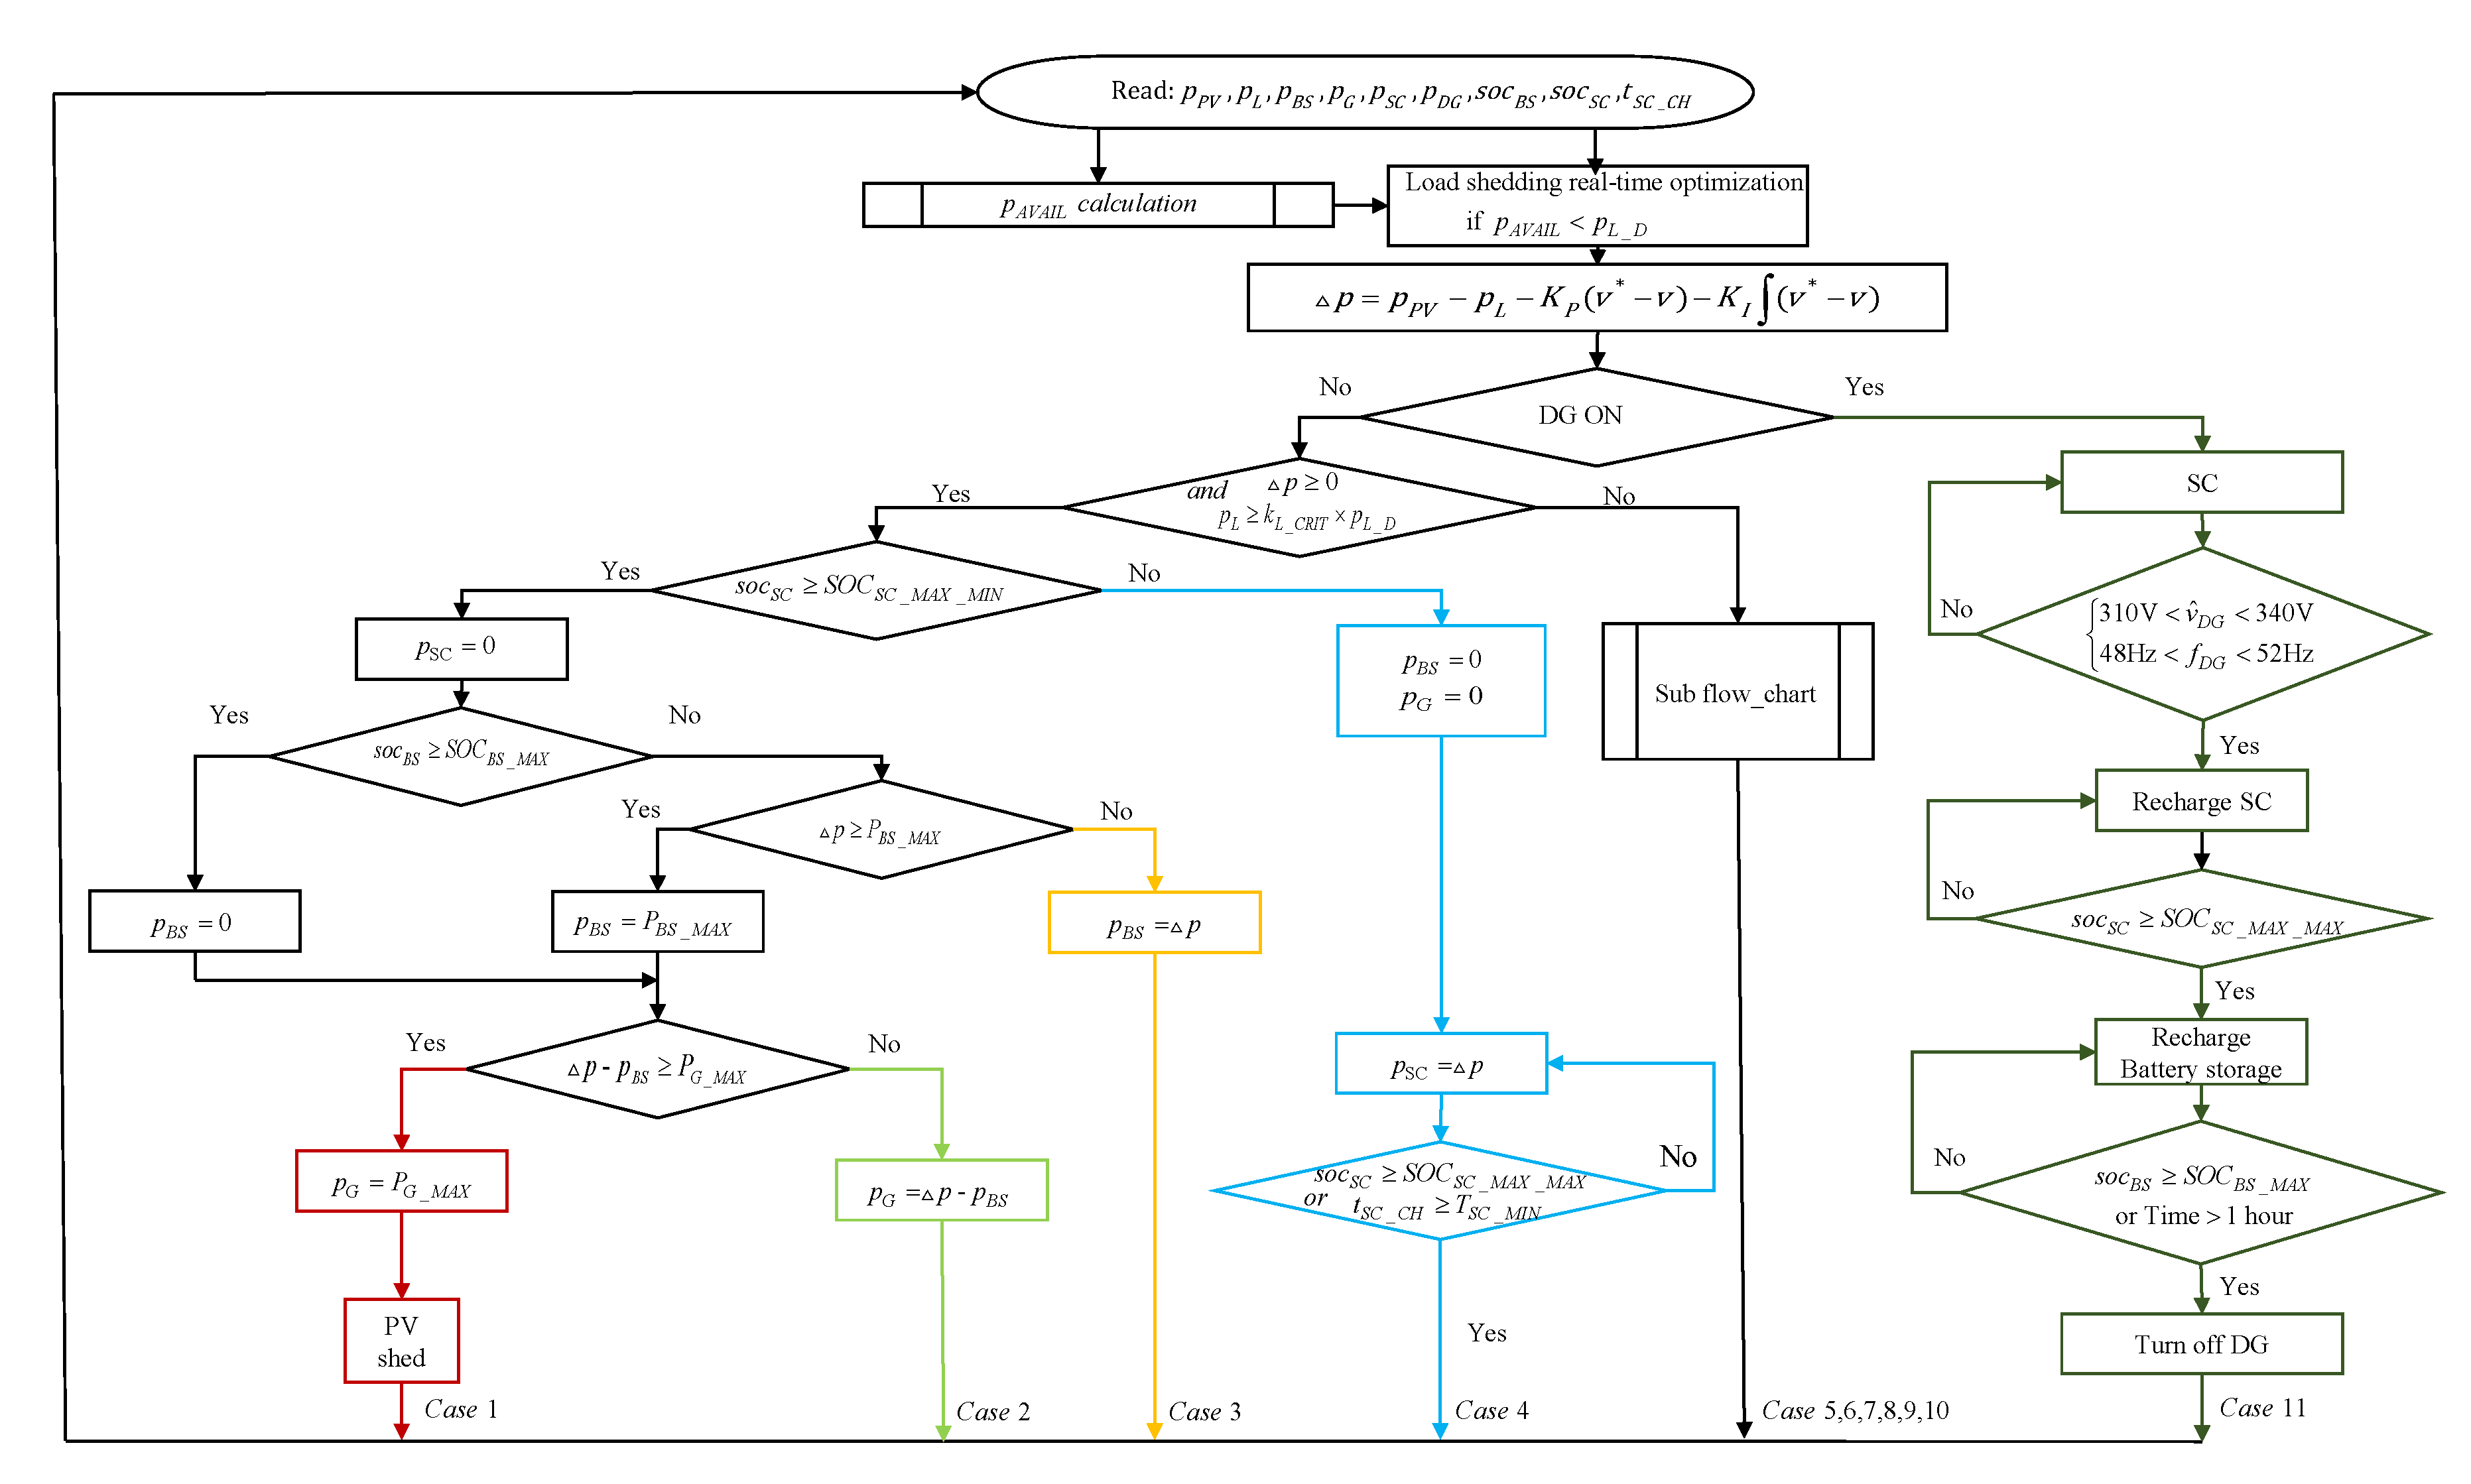
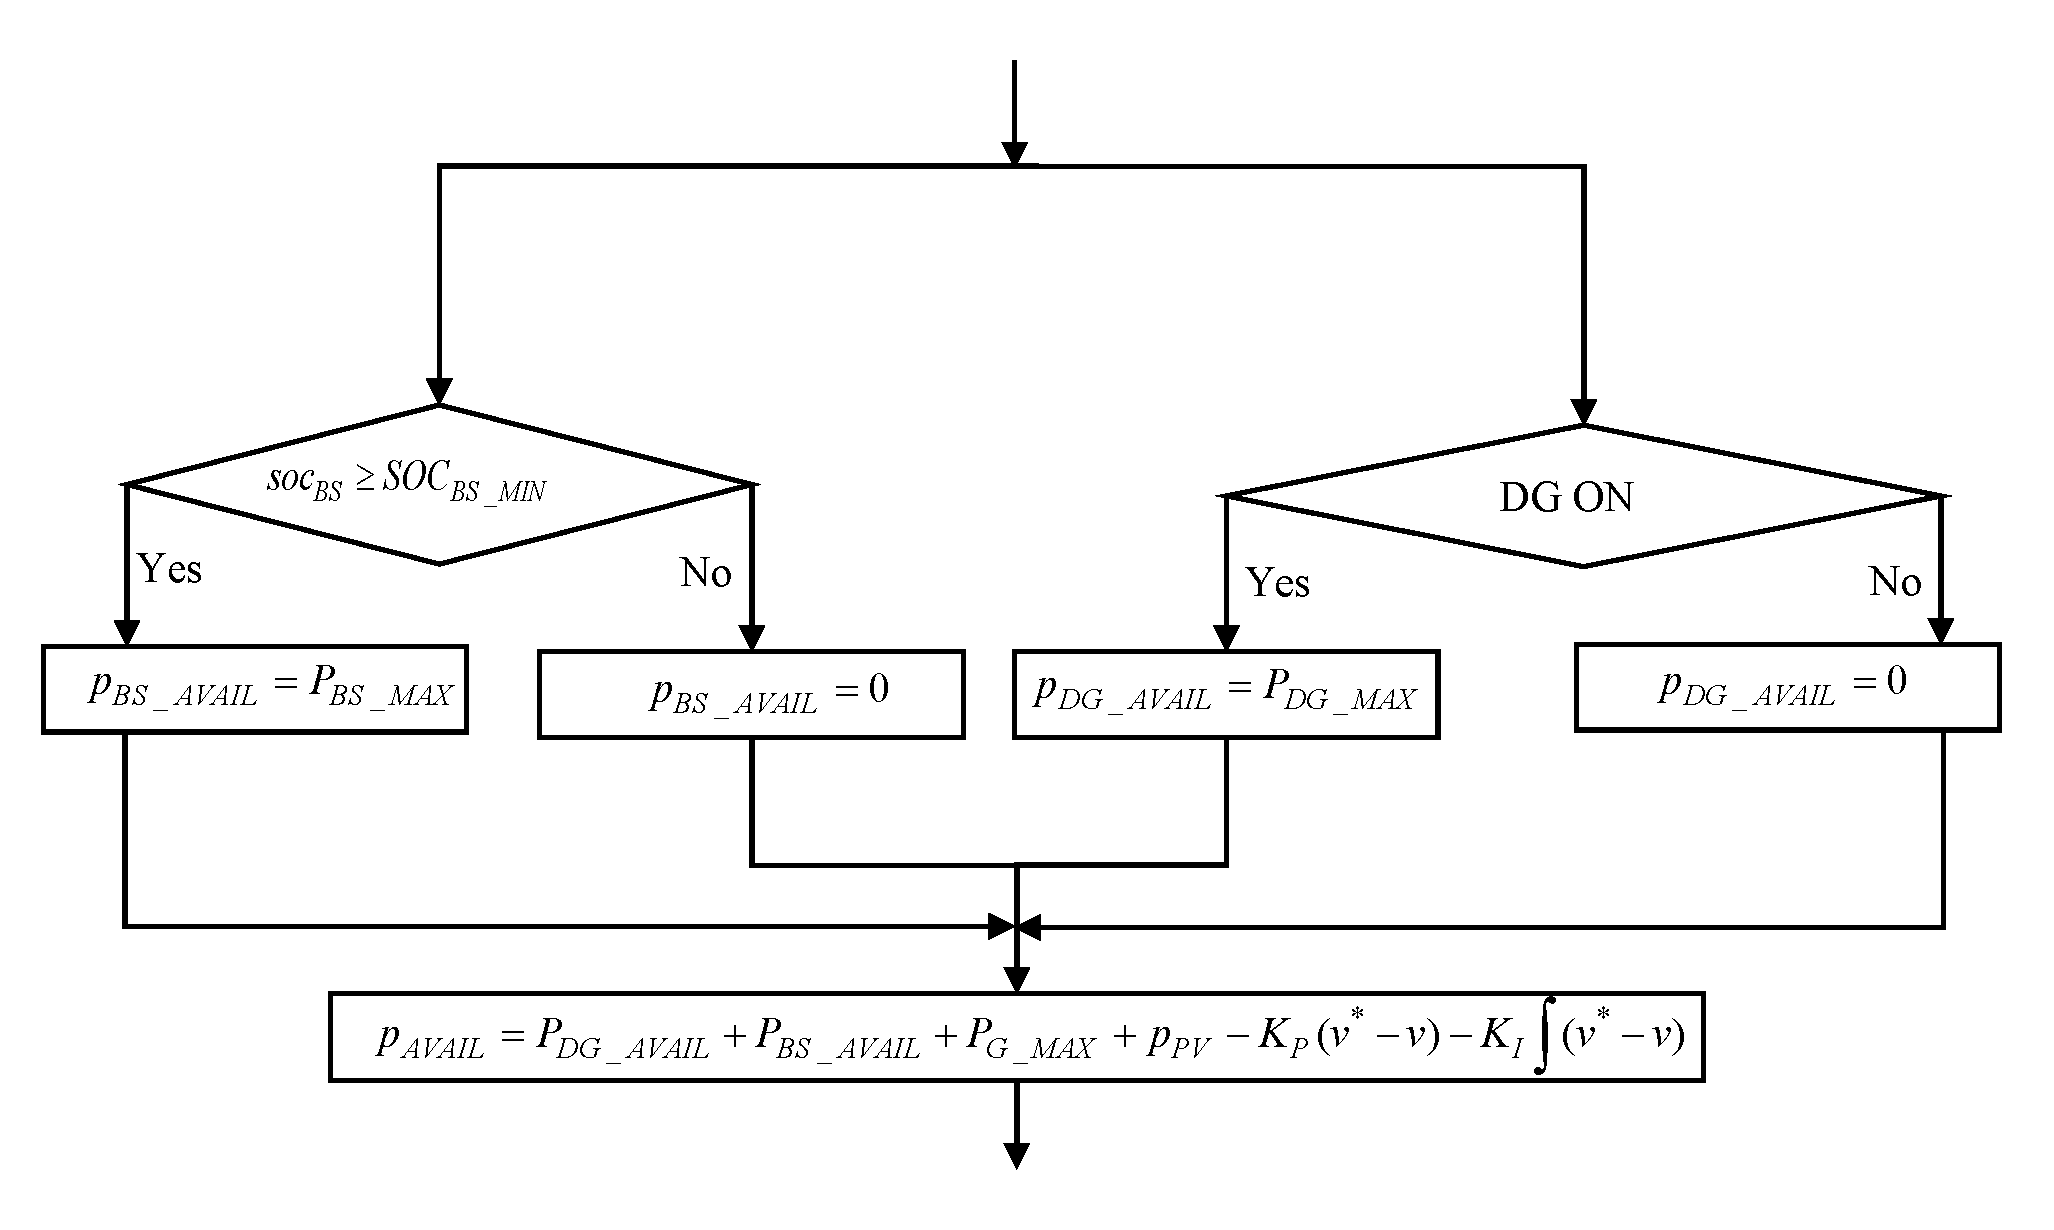
3. Algorithm for Power Control and Power Management

The algorithm for the power control operating simultaneously with the power management is presented in Figure 2, Figure 3, Figure 4 and Figure 5. The available power block is given in Figure 3. The power management is introduced with the power control flowchart to provide a high running rate for real-time power management, and complex computation is avoided due to the computation time. Therefore, the power of the described full DC microgrid can be balanced in real-time by running the proposed algorithm. In order to present optimal load demand management, this algorithm for power control and power management integrates a load optimization algorithm, which can run in real-time to decide the optimal load management. In order to forbid the BS from directly selling power to the public grid, the power management algorithm is designed respecting the following rules: the public grid can sell power to support the load demand, the BS, and the SC; however, the public grid can only buy the PV-generated power.
In Figure 2, Figure 4, and Figure 5, the inputs of the algorithm are the power measurement value and real-time estimated value; the output is the controller reference values for the PV sources, the BS, the public grid, the DG, and the SC. In Figure 5, there are two sub-flowcharts, a and b, which can operate at different periods. The load optimization runs in real-time according to Equation (14). The available power is calculated according to the BS available power p B S _ A V A I L , the DG available power p D G _ A V A I L , the public grid available power, and the common DC compensated power in Figure 3. The public grid available power equals p G _ M A X . The proposed power management consists of 11 cases, which are detailed in the following sections of this paper.

3.1. Case 1, 2, 3, 4

Case 1, case 2, case 3, and case 4 happen when Δ p is positive, representing that the power of the PV supply is more than the sum power of the load demand and common DC bus compensated power; meanwhile, p L is more than its critical load. In case 1, case 2, and case 3 Δ p can be distributed by the BS and public grid. The BS has a higher priority than the public grid in the power compensation of the microgrid. When the BS and public grid are both limited to their limitations, PV shedding happens in case 1. The BS and public grid can support the Δ p in case 2 and case 3 under their limitations. The SC recharging is triggered by the s o c S C in case 4. When the SC starts recharging, the Δ p is the SC recharging power. The SC cannot stop recharging until s o c S C reaches S O C S C _ M A X _ M A X or the SC recharging time, t S C _ C H , is more than its minimal value T S C _ M I N . The two conditions also keep the SC working during this period to avoid the converters working at low efficiency.

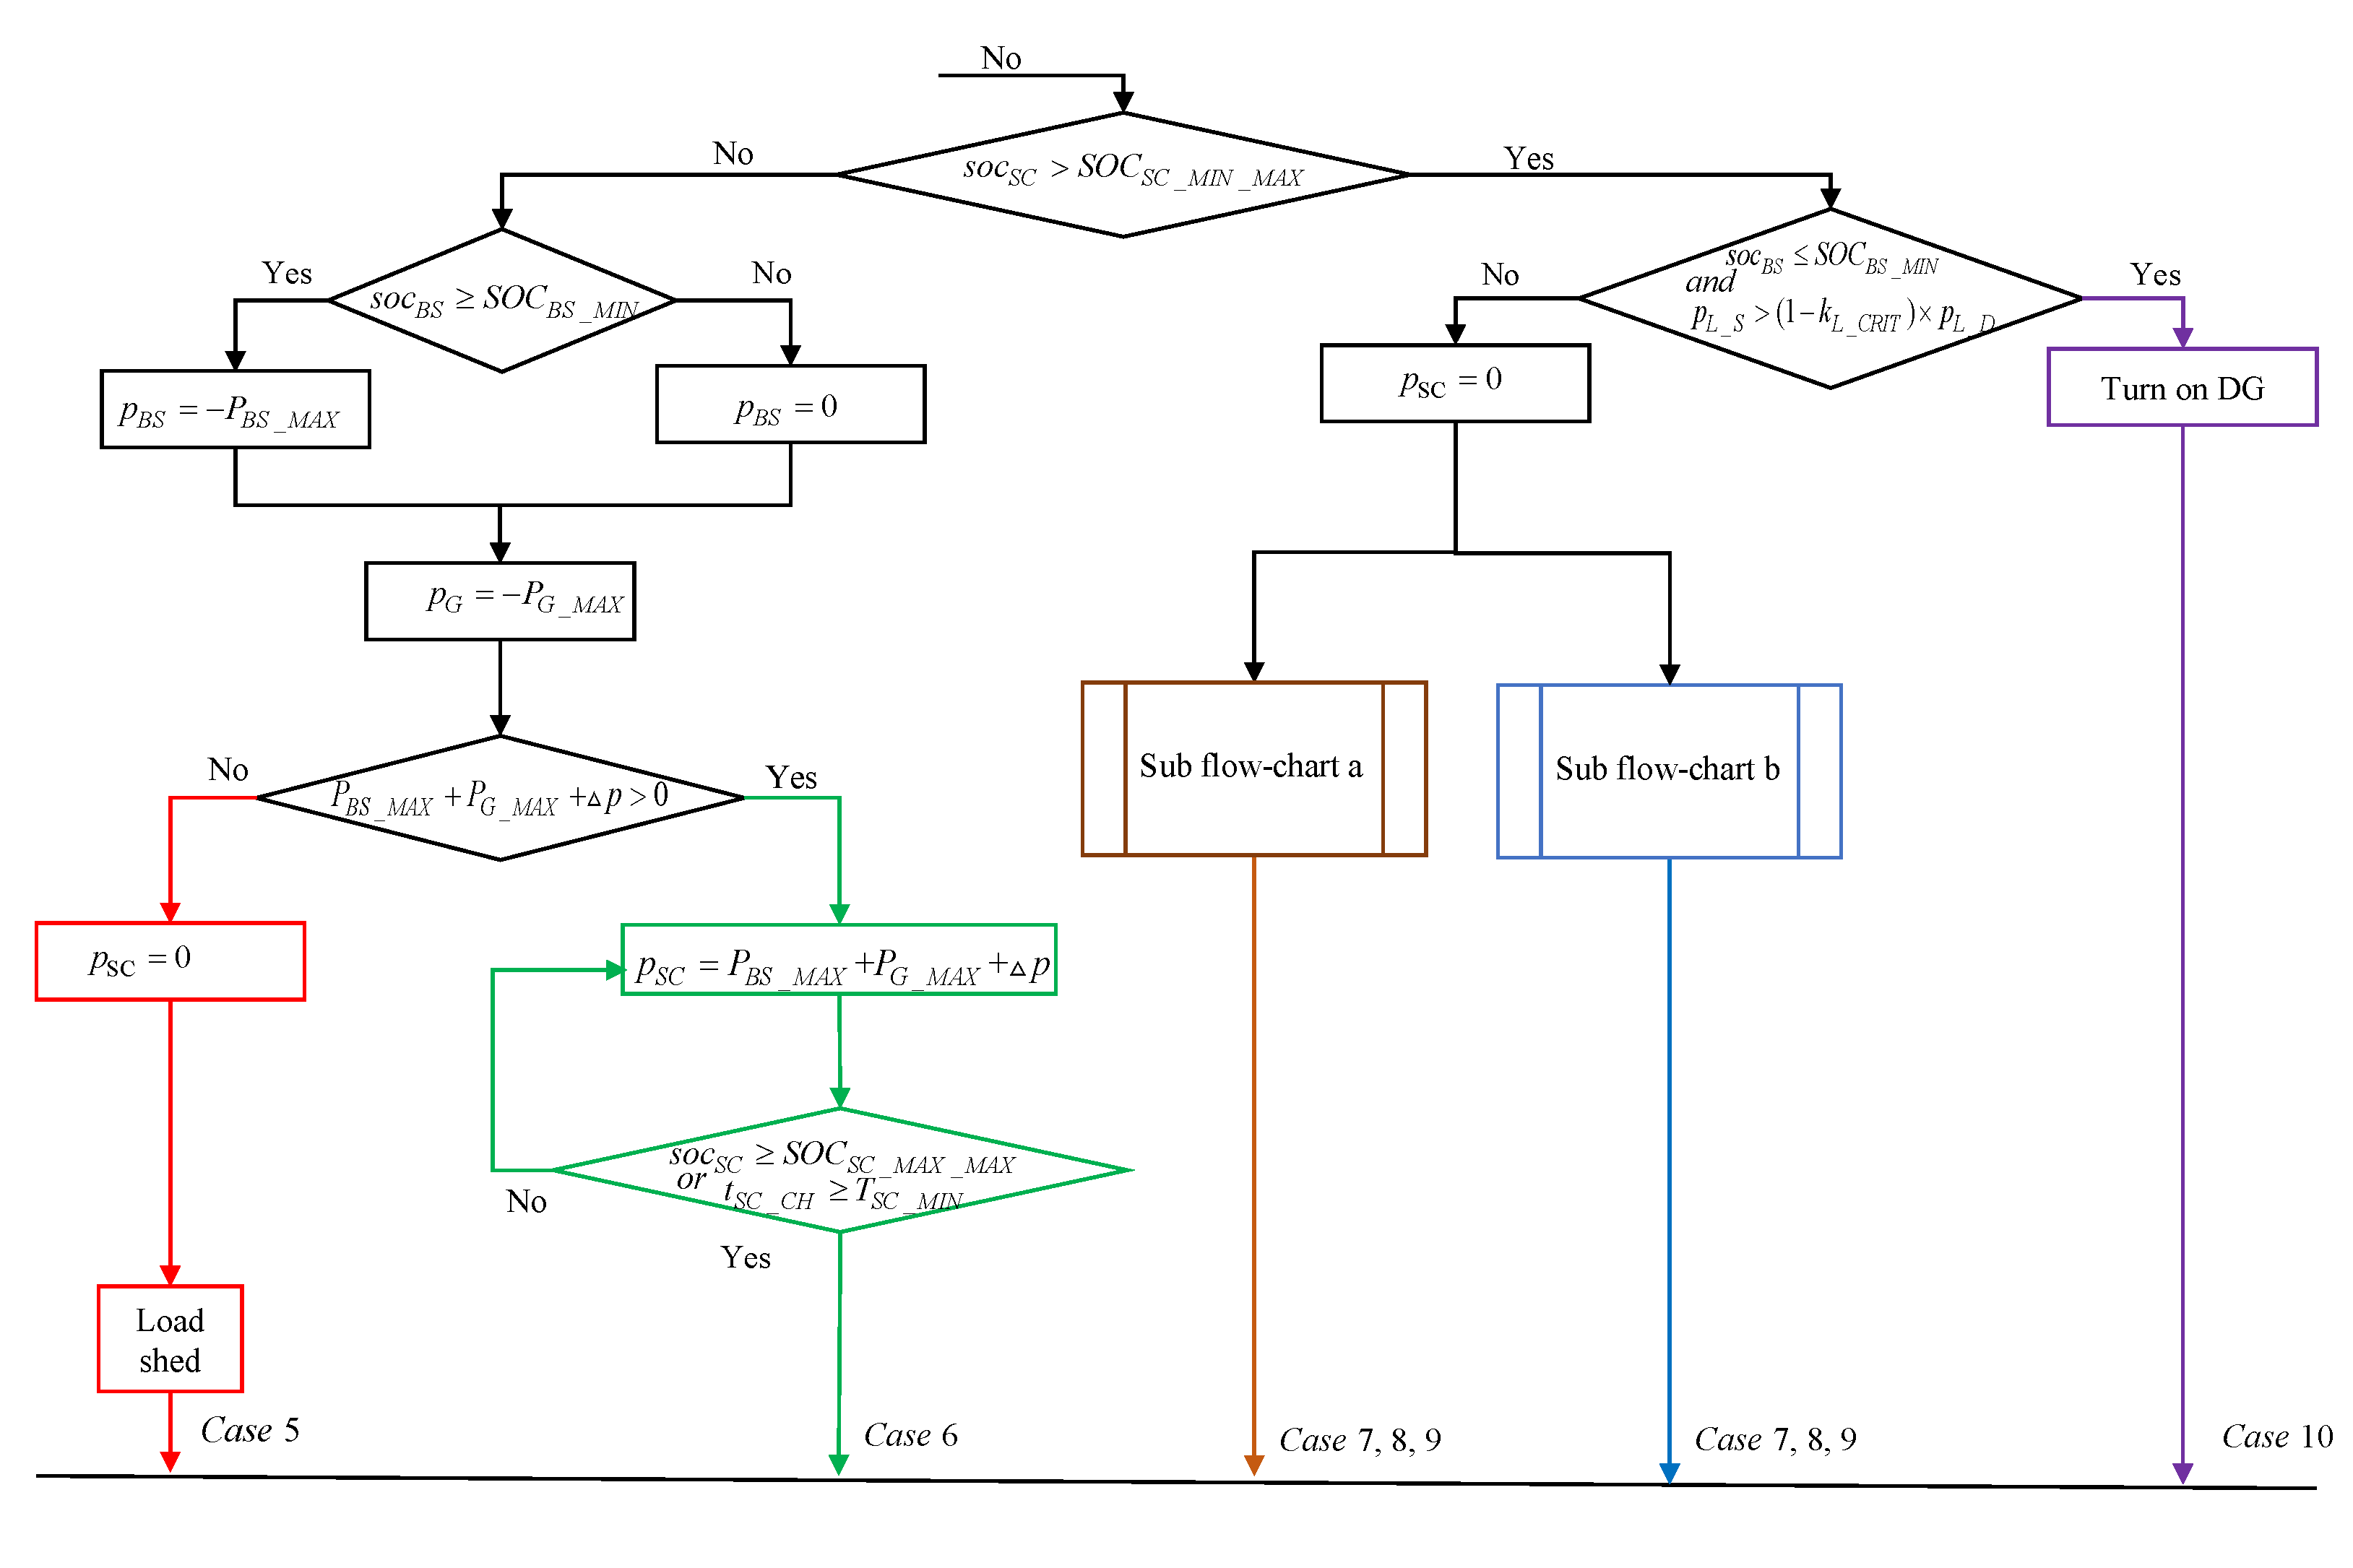
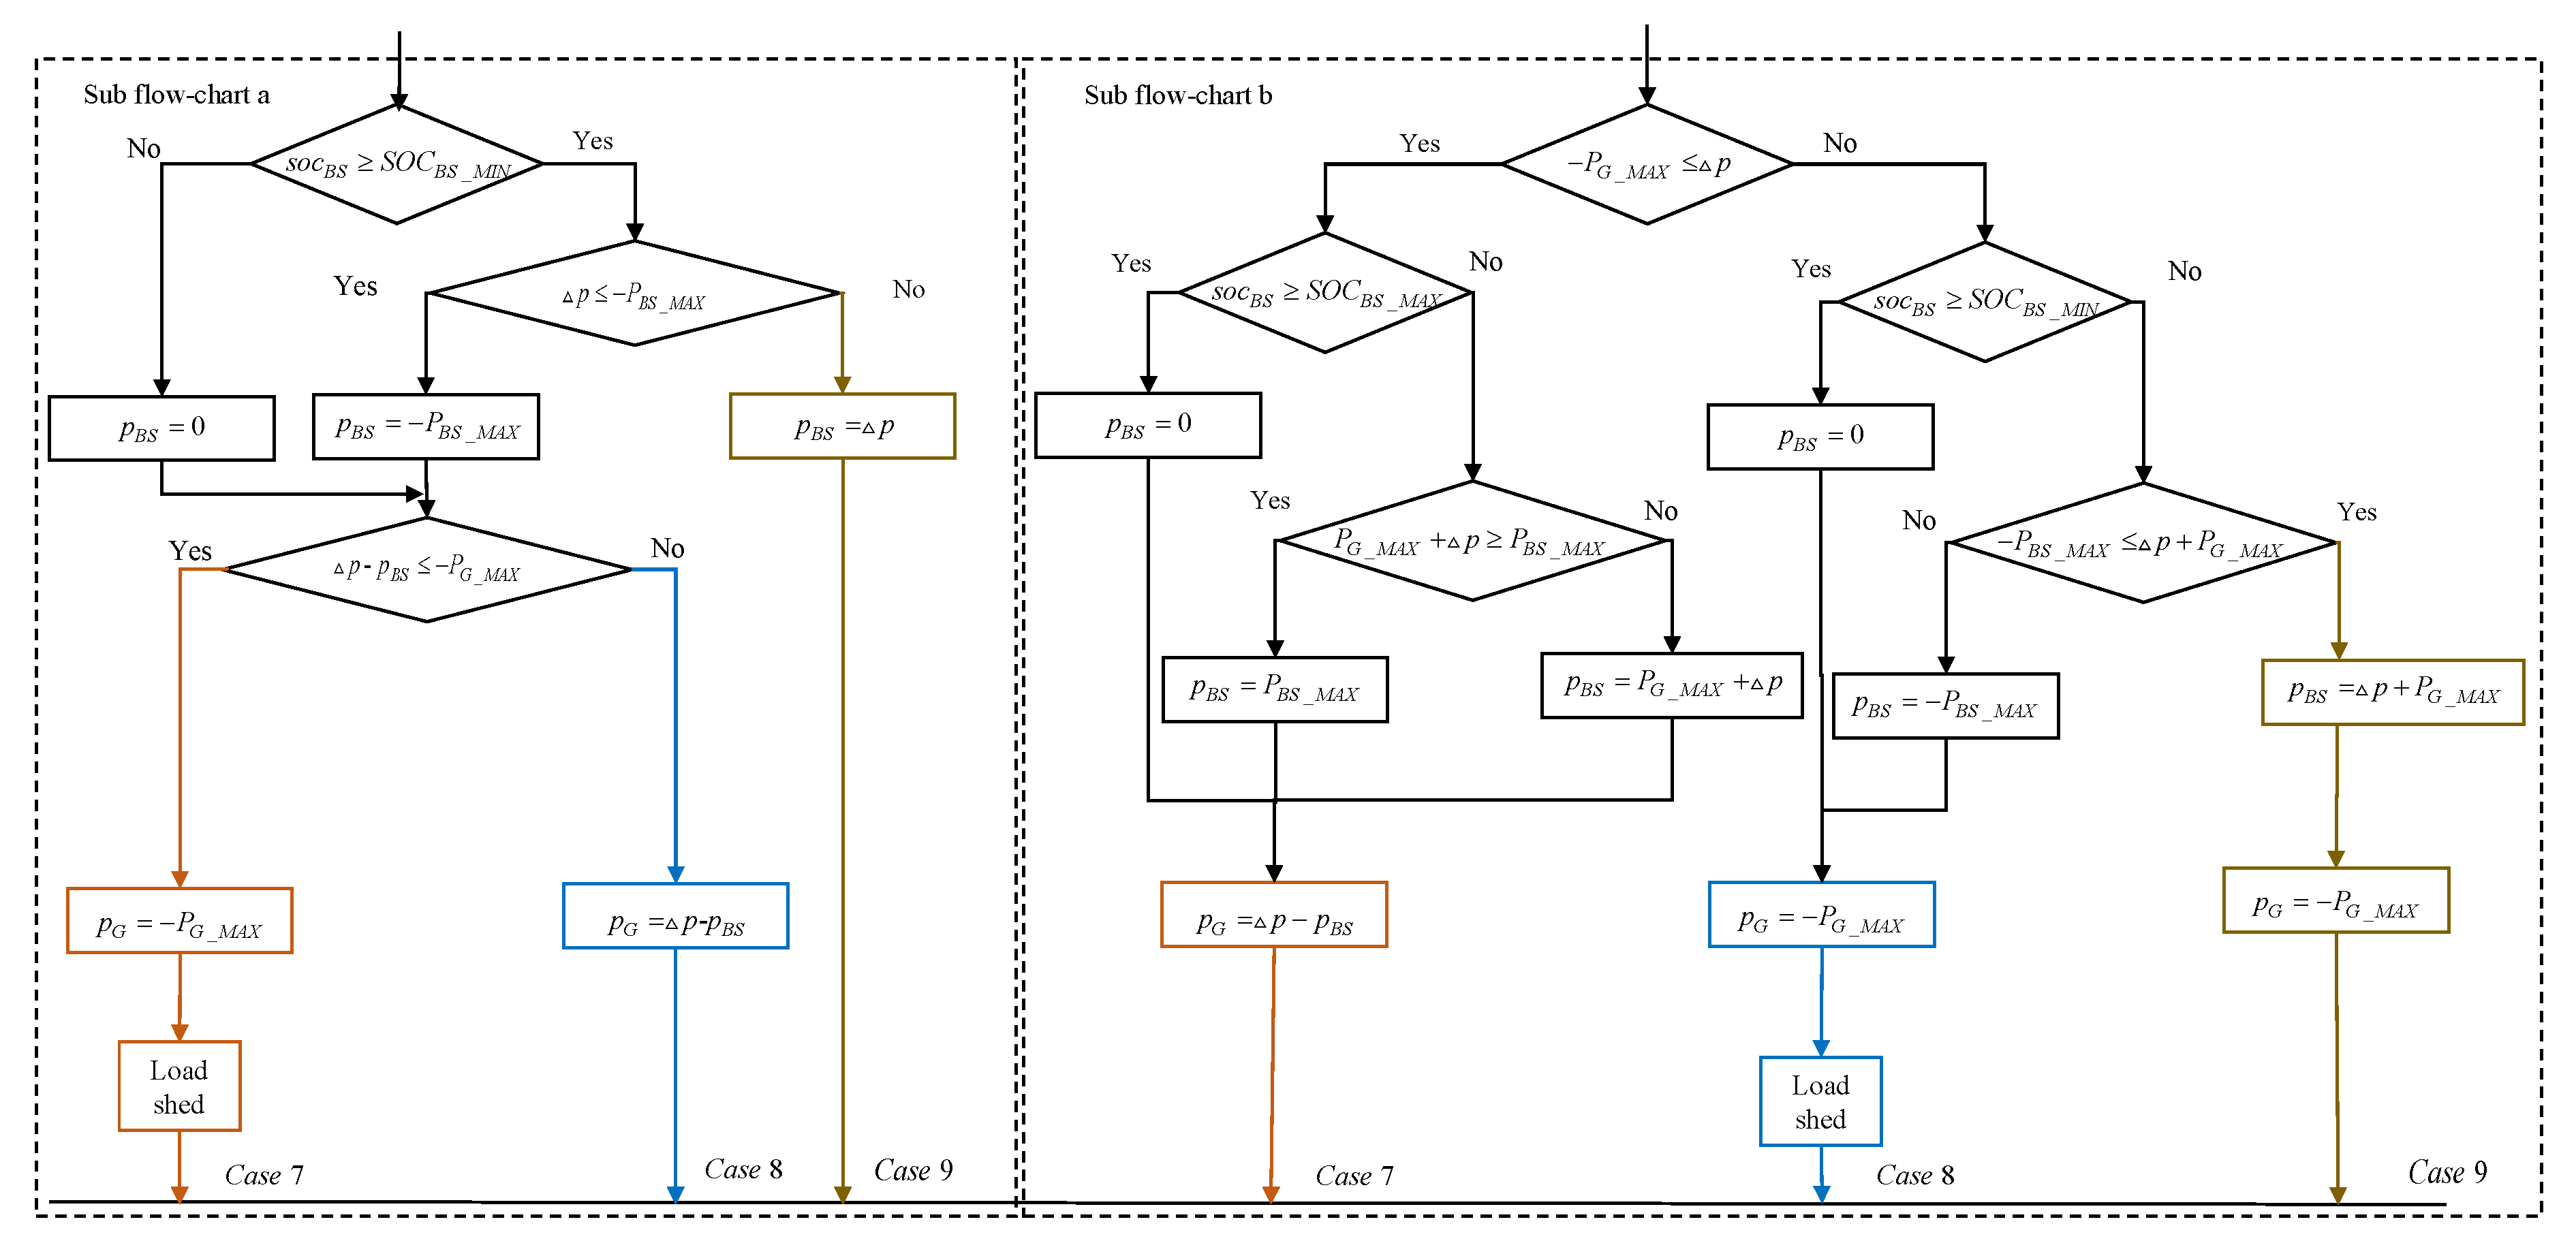
3.2. Case 5, 6, 7, 8, 9, 10

Case 5, case 6, case 7, case 8, case 9, and case 10 happen when Δ p is negative or p L is less than its critical load. The start-time of SC recharging is decided by s o c S C . When s o c S C is less than S O C S C _ M I N _ M A X , the SC starts recharging. The BS and public grid can support the SC recharging and p L _ D under their limitations in cases 5 and 6. Load shedding happens in case 5 when the BS and public grid can support p L _ D . The SC cannot stop recharging until s o c S C is more than S O C S C _ M A X _ M A X or the SC recharging time, t S C _ C H , is more than its minimal value T S C _ M I N . In case 7, case 8, and case 9 of the sub flow-chart a, Δ p can be distributed to the BS and public grid in case 8 and 9. The BS has higher priority than the public grid in the power compensation of the microgrid. When the BS and public grid are both limited to their limitations, load shedding happens in case 7. In case 7, case 8, and case 9 of sub-flowchart b, when the public grid can supply Δ p , the rest of the public grid power can charge the BS in case 7; when the public grid cannot supply Δ p , Δ p can also be distributed to the BS and public grid, and the public grid has higher priority than the BS in the power compensation of the microgrid in case 9; when the BS and public grid are both limited to their limitations, load shedding happens in case 8.
When s o c S C is less than S O C B S _ M I N and p L is less than its critical load, the DG is turned on in case 10. The BS and public grid can support the Δ p in case 8 and case 9 under their limitations.

3.3. Case 11

When the DG is turned on, the SC starts discharging to compensate for the power of the sluggish dynamic of the DG until the DG can supply the stable power expressed in Equation (10). When the DG can supply stable power, it starts charging the SC and supplying Δ p to keep the power balance of the microgrid until the SC finishes charging. Then, the DG stops charging the SC, and it starts charging the BS and supplying Δ p to keep the power balance of the microgrid until the BS finishes charging. When the BS finishes charging or the DG reaches its duty cycle, the DG is turned off.

4. Simulation Results and Analyses

The performance of the presented algorithm was verified using simulation. It was implemented in MATLAB/Simulink following the presented full DC microgrid system modeling. The DC microgrid simulation parameters and scenarios are given below.

4.1. Simulation Case

The simulation case is based on an operational period of 24 h separated into five time periods, 0:00–6:00, 6:00–8:00, 8:00–17:00, 17:00–22:00, and 22:00–24:00. The simulation is based on the PV generator, the public grid, the BS, the SC, the DG, the DC load, and DC bus modeling. The PV generator is composed of 14 PV panels (SF 130/2-125, Solar-Fabrik, Germany) in series, whose maximum power is 1750 W under standard test conditions (STC). The weather data were recorded on the 20 June 2018 in Compiegne, France. The public grid was considered as a single-phase voltage power source. The BS is composed of five lead-acid batteries in series, whose characteristics are 12 V/6.6 Ah for each one. The DG used in this simulation was SDMO Technic 6500 E AVR. Regarding the SC, its capacity C S C is 94 F and the v S C _ R a t e d is 75 V. The load power curve is scaled according to a real daily consumption profile of our university building during the weekdays, which consists of 49 appliances, as stated in [23].
It should be noted that the proposed power management system allows BS charging with public grid energy during the night when the public grid is less stressed. Regarding energy resale, the microgrid can only sell energy from the PV generator.
The simulation parameters are given in Table 1.
To allow DG start-up during daytime operation, the public grid power was limited to 200 W or 600 W in this simulation. The BS power was limited to 1000 W. The state of charge, SOC, limitations of BS was from 20% to 80%, and the initial value of BS was 50%. The DG power was limited to 1500 W to be at the same level of the PV and the load demand power; the DG duty cycle was set to 1 h. The maximal power of the SC was limited to 1500 W, the as same as the DG; the SC working period, T S C _ M I N , was constrained to be more than 3 min. The SOC of the SC was from 35% to 85%, and the two recharging SOC values of the SC were 45% and 75% in two different conditions as described in Section 2.5. The coefficient k L _ C R I T was set to be 80% or 100%. The common DC bus voltage reference was 400 V by considering the power conversion efficiency between the microgrid and the public grid.
Table 2 presents the simulation scenarios and parameters following the different periods, the choice of sub-flowchart a and sub-flowchart b, the set of the coefficient k L _ C R I T , and public grid power limitation. These configurations, shown in Table 2, were set according to the energy demand of the university building during the week.
In Table 2 the five time periods can be seen. During 0:00–6:00 and 22:00–24:00, it is assumed that the load demand power is low, respecting sub-flowchart b. The coefficient k L _ C R I T is set at 100% because all the load demand is the critical load that cannot be shedding, and the public grid power is limited to 600 W. During 6:00–8:00, the PV energy production is different according to the seasons and it is assumed that sub-flowchart a is used. The coefficient k L _ C R I T is set at 80%, and the public grid power is limited to 200 W. During 8:00–17:00, the load demand varies according to the energy demand of the university building, and it is assumed that the power management uses sub-flowchart a. The coefficient k L _ C R I T is set at 80%, and the public grid power is limited to 200 W. During 17:00–22:00, the load demand for tertiary buildings is low but for residential buildings it is very high so that the public grid is highly stressed; therefore, it is assumed that sub-flowchart a is used. The coefficient k L _ C R I T is set at 80%, and the public grid power is limited to 200 W.

4.2. Results and Analyses

The simulation was performed for the daily time of 20 June 2018 and for the time horizon from 0:00 to 24:00. The microgrid can operate either on-grid or off-grid modes and can automatically switch between these two modes. The weather data recorded on the 20 June 2018 are shown in Figure 6, where the high variations of the two data sets occur at noon, the slow variations and low values show at night.
The curve of the common DC bus voltage and the SOC curves of the SC and BS are provided in Figure 7a. One notes that the DC bus voltage oscillates around 400 V. This very slight fluctuation becomes obvious when events occur, i.e., the limitations condition of the BS and public grid, DG start-up and end-up, SC charging and discharging, and PV shedding or load shedding; however, the stability of the common DC bus voltage is kept. The power curves are shown in Figure 7b. At 6:27, 7:10, 7:56, 9:58, 11:18, 12:27, 19:36, 20:18, 21:00, and 21:43, the DG is turned on as in case 10 and 11. At 5:00, 9:33, 13:41, 14:57, 16:12, and 17:27, the SC is recharged as in case 4 or case 6. At 10:42 and 19:34, the load shedding happens. At 12:45, 14:51, and 15:44, the PV supplies more power than the power that microgrid can consume, so the PV starts being shed, as in case 1.
To better check the simulation results, the five time periods, 0:00–6:00, 6:00–8:00, 8:00–17:00, 17:00–22:00, and 22:00–24:00, are separately descripted in Section 4.2.1, Section 4.2.2, Section 4.2.3, Section 4.2.4 and Section 4.2.5.

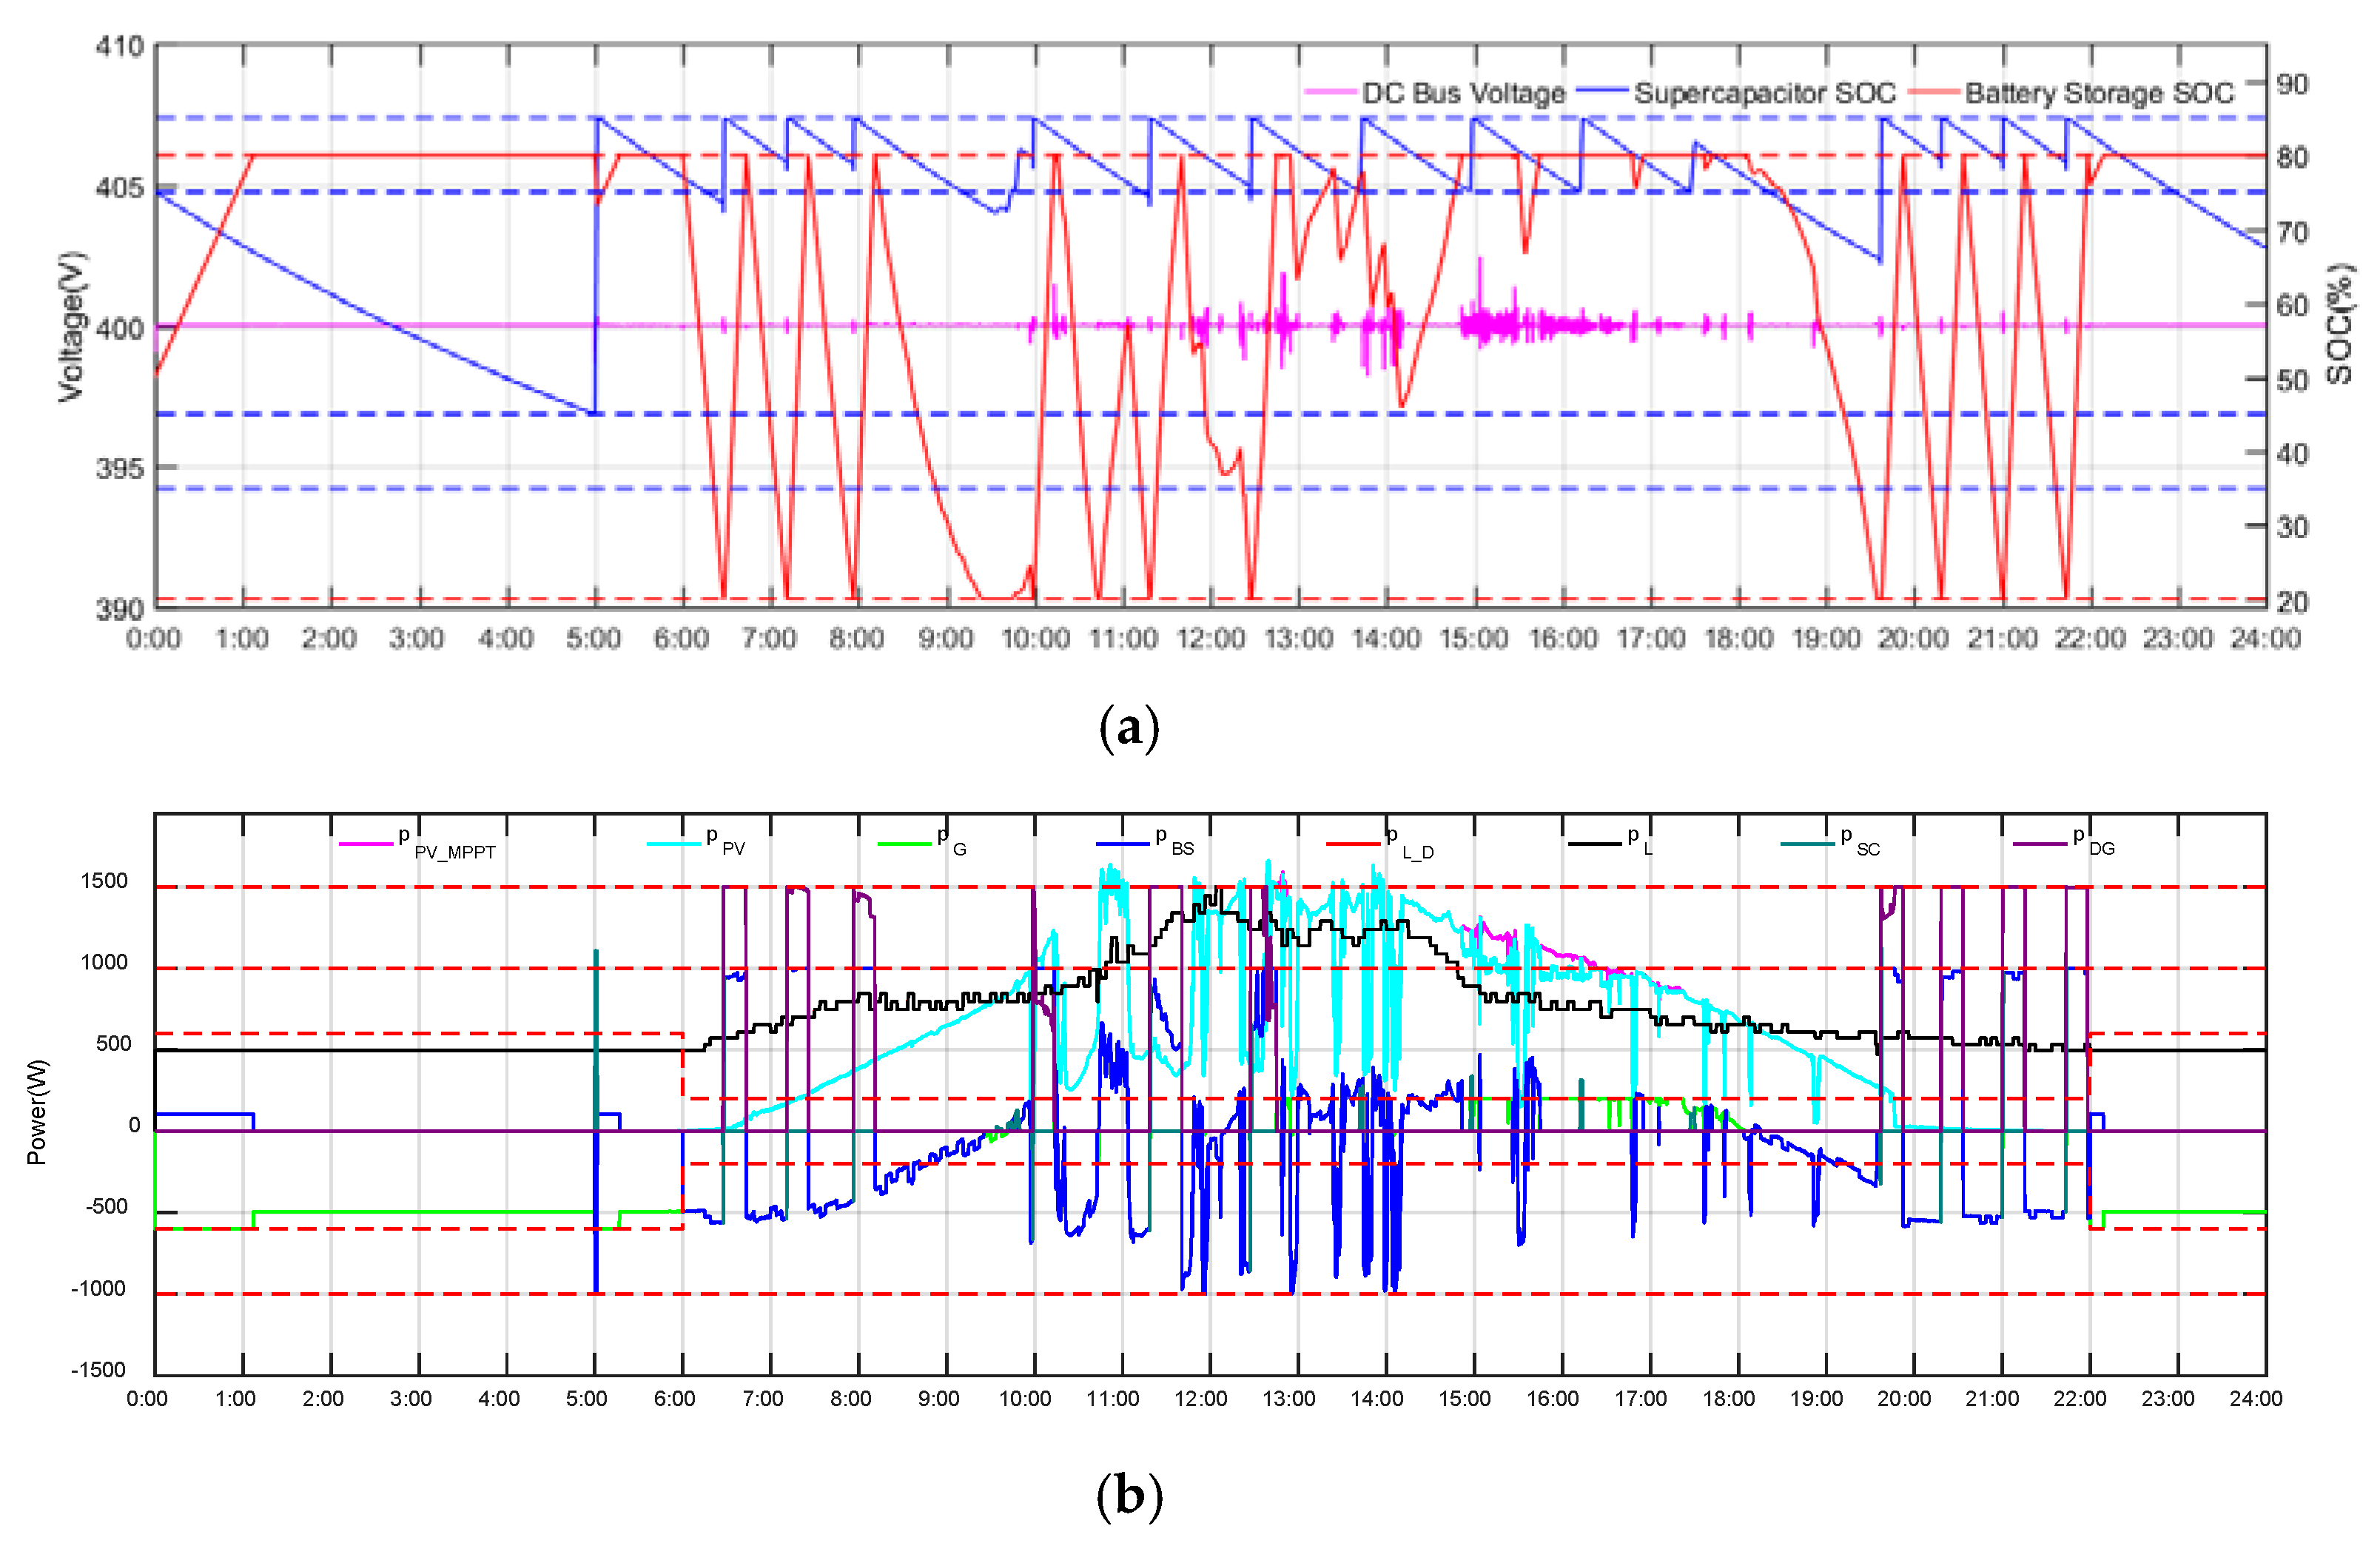
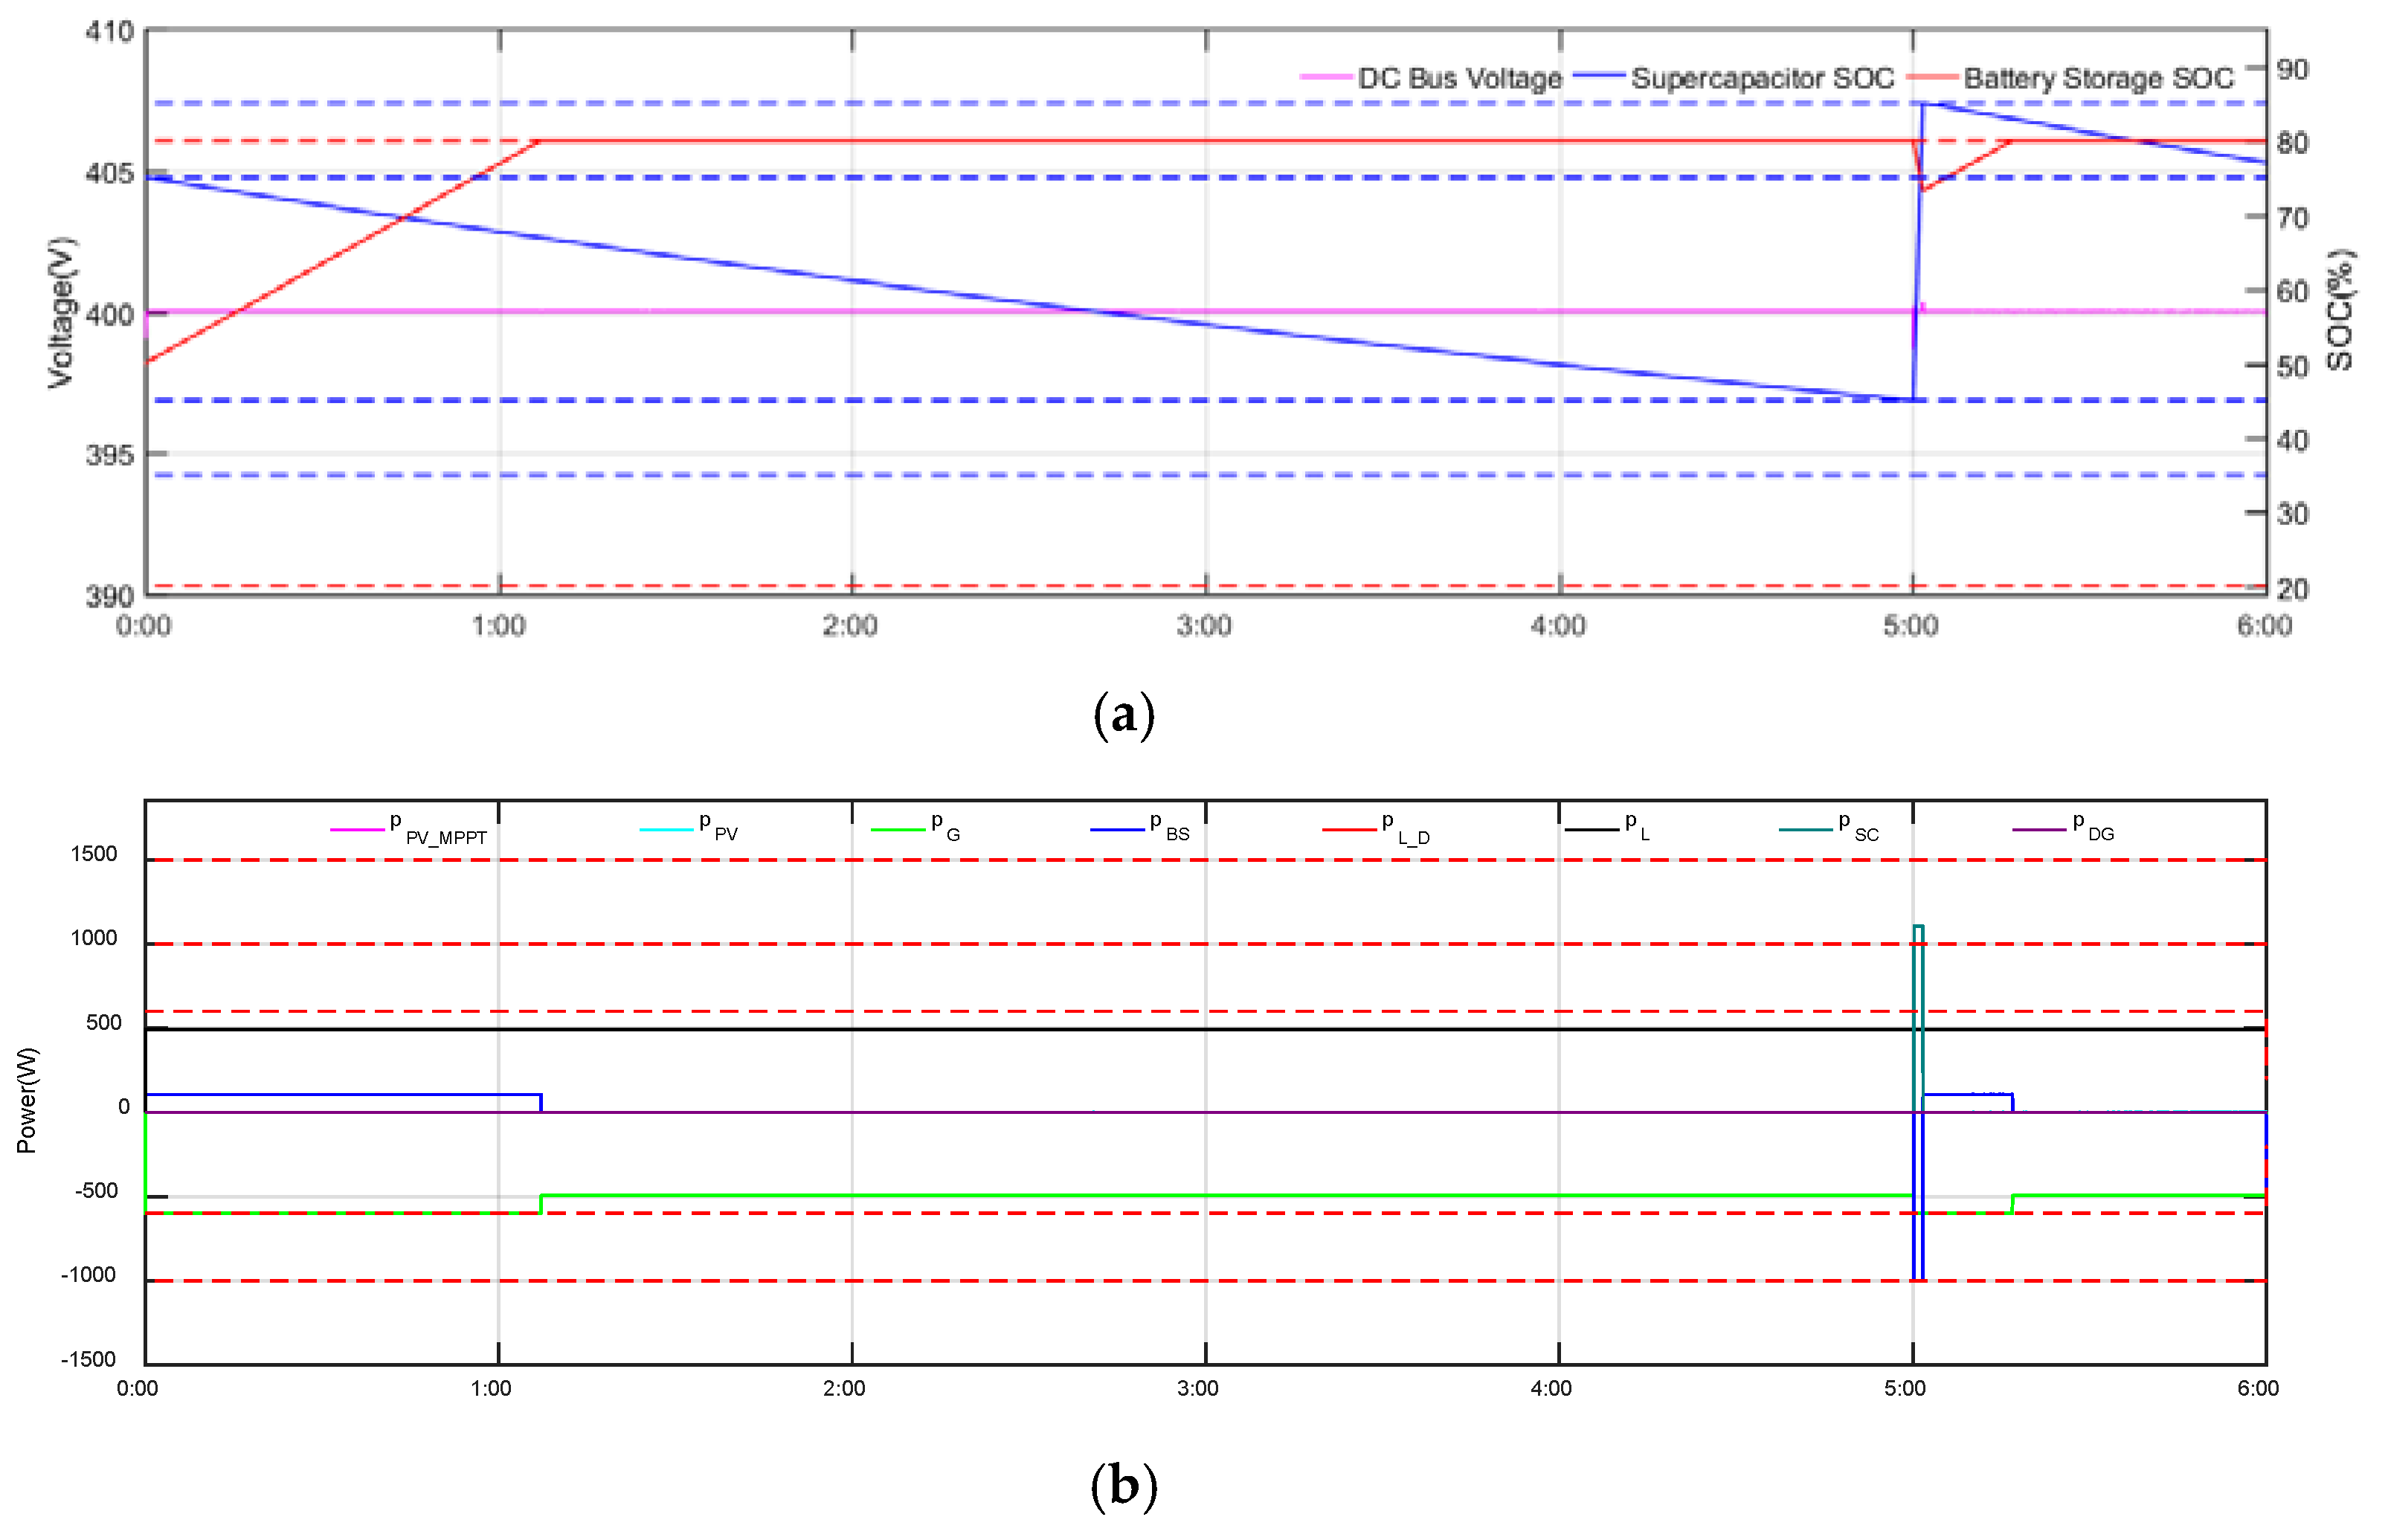
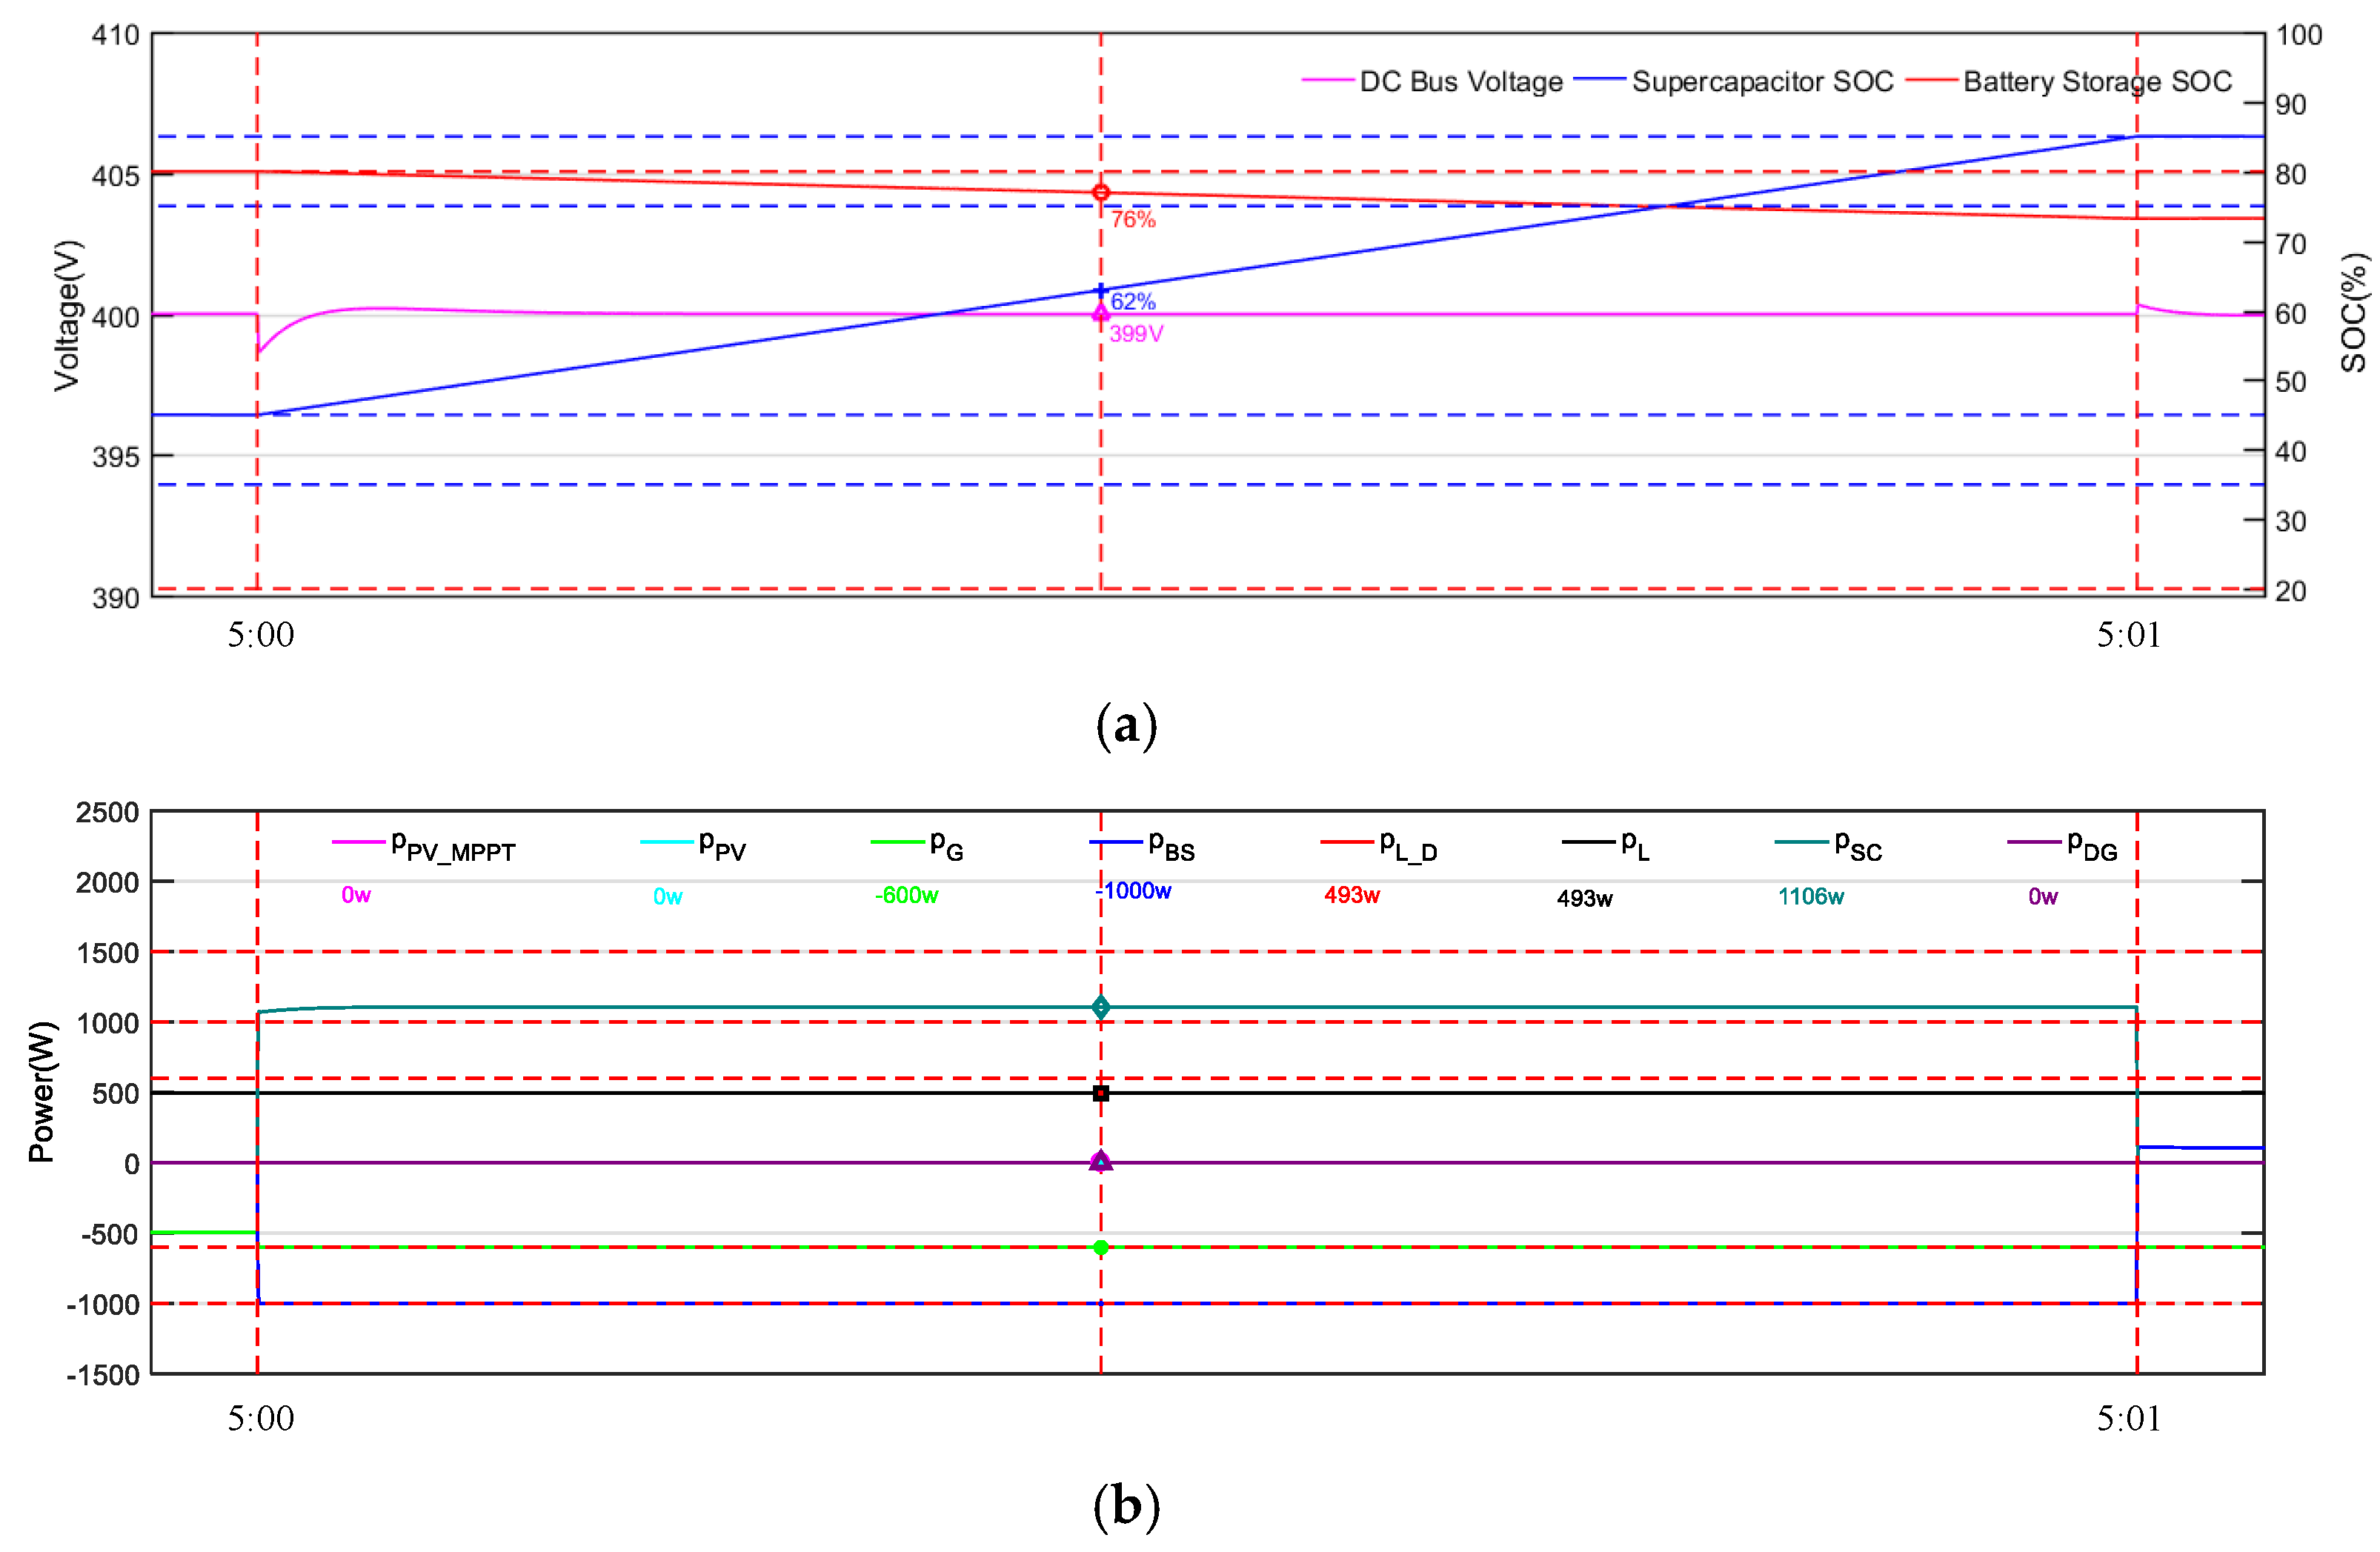
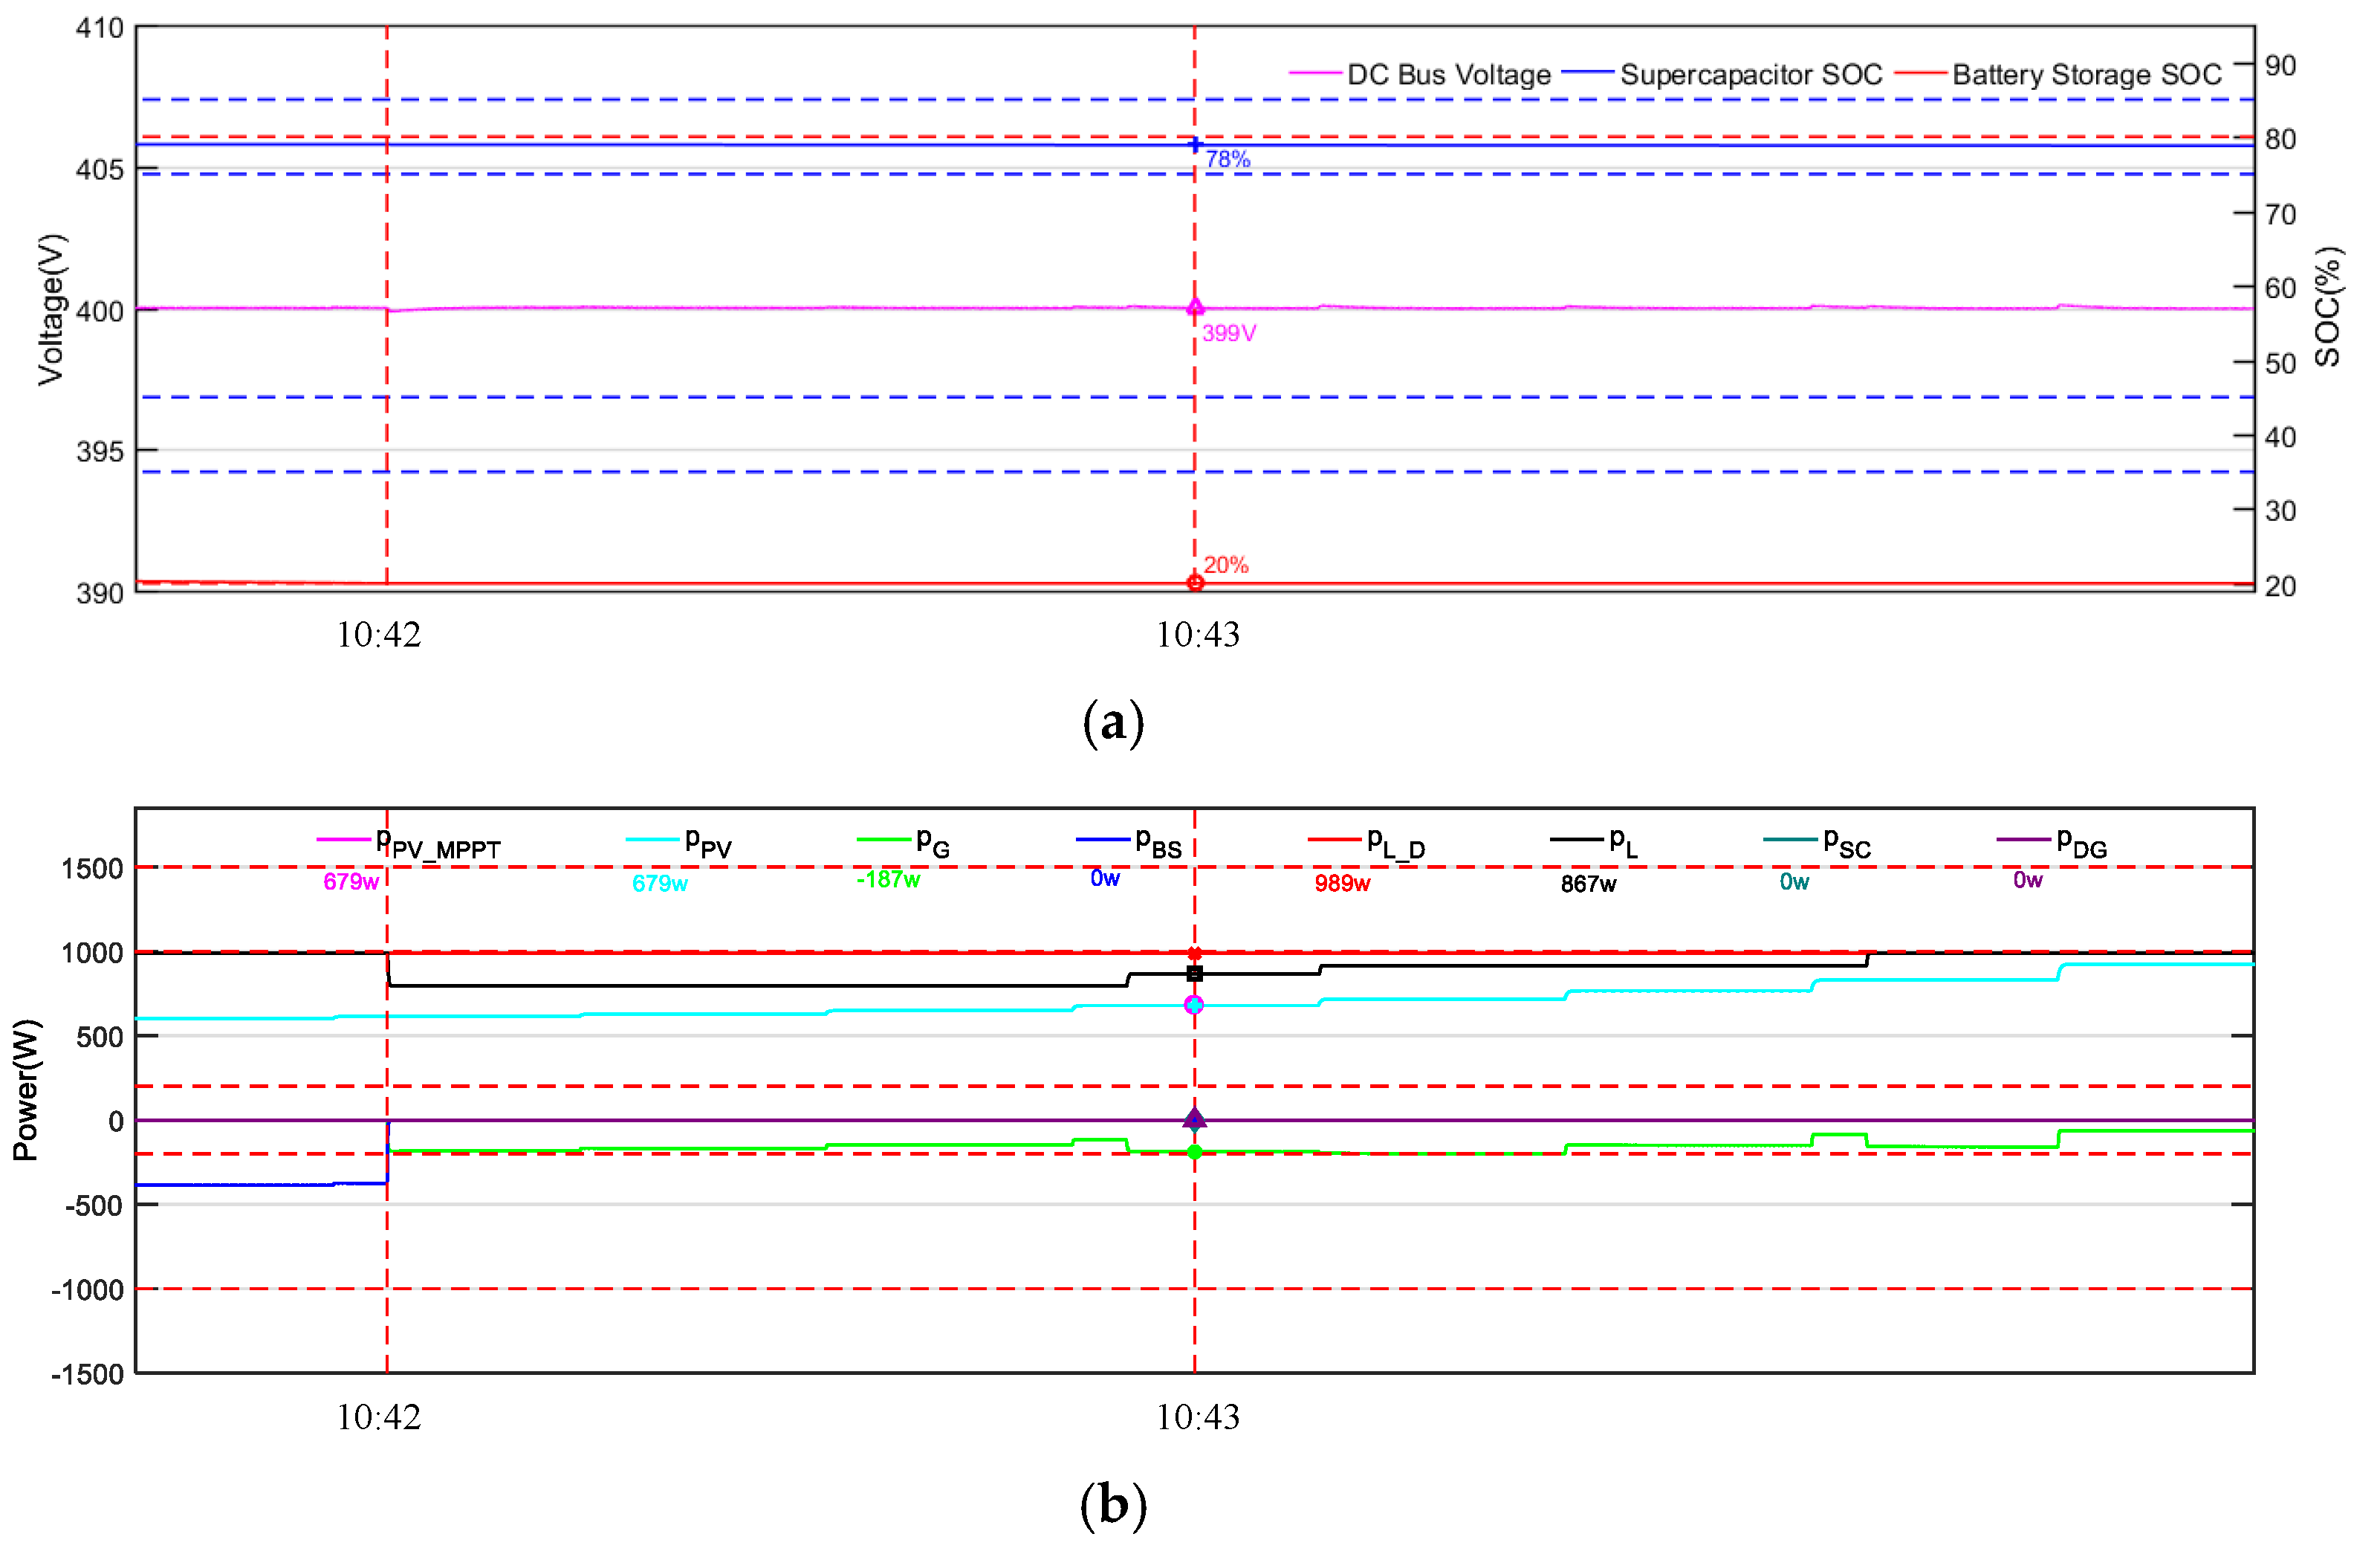
4.2.1. Simulation Results and Analyses for 0:00 to 6:00

Figure 8 shows the results of the period 0:00–6:00 taken from Figure 7. In Figure 8, there is no load shedding because all the load demand is critical load; the public grid power limitation is greater than the load demand power; thus, the excess public grid power can charge the BS. Therefore, at the beginning of the simulation, the public grid supports the load demand and charges the BS until the s o c B S reaches S O C B S _ M A X , then the public grid only supports the load demand in case 7 of sub-flowchart b; at 5:00, the SC is recharged by the BS and the public grid because the s o c S C reaches the S O C S C _ M I N _ M A X in case 6.
Figure 9 is the zoom at the key period when the SC is recharging. Figure 9a shows the curve of the common DC bus voltage and the SOC curves of the SC and BS, and Figure 9b shows the power curves while the SC is recharging from 5:00 to 5:01.
In Figure 9, the SC starts recharging at 5:00 in case 6, and the SC stops recharging at 5:01 because s o c S C reaches the S O C S C _ M A X _ M A X and the Δ p is negative. During the SC recharging period, the microgrid power control can keep balance, and some points are marked at the same time in Figure 9a,b; all the values marked only reserve the integer part.
During the period from 5:00 to 5:01, in Figure 9a, the DC bus voltage value is 399 V near to the v D C , the s o c S C is 62%, and the s o c B S is 76%. In Figure 9b, the marked power values are listed under the legend ( p P V _ M P P T = p P V = 0 W , the p G = 600 W , the p B S = 1000 W , the p L _ D = p L = 493 W , the p S C = 1106 W , and the p D G = 0 W ) and show that the PV is not working because of low solar irradiation, the load is supplied by the BS following its demand, the SC is being charged by the BS, and the public grid and the DG are not working (case 6).

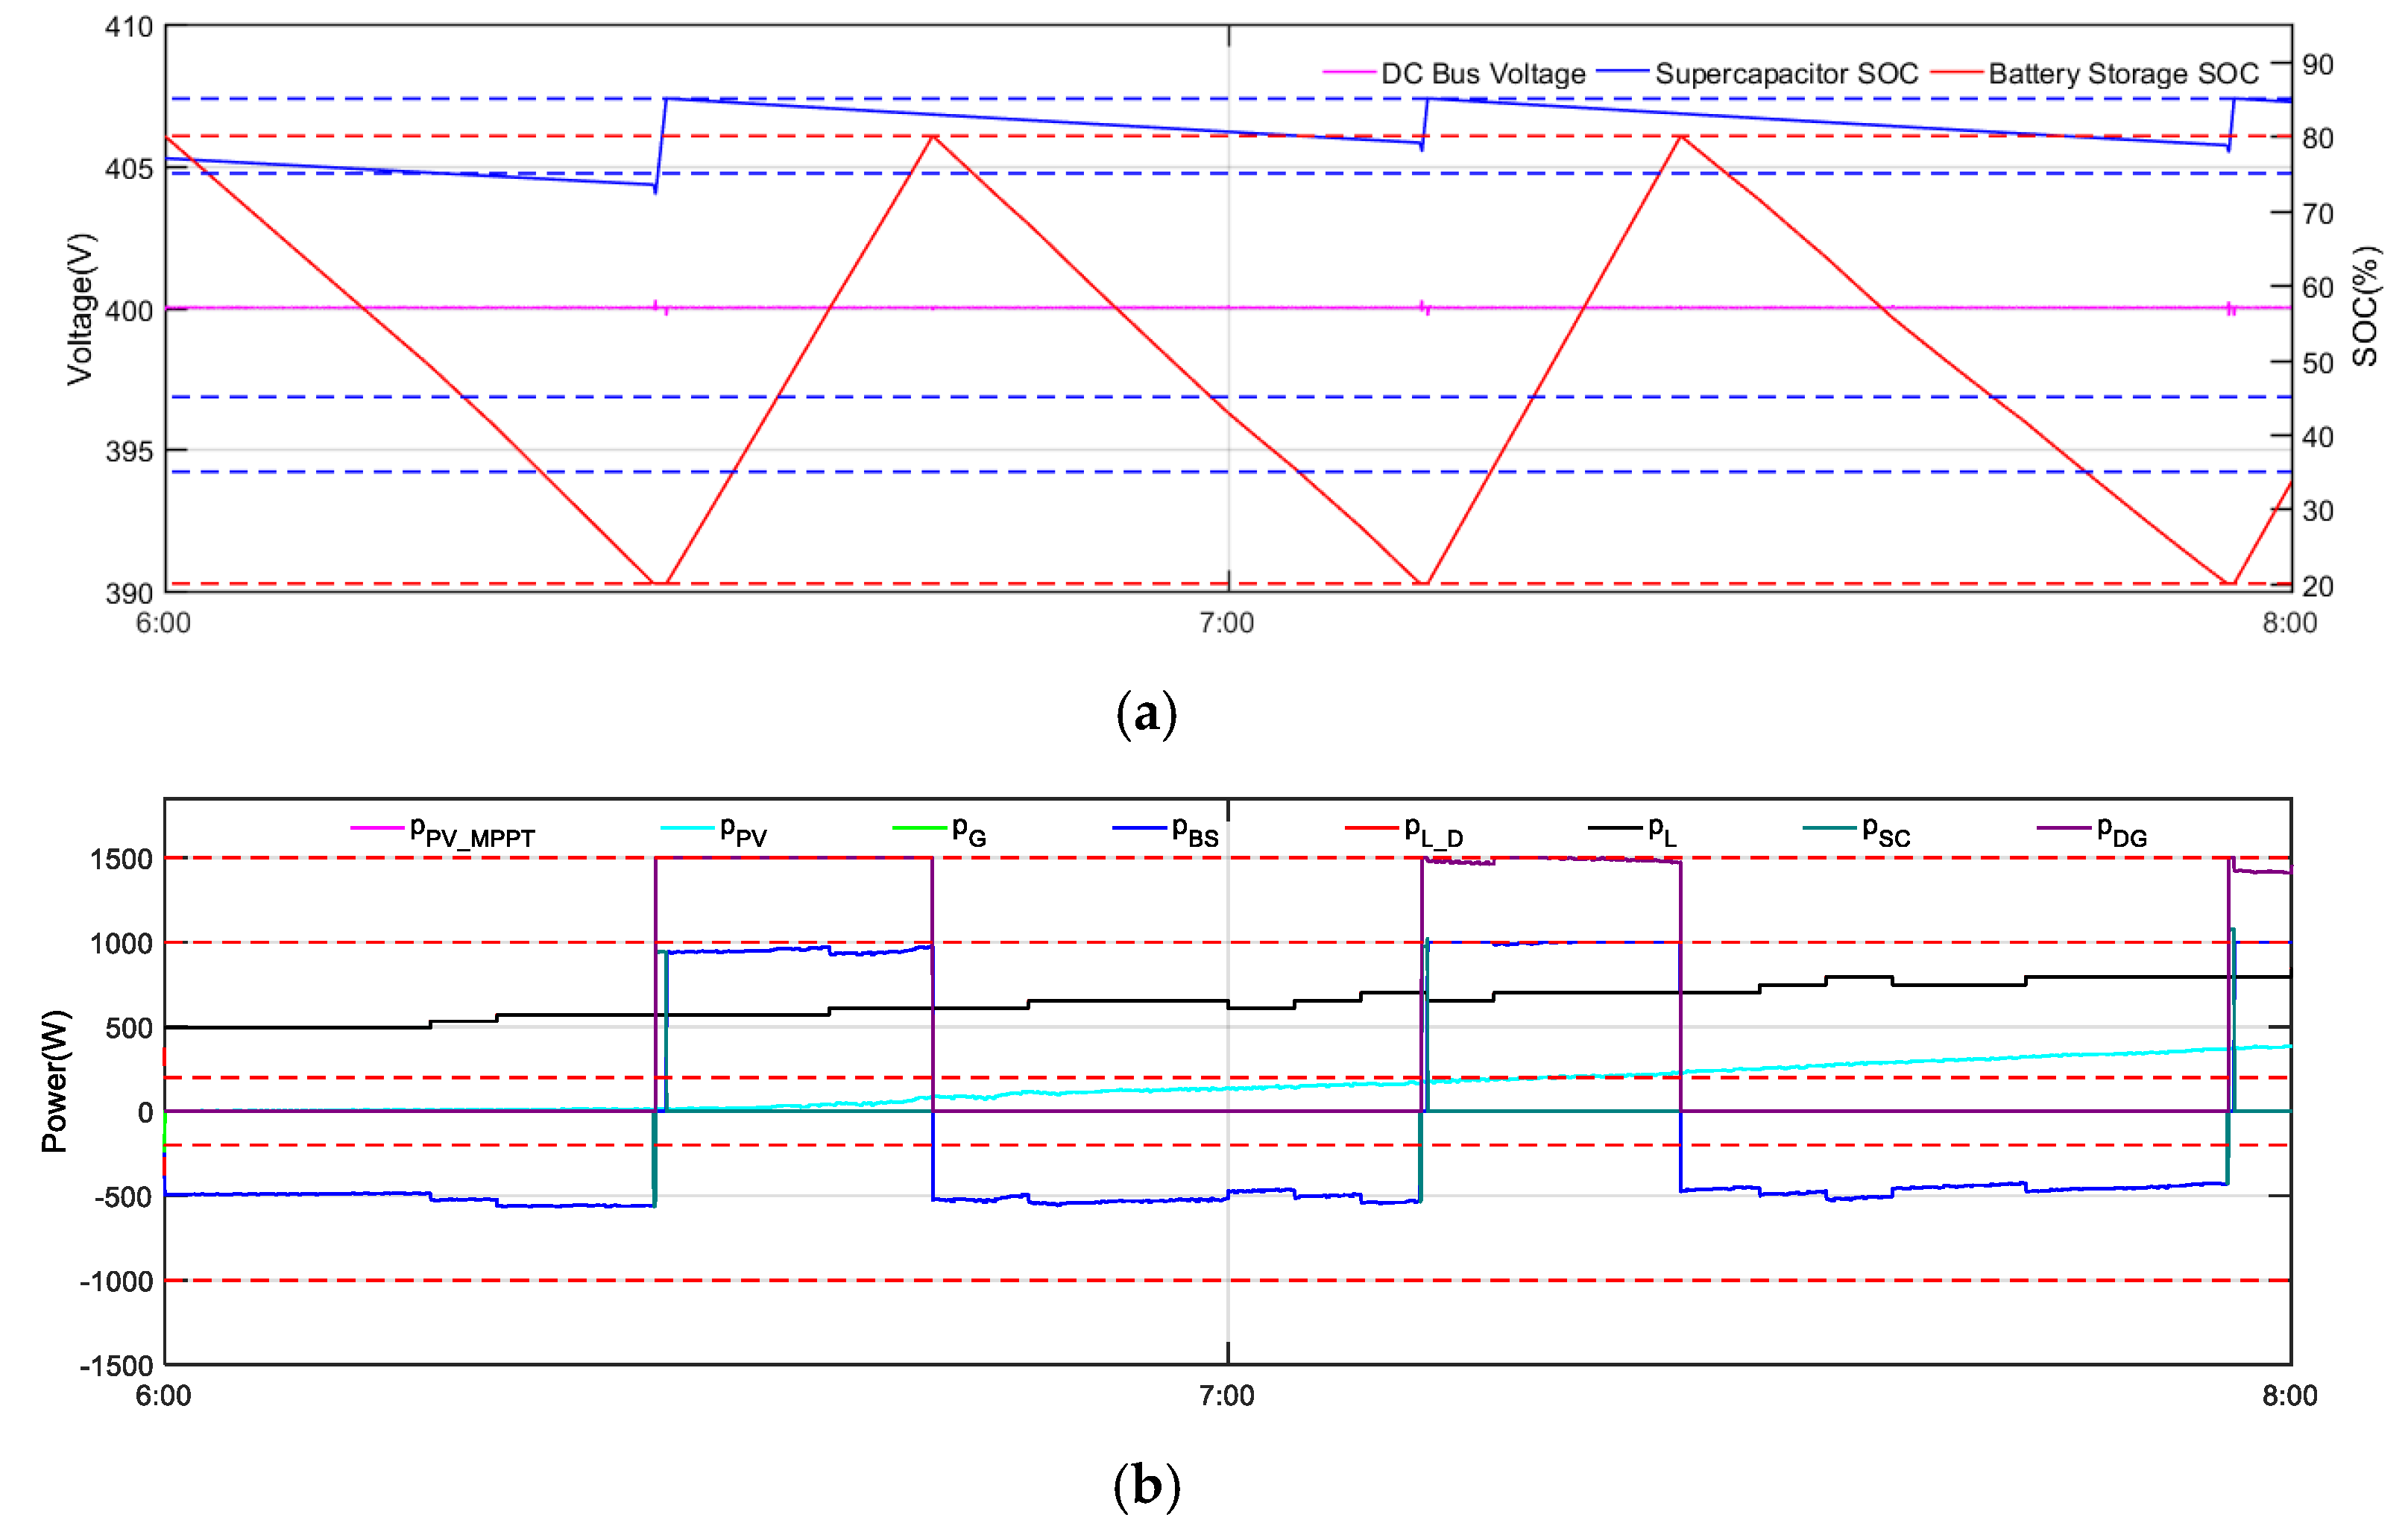
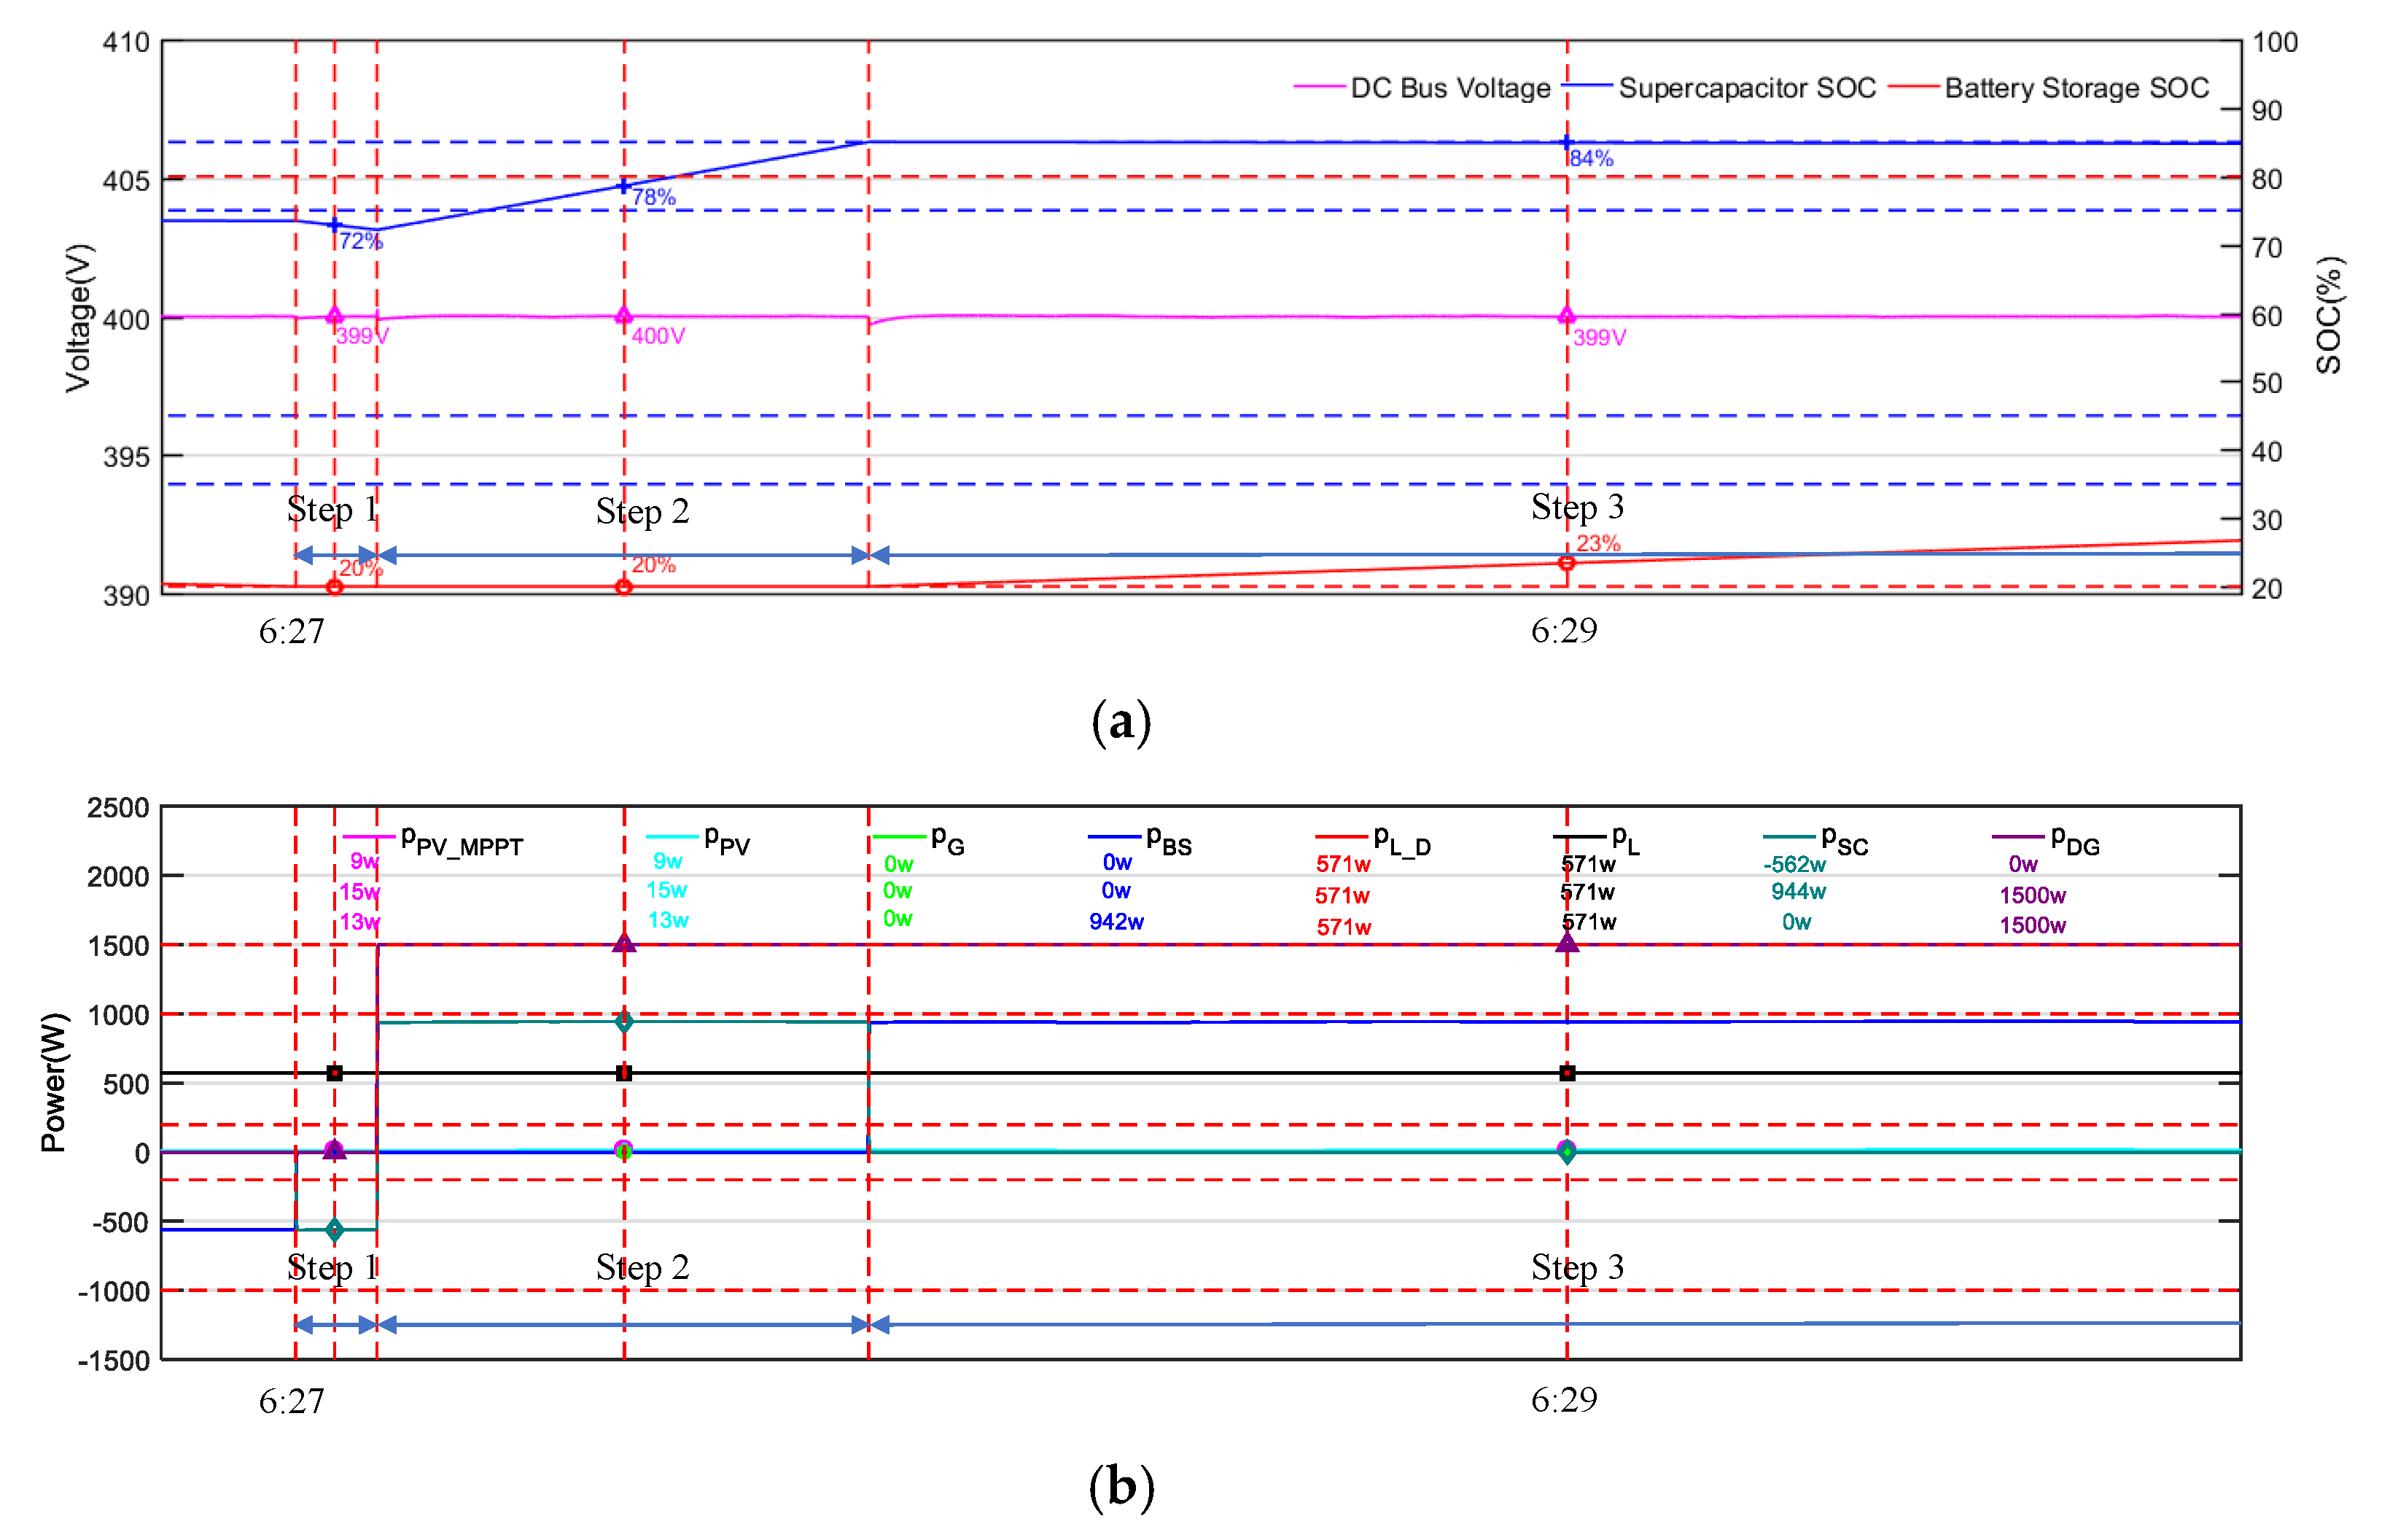
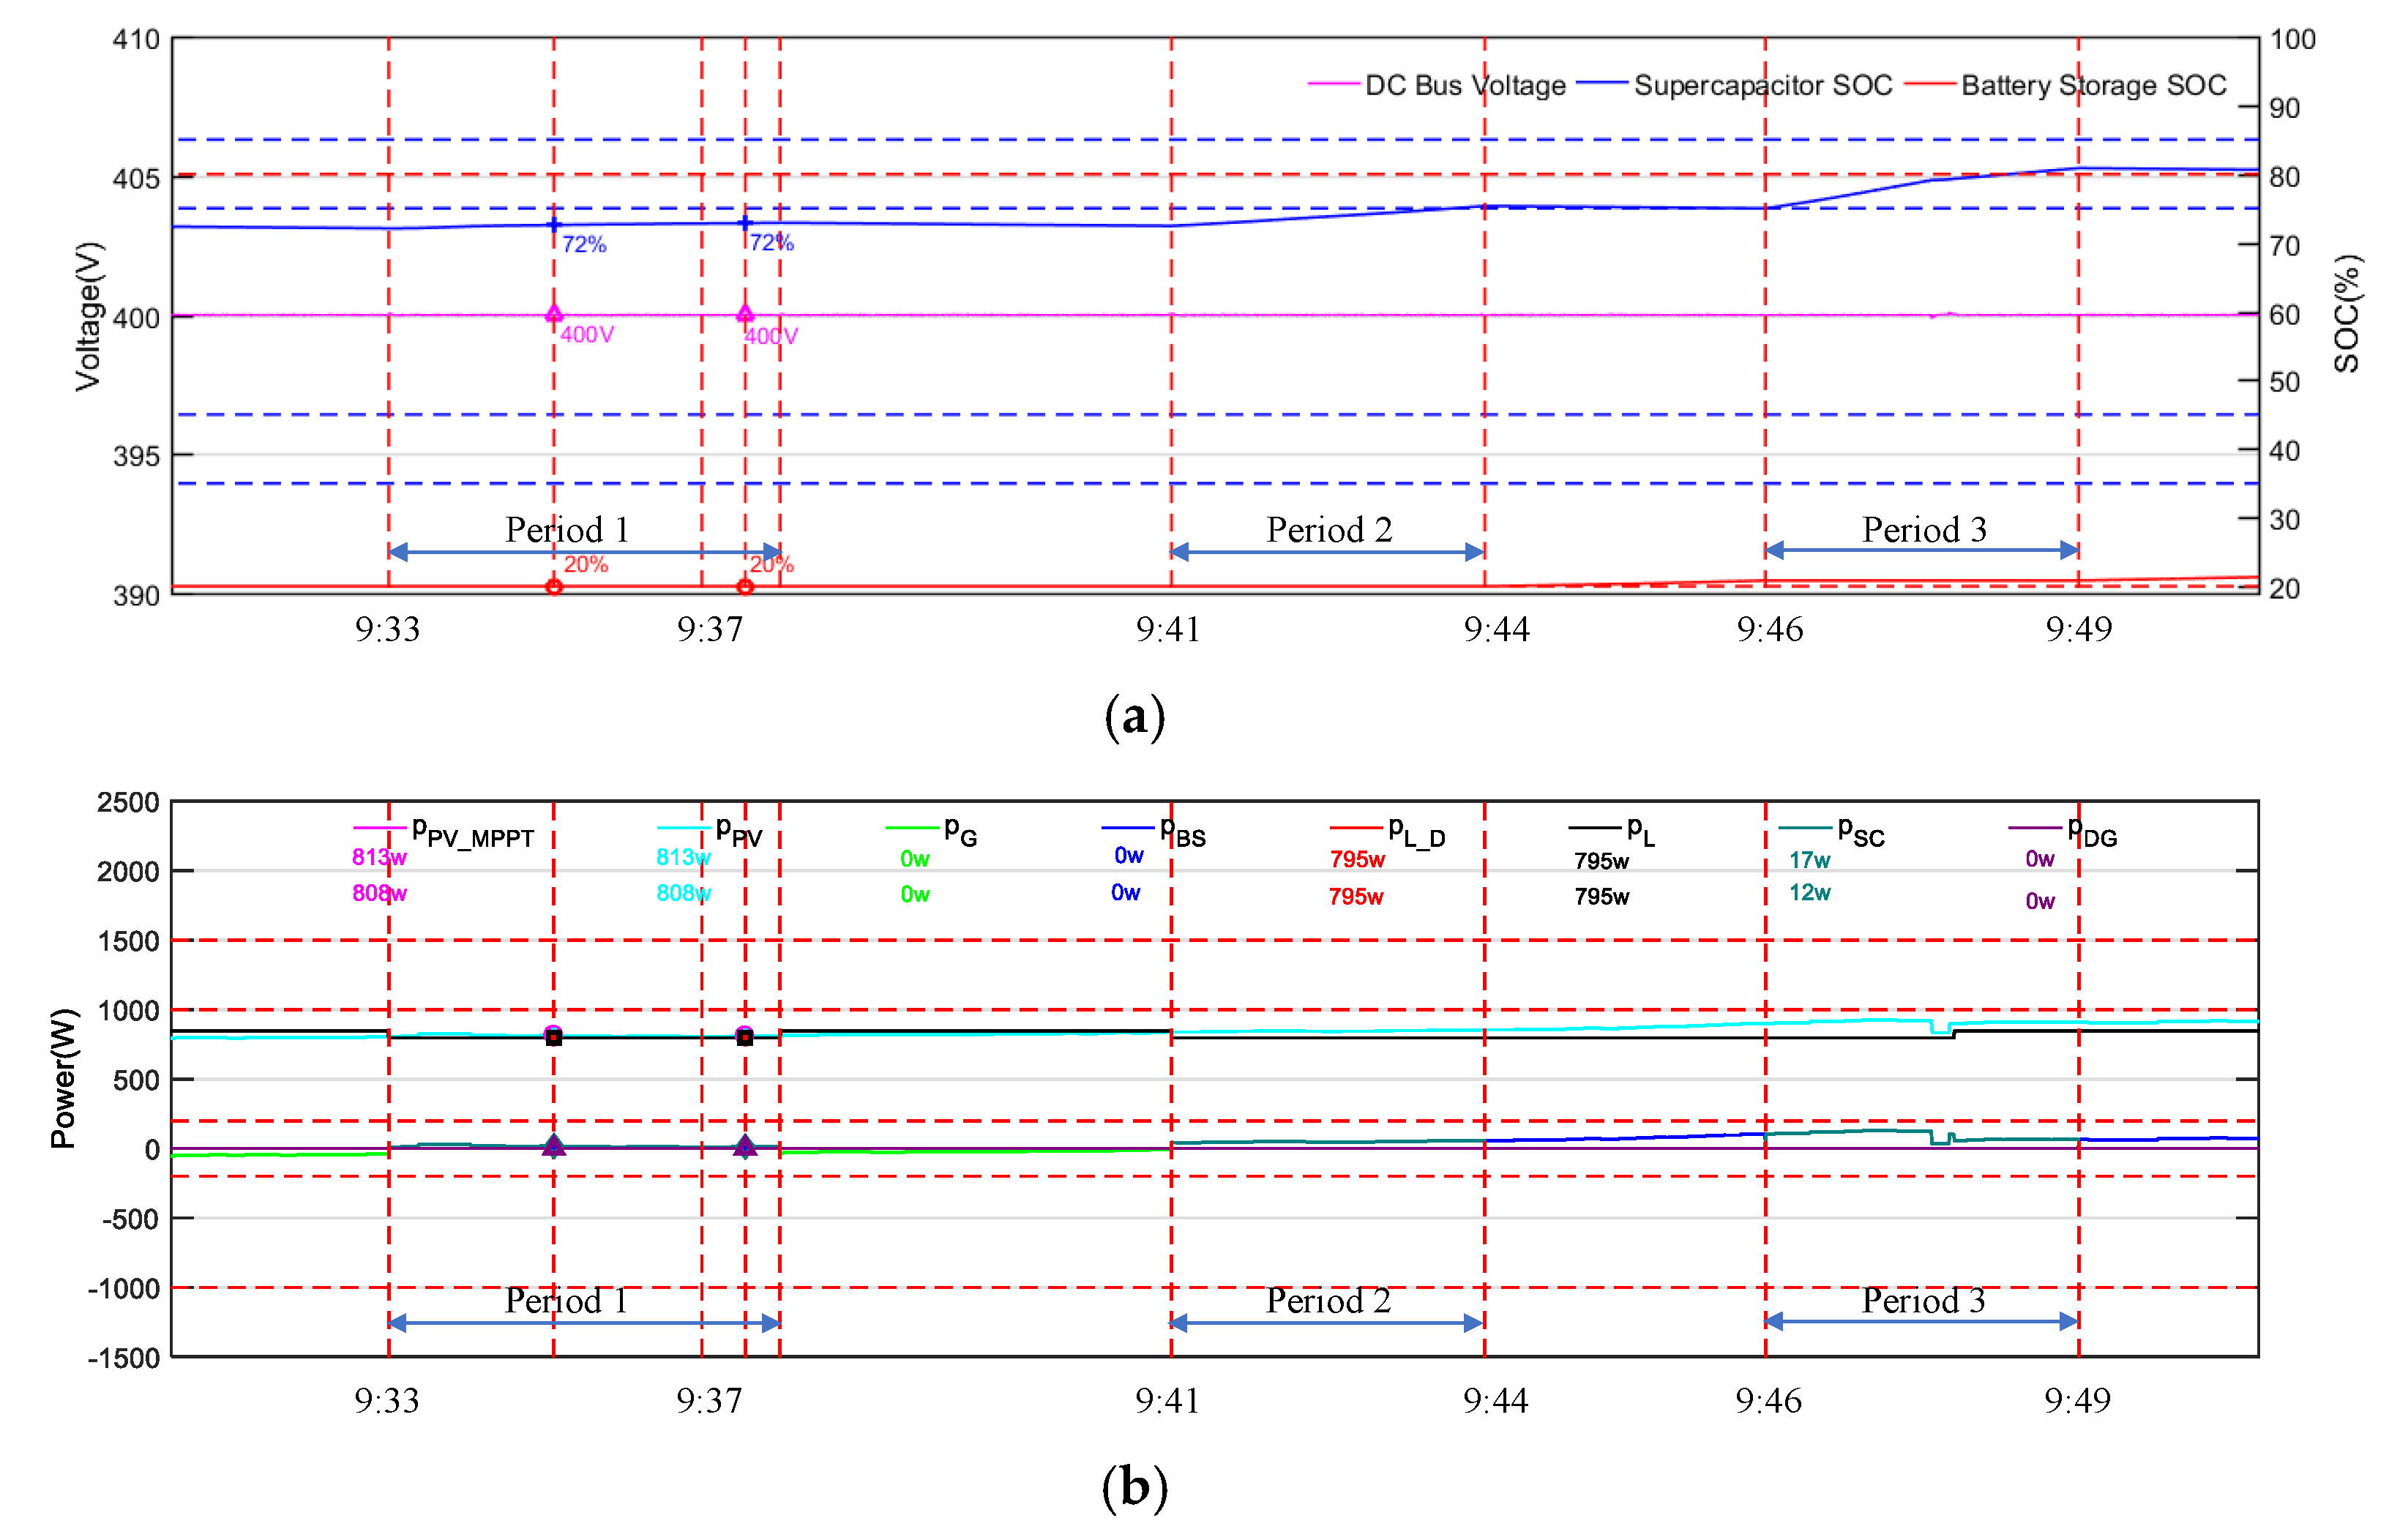
4.2.2. Simulation Results and Analyses for 6:00 to 8:00

Figure 10 is the results of the period 6:00–8:00 taken from Figure 7. During 6:00–8:00, the PV generated power is less than the load demand power, and sub-flowchart a is chosen as the power management strategy; thus, the BS has the higher priority to supply the Δ p to keep the power balance of the microgrid. Then, when the BS has no more power, the DG is turned on because the public grid has a low limitation and the PV cannot support 80% of the load demand power, after which the result above repeats twice.
Figure 11 is the zoom at the key period when the DG is first turned on. Figure 11a shows the curve of the common DC bus voltage and the SOC curves of the SC and BS, and Figure 11b shows the power curves while the DG is turned on at 6:27.
In Figure 11, the DG is turned on at 6:27 and the system is in case 10. Three steps of case 11 are highlighted: the SC starts discharging to compensate the power of the sluggish dynamic of the DG until the DG can supply stable power in step 1; the DG starts charging the SC and supplying Δ p to keep the power balance of the microgrid until the SC finishes charging in step 2; the DG stops charging the SC and starts charging the BS and supplying Δ p to keep the power balance of the microgrid until the BS finishes charging in step 3. During these three steps, the microgrid power is well balanced.
For an easy reading of Figure 11a,b the same points are marked in both figures and the given numerical values only reserve the integer part. In the period of step 1, these values show that the DC bus voltage value is 399 V, near to v D C , the PV generator is working in MPPT mode, the load works at its load demand power, the SC is compensating the Δ p according to Equation (3), the BS is not working, the DG is turned on with low dynamic power at 0 W, and the public grid is not working. In the period of step 2, the difference is that the DG is working under the p D G _ M A X and can recharge the SC. In the period of step 3, the DG is still working under the p D G _ M A X , and the SC stops charging while the BS is being recharging by the p D G .
One notes that during the period 6:00–8:00, the DG is also turned on at 7:10, and 7:56 and shows the same results as those depicted above at 6:27.

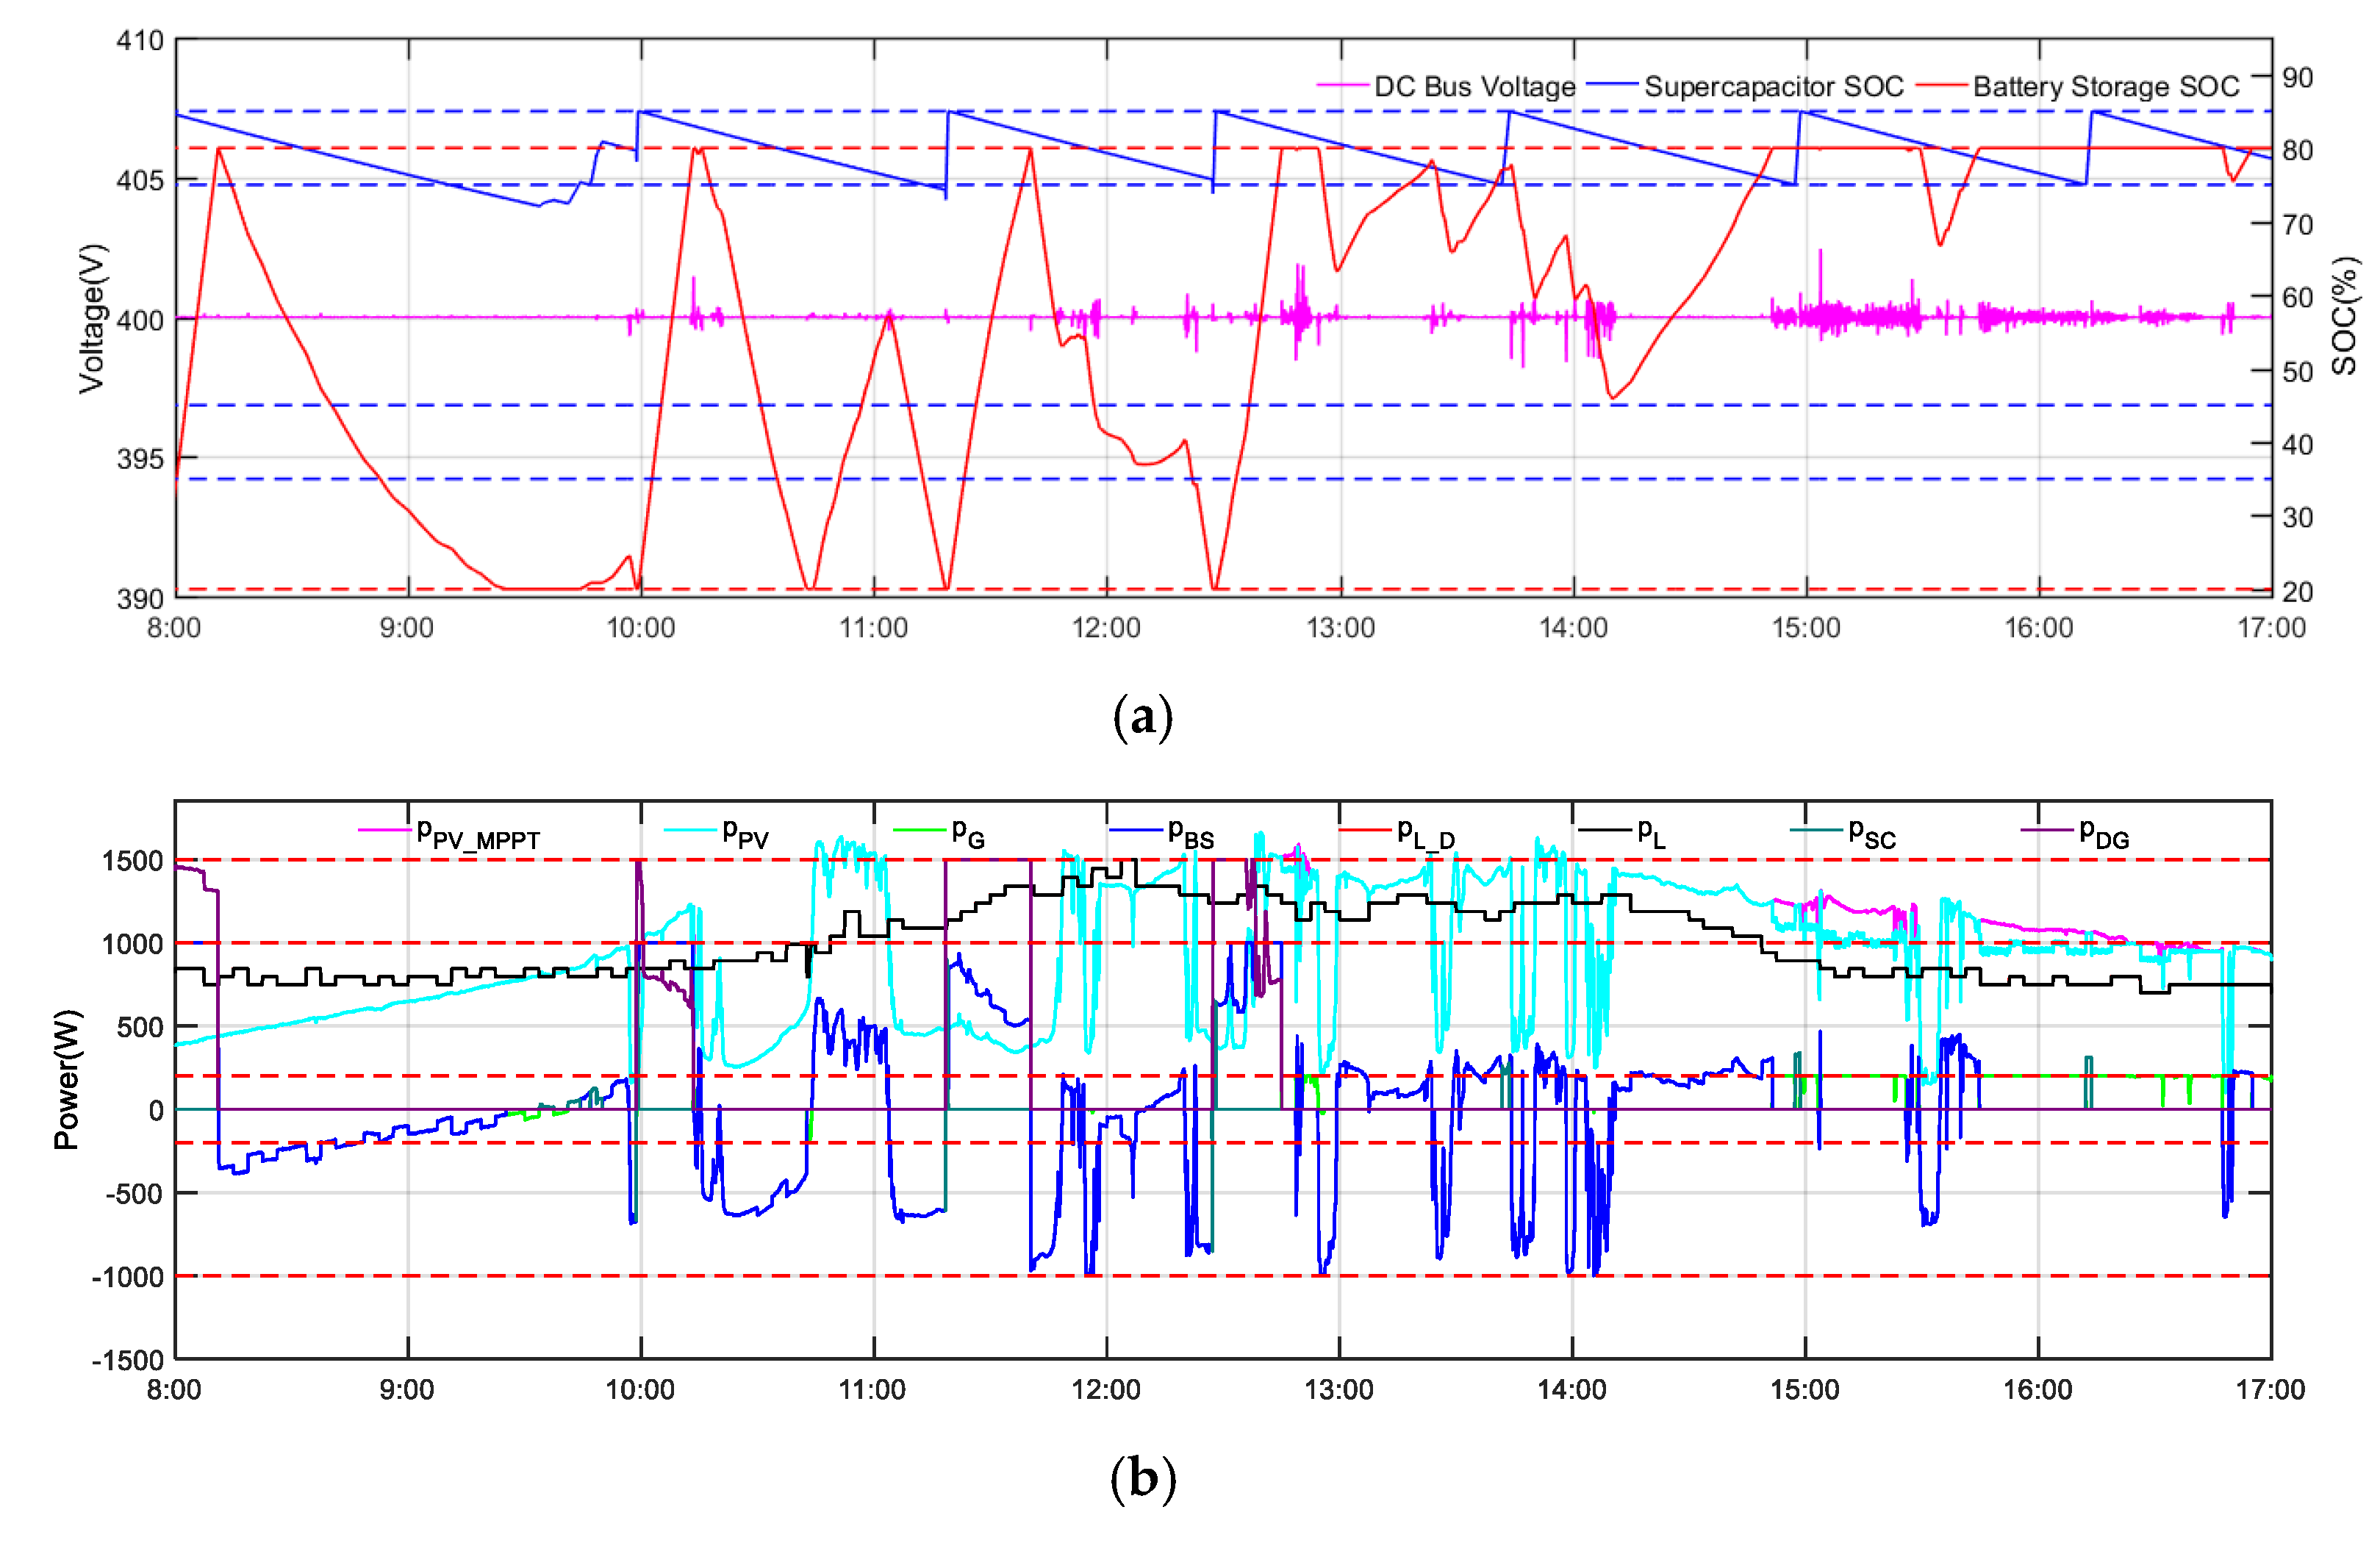
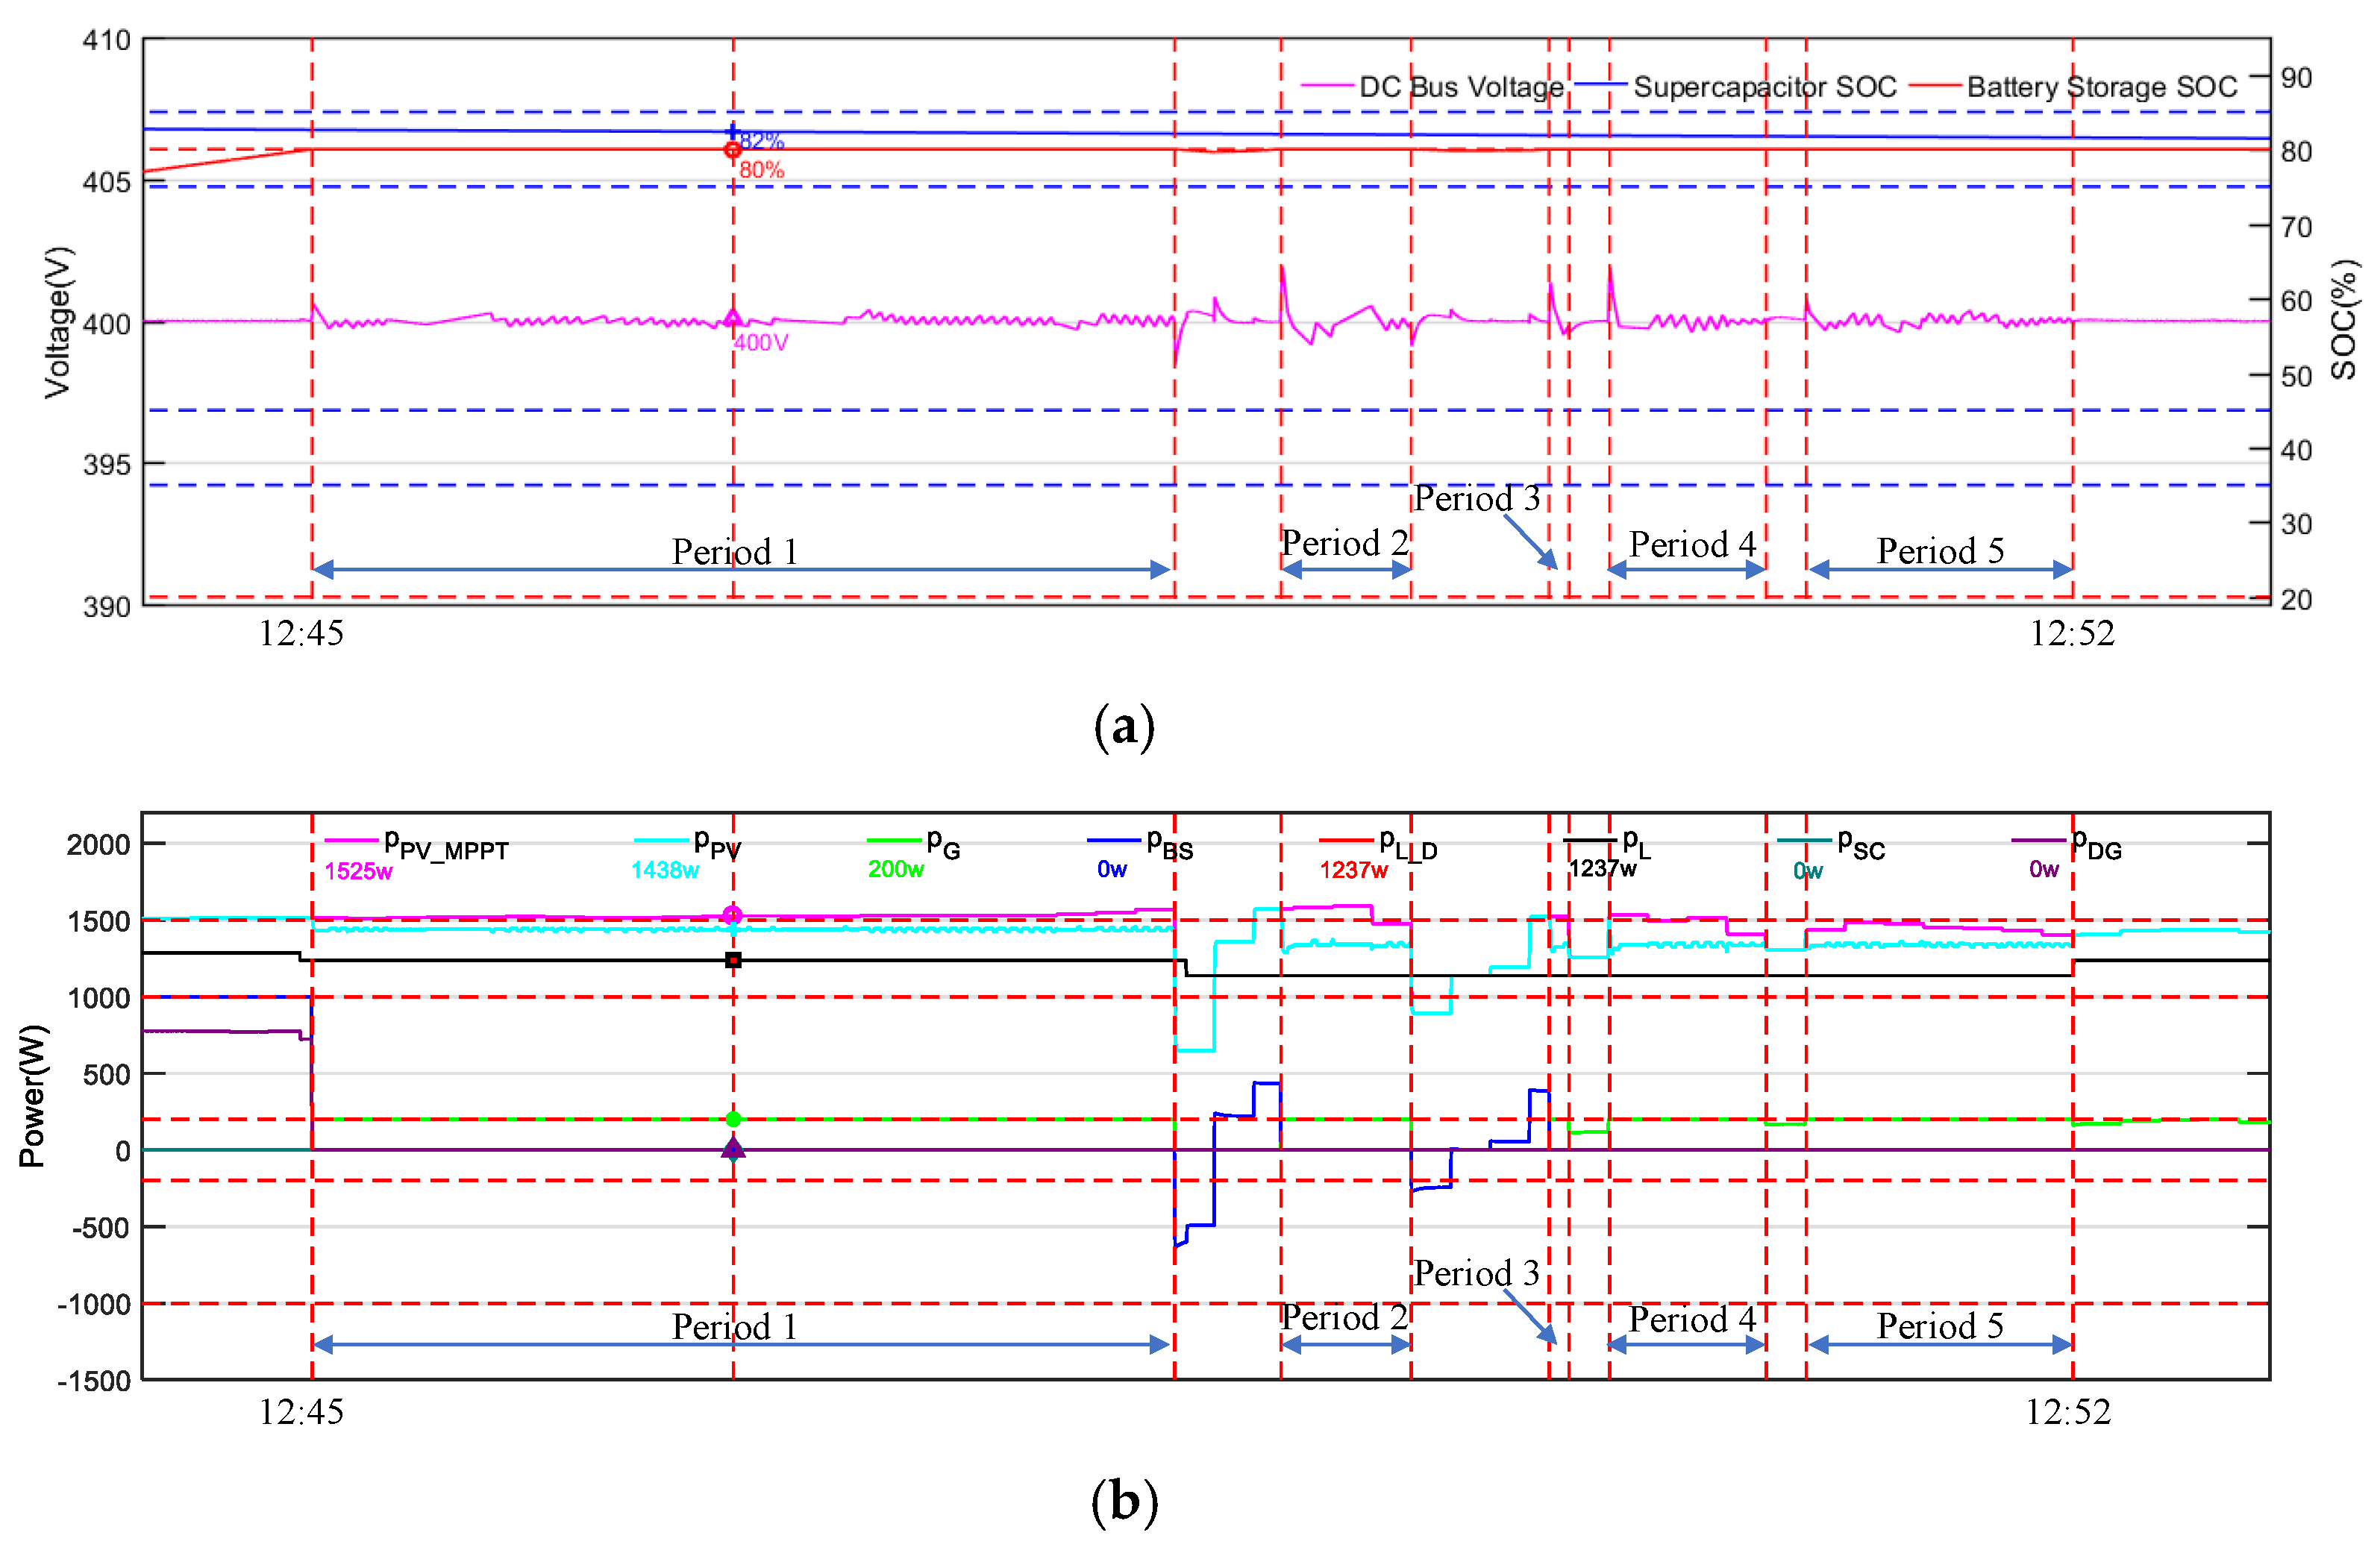
4.2.3. Simulation Results and Analyses for 8:00 to 17:00

Figure 12 shows the results of the period 8:00–17:00 taken from Figure 7. During 8:00–17:00 the PV generated power is variable according to the solar irradiation. The PV generated power is less than the load demand power from 8:00 to 9:30 and then it severely changes around the load demand power until 14:10. From 14:10 to 17:00, the PV generated power is often greater than the load demand power. Sub-flowchart a operates when the PV generated power is less than the load demand power. The BS has the higher priority to supply the Δ p to keep the power balance of the microgrid; then, when the BS has no more power, the DG is turned on because the public grid is predetermined with a low limitation, and the PV cannot support 80% of the load demand power. Otherwise, when the PV generated power is greater than the load demand power, the BS recharges until the s o c B S reaches the S O C B S _ M A X and the excess power is sold to the public grid under the fixed limitation of p G _ M A X ; if PV sources generate too much power, the PV shedding occurs to keep the power balance in the microgrid.
During the period 8:00–17:00, the DG is also turned on at 9:58, 11:18, and 12:27 and shows the same results as those depicted above at 6:27.
Figure 13a shows the curve of the common DC bus voltage and the SOC curves of the SC and BS, and Figure 13b shows the power curves when the load starts shedding at 10:42.
In Figure 13, the load starts shedding at 10:42 according to case 7 of sub-flowchart a because the microgrid generated power cannot supply the load demand, and the load can be shed less than its non-critical load. Due to load optimization, the optimal load combination result can be such that p G is under p G _ M A X , meaning that the public grid cannot supply its maximal power to the microgrid.
For an easy reading of Figure 13a,b, the same points are marked in both figures and the given numerical values only reserve the integer part. These values show that the DC bus voltage is stable, the PV is working in MPPT mode, the load works in its load shedding mode, the BS is not working because the s o c B S reaches the S O C B S _ M I N , and the public grid supplies power to the microgrid. The DG and SC are not working because the load power shedding does not reach its critical limit.
Figure 14a shows the curve of the common DC bus voltage and the SOC curves of the SC and BS, and Figure 14b shows the power curves when the PV starts shedding at 12:45.
Because the PV sources generate more excess power than the microgrid needs, in Figure 14, the PV generator is shedding in five periods noted as Period 1, Period 2, Period 3, Period 4, and Period 5 according to case 1. The DC bus voltage fluctuation is caused by the dynamic response of the PV shedding control loop. For an easy reading of Figure 14a,b, the same points are marked in both figures and the given numerical values only reserve the integer part. The marked values show that the PV works in the PV shedding mode, the load works at its load demand, the BS is not working because the s o c B S reaches the S O C B S _ M A X meaning the BS is full, and the microgrid sells the excess PV power to the public grid at p G _ M A X . One notes that the DG and SC are not working because the PV power covers enough of the load demand.
During the period 8:00–17:00, PV shedding also happens at 14:51, and 15:44 and shows the same results as those depicted above at 12:45.
Figure 15a shows the curve of the common DC bus voltage and the SOC curves of the SC and BS, and Figure 15b shows the power curves when the SC starts recharging at 9:33.
In Figure 15, the SC is recharging in three periods, Period 1, Period 2, Period 3, in case 4. In Period 1, the SC starts recharging at 9:33. The SC cannot stop recharging when the t S C _ C H is more than T S C _ M I N , because the s o c S C is always less than the S O C S C _ M A X _ M I N while the Δ p is positive in case 4. The SC stops recharging at the end of the Period 1 in case 6. In Period 2, the SC starts recharging at 9:41 and stops recharging at 9:44 when t S C _ C H reaches T S C _ M I N , because the s o c S C reaches the S O C S C _ M A X _ M I N while the Δ p is positive in case 4. In Period 3, the SC starts recharging at 9:46 and stops recharging at 9:49 in case 4.
For an easy reading of Figure 15a,b, the same points are marked in both figures and the given numerical values only reserve the integer part. The marked values show that the DC bus voltage is stable, the PV is working in MPPT mode, the load works at its load demand power, the SC is being charged by the Δ p , and the BS, the DG, and the public grid are not working (case 4).
During the period 8:00–17:00, the SC is also recharged at 13:41, 14:57, and 16:12 and shows the same results as those depicted above at 9:33, except for the condition in which the SC stops recharging when s o c S C reaches the S O C S C _ M A X _ M A X .

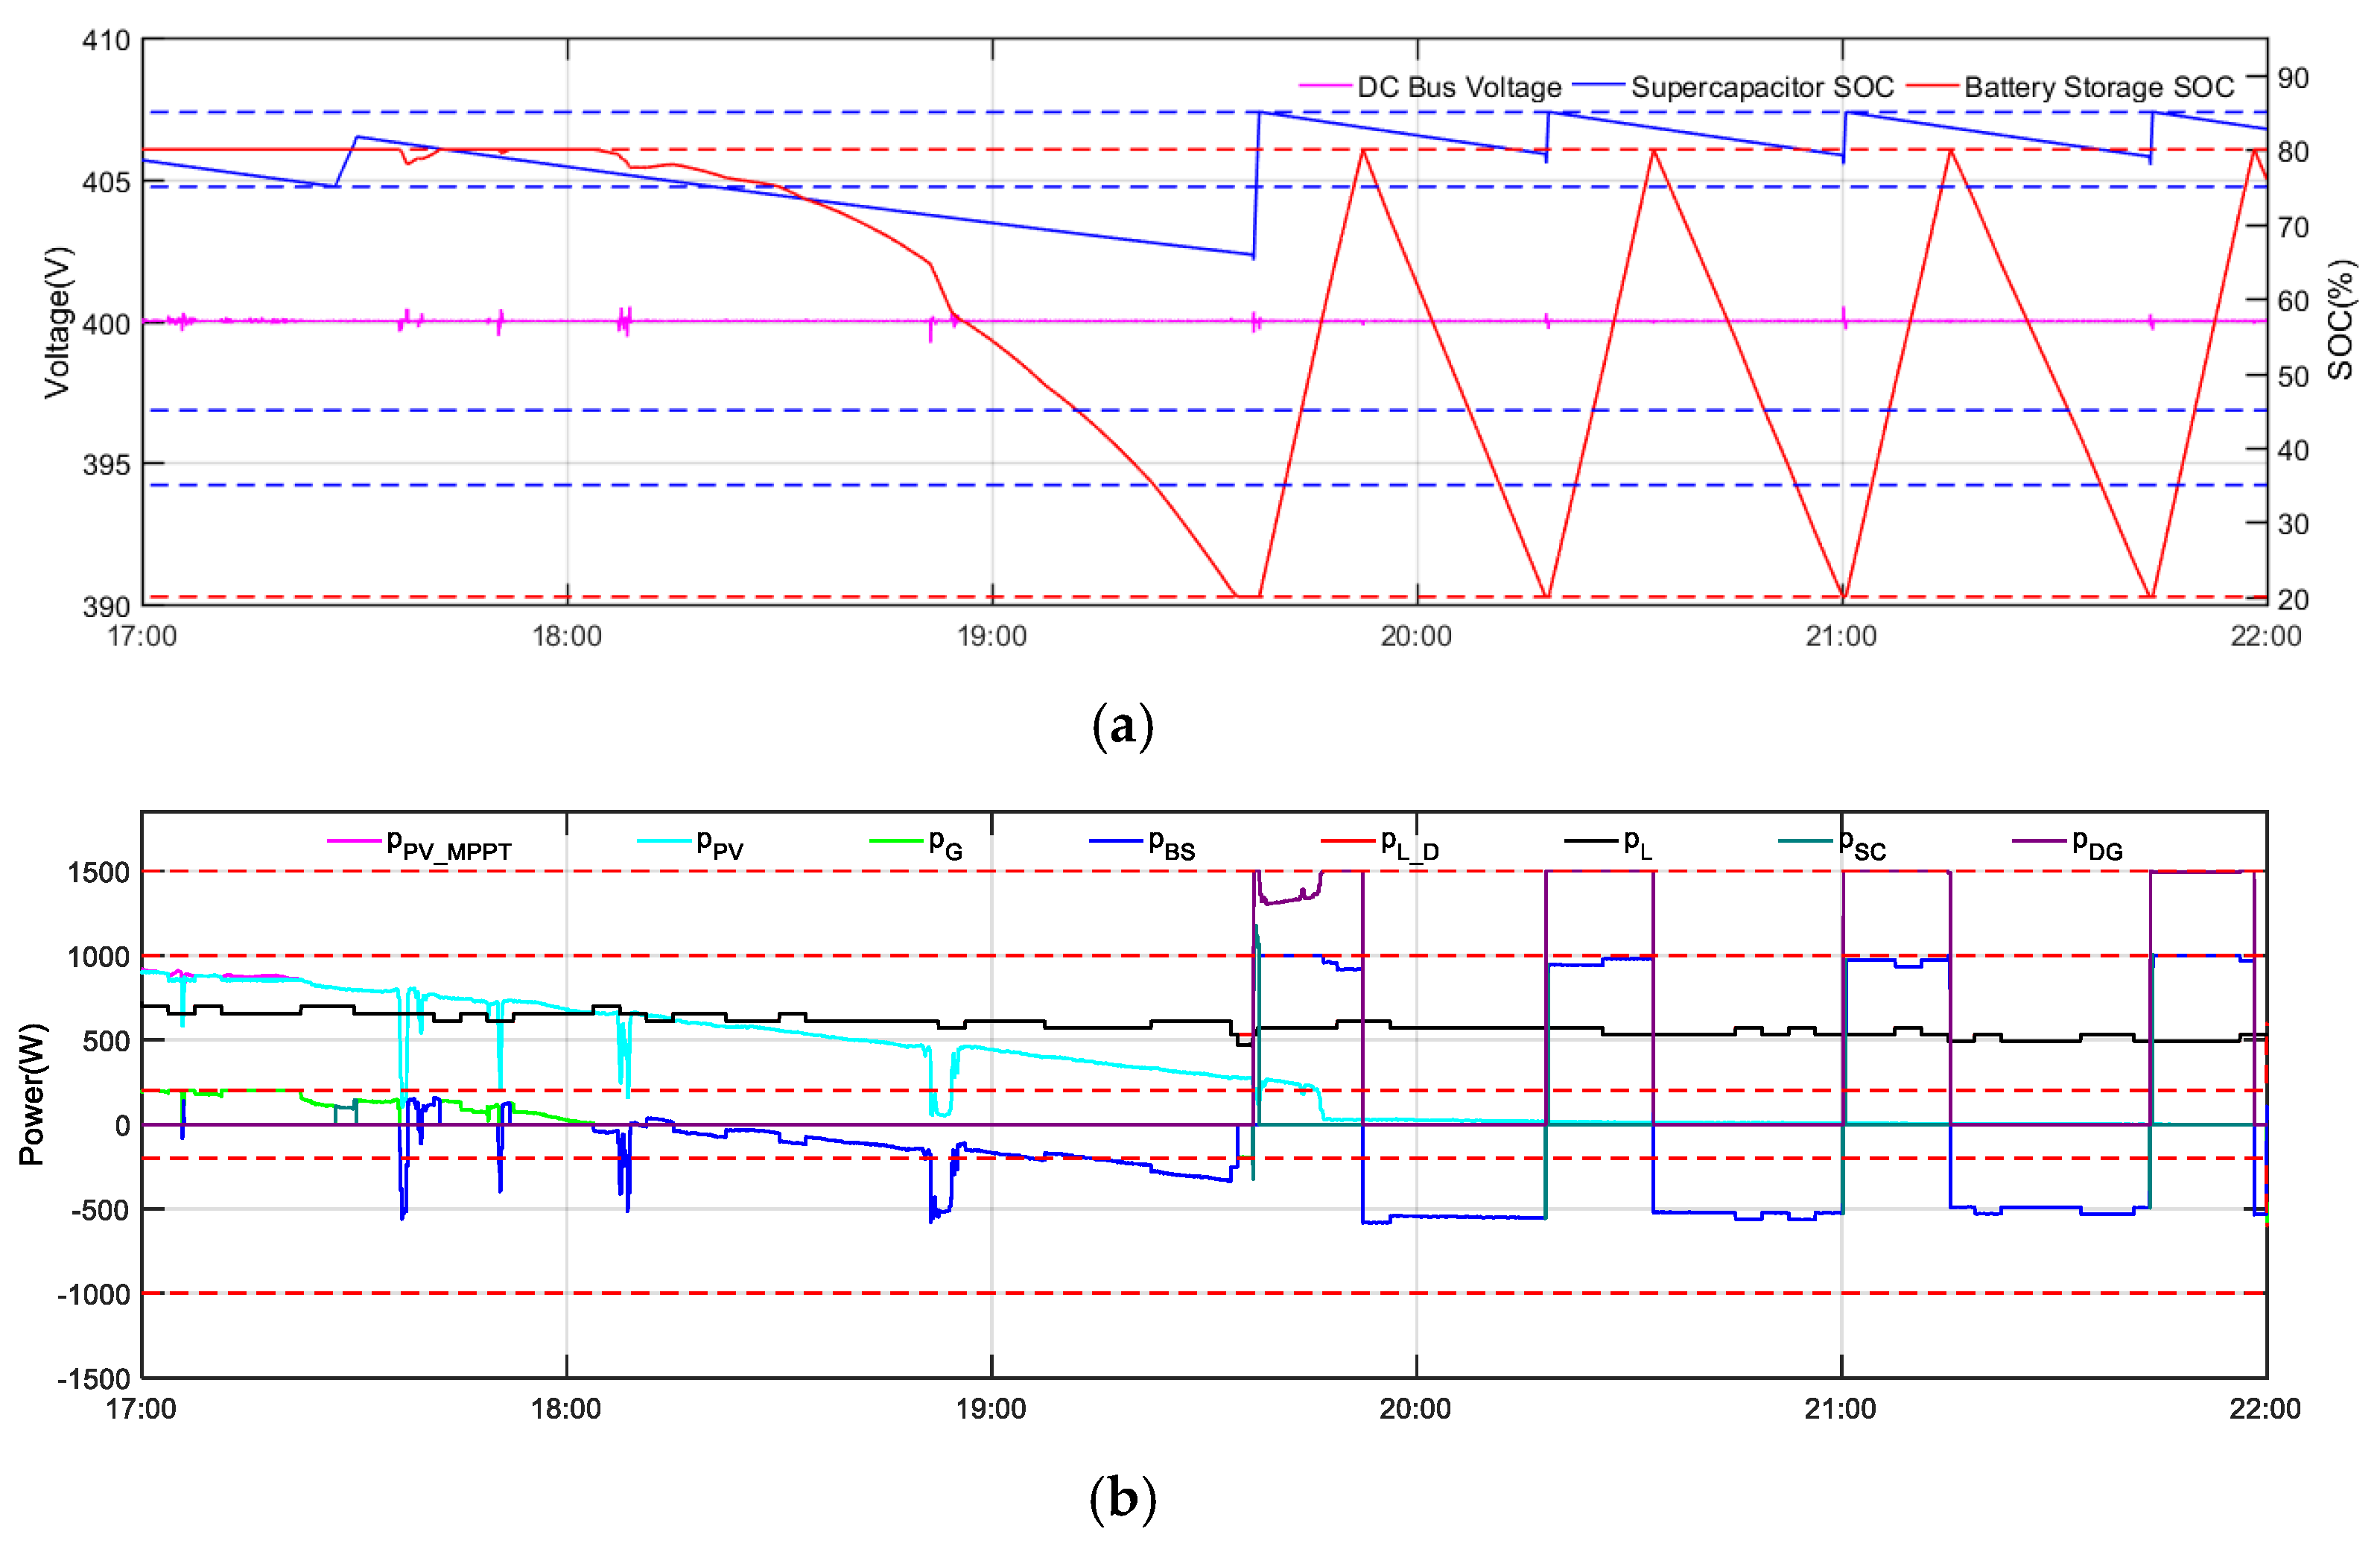
4.2.4. Simulation Results and Analyses for 17:00 to 22:00

Figure 16 is the results of the period 17:00–22:00 taken from Figure 7. During 17:00–22:00, sub-flowchart a operates and the k L _ C R I T is set as 80%. At the beginning of this period, the PV generated power is greater than the load demand power, the s o c B S reaches the S O C B S _ M A X , so the power from the public grid is the only power to support Δ p . Therefore, a small amount of PV power is shed when the public grid power reaches its limit p G _ M A X . The other part of the period shows that the PV generated power is less than the load demand power, so the simulation results are the same as the results analyzed for the period 6:00–8:00.
During the period 17:00–22:00, the DG is turned on also at 19:36, 20:18, 21:00, and 21:43 and shows the same results as those depicted above at 6:27, load shedding also happens at 19:34 and shows the same results as those depicted above at 10:42, and the SC is also recharged at 17:27, showing the same results as those depicted above at 9:33.

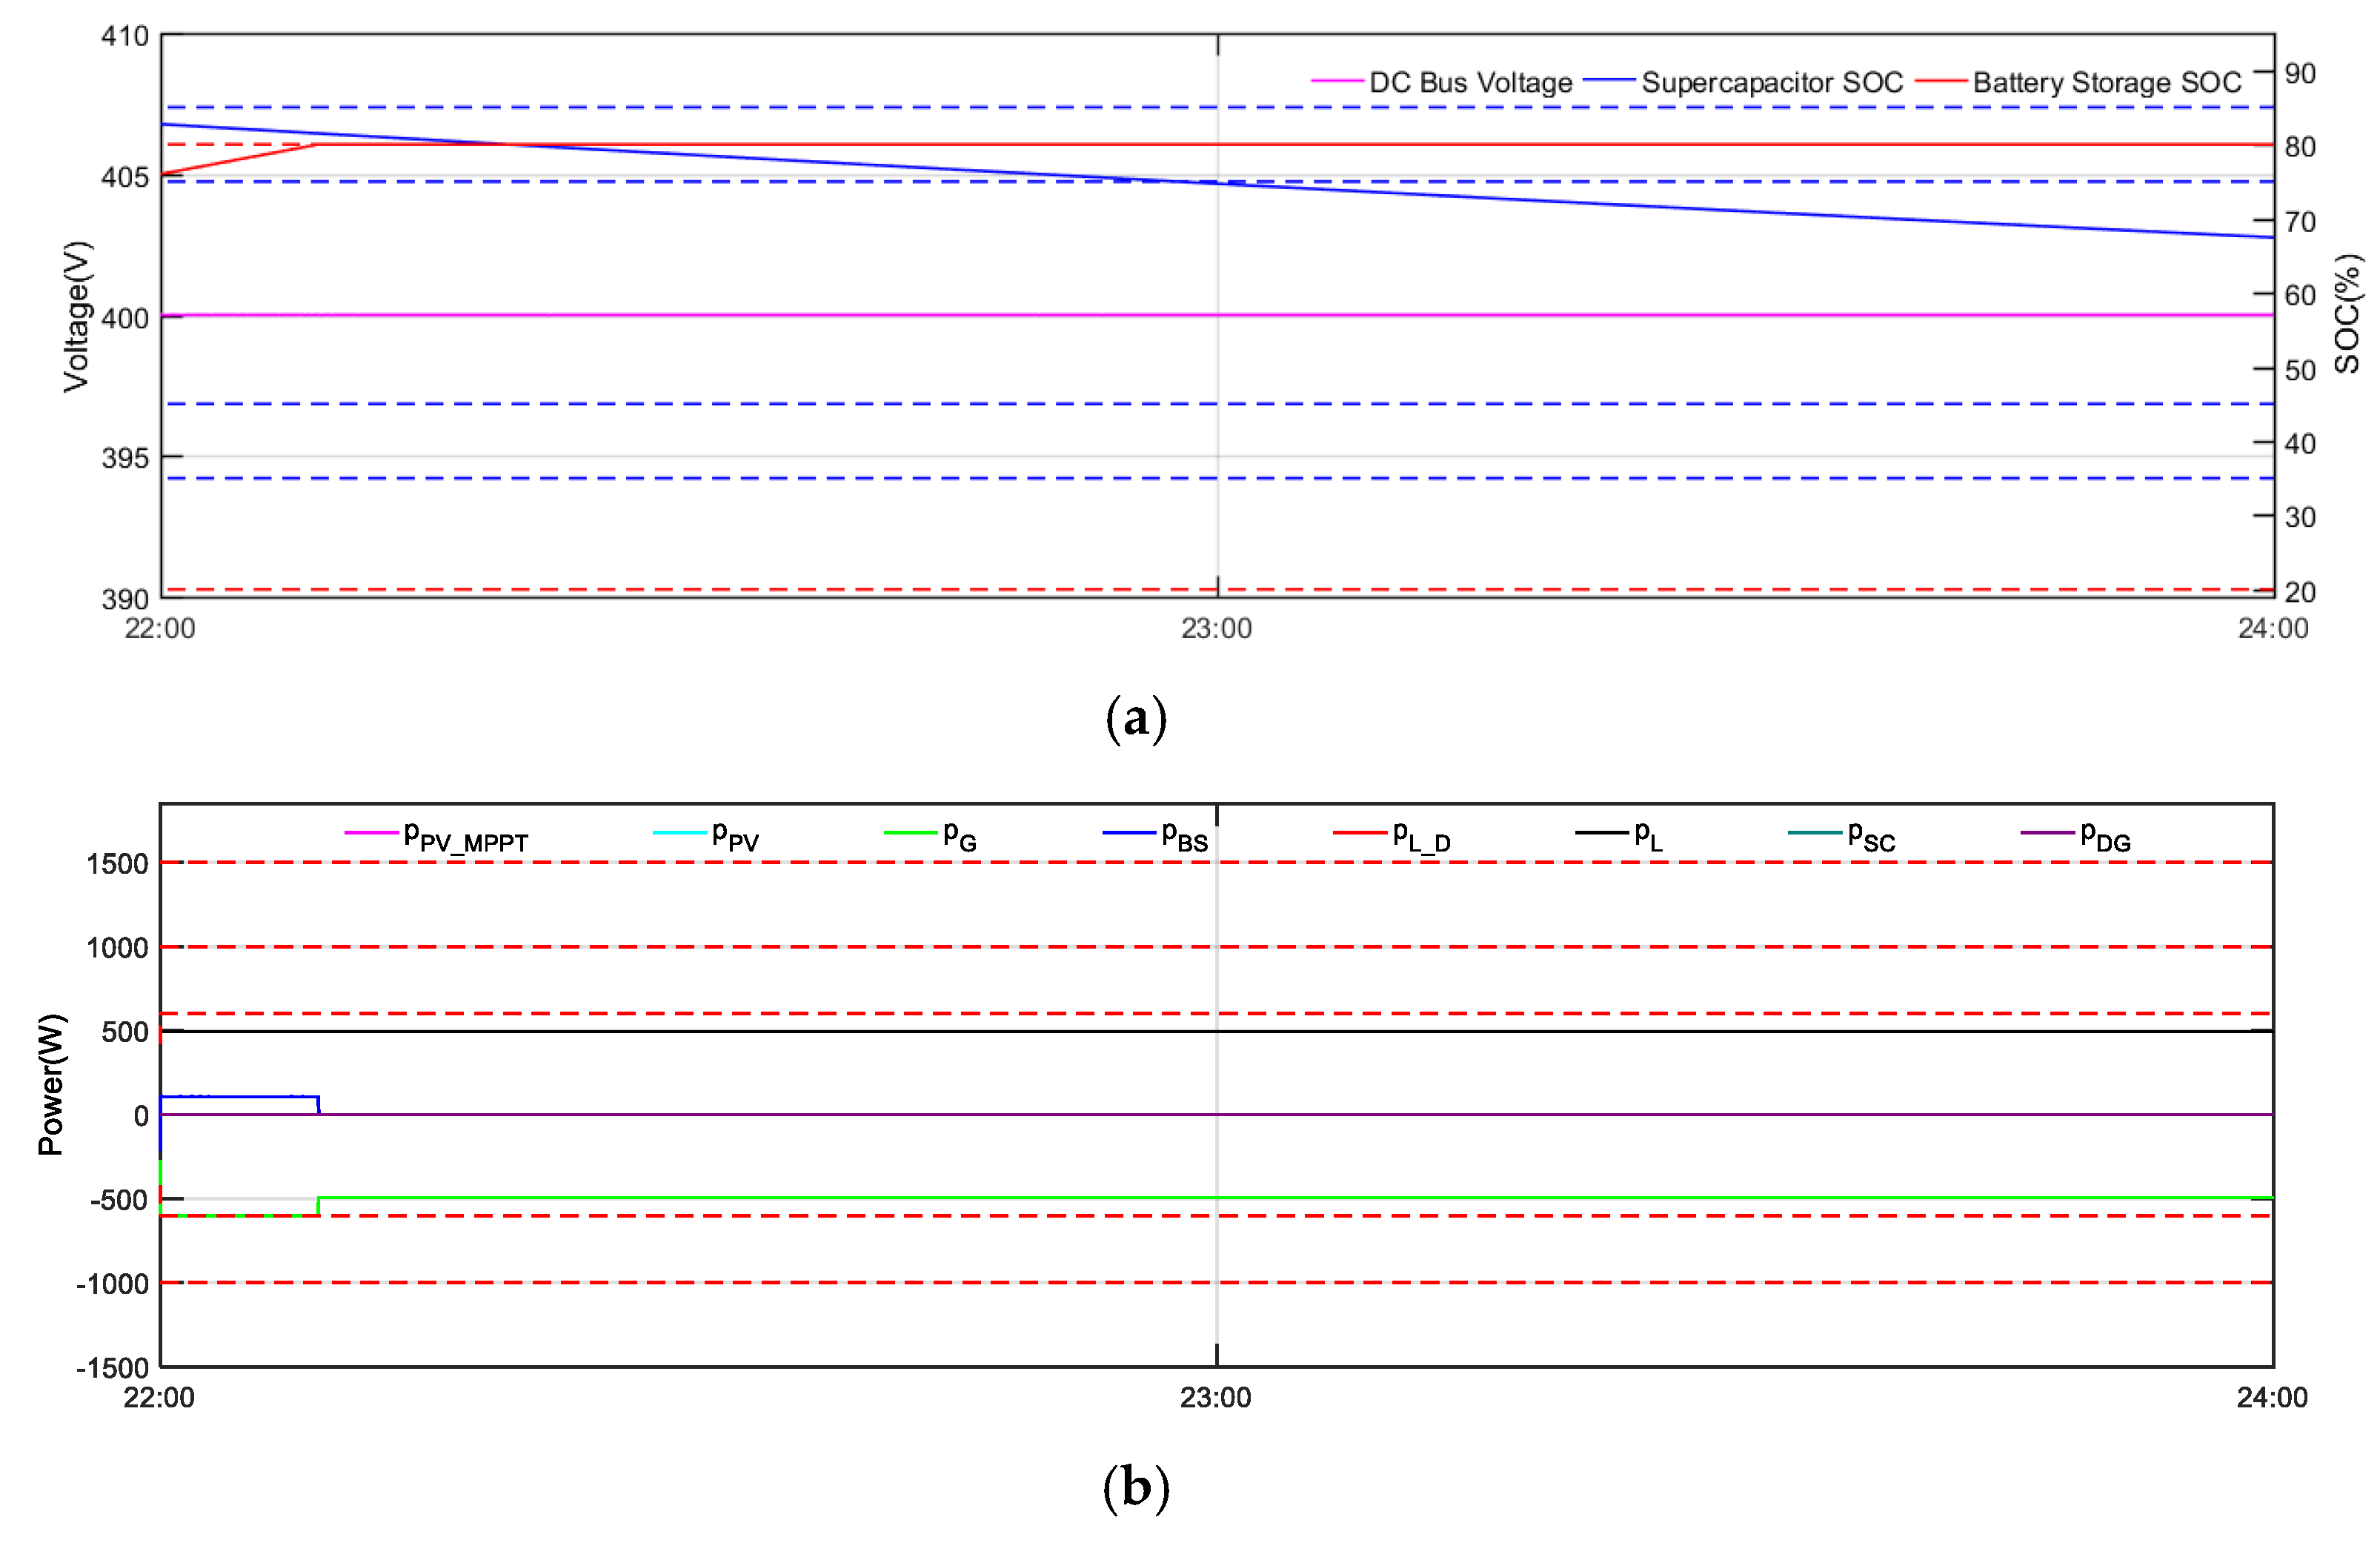
4.2.5. Simulation Results and Analyses for 22:00 to 24:00

Figure 17 presents the results of the period 22:00–24:00 taken from Figure 7. One notes that the same results are shown above as the results of the period 0:00–6:00. At 22:00 the public grid power limit is 600 W and supports the load demand and also charges the BS until the s o c B S reaches S O C B S _ M A X ; then, the public grid only supports the load demand.
From these simulation results, one can note the following:
The full DC microgrid can operate normally during the day and night with the proposed algorithm.
The microgrid power is well balanced with DC bus voltage fluctuation limited to achieve the microgrid power quality.
The specific algorithm can operate the microgrid power balance control and follow the constrained power management strategy in grid-connected mode as well as in islanded mode.
The constraints depicted in Section 2 of this paper can work.
Load real-time optimization can give the optimal load combination according to the predefined load constraints.

5. Conclusions

Based on system modeling, this paper presents a specific algorithm for both power control and power management applied to a full DC microgrid. It is an improved power control and management system, going beyond the current state-of-the-art systems in several aspects. First and foremost, the full DC microgrid can switch freely between grid-connected mode and islanded mode, which improves the reliability compared to a microgrid with only renewable sources or with only traditional energy sources. Furthermore, the algorithm takes into consideration the sluggish dynamic of the DG and the self-discharging characteristic of the SC. In addition, this algorithm considers both the process of power control and power management. Finally, demand-side management is applied with real-time load demand power optimization.
The simulation results obtained under MATLAB/Simulink verify the performance of the specific algorithm, which can keep the power balance with respect to the power management. The PV can operate in MPPT mode and PV power shedding mode. The BS can be the controllable source to well supply power deficiency, absorb the excess power during the on-grid operation of the full DC microgrid, as well as be recharged when the DG is turned on to reduce the usage of the DG during the off-grid operation of the full DC microgrid. The public grid can operate well under its limitation to balance the power in the full DC microgrid well. The DG can operate well as the backup source; meanwhile, the SC can operate to give good function on the power deficiency during DG start-up and be recharged in time.
Future work will focus on the techno-economic dispatching optimization of the full DC microgrid, according to forecast data and historical data, to achieve the lowest overall cost and more reasonable energy allocation, which will lay a solid foundation for a future full DC microgrid to be more easily accepted and constructed.

Author Contributions

W.B., M.S. and F.L. designed the research question; W.B. and M.S. performed the simulations; W.B., M.S., and F.L. analyzed the data and wrote the paper; M.S. and F.L. reviewed the paper. All authors have read and agreed to the published version of the manuscript.

Funding

This research received no external funding.

Conflicts of Interest

The authors declare no conflict of interest.

References

  1. Sechilariu, M.; Molines, N.; Richard, G.; Martell-Flores, H.; Locment, F.; Baert, J. Electromobility framework study: Infrastructure and urban planning for EV charging station empowered by PV-based microgrid. IET Electr. Syst. Transp. 2019, 9, 176–185. [Google Scholar] [CrossRef]
  2. Mariam, L.; Basu, M.; Conlon, M. Microgrid: Architecture, policy and future trends. Renew. Sustain. Energy Rev. 2016, 64, 477–489. [Google Scholar] [CrossRef]
  3. Kumar, M.; Tyagi, B. A state of art review of microgrid control and integration aspects. In Proceedings of the 2016 7th India International Conference on Power Electronics (IICPE), Patiala, India, 17–19 November 2016; pp. 1–6. [Google Scholar]
  4. Sechilariu, M.; Wang, B.; Locment, F.M.S.F.L. Power management and optimization for isolated DC microgrid. In Proceedings of the International Symposium on Power Electronics, Electrical Drives, Automation and Motion, Ischia, Italy, 18–20 June 2014; pp. 1284–1289. [Google Scholar]
  5. Sechilariu, M.; Locment, F.; Dos Santos, L.T. A conceptual framework for full optimal operation of a grid-connected DC microgrid. In Proceedings of the IEEE International Conference on Industrial Electronics for Sustainable Energy Systems (IESES), Hamilton, New Zealand, 31 January–2 February 2018; pp. 296–301. [Google Scholar]
  6. Lede, A.M.R.; Molina, M.; Martinez, M.; Mercado, P.E. Microgrid architectures for distributed generation: A brief review. In Proceedings of the IEEE PES Innovative Smart Grid Technologies Conference—Latin America (ISGT Latin America), Quito, Ecuador, 20–22 September 2017; pp. 1–6. [Google Scholar]
  7. Sechilariu, M.; Locment, F. Urban DC Microgrid: Intelligent Control and Power Flow Optimization, 1st ed.; Butterworth-Heinemann: Oxford, UK, 2016. [Google Scholar]
  8. Alseyat, A.; Park, J.-D. Multi-Agent System using JADE for Distributed DC Microgrid System Control. In Proceedings of the North American Power Symposium (NAPS), Wichita, KS, USA, 13–15 October 2019; pp. 1–5. [Google Scholar]
  9. Han, Y.; Ning, X.; Yang, P.; Xu, L. Review of Power Sharing, Voltage Restoration and Stabilization Techniques in Hierarchical Controlled DC Microgrids. IEEE Access 2019, 7, 149202–149223. [Google Scholar] [CrossRef]
  10. Amicarelli, E.; Tran, Q.T.; Bacha, S. Multi-agent system for day-ahead energy management of microgrid. In Proceedings of the 2016 18th European Conference on Power Electronics and Applications (EPE’16 ECCE Europe), Karlsruhe, Germany, 5–9 September 2016; pp. 1–10. [Google Scholar]
  11. Dos Santos, L.T.; Sechilariu, M.; Locment, F. Prediction-based economic dispatch and online optimization for grid-connected DC microgrid. In Proceedings of the IEEE International Energy Conference (ENERGYCON), Leuven, Belgium, 4–8 April 2016; pp. 1–6. [Google Scholar]
  12. Dos Santos, L.T.; Sechilariu, M.; Locment, F. Prediction-based optimization for islanded microgrid resources scheduling and management. In Proceedings of the IEEE 24th International Symposium on Industrial Electronics (ISIE), Buzios, Brazil, 3–5 June 2015; pp. 760–765. [Google Scholar]
  13. Yi, Z.; Dong, W.; Etemadi, A.H. A Unified Control and Power Management Scheme for PV-Battery-Based Hybrid Microgrids for Both Grid-Connected and Islanded Modes. IEEE Trans. Smart Grid 2017, 9, 5975–5985. [Google Scholar] [CrossRef]
  14. Sanjeev, P.; Padhy, N.P.; Agarwal, P. Autonomous Power Control and Management Between Standalone DC Microgrids. IEEE Trans. Ind. Inform. 2017, 14, 2941–2950. [Google Scholar] [CrossRef]
  15. Sharma, R.K.; Mishra, S. Dynamic Power Management and Control of a PV PEM Fuel-Cell-Based Standalone ac/dc Microgrid Using Hybrid Energy Storage. IEEE Trans. Ind. Appl. 2017, 54, 526–538. [Google Scholar] [CrossRef]
  16. Thirugnanam, K.; Kerk, S.K.; Yuen, C.; Liu, N.; Zhang, M. Energy Management for Renewable Microgrid in Reducing Diesel Generators Usage With Multiple Types of Battery. IEEE Trans. Ind. Electron. 2018, 65, 6772–6786. [Google Scholar] [CrossRef]
  17. Solanki, B.; Raghurajan, A.; Bhattacharya, K.; Cañizares, C. Including smart loads for optimal demand response in integrated energy management systems for isolated microgrids. IEEE Trans. Smart Grid 2017, 8, 1. [Google Scholar] [CrossRef]
  18. Picco, I.U.; Lotero, R.C. Photovoltaic system simulation model for steady-state microgrid energy management application. In Proceedings of the 2019 IEEE PES Innovative Smart Grid Technologies Conference—Latin America (ISGT Latin America), Gramado, Brazil, 15–18 September 2019; pp. 1–6. [Google Scholar]
  19. Yin, C.; Sechilariu, M.; Locment, F. Diesel generator slow start-up compensation by supercapacitor for DC microgrid power balancing. In Proceedings of the IEEE International Energy Conference (ENERGYCON), Leuven, Belgium, 4–8 April 2016; pp. 1–6. [Google Scholar]
  20. Yin, C.; Wu, H.; Locment, F.; Sechilariu, M. Energy management of DC microgrid based on photovoltaic combined with diesel generator and supercapacitor. Energy Convers. Manag. 2017, 132, 14–27. [Google Scholar] [CrossRef]
  21. Yin, C.; Wu, H.; Sechilariu, M.; Locment, F. Power Management Strategy for an Autonomous DC Microgrid. Appl. Sci. 2018, 8, 2202. [Google Scholar] [CrossRef] [Green Version]
  22. Khoa, T.D.; Dos Santos, L.T.; Sechilariu, M.; Locment, F. Load shedding and restoration real-time optimization for DC microgrid power balancing. In Proceedings of the IEEE International Energy Conference (ENERGYCON), Leuven, Belgium, 4–8 April 2016; pp. 1–6. [Google Scholar]
  23. Dos Santos, L.T.; Sechilariu, M.; Locment, F. Optimized Load Shedding Approach for Grid-Connected DC Microgrid Systems under Realistic Constraints. Buildings 2016, 6, 50. [Google Scholar] [CrossRef] [Green Version]
  24. Ibm Ilog Cplex Optimizer. Available online: http://ibm.com (accessed on 1 April 2020).
Figure 1. Overview of full direct current (DC) microgrid.
Applsci 10 02544 g001
Figure 2. Flowchart of operational power control and management algorithm.
Applsci 10 02544 g002
Figure 3. Flowchart of available power calculation.
Applsci 10 02544 g003
Figure 4. Sub-flowchart of operational power control and management algorithm.
Applsci 10 02544 g004
Figure 5. Sub-flowchart a and sub-flowchart b.
Applsci 10 02544 g005
Figure 6. Weather data on the 20th June 2018 in Compiegne, France.
Applsci 10 02544 g006
Figure 7. Curves of common DC bus voltage and state of charge (SOC) of storage (a) and curves of power (b).
Applsci 10 02544 g007
Figure 8. Curves of common DC bus voltage and SOC of storage (a) and curves of power (b) during the period 0:00–6:00.
Applsci 10 02544 g008
Figure 9. Curves of common DC bus voltage and SOC of storage (a) and curves of power (b) while the supercapacitor (SC) is recharging.
Applsci 10 02544 g009
Figure 10. Curves of common DC Bus voltage and SOC of storage (a) and curves of power (b) during the period 6:00–8:00.
Applsci 10 02544 g010
Figure 11. Curves of common DC Bus voltage and SOC of storage (a) and curves of power (b) when the diesel generator (DG) is turned on.
Applsci 10 02544 g011
Figure 12. Curves of common DC bus voltage and SOC of storage (a) and curves of power (b) during the period 8:00–17:00.
Applsci 10 02544 g012
Figure 13. Curves of common DC bus voltage and SOC of storage (a) and curves of power (b) during load shedding.
Applsci 10 02544 g013
Figure 14. Curves of common DC Bus voltage and SOC of storage (a) and curves of power (b) during PV shedding.
Applsci 10 02544 g014
Figure 15. Curves of common DC bus voltage and SOC of storage (a) and curves of power (b) during SC recharging.
Applsci 10 02544 g015
Figure 16. Curves of common DC bus voltage and SOC of storage (a) and curves of power (b) during the period 17:00–22:00.
Applsci 10 02544 g016
Figure 17. Curves of common DC bus voltage and SOC of storage (a) and curves of power (b) during the period 22:00–24:00.
Applsci 10 02544 g017
Table 1. General parameters.
ParameterValueParameterValue
P P V _ S T C 1750 W T D G _ O N _ M A X 3600 s
P B S _ M A X 1000 W S O C S C _ M A X _ M A X 85%
S O C B S _ M A X 80% S O C S C _ M A X _ M I N 75%
S O C B S _ M I N 20% S O C S C _ M I N _ M A X 45%
S O C B S _ 0 50% S O C S C _ M I N _ M I N 35%
C R E F 6.6 Ah S O C S C _ 0 75%
v D C 400 V P S C _ M A X 1500 W
k L _ C R I T 80% or 100% P G _ M A X 200 W or 600 W
P D G _ M A X 1500 W T S C _ M I N 3 min
Table 2. Scenario parameters.
PeriodDescriptionChoose of Power Strategy k L _ C R I T P G _ M A X
0:00–6:00Low load demandSub-flowchart b100%600 W
6:00–8:00Different according to the seasonsSub-flowchart a80%200 W
8:00–17:00Working time in buildingSub-flowchart a80%200 W
17:00–22:00High load demand from the public gridSub-flowchart a80%200 W

