Article

A Study on the Utilization of Clayey Soil as Embankment Material through Model Bearing Capacity Tests

Department of Civil Engineering, Kunsan National University; Gunsan 54150, Korea
*
Author to whom correspondence should be addressed.
Appl. Sci. 2020, 10(7), 2315; https://doi.org/10.3390/app10072315
Submission received: 2 March 2020 / Revised: 20 March 2020 / Accepted: 25 March 2020 / Published: 28 March 2020
(This article belongs to the Section Civil Engineering)

Abstract

:
The Saemangeum seawall, located on the western coast of Korea, is 33.8 km long and is known as the longest embankment in the world. The Saemangeum project is underway for road, railway, and port constructions for internal development. In the Saemangeum area, suitable granular soil for embankment material is difficult to obtain. However, silty clay is widely distributed. In this study, a series of model-bearing capacity tests were conducted as a basic study for using clayey soils as embankment materials. The model bearing capacity tests were carried out using a standard metal mold and a customized metal box. The test results showed that clayey soil, with normal moisture content (NMC), exhibited a large deformation and low bearing capacity. However, when the clay was well-compacted, with optimum moisture content (OMC), it exhibited a higher bearing capacity than dense sand. In addition, when crushed gravel and composite geotextiles were placed in the clayey soil with NMC, the bearing capacity was higher than that of dense sand. From the viewpoint of the bearing capacity, it is considered that clayey soil can be used as an embankment material when clay, crushed gravel, and composite geotextiles are properly combined.

1. Introduction

Saemangeum is one of the largest land reclamations in South Korea. Its development began in 1991, with the construction of the world’s longest man-made seawall or dike [1,2]. Saemangeum is a tidal flat located on the central western coast of Korea (see Figure 1). The Saemangeum project is underway for road, railway, and port constructions for internal development. With the geographical location of Saemangeum, acquiring good quality, granular fill materials for embankments becomes challenging. Suitable granular soil for embankment material is difficult to find in the Saemangeum area. However, silty clay is widely distributed. With the great demand for quantity, the procurement and transportation of good quality fill materials for embankments may be costly and uneconomical [3]. Therefore, this study will maximize the utilization of clayey soil, which will serve as an effective, alternative solution to the limited supply of good quality, granular fill materials in the Saemangeum projects.
Why soft clay? Geologically, the Saemangeum area has vast wetlands and flat terrain wherein fine materials, like clay, are very abundant and readily available. Clay has high potential and may be suitable for road embankments if designed and conditioned properly. However, very limited studies can be found concerning the feasibility of soft clay as a road embankment material [4]. Soft clay is rarely used as a fill material and, because of its documented poor engineering properties, only few researchers have considered its high potential for road embankments. The Federal Highway Administration (FHWA) [5] states that granular soils, like sand and gravel, are highly desirable as embankment materials because they can facilitate drainage, prevent saturation, are well-graded, and are capable of being well-compacted. On the other hand, finer materials, like silts and clays, are considered as less desirable and unsuitable for use as embankment materials, again because of their poor engineering properties [4,5].
High-strength, clayey soil can be attained when the soil has optimum water content, is properly compacted, and is clear of unsuitable materials. However, such conditions are very difficult to implement at the construction site. In such instances, clayey soil with high water content can probably be used on-site. Considering the poor engineering properties of clay, various soil improvements can be applied—such as adding reinforcements or stabilizing agents. It is expected that the soil should have a higher bearing capacity when reinforcements are added and proper soil conditioning is applied [6,7,8]. Geosynthetics are popular reinforcements that are widely used to improve the load-bearing capacity of soil [6,9,10,11]. Granular materials, such as gravel and sand, are also used with clayey soils to hasten the consolidation process and increase the soil-bearing capacity. Several studies have also showed that adding reinforcements to soft clay reduces settlement and increases the soil strength [4,12,13,14,15,16,17,18,19,20].
In this present study, a series of model bearing capacity tests are carried out to investigate the capability of soft clay to support imposed loading and its viability for use as embankment material. Materials, like crushed gravel and composite geotextiles, are used as reinforcements for the soft clay. A desirable embankment material, such as sand, is also tested as a basis for comparison. Hence, this study undertakes eight mold model test cases and four box model test cases, which consist of clay, loose sand, dense sand, and combinations of clay with crushed gravel and composite geotextiles.

2. Flow Diagram of the Experimental Procedure

Figure 2 shows the experimental flow diagram of the series of model bearing capacity tests undertaken in this study. After the concept and designs were finalized and materialized, various laboratory tests were conducted to determine the properties of the materials to be used. There were two major parts to the experiment: (1) the mold model test and (2) the box model test. The mold model test was conducted prior to the large, box model test, with eight different sets of materials. After evaluating the mold test results, only four model cases were considered for the box model test. Then, experiment evaluation and analysis on the bearing capacity test results commenced.

3. Materials and Equipment

3.1. Materials and Laboratory Testing

The materials used in the experiment were clays, sands, crushed gravels, and composite geotextiles. The clay was sourced from near the Gunsan Train Station, South Korea. Geographically, Gunsan is situated near the coast, approximately 200 km southwest of Seoul (see Figure 1). Table 1 shows the properties of the clay sample obtained from the laboratory testing for soil classification.
The soil was then classified in the Unified Soil Classification System (USCS) as inorganic clay (CL). The compaction test (Korean Standard, KS F 2312) showed that the clayey soil had an optimum moisture content (OMC) of 14.5% and a maximum dry unit weight of 17.75 kN/m3. The clayey soil used during the experiment had two normal moisture contents (NMC): 30% (NMC 1), during the mold model test, and 35% (NMC 2), during the box model test. The soft clay will, therefore, be referred to as the NMC clay in the rest of this paper. The particle-size analysis (Korean Standard, KS F 2302) of the clayey soil is shown in Figure 3, wherein 97% is finer than 74 μmm (No. 200 sieve).
Another material used in this experiment was sand. The sand was tested as the basis for comparison because it has proven to be an effective backfill material and is also a desirable embankment material [5]. In this experiment, both loose sand and dense sand were used. For the mold model test, loose sand was directly placed in the mold, without compaction, while dense sand was compacted by hammering the sides of the mold. However, compaction in the box model test was different. The air pluviation method [10] was conducted using the sand sample. The falling height, when the sand was dropped, varied from 10 to 100 cm. The relative density of 50% was then obtained at a falling height of approximately 34.6 cm, with a corresponding unit weight of approximately 14.42 kN/m3. Hence, to achieve dense sand in the box model experiment based on the results of the air pluviation method, the sand sample will be poured into the box with a constant falling height of 80 cm. The properties of sand used in this study are tabulated in Table 2. The sand had a specific gravity, Gs, equal to 2.715. The sand was classified, using the USCS, as poorly-graded sand (SP), whose particle sizes were finer than the No. 20 sieve, but were generally retained in the No. 40 sieve (see Figure 3).
Crushed gravel is also used in this experiment to reinforce the clayey soil. The crushed gravel was classified, using the USCS, as poorly graded gravel (GP). A specific gravity test was done for the gravel sample based on AASHTO T 85 and ASTM C 127. Table 3 shows the properties of the crushed gravel for both model tests. The particle size distribution of the crushed gravel is shown in Figure 3. Gravel 1 was used in the mold model test cases, with 99.7% passing through the 13 mm diameter sieve and 97% being retained in the No. 4 sieve. Gravel 2 was larger than Gravel 1 and was used in the box model test cases, with 95% passing through the 25 mm diameter sieve and 57.43% being retained in the No. 4 sieve.
Lastly, another reinforcement material used in this experiment was the composite geotextile (Daeyoungeotech, Gimcheon, Gyeongsangbukdo, Korea). The composite geotextiles were composed of non-woven and woven polyethylene geotextiles, with a thickness of approximately two millimeters. Their tensile strengths (Korean Standard, KS K ISO 10319) are shown in Table 4.

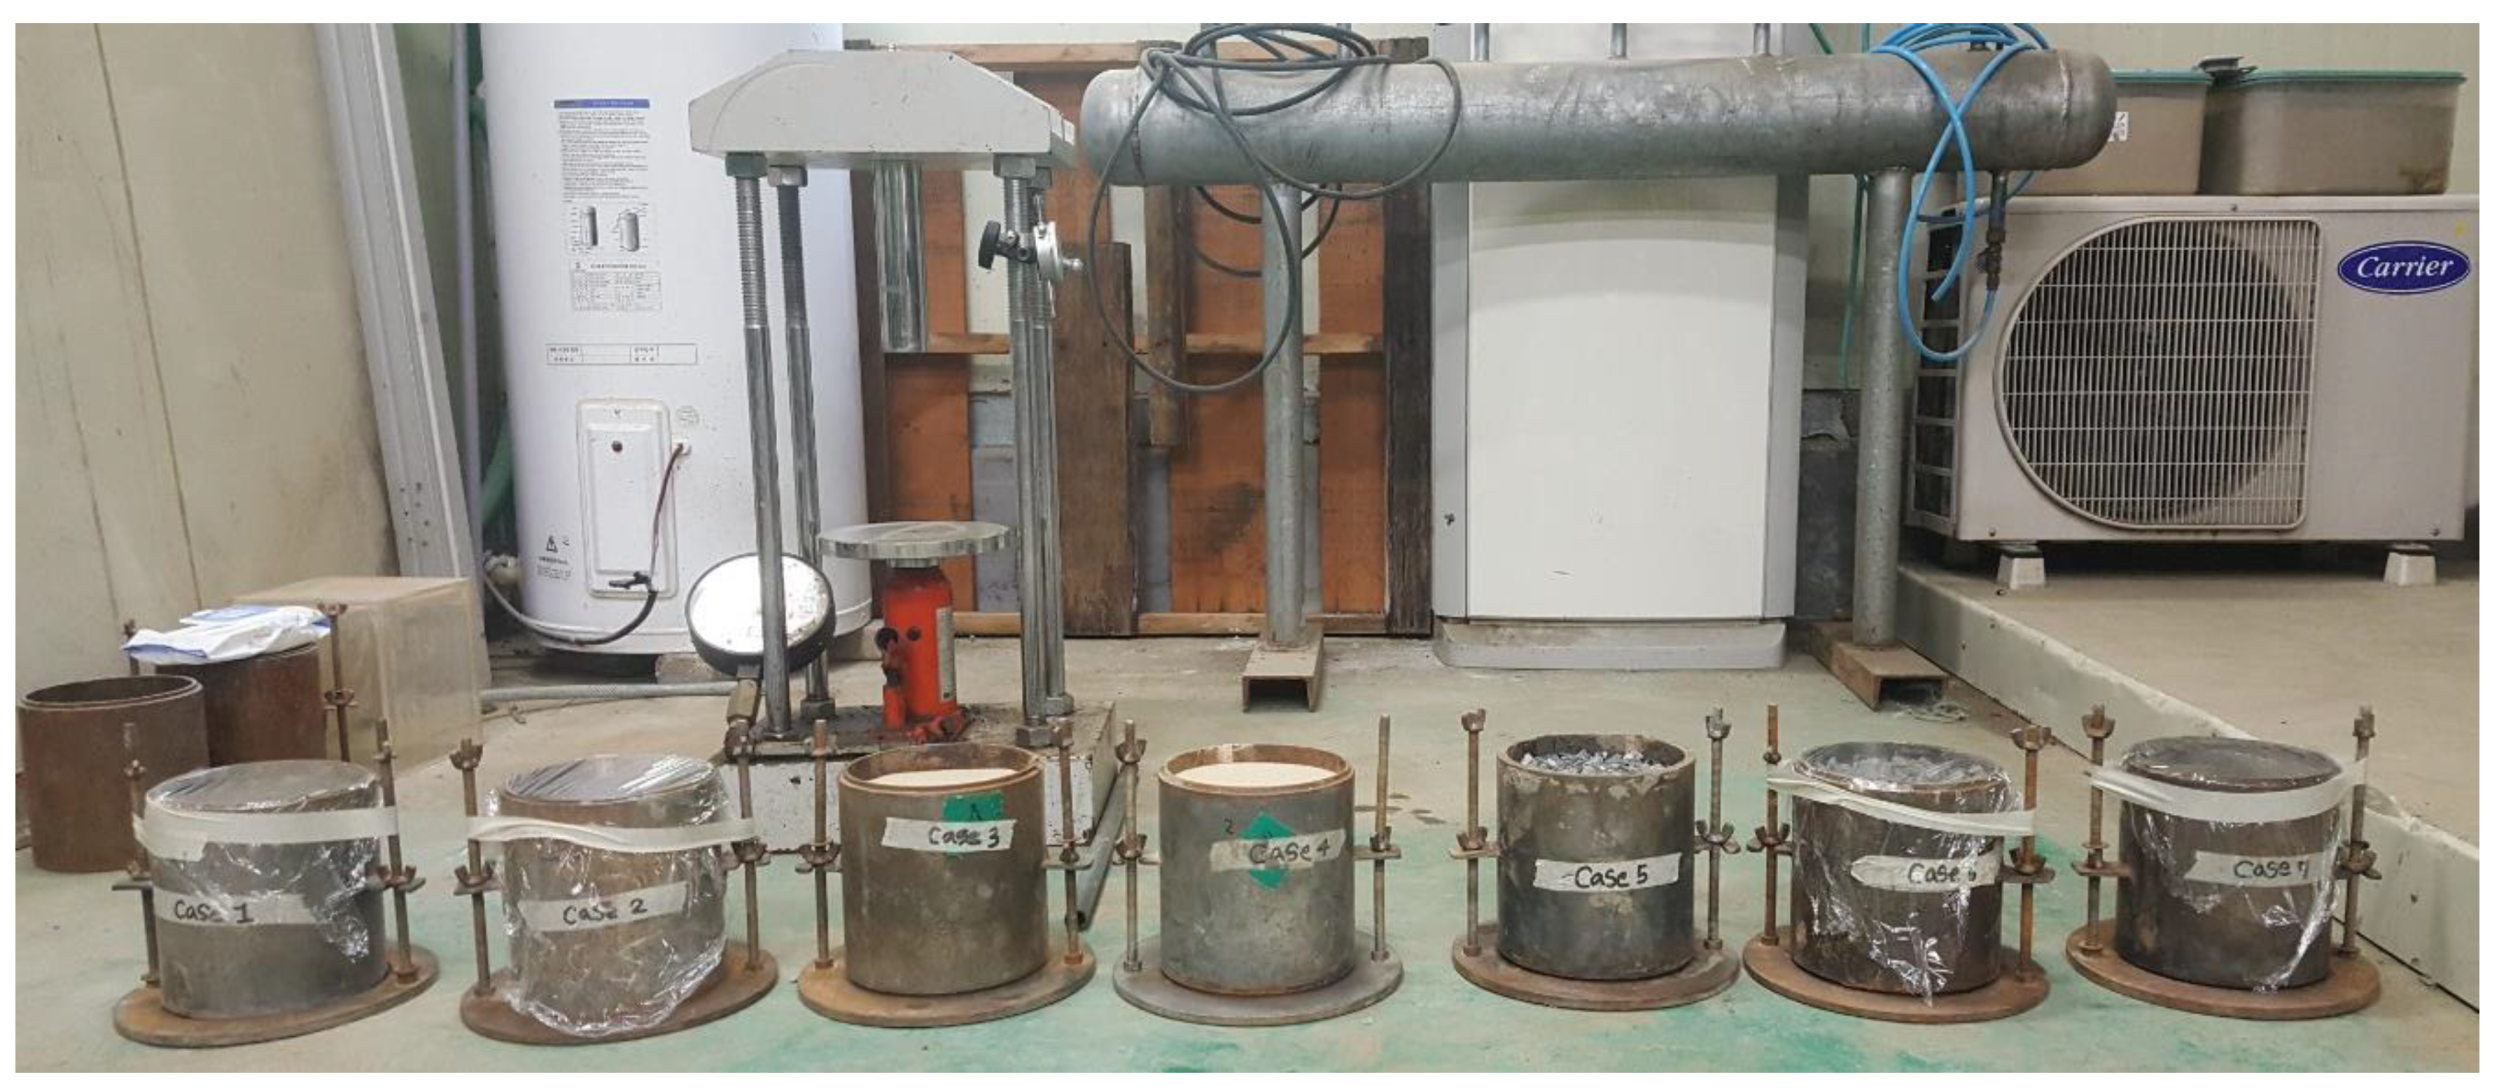
3.2. Mold Model Test Equipment

The first part of the basic bearing capacity undertaken in this study was the mold model test. There were eight sets of standard, metal molds, 150 mm in diameter and 175 mm in height, that were used to contain the material samples (see Figure 4). The molds were then placed on California Bearing Ratio (CBR) equipment (KATS (Korean Agency for Technology and Standards, Eumseong, Chungcheongbukdo, Korea) to measure the bearing capacity of the material sample at certain penetrations (see Figure 5). The penetration dial gauge was controlled using a mechanical jack, with a 1 mm/min penetration rate, and the load was recorded from the load gauge.

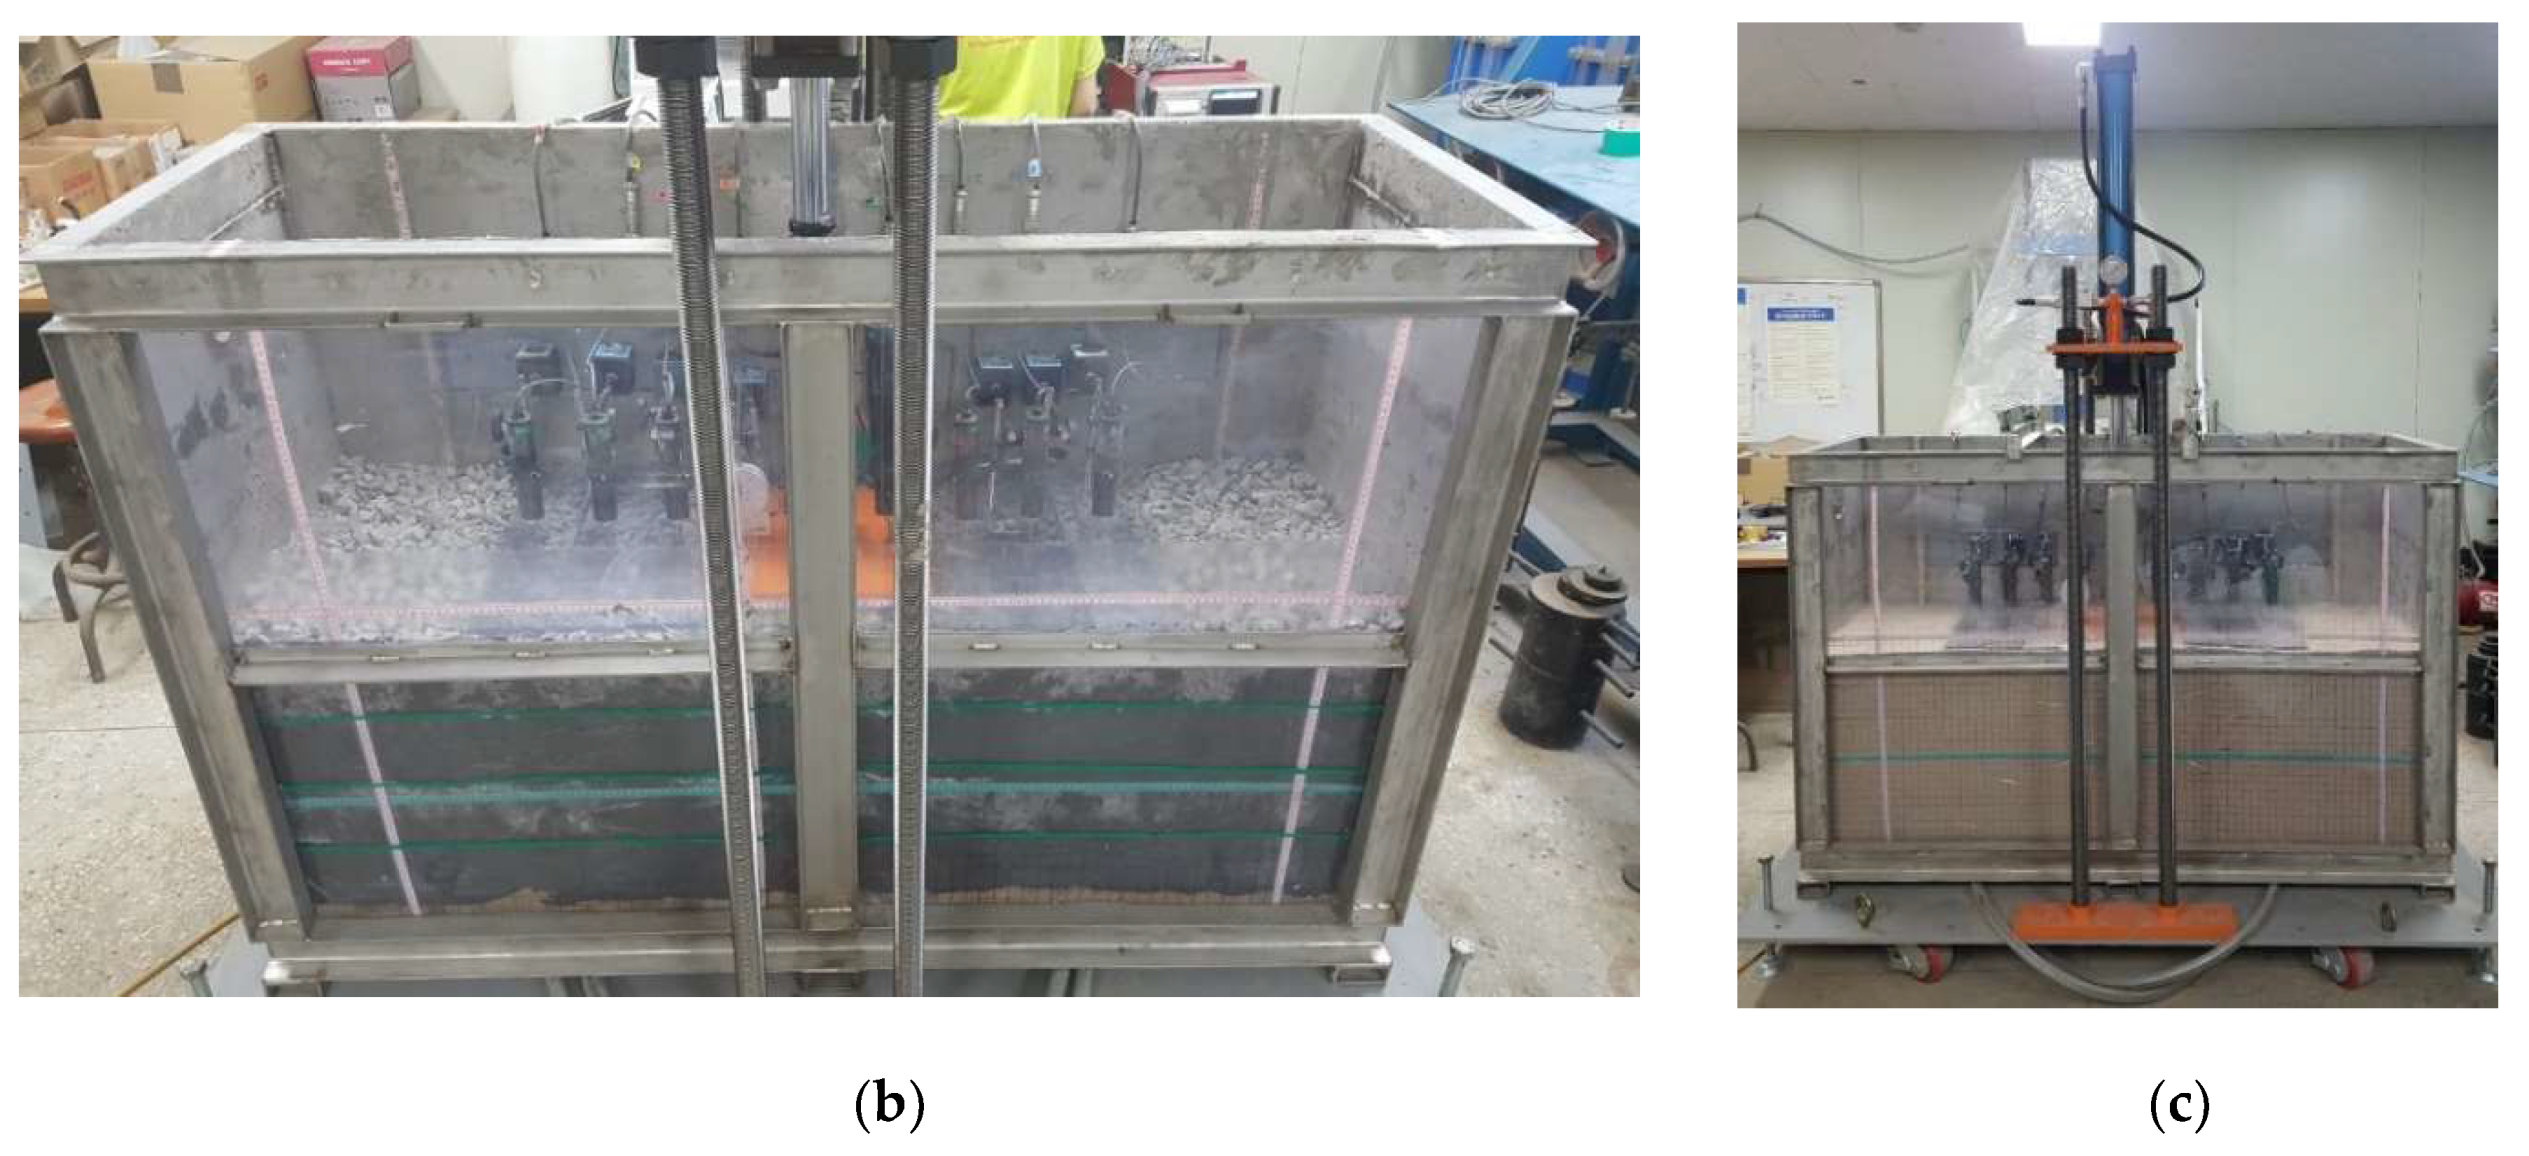
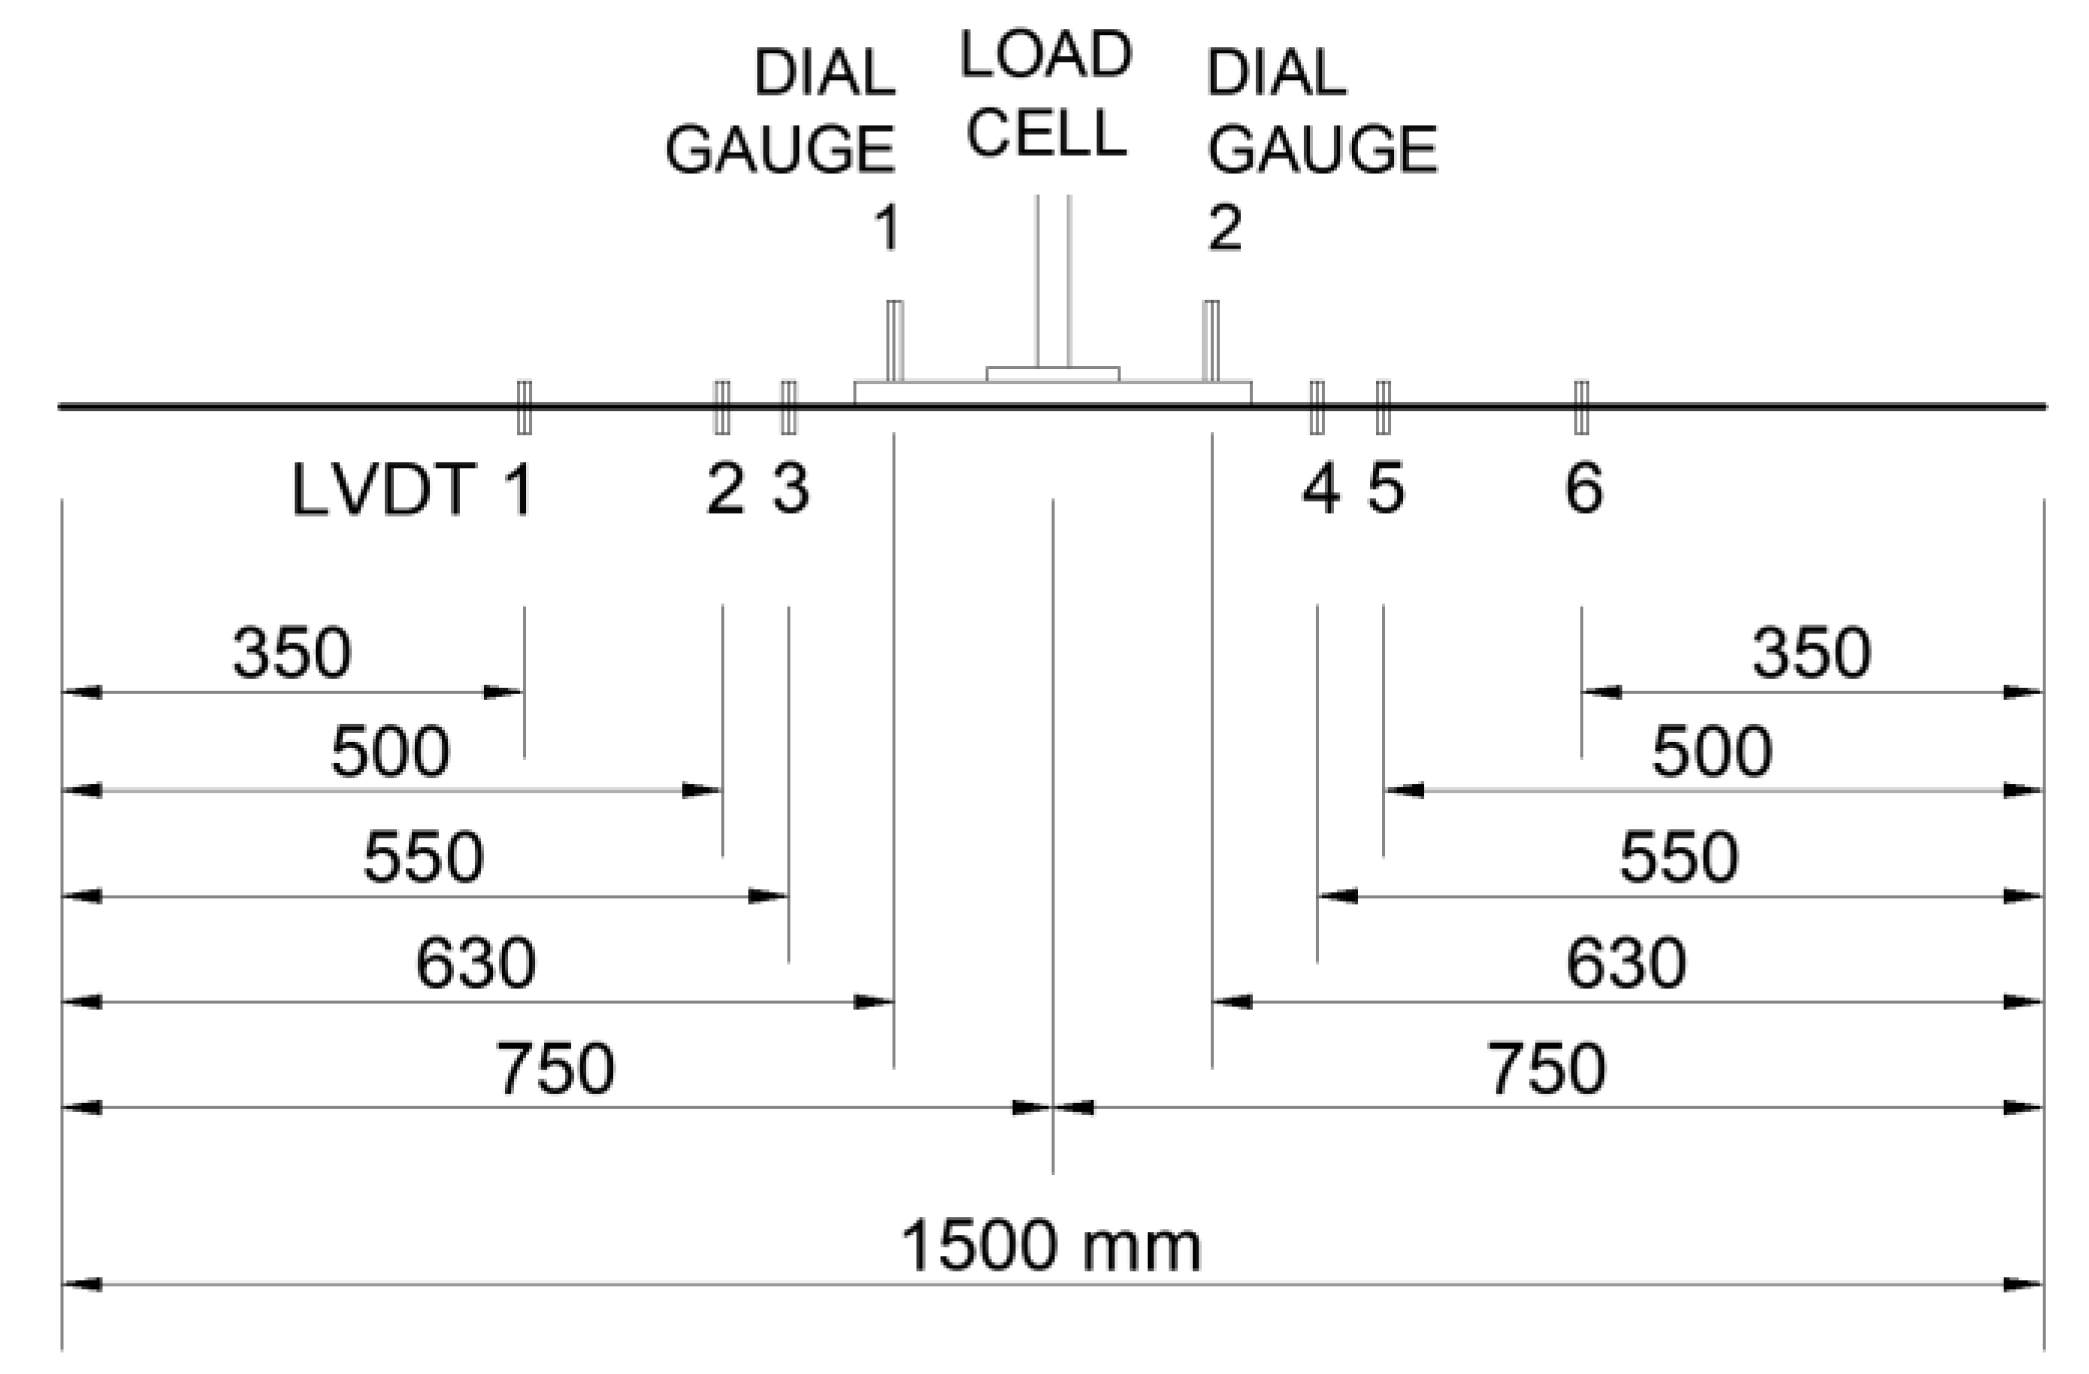
3.3. Box Model Test Equipment

The second part of the experiment was the box model test. The equipment used in this experiment was composed of a customized specimen box and a loading system assembly, as illustrated in Figure 6a. The mobile or detachable loading system was placed on the middle–top of the specimen box. The loading system had a maximum capacity of five tons and a minimum loading speed of 1.7 mm/s.
The specimen box had internal, clear dimensions of 1.5 m in length, 0.5 m in width, and 1.0 m in height. The left- and right-side walls of the specimen box were made of 5 mm thick stainless-steel plates and reinforced with 40 by 5 mm thick flat steel bars, spaced at 175 mm on-center vertically, and 75 by 40 by 5 mm thick steel channels at the perimeters of the walls. Similarly, the rear wall of the specimen box was made of a 5 mm thick stainless-steel plate and reinforced with 40 by 5 mm thick flat steel bars, spaced at 175 mm on-center vertically, and 75 by 40 by 5 mm thick steel channels at the center and at the perimeter of the wall. The front wall was made of a 10 mm thick, transparent, polycarbonate sheet, through which the interior could be observed (see Figure 6b,c) and was reinforced horizontally with 40 by 5mm thick, equal angle steel bars, placed at the center and vertically, with 75 by 40 by 5 mm thick steel channels at the center and the perimeter of the wall. The top of the specimen box was kept open for the operations, while two lengths of detachable, 40 by 5 mm thick, equal angle steel bars were placed as reinforcements during tests. The bottom plate was made of a 5 mm thick, stainless-steel plate and braced with 75 by 40 by 5 mm thick steel channels on-center. The wall reinforcements were designed to prevent the deformation of the specimen box during testing. The specimen box was placed on top of the supporting platform made of a 15 mm thick steel plate with rollers and stabilizing locks. Figure 6b,c show the actual photos of the box model experiment, including the material sample sets inside the specimen box.

4. Experiment Methodology

4.1. Mold Model Test

The basic mold test was composed of eight sample cases, which are depicted in Figure 7 and Table 5. Case 1 involved a full volume of clay, having 30% NMC and a specific weight, ɣ, of 17.6 kN/m3. The clay was placed inside the mold in four layers, with each layer being subjected to compaction by having its surface manually vibrated for one minute using a 2.5 kg metal tube with a 50 mm surface diameter. Case 2 used a full volume of clay, with an OMC of 14.5% and ɣ of 20.5 kN/m3, subjected to compaction using a 4.5 kg rammer with 55 blows over four layers. Case 3 included a full volume of loose sand, with ɣ of 13.5 kN/m3, directly placed inside the mold without compaction. Case 4 used a full volume of dense sand, with ɣ of 15.7 kN/m3, placed inside the mold in four layers, with each layer being subjected to compaction by manually hitting the sides of the mold with a rubber hammer for one minute. Case 5 included a combination of NMC clay and crushed gravel, with ɣ of 17.3 kN/m3. It consisted of four alternating layers of NMC clay and crushed gravel. The compaction of NMC clay was done by manually vibrating its surface for one minute using a 2.5 kg metal tube with a 50 mm surface diameter. The crushed gravel layers were not subjected to any compaction method to avoid mixing the gravel with the NMC clay layers. Case 6 had the same combination as Case 5, but with the addition of three pieces of composite geotextiles placed between the layers of NMC clay and crushed gravel whose ɣ was 16.1 kN/m3. Case 7 consisted of four layers of NMC clay with composite geotextiles placed in between the layers and whose ɣ was 17.1 kN/m3. Lastly, Case 8 was conducted similarly to Case 6, but with additional composite geotextiles inserted at the top layer of crushed gravel and whose ɣ was 15.9 kN/m3.

4.2. Box Model Test

Four model cases or material sets were used in this experiment to investigate the bearing capacity. Each case had a height of 500 mm, a width of 500 mm, and a length of 1500 mm. Figure 8 and Table 6 show the description and condition for each case. Case 1 involved a full height, and NMC clayey soil. The clay was placed inside the specimen box and subjected to 10 kPa compaction (approximately equivalent to the pressure of a 50 kg human’s foot stamp). Case 1 obtained a unit weight of 17.02 kN/m3. Case 2 examined dense sand. The dense sand used in this experiment was simulated to have a relative density of 90%. Thus, the falling height of the sand was maintained at 80 cm. The unit weight for Case 2 was 15.49 kN/m3. Case 3 was composed of four layers—alternately, NMC clays and crushed gravel. The first layer was the NMC clay, which was subjected to 10 kPa manual foot compaction. The second layer was crushed gravel placed directly in the box without compaction. The third layer was another one of NMC clay, again subjected to 10 kPa manual foot compaction. The last, or top, layer was another layer of crushed gravel placed directly in the box without compaction. Case 3 had a unit weight of 16.56 kN/m3. Lastly, Case 4 was very similar to Case 3 but with an additional three sheets of composite geotextiles placed between the layers of NMC clays and the crushed gravel. Case 4 obtained a unit weight of 15.76 kN/m3.
At the start of the experiment, all the materials and equipment were prepared, including the six Linear Variable Differential Transducers (LVDTs), one soil pressure gauge, two dial gauges, one load cell, a data logger, a laptop, and a 30 by 30 cm by 15 mm thick steel loading plate. First, the load cell was attached to the loading system and connected to the data logger. The soil pressure gauge was installed at the bottom–center of the specimen box before the foundation was placed. The foundation, composed of a 50 mm thick layer of sand, was placed and compacted at the bottom of the specimen box. When the materials were completely placed in the specimen box and the top surface was leveled, the steel loading plate was then placed at the center of the specimen box, directly under the load cell. Then, two dial gauges were installed at the right and left sides of the loading plate to measure the vertical displacement or settlement during the load application. Afterwards, the six LVDTs were installed—three placed at the right side and three at the left side of the loading plate (see Figure 9). The left and right sets of LVDTs had a uniform distance from the loading plate. LVDT #3 and #4 were installed 5 cm from the edge of the loading plate. LVDT #2 and #5 were installed 10 cm from the edge of the loading plate. Lastly, LVDT #1 and #6 were installed 25 cm from the edge of the loading plate. All measuring devices were connected to the data logger, and the results were recorded on the laptop, with a reading interval of two seconds. The load was applied at a constant speed of 1.7 mm/s for approximately 30 s, or when a vertical displacement of 50 mm was reached.

5. Results and Discussion

5.1. Definition and Designation of Context Parameters

The bearing capacity results were expressed in graphs, generally comprised of the load-settlement relationships. The parameters used in the following context—q, S, B, SR, and BCR—shall first be defined. The bearing capacity, “q,” is expressed in “kPa,” which are obtained from the recorded load applied (in “kgf”) over the surface area of the piston or loading plate. The piston in the mold model test had a diameter of 50 mm (Ø = B = 50 mm) and a surface area of 1,963.5 mm2. The diameter of the mold (150 mm) was three times the diameter of the piston (50 mm), and, thus the end effects may have no, or very minimal, significance. Similarly, the square loading plate used in the box model test had B = 300 mm and a surface area of 90,000 mm2. The width of the loading plate was five times the length of the specimen box, yet 1.7 times the width of the specimen box. Thus, the end effects may have no or very minimal significance on the longitudinal direction, but may have effects on the traverse direction. The vertical displacement or penetration of the loading plate and piston will be designated, in the following context of this paper, as Settlement, S, and the Settlement Ratio (SR) is computed as S/B. The Bearing Capacity Ratio (BCR) [10,11,15,21] is computed as
BCR = q i r q i ,
where q i r is the bearing capacity of reinforced NMC clay (and sand) at a certain settlement level, and q i is the bearing capacity of unreinforced NMC clay (Case 1) at a certain settlement level.

5.2. Mold Model Test Results

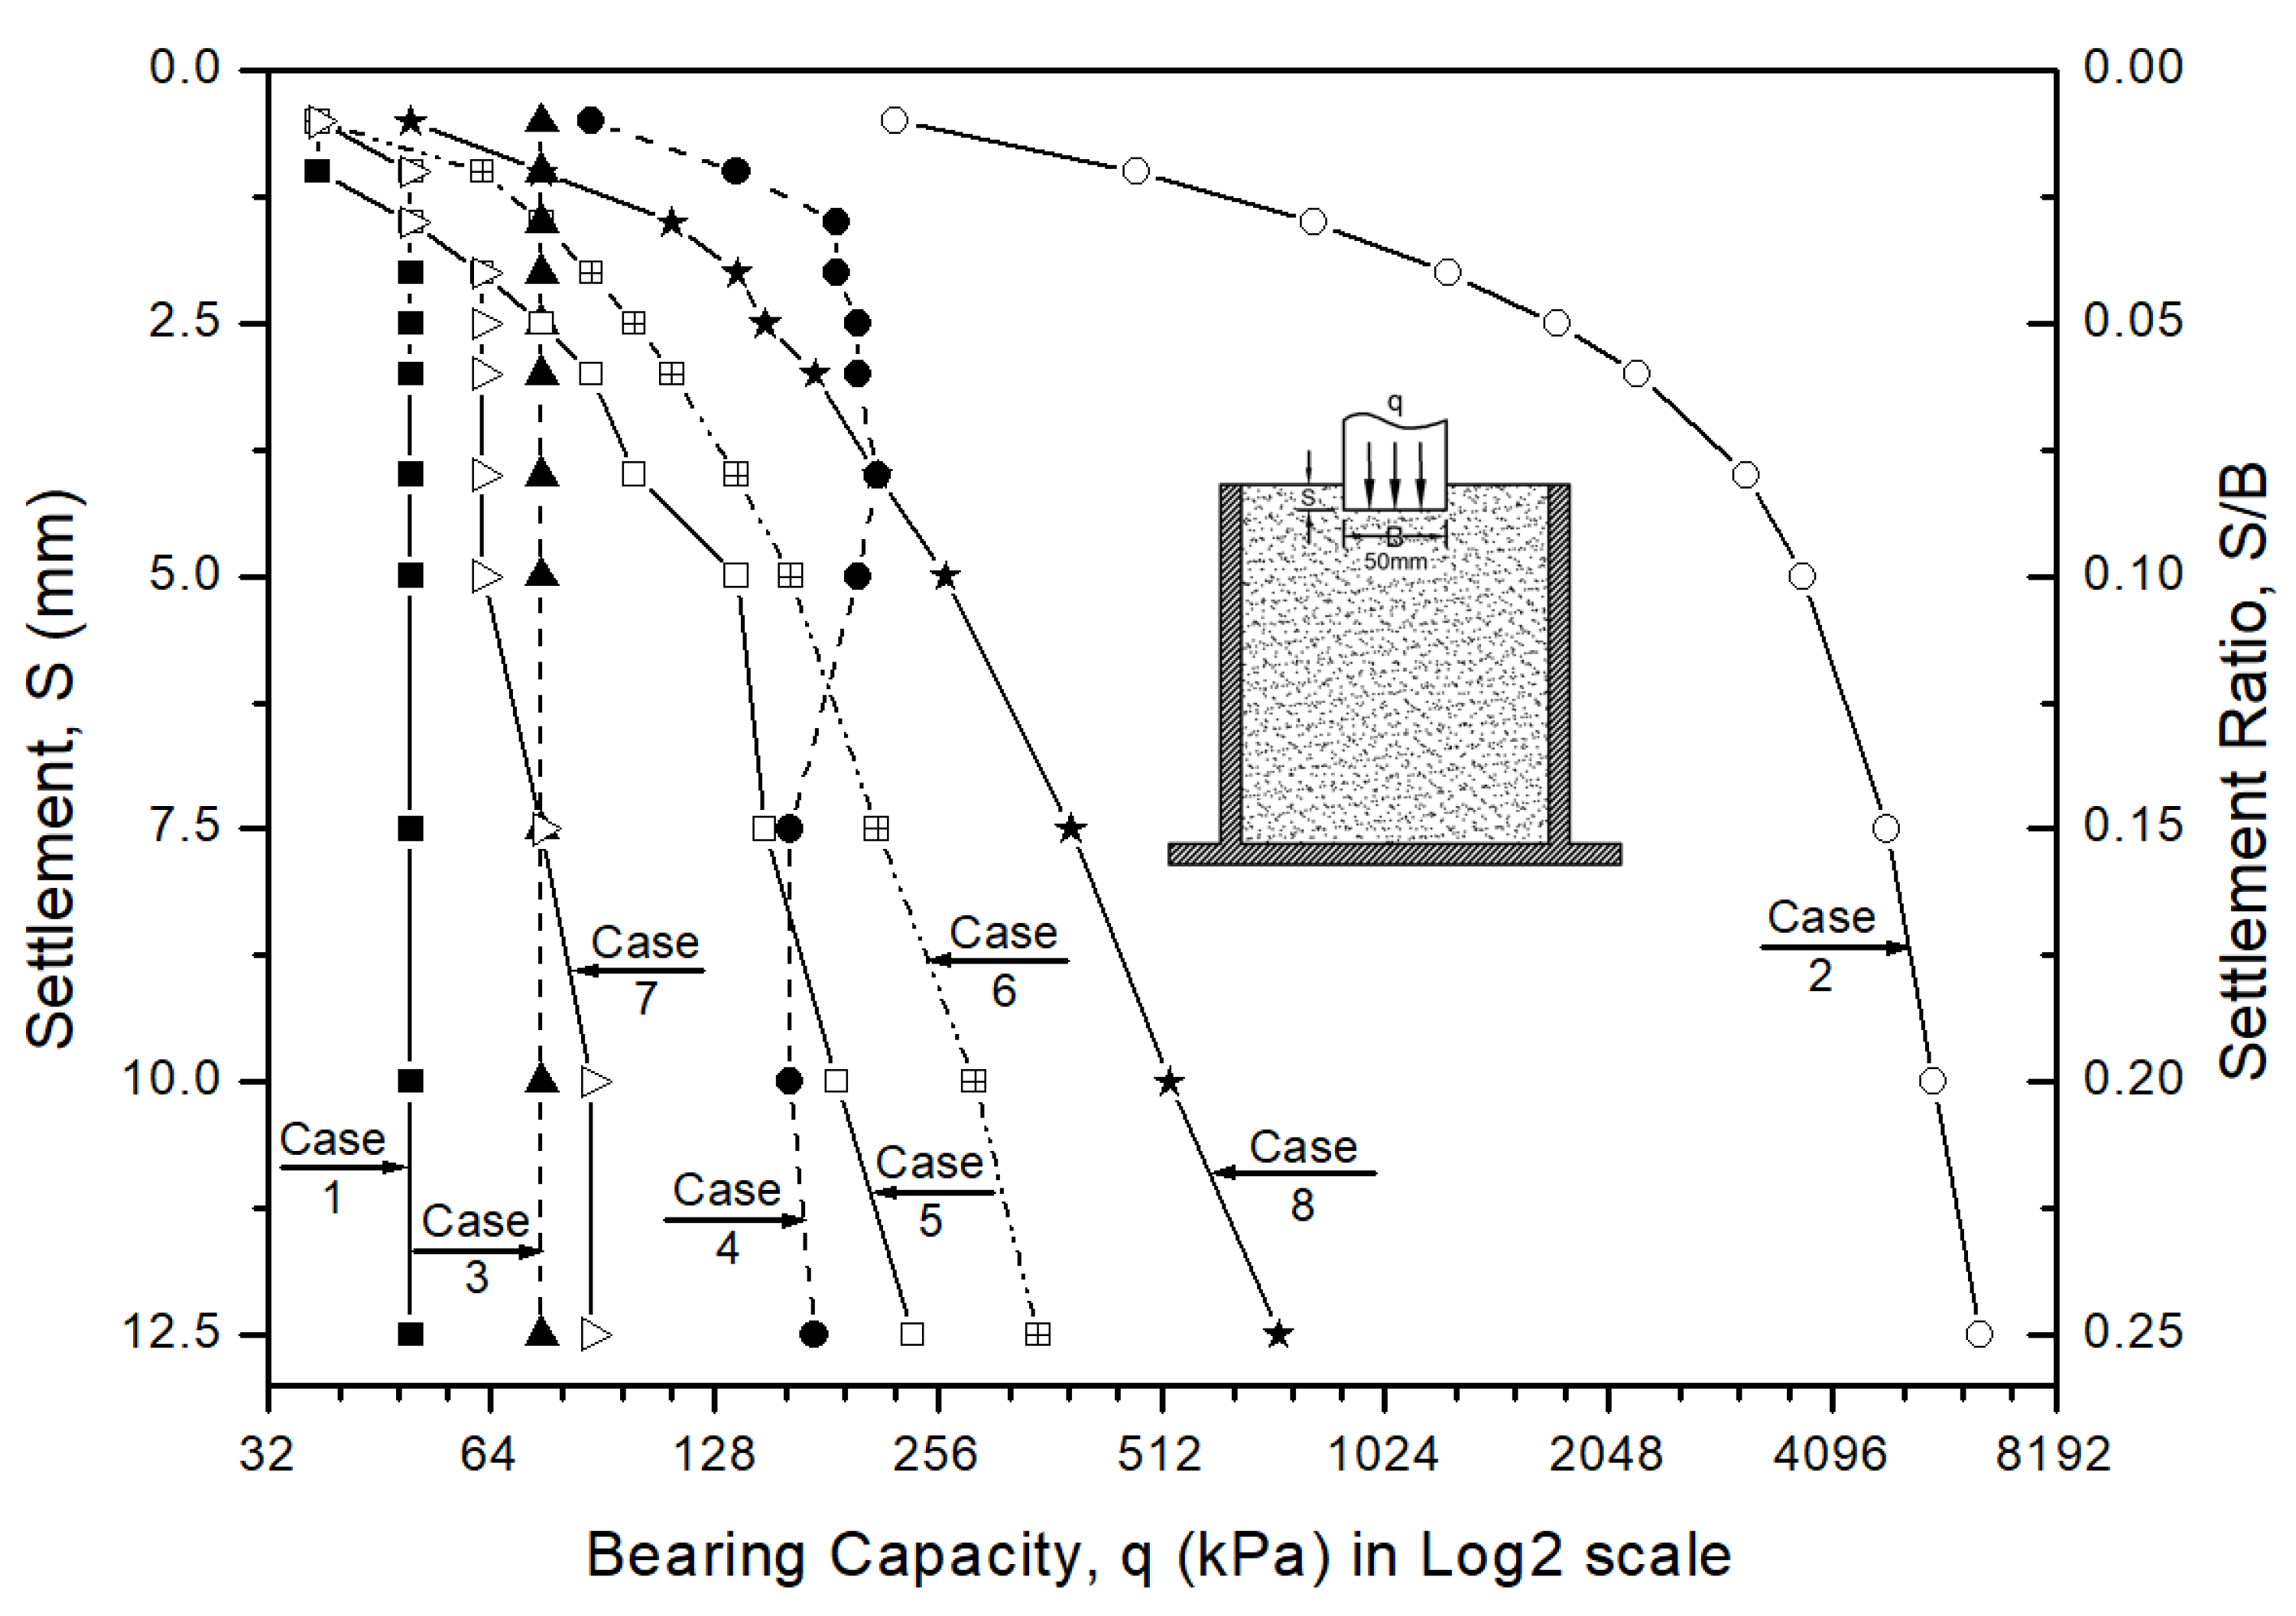
5.2.1. Load-Settlement Curves of the Eight Mold Test Cases

Figure 10 shows the summary of the basic bearing capacity test results until the 12.5 mm settlement (0.25B) of all eight mold model test cases. The load-settlement curves were presented in Log2 scale because of the very high bearing capacity exhibited by Case 2. The unreinforced NMC clay (Case 1) represented the raw clay materials expected to be obtained in the field. The OMC clay (Case 2) was included in this study to compare the effects of clay water content on its bearing capacity. The present study also conducted bearing capacity tests for loose sand (Case 3) and dense sand (Case 4) for comparison with both the unreinforced and reinforced NMC clay model cases. We used sand since granular soils are highly desirable as embankment materials because they can facilitate drainage, can prevent saturation, are well-graded, and are capable of being well-compacted. At the same time, the density of sand is considered, in this study, to determine its effects on the bearing capacity. Most importantly, the various reinforcement methods are considered on NMC clay (Cases 5–8) to examine their individual effects on the bearing capacity of NMC clay.
At this point, the results of unreinforced NMC clay (Case 1) and reinforced NMC clays (Cases 5–8) shall be compared with the bearing capacity exhibited by the sand models (Cases 3–4). For a better comparison of each case, analyses of the bearing capacity at SR of 0.05, 0.10, 0.15, and 0.25B are depicted in Figure 11. Unreinforced NMC clay (Case 1) with NMC 30% exhibited low bearing capacity. However, when clayey soil was well-compacted (Case 2) with OMC, it exhibited very high bearing capacity—far higher even than that of dense sand (Case 4).
Here, the results showed that loose sand (Case 3) and dense sand (Case 4) had higher bearing capacities than unreinforced NMC clay (Case 1). This implied that unreinforced clayey soil is too weak to be utilized as an embankment material, and thus, reinforcements are needed. Hence, when composite geotextiles were added to the NMC clay (Case 7), it showed an equal bearing capacity with loose sand—75 kPa at 0.15B (Case 3)—and that bearing capacity increased by 17% at 0.25B. However, Case 7 showed less bearing capacity than Case 4 by 220% (max) at 0.05B and 0.10B. This implied that composite geotextiles alone are not enough as reinforcements for NMC clay. Therefore, when crushed gravel was combined with NMC clay (Case 5), it obtained a higher bearing capacity than loose sand (Case 3). At the same time, Case 5 showed, at first, that the bearing capacity was lower than dense sand (Case 4), but it later became stronger than dense sand by 36% at 0.25B. When crushed gravel and composite geotextiles were combined with the NMC clay (Case 6), it obtained a higher bearing capacity than both loose sand (Case 3) and dense sand (Case 4) at 0.15 and 0.25B. Likewise, adding one more layer of composite geotextiles to the top (Case 8) showed an even higher bearing capacity—higher than that of dense sand (Case 4) at 0.15 and 0.25B.
To this point, Case 8 exhibited a favorable bearing capacity, which could be desirable for field application. It can be inferred that adding reinforcements to the NMC clay enhanced its bearing capacity—making it exhibit a high bearing capacity, showing better strengths than dense sand. This result is very promising, wherein NMC clay, despite having a high water content, can be used as an efficient material for embankments.

5.2.2. Effects of Moisture Content and Compaction (Case 1 vs. Case 2)

It is noticeable that Case 2 (OMC clay) exhibited a very high bearing capacity compared to all other cases. The OMC clay was very stiff, thus tensions occur at the surface around the piston during penetration. The experimental results showed a local shear failure on the OMC clay sample as manifested by a soil bulging (soil heave) at the surface around the piston and the smooth load-settlement curve in Figure 12. Considering only Case 1 and Case 2 have full clayey soil (Figure 12), Case 2 exhibited an extremely large bearing capacity, which shows that well-compacted clay at OMC is high strength clay capable of sustaining loads up to 6,500 kPa at 0.25B. This strength is very desirable for actual construction. However, it is very difficult to implement on the construction site and would entail too much effort and a long period of time. Thus, clayey soil with a high water content is more likely to be used. In this study, the clay with high water content (Case 1) exhibited the least load of 50 kPa. The NMC clay (Case 1) is soft and has negligible tensions at the surface around the piston during the penetration. The experimental results showed a punching shear failure during the penetration as shown by the straight load-settlement curve in Figure 12. From this, it can be inferred that clay with a higher moisture content has a lower bearing capacity.
Therefore, water content is a crucial factor, which significantly influences the strength of the soil. It is said that water serves as a lubricant, reducing friction between soil particles, making compaction easier, and creating a good sealer for engineered barriers. However, water saturates the soil, which increases its plasticity and, at the same time, reduces soil unit weight, thus reducing bearing capacity [4,22,23,24].

5.2.3. Effects of Density on Sand (Case 3 vs Case 4)

Figure 13 shows the load-settlement curves of loose sand (Case 3) and dense sand (Case 4) to compare the effects of density on bearing capacity. Here, Case 3 showed a constant bearing capacity, while Case 4 showed increasing bearing capacity, obtained a peak value of 212 kPa at 0.08B, and then slowly decayed. As expected, Case 4 obtained about 2.8 times higher bearing capacity than Case 3. This implies that manually compacted or dense sand is stronger than loose or not compacted sand. It can, therefore, be inferred that compaction apparently results in higher density—thus inducing a higher bearing capacity. That is why compaction is very important on the construction site.

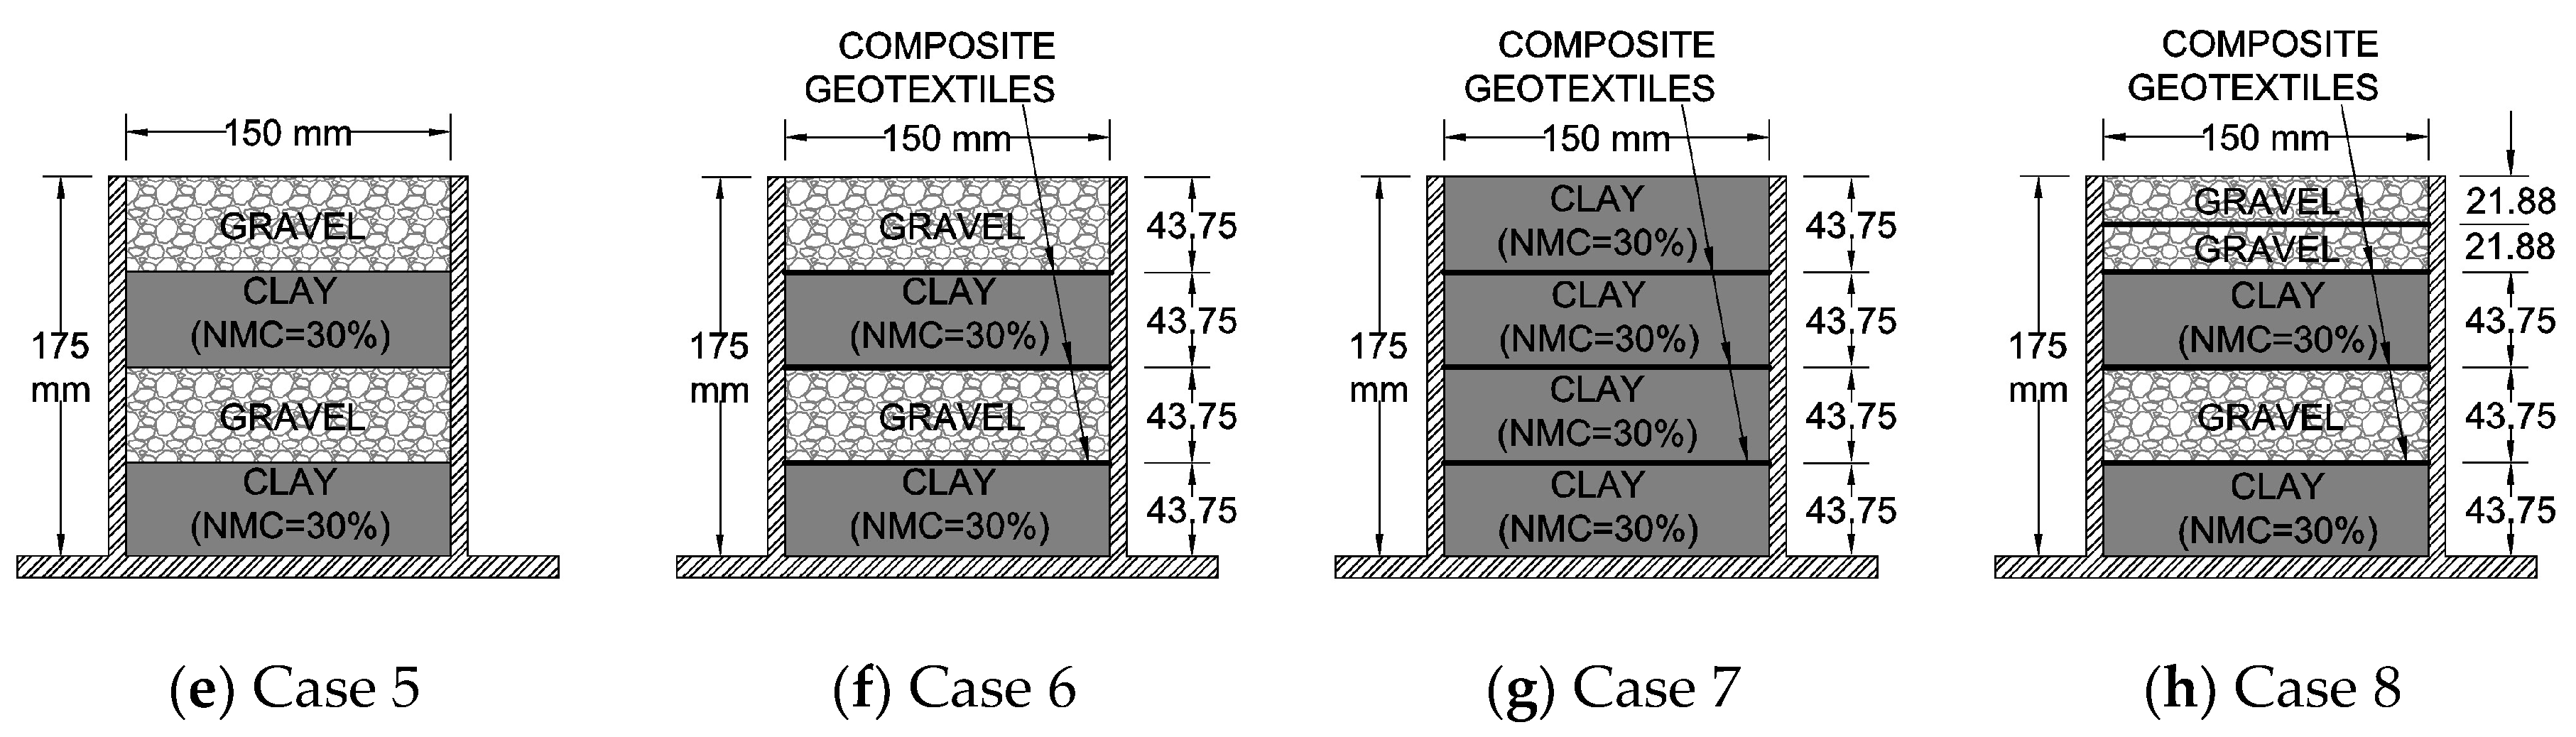
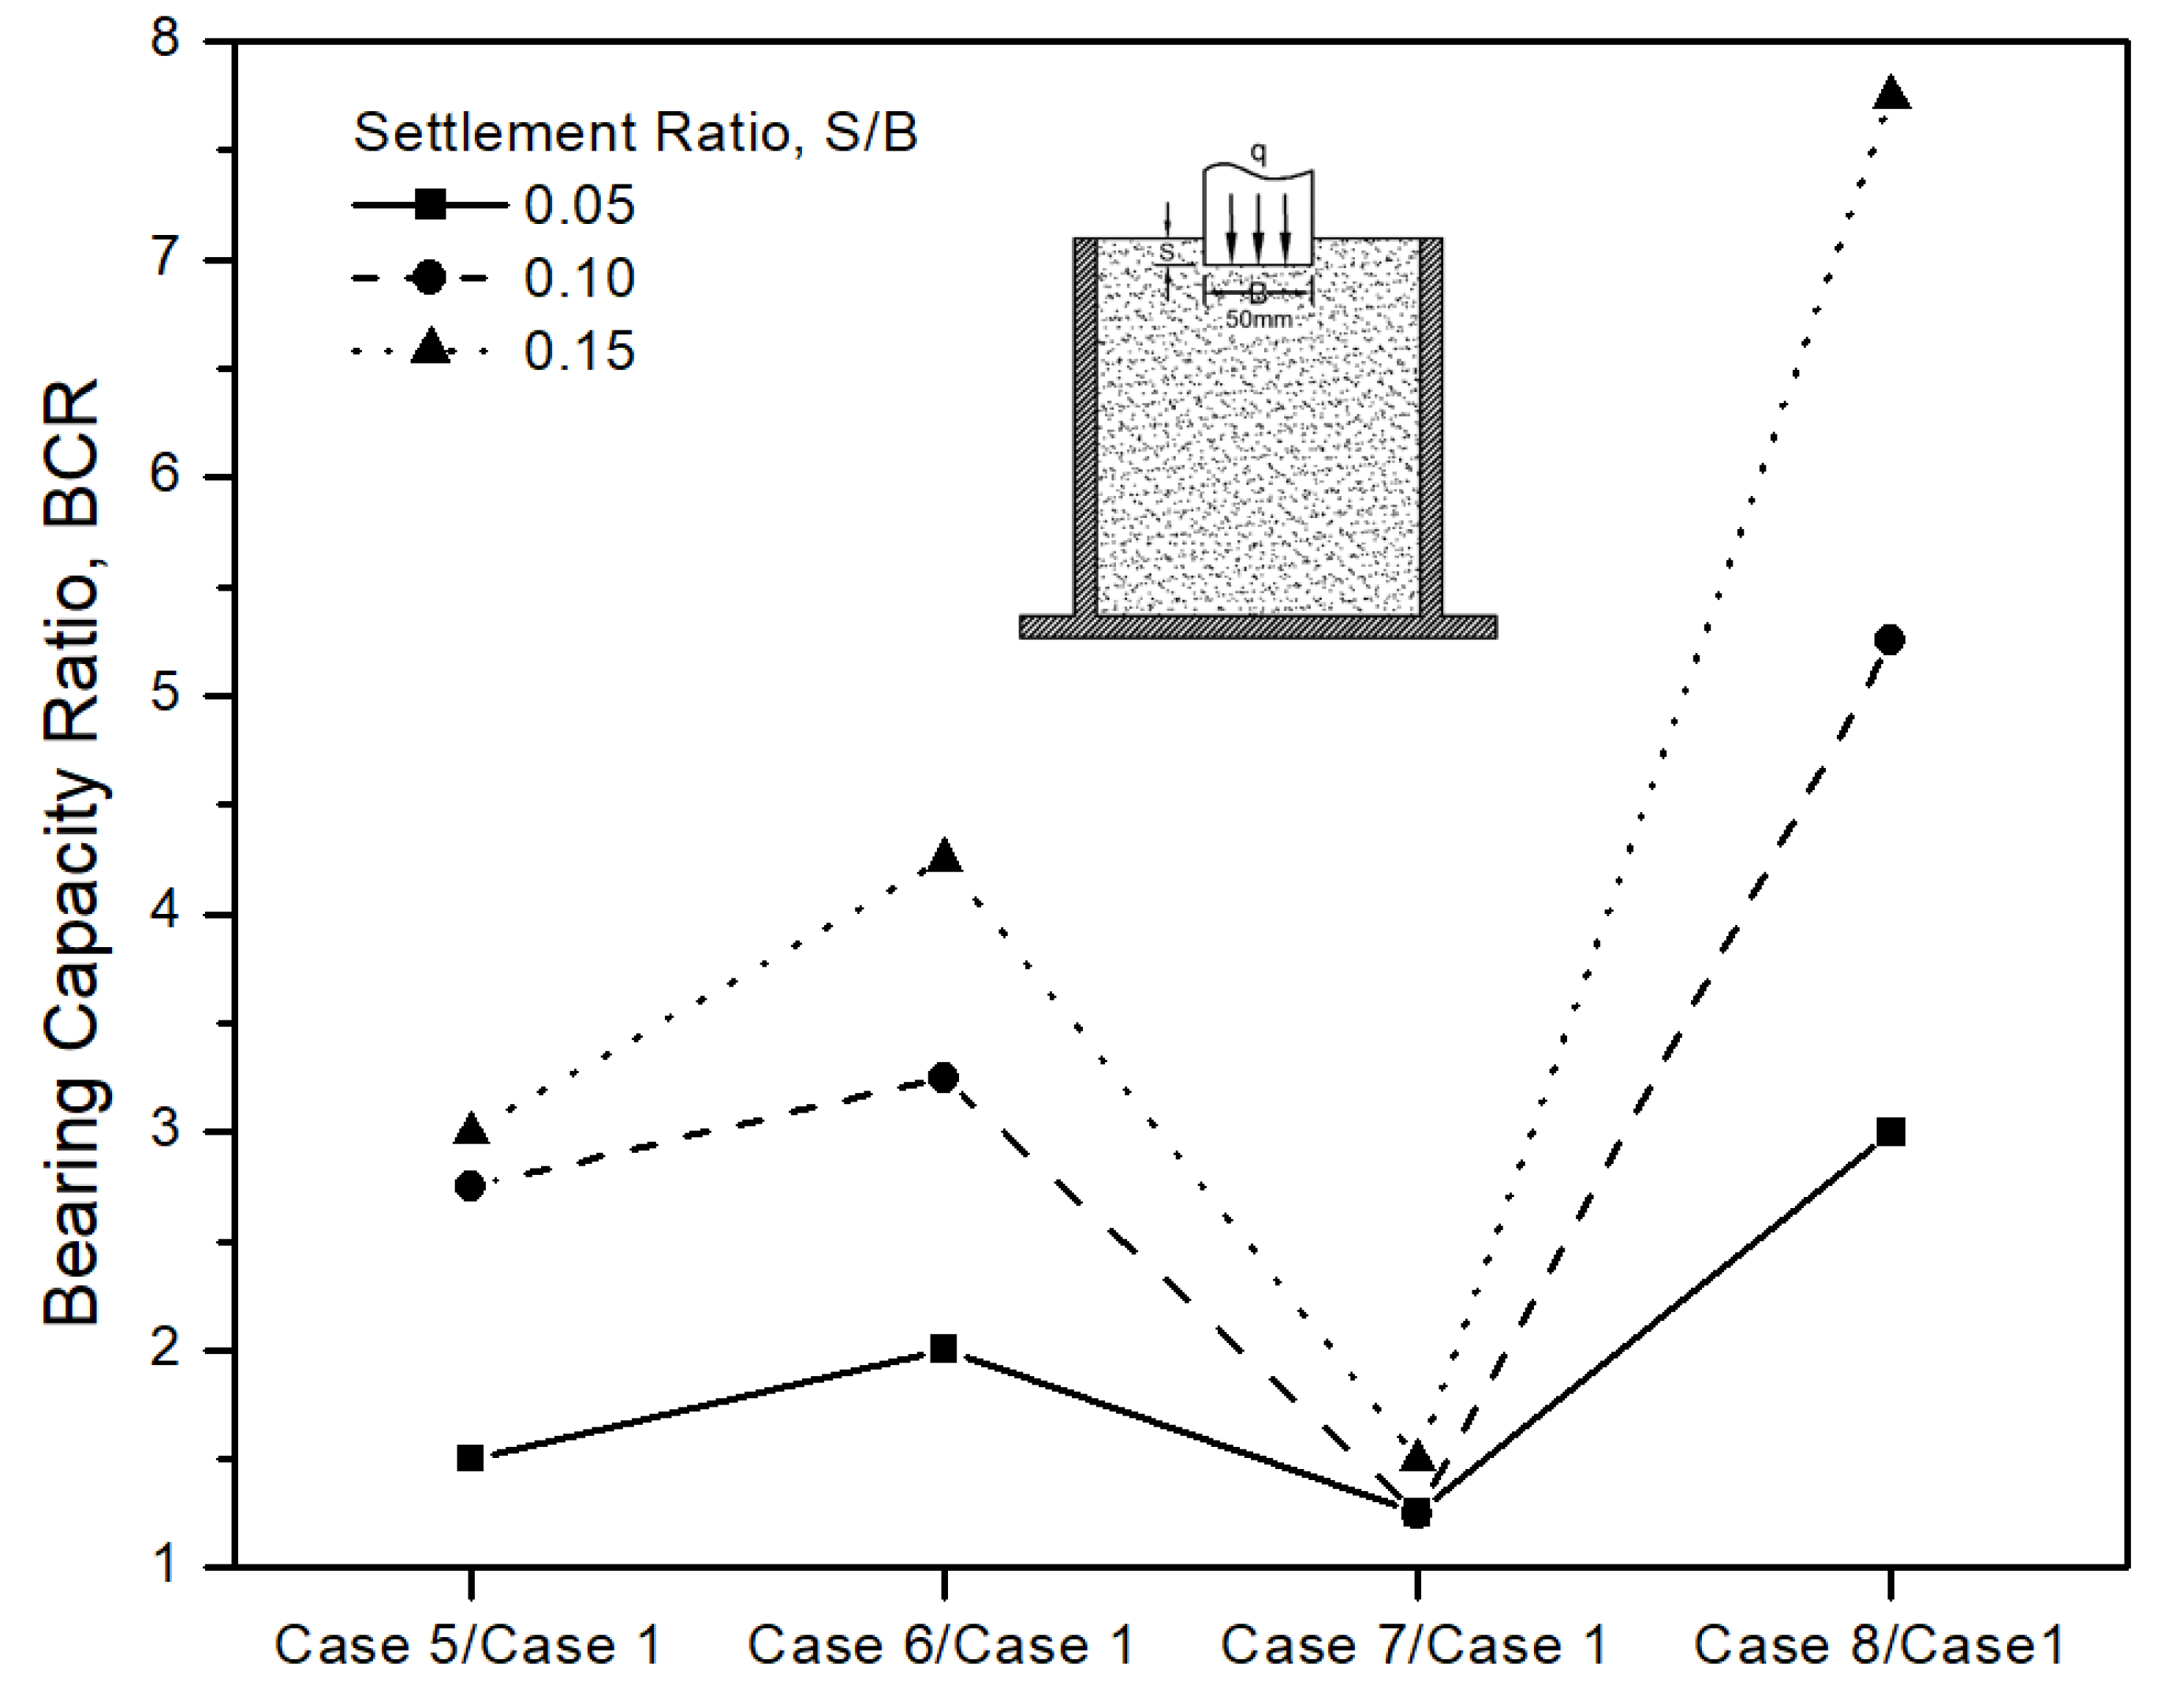
5.2.4. Effects of Reinforcements (Comparing Cases 1, 5, 6, 7, and 8)

At this point, the effects of reinforcements on NMC clay shall be analyzed. In the present study, unreinforced NMC clay had a high water content (30%) and low bearing capacity. To be able to use soft clay as an efficient embankment material, reinforcements must be provided. As depicted in Figure 14, the bearing capacity of NMC clay increases when reinforcements are added. The results showed that, when composite geotextiles (three layers) are added to layers of NMC clay (Case 7), the bearing capacity of the NMC clay increased. Yet, this improvement is small, so another type of reinforcement should be considered. Here, when crushed gravel was layered with the NMC clay (Case 5), the bearing capacity significantly increased. Therefore, when both composite geotextiles (three layers) and crushed gravel were layered with NMC clay (Case 6), the bearing capacity greatly increased compared to unreinforced NMC clay (Case 1). Moreover, when one more layer of composite geotextile was added to the top (Case 8), the bearing capacity increased tremendously and was far higher than the unreinforced NMC clay (Case 1). Basically, the results implied that clayey soil with a high water content can obtain a high bearing capacity when combined with crushed gravels and composite geotextiles.
In addition, Figure 15 shows the BCR relationships of reinforced NMC clay over unreinforced NMC clay. Here, Case 5 showed a higher BCR than Case 7, which means that composite geotextiles are not strong enough as lone reinforcements; hence, crushed gravel is better. Yet, when the two reinforcements were combined (Case 6), the bearing capacity increased and then showed a higher BCR than Case 5. Moreover, adding one more layer of composite geotextile (Case 8) exhibited about two times higher bearing capacity than Case 6 at 0.25B and the highest BCR among the other reinforced NMC clay samples.
It can be inferred that the parametric strength of crushed gravel and composite geotextiles may have contributed to the increase in the soft clay’s bearing capacity. The lone, soft clay is weak and has poor engineering properties. Therefore, it may not be suitable as an embankment material. However, the soft clay layered with crushed gravel and reinforced with composite geotextiles exhibited a high bearing capacity, which may imply that it can be utilized as an efficient embankment material.

5.3. Box Model Test Results

5.3.1. Load-Settlement Curves of the Four Box Model Test Cases (Clay vs Sand)

The present study conducted the bearing capacity test with dense sand to serve as a basis for comparison with both unreinforced NMC clay and reinforced NMC clay. Here, Figure 16 shows the settlement, with the corresponding load applied at the loading plate. The unreinforced NMC clay (Case 1) with high water content (35%) showed a low bearing capacity and large deformation. Case 1 also showed a lower bearing capacity than that of dense sand (Case 2), and the results showed that dense sand (Case 2) has a higher bearing capacity than NMC clay reinforced with crushed gravel only (Case 3) by a small margin. This implies that crushed gravel is not enough as the lone reinforcement for NMC clay relative to dense sand. Thus, composite geotextiles (three layers) were added to the gravel-reinforced NMC clay (Case 4). Then, the graph showed that the Case 4 exhibited a higher bearing capacity than dense sand (Case 2) by 60% and 33% at 0.10 and 0.17B, respectively. It can also be observed that Case 4 exhibited an arching curve, which slowly decayed after 0.1B, while Case 2 exhibited an increasing linear bearing capacity trend. At the beginning of the loading, the difference between Case 4 and Case 2 was increasing. However, after 30 mm (0.1B) settlement, the difference decreased; it could then be expected that the two cases would have the same bearing capacity when the vertical displacement further increased.
Figure 17 shows the BCR relationships of the dense sand and reinforced NMC clay over the unreinforced NMC clay in the box model test. Dense sand (Case 2) exhibited a higher BCR than gravel-reinforced NMC clay (Case 3). However, the NMC clay was reinforced with both crushed gravel and composite geotextiles (Case 4) exhibited a higher BCR than dense sand (Case 2).
Similarly, Figure 18 shows the specific comparison of reinforced NMC clay against the dense sand and also the specific comparison of reinforced NMC clay and dense sand against the unreinforced NMC clay. The BCR beyond 1.0 implies higher bearing capacity, while a BCR of less than 1.0 implies a lower bearing capacity, with respect to its dividend. Here, the effect of crushed gravel as the top layer can be seen at 0.03B, wherein both Case 3 and Case 4 showed a higher BCR than Case 2 (see Figure 18a). It is also noticeable that Case 4 has approximately 1.5 times greater BCR than Case 2 while Case 3 shows lower BCR than Case 2 after S = 15 mm. This clearly implies that NMC clay reinforced with crushed gravel and composite geotextiles is stronger than dense sand. Additionally, Figure 18b shows that Case 4 has a greater BCR than Case 2 after being compared to Case 1. Here, Case 2 is compared with Case 1 to show that dense sand (Case 2) has a higher BCR than unreinforced NMC clay (Case 1). However, with gravel and composite geotextile reinforcements (Case 4), the NMC clay BCR has improved and has a higher BCR than dense sand (Case 2).
Overall, Case 4 exhibited favorable bearing capacity, which could be desirable for field application. It can be inferred than NMC clay reinforced with crushed gravel increased the bearing capacity to be higher than unreinforced NMC clay, and adding composite geotextiles increased the bearing capacity to be higher than dense sand. It can also be inferred that the parametric strength of crushed gravel and composite geotextiles may have attributed to the increase in the soft clay’s bearing capacity. The lone soft clay is weak and has poor engineering properties; thus, it may not be suitable as an embankment material. However, the soft clay, layered with crushed gravel and reinforced with composite geotextiles, exhibited a high bearing capacity, which may imply that it can be utilized as efficient embankment material.

5.3.2. Effects of the Reinforcements on Bearing Capacity of NMC Clay (Comparing Cases 1, 3, and 4)

The effects of reinforcement on NMC clay were analyzed using Figure 19. The graph shows the BCR relationships of reinforced NMC clay and unreinforced NMC clay, highlighting the contribution of crushed gravel and composite geotextiles to the improvement of NMC clay’s bearing capacity. The BCR beyond 1.0 implies a higher bearing capacity, while a BCR of less than 1.0 implies a lower bearing capacity, with respect to its dividend. The graph clearly shows that Case 4 has approximately two times higher BCR than Case 3.
With the addition of composite geotextiles, the loading applied on the NMC clay and crushed gravel layers was distributed properly throughout the area. Hence, the vertical force exerted by the loading towards the gravel (top, 4th layer) and the normal force of the NMC clay (3rd layer) were transferred to the composite geotextile. The composite geotextile’s tensile strength resisted the vertical displacement of the soil material. At the same time, the drainage effects and the frictional forces of the crushed gravel increased the load-bearing capacity of the NMC clay [3,6].
Based on the typical values of bearing capacity for clays (BS 8004:1986) [25], the bearing capacity obtained by Case 1 depicted that the NMC clay, with 35% water content, is a soft clay. Therefore, when NMC clay is layered with crushed gravel (Case 3), the bearing capacity increased by 144% at 0.17B. Case 3 exhibited a bearing capacity of 92 kPa at 0.17B, which depicted that the NMC clay was as strong as a firm clay, despite having a high water content. This may imply that the reinforcement of crushed gravel increased the bearing capacity of the NMC clay, and so much more when the composite geotextiles were installed between layers of NMC clay and crushed gravel (Case 4). In that case, the bearing capacity increased by 373% and 94%, compared with Case 1 and Case 3, respectively. As with Case 4, the bearing capacity, which was 178 kPa, depicted that the NMC clay was as strong as a stiff clay, despite having high water content. This may imply that adding composite geotextiles between the NMC clay and crushed gravel layers increased the bearing capacity.

5.3.3. Vertical Displacements at the Surface of Soil

Figure 20 shows the surface deformations (soil heave and soil depression) in relation to the specific settlement of the loading plate obtained from the measuring apparatus installed at the surface of model cases (see Figure 9). The results showed that, at 0.05, 0.10 and 0.15B (of the loading plate), the bearing capacity of each case differed in magnitude. This was because each case had different material properties and different unit weights. The surface deformations around the loading plate were greatly visible, wherein the deeper penetration of the loading plate induced higher vertical displacements at the surface.
In Figure 20a, the differences in surface deformation among model cases were not so visible. Case 4 showed the highest soil heaves of 6 and 4 mm at distances of 1000 and 500 mm, respectively. Case 3 showed 3.7 and 5 mm soil heaves at distances of 1000 and 500 mm, respectively. Case 1 showed about 3 and 2.5 mm soil heaves at distances of 1000 and 500 mm, respectively. Case 2 showed soil depressions of 2 and 1.5 mm at distances of 550 and 950 mm. Case 4 obtained the maximum bearing capacity of 79 kPa at 0.05B, followed by Case 2 with 50 kPa bearing capacity.
In Figure 20b, the differences in surface deformation among model cases are quite visible. Here, Case 4 showed the highest soil heaves of 16.5 and 13.6 mm at distances of 1000 and 500 mm, respectively. Case 3 showed 11.7 and 10.3 mm soil heaves at distances of 1100 and 500 mm, respectively. Case 1 showed approximately 5.6 and 4.7 mm soil heaves at distances of 1000 and 500 mm. Case 2 showed soil heaves of 2 mm at distances of 400 and 1100 mm. Case 4 obtained the maximum bearing capacity of 135 kPa at 0.10B, followed by Case 2 with 86 kPa bearing capacity.
In Figure 20c, more visible differences in surface deformation among model cases can be observed. Here, Case 4 showed the highest soil heave of 25.4 mm and 23.3 mm at distances of 1000 mm and 500 mm, respectively. Case 3 showed 17.6 mm and 19.3 mm soil heaves at distances of 1100 mm and 500 mm, respectively. Case 1 showed about 8.2 mm and 7 mm soil heaves at distances of 1100 mm and 400–500 mm. Case 2 showed soil heaves of 4.4 mm and 4 mm at distances of 1100 mm and 400 mm. Case 4 obtained the maximum bearing capacity of 169 kPa at 0.15B, followed by Case 2, with 121 kPa bearing capacity.
Generally, the results indicated that the maximum vertical displacement at the surface was located 250 mm from the center of the loading plate. As the loading plate penetrated deeper into the soil, at the same time as the applied load increased, the vertical displacement at the surface of the perimeter of the loading plate dilated or bulged (soil heave). This indicated that bearing capacity failure had developed, which was visible at the edges of the loading plate and at the surface [6,25,26]. Here, Case 4 showed the highest soil heave of 25.4 mm (see Figure 21d) followed by Case 3 (see Figure 21c). Both reinforced NMC clays (Case 3 and Case 4) exhibited high strengths of bearing capacity, which resulted in General Shear failure mode and were consistent with the load-settlement curves. General Shear failure is the most common type of shear failure which generally occurs in strong soils and can be characterized by a visible soil heave or bulging at the sheared surface. Moreover, the dense sand (Case 2) and the unreinforced NMC clay (Case 1) exhibited Local Shear and Punching Shear modes of bearing capacity failure, respectively. The unreinforced NMC clay (Case 1) showed a clean cut or shear in the surface and a negligible soil heave around the perimeter of the loading plate which characterized a Punching Shear failure (see Figure 21a). The dense sand (Case 2) was expected to exhibit a higher soil heave because of its higher density. However, when the loading plate penetrated deeper than its thickness, 15 mm, some of the sand particles started to slide down and fell on top of the loading plate, which affected its surface deformation (see Figure 21b). Thus, soil depression in Case 2 occurred at the perimeter of the loading plate. Nevertheless, Case 3 and Case 4 exhibited good results, which confirmed that their strengths are viable for field application.

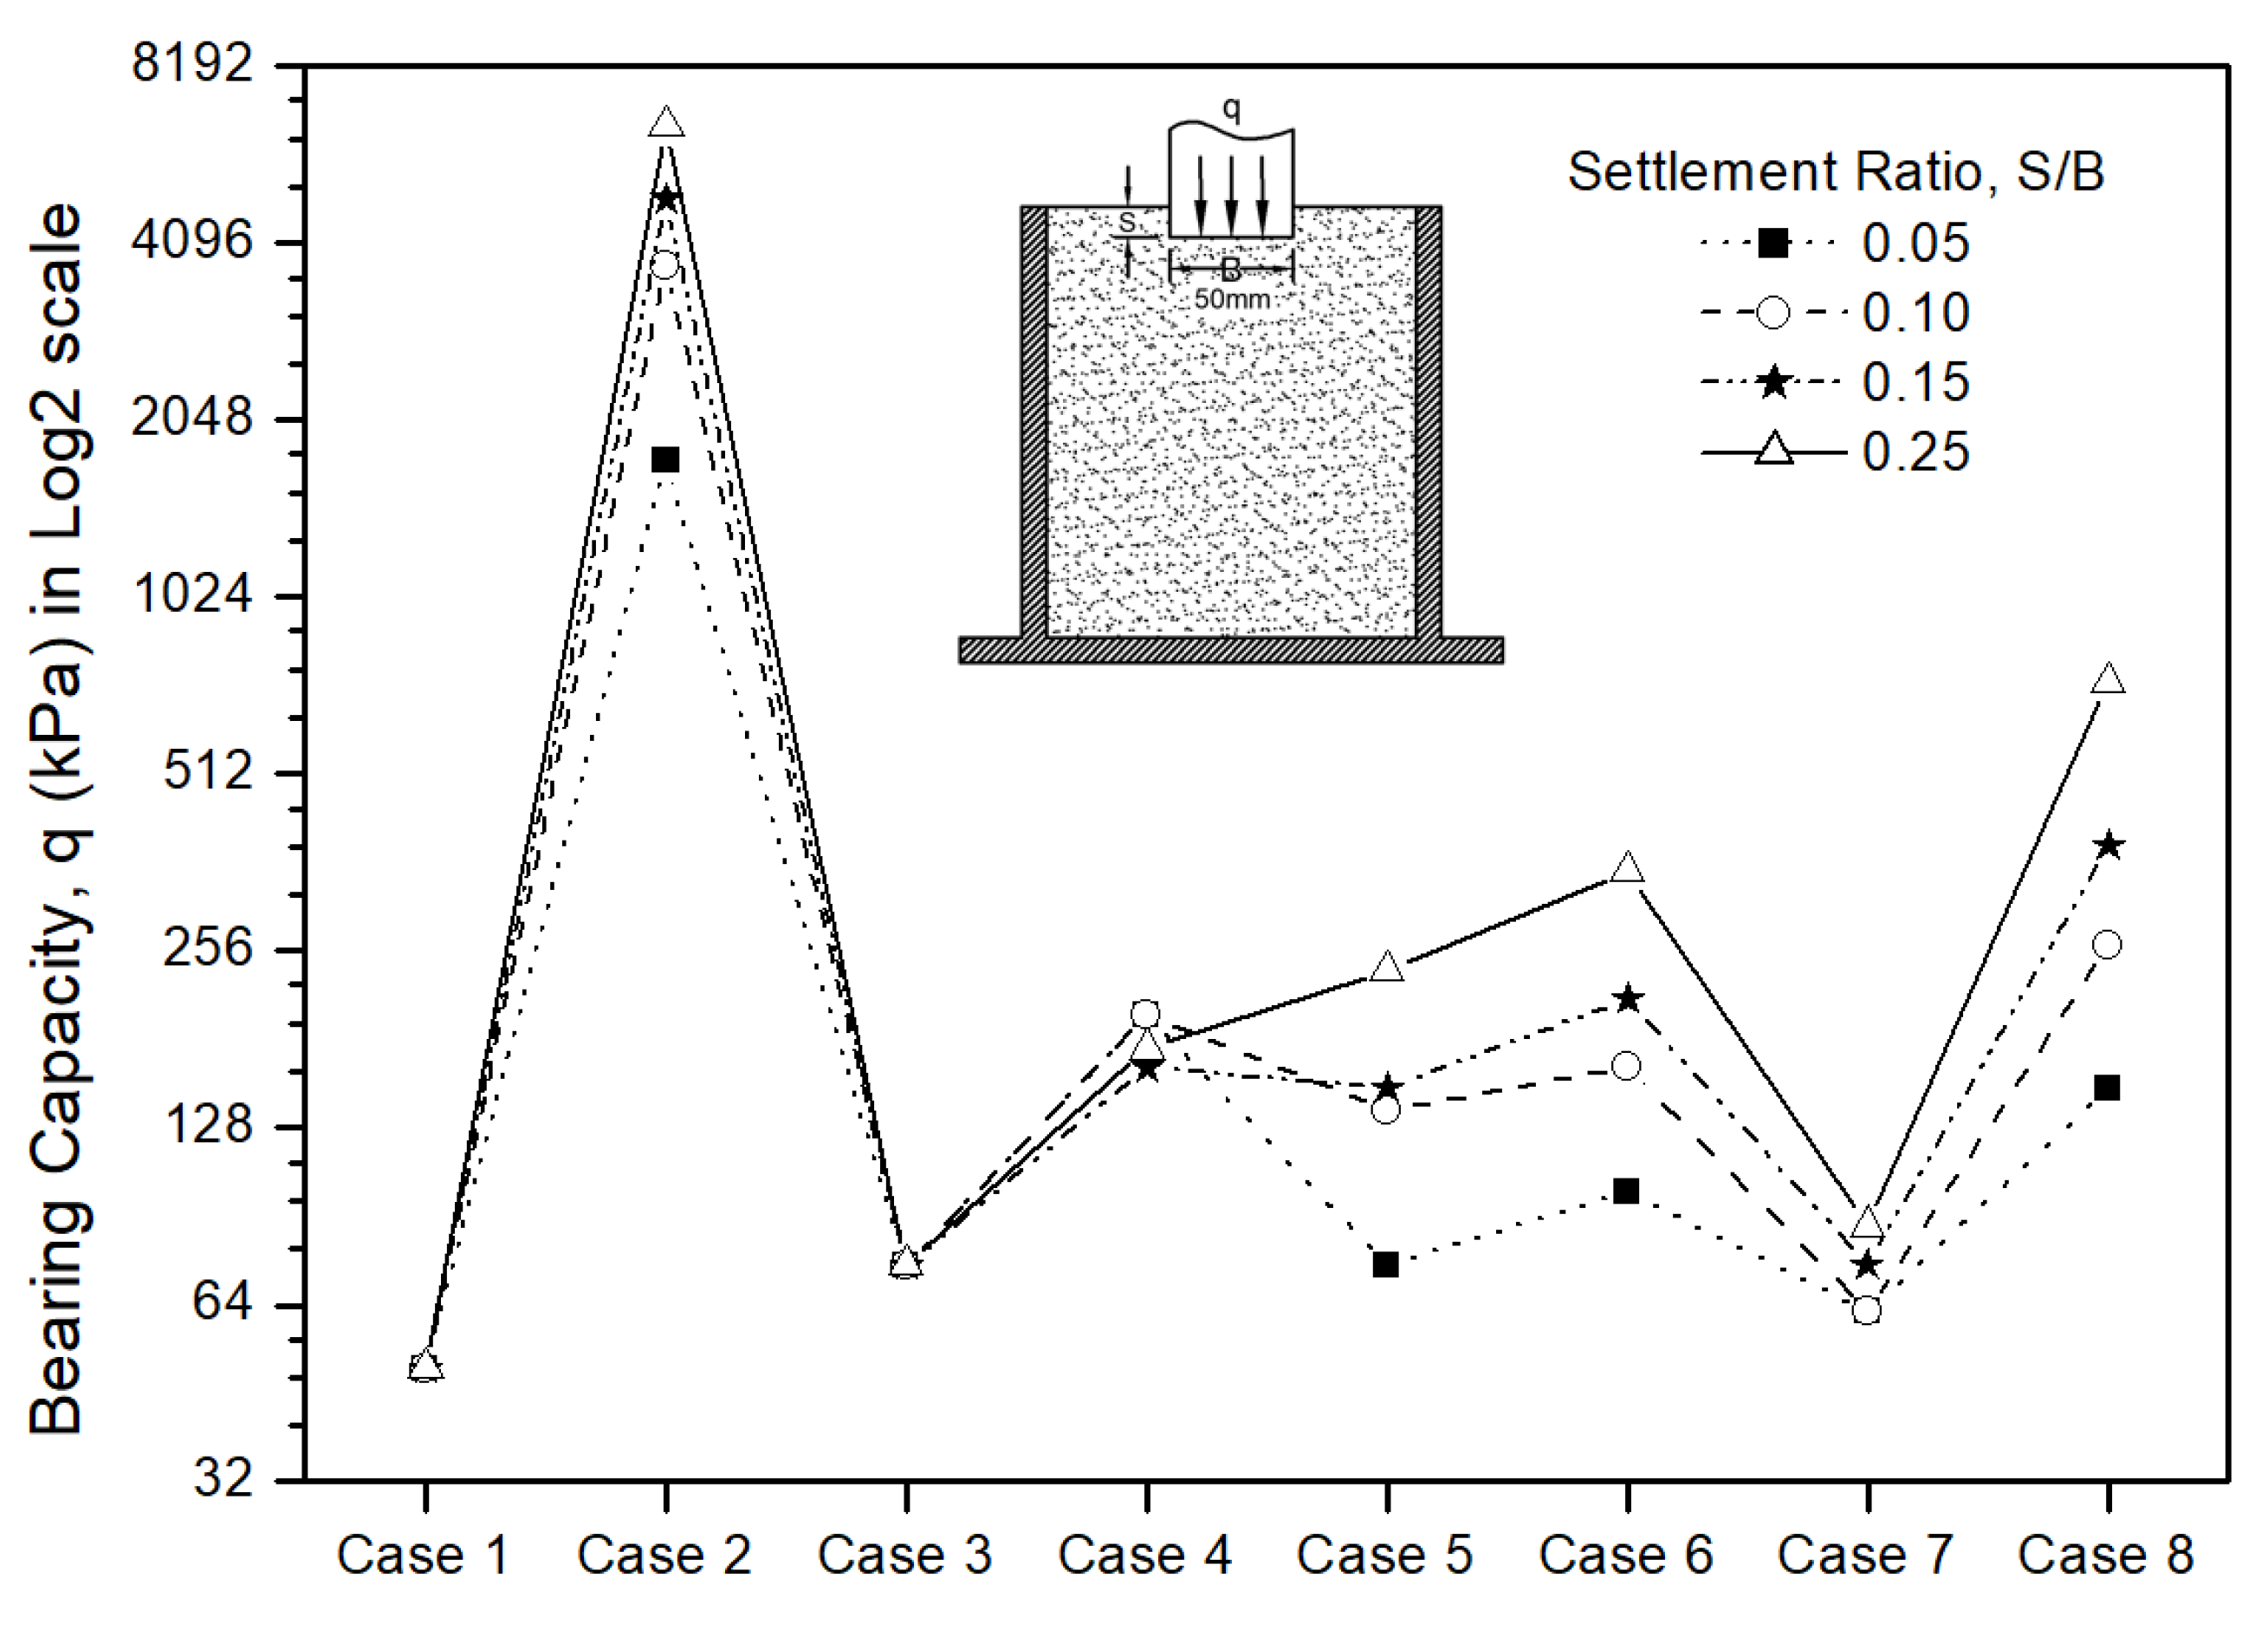
5.4. Mold And Box Model Test Evaluation of Results

The results of the mold model tests suggest that reinforcements improved the bearing capacity of clayey soils with a high water content, and the reinforced NMC clay models exhibited higher bearing capacities than those of sand models. In the study, a standard mold is used with diameter, D = 150 mm. Hence the mold has a boundary of 1D around the 50 mm-Ø piston. Therefore, the lateral boundary effect is expected for footing on sand and gravel. However, in this study, the lateral boundary effect because of the mold size was not considered. Hence, a larger box model test was conducted using similar conditions as those of the mold model test. This time, out of the original eight model cases, only four with significant results were considered. In the box model test, the results obtained were better than those of the mold model test. Reinforcement effects were more visible. The model test results depicted that the top layer was very important, which implies that crushed gravel is more effective than NMC clay or sand. Here, the addition of composite geotextiles between layers of crushed gravel and NMC clays were significant. They prevented the crushed gravel and NMC clays from mixing during the load application. Nevertheless, this present study shows that the bigger (box) model test size is more effective than the smaller (mold) model test size. This implies that the field application, on a greater area, will show much better reinforcement effects than the model tests.

6. Conclusions

The Saemangeum project is underway for road, railway, and port constructions for internal development. Suitable granular soil for embankment material is difficult to find in the Saemangeum area. However, silty clay is widely distributed. Thus, this research will maximize the utilization of clayey soil, which will serve as an effective, alternative solution to the limited supply of good quality, granular fill materials in the Saemangeum projects or any applicable locations.
A series of model bearing capacity tests were carried out as basic research to investigate the feasibility of clayey soil being utilized as embankment material. The main conclusions drawn from the series of model bearing capacity tests are as follows:
  • Clayey soil with NMC exhibited large deformation and low bearing capacity. However, when clayey soil is well-compacted with OMC, it exhibited a higher bearing capacity than dense sand;
  • The bearing capacity of loose sand was constant regardless of vertical displacements, and the bearing capacity of dense sand was found to be maximum at the point where vertical displacement is at 0.08B. The bearing capacity of dense sand was about 2.5 times larger than that of loose sand;
  • When the clayey soil was reinforced with composite geotextiles only, the bearing capacity improvement was small, and its bearing capacity is smaller than that of the combination of clayey soils and crushed gravel;
  • The bearing capacity of clayey soil in combination with crushed gravel and composite geotextiles was significantly higher than that of clayey soil and crushed gravel only. Also, its bearing capacity was similar to, or larger than, that of dense sand.
From the viewpoint of bearing capacity, it is considered that clayey soil can be used as embankment material when the clays, crushed gravel, and composite geotextiles are properly combined.

Author Contributions

Conceptualization, M.-S.W.; Data curation, C.P.L.; Formal analysis, M.-S.W., C.P.L. and Y.-C.G.; Funding acquisition, M.-S.W.; Investigation, C.P.L.; Supervision, M.-S.W.; Writing—original draft, C.P.L.; Writing—review and editing, C.P.L. All authors have read and agreed to the published version of the manuscript.

Funding

This study was supported by the Technology Innovation Development Project of the SME (C0565624, Development of Technology to Utilize High-Strength Clay Soils as Efficient Soil Materials), Brain Korea 21 Plus Project (22A20152713403) funded by the Ministry of Education and National Research Foundation of Korea (NRF), and the Ministry of Trade, Industry & Energy (MOTIE) of the Republic of Korea (20183010025200).

Acknowledgments

This study was carried out as a part of the Technology Innovation Development Project of the SME (C0565624, Development of Technology to Utilize High-Strength Clay Soils as Efficient Soil Materials), Brain Korea 21 Plus Project (22A20152713403) funded by the Ministry of Education and National Research Foundation of Korea (NRF), and the Ministry of Trade, Industry & Energy (MOTIE) of the Republic of Korea (20183010025200).

Conflicts of Interest

The authors declare no conflict of interest. The funders had no role in the design of the study; in the collection, analyses, or interpretation of data; in the writing of the manuscript, or in the decision to publish the results.

References

  1. Ryu, J.S.; Nam, J.H.; Park, J.S.; Kwon, B.O.; Lee, J.H.; Song, S.J.; Hong, S.J.; Chang, W.K.; Khim, J.S. The Saemangeum tidal flat: Long-term environmental and ecological changes in marine benthic flora and fauna in relation to the embankment. Ocean Coast. Manag. 2014, 102, 559–571. [Google Scholar] [CrossRef]
  2. Yoon, S.J. Saemangeum dike listed in Guinness World Records. The Korea Times. 3 August 2010. Available online: http://web.archive.org/web/20181203042655/http://www.koreatimes.co.kr/www/tech/2018/07/693_70621.html (accessed on 3 December 2018).
  3. Ryan, R.; Berg, P.E.; Barry, R.; Christopher, B.R. Design of Mechanically Stabilized Earth Walls and Reinforced Soil Slopes—Volume I, FHWA-NHI-10-024; U.S. Technical Report for Federal Highway Administration (FHWA): Washington, DC, USA, 2009.
  4. Limsiri, C. Very Soft Organic Clay Applied for Road Embankment: Modelling and Optimisation Approach. Ph.D. Thesis, Delft University of Technology, Delft, The Netherlands, 2008. [Google Scholar]
  5. Federal Highway Administration (FHWA). User Guidelines for Waste and Byproduct Materials in Pavement Construction, FHWA-RD-97-148. Federal Highway Administration Research and Technology. 2008. Available online: http://web.archive.org/web/20181203043547/https://www.fhwa.dot.gov/publications/research/infrastructure/structures/97148/app4.cfm (accessed on 3 December 2018).
  6. Das, B.M. Principles of Foundation Engineering, SI 7th ed.; Cengage Learning: Stamford, CT, USA, 2011. [Google Scholar]
  7. Koerner, R.M. Designing with Geosynthetics, 4th ed.; Prentice-Hall: Upper Saddle River, NJ, USA, 1997. [Google Scholar]
  8. Castelli, F.; Cavallaro, A.; Maugeri, M. Laboratory Tests for Estimation of Static and Dynamic Interface Characteristics of Geosynthetic. In Proceedings of the 8th International Waste Management and Landfill Symposium, S. Margherita di Pula, Cagliari, 1–5 October 2001; pp. 157–166. [Google Scholar]
  9. Wang, J.Q.; Zhang, L.L.; Xue, J.F.; Tang, Y. Load-settlement response of shallow square footings on geogrid-reinforced sand under cyclic loading. Geotext. Geomembr. 2018, 46, 586–596. [Google Scholar] [CrossRef]
  10. Won, M.S. Effects of Reinforcement on Bearing Capacity of Loose Sand Foundation and Deformation Behavior of Buried Flexible Pipes. J. Test. Eval. 2010, 38, 232–241. [Google Scholar]
  11. Raheem, A.M.; Abdulkarem, M.A. Experimental Testing and Analytical Modeling of Strip Footing in Reinforced Sandy Soil with Multi-Geogrid Layers Under Different Loading Conditions. Am. J. Civ. Eng. 2016, 4, 1–11. [Google Scholar] [CrossRef] [Green Version]
  12. Jones, D.L. The Bearing Capacity and Settlement of Gravel Piles in Clay. Master’s Thesis, University of Cape Town, Cape Town, South Africa, 1980. [Google Scholar]
  13. Imai, G.; Nawagamuwa, U.P. Consolidation of clayey sub-soils with intermediate permeable layers improved by vertical drains with smear effect. Lowl. Technol. Int. 2005, 7, 19–29. [Google Scholar]
  14. Rethaliya, R.P.; Verma, A.K. Strip Footing on Sand Overlying Soft Clay with Geotextile Interface. Indian Geotech. J. 2009, 39, 271–287. [Google Scholar]
  15. Mandal, J.N.; Sah, H.S. Bearing Capacity Tests on Geogrid-Reinforced Clay. Geotext. Geomembr. 1992, 11, 327–333. [Google Scholar] [CrossRef]
  16. Abdelhadi, M. Improving the Bearing Capacity of Brown Clay by Using Geogrid. Contemp. Eng. Sci. 2013, 6, 213–223. [Google Scholar] [CrossRef]
  17. Benmebarek, S.; Berrabah, F.; Benmebarek, N. Effect of geosynthetic reinforced embankment on locally weak zones by numerical approach. Comput. Geotech. 2015, 65, 115–125. [Google Scholar] [CrossRef]
  18. Esmaeili, M.; Naderi, B.; Neyestanaki, H.K.; Khodaverdian, A. Investigating the effect of geogrid on stabilization of high railway embankments. Soils Found. 2018, 58, 319–332. [Google Scholar] [CrossRef]
  19. Le Hello, B.; Villard, P. Embankments reinforced by piles and geosynthetics – numerical and experimental studies dealing with the transfer of load on the soil embankment. Eng. Geol. 2009, 106, 78–91. [Google Scholar] [CrossRef]
  20. Shin, E.; Das, B.; Puri, V.; Yen, S.; Cook, E. Bearing Capacity of Strip Foundation on Geogrid-Reinforced Clay. Geotech. Test. J. 1993, 16, 534–541. [Google Scholar]
  21. Chen, Q.; Abu-Farsakh, M. Ultimate Bearing Capacity Analysis of Strip Footings on Reinforced Soil Foundation. Soils Found. 2015, 55, 74–85. [Google Scholar] [CrossRef] [Green Version]
  22. Jacinto, A.C.; Ledesma, A.; Demagistri, A. Effect of the clay-water interaction in the hydration of compacted bentonite used in engineered barriers. Geomech. Energy Environ. 2016, 8, 52–61. [Google Scholar] [CrossRef]
  23. Ausilio, E.; Conte, E. Influence of groundwater on the bearing capacity of shallow foundations. Can. Geotech. J. 2005, 42, 663–672. [Google Scholar] [CrossRef]
  24. Dixit, M.S.; Patil, K.A. Effect of Depth of Footing and Water Table on Bearing Capacity of Soil. In Proceedings of the Indian Geotechnical Conference, Mumbai, India, 16–18 December 2010. [Google Scholar]
  25. Craig, R.F. Craig’s Soil Mechanics, 7th ed.; Spon Press, Taylor & Francis Ltd.: New York, NY, USA, 2004. [Google Scholar]
  26. Das, B.M. Principles of Geotechnical Engineering, 7th ed.; Cengage Learning: Stamford, CT, USA, 2010. [Google Scholar]
Figure 1. The location of Saemangeum, Republic of Korea.
Applsci 10 02315 g001
Figure 2. The flow diagram of the experimental study.
Applsci 10 02315 g002
Figure 3. The particle size distribution for gravels, sand, and clay.
Applsci 10 02315 g003
Figure 4. The molds containing the material samples.
Applsci 10 02315 g004
Figure 5. The mold test equipment set-up.
Applsci 10 02315 g005
Figure 6. The (a) box model test experimental set-up, and the actual photos of the model test equipment for (b) a combination of NMC clay and gravel, and (c) sand.
Applsci 10 02315 g006aApplsci 10 02315 g006b
Figure 7. The sectional view of the mold test sample cases; (a) Case 1; (b) Case 2; (c) Case 3; (d) Case 4; (e) Case 5; (f) Case 6; (g) Case 7; and (h) Case 8.
Applsci 10 02315 g007aApplsci 10 02315 g007b
Figure 8. The sectional view of the box model test cases; (a) Case 1; (b) Case 2; (c) Case 3; and (d) Case 4.
Applsci 10 02315 g008
Figure 9. The locations and plan of the measuring equipment set-up.
Applsci 10 02315 g009
Figure 10. The load-settlement curve of mold test results.
Applsci 10 02315 g010
Figure 11. The bearing capacity analysis at 2.5, 5, 7.5, and 12.5 mm penetration.
Applsci 10 02315 g011
Figure 12. The comparison of the bearing capacity of NMC clay (Case 1) and OMC clay (Case 2).
Applsci 10 02315 g012
Figure 13. The comparison of the bearing capacity between loose sand (Case 3) and dense sand (Case 4).
Applsci 10 02315 g013
Figure 14. The comparison of the bearing capacity of unreinforced NMC clay versus reinforced NMC clay.
Applsci 10 02315 g014
Figure 15. The load-settlement curve of unreinforced NMC clay versus reinforced NMC clay.
Applsci 10 02315 g015
Figure 16. The bearing capacity analysis on box model test results.
Applsci 10 02315 g016
Figure 17. The BCR of unreinforced NMC clay versus other cases.
Applsci 10 02315 g017
Figure 18. The comparison of BCR for (a) reinforced NMC clay against the dense sand and (b) reinforced NMC clay and dense sand against the unreinforced NMC clay.
Applsci 10 02315 g018
Figure 19. The comparison of BCR for the (a) effects of composite geotextiles and (b) effects of crushed gravel and composite geotextiles.
Applsci 10 02315 g019
Figure 20. Illustrates the deformations at the surface of the model samples; (a) When Settlement of Loading Plate is at 0.05B (S = 15mm); (b) When Settlement of Loading Plate is at 0.10B (S = 30mm); (c) When Settlement of Loading Plate is at 0.15B (S = 45mm).
Applsci 10 02315 g020aApplsci 10 02315 g020b
Figure 21. The actual model test photos at 50 mm loading plate vertical displacement; (a) Case 1; (b) Case 2; (c) Case 3; and (d) Case 4.
Applsci 10 02315 g021
Table 1. Clay Properties.
USCS Class.Specific Gravity, GsPercentage Passing #200 SieveLiquid Limit, LLPlastic Limit, PLPlasticity Index, PIMax Dry Unit Weight, kN/m3Optimum Moisture Content (OMC)Normal Moisture Content (NMC)
NMC 1NMC 2
CL2.63797%45.0%23.6%21.4%17.7514.5%30%35%
Table 2. Sand Properties.
USCS ClassificationD60
(mm)
D30
(mm)
D10
(mm)
CuCcSpecific GravityVoid RatioDry Unit Weight (kN/m3)
Max Min Max Min
SP0.630.510.441.400.942.7151.010.6915.7913.24
Table 3. Crushed Gravel Properties.
USCS Class.Gravel 1
Size Distribution (mm)
Gravel 2
Size Distribution (mm)
Unit Weight
kN/m3
Bulk Specific Gravity
D60D30D10CuCcD60D30D10CuCc
GP8.206.205.201.60.909.706.805.301.800.915.972.84
Table 4. Composite Geotextile Properties.
Physical CharacteristicMaterialTensile Strength (kN/m)Tensile Elongation (%)Thickness mm
WarpWeftWarpWeft
Woven and Non-WovenPET156.54149.0537.631.4≈2
Table 5. Specifications of Mold Test Sample Cases.
ParametersCase 1Case 2Case 3Case 4Case 5Case 6Case 7Case 8
ClayOMC 1-------
NMC 2---
SandLoose-------
Dense-------
Crushed Gravel No. 1-----
No. of Composite Geotextile Layers-----334
Compaction Methodmanual surface vibration4.5 kgs rammer (55 blows)nonerubber hammer (side)manual surface vibrationmanual surface vibrationmanual surface vibrationmanual surface vibration
Unit Weight, ɣ (kN/m3)17.620.513.515.717.316.117.115.9
1 OMC—stands for Optimum Moisture Content, which is equivalent to 14.5%. 2 NMC—stands for Normal Moisture Content, which is equivalent to 30.0%.
Table 6. Box Model Test Material Composition.
ParametersCase 1Case 2Case 3Case 4
Clay (NMC = 35%)-
Dense Sand---
Crushed Gravel No. 2--
Composite Geotextile Layer---3
No. of Layer(s)1144
Unit Weight (kN/m3)17.0215.4916.5615.76

