Article

Ultrasonic VHCF Tests on Very Large Specimens with Risk-Volume Up to 5000 mm3

by
Andrea Tridello
*,
Davide Salvatore Paolino
and
Massimo Rossetto
Department of Mechanical and Aerospace Engineering, Politecnico di Torino, 10129 Turin, Italy
*
Author to whom correspondence should be addressed.
Appl. Sci. 2020, 10(7), 2210; https://doi.org/10.3390/app10072210
Submission received: 28 February 2020 / Revised: 16 March 2020 / Accepted: 17 March 2020 / Published: 25 March 2020
(This article belongs to the Special Issue Advances in Very-High-Cycle Fatigue)

Abstract

:
The research on the size-effects in Very-High-Cycle Fatigue (VHCF) has recently drawn the attention of several scholars. The fatigue cracks in VHCF originate from the largest defect present within the loaded material volume (risk-volume) and the larger the risk-volume, the larger the probability of critical defects affecting the VHCF response (size-effect). Many models have been proposed in the literature to deal with size-effects in VHCF. However, the proposed models cannot be validated on full-scale components, since VHCF tests are typically carried out with ultrasonic fatigue testing machines. The authors have proposed a specimen geometry, the so-called Gaussian specimens, to enlarge as much as possible the risk-volume in ultrasonic VHCF tests. In this study, fully reversed tension–compression ultrasonic VHCF tests up to 109 cycles were carried out on AISI H13 steel Gaussian specimens with a risk-volume of 5000 mm3, two times larger than the largest tested in the literature. The stress distribution and the absence of bending loads were verified with strain gages, proving that VHCF tests on risk-volumes of 5000 mm3 can be reliably carried out. Ultrasonic VHCF tests were also carried out on small hourglass specimens, confirming that larger risk-volumes allow for a more reliable design against VHCF failures.

1. Introduction

Design methodologies for structures and components subjected to static or cyclic loads have the main objective of preventing failures or minimizing the risk of failures. According to International Standards, the material strength against static or fatigue failures is generally assessed through laboratory tests on small specimens with standard geometries. The size of components is, however, significantly larger than that of specimens commonly tested, and the material strength, as well as the stress gradient [1], in the most stressed region is size-dependent. This is known as size-effect, and it must be properly considered for the structural integrity of components [2], particularly when components are subjected to fatigue loads in service.
Size-effects have been extensively investigated in the literature, in the case of High-Cycle Fatigue (HCF) response of metallic materials. It is mainly caused by the variation of the stress gradient within the so-called process-zone from specimens, with small volumes, to components, characterized by larger volumes. Secondly, the probability of weak sites (e.g., microstructural discontinuities) increases with larger process-zones, thus inducing a reduction of the HCF strength [3]. International Standards prescribe how to deal with size-effects when components subjected to HCF loads are to be designed. On the other hand, size-effects in the Very-High-Cycle Fatigue (VHCF) region (i.e., the region below the conventional fatigue limit and above 10 7 cycles) represent an almost unexplored research field. It is well-known that the fatigue crack in the VHCF region generally originates from the largest defect present within the volume of stressed material (risk-volume). Size-effects in VHCF are associated to the random distribution of the defect size within the risk-volume, denoted as V90 and defined [3] as the volume of material subjected to a stress amplitude above the 90% of the maximum applied stress. According to [3], the probability of defects with larger size increases with the risk-volume, thus inducing a reduction of the VHCF strength. Murakami [3] proposed a methodology for predicting the most critical defect in the component volume based on inclusion inspections on polished metallographic samples. In [4], the size-effect was investigated by performing ultrasonic VHCF tests (load frequency of 20 kHz) on hourglass specimens with small V90 ( 33   mm 3 ) and on dog-bone specimens with larger V90 ( 912   mm 3 ). Experimental results showed that a significant decrement of the VHCF response occurs when increasing the tested V90. The non-uniform distribution of the stress amplitude in dog-bone specimens [5] prevented from a more extended investigation of size-effects on larger risk-volumes in [4]. For this reason, the authors [6] proposed a new specimen geometry, the so-called Gaussian specimen, which permitted them to significantly increase the maximum testable V90 with ultrasonic machines. In [7], the authors carried out tests on hourglass and Gaussian specimens with V90 of 294 and 2300 mm3, respectively. The investigation was made on specimens made of an AISI H13 steel before and after the ElectroSlag Remelting (ESR) process. Both materials evidenced a significant size-effect, which was more relevant in the case of the unrefined H13 steel. In [8], ultrasonic VHCF tests were carried out up to 1010 cycles on Al-Si-Cu hourglass specimens with increasing diameter, from 3 to 6 mm.
In the present research, ultrasonic VHCF tests up to 109 cycles were carried out on Gaussian specimens made of an AISI H13 steel. The tested risk-volume, about 5000 mm3, was two times larger than the largest tested in the literature. Fully reversed tension–compression tests were carried out with the ultrasonic testing machines developed at Politecnico di Torino. The stress distribution and the absence of bending spurious loads was verified by means of strain gages, proving that very large risk-volumes can be reliably tested with the proposed geometry. Ultrasonic tests were also carried out on small hourglass specimens with limited risk-volume (55 mm3), in order to investigate possible size-effects and the reliability of P–S–N curves estimated from test results on specimens having small V90.

2. Materials and Methods

In this section, the experimental activity is described in detail. Section 2.1 is about the H13 steel used for the specimen production. Section 2.2 deals with the design procedure adopted for the Gaussian specimens with a risk-volume of 5000 mm3. Section 2.3 describes the strain-gage calibration and the ultrasonic testing machine used for the experimental tests.

2.1. Specimen Material

Hourglass and Gaussian specimens subjected to ultrasonic VHCF tests were produced with an AISI H13 high-strength steel subjected to an ElectroSlag Remelting (ESR) process (commercial name Orvar® Supreme, Bohler Uddeholm). The investigated material is a tool steel that is also used for the production of components subjected to low-amplitude fatigue loads at a very high number of cycles (e.g., fuel injectors for naval engines and aerospace components). The ESR process was carried out after a traditional casting process, in order to increase the steel cleanliness and remove large and rare defects. For more details on the ESR process, the reader is referred to [9]. Table 1 reports the chemical composition of the tested H13 steel:

2.2. Gaussian Specimen Design

The geometry of Gaussian specimens with a risk-volume of 5000 mm3 was designed through an iterative optimization procedure. At first, a preliminary geometry was analytically defined according to [6]. Thereafter, an iterative numerical procedure was developed in order to define the specimen geometry, ensuring a resonance frequency (f0) of 20 kHz, a stress concentration factor (kt,0) smaller than 1.07 (smooth specimen), a risk-volume (V90,0) larger than 5000 mm3 and a specimen amplification factor (Mσ,0), defined according [6,10], larger than 1.4 (to ensure the application of a sufficient stress amplitude in the Gaussian profile). A model of the specimens was created by using the commercial software Ansys. Axisymmetric elements, Plane82 in Ansys, were used for the model. Due to its symmetry, only half of the specimen was modeled. A modal analysis was then carried out and the resonance frequency (fris,FEA) the stress concentration factor (kt,FEA) [9], the risk-volume (V90,FEA) and the stress amplification factor (Mσ,FEA) were assessed. A Matlab routine was written in order to iteratively vary the specimen geometry, with the aim of minimizing an objective function defined as the sum of the percentage difference between the computed FEA values (fris,FEA, kt,FEA, V90,FEA and Mσ,FEA) and the desired nominal values (fris,0, kt,0, V90,FEA and Mσ,0). The final geometry, characterized by fris,FEA equal to 20.028 kHz, kt,FEA equal to 1.042, V90,FEA equal to 5067 mm3 and Mσ,FEA equal to 1.42, is shown in Figure 1a. The geometry of the investigated hourglass specimens, with 3 mm diameter at the gage section (a typical value for ultrasonic tests in the VHCF literature [10,11,12]) and characterized by a significantly smaller risk-volume equal to 55 mm 3 is depicted in Figure 1b. Dimensions in Figure 1 are in mm.
The hourglass and the Gaussian specimens were produced through a machining process, starting from round bars provided in the annealed condition. Thereafter, the specimens were subjected to a heat treatment involving preheating at 750 °C for 1 h, austenitization at 1030 °C for 1 h, gas quenching and triple tempering (first tempering at 520 °C for 1 h; second tempering and third tempering at 540 °C for 1 h). The heating phase was carried out in a vacuum environment, whereas the cooling phase was carried out in a furnace filled with inert gas. The Vickers hardness after the heat treatment was experimentally measured (INNOVATEST® Nemesis 9000) at the center of the cross-section at the specimen free end; the measured hardness was 615 HV, with a limited variation within the cross-section (smaller than 2 % ), thus confirming the uniformity of the microstructure. Before the experimental tests, the specimens were finely mechanically polished [13] with sandpapers, with increasing grit, to enhance the crack nucleation from defects randomly distributed within the risk-volume and avoid premature failures in the HCF region due to cracks propagating directly from large defects that originated during the machining process.

2.3. Ultrasonic Fatigue Tests

Experimental tests were carried by using the ultrasonic fatigue testing machines developed at Politecnico di Torino. According to [7,9], an ultrasonic generator (Branson DCX 4 kW) generates an electric sinusoidal signal with a frequency of 20 kHz, which is converted by a piezoelectric transducer in mechanical vibration. Two mechanical amplifiers (a booster, provided by Branson, and a horn, designed in Ti6Al4V alloy by the Authors), rigidly connected through a threaded connection to the piezoelectric transducer, amplify the vibration amplitude in order to induce a fully reversed tension–compression stress within the specimen, which is rigidly connected with an adhesive butt-joint to the horn.
Before the tests, the stress distribution within the risk-volume and the presence of spurious bending loads in Gaussian specimens were verified through a strain-gage calibration. Three strain gages were bonded to a Gaussian specimen: The location of the strain gages (Gage A and Gage B) used for the validation of the stress distribution is shown in Figure 2a; meanwhile, the location of the strain gages used to verify the presence of bending loads (Gage A and Gage C) is shown Figure 2b. It is worth noting that this gage calibration was not carried out on small hourglass specimens, since they have been widely employed and validated in the literature [10,11,12].
Strain-gage rosettes in the half bridge configuration for the temperature compensation were used for the calibration: in particular, the HBM 1-XY91-1.5/350 strain-gage rosettes and the HBM XY31-1.5/350 strain-gage rosettes were used for the stress validation and for the assessment of bending loads, respectively. A strain-gage amplifier (Elsys SGA2-Box/7) was used for the amplification of the gage signal, which was acquired with multifunction data acquisition (National Instrument, NI 6363), at a sampling frequency of 300 kHz.
After the calibration, the experimental tests were carried out at a constant stress amplitude up to failure, or up to 109 cycles (runout number of cycles). According to [9], the stress amplitude was kept constant with a closed-loop control based on the displacement at the specimen free end, U0, measured with a laser displacement sensor. The correlation between U0 and the stress amplitude within the risk-volume was verified through a second strain-gage calibration, according to [9], for both the hourglass and the Gaussian specimens. The temperature at the specimen center was monitored during the tests with an infrared sensor and intermittent tests [12] were carried out. In particular, a limited temperature increment of 2 °C (with respect to the specimen temperature at the beginning of the test, T0) was conservatively set, to guarantee a uniform temperature distribution within the risk-volume of Gaussian specimens. When the maximum temperature was exceeded, the control system automatically stopped the test, to go back to the initial value T0. Three vortex tubes were also used to slow down the temperature increment when the specimen was loaded and to speed up the cooling phase.

3. Results

In this section, the experimental results are analyzed. Section 3.1 reports the results of the strain-gage calibration for the Gaussian specimens. Section 3.2 deals with the experimental dataset, and in Section 3.3, the defects originating the fatigue failures are analyzed. Finally, the P–S–N curves are estimated in Section 3.4, and the size-effect is discussed in Section 3.5.

3.1. Experimental Calibration

Figure 3 reports the stress-amplitude variation between Gage A and Gage B, computed through Finite Element Analysis (“FEA” in Figure 3) and measured with strain gages (“Experimental” in Figure 3). In particular, the ordinate axis reports the stress amplitude measured by Gage B (sB), normalized with respect to the stress amplitude measured by Gage A (sA). For the experimental data, the stress amplitude was computed through a sinusoidal interpolation of the acquired signal, whereas, for the FEA model, the stress along the gage length (1.5 mm, subdivided in 140 points) was considered. Figure 3b shows the data points acquired with Gage A and Gage C for an input voltage amplitude of 1.4 V (inducing a maximum stress amplitude of about 105 MPa). The acquired data points were interpolated with a sinusoidal function.
According to Figure 3a, the measured sA was close to the measured sB, and the difference between the experimental and the FEA ratio sA/sB was limited (i.e., the experimental average value was equal to 0.997, and the FEA average value was equal to 1.006). The scatter of the ratio sA/sB was within a limited range that was smaller than ± 3%, and this was mainly due to the signal noise. It is worth noting that the ratio was above 1, since the stress amplitude slightly increases from the specimen half length, as already shown in [6]. This first calibration confirmed the uniformity of the stress distribution within the risk-volume and validated the FEA model considered for the design of the Gaussian specimen. Moreover, Figure 3b confirms that bending loads are not present even in Gaussian specimens characterized by very large risk-volumes. The two sinusoidal fitting functions overlap. The 90% confidence intervals for the amplitude, equal to [105:107] MPa for Gage A and to [105:106] MPa for Gage C, and for the phase, equal to [149:155] rad for Gage A and to [150:155] rad for Gage C, overlap. This is a further confirmation that the risk-volume was subjected to pure tension–compression stress, with no bending loads. It is worth noting that this test was also carried out at larger stress amplitude and, even in this case, no bending loads were found.

3.2. Experimental Results

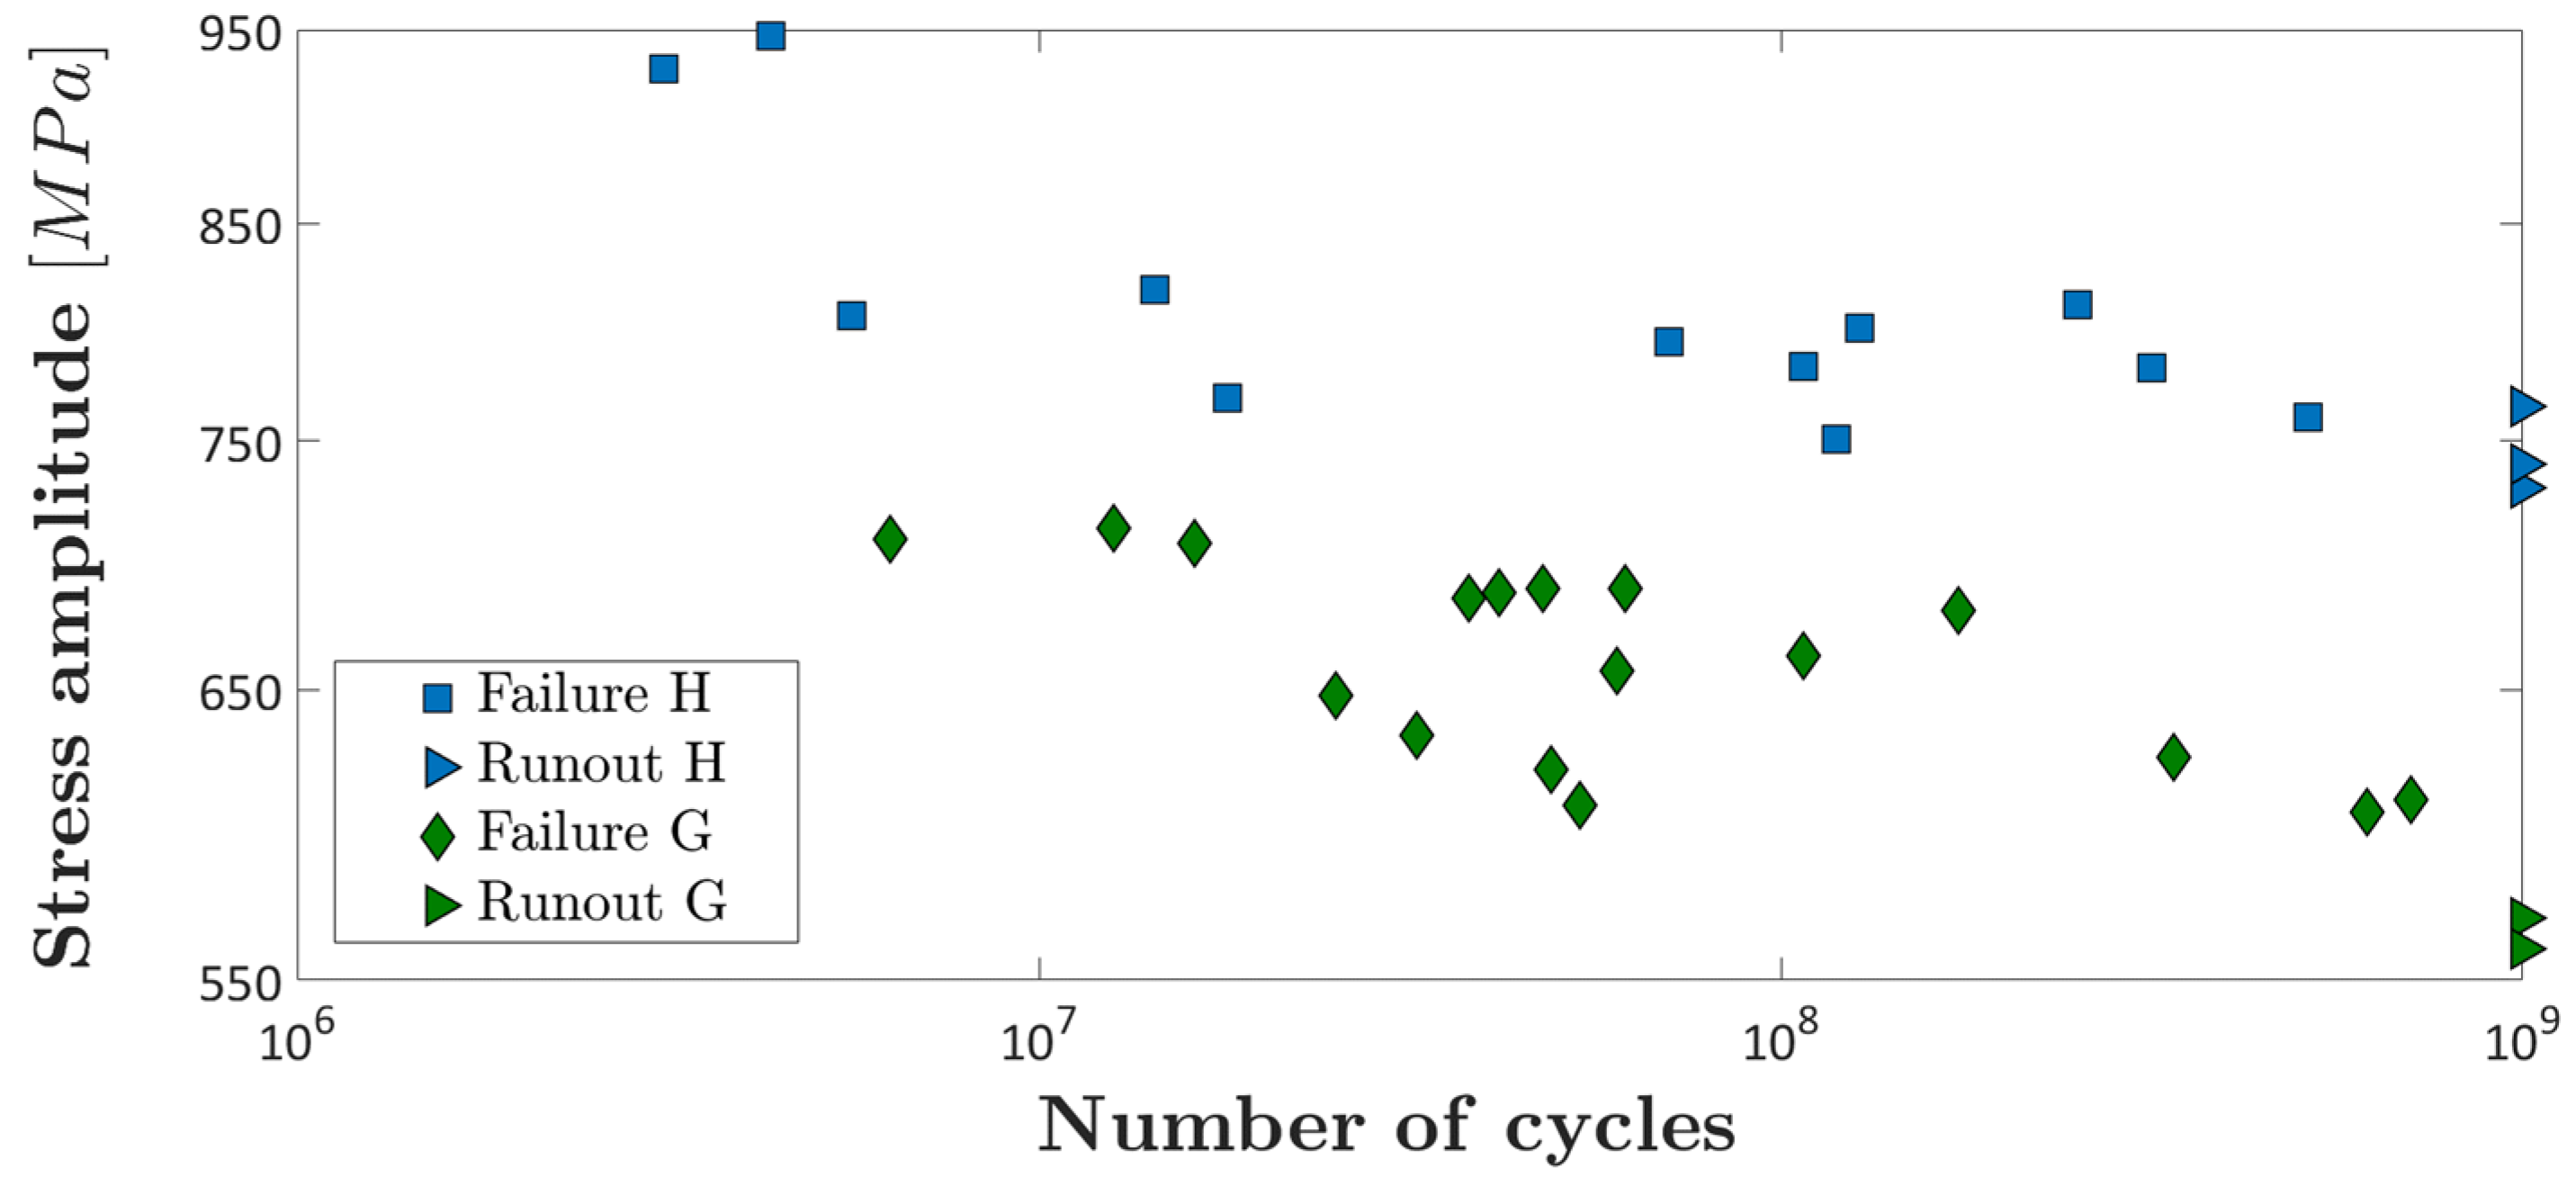
Hourglass and Gaussian specimens were tested in a stress-amplitude range, measured at the specimen half length, scenter, equal to [560:950] MPa. Failures occurred in a range of number of cycles to failure, Nf, equal to [3.13·106:7.08·108]. The fatigue failures originated from a defect, which was experimentally observed by the Scanning Electron Microscope (SEM, Tescan Mira3 FE SEM). As in [9], the stress amplitude close to the defect location, slocal, was considered as the applied stress amplitude during the tests, in order to take into account the real stress originating the fatigue failure. Figure 4 shows the S–N plot of the experimental datasets related to the hourglass specimens (blue square marker) and to the Gaussian specimens (green diamond marker). As for the hourglass specimens, in total, 16 tests were carried out, with 13 failures and 3 runouts. In one case, however, the stress amplitude was not properly controlled during the tests, and it is not considered in the following analysis. Nonetheless, the defect originating the fatigue failure was clearly visible through a SEM investigation, and it was thus considered for the defect analysis. As for the Gaussian specimens, 20 tests were carried out, with 18 failures and 2 runouts. One specimen out of 20 failed before 105 cycles, due to a large surface scratch, and it is not considered in the following analysis.
As expected, Figure 4 shows that the dataset related to hourglass specimens is above that related to Gaussian specimens. As for the hourglass specimens, no failure occurred below 730 MPa; however, when the Gaussian specimens are considered, no failure occurred below 605 MPa. These different responses offer clear evidence of a significant size-effect. Further discussions are carried out in Section 3.5.

3.3. Fracture Surfaces and Defect Analysis

At first, the distribution of defects within the risk-volume was analyzed. The location of defects in the radial direction was measured through digital image processing of the fracture surface images obtained by using the optical microscope (Leica Z16 APO A) and the SEM; meanwhile, the location of the defect along the longitudinal direction was measured by using a digital caliber with a nominal resolution of 0.01 mm.
Figure 5 shows the distribution of defects within the risk-volume of hourglass specimens (Figure 5a) and Gaussian specimen (Figure 5b). In the following, the defect at the origin of the fatigue failure is called “critical defect”.
According to Figure 5, critical defects in hourglass and Gaussian specimens were randomly distributed within the risk-volume, but in hourglass specimens, they were mainly concentrated near the specimen surface, with all but one of the defects at a distance from the surface smaller than 0.8 mm. On the other hand, critical defects in Gaussian specimens were more internal and more uniformly distributed within the risk-volume. This can be explained by considering, for the two specimen types, the different stress gradients and stress distributions within the risk-volume. Moreover, one failure in hourglass specimen and one failure in Gaussian specimens originated from a defect outside the V90 region, for stress amplitudes equal to the 83% and the 88% of the maximum stress amplitude.
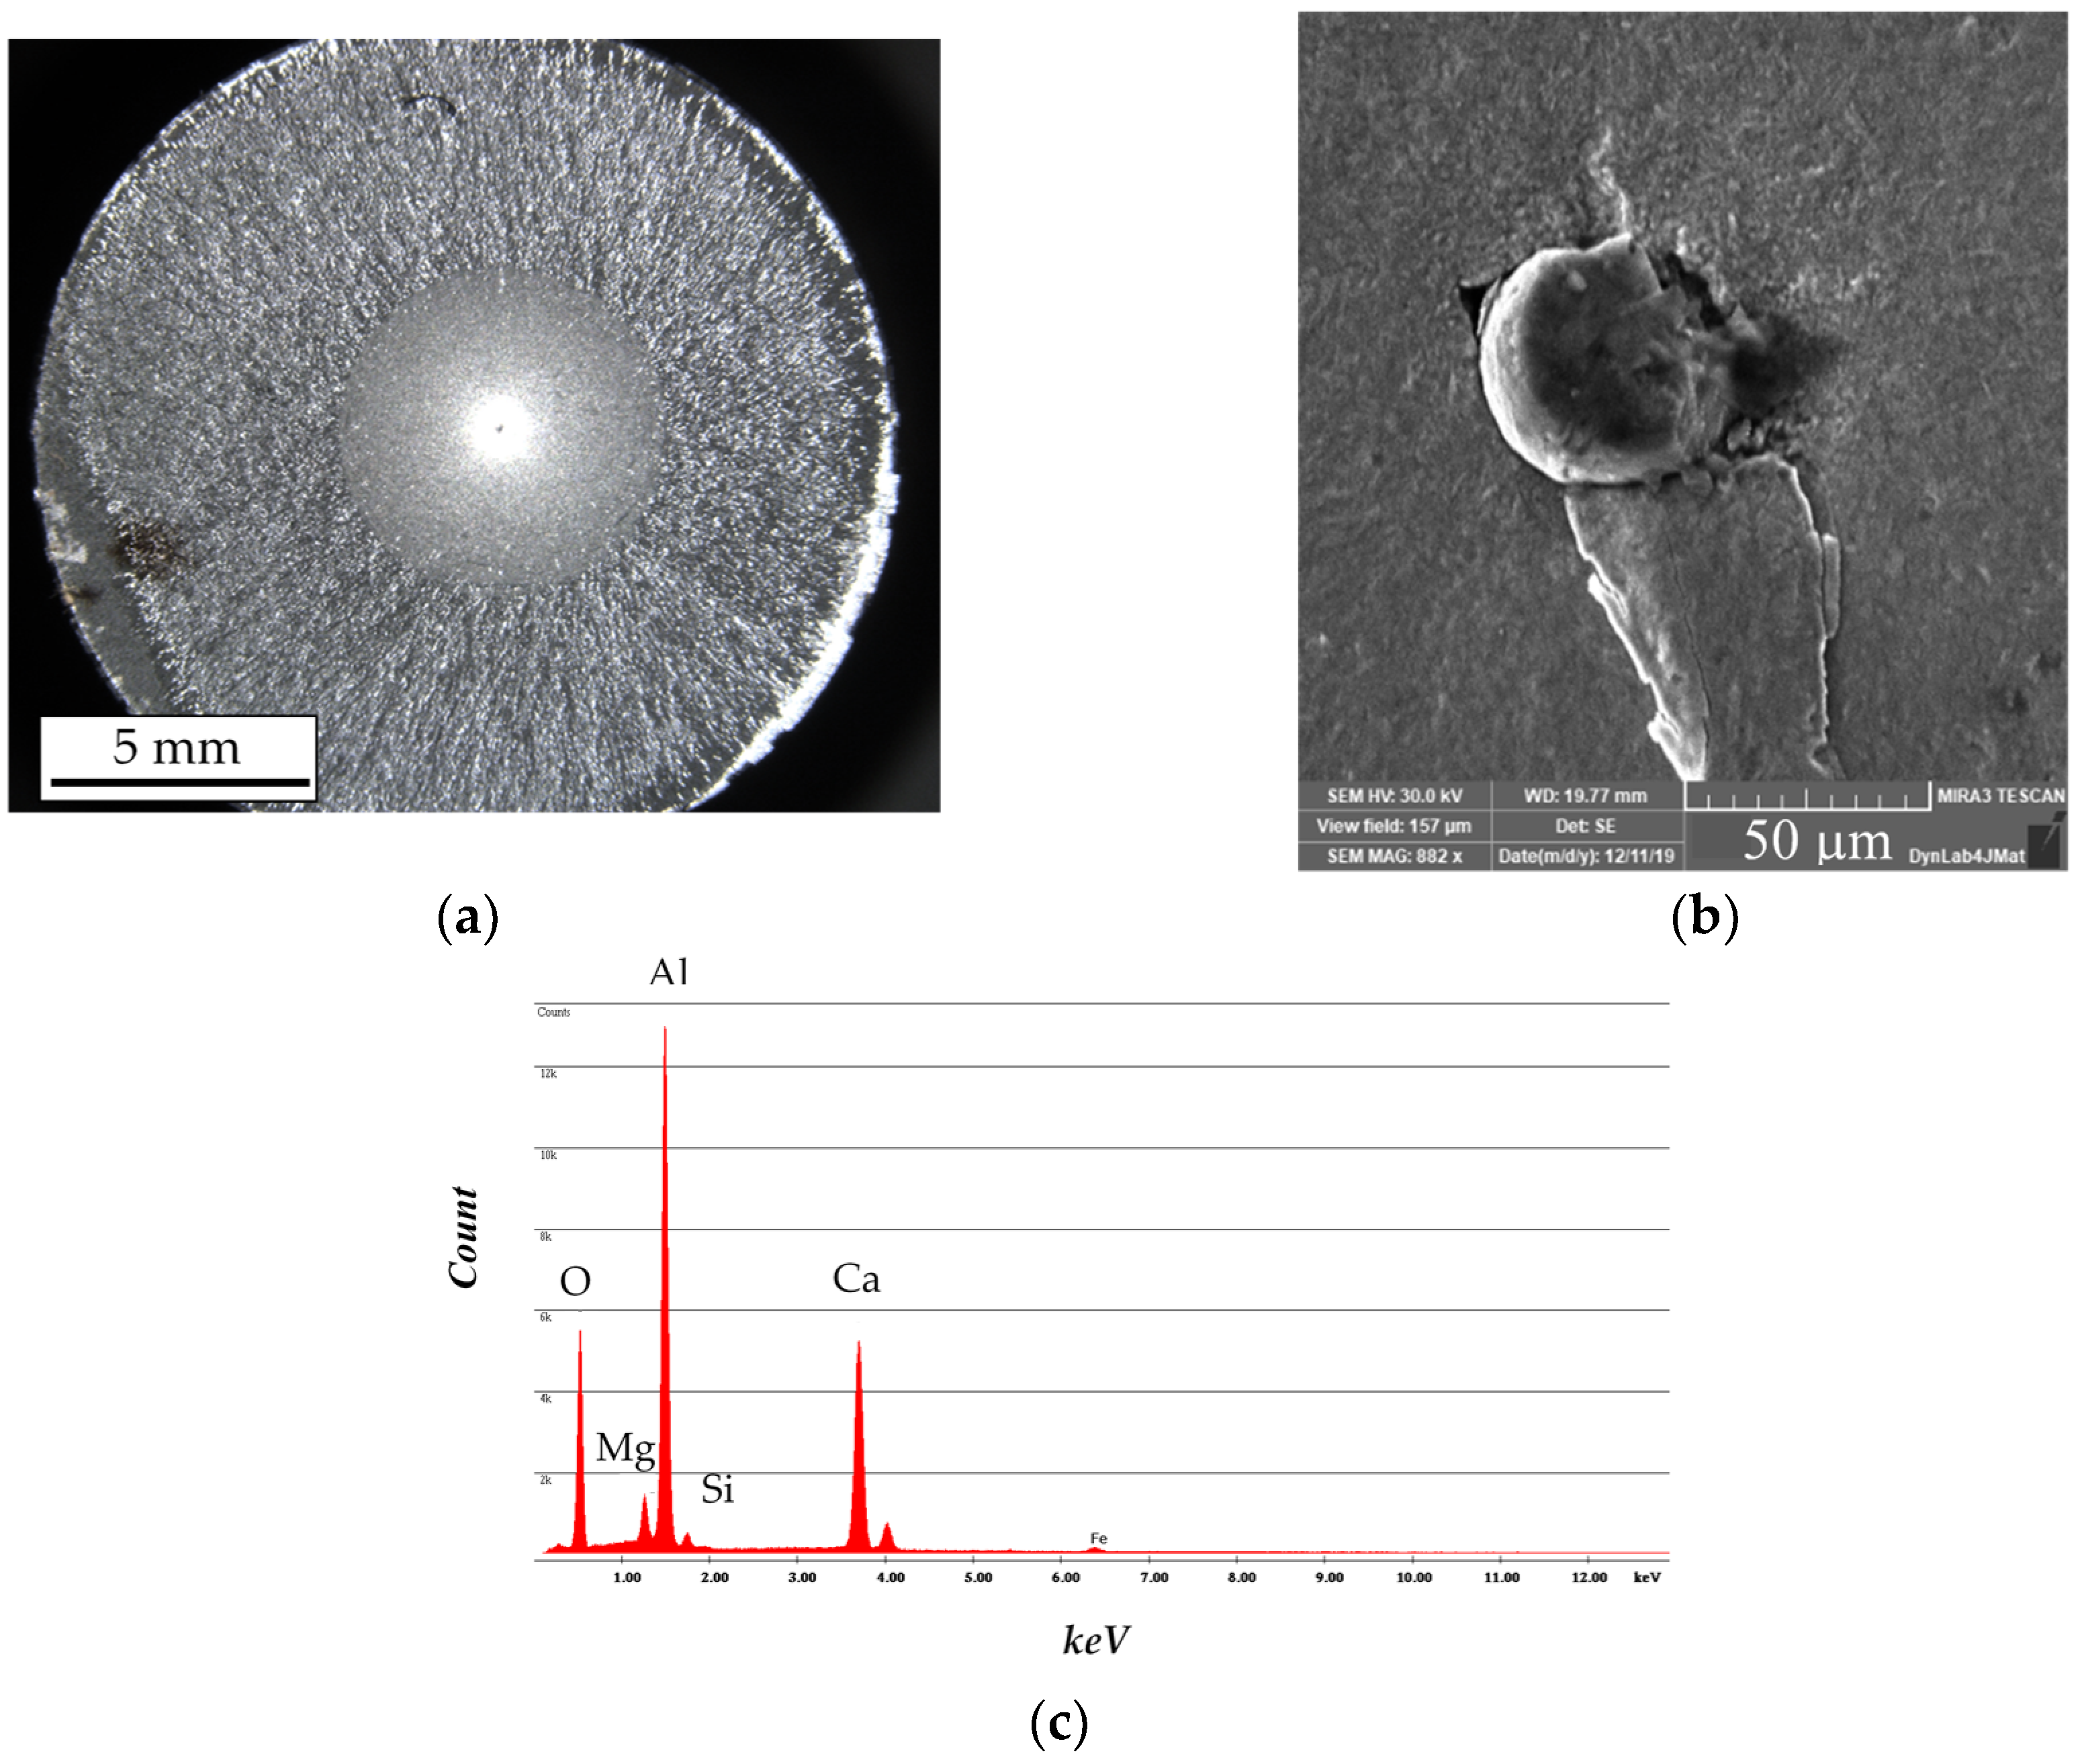
Figure 6a shows an example of a typical fracture surface found both in hourglass and in Gaussian specimens and observed with the optical microscope (Leica Z16 APO A): in particular, it is shown the fracture surface of a Gaussian specimen. All but one fracture surfaces showed a fish-eye morphology, with the initial defect surrounded by a Fine Granular Area (FGA). Figure 6b shows an example of the initial defect (spherical inclusion) originating the fatigue failure, observed with the SEM. In almost all the fatigue failures with a fish-eye morphology (22 out of 28), the initial defect was a spherical inclusion with regular shape, whereas in 6 out of 28 failures, the initial defect showed a more irregular morphology. EDX (EDAX Genesis) analysis was also performed and confirmed that all the initial defects were oxide inclusions with high percentage of Al, Ca, Si and, in some cases, S. Figure 6c shows an example of a typical EDX spectrum taken at the center of an inclusion originating the fatigue failure. Further detailed analyses on the chemical composition of the inclusions originating the fatigue failures were not carried out, since, according to [3], the defect size mainly controls the VHCF response, with the chemical composition having a limited influence. Therefore, since one of the main objectives of the paper was to validate the methodologies proposed to deal with size-effects in VHCF (Section 3.5), the EDX was carried out to qualitatively verify if the critical inclusions in hourglass and in Gaussian specimens were similar, without focusing on their origin and chemical composition, which is out of the scope of the present paper.
The sizes of the critical defects were also compared. According to [3], the defect size, a d , 0 , mainly affects the VHCF response, provided that an “equivalent defect size” is considered when dealing with defects with irregular morphology and shape. Accordingly, the equivalent defect size for non-spherical inclusions was assessed by following the indications in [3,14]. Table 2 reports the defect sizes in hourglass and Gaussian specimens. Runout specimens were subjected to a second test at a larger stress amplitude, in order to reveal, also in case of runouts, the critical defects within the risk-volume. When the fatigue failure originated from a defect clearly visible through an SEM analysis, the defect was considered for the following analyses. In Table 2, a d , 0 m i n , a d , 0 m a x and a d , 0 m e d i a n refer to the equivalent size of the smallest, the largest and the median critical defect for the hourglass (first column) and for the Gaussian specimens (second column).
According to Table 2, critical defects in Gaussian specimens are significantly larger than those in hourglass specimens, with the smallest defect in Gaussian specimens larger than the largest one in hourglass specimens, and with the largest defect in Gaussian specimens about twice the largest defect in hourglass specimens. Moreover, a d , 0 m e d i a n in Gaussian specimens is about 2.7 times the a d , 0 m e d i a n in hourglass specimens. This is clear evidence of size-effects. Indeed, according to [3], very large defects, critical for the VHCF response since fatigue failures originate from the largest defect in the risk-volume, are rare and unlikely in small risk-volumes. On the other hand, the probability of critical and large defects statistically increases with the risk-volume, thus justifying that similar defects but with larger size originate the fatigue failure in Gaussian specimens. It is worth noting that smaller defects could also be present in Gaussian specimens, but they are not critical and do not originate the fatigue failure.

3.4. P–S–N Curves

The marginal P–S–N curves were finally estimated, according to [15]. In particular, the fatigue life was modeled by considering a monotonically decreasing behavior in the finite life region, with an asymptotic behavior at the end (fatigue limit). According to Equation (1), the cumulative distribution function (cdf) of the fatigue life, F Y ( y ; x ) (being x and y the logarithm of the applied stress and of the number of cycles to failure) can be expressed by multiplying the conditional cdf of the fatigue life F Y | a d 0 ( y ; x , a d 0 ) (conditioned to the defect size a d 0 ) by the probability density function (pdf) of the defect size, f a d 0 ( a d 0 ) :
F Y ( y ; x ) = 0 F Y | a d 0 ( y ; x , a d 0 ) f a d 0 ( a d 0 ) d a d 0 ,
According to [15,16], the finite fatigue life was assumed to be Normally distributed, with mean linearly dependent on the applied stress amplitude and on the defect size a d 0 and constant standard deviation. The fatigue limit was assumed to be Normally distributed with mean value depending on a d 0 , whereas the defect size was assumed to follow the Largest Extreme Value Distribution (LEVD), according to [3]. The median, the 0.95-th and the 0.05-th quantiles of the P–S–N curves are shown in Figure 7, together with the experimental data. In particular, Figure 7a,b depict the P–S–N curves for the hourglass and the Gaussian specimens, respectively.
According to Figure 7, the estimated marginal P–S–N curves are in good agreement with the experimental data. Indeed, for the hourglass and for the Gaussian specimens, the median P–S–N curve is above about the 50% of the experimental failures, and all the data are within the 0.05-th and the 0.95-th quantiles of the P–S–N curves.

3.5. Size-Effect: Discussion

One of the main objectives of the paper, besides experimentally validating the Gaussian specimens with very large risk-volume, was to verify how accurate and reliable is the prediction of the VHCF response of parts with large risk-volume through tests on small hourglass specimens, which are commonly adopted in the literature. The P–S–N curve for a risk-volume, V90,pred, larger than that experimentally tested, V90,exp, can be estimated by modifying Equation (1). According to [3,15,17], the pdf ( f a d , p r e d ( a d , 0 ) ) of the predicted defect size, a d , p r e d , was computed as follows:
f a d , p r e d ( a d , 0 ) = n · [ F a d , e x p ] n 1 f a d , e x p ( a d , 0 ) ,
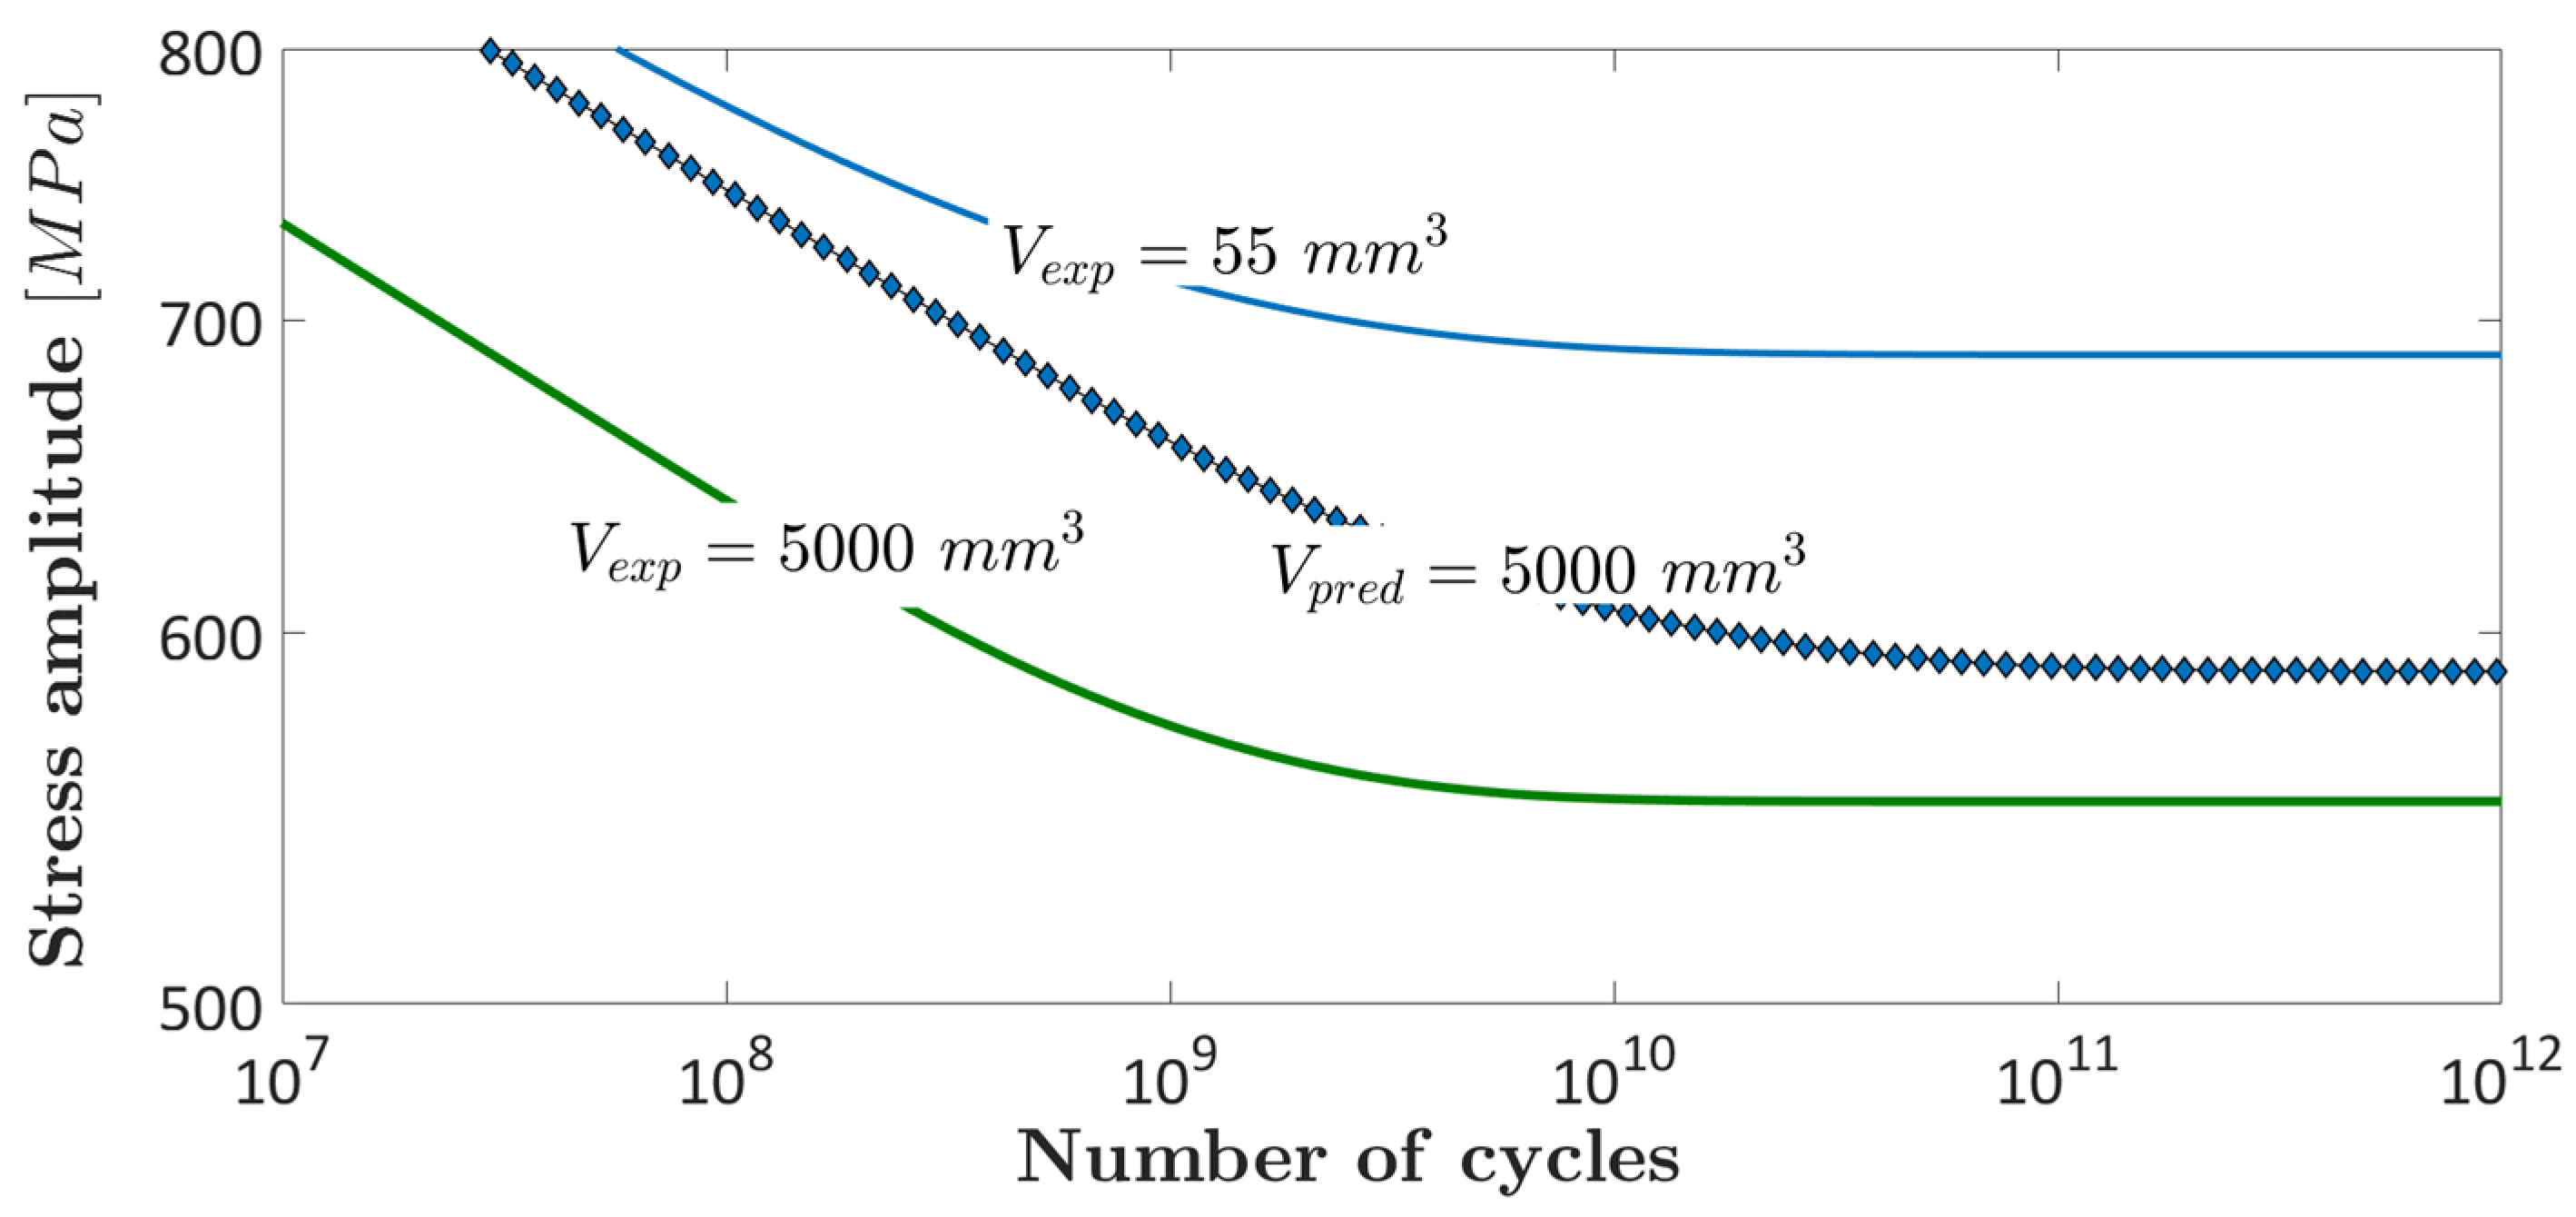
where f a d , e x p and F a d , e x p are the pdf and the cdf of the experimental defect size and n = V90,pred/V90,exp. Equation (2) permitted to predict a d 0 for a risk-volume larger than that experimentally tested. It is worth noting that, for n = 1, the tested risk-volume was taken into account, whereas for n > 1, the critical a d 0 for a larger risk-volume was predicted. By substituting f a d 0 in Equation (1) with f a d , p r e d , the P–S–N curve as a function of V90,pred was easily obtained. Figure 8 plots the median P–S–N curves estimated from experimental tests on hourglass (Vexp = 55 mm3 in Figure 8) and on Gaussian specimens (Vexp = 5000 mm3 in Figure 8) and the median P–S–N curve predicted by considering the experimental results on hourglass specimens (Vpred = 5000 mm3 in Figure 8).
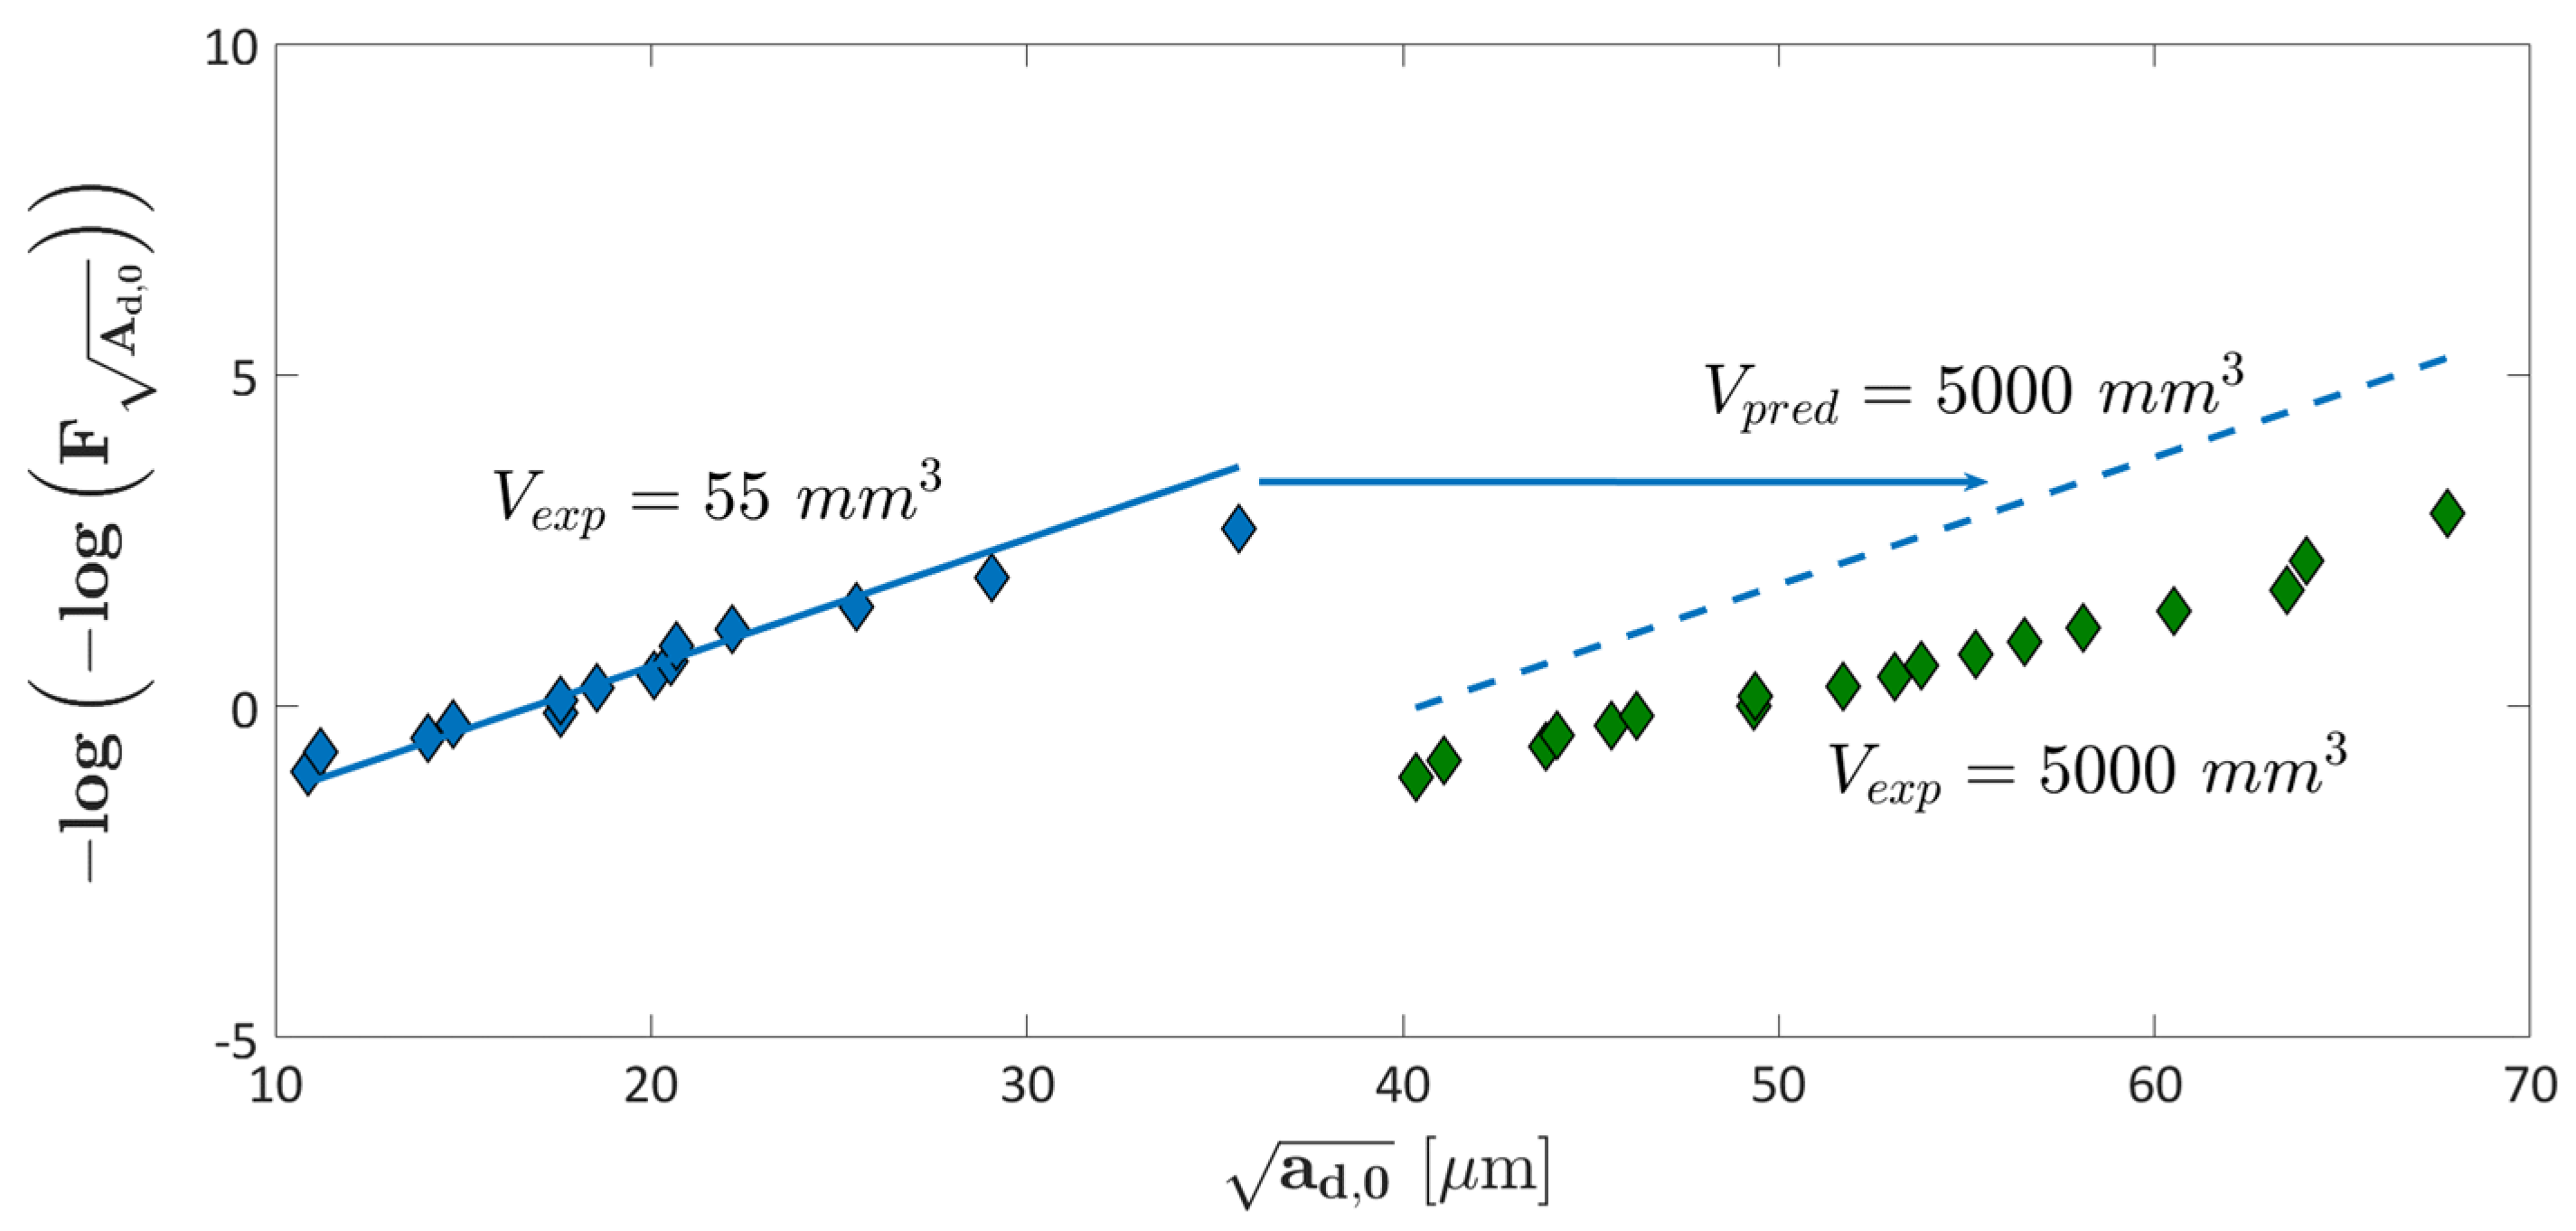
As shown in Figure 8, the predicted P–S–N curve is above the experimental P–S–N curve. By considering the fatigue limit, the difference is about 7%, but it increases up to 14% in the finite life region. This difference is mainly related to the capability of predicting the defect size in large Vpred. Figure 9 shows the Gumbel plot of the experimental dataset, together with the estimated LEVD. The LEVD for Vpred = 5000 mm3 was estimated, according to Equation (2), starting from the LEVD of hourglass specimens.
According to Figure 9, the predicted LEVD underestimates the Gaussian dataset. This is one of the main reasons for the error in the prediction of the median P–S–N curve for Vpred = 5000 mm3 (Figure 8). In particular, the definition of risk-volume as “the region subjected to a stress amplitude larger than the 90% of the maximum stress” could be not appropriate and could lead to conservative or non-conservative predictions. Indeed, even if a 10% stress-amplitude variation was shown in the literature [3,4] to be appropriate to describe the “region at risk” and, therefore, to be considered as the reference volume for predictions, it cannot completely take into account the effect of stress gradients within that region. Indeed, the more uniform is the stress distribution in the risk-volume, the higher the probability of finding larger critical defects. In addition, defects subjected to a stress amplitude below the 90% of the maximum stress may be in any case critical in the VHCF region, since it is well-known that cracks can propagate even though the stress intensity factor is below the threshold for crack propagation [18,19,20]. This is confirmed by the fact that two fatigue failures originated at a stress amplitude below the 90% of the largest applied stress amplitude. For these reasons a statistical distribution of critical defects should also take into account the stress amplitude distribution within the volume and would finally permit a more reliable estimation of the actual “volume at risk” that must be considered if the stress amplitude is not constant.

4. Conclusions

In this paper, ultrasonic Very-High-Cycle Fatigue (VHCF) tests at a loading frequency of 20 kHz were carried out on Gaussian specimens with very large risk-volumes, above 5000 mm3. The geometry of the specimens made of a H13 steel subjected to an ElectroSlag Remelting (ESR) process was analytically defined, verified through Finite Element Analyses (FEA) and validated through a strain-gage calibration. Fully reversed tension–compression tests were carried out up to 109 cycles on Gaussian specimens and also on small hourglass specimens characterized by a risk-volume of 55 mm3, to highlight and discuss size-effects in VHCF. The main results can be summarized as follows:
(1)
Ultrasonic VHCF tests on Gaussian specimens with very large risk-volumes above 5000 mm3 are feasible. The strain-gage calibration validated the stress distribution assessed through FEA and confirmed that no spurious bending loads are present, even by significantly enlarging the risk-volume.
(2)
Fatigue failures were uniformly distributed within the risk-volume in Gaussians specimens, whereas they were more concentrated close to the surface for small hourglass specimens, mainly due to the different stress gradients and stress distributions within the risk-volumes of the two specimen types.
(3)
The median P–S–N curve for a risk-volume of 5000 mm3 was predicted by considering the experimental results on hourglass specimens with a statistical model proposed by the authors. The predicted median curve was found to be above the experimental P–S–N curve. The main reason was that the distribution of defects size, assumed to follow a Largest Extreme Value Distribution (LEVD), was not capable of accurately predicting the largest defect for the risk-volume of Gaussian specimens. The prediction error was mainly due to the fact that the estimated LEVD did not take into account the stress gradient within the specimen risk-volume. A statistical distribution of defect size capable of considering the stress gradient would permit us to more properly predict the defect size within the component volume and, accordingly, the VHCF response.
(4)
Experimental results pointed out that larger tested risk-volumes lead to a more reliable design against VHCF failures. Very large tested risk-volumes allow for a more proper assessment of the critical defect size and of the P–S–N curves for components in service conditions.

Author Contributions

A.T. designed the specimens, performed the calibration and the experimental tests, analyzed the data and wrote the paper. D.S.P. supervised the research, suggested the adopted models and reviewed the full manuscript. M.R. reviewed the full manuscript. All authors have read and agreed to the published version of the manuscript.

Funding

This research received no external funding.

Conflicts of Interest

The authors declare no conflict of interest.

References

  1. Findley, W.N. An explanation of size effect in fatigue of metals. J. Mech. Eng. Sci. 1972, 14, 424–425. [Google Scholar] [CrossRef]
  2. Nishida, S. Failure Analysis in Engineering Applications, 1st ed.; Butterworth-Heinemann: Oxford, UK, 1992. [Google Scholar]
  3. Murakami, Y. Metal Fatigue: Effects of Small Defects and Nonmetallic Inclusions Elsevier, 1st ed.; Elsevier: Oxford, UK, 2002. [Google Scholar]
  4. Furuya, Y. Notable size effects on very high cycle fatigue properties of high strength steel. Mater. Sci. Eng. 2011, 528, 5234–5240. [Google Scholar] [CrossRef]
  5. Tridello, A.; Paolino, D.S.; Chiandussi, G.; Rossetto, M. Comparison between dog-bone and Gaussian specimens for size effect evaluation in gigacycle fatigue. Frat. Integrità Strutt. 2013, 26, 49–56. [Google Scholar] [CrossRef] [Green Version]
  6. Paolino, D.S.; Tridello, A.; Chiandussi, G.; Rossetto, M. On specimen design for size effect evaluation in ultrasonic gigacycle fatigue testing. Fatigue Fract. Eng. Mater. Struct. 2014, 37, 570–579. [Google Scholar] [CrossRef] [Green Version]
  7. Tridello, A. VHCF response of two AISI H13 steels: Effect of manufacturing process and size-effect. Metals 2019, 9, 133. [Google Scholar] [CrossRef] [Green Version]
  8. Xue, H.; Sun, Z.; Zhang, X.; Gao, T.; Li, Z. Very High Cycle Fatigue of a Cast Aluminum Alloy: Size Effect and Crack Initiation. J. Mater. Eng. Perform. 2018, 27, 5406–5416. [Google Scholar] [CrossRef]
  9. Tridello, A. VHCF response of Gaussian specimens made of high-strength steels: Comparison between unrefined and refined AISI H13. Fatigue Fract. Eng. Mater. Struct. 2017, 40, 1676–1689. [Google Scholar] [CrossRef]
  10. Bathias, C.; Paris, P.C. Gigacycle Fatigue in Mechanical Practice, 1st ed.; CRC Dekker: New York, NY, USA, 2004. [Google Scholar]
  11. Lei, Z.; Hong, Y.; Xie, J.; Sun, C.; Zhao, A. Effects of inclusion size and location on very-high-cycle fatigue behavior for high strength steels. Mater. Sci. Eng. 2012, 558, 234–241. [Google Scholar] [CrossRef] [Green Version]
  12. Stanzl-Tschegg, S. Very high cycle fatigue measuring techniques. Int. J. Fatigue 2014, 60, 2–17. [Google Scholar] [CrossRef]
  13. Tridello, A.; Biffi, C.A.; Fiocchi, J.; Bassani, P.; Chiandussi, G.; Rossetto, M.; Tuissi, A.; Paolino, D.S. VHCF response of as-built SLM AlSi10Mg specimens with large loaded volume. Fatigue Fract. Eng. Mater. Struct. 2018, 41, 1918–1928. [Google Scholar] [CrossRef]
  14. Masuo, H.; Tanaka, Y.; Morokoshi, S.; Yagura, H.; Uchida, T.; Yamamoto, Y.; Murakami, Y. Influence of defects, surface roughness and HIP on the fatigue strength of Ti-6Al-4V manufactured by additive manufacturing. Int. J. Fatigue 2018, 117, 163–179. [Google Scholar] [CrossRef]
  15. Paolino, D.S.; Tridello, A.; Chiandussi, G.; Rossetto, M. S-N curves in the very-high-cycle fatigue regime: Statistical modeling based on the hydrogen embrittlement consideration. Fatigue Fract. Eng. Mater. Struct. 2016, 39, 1319–1336. [Google Scholar] [CrossRef]
  16. Paolino, D.S.; Chiandussi, G.; Rossetto, M. A unified statistical model for S-N fatigue curves: Probabilistic definition. Fatigue Fract. Eng. Mater. Struct. 2013, 36, 187–201. [Google Scholar] [CrossRef] [Green Version]
  17. Beretta, S.; Ghidini, A.; Lombardo, F. Fracture mechanics and scale effects in the fatigue of railway axles. Eng. Fract. Mech. 2005, 72, 195–208. [Google Scholar] [CrossRef]
  18. Sakai, T.; Sato, Y.; Oguma, N. Characteristic S–N properties of high-carbon–chromium–bearing steel under axial loading in long-life fatigue. Fatigue Fract. Eng. Mater. Struct. 2002, 25, 765–773. [Google Scholar] [CrossRef]
  19. Qian, G.; Hong, Y.; Zhou, C. Investigation of high cycle and Very-High-Cycle Fatigue behaviors for a structural steel with smooth and notched specimens. Eng. Fail. Anal. 2010, 17, 1517–1525. [Google Scholar] [CrossRef] [Green Version]
  20. Spriestersbach, D.; Grad, P.; Kerscher, E. Influence of different non-metallic inclusion types on the crack initiation in high-strength steels in the VHCF regime. Int. J. Fatigue 2014, 64, 114–120. [Google Scholar] [CrossRef]
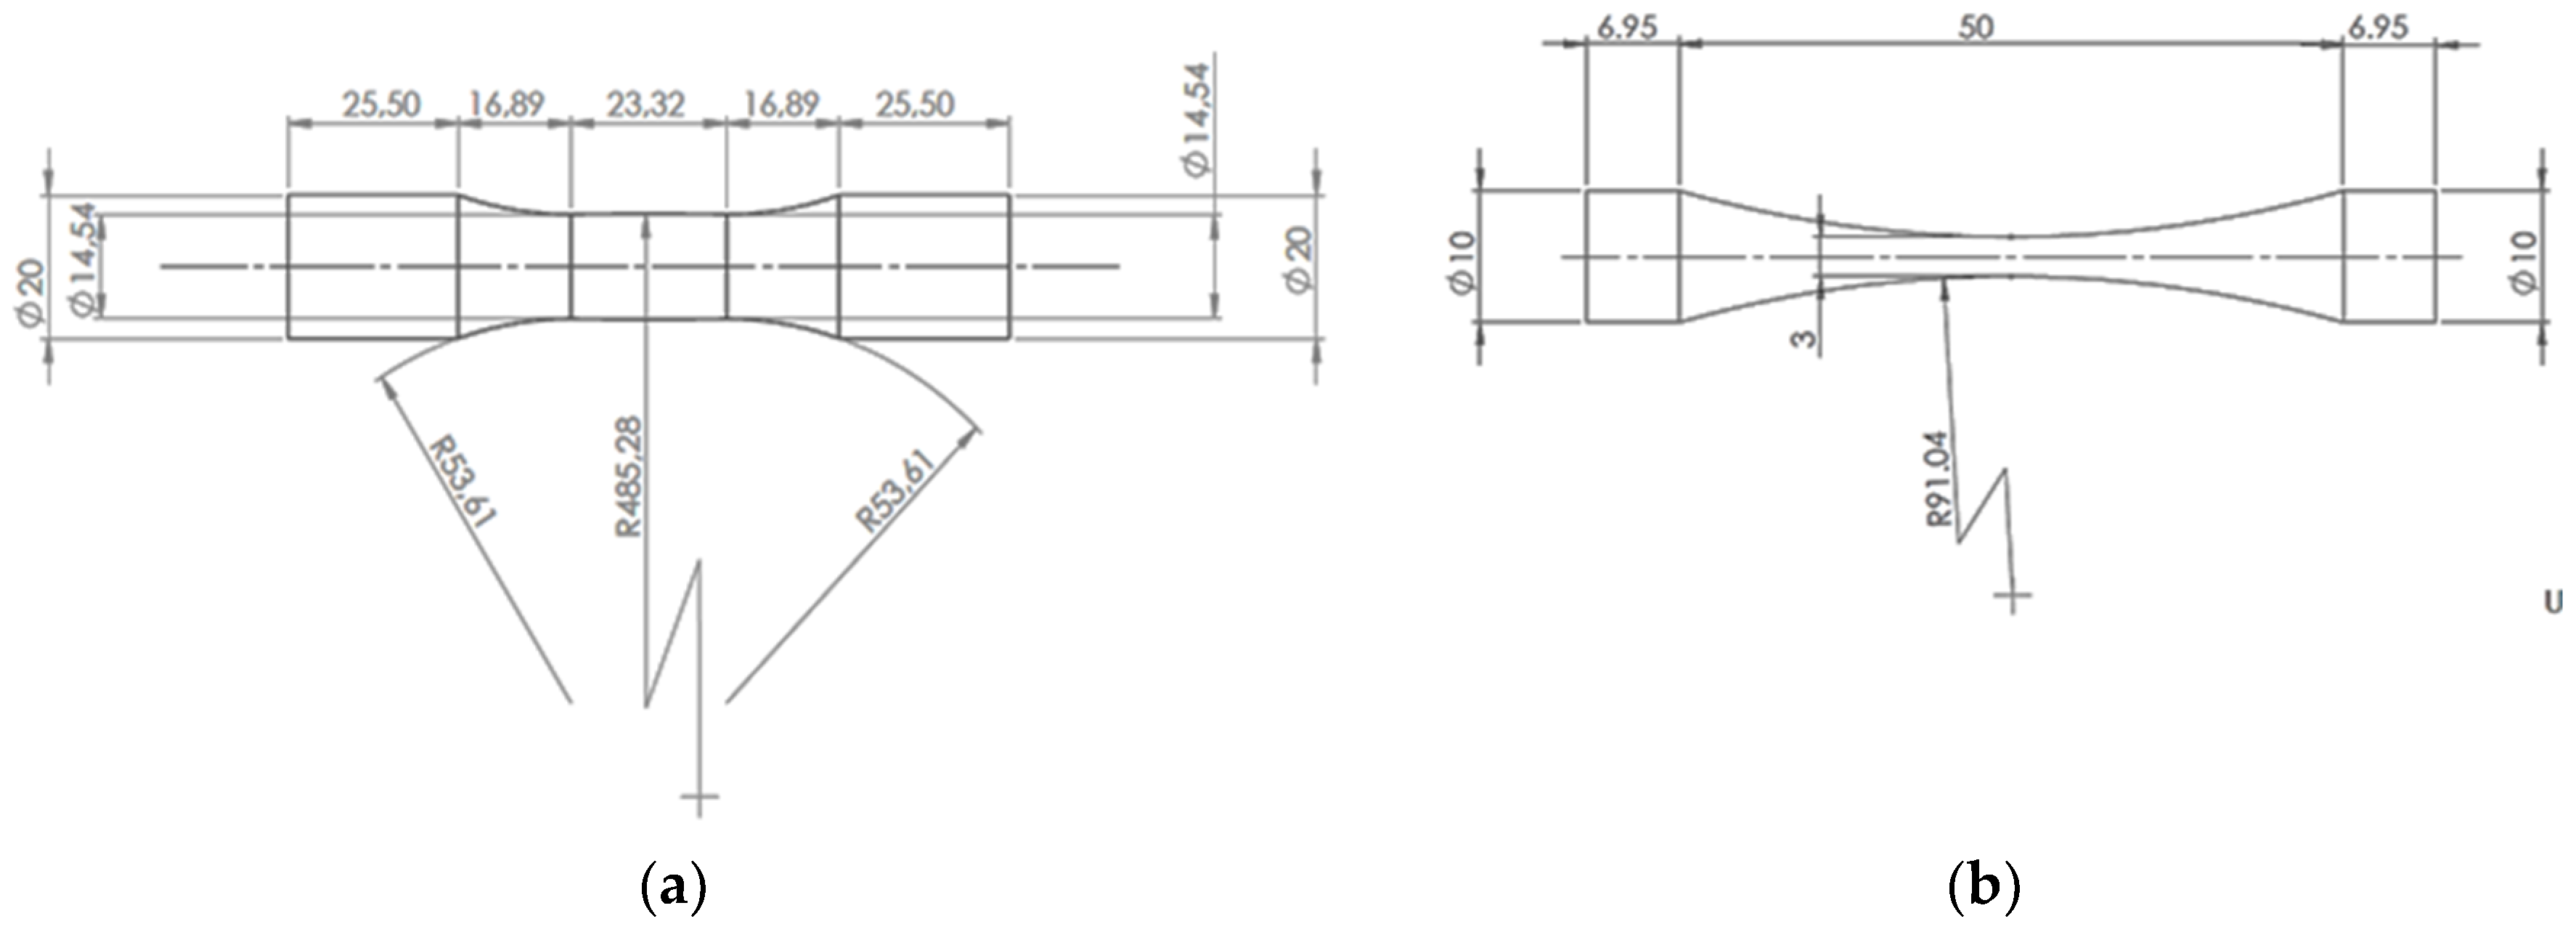
Figure 1. Geometry of the specimens subjected to ultrasonic tests: (a) Gaussian specimen; (b) hourglass specimen (not in scale, dimensions in mm).
Applsci 10 02210 g001
Figure 2. Location of the strain gages used for the calibration of the applied stress amplitude: (a) stress distribution validation; (b) bending validation.
Applsci 10 02210 g002
Figure 3. Validation of the stress amplitude in Gaussian specimens with very large risk-volume: (a) normalized stress amplitude acquired by Gages A and B and computed through FEA; (b) stress amplitude acquired by Gages A and C.
Applsci 10 02210 g003
Figure 4. S–N plot of the experimental dataset.
Applsci 10 02210 g004
Figure 5. Critical defect distribution: (a) hourglass specimens; (b) Gaussian specimens.
Applsci 10 02210 g005
Figure 6. Fracture surfaces and analysis of defects: (a) fish-eye fracture in Gaussian specimen (optical microscope); (b) example of a spherical inclusion originating failure (SEM image); (c) typical EDX spectrum taken at the center of an inclusion originating the fatigue failure.
Applsci 10 02210 g006
Figure 7. Marginal P–S–N curves (median, 0.05-th and 0.95-th quantiles): (a) hourglass with V90 = 55 mm3; (b) Gaussian with V90 = 5163 mm3.
Applsci 10 02210 g007
Figure 8. Median P–S–N curves estimated from the experimental data and predicted from test results on hourglass specimens.
Applsci 10 02210 g008
Figure 9. Gumbel plot of the defect size for hourglass specimens (blue points are experimental values; the solid blue curve is the estimated LEVD) and Gaussian specimens (green points are experimental values; the dashed blue curve is the estimated LEVD from hourglass data).
Applsci 10 02210 g009
Table 1. Chemical composition of the investigated AISI H13 steel.
ElementCSiMnCrMoV
wt.%0.391.000.400.405.300.90
Table 2. Size of the critical defect,   a d , 0 , in hourglass specimens and in Gaussian specimens.
Specimen Hourglass   ( μ m ) Gaussian   ( μ m )
a d , 0 m i n 11 40
a d , 0 m a x 36 68
a d , 0 m e d i a n 19 52