Abstract
Partial Discharge (PD) measurements of large generators are extremely affected and hampered by noise, making the denoising of PD signal an inevitable issue. Wavelet shrinkage is the most commonly employed method for PD signal denoising. The appropriate mother wavelet and decomposition level are critically important for the denoising performance. In consideration of the PD signal characteristics of large generators, a novel wavelet shrinkage scheme for PD signal denoising is presented. In the scheme, a scale dependent wavelet selection method is proposed; the core idea is that the optimum wavelet at each scale is selected as the one maximizing the energy ratio of coefficients beside and inside the range formed by the threshold, which correspond to the signal to be reserved and noise to be removed, respectively. In addition, taking into account the influence of mother wavelet at each scale on the decomposition level, an approach for decomposition level determination is put forward based on the energy composition after decomposition at each scale. The application results on the simulated signals with different SNR obtained by combining the various pulses and measured signal on-site show the effectiveness of the proposed scheme. Besides, the denoising results are compared with that of the existing wavelet selection methods and the proposed wavelet selection method shows an obvious advantage.
1. Introduction
Partial discharge (PD) measurements have been made on electrical equipment insulation for many years and proved to be a sensitive means of insulation condition assessment and fault diagnosis [1,2,3,4,5,6,7]. However, electrical equipment operates in a strong electromagnetic environment, and PD on-line measurements are extremely affected and hampered by electrical noise [2]. In addition, it is very common that multiple PD sources present simultaneously in insulation systems, especially for large generators. PD signals suffer from different degrees of attenuation when propagating from the discharge site to detector location through various paths, resulting in a low signal to noise ratio (SNR) of the measured signal. PD signals may be overwhelmed by severe noise and are difficult to be effectively extracted from the noisy signal, affecting the accurate assessment of insulation conditions. The waveforms of PD pulses are important for PD pulses clustering and PD source identification. Therefore, it is important to eliminate noise as much as possible to increase the SNR, to minimize signal distortions and preserve the PD waveforms.
Wavelet transform is an efficient mathematics tool and is utilized for PD signal denoising due to the unique ability to identify singularity signal in both time and frequency domains. Mother wavelet selection, decomposition level determination, and threshold estimation together with threshold function are the major problems that influence the denoising effect [8]. Great efforts have been made on optimum mother wavelet selection methods. In the early stage of PD denoising, the selection of the optimum mother wavelet is typically handled based on the experience of the researchers or by trial and error; the selection methods are different in literature and can only perform well in their own environments [9,10,11]. A specific criterion is urgently needed for the optimum mother wavelet selection. To this end, numerous techniques have been proposed for the PD denoising. The correlation based wavelet selection methods (CBWS) are made with the purpose of maximizing the correlation between the original PD signal and the wavelet function chosen from a library of wavelets [12,13]. Nevertheless, the real PD signal shape is unknown in most cases and CBWS methods are time-consuming. An alternative is to select the optimum mother wavelet based on the correlation between the coefficients and the measured signals [14,15]. To simplify the calculation of correlation, the dynamic time warping (DTW) method was introduced [16]. An attempt to improve the CBWS method by replacing DWT with stationary wavelet transform is proposed in [17] at the expense of a sharp increase in time consumption. However, waveforms of measured pulses depend on the types and locations of PD sources, propagation paths of PD pulses, and the response characteristics of detectors. It is difficult for CBWS to obtain a typical pulse waveform to represent all PD pulses. Besides, when noised PD signal is adopted to calculate the correlation, improper selection of mother wavelet by these schemes may be incurred, especially for signals with low SNR. In [8], energy based wavelet selection (EBWS) is proposed and the optimum mother wavelet is selected as the one generating an approximation with the largest energy at each scale, while it may suffer more component loss and lead to less-than-desirable results when the energy mainly locates in the detail coefficients. With the purpose to maximize the energy concentrating on the sub-band that the signal frequency distributes, the energy and entropy ratio based wavelet selection [18], a new energy based wavelet selection (NewEBWS) [17], and signal-to-noise ratios based wavelet selection (SNRBWS) [19] are proposed in succession. SNRBWS is focused on the maximum coefficient of the noised signal at each scale, but may get worse results when there are massive small pulses in the noised signal.
The decomposition level is important to the denoising results. A too large decomposition level will increase calculation complexity without significant improvement in the denoising effect; a too small decomposition level cannot achieve desirable denoising results. In previous studies, it was determined based on prior knowledge about signal energy distribution in the wavelet domain [6] or through trial and error [9,10,11], which is expert-dependent and subjective. Automatic approaches are introduced in references [17,19] aimed at guaranteeing that most energy of the signal is decomposed into detail sub-bands. There is no widely accepted method for decomposition level determination of the above-mentioned approaches.
Threshold estimation, together with threshold function, is widely studied and plenty of achievements are acquired. The threshold estimation methods include sqtwolog threshold, rigrsure threshold, heursure threshold, and minimaxi threshold [20,21,22], of which the modified scale dependent threshold based on SURE estimator [12,14,18] is widely used in PD signal denoising and adopted in this paper. The threshold rules involve soft threshold, hard threshold, and other threshold functions. As above, plenty of studies have been developed about the three major problems of wavelet threshold denoising. However, in most studies, the three problems are considered in isolation, while in fact, they are closely related with each other.
To improve PD signal denoising performance, this study presented a novel wavelet shrinkage scheme. First, a new optimum wavelet method is introduced. At each scale, the optimum wavelet is selected as the one maximizing the energy ratio of coefficients beside and inside the range formed by the threshold, which represent the signal to be reserved and noise to be removed, respectively. The method is aimed at increasing the coefficients’ energy corresponding to signal and decreasing the coefficients energy corresponding to noise, which means that the wavelet is most appropriate for extracting the PD pulses immersed in noise. Besides, a novel idea for decomposition level determination is proposed accordingly, i.e., after each decomposition, the energy composition of the approximation coefficients is analyzed to judge whether to perform the next scale decomposition or not. The innovations of the proposed scheme are as follows: (1) the optimum mother wavelet is selected with the purpose to improve the SNR of coefficients combined with the threshold at each scale, (2) the decomposition level is determined considering the influence of the optimum mother wavelets at all scales instead of the frequency analysis before the wavelet decomposition, (3) the proposed scheme is applied to the simulated PD signals and measured PD signals of large generators, obtaining outstanding results.
2. Wavelet Denoising Technique
Wavelet analysis is an effective and widespread time-frequency signal processing tool. The continuous wavelet transform (CWT) of signal s is given by (1), where the signal is transformed into shifted and scaled versions with respect to a mother wavelet ψ(i), a and b are the scaling and translation parameters, respectively.
Given a sequence of noised signal s = {s(i)}, i∈{1, 2, …, N}, discrete wavelet transform (DWT) is expressed by (2), where j and k are the discrete versions of a and b, respectively.
Mallat produced a fast decomposition and reconstruction algorithm for DWT, which is known as a two-channel sub-band coder using quadrature mirror filters [23]. Starting from the signal s, two sets of coefficients are computed: approximation coefficients cA1 and detail coefficients cD1. The sets are obtained by convolving s with the low pass filter h for approximation and with the high pass filter g for detail, followed by dyadic decimation. The approximation coefficients cA1 are then split into two parts using the same scheme by replacing s with cA1 and producing cA2, and so on. The wavelet tree containing the terminal nodes for j level DWT decomposition is portrayed in Figure 1 [24].
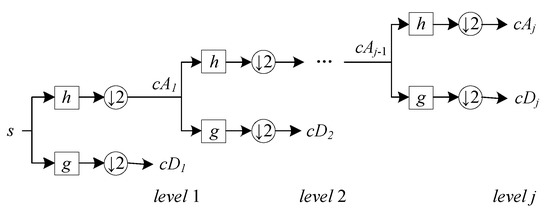
Figure 1.
j level DWT decomposition.
PD pulses and white noise show different behaviors in the frequency sub-band. The white noise energy is uniformly distributed in the wavelet coefficients among each scale, while the PD pulse energy concentrates on a limited number of coefficients with amplitudes above those of the corresponding noise coefficients [19]. The wavelet denoising is based on the assumption that coefficients with large amplitudes are mainly generated by signal and coefficients with small amplitudes are mainly generated by noise. Wavelet threshold shrinkage denoising involves three steps: decomposition, thresholding, and reconstruction.
(1) Decomposition
Select a wavelet, determine decomposition level J, and perform the J level DWT decomposition as Figure 1.
(2) Thresholding
Estimate the threshold for each level and apply it to the detail coefficients.
(3) Reconstruction
Reconstruct the signal using the approximation coefficients and the thresholded detail coefficients of all scales.
3. Proposed Optimum Mother Wavelet Selection Method
3.1. Selection of the Optimum Wavelet
For signal contaminated by white noise, the denoising is based on the different behaviors of pulses and noise in frequency sub-band. According to the theory of wavelet denoising, when hard threshold function is adopted, the detail coefficients with absolute values smaller than threshold are considered to correspond to the noise, while the detail coefficients with absolute values larger than threshold are assumed to associate with PD pulses. The threshold is estimated based on the detail coefficients at each scale, and the coefficients are related with the mother wavelet. Thus, the SNR is reflected by both the coefficients and threshold at each scale. To improve the SNR after denoising, the wavelet transform should maximize the coefficients exceeding threshold as much as possible. From this point of view, a novel opinion for optimum wavelet selection is proposed, i.e., the optimum wavelet suitable for analyzing a given signal is the one that maximizes the energy ratio of coefficients beside and inside the range separated by the threshold at each scale.
At the jth stage, the scale dependent threshold λj is obtained based on the SURE thresholding estimator, which is expressed as:
where is the median value of the detail coefficients, and is the number of detail coefficients at level j.
To describe the energy composition in detail coefficients at scale j, the energy of signal and the energy of noise in the detail coefficients are defined as Equations (4) and (5), respectively.
where is the kth detail coefficient of jth level, and represents the number set of the detail coefficients with absolute value larger than threshold , represents the number set of the detail coefficients with absolute value smaller than threshold . and are described by Equations (6) and (7), respectively.
According to the characteristics of white noise, it has equal intensity at different frequencies, manifesting as a constant power spectral density. The threshold obtained based on the detail coefficients is also suitable for the noise estimation of approximation coefficients at the same scale. To describe the energy composition in approximation coefficients at each scale, the energy of signal and the energy of noise in the approximation coefficients are defined as Equations (8) and (9), respectively.
where and are described as Equations (10) and (11), respectively.
at jth scale, the energy of signal and noise are expressed as follows:
The SNR of the jth scale is calculated by (14) at this frequency sub-band:
Based on the perspective to improve the SNR, the proposed method identifies, at jth decomposition scale, the optimum mother wavelet is selected as the one maximizing the value.
It is worth mentioning that the proposed method for optimum wavelet selection is more time-consuming than the other energy based wavelet selection methods; the extra time is mainly spent on the threshold estimation for each candidate mother wavelet.
3.2. Determination of Decomposition Level
In theory, after the jth scale decomposition, as long as the length of approximation coefficients is smaller than the length of wavelet filter, next scale decomposition can be performed. However, a too large decomposition level will increase the calculation complexity without significant improvement in the denoising effect. Thus, it is important to find a balance between the denoising effect and the decomposition level. The proper decomposition level J is essential for good denoising results.
In traditional methods, the decomposition level is determined through trial and error or according to the signal frequency spectrum distribution before wavelet transform is performed on the noised signal. However, in scale dependent wavelet selection for denoising, the denoising effect changes with the selected wavelet at each scale; it is difficult to determine the decomposition level ahead of the wavelet transform. If the decomposition level is J, the noise components in the detail coefficients at all scales will be eliminated, while the noise components in the approximation coefficients at the Jth scale will be reserved. When the noise components are a tiny proportion of the approximation coefficients, the influence of the remaining noise on the denoising effect can be ignored. Given the approximation coefficients are of high SNR, then a further decomposition cannot visibly improve the denoising effect. Accordingly, this paper proposes a novel idea for decomposition level determination. After each decomposition, the energy composition of the approximation coefficients is analyzed to judge whether to perform the next scale decomposition; when it meets one of the following conditions, the decomposition stops.
- (1)
- The energy of approximation coefficients is smaller than 5% of wavelet domain total energy. The percentage of approximation coefficients energy is computed as (15), where is the energy of the approximation coefficients of jth scale, is the total energy of detail coefficients from the first scale to the jth scale. The value of gets smaller with the wavelet decomposition proceeding; this means that more levels of decomposition cannot improve the denoising effect significantly when is very small.
- (2)
- The SNR of approximation coefficients is larger than 20 dB. When the SNR of approximation coefficients is larger than 20 dB according to Equation (16), the energy of noise in the approximation coefficients is much smaller than the signal energy; a further decomposition can make very little contribution to the denoising effect at the cost of computation time.
3.3. Scheme of the Proposed Method
The wavelet shrinkage scheme is composed of a novel optimum mother wavelet selection method and a decomposition level determination method, which is detailed as follows:
- (1)
- Prepare a series of candidate wavelets to be selected, where i∈{1, 2, …, nw}, and nw is the number of candidate wavelets. In this paper, the wavelets db2–db20, coif1–coif5 and sym2–sym8 are adopted.
- (2)
- Initialize the current decomposition scale j = 1. The signal to be analyzed at the first scale is original noised signal s.
- (3)
- Perform the jth scale wavelet decomposition on the signal s with candidate wavelets for i = 1, 2, …, nw.
- (4)
- Calculate the scale dependent threshold with (3) for i = 1, 2, …, nw.
- (5)
- Calculate the SNR value of approximation and detail coefficients and record as SNR(j, i) according to Equations (4)–(14).
- (6)
- Find the maximum value of SNR(j, i), i = 1, 2, …, nw, and the corresponding wavelet is selected as the optimum mother wavelet of jth scale.
- (7)
- Calculate the and according to Equations (15) and (16) with respect to the optimum mother wavelet.
- (8)
- If < 5% or > 20 dB, no further decomposition will be performed, otherwise, decomposition of next scale will be performed by taking the approximation coefficients obtained by the optimum mother wavelet of jth scale as the signal s, and repeat steps (3)–(7) with j = j + 1.The flowchart is shown in Figure 2.
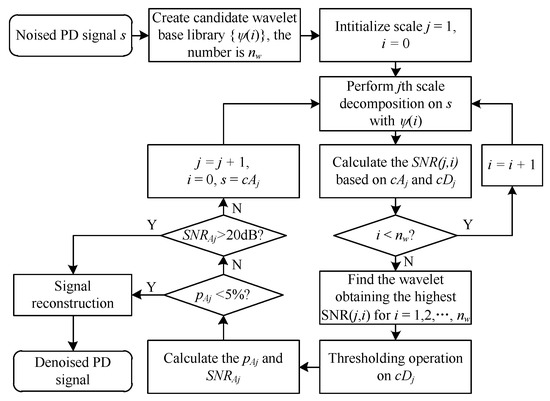 Figure 2. Flowchart of the proposed wavelet shrinkage scheme for PD signal denoising.
4. PD Measurement System
The major online PD measurement systems of generators include neutral detection methods and high voltage terminal detection methods [5]. From the perspective to improve the SNR of measured signal, high voltage terminal detection methods outperform neutral detection methods. However, the sensors installed on the high voltage terminals introduce an extra security risk and threaten the reliability of the generators, since the breakdown of the sensors may lead to single phase to ground short circuit fault. In the last decade, Huazhong University of Science and Technology has been devoted to the research of generator PD on-line measurement and fault diagnosis. The PD measurement system consists of a sensor unit, a conditioning unit, a synchronization unit, an acquisition and analysis unit, as shown in Figure 3. Taking the operation safety into account, the sensor unit is mounted at the neutral point of the generator. When propagating from discharge site to detector location, the PD pulses suffer a severe loss of frequency components, especially the high frequency components. To guarantee the fault coverage of high windings, a capacitor with a bandwidth of 100 kHz–20 MHz is adopted as the PD sensor. The homemade signal conditioning unit is used to amplify the signal, of which the output voltage is between −5 V and +5 V. The synchronization unit is used to get the phase of the signal; it is composed of an isolating transformer and conditioning device. The isolating transformer is installed in the PT cabinet, and takes the voltage of a phase from PT secondary windings and transforms the voltage from 100 V to about 10 V. The conditioning device is installed in the PD monitoring cabinet and used to condition the sinusoidal signal to square signal, the rising edge is synchronized to the phase 0°. The acquisition unit is mainly composed of a high-speed analog/digital converter, which is installed in the industrial control computer in the PD monitoring cabinet. When the acquisition unit is idle and the rising edge of square signal is detected, the signal acquisition is triggered and starts to sample PD signal with a resolution of 12 bits, and every acquisition lasts for 100 ms. The analysis unit consists of the aforementioned computer and analysis software. The proposed wavelet shrinkage scheme in this paper is applied to the analysis unit and the sampled signal is analyzed. The above described PD measurement system has been applied to more than 40 large generators and plays an important role in the condition monitoring and fault diagnosis of stator windings.
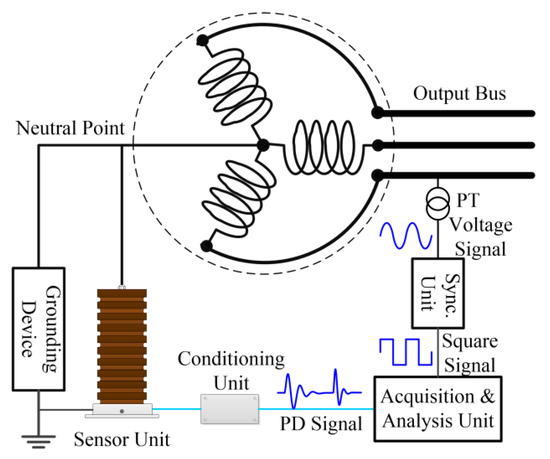
Figure 3.
Schematic diagram of PD on-line measurement system.
5. Application Results and Analysis
5.1. Simulation PD Models and Denoising Performance Evaluation
5.1.1. Simulated PD Pulses
Simulated PD signals are indispensable in verifying the denoising performance of the proposed method and offer comparisons with previous methods. Generally, damped exponential pulse (DEP) and damped oscillatory pulse (DOP) are adopted as the simulated PD models [11,16], expressed as Equations (17) and (18), respectively:
In the PD models, A is the pulse peak value, time constants and determine the typical PD parameters such as pulse risetime, pulse width and pulse decay time. is the oscillatory frequency of the DOP type pulse. The corresponding pulse waveforms are shown in Figure 4.
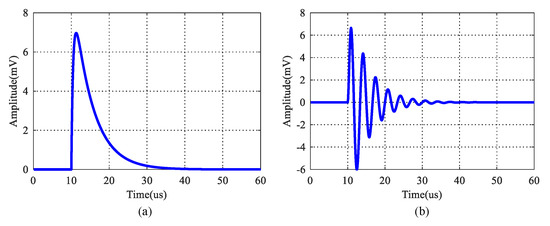
Figure 4.
Waveforms of simulation PD models (a) DEP, (b) DOP.
When an electrical method is used to detect PD activities, the waveforms of the measured PD pulse depend on the PD source, the frequency response of the PD sensors, and stator winding propagation characteristics between them [25]. Multi-source PDs are commonly present in insulation systems simultaneously during operation due to imperfect insulation. PD pulses of different types present different features in waveforms based on PD mechanisms. The PD pulses in the measured signal are diverse in time and frequency waveforms. In order to well simulate the measured signal, the simulated signals are obtained by combining various pulses with controlling parameters of (17) and (18).
5.1.2. Denoising Performance Evaluation
In order to quantitatively evaluate denoising performance, three statistical evaluation indexes are used, where x(i) is the noised signal, y(i) is the denoised signal, N is their length.
- (1)
- Mean Square Error (MSE) [8,15,25]
- (2)
- Normalised Correlation Coefficient (NCC) [15,19]
- (3)
- Maximum Amplitude Error (MAE) [17]
5.2. Existing Wavelet Selection Methods
To evaluate the denoising performance of the proposed method, it was compared with previous methods. EBWS and SNRBWS, the NewEBWS methods, are selected due to the similar scheme of the scale-dependent mother wavelet with the proposed method.
(1) Energy based wavelet selection (EBWS) [8]
According to the energy based wavelet selection method, a wavelet is selected as an optimum mother wavelet if it generates an approximation with the largest energy among all candidate wavelets for selection at each scale. For a one-dimensional wavelet decomposition, is defined as the energy percentage of approximation coefficients at the scale j as (22), where i=1,2,…, j.
(2) SNR based wavelet selection (SNRBWS) [19]
The separation of PD pulses and noise will be efficient as the wavelet well represents PD pulses with the least high amplitude coefficients. In this sense, the filters should concentrate the wavelet coefficients energy, rather than spread it. The SNRBWS method is based on the assumption that the highest energy concentration corresponds to the sub-band with the highest absolute coefficient value. At each scale, the optimum wavelet is selected as the one maximizing the difference between the peak amplitudes of the detail coefficients and approximation coefficients.
(3) New energy based wavelet selection (NewEBWS) [17]
NewEBWS follows a similar idea with SNRBWS, identifying the sub-band that concentrates most of the PD pulses representation at each decomposition scale. However, the sub-band corresponding to the PD pulses will no longer be identified as the one that has the coefficient with the maximum absolute value, but as the one with the largest coefficient energy.
5.3. Simulated Signal
In order to simulate well the signal in the field, the simulated signals are composed of pulses with different waveforms by controlling the pulse parameters, as shown in Table 1. Signal s1 is formed by pulses P1-P5 and s2 is formed by pulses P6-P10. White noises are added to s1 and s2 so that the SNRs are equal to −5 dB; the original signal and the noised signal are presented in Figure 5.

Table 1.
Parameters of the pulses.
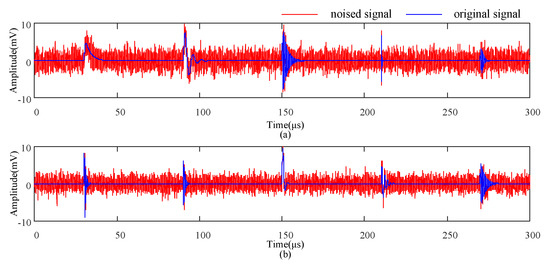
Figure 5.
Original and noised signal (a)s1 (b)s2.
The noised signals are denoised by EBWS, SNRBWS, NewEBWS and the proposed method. According to the method described in the previous section, the decomposition levels of s1 and s2 are determined as 9 and 7 respectively. The denoising results of s1 and s2 can be compared in Figure 6 and Figure 7. To display the pulse details clearly, the sections of pulses are cut out from the whole signal and the time axis densities of different pulses are different. As can be seen from the denoising results, the proposed method possesses smaller waveform distortion and higher waveform fidelity, which is particularly obvious for pulses P3, P4, P5, P7 and P10. The overall denoising performance of the proposed method is better than the other three methods. Besides, SNRBWS is more focused on the pulses with large amplitude, it performs poorer in the denoising of pulses with small amplitude.
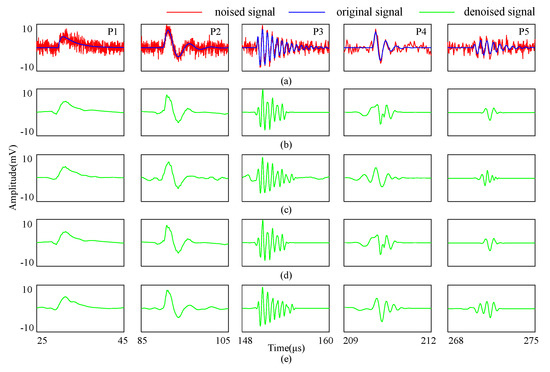
Figure 6.
Denoising result of pulses in s1 (a) noised and original signal (b) EBWS (c) SNRBWS (d) NewEBWS (e) the proposed method.
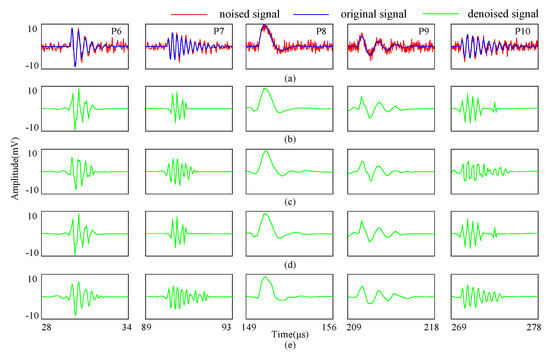
Figure 7.
Denoising result of pulses in s2(a) noised and original signal (b) EBWS (c) SNRBWS (d) NewEBWS (e) the proposed method.
To eliminate the stochastic behaviors and obtain statistical comparison results of different denoising methods, 1000 sets of different white noises are adopted; and the mean value of denoising evaluation indexes are shown in Table 2. It can be seen from the values of evaluation indexes that the proposed method performs best in denoising both s1 and s2.

Table 2.
Mean value of denoising evaluation indexes.
According to the principles of the proposed method, it is more time-consuming than other energy based wavelet selection methods because of the threshold estimation for each candidate mother wavelet at each scale. For the four methods, the time consumption of optimum mother wavelet selection and total computation time of denoising are calculated, respectively, and the comparisons are shown in Figure 8 in the form of a stick chart. The time comparison results in Figure 8a indicate that the proposed mother wavelet selection method is more time-consuming. However, as can be seen from Figure 8b, the total computation time of denoising depends little on the time consumption of optimum mother wavelet selection; the proposed scheme is comparable with existing methods with regard to time consumption.
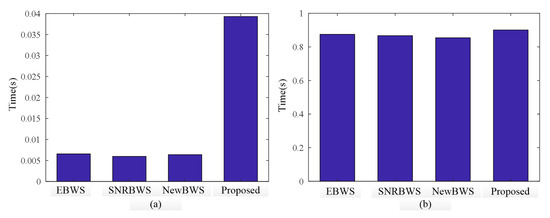
Figure 8.
Time consumption comparison results (a) time consumption of optimum mother wavelet selection (b) total denoising computation time.
The times at each method obtain the best result for each denoising evaluation index are counted; the percentages are shown in Figure 9 in the form of pie charts. It is apparent that the proposed method possesses an obvious advantage over the other three methods. On the other hand, it indicates that no method can perform the best in all cases; SNRBWS also achieves the best in many cases and is only inferior to the proposed method.
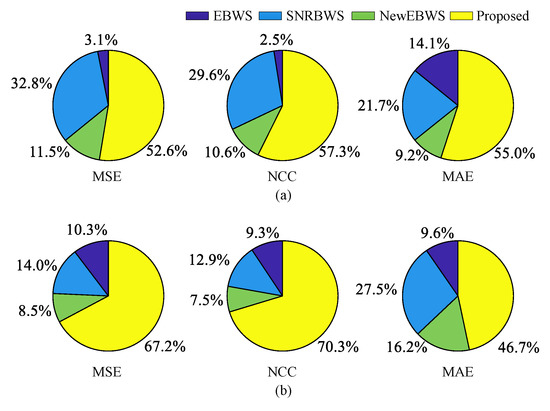
Figure 9.
The time percentages at which each method obtains the best result (a) s1 (b) s2.
To investigate the denoising effect for signals with different SNRs, white noise with different energy are added to s1 and s2 to make the SNRs vary from −5 to 5 with a step of 0.5. To eliminate the stochastic behaviors and get the statistical comparison results of different denoising methods, 100 sets of different white noise are adopted for signals under each SNR, and the mean values of denoising evaluation indexes are employed. The relationships of denoising evaluation indexes with SNRs are presented in Figure 10. As can be seen, the denoising evaluation indexes of the proposed method are better than that of the compared methods.
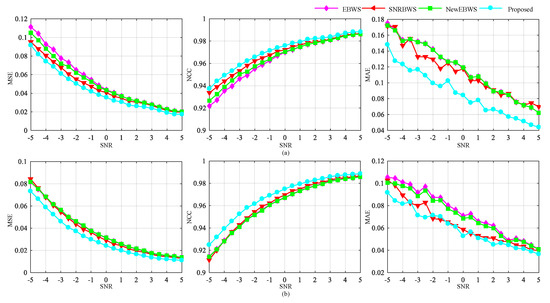
Figure 10.
The relationships between the mean values of denoising evaluation indexes and SNRs (a) s1 (b) s2.
Through comprehensive analysis and evaluation, the proposed method performs well in the denoising of noised PD signals. From Figure 6 and Figure 7, it can be seen that the denoised signals obtained by EBWS and NewEBWS show high similarity. By comparing the principles of the EBWS and NewEBWS, it can be seen that the criteria of wavelet selection are equivalent when the energy of approximation coefficients is larger than that of detail coefficients at all scales. If the energy of approximation coefficients is smaller than that of detail coefficients at a certain scale, EBWS will spread the wavelet coefficients energy, which is likely to result in more energy loss than NewEBWS does when the threshold is applied to the detail coefficients.
SNRBWS, NewEBWS, and the proposed method share a similar purpose—to improve the SNR of coefficients at each scale. SNRBWS can be seen as a fast algorithm of NewEBWS. SNRBWS is focused on the maximum absolute value of coefficients, which corresponds to a particular pulse, while NewEBWS is focused on the general energy of coefficients. However, the wavelet selected by SNRBWS is suitable for the pulse that the coefficient with maximum absolute value belongs to, and may not be suitable for the other pulses. As a consequence, if the energy proportion of the coefficient with maximum absolute value to all coefficients is very small, the denoising performance will be worse than the proposed method and NewEBWS. To verify the inference, simulated signal s3 is composed of pulses P1-P10, as shown in Figure 11.

Figure 11.
Original and noised signal of s3.
Signal s3 contains more pulses than s1 and s2, indicating that the mother wavelet selected by SNRBWS may be unsuitable for more pulses. One thousand sets of different white noises are adopted and the SNRs are all equal to −5; the mean values of denoising evaluation indexes are presented in Table 3. As can be seen, the proposed method achieves the best performance in all three evaluation indexes.

Table 3.
Mean value of denoising evaluation indexes for s3.
The statistical results of each method obtaining the best result for each evaluation index are shown in Figure 12; the times percentage of the proposed method are the best—are more than 60%—which is an absolute advantage over other three methods. By comparing the pie charts in Figure 12 with Figure 9, it can be concluded that the proposed method has a higher stability and adaptability, and is more suitable for the denoising of complicated PD signals. Besides, NewEBWS outperforms SNRBWS in MSE and NCC indexes, and the advantage of SNRBWS over NewEBWS method in MAE index gets smaller when the energy proportion of the coefficient with maximum absolute value in the coefficients gets smaller.
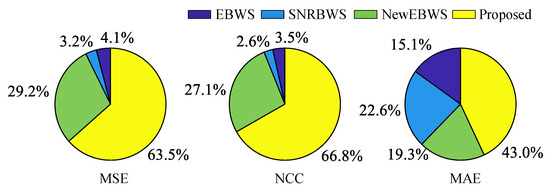
Figure 12.
The times percentages of each method obtaining the best result for s3.
5.4. Measured Signal
The aforementioned PD online measurement system is installed in a hydro-plant. In order to further examine the denoising performance of the proposed scheme, it is applied to the measured PD signal from the on-line measurement system performed on hydro-generators in the hydro-plant, and the denoising results are compared with those of EBWS, SNRBWS and NewEBWS by visual inspection.
(1) Case 1
The first case is the PD signal measured on a hydro-generator with rated parameters of 20 kV, 50 Hz and 460 MW, as shown in Figure 13a. The whole noised signal is denoised by EBWS, SNRBWS, NewEBWS and the proposed method, the denoising results are shown in Figure 13b–e, respectively. As can be seen, only the proposed method extracts nearly all pulses, which is very meaningful for the accurate phase resolved partial discharge (PRPD) patterns and PD pattern recognition, while the other three methods all produce different degrees of pulses omission. Besides, the proposed method causes the minimum amplitude errors by comparing the amplitude of the pulses in original measured signal and denoised signals, while the SNRBWS gets the worst denoising results, specifically in the most missed pulses and the maximum pulse amplitude errors.
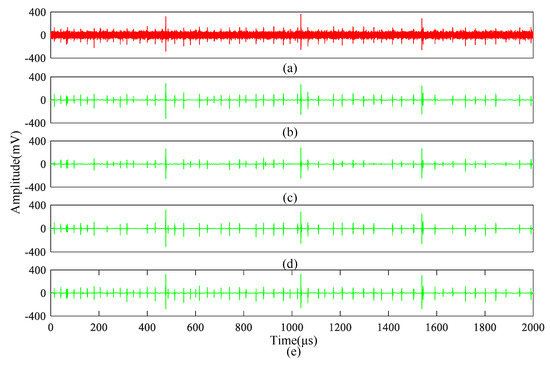
Figure 13.
Denoising results of measured PD signal immersed in noise (a) original measured signal (b) EBWS (c) SNRBWS (d) NewEBWS (e) proposed method.
(2) Case 2
The second case is from another hydro-generator in the same plant with the same parameter.as shown in Figure 14a. The results comparison is shown in Figure 14b–e. From the results it can be found that the EBWS, SNRBWS and NewEBWS produce more pulses loss than the proposed method. Besides, the SNRBWS causes larger amplitude error especially for the pulses with small amplitude, for the SNRBWS is mainly focused on the pulse with maximum amplitude at each scale. In general, the proposed method outperforms other three methods in the denoising of the measured PD signal.
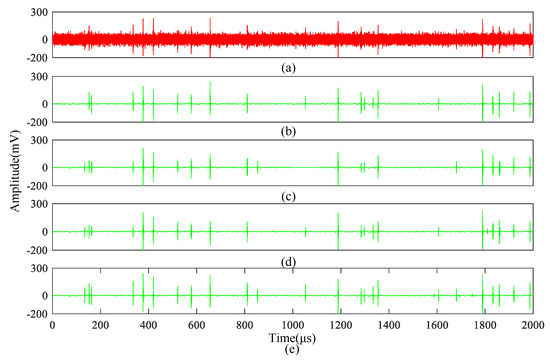
Figure 14.
Denoising results of measured PD signal immersed in noise (a) original measured signal (b) EBWS (c) SNRBWS (d) NewEBWS (e) proposed method.
6. Conclusions
This paper describes a novel wavelet shrinkage scheme for the extraction of PD pulses immersed in noise. Aimed at improving the SNR of denoised PD signal, the optimum wavelet at each scale is selected as the one maximizing the energy ratio of coefficients beside and inside the range formed by the threshold, corresponding to the signal to be reserved and noise to be removed, respectively. Different from most existing studies, the proposed optimum wavelet selection is considered in conjunction with the threshold at each scale. To determine the number of wavelet decomposition levels automatically and get good results for various signals, this paper proposes a novel idea—the energy composition of the approximation coefficients at each scale is analyzed to judge whether to perform the next scale decomposition according to the energy composition of approximation coefficients, rather than before the first scale decomposition. The proposed scheme is applied to simulated PD signals composed of various pulses with different waveforms and measured PD signal on-site and shows obvious advantages over other existing wavelet selection methods. However, the proposed method is more time-consuming; the extra time is mainly spent on the threshold estimation for each candidate mother wavelet.
Author Contributions
Methodology, Y.L.; Software, Y.L.; Validation, Z.L.; Formal Analysis, Z.L.; Investigation, Y.L.; Writing-Original Draft Preparation, Y.L.; Writing-Review & Editing, Z.L.; Supervision, Z.L. All authors have read and agreed to the published version of the manuscript.
Funding
This research received no external funding.
Conflicts of Interest
The authors declare no conflict of interest.
References
- On-Line Partial Discharge Measurements on the Stator Winding Insulation of Rotating Electrical Machines; IEC-TS-60034-27-2; International Electrotechnical Commission: Geneva, Switzerland, 2012.
- IEEE Guide for the Measurement of Partial Discharges in AC Electric Machinery; IEEE Standard 1434; IEEE Standards Association: Piscatawy, NJ, USA, 2014.
- Gu, F.C.; Chen, H.C.; Chao, M.H. Application of Improved Hilbert–Huang Transform to Partial Discharge Defect Model Recognition of Power Cables. Appl. Sci. 2017, 7, 1021. [Google Scholar] [CrossRef]
- Qian, Y.; Chen, X.; Zang, Y.; Wang, H.; Sheng, G.; Jiang, X. Amplitude Distribution of Partial Discharge Signals on Tunnel-Installed High-Voltage Cables. Appl. Sci. 2019, 9, 4595. [Google Scholar] [CrossRef]
- Fu, W.; Wang, K.; Tan, J.; Zhang, K. A composite framework coupling multiple feature selection, compound prediction models and novel hybrid swarm optimizer-based synchronization optimization strategy for multi-step ahead short-term wind speed forecasting. Energ. Convers. Manag. 2020, 205, 112461. [Google Scholar] [CrossRef]
- Luo, Y.; Li, Z.; Wang, H. A review of online partial discharge measurement of large generators. Energies 2017, 10, 1694. [Google Scholar] [CrossRef]
- Fu, W.; Shao, K.; Tan, J.; Wang, K. Fault Diagnosis for Rolling Bearings Based on Composite Multiscale Fine-Sorted Dispersion Entropy and SVM with Hybrid Mutation SCA-HHO Algorithm Optimization. IEEE Access 2020, 8, 13086–13104. [Google Scholar] [CrossRef]
- Li, J.; Jiang, T.; Grzybowski, S. Scale dependent wavelet selection for de-noising of partial discharge detection. IEEE Trans. Dielectr. Electr. Insul. 2010, 17, 1705–1714. [Google Scholar] [CrossRef]
- Shim, I.; Soraghan, J.J.; Siew, W.H. Detection of PD utilizing digital signal processing methods. Part 3: Open-loop noise reduction. IEEE Electr. Insul. Mag. 2001, 17, 6–13. [Google Scholar] [CrossRef]
- Satish, L.; Nazneen, B. Wavelet-based denoising of PD signals buried in excessive noise and interference. IEEE Trans. Dielectr. Electr. Insul. 2003, 10, 354–367. [Google Scholar] [CrossRef]
- Zhang, H.; Blackburn, T.R.; Phung, B.T. A novel wavelet transform technique for on-line partial discharge measurements. 1. WT de-noising algorithm. IEEE Trans. Dielectr. Electr. Insul. 2007, 14, 3–14. [Google Scholar] [CrossRef]
- Ma, X.; Zhou, C.; Kemp, I.J. Automated wavelet selection and thresholding for PD detection. IEEE Electr. Insul. Mag. 2002, 18, 37–45. [Google Scholar] [CrossRef]
- Zhang, H.; Blackburn, T.R.; Phung, B.T. Application of signal processing techniques to on-line partial discharge detection in cables. In Proceedings of the IEEE International Conference on Power System Technology, Singapore, 21–24 November 2004; pp. 1780–1785. [Google Scholar]
- Ma, X.; Zhou, C.; Kemp, I.J. Interpretation of wavelet analysis and its application in partial discharge detection. IEEE Trans. Dielectr. Electr. Insul. 2002, 9, 446–457. [Google Scholar] [CrossRef]
- Chan, J.C.; Ma, H.; Saha, T.K. A novel level-based automatic wavelet selection scheme for partial discharge measurement. In Proceedings of the Australasian Universities Power Engineering Conference, Bali, Indonesia, 26–29 September 2012; pp. 1–6. [Google Scholar]
- Wang, G.; Kim, S.J.; Kil, G.S. Optimization of wavelet and thresholding for partial discharge detection under HVDC. IEEE Trans. Dielectr. Electr. Insul. 2017, 24, 200–208. [Google Scholar] [CrossRef]
- Carvalho, A.T.; Lima, A.C.S.; Cunha, C.F.F.C. Identification of partial discharges immersed in noise in large hydro-generators based on improved wavelet selection methods. Measurement 2015, 75, 122–133. [Google Scholar] [CrossRef]
- Özkan, A.; Özcan, K. Wavelet base selection for de-noising and extraction of partial discharge pulses in noisy environment. IET Sci. Meas. Technol. 2015, 9, 276–284. [Google Scholar]
- Cunha, C.F.F.C.; Carvalho, A.T.; Petraglia, M.R. A new wavelet selection method for partial discharge denoising. Electr. Power Syst Res. 2015, 125, 184–195. [Google Scholar] [CrossRef]
- Donoho, D.L. De-noising by soft-thresholding. IEEE Trans. Inf. Theory 1995, 41, 613–627. [Google Scholar] [CrossRef]
- Donoho, D.L.; Johnstone, J.M. Ideal spatial adaptation by wavelet shrinkage. Biometrika 1994, 81, 425–455. [Google Scholar] [CrossRef]
- Donoho, D.L.; Johnstone, I.M. Adapting to unknown smoothness via wavelet shrinkage. J. Am. Stat. Assoc. 1995, 90, 1200–1224. [Google Scholar] [CrossRef]
- Mallat, S. A theory for multi-resolution signal de-composition: The wavelet representation. IEEE Trans. Pattern Anal. Mach. Intell. 1989, 11, 674–693. [Google Scholar] [CrossRef]
- Daubechies, I. Ten Lectures on Wavelets; Siam: Philadelphia, PA, USA, 1992; Volume 61. [Google Scholar]
- Zhou, X.; Zhou, C.; Kemp, I.J. An improved methodology for application of wavelet transform to partial discharge measurement denoising. IEEE Trans. Dielectr. Electr. Insul. 2005, 12, 586–594. [Google Scholar] [CrossRef]
© 2020 by the authors. Licensee MDPI, Basel, Switzerland. This article is an open access article distributed under the terms and conditions of the Creative Commons Attribution (CC BY) license (http://creativecommons.org/licenses/by/4.0/).