1. Introduction
As an important part of lifeline engineering, bridge structures are mostly built in corrosive environments such as rivers, lakes, and seas. As the service time increases, the bridge structure will inevitably become corroded. Corrosion can cause the decline of material properties and the load carrying capacities of members [
1,
2]. In severe cases, it can affect the overall safety of bridge structure and lead to huge economic losses. At present, safety assessment and residual life prediction of corroded bridge structures have become important research topics globally. In this case, study on the mechanical properties of corroded members, as the premise and basis, is of extreme significance.
Typical bridge structures mainly include reinforced concrete and steel structures. Among them, the research on corroded reinforced concrete structures began earlier, and a lot of related experimental studies and theoretical analyses have been performed. Han et al. [
3] investigated the effects of longitudinal reinforcement corrosion on the shear capacity of RC members with transverse reinforcement. Triantafyllou et al. [
4,
5] studied the mechanical behavior of reinforced concrete beams with corroded steel reinforcement and corroded RC beams were strengthened with cement-based repair patch and externally bonded reinforcement or near surface mounted fiber-reinforced polymer laminates. Bossio et al. [
6] presented an additional tool that can be used to evaluate and assess the vulnerability of existing structures by calculating reinforcing bar cross section loss due to corrosion by measuring external crack widths in the concrete cover. Mohammed et al. [
7] experimentally studied the influence of crack widths and type of bars (plain and deformed) on corrosion of steel bars in cracked concrete. In recent years, there have been many studies on the mechanical properties of corroded H-shaped steel members [
8,
9,
10,
11,
12,
13,
14,
15,
16,
17,
18,
19], but the research on circular steel tube members is relatively rare [
20,
21,
22,
23,
24]. Existing research focuses on pressure tubes under internal pressure [
20,
21,
22,
23], which is different from the structural members mainly due to axial force, bending moment, and shearing force. In [
24], the mechanical properties of corroded circular steel tubular columns were tested and numerically simulated, and the influence of corrosion degree on axial load carrying capacity was studied. However, the specimens were non-enclosed members, and the internal and external surfaces were corroded. In practical constructions, the method of enclosed ends of members is often used to prevent the internal corrosion of steel tubes [
25].
To further study the mechanical properties of corroded circular steel tube members in actual bridge structures, 18 uniformly corroded circular steel tubular columns were designed and manufactured, and the corresponding mechanical properties were tested and theoretically analyzed. At the same time, the influence of corrosion degree on mechanical behavior of circular steel tubular beam-columns corroded uniformly was studied. Then, the corresponding calculation methods of load carrying capacity of members were proposed.
2. Experimental Program
2.1. Test Specimens
Eighteen specimens were designed with different parameters such as corrosion degree and eccentricity. All specimens were made of Q235B seamless circular steel tube with a length of 1000 mm. End plates were welded to each specimen with a thickness of 20 mm to prevent internal corrosion and for the convenience of loading. The geometric dimensions of specimens are shown in
Figure 1. The numbers and main geometric parameters of specimens are shown in
Table 1, where, in specimen ID, C is the abbreviation of circular steel tube; 0, 15, and 35 are different eccentricities; 0, 30, 90, 180, 270, and 360 are different corrosion days;
D is the diameter of circular steel tube;
t is the thickness of circular steel tube; e is the eccentricity;
T is the corrosion days;
W0 and
W1 are the mass of the same specimen before and after corrosion;
Dw is the corrosion ratio, according to Equation (1);
N′
t is the load carrying capacity of corroded specimen;
ΨN is the degradation ratio of load carrying capacity of specimen,
ΨN = (
Nt −
N′
t)/
Nt × 100%;
Nt is the load carrying capacity of non-corroded specimen;
k′
y is the stiffness of corroded specimen;
Ψk is the degradation ratio of stiffness of specimen,
Ψk = (
ky −
k′
y)/
ky × 100%;
ky is the stiffness of non-corroded specimen; and
μ is the ductility factor.
2.2. Accelerated Corrosion Test
Steel atmospheric exposure test is the most common and near-real corrosion test method, but its corrosion time is long and limited by regional climate and environment. The laboratory accelerated corrosion method is more efficient and can greatly shorten the corrosion cycle. However, due to the lack of technology and theory, its accelerated corrosion effect is less reproducible than real corrosion, and the size of components is limited by equipment space. To obtain the uniformly corroded circular steel tube members that meet the test requirements in atmospheric environment within a relatively short period, the accelerated corrosion test by artificial periodic spraying was used in natural environment.
Neutral salt spray solution was prepared according to the specification (ISO 9227: 2006). The NaCl concentration was 50 g/L and the pH value was 6.5–7.2. Both the test temperature and humidity were based on outdoor natural environment in Fuzhou, China. The solution was sprayed onto the surface of members in a mist form, and the spraying period was arranged at 8:30–11:30 and 14:30–17:30 everyday with an interval of 40 min. The surface of specimen was uniformly wetted as much as possible to alternate wetting and drying. To ensure the same rust status of steel tubes at different positions, the specimens were turned over once a week.
After the accelerated corrosion test, the weight loss method was used to determine the corrosion ratio of uniform corroded specimen [
1,
2,
12,
13,
14,
15,
24]. First, the specimen was washed with 12% dilute hydrochloric acid solution; then, the specimen was washed with water; next, it was neutralized with lime water; next, the specimen was washed with water again; next, the specimen was dried; finally, the specimen was weighed and the corrosion ratio
Dw was calculated according to Equation (1).
2.3. Material Properties
According to the provisions of specification (ISO 6892-1: 2009), the standard specimens with different corrosion degrees were cut from uniform corrosion columns of the same batch, size, and corrosion environment as the test specimens. Each group had eight specimens, with a total of seven groups, and the test results are shown in
Table 2. The corrosion degrees were expressed by the corrosion ratio
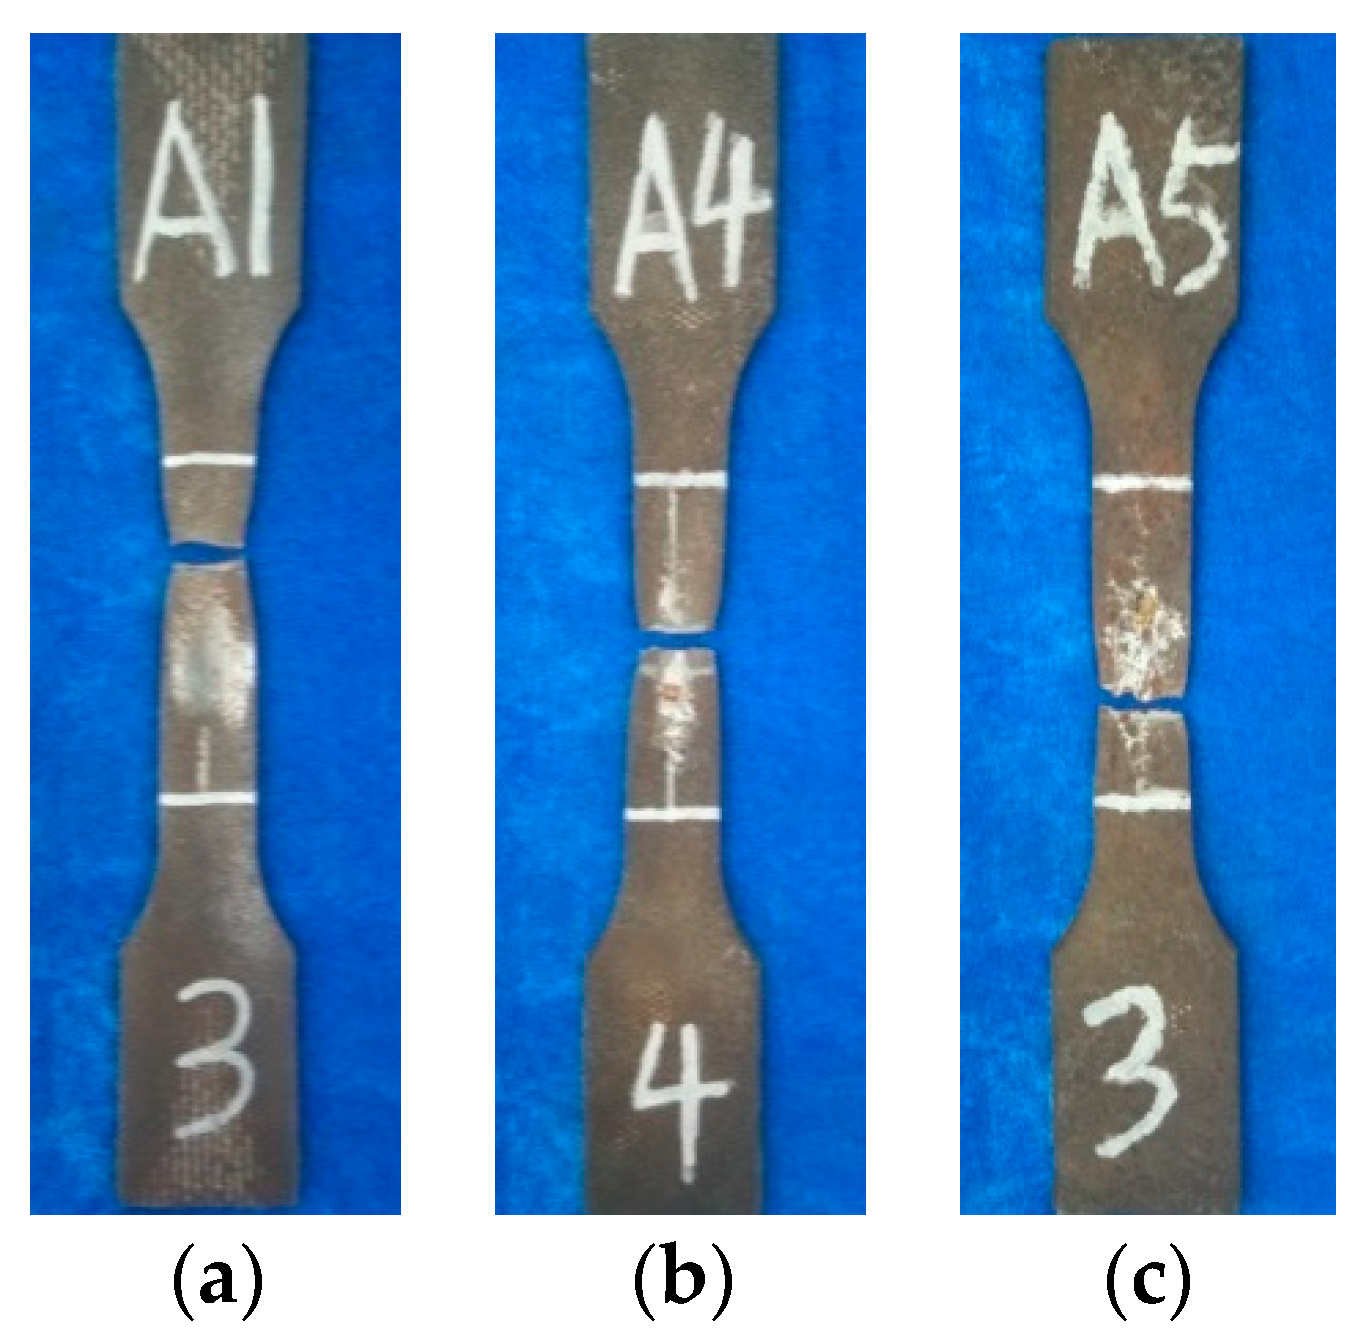
Dw, and the test results were calculated based on the size of non-corroded specimens. The material tensile test was performed by using a universal testing machine (MTS), and the loading rate did not exceed 1.05 mm/min. The tensile fracture mode of non-corroded steel specimen was typical ductile fracture. With the increase of corrosion ratio, the necking phenomenon of corroded specimens obviously weakened, and the steel fracture gradually changed from ductile fracture to brittle fracture. The tensile fracture morphology of specimens is shown in
Figure 2.
The relationships of corroded steel between
Dw and
fy,
fu,
E, and
ψ were established by linear regression with the least square method, as shown in Equation (2). It can be found that, with the increase of corrosion degree, the mechanical properties of the corroded steel decrease significantly, and the degradation law of each parameter has a linear relationship with the corrosion ratio.
where
fy,
fu,
E, and
ψ as well as
f′
y,
f′
u,
E′, and
ψ′ are the yield strength, tensile strength, elasticity modulus, and percentage elongation of no-corroded and corroded steel, respectively.
2.4. Test Setup
The compression test was performed by using a pressure testing machine (YAW6506) with a capacity of 5000 kN in Structural Laboratory of Fuzhou University. The knife edge hinge was connected to the loading end of test machine. The specimen end plate and the steel plate with strip groove were fixed by high-strength bolts.
A preloading 20% of the predicted ultimate load carrying capacity was carried out for ensuing the normal operation of the instrument and the physical alignment of the loading position. Physical alignment was achieved by adjusting the position of the specimen according to the strains of the four gauges locating at the same section. When the test was officially started, the grading load was applied during the stage of force control and each stage of load was about 10% of the predicted ultimate load carrying capacity. After the load reached level 7 or 8, the displacement controlling scheme was employed, and the loading rate did not exceed 0.1 mm/min. The upper limits of force control and displacement control were adjusted according to load, displacement, and strain feedback during actual control.
2.5. Instrumentation
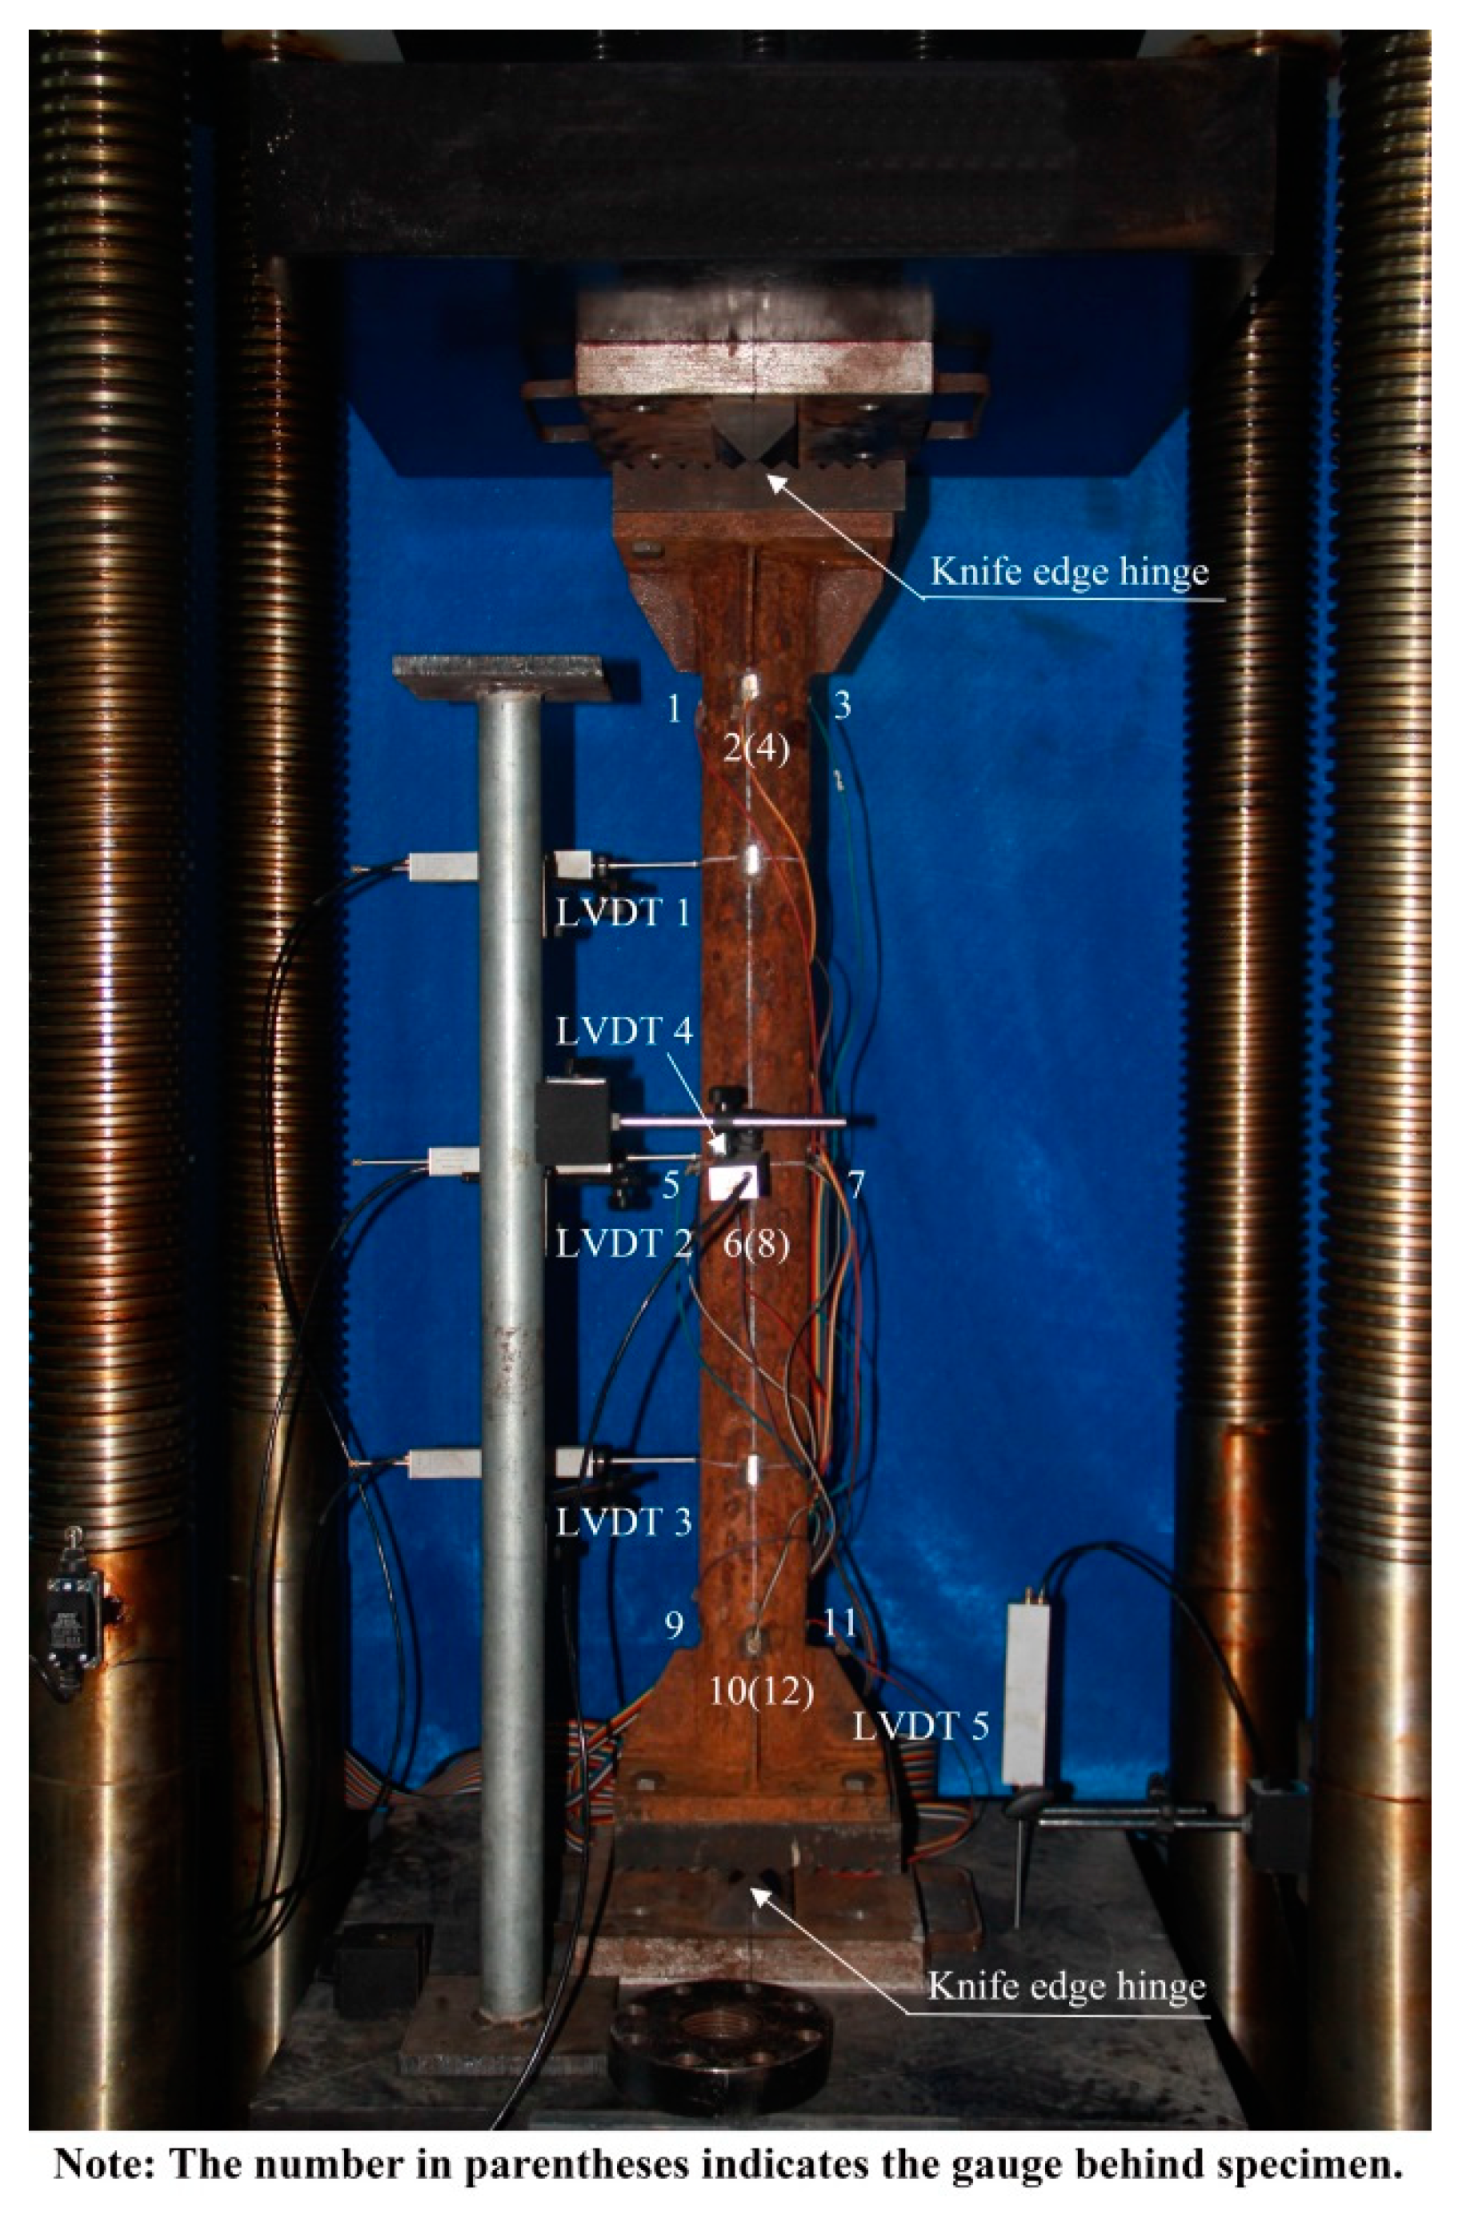
Arrangement of strain gauges and LVDTs are shown in
Figure 3. Four longitudinal strain gauges were equipped along the upper, middle, and lower sections of the specimen. Four hoop strain gauges were arranged at the mid-span of the specimen to observe hoop strains. LVDT1–LVDT3 were located horizontally at quartering positions of the height in the bending plane of the specimen. LVDT4 was installed horizontally at the mid-span of the specimen outside the bending plane to measure out-of-plane deformation. LVDT5 was adopted to measure the axial deformation of specimen.
3. Experimental Procedure and Observations
3.1. Concentrically Loaded Specimen
The numbers of concentrically loaded specimens were C0-0, C0-30, C0-90, C0-180, C0-270, and C0-360, respectively. Failure modes of all specimens were attributed to global buckling failure. Among the corrosion ratios of specimens obtained by accelerated corrosion test, uniform corrosion did not change the failure modes of concentrically loaded specimens. At the initial stage of loading, the non-corroded specimens were in the elastic stage, and the load, displacement, and strain increased steadily without obvious phenomenon. After the specimens entered the elastic–plastic stage, micro-deformation began to appear. When the load peaked, the deflection of specimens was obvious, and the axis of specimens was curved. Then, the load dropped rapidly and gradually became flat, while the deflection of specimens continued to increase. Unlike the non-corroded specimens, before the elastic–plastic stage, the corroded specimens had a crisp sound that the rust layer was gradually fractured, and cracks appeared in the brown-yellow rust layer. Meanwhile, the concave side rust layer in the middle of specimens was crushed and detached. As the deformation continued to increase, the rust layer detached gradually along the tube wall to the convex side, and the rust layer detached area became elliptical eventually. Experimental phenomena of the specimen C0-90 are shown in
Figure 4.
3.2. Eccentrically Loaded Specimen
The numbers of eccentrically loaded specimens were C15-0, C15-30, C15-90, C15-180, C15-270, C15-360, C35-0, C35-30, C35-90, C35-180, C35-270, and C35-360, respectively. Failure modes of all specimens were global buckling failure. Among the corrosion ratios of specimens obtained by accelerated corrosion test, uniform corrosion did not change the failure modes of eccentrically loaded specimens. At the initial stage of loading, the non-corroded specimens were in the elastic stage, and the load, displacement and strain increased steadily with tiny deflection. As the load continued to increase, the specimens entered the elastic–plastic stage, and the deflection of specimens was obvious. When the peak load was reached, the deflection of specimens became increasingly obvious, and the axis of specimens was curved. Then, the load dropped rapidly and gradually became flat, while the deflection of specimens continued to increase. Unlike the non-corroded specimens, before the elastic–plastic stage, the corroded specimens had a crisp sound that the rust layer was gradually fractured, and cracks appeared in the brown-yellow rust layer. When the peak load was reached, the concave side rust layer in the middle of specimens was crushed and detached. As the deformation continued to increase, the rust layer detached gradually along the tube wall to the convex side, and the rust layer detached area became elliptical eventually. Experimental phenomena of the specimen C15-90 are shown in
Figure 5.
4. Experimental Results and Analysis
4.1. Load–Strain Curves
4.1.1. Concentrically Loaded Specimen
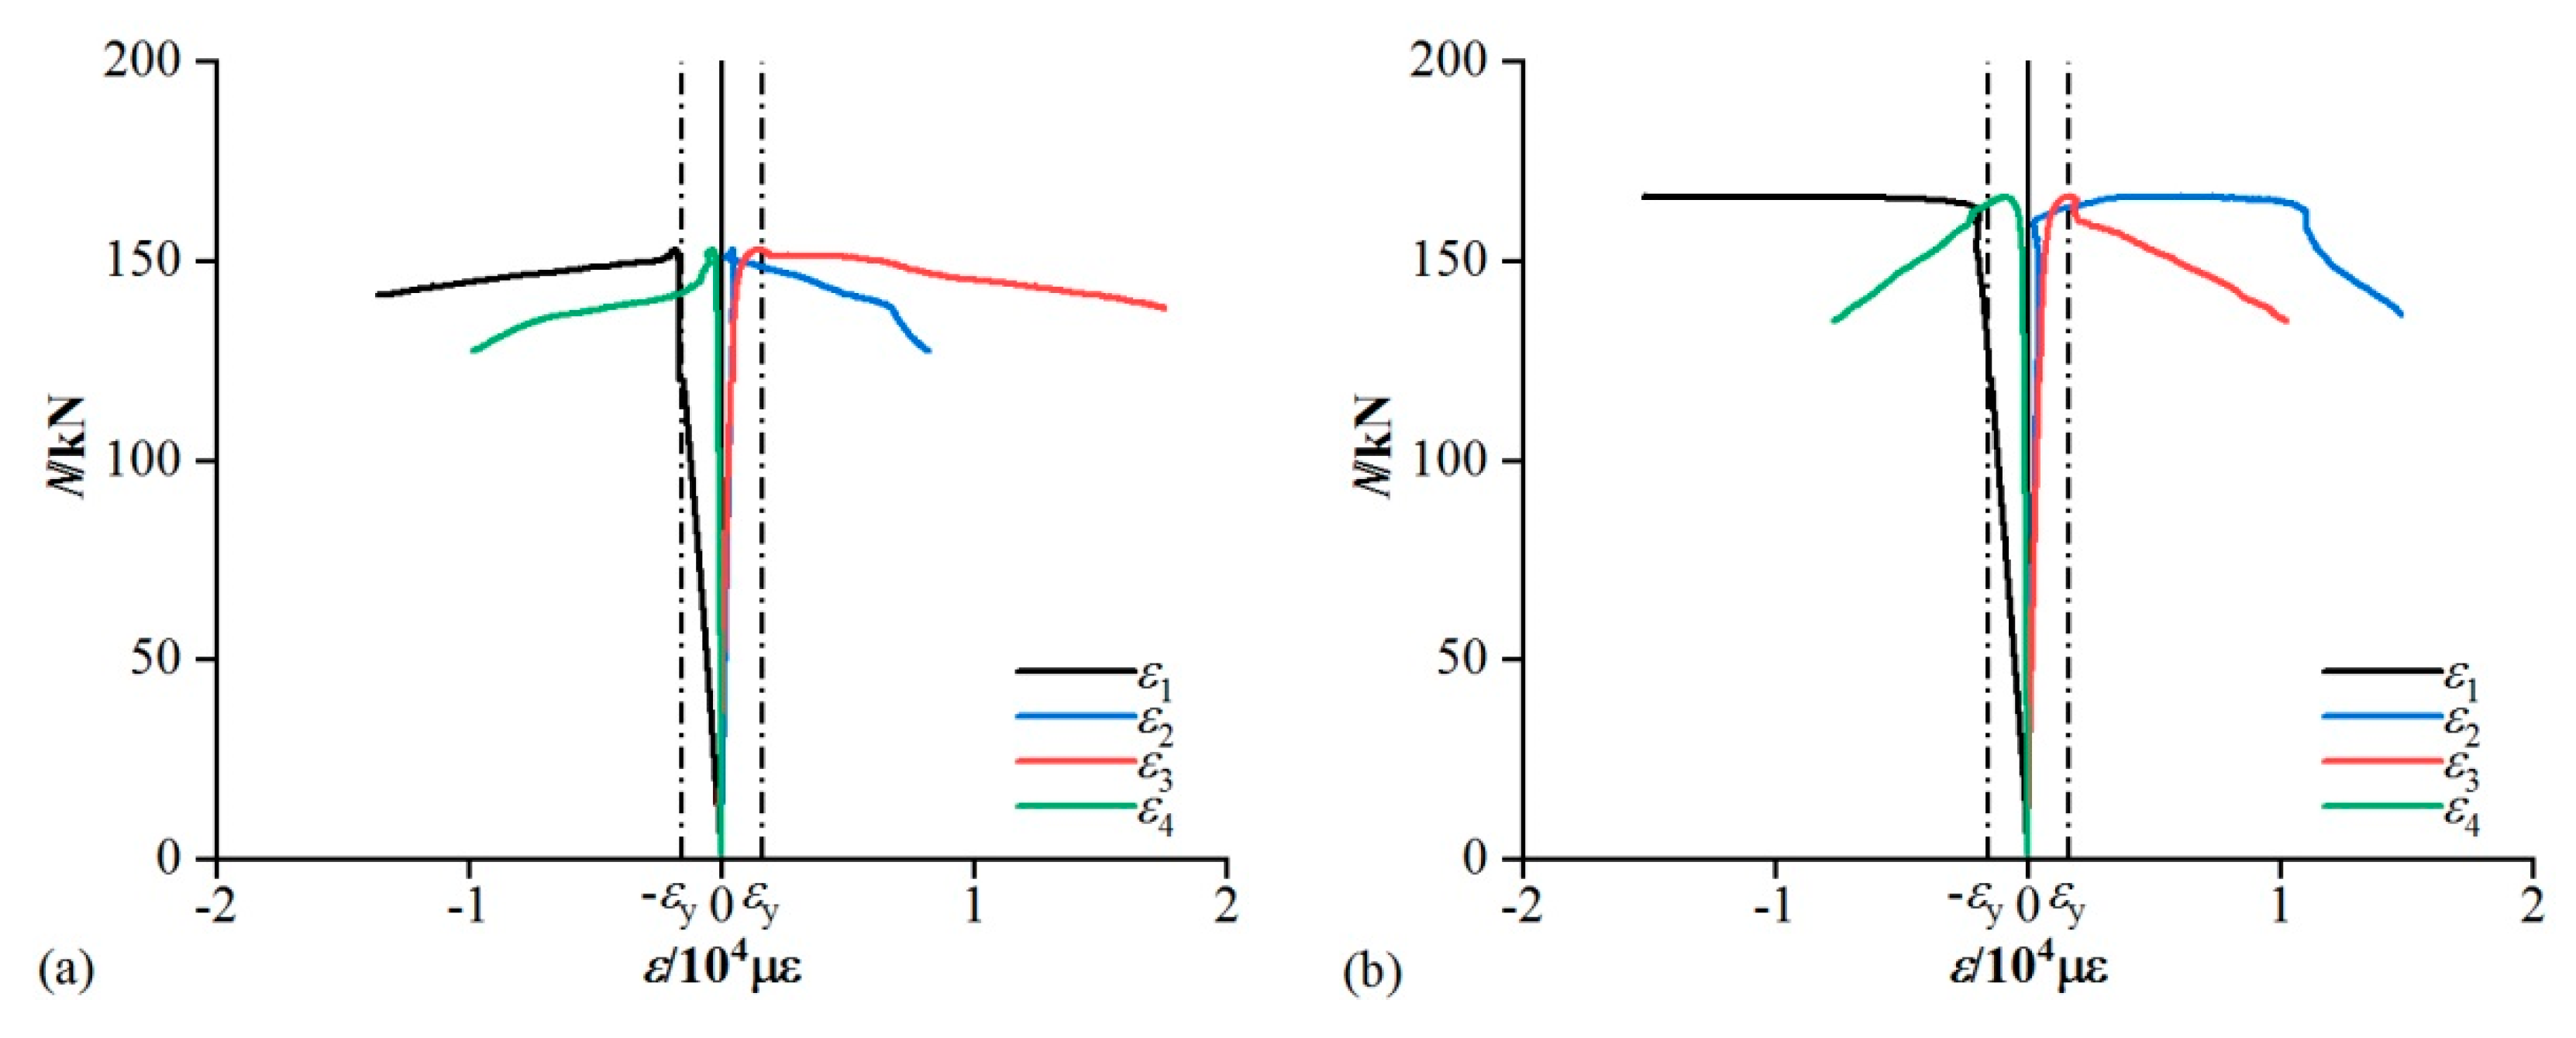
Figure 6 shows the load–strain curves of concentrically loaded specimens, where
ε1 and
ε2 are the longitudinal strain and transverse strain of concave side of mid-section,
ε3 and
ε4 are the longitudinal strain and transverse strain of convex side of mid-section, and the measured yield strain
εy is 1650 με. It can be seen that the strain change laws of specimens are basically the same. During the elastic phase, the strain of mid-section is synchronously increased, longitudinally compressed, and circumferentially tensioned. After entering the elastic–plastic stage, the stress state begins to change, the longitudinal compressive strain and the transverse tensile strain of convex side gradually decrease, while the longitudinal compressive strain and transverse tensile strain of concave side continue to increase, which is due to the additional bending moment caused by the second-order effect of member flexure. After the peak load, the longitudinal strain of the convex side gradually changes from compressive strain to tensile strain, and the transverse strain gradually changes from tensile strain to compressive strain. The longitudinal compressive strain and transverse tensile strain of concave side continue to increase. At peak load, the strain of each specimen is in the elastic–plastic stage.
4.1.2. Eccentrically Loaded Specimen
1. Eccentricity of 15 mm
Figure 7 shows the load–strain curves of specimens with eccentricity of 15 mm. It can be seen that the strain change laws of specimens are basically the same. During the elastic phase, the strain of mid-section is synchronously increased, and the specimens are longitudinally compressed and circumferentially tensioned. After entering the elastic–plastic stage, the stress state begins to change, the longitudinal compressive strain and transverse tensile strain of convex side gradually decrease until these strains become reverse, that is tensile strain and compressive strain, respectively, which is due to the additional bending moment caused by the second-order effect of member flexure. After the peak load, the longitudinal tensile strain and transverse compressive strain of convex side gradually increase, while the longitudinal compressive strain and transverse tensile strain of concave side also continue to increase. At peak load, the strain of each specimen is in the elastic–plastic stage.
2. Eccentricity of 35 mm
Figure 8 shows the load–strain curves of specimens with eccentricity of 35 mm. It can be seen that the strain change laws of specimens are basically the same. In the elastic phase, the strain of mid-section is synchronously increased. The strain of concave side is longitudinally compressed and circumferentially tensioned with the specimens being longitudinally tensioned and circumferentially compressed. After entering the elastic–plastic stage, the stress state does not change and the strains of concave side and convex side gradually increase. When the longitudinal tensile strain of convex side reaches the yield value, the ultimate load carrying capacity of specimen is also achieved. After the peak load, the strains of concave side and convex side continue to increase. At peak load, the strain of each specimen is in the elastic–plastic stage.
4.2. Load–Axial Displacement Curves
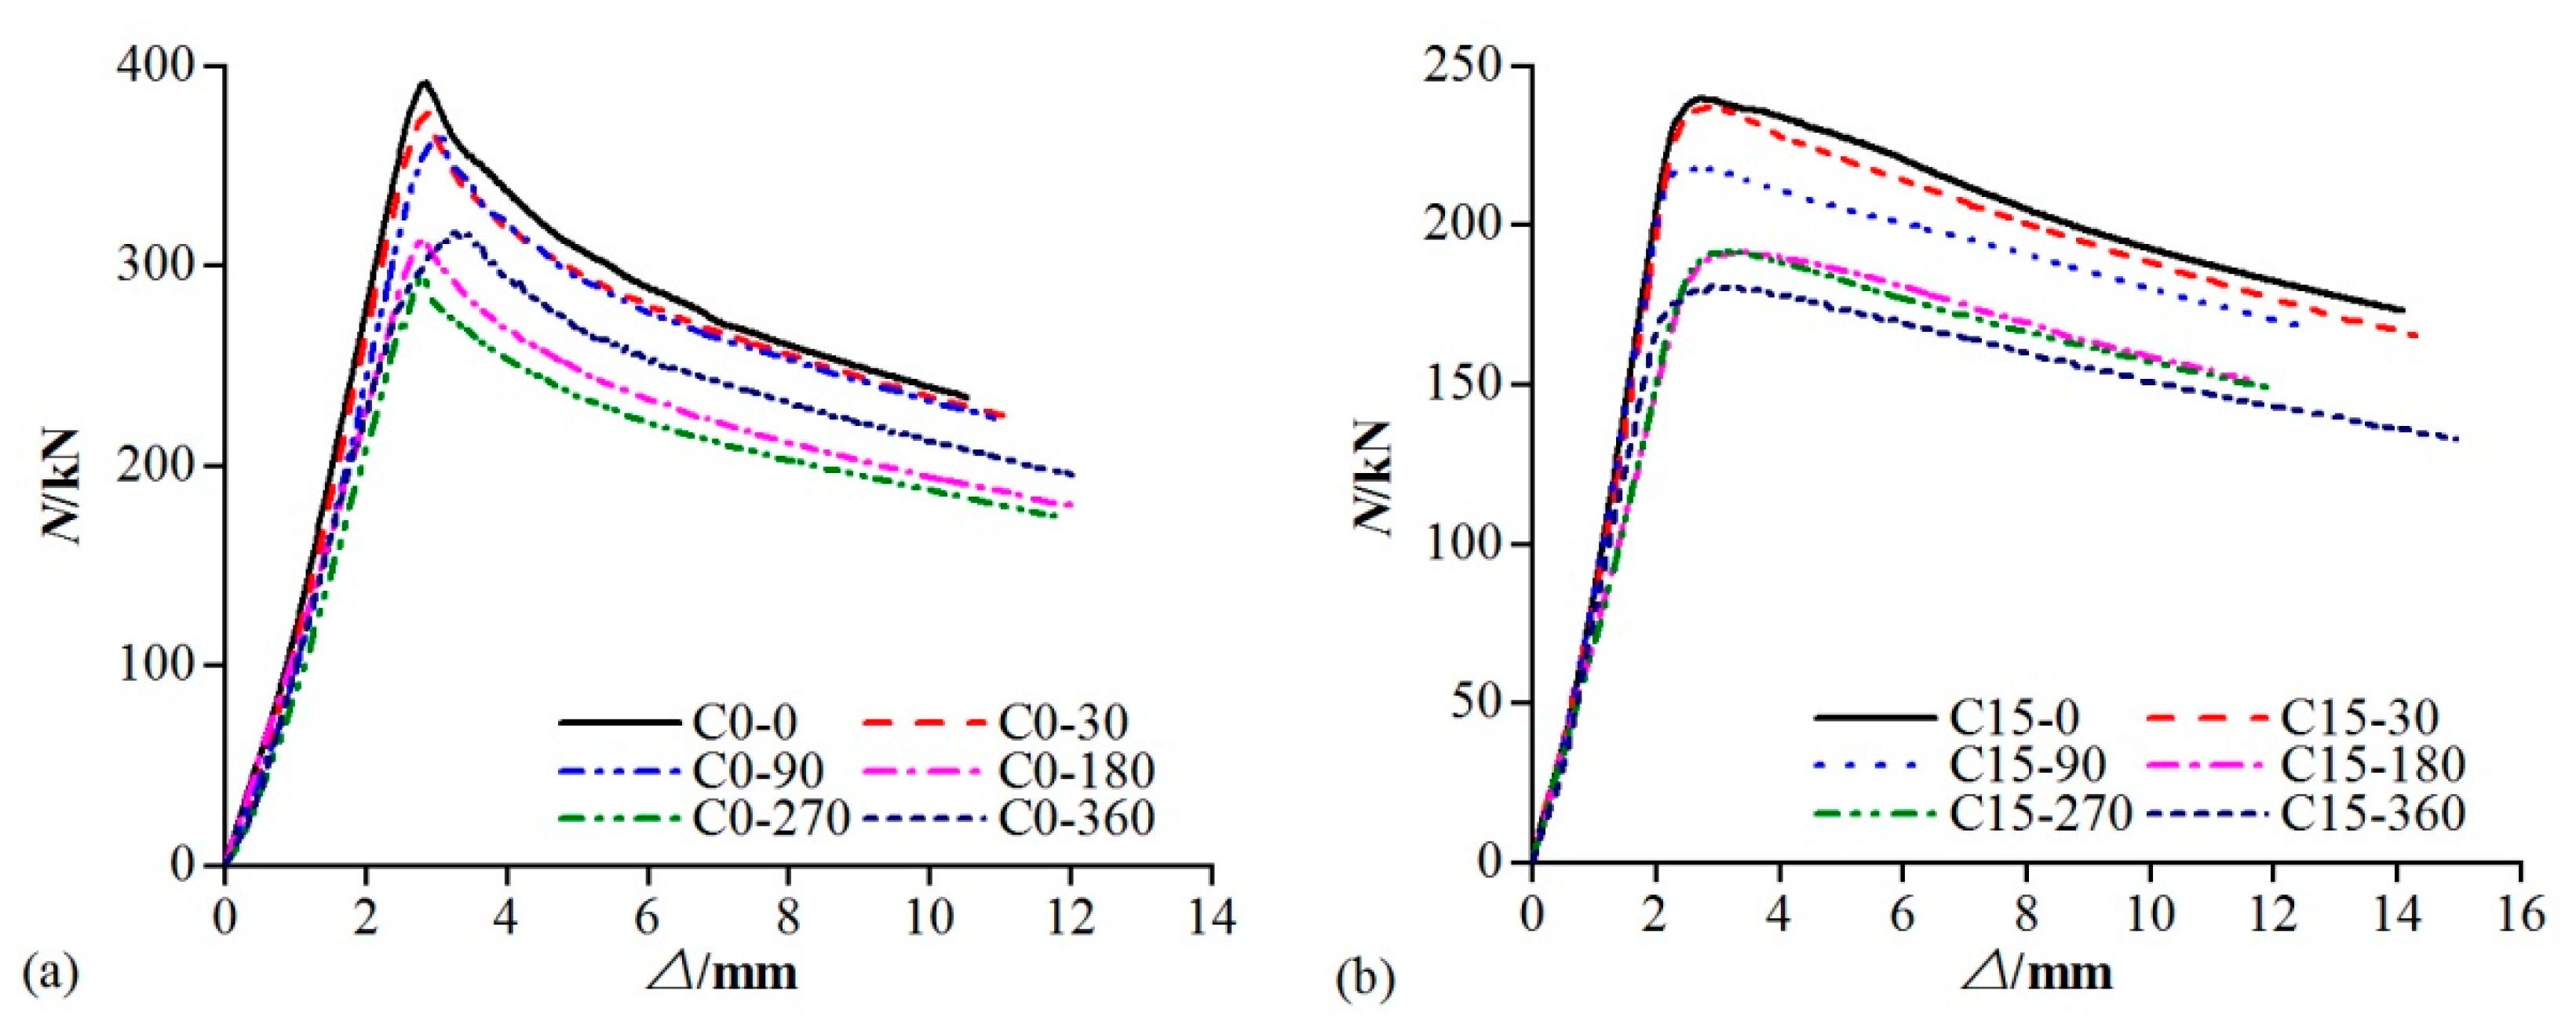
The load carrying capacities, stiffness and ductility factors of specimens are shown in
Table 1. Load–axial displacement curves of specimens are shown in
Figure 9.
Table 1 and
Figure 9 show that the peak loads and the slopes of rising phase of curves of corrosion specimens become smaller, indicating that uniform corrosion can lead to degradations of the stiffness and load carrying capacities of specimens in the same condition. The larger is the eccentricity, the lower is the ultimate load carrying capacity of specimen, but with a better the ductility.
4.3. Degradation Analysis of Load Carrying Capacity
The ultimate load carrying capacities of specimens are shown in
Table 1. The degradations of ultimate load carrying capacities of corroded specimens relative to non-corroded specimens are shown in
Figure 10.
Table 1 and
Figure 10 show that the load carrying capacities of specimens decrease with the increase of eccentricity. The reductions of ultimate load carrying capacities of specimens increase with the increase of corrosion ratio. The negative degradation ratio of load carrying capacity of specimen with eccentricity of 35 mm is mainly due to the smaller thickness and load carrying capacity of the non-corroded specimen C35-0 compared to the corroded specimens C35-30 and C35-90. In general, the relationships between the load carrying capacity degradations and the corrosion ratios of uniformly corroded specimens under various working conditions are linear. The slopes are greater than 1, and increase with the increase of eccentricity. That is to say, the degradations of load carrying capacities of specimens increase with the increase of eccentricity at the same corrosion ratio, and the reductions of ultimate load carrying capacities of specimens are greater than that of material strength.
4.4. Degradation Analysis of Stiffness
The stiffness of specimens is shown in
Table 1. The stiffness degradations of uniformly corroded specimens under various working conditions are shown in
Figure 11.
Table 1 and
Figure 11 show that the stiffness of specimens decrease with the increase of eccentricity. The reductions of the stiffness of specimens increase with the increase of corrosion ratio. The stiffness degradations of uniformly corroded specimens are linear with the corrosion ratios, and the slopes are greater than 1. That is, the reductions of the stiffness of specimens are greater than that of material strength. The slope of specimens with eccentricity of 35 mm is the largest, that is, the stiffness degradation of specimens with eccentricity of 35 mm is the largest at the same corrosion ratio.
5. Calculation of Load Carrying Capacity
5.1. Comparison Calculations of Load Carrying Capacity
There are two main methods for calculating the load carrying capacities of corroded members. One is that the corrosion only causes the reduction of the cross-section, and maintains the material property unchanged [
9,
10,
11,
12,
13,
14]. The other is that the corrosion does not change the cross-section of member, but results in the degradation of material property [
17,
18,
19]. Based on the above two ideas, the load carrying capacities of members can be calculated according to the relevant formulas in GB50017-2017 [
26], EN 1993-1-1 [
27] and ANSI/AISC 360-16 [
28], as shown in Equations (3)–(8). The calculation results are shown in
Table 3, where
Ncs and
Ncm are the load carrying capacities of specimens calculated considering the section reduction and the material degradation, respectively. It can be seen that the calculation results of three specifications have a certain safety margin, and
Ncs is slightly larger than
Ncm in the results, which are basically the same.
- (1)
GB50017-2017
where
N is the required axial strength, N;
is the parameter according to Equation (4);
φ is the stability reduction coefficient of concentrically loaded member;
A is the gross cross-sectional area, mm
2;
β is the equivalent moment factor;
M is the required moment strength, N⋅mm;
γm is the plastic adaption coefficient; and
W is the gross section modulus, mm
3.
- (2)
EN 1993-1-1
where
NEd,
My,Ed, and
Mz,Ed are the design values of the compression force and the maximum moments about the y-y and z-z axis along the member, respectively;
NRk,
My,Rk, and
Mz,Rk are the characteristic value of resistance to compression and the characteristic value of resistance to bending moments about the y-y and z-z axis along the member, respectively; Δ
My,Ed and Δ
Mz,Ed are the moments due to the shift of the centroidal axis;
χy and
χz are the reduction factors due to flexural buckling;
χLT is the reduction factor due to lateral torsional buckling;
γM1 is the partial factor, 1.0; and
kyy,
kyz,
kzy, and
kzz are the interaction factors.
- (3)
ANSI/AISC 360-16
When
where
Pr is the required axial strength, kips (N);
Pc is the design axial strength,
Pc = ϕ
cPn, kips (N);
Mr is the required flexural strength, kip⋅in (N⋅mm);
Mc is the design flexural strength,
Mc = ϕ
bMn, kip⋅in (N⋅mm); ϕ
c is the resistance factor for compression, 0.9; ϕ
b is the resistance factor for flexural, 0.9;
x is the subscript relating symbol to major axis bending; and
y is the subscript relating symbol to minor axis bending.
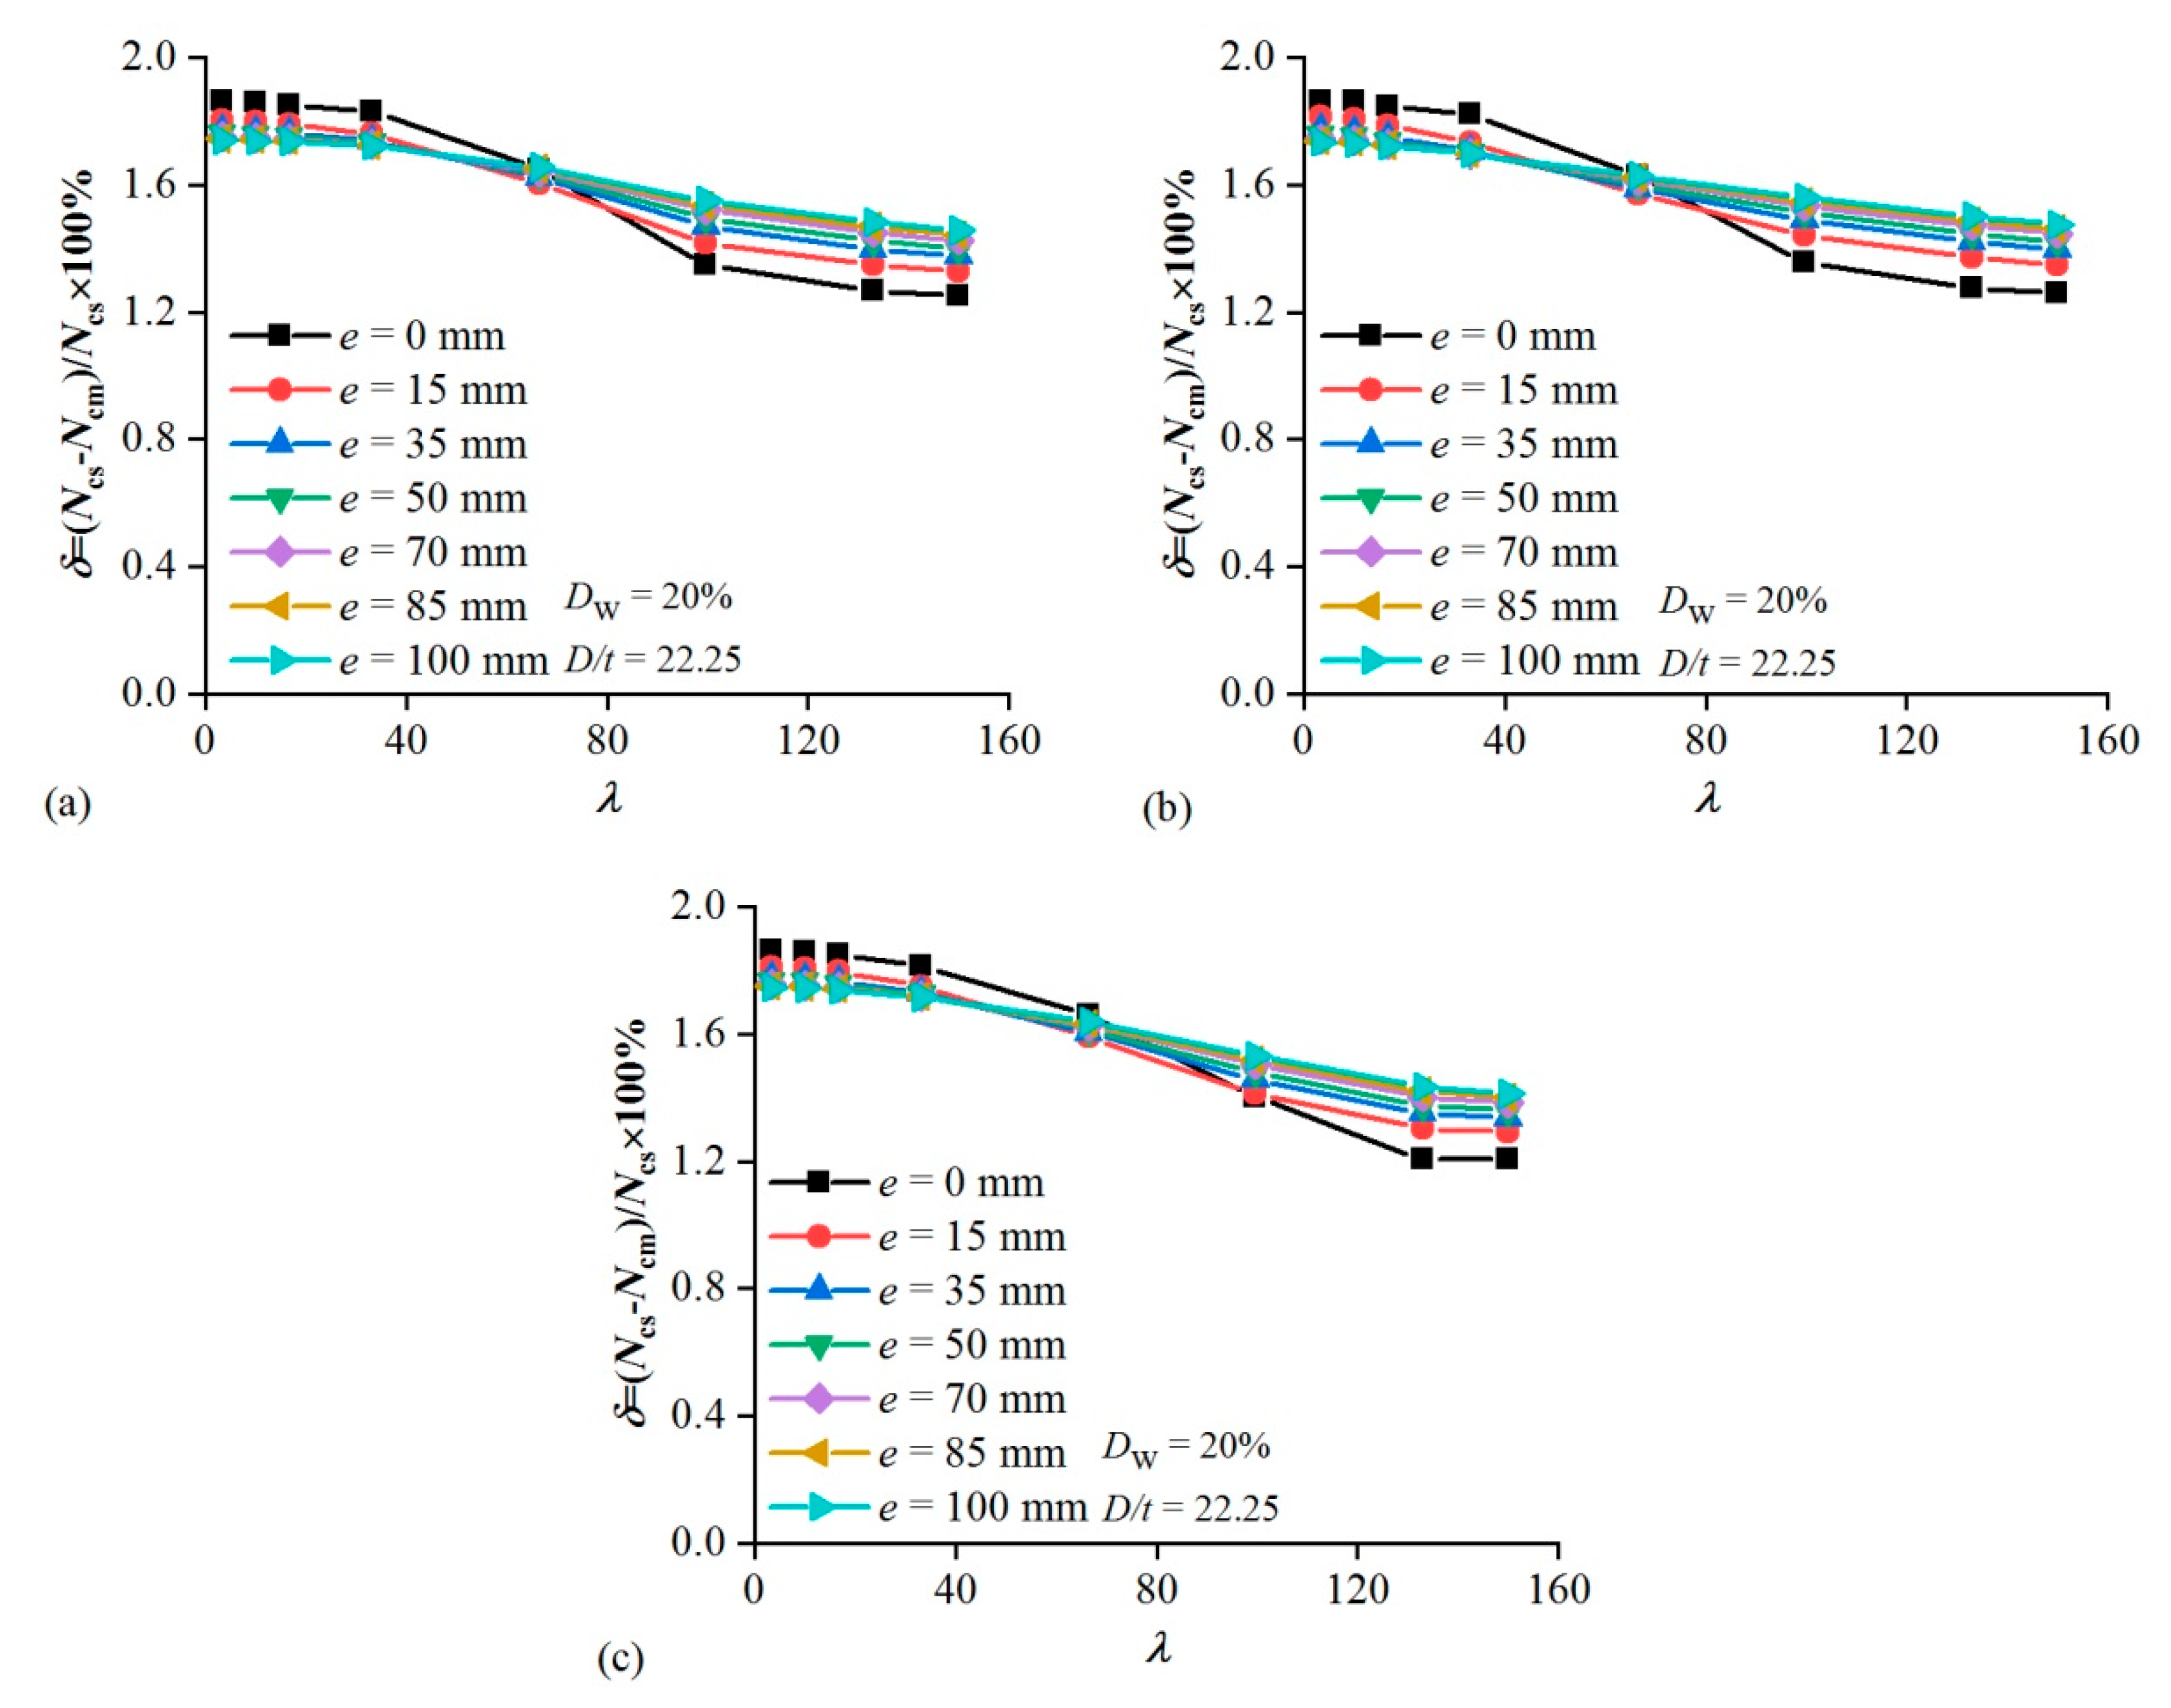
To further investigate the difference between the two calculation methods, when the corrosion ratio (
Dw = 20%) of specimens is large, the load carrying capacities of specimens with different slenderness ratios and diameter-to-thickness ratios are compared, as shown in
Figure 12 and
Figure 13, where
δ is the relative error,
δ = (
Ncs −
Ncm)/
Ncs × 100%;
λ is the slenderness ratio,
λ = l/i;
l is the length of circular steel tube;
i is the radius of gyration of circular steel tube; and
D/t is the diameter-to-thickness ratio. As shown in
Figure 12, with the increase of slenderness ratio, the difference between the two methods becomes smaller and smaller. With the slenderness ratio 66 as the limit, the difference between
Ncs and
Ncm decreases first and then increases with the ascent of eccentricity (
e = 0~100 mm).
Figure 13 shows that, when the diameter-to-thickness ratio is relatively small, the load carrying capacity calculated by three specification formulas considering the material degradation method is higher than that calculated by the section reduction method, but such a small diameter-to-thickness ratio is not usually used in practical engineering. In the common range of engineering, the calculation results of the three specifications are not the same, among which the difference of calculation results of GB 50017-2017 increases slightly with the increase of the diameter-to-thickness ratio, and the overall difference is not more than 3%. However, the calculation results of EN 1993-1-1 and ANSI/AISC 360-16 all show mutation points. This is mainly resulted from the finer classification of steel tubes in these two specification calculation formulas, and the calculation formulas or parameters of different categories of steel tubes are slightly different. When considering material degradation or section reduction to simulate uniform corrosion, two methods can be used to calculate different categories of steel tubes, and then different parameters or calculation formulas will be taken.
5.2. Accuracy Analysis of Load Carrying Capacity Calculation Method
According to the section reduction method, the comparison between the load carrying capacity calculation results
Ncs by the above three specifications and the test results
Nt of specimens are shown in
Figure 14. It can be found that the ultimate load carrying capacities of specimens calculated based on section reduction are close to the test results, and have a certain safety margin, indicating the feasibility of this method. Considering that
Ncm and
Ncs are basically the same, the method of material degradation for load carrying capacities can also be proved feasible. After comparison, the conservative degree of calculation results of three specifications indicates a descending order of ANSI/AISC 360-16, GB50017-2017, and EN 1993-1-1.
5.3. Comparison of One-Sided Corrosion and Two-Sided Corrosion
Because of the different parameters such as the slenderness ratio and the diameter-to-thickness ratio of specimens in this study and the study in [
24], it is not possible to directly use these data to compare the difference between one-sided corrosion and two-sided corrosion. The results of the study in [
24] are also shown in
Figure 14, and it can be seen that the section reduction method can also be used to calculate the load carrying capacities of two-sided corrosion specimens. With the same corrosion ratio, the load carrying capacities of one-sided corrosion and two-sided corrosion specimens are shown in
Figure 15, where
Nco and
Nct are the load carrying capacities of the specimens calculated by considering one-sided corrosion and two-sided corrosion, respectively. It can be seen that
Nct is slightly larger than
Nco, but the results are basically the same.
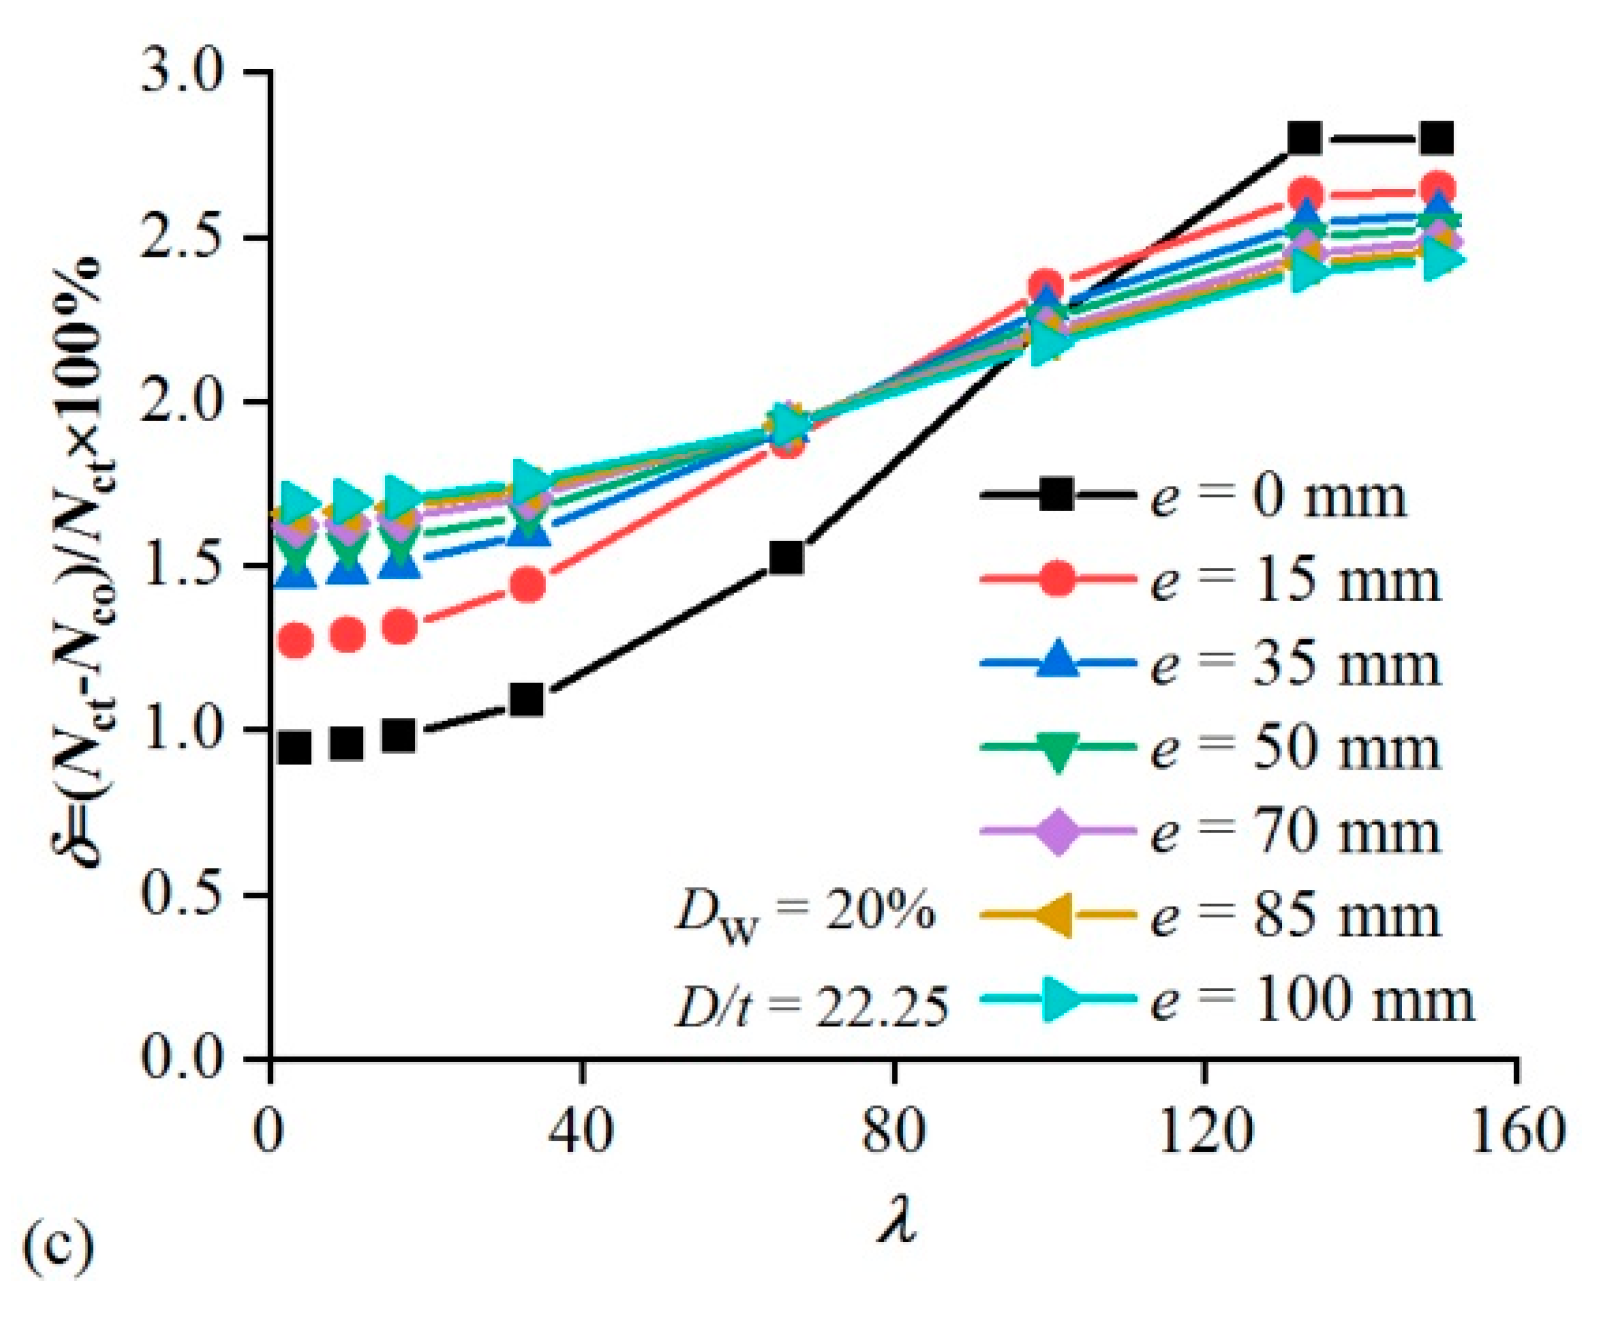
To study the difference between the two methods of one-sided corrosion and two-sided corrosion, the load carrying capacities of specimens were calculated by the above three specifications according to the previous values of corrosion ratio, eccentricity, slenderness ratio, and diameter-to-thickness ratio, as shown in
Figure 16 and
Figure 17. It can be found that, with the increase of slenderness ratio, the calculated results of one-sided corrosion and two-sided corrosion are more and more different. Within the common range of engineering, the difference between the two corrosion methods decreases with the increase of diameter-to-thickness ratio. In general, the load carrying capacities of specimens calculated by the two corrosion methods are not much different. When the corrosion degrees of specimens do not exceed 20%, the results between the two corrosion methods are no more than 3%. It shows that different uniform corrosion modes have little influence on the calculation results of load carrying capacities of specimens. Two-sided corrosion can only be considered to accelerate the corrosion ratio in the accelerated corrosion test.
6. Conclusions
The influences of parameters such as corrosion degree and eccentricity on the mechanical properties of uniformly corroded circular steel tubular beam-columns in atmospheric environment were studied experimentally. Based on the calculation formulas of three specifications, the load carrying capacities of corroded specimens were calculated by the section reduction method and material degradation method. Herein, the following conclusions are summarized.
The yield strength, tensile strength, elastic modulus, and elongation of corroded steel decrease linearly with the increase of corrosion ratio, and the elongation decreases more quickly than other properties.
The failure modes of circular steel tube specimens do not change under uniform corrosion, which are global buckling failure. With the increase of eccentricity, the load carrying capacities and stiffness of specimens descend.
The load carrying capacities and stiffness of circular steel tube specimens decrease with the growth of corrosion ratio, which are more prominent than the degradation of material properties of steel, and the degree of reduction is linear with the corrosion ratio. At the same corrosion ratio, the load carrying capacity and stiffness degradation of specimens with larger eccentricity are more significant.
The load carrying capacities of specimens calculated based on the section reduction and material degradation are in good agreement with the test results and have a certain margin. The conservative degree of the calculation results of three specifications ranks in descending order of ANSI/AISC 360-16, GB50017-2017, and EN 1993-1-1.
When the corrosion ratios of specimens are equal and do not exceed 20%, the load carrying capacities of one-sided corrosion and two-sided corrosion specimens are basically the same, and the difference between two results is no more than 3%.
Author Contributions
Z.W., S.-F.J., and Y.W. conceived and designed the experiments; Y.W., X.W., and C.H. performed the experiments and analyzed the data; Z.W. and S.-F.J. contributed reagents/materials/analysis tools; and Y.W. wrote the paper. All authors have read and agreed to the published version of the manuscript.
Funding
This research was funded by the China National Key R&D Program during the 13th Five-Year Plan Period (Grant No. 2016YFC0700706).
Acknowledgments
This research was supported by the China National Key R&D Program during the 13th Five-Year Plan Period (Grant No. 2016YFC0700706), which is gratefully acknowledged. The authors would also like to acknowledge Fujian Provincial Key Laboratory on Multi-Disasters Prevention and Mitigation in Civil Engineering Fuzhou University, China, for laboratory help.
Conflicts of Interest
The authors declare no conflict of interest.
References
- Chen, L.; Li, N.; Xu, S.H.; Kong, Z.Y. Experimental study on the deterioration of mechanical properties of corroded steel. Ind. Constr. 2011, 41, 652–654+631. [Google Scholar] [CrossRef]
- Wei, Y.; Wu, Z.Q.; Jiang, S.F. Deterioration law of mechanical properties of corroded steels. Steel Constr. 2018, 33, 117–122. [Google Scholar]
- Han, S.J.; Joo, H.E.; Choi, S.H.; Heo, I.; Kim, K.S.; Seo, S.Y. Experimental Study on Shear Capacity of Reinforced Concrete Beams with Corroded Longitudinal Reinforcement. Materials 2019, 12, 837. [Google Scholar] [CrossRef]
- Triantafyllou, G.; Rousakis, T.; Karabinis, A. Corroded RC Beams at Service Load before and after Patch Repair and Strengthening with NSM CFRP Strips. Buildings 2019, 9, 67. [Google Scholar] [CrossRef]
- Triantafyllou, G.G.; Rousakis, T.C.; Karabinis, A.I. Corroded RC beams patch repaired and strengthened in flexure with fiber-reinforced polymer laminates. Compos. Part B 2017, 12, 112, 125–136. [Google Scholar] [CrossRef]
- Bossio, A.; Lignola, G.P.; Fabbrocino, F.; Monetta, T.; Prota, A.; Bellucci, F.; Manfredi, G. Nondestructive assessment of corrosion of reinforcing bars through surface concrete cracks. Struct. Concr. 2017, 18, 104–117. [Google Scholar] [CrossRef]
- Mohammed, T.U.; Otsuki, N.; Hisada, M.; Shibata, T. Effect of Crack Width and Bar Types on Corrosion of Steel in Concrete. J. Mater. Civ. Eng. 2001, 13, 194–201. [Google Scholar] [CrossRef]
- Sadovský, Z.; Drdácký, M. Buckling of plate strip subjected to localized corrosion-a stochastic model. Thin-Wall. Struct. 2001, 39, 247–259. [Google Scholar] [CrossRef]
- Kawanishi, N.; Goto, Y. Analysis to Predict Long-Term Mechanical Performance of Steel Structures with Histories of Corrosion and Repair. J. Struct. Eng. 2004, 130, 1578–1585. [Google Scholar] [CrossRef]
- Beaulieu, L.V.; Legeron, F.; Langlois, S. Compression strength of corroded steel angle members. J. Constr. Steel Res. 2010, 66, 1366–1373. [Google Scholar] [CrossRef]
- Pan, D.S.; Xu, S.H. Research on prediction model for flexural load-bearing capacity of corroded steel components. J. Water Resour. Archit. Eng. 2009, 7, 27–28. [Google Scholar]
- Zhang, H. Experimental Study and Theoretical Analysis on the Buckling Behavior of the Corroded H-Shape Steel. Master’s Thesis, Xi’an University of Architecture and Technology, Xi’an, China, 2011. [Google Scholar]
- Xue, N. Experimental Study and Analysis on the Eccentric Compression Behavior of the Corroded H-Shape Steel. Master’s Thesis, Xi’an University of Architecture and Technology, Xi’an, China, 2013. [Google Scholar]
- Qiu, B. The Study on Surface Characteristics and Eccentric Compressive Load-Capacity of Corroded H-Shape Steel Members at Neutral Salt Fog Environment. Ph.D. Thesis, Xi’an University of Architecture and Technology, Xi’an, China, 2014. [Google Scholar]
- Shi, W.Z.; Tong, L.W.; Chen, Y.Y.; Li, Z.G.; Shen, K. Experimental study on influence of corrosion on behavior of steel material and steel beams. J. Build. Struct. 2012, 33, 53–60. [Google Scholar] [CrossRef]
- Xu, S.H.; Qiu, B. Experimental study of bearing performance of corroded h-type steel member subjected to eccentric compression. J. Exp. Mech. 2013, 28, 536–541. [Google Scholar] [CrossRef]
- Zheng, S.S.; Cheng, Y.; Wang, X.F.; Sun, L.B. Seismic vulnerability analysis of multi-age steel frame structures. Earthq. Eng. Eng. D 2014, 34, 207–217. [Google Scholar] [CrossRef]
- Zheng, S.S.; Zhang, X.H.; Wang, X.F.; Cheng, Y.; Zuo, Y. Experimental research and finite element analysis on aseismic behaviors of corroded steel frame columns. Eng. Mech. 2016, 33, 145–154. [Google Scholar]
- Zheng, S.S.; Zhang, X.H.; Huang, W.Z.; Zhao, X.R. Experimental research and finite element analysis on the seismic behavior of corroded plane steel frames under offshore atmospheric environment. Eng. Mech. 2018, 35, 62–73+82. [Google Scholar] [CrossRef]
- Teixeira, A.P.; Soares, C.G.; Netto, T.A.; Estefen, S.F. Reliability of pipelines with corrosion defects. Int. J. Pres. Ves. Pip. 2008, 85, 228–237. [Google Scholar] [CrossRef]
- Caleyo, F.; Gonzalez, J.L.; Hallen, J.M. A study on the reliability assessment methodology for pipelines with active corrosion defects. Int. J. Pres. Ves. Pip. 2002, 79, 77–86. [Google Scholar] [CrossRef]
- Amirat, A.; Mohamed-Chateauneuf, A.; Chaoui, K. Reliability assessment of underground pipelines under the combined effect of active corrosion and residual stress. Int. J. Pres. Ves. Pip. 2005, 83, 107–117. [Google Scholar] [CrossRef]
- Rajabipour, A.; Melchers, R.E. A numerical study of damage caused by combined pitting corrosion and axial stress in steel pipes. Corros. Sci. 2013, 76, 292–301. [Google Scholar] [CrossRef]
- Wang, H.J.; Zhang, Z.W.; Qian, H.L.; Song, G.; Wang, J.B.; Fan, F. On the axial bearing capability of construction steel tube considering the uniform corrosion effect. Indian J. Eng. Mater. S. 2020. (accepted). [Google Scholar]
- GB/T 50046-2018. Standard for Anticorrosion Design of Industrial Constructions; China Planning Press: Beijing, China, 2018. [Google Scholar]
- GB 50017-2017. Standard for Design of Steel Structures; China Architecture & Building Press: Beijing, China, 2017. [Google Scholar]
- EN 1993-1-1: 2005. Eurocode 3: Design of Steel Structures; CEN: Brussels, Belgium, 2005. [Google Scholar]
- ANSI/AISC 360-16. Specification for Structural Steel Buildings; American Institute of Steel Construction: Chicago, CA, USA, 2016. [Google Scholar]
Figure 1.
Details of specimens.
Figure 1.
Details of specimens.
Figure 2.
The tensile fracture morphology of specimens: (a) Dw = 0.00%; (b) Dw = 4.54%; and (c) Dw = 9.41%.
Figure 2.
The tensile fracture morphology of specimens: (a) Dw = 0.00%; (b) Dw = 4.54%; and (c) Dw = 9.41%.
Figure 3.
Test setup and instrumentation.
Figure 3.
Test setup and instrumentation.
Figure 4.
Experimental phenomena of the specimen C0-90: (a) elastic stage; (b) failure stage; and (c) rust peeling.
Figure 4.
Experimental phenomena of the specimen C0-90: (a) elastic stage; (b) failure stage; and (c) rust peeling.
Figure 5.
Experimental phenomena of the specimen C15-90: (a) elastic stage; (b) failure stage; and (c) rust peeling.
Figure 5.
Experimental phenomena of the specimen C15-90: (a) elastic stage; (b) failure stage; and (c) rust peeling.
Figure 6.
Load–strain curves of specimens: (a) C0-0; (b) C0-30; (c) C0-90; (d) C0-180; (e) C0-270; and (f) C0-360.
Figure 6.
Load–strain curves of specimens: (a) C0-0; (b) C0-30; (c) C0-90; (d) C0-180; (e) C0-270; and (f) C0-360.
Figure 7.
Load–strain curves of specimens: (a) C15-0; (b) C15-30; (c) C15-90; (d) C15-180; (e) C15-270; and (f) C15-360.
Figure 7.
Load–strain curves of specimens: (a) C15-0; (b) C15-30; (c) C15-90; (d) C15-180; (e) C15-270; and (f) C15-360.
Figure 8.
Load–strain curves of specimens: (a) C35-0; (b) C35-30; (c) C35-90; (d) C35-180; (e) C35-270; and (f) C35-360.
Figure 8.
Load–strain curves of specimens: (a) C35-0; (b) C35-30; (c) C35-90; (d) C35-180; (e) C35-270; and (f) C35-360.
Figure 9.
Load–axial displacement curves of specimens: (a) concentrically loaded; (b) eccentricity of 15 mm; and (c) eccentricity of 35 mm.
Figure 9.
Load–axial displacement curves of specimens: (a) concentrically loaded; (b) eccentricity of 15 mm; and (c) eccentricity of 35 mm.
Figure 10.
Relation between degradation of load carrying capacity and corrosion ratio.
Figure 10.
Relation between degradation of load carrying capacity and corrosion ratio.
Figure 11.
Relation between degradation of stiffness and corrosion ratio.
Figure 11.
Relation between degradation of stiffness and corrosion ratio.
Figure 12.
Relationship between δ and λ: (a) GB50017-2017; (b) EN 1993-1-1; and (c) ANSI/AISC 360-16.
Figure 12.
Relationship between δ and λ: (a) GB50017-2017; (b) EN 1993-1-1; and (c) ANSI/AISC 360-16.
Figure 13.
Relationship between δ and D/t: (a) GB50017-2017; (b) EN 1993-1-1; and (c) ANSI/AISC 360-16.
Figure 13.
Relationship between δ and D/t: (a) GB50017-2017; (b) EN 1993-1-1; and (c) ANSI/AISC 360-16.
Figure 14.
Comparison of the tested results and load carrying capacity predicted by using the section reduction method: (a) GB50017 – 2017; (b) EN 1993-1-1; and (c) ANSI/AISC 360-16.
Figure 14.
Comparison of the tested results and load carrying capacity predicted by using the section reduction method: (a) GB50017 – 2017; (b) EN 1993-1-1; and (c) ANSI/AISC 360-16.
Figure 15.
Comparison of the load carrying capacity of the specimens with one-sided corrosion and with two-sided corrosion: (a) GB50017 – 2017; (b) EN 1993-1-1; and (c) ANSI/AISC 360-16.
Figure 15.
Comparison of the load carrying capacity of the specimens with one-sided corrosion and with two-sided corrosion: (a) GB50017 – 2017; (b) EN 1993-1-1; and (c) ANSI/AISC 360-16.
Figure 16.
Relationship between δ and λ: (a) GB50017-2017; (b) EN 1993-1-1; and (c) ANSI/AISC 360-16.
Figure 16.
Relationship between δ and λ: (a) GB50017-2017; (b) EN 1993-1-1; and (c) ANSI/AISC 360-16.
Figure 17.
Relationship between δ and D/t: (a) GB50017-2017; (b) EN 1993-1-1; and (c) ANSI/AISC 360-16.
Figure 17.
Relationship between δ and D/t: (a) GB50017-2017; (b) EN 1993-1-1; and (c) ANSI/AISC 360-16.
Table 1.
Geometric parameters and test results of specimens.
Table 1.
Geometric parameters and test results of specimens.
| Specimen ID | D/mm | t/mm | e/mm | T/d | W0/kg | W1/kg | Dw/(%) | N′t/kN | ΨN/(%) | k′y/(×107 N/m) | Ψk/(%) | μ |
|---|
| C0-0 | 89.82 | 4.07 | 0 | 0 | 9.02 | 9.02 | 0 | 391.5 | — | 13.73 | — | 1.59 |
| C0-30 | 89.74 | 4.28 | 0 | 30 | 9.41 | 8.96 | 4.78 | 377.9 | 3.47 | 13.09 | 4.63 | 1.35 |
| C0-90 | 89.10 | 4.44 | 0 | 90 | 9.44 | 8.87 | 6.04 | 363.8 | 7.08 | 12.12 | 11.71 | 1.47 |
| C0-180 | 89.00 | 4.24 | 0 | 180 | 8.83 | 7.59 | 13.99 | 313.3 | 19.97 | 11.27 | 17.92 | 1.62 |
| C0-270 | 89.06 | 4.01 | 0 | 270 | 8.65 | 7.15 | 16.81 | 295.6 | 24.50 | 10.28 | 25.13 | 1.47 |
| C0-360 | 89.30 | 4.15 | 0 | 360 | 8.48 | 6.77 | 20.22 | 316.8 | 19.08 | 11.12 | 19.02 | 1.75 |
| C15-0 | 89.80 | 4.01 | 15 | 0 | 8.90 | 8.90 | 0 | 239.8 | — | 9.72 | — | 4.45 |
| C15-30 | 89.36 | 3.98 | 15 | 30 | 8.77 | 8.45 | 3.65 | 238.1 | 0.71 | 9.36 | 3.66 | 3.83 |
| C15-90 | 89.04 | 4.1 | 15 | 90 | 8.54 | 7.97 | 6.67 | 217.8 | 9.17 | 9.39 | 3.40 | 4.39 |
| C15-180 | 89.02 | 4.2 | 15 | 180 | 8.50 | 7.38 | 13.23 | 191.6 | 20.10 | 7.25 | 25.42 | 3.24 |
| C15-270 | 89.20 | 4.18 | 15 | 270 | 8.49 | 6.89 | 18.85 | 191.7 | 20.06 | 7.28 | 25.10 | 2.80 |
| C15-360 | 89.22 | 4.12 | 15 | 360 | 8.42 | 6.76 | 19.66 | 181.3 | 24.40 | 8.18 | 15.82 | 5.01 |
| C35-0 | 89.60 | 3.86 | 35 | 0 | 8.73 | 8.73 | 0 | 152.4 | — | 6.39 | — | 7.17 |
| C35-30 | 89.78 | 4.03 | 35 | 30 | 8.97 | 8.65 | 3.56 | 166.7 | −9.38 | 6.20 | 2.98 | 6.62 |
| C35-90 | 89.84 | 4.43 | 35 | 90 | 9.01 | 8.52 | 5.49 | 170.5 | −11.88 | 6.02 | 5.81 | 6.11 |
| C35-180 | 89.08 | 4.41 | 35 | 180 | 8.65 | 7.16 | 17.17 | 143.1 | 6.10 | 4.96 | 22.49 | 5.71 |
| C35-270 | 89.60 | 3.93 | 35 | 270 | 8.58 | 7.12 | 17.12 | 140.5 | 7.81 | 5.00 | 21.80 | 7.58 |
| C35-360 | 89.16 | 4.07 | 35 | 360 | 8.52 | 6.72 | 21.12 | 133.8 | 12.20 | 4.28 | 33.03 | 5.77 |
Table 2.
Tested mechanical properties of steel.
Table 2.
Tested mechanical properties of steel.
| Group ID | Dw/(%) | E/(×105 MPa) | fy/MPa | fu/MPa | ψ/(%) |
|---|
| A1 | 0.00 | 2.02 | 330.43 | 467.00 | 31.47 |
| A2 | 2.42 | 1.95 | 332.29 | 479.03 | 35.64 |
| A3 | 3.11 | 1.96 | 303.51 | 481.71 | 32.47 |
| A4 | 4.54 | 1.98 | 329.17 | 449.65 | 31.03 |
| A5 | 9.41 | 1.81 | 299.16 | 418.33 | 22.94 |
| A6 | 9.74 | 1.80 | 286.97 | 431.09 | 27.62 |
| A7 | 11.35 | 1.71 | 288.40 | 395.46 | 25.39 |
Table 3.
Analysis results of specimens by using section reduction method and material degradation method.
Table 3.
Analysis results of specimens by using section reduction method and material degradation method.
| Specimen ID | Nt/kN | GB 50017-2017 | EN 1993-1-1 | ANSI/AISC 360-16 |
|---|
| Ncs/kN | Ncm/kN | Ncs/kN | Ncm/kN | Ncs/kN | Ncm/kN |
|---|
| C0-0 | 391.5 | 341.5 | 341.5 | 342.8 | 342.8 | 302.4 | 302.4 |
| C0-30 | 377.9 | 339.8 | 338.8 | 341.1 | 340.0 | 300.8 | 299.9 |
| C0-90 | 363.8 | 344.0 | 342.7 | 345.2 | 343.9 | 304.3 | 303.2 |
| C0-180 | 313.3 | 299.8 | 296.6 | 300.8 | 297.6 | 265.2 | 262.4 |
| C0-270 | 295.6 | 275.0 | 271.0 | 275.9 | 272.0 | 243.3 | 239.8 |
| C0-360 | 316.8 | 272.7 | 267.7 | 273.6 | 268.7 | 241.2 | 236.9 |
| C15-0 | 239.8 | 203.1 | 203.1 | 222.3 | 222.3 | 193.5 | 193.5 |
| C15-30 | 238.1 | 192.4 | 191.9 | 210.5 | 210.0 | 183.3 | 182.9 |
| C15-90 | 217.8 | 190.0 | 189.2 | 207.8 | 207.0 | 181.1 | 180.3 |
| C15-180 | 191.6 | 179.8 | 178.0 | 196.6 | 194.7 | 171.3 | 169.7 |
| C15-270 | 191.7 | 167.4 | 164.8 | 183.0 | 180.2 | 159.5 | 157.0 |
| C15-360 | 181.3 | 163.6 | 160.8 | 178.8 | 175.9 | 155.8 | 153.2 |
| C35-0 | 152.4 | 130.3 | 130.3 | 146.2 | 146.2 | 129.9 | 129.9 |
| C35-30 | 166.7 | 130.8 | 130.6 | 146.8 | 146.5 | 130.4 | 130.1 |
| C35-90 | 170.5 | 139.5 | 139.0 | 156.4 | 156.0 | 139.0 | 138.6 |
| C35-180 | 143.1 | 119.0 | 117.5 | 133.3 | 131.6 | 118.6 | 117.1 |
| C35-270 | 140.5 | 108.7 | 107.2 | 121.9 | 120.2 | 108.3 | 106.8 |
| C35-360 | 133.8 | 105.6 | 103.6 | 118.2 | 116.1 | 105.2 | 103.2 |
© 2020 by the authors. Licensee MDPI, Basel, Switzerland. This article is an open access article distributed under the terms and conditions of the Creative Commons Attribution (CC BY) license (http://creativecommons.org/licenses/by/4.0/).


