Abstract
High impact and strong noise complicate the response of reciprocating compressor (RC). It requires a complex signal processing method that is a single response-based or excitation-based fault diagnosis method applied to RC valve leakage fault diagnosis. This paper proposes a quantitative diagnosis method of RC valve leakage that is based on system characteristic diagnosis method. First, the current signal of the RC induction motor and the cylinder vibration signal are introduced as the excitation and response signals, the mathematical model of the RC motor current is established, and the influence mechanism of the valve leakage on the RC vibration is analyzed. Subsequently, the ensemble empirical mode decomposition and comb filter are respectively used to extract the fault characteristic information of excitation signal and response signal to obtain the excitation condition indicators (CIs), response CIs, and system CIs. Finally, the support vector machine based on the obtained CIs classified the valve leakage failure patterns of different severity, and a fault diagnoser was constructed for the quantitative diagnosis of valve leakage fault. The results of experiment and application proved that the proposed method could realize the quantitative diagnosis of RC valve leakage fault while using simple signal processing technology.
1. Introduction
Reciprocating compressors (RCs) are widely used in the petrochemical, refrigeration, and gas transportation industries [1,2,3]. The valve is the core part of RC, which determines the stable and efficient operation, and it is one of the most easily damaged parts in RC. Therefore, an effective and accurate valve fault detection method can improve the operation reliability of the RC, reduce the occurrence of accidents, and reduce the downtime and cost of the RC [4,5].
The fault diagnosis method (FDM) of RC is mainly developed from the FDM of rotating machinery. For example, the wavelet transform, which is widely used in rotating machinery, has been well applied to the fault diagnosis of internal combustion engines [6,7,8]. As one of the most commonly used FDM, vibration-based pattern recognition method has attracted significant attention in the field of rotating equipment fault diagnosis. However, the vibration characteristics of RC have non-linear, non-stationary, and multi-component coupling factors [3,9], which pose challenges for RC fault diagnosis. Generally, the FDM of RC can be divided into three categories: model-based, data-driven, and a combination of the two [2,10,11].
The model-based FDM creates a mathematical model of the RC system or fault characteristics. The thermodynamic model [12], FSI model [13], and hybrid numerical model [14,15] of the RC have been studied, and successively established a variety of mechanism model of the RC system fault. However, the establishment of RC system model requires very complex calculation and profound theoretical knowledge, which is difficult for most researchers. The data-driven method is based on the response data of the sensors, and it uses various algorithms to obtain the hidden information in the data for fault diagnosis. The diagnosis effect of data-driven method mainly depends on the quantity and quality of data and the conditions of collecting data, and it has low requirements for experience knowledge and fault mechanism. Therefore, it has been actively studied in the field of RC fault diagnosis, among which local mean decomposition [1,16], deep confidence network and back-propagation neural network [17,18,19], support vector machine (SVM) [9,20], k approximate regression [18,21], Bayesian estimation algorithm [10,22], big data [23], and other technologies have been successfully applied. The method of combining model and data-driven is to diagnose the system fault by fusing the system operation data with the system fault model. Gu F.S. et al. [24,25,26] established the induction motor current model and combined with the modulation signal bispectrum method to realize the fault diagnosis of gear and RC. Wang Y.F. et al. [27] proposed the method of combining the kinematic model of valve with acoustic emission signal to diagnose the leakage fault of the RC valve. When compared with model-based and data-driven methods, the method of combining the two can achieve a better diagnosis effect. However, presently, this method has relatively few applications in the RC valve leakage fault. This paper will serve as a successful application to this method.
The quality and type of data is the key to data-driven FDM. The scientific test-rig, reliable sensors, and reasonable experimental conditions can guarantee the quality of data. The data types of data-driven method can be divided into single signal and multi-signal fusion. Single signal, such as vibration signal [3,18,28,29,30], acoustic signal [31,32,33,34], current signal [24], [25], temperature signal [21], pressure signal [35], and instantaneous phase signal [36], etc., have been successfully applied to RC fault diagnosis. Although good diagnosis results have been achieved, the difficulty of data processing is increased because of the singleness of signal and the few effective fault features. Therefore, the FDM of multi-signal fusion has attracted the attention of scholars. Elhaj and Gu F.S. [37] developed a new numerical simulation method to monitor the RC valves status while using the instantaneous angular speed (IAS) of crankshaft and cylinder pressure. A modular fault diagnosis and prediction method of hydraulic valve system based on multi-sensor data redundancy was proposed in [10]. G. Qi et al. [23] used big data and machine learning methods to identify and classify RC faults based on multi-signal such as vibration, temperature, and displacement. V.T. Tran et al. proposed an approach to fault diagnosis of RC valves while using Teager–Kaiser energy operator and deep belief networks based on vibration, pressure, and current signals [38]. Although these studies make up for the singleness of signal, the lack of correlation between multiple signals makes it necessary to consider the fusion of different signals, which increases the difficulty of the signal processing methods.
This paper proposes a quantitative diagnosis method of RC valve leakage based on system characteristics. The current signal and vibration signal are used as the excitation signal and the response signal, respectively. The excitation and response signals have a natural system transfer relationship, which can maximize the potential of the signal. Therefore, the problem of a small amount of information in a single signal is solved, and the problem of multi-signal coupling is avoided. Additionally, the mathematical model of the RC motor current was established, which constitutes a fault diagnosis method that combines model and data-drive, and it can reduce the performance requirement of signal processing method. In addition, the diagnosis object can be regarded as a “black box”, without the need for detailed parameters inside the diagnosis object, which greatly reduces the impact of modeling difficulties on the diagnosis effect [39].
The ensemble empirical mode decomposition (EEMD) algorithm maintains the adaptive decomposition of the empirical mode decomposition (EMD) and overcomes the endpoint effect and mode aliasing effect of EMD [40,41]. However, the selection of the intrinsic mode function (IMF) is still a problem to be solved [42,43]. The optimal IMFs are selected to reconstruct the excitation signal, and the kurtosis, RMS, and correlation coefficient are calculated as the excitation condition indicators (CIs), according to the side frequency effect of the current signal and the rotational frequency effect of the RC. The vibration signal of RC is periodic, and accompanied by the frequency doubling component. The comb filter is composed of a number of passbands and stopbands arranged at a certain frequency interval, only allowing signals of certain frequency range to pass, and it is a good tool for extracting faulty characteristic information [44,45,46]. By using comb filter and setting appropriate basic frequency and bandwidth, the energy spectrum values of RC rotational frequency component and its two-fold and three-fold frequency components contained in vibration signal were extracted as the CIs of the response. SVM has unique advantages for solving small samples, nonlinearity, and high dimension classification problems [47,48], and it has good robustness and generalization ability [49,50]. Based on the CIs of excitation, response, and system, the SVM was used to conduct the contrast experiment of different fault pattern. At the same time, on the basis of classification, a “three - regions, four-point sets” fault diagnoser was constructed to quantitatively diagnose for different severity of RC valve leakage.
The rest of this paper is organized, as follows. Section 2 presents a framework of the proposed method, established the RC motor current model, and analyzed the influence mechanism of valve leakage on RC vibration. Section 3 introduces the experimental test-rig and conditions of data collection. The failure characteristics of excitation signal and response signal are analyzed, and the CIs are extracted in Section 4. The pattern recognition and quantitative diagnosis of RC valve leakage fault are performed in Section 5. Finally, Section 6 addresses the conclusions of this paper.
2. Fault Diagnosis Method Based on System Characteristics
This paper proposed a quantitative diagnosis method of RC valve leakage fault that is based on system characteristics and Figure 1 shows the framework of the method. Taking the motor current signal as the excitation signal and the vibration signal as the response signal, the influence of the valve leakage on the response and excitation was comprehensively analyzed. The method combined model and data-driven to quantitatively diagnose the RC valve fault from the perspective of system characteristics. Focusing on the significant fault features and the correlation in excitation and response signals, the simple signal processing methods can achieve the quantitative diagnosis effect of RC valve leakage.
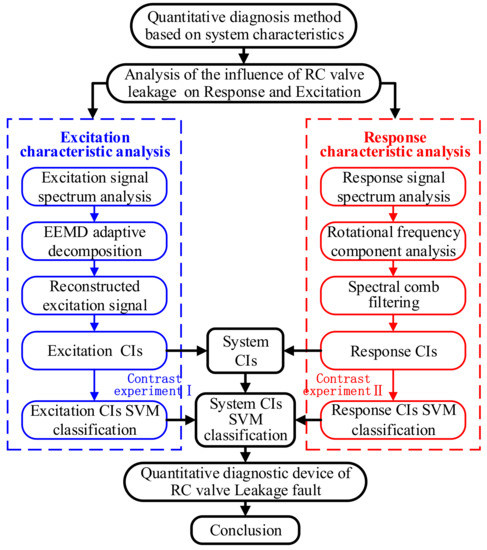
Figure 1.
Quantitative diagnosis method of reciprocating compressors (RC) valve failure based on system characteristics.
2.1. Mechanism Analysis of the Influence of Valve Leakage on the RC
Based on the construction and working process, a two-stage and single acting RC can be represented, as in Figure 2. It consists of four parts: an induction motor, a reciprocating compressing unit, a compressed air storage tank, and safe-assistant device.
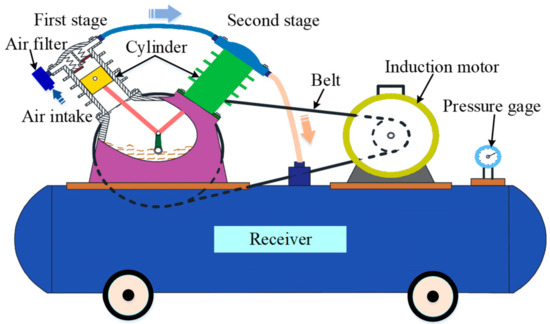
Figure 2.
Structure diagram of RC.
The piston makes reciprocating motion in the compression cylinder under the joint action of the connecting rod, the crankshaft, the pulley, the belt, and the motor, which constitutes the working process of RC. During the movement of the piston from the top dead center (TDC) to the bottom dead center (BDC), the pressure in the piston cylinder gradually decreases, which causes the suction valve to gradually open and the discharge valve to gradually close. When the piston moves to the vicinity of the BDC, the suction valve is fully opened, the discharge valve is completely closed, and the expansion and suction process of the RC are completed, as shown in Figure 3b. At the moment when the valve is fully opened or closed, it will hit the valve body to generate the impact. During the movement of the piston from the BDC to the TDC, the pressure in the piston cylinder gradually increases, thus causing the suction valve to gradually close and the discharge valve to gradually open. When the piston moves to the vicinity of the TDC, the suction valve is completely closed, and the discharge valve is fully opened, completing the compression and discharge process of RC, as shown in Figure 3a.
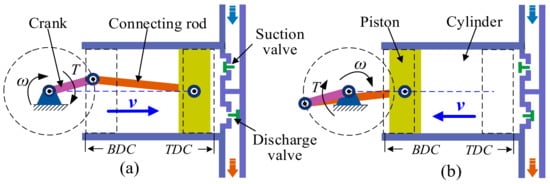
Figure 3.
Schematic diagram of RC working process; (a) Positive stroke, and (b) Negative stroke.
When the RC suction valve leaks, the pressure difference between the piston cylinder and the intake pipe decreases, which causes the suction valve to not fully open or close, thus reducing the impact of the suction valve on the valve body. When the RC discharge valve leaks, the pressure difference between the piston cylinder and the exhaust pipe decreases, which causes the discharge valve to not completely close or open, reducing the impact of the discharge valve on the valve body. At the same time, the peak pressure in the cylinder will be reduced due to the existence of leakage, thus resulting in the crank torque reduction, that is, the load on the motor is reduced. Therefore, the motor speed will increase, which will lead to an increase in the rotation frequency of the RC.
In summary, the valve leakage will reduce the energy of the impact component in the RC response signal, and increase the frequency of the impact. In addition, the leakage of the valve will increase the fluctuation frequency of the current signal since the load on the motor is positively correlated with the motor current. Therefore, the response and excitation signals will all contain RC valve leakage fault information, and both have some correlation.
2.2. The Model of RC Motor Current and Excitation Signal Selection
The stator current signal of induction motor is the most important excitation signal of RC system, and it is closely related to the valve leakage. Moreover, the stator current signal can be directly measured from the motor supply wire. Therefore, the stator current signal of the motor is used as the excitation signal in this paper.
This paper takes the A phase, one of the three phases of the power supply system, as an example to study the electromagnetic relationship of the current, ignoring the higher harmonics, in order to study the motor current signal characteristics. The phase A current and magnetic flux of the motor under normal equipment can be expressed [24,51], as Equations (1) and (2).
The electromagnetic torque that is generated by the interaction of current and magnetic flux is as shown in Equation (3).
, represent the RMS amplitude of the supply current and the magnetic flux, respectively. , is the phase of the current and the flux with respect to the power supply. is the fundamental frequency of the power supply and P is the number of pole pairs of the motor.
When the motor drive equipment fails, the system will generate an additional fluctuating torque. The motor will generate an electric torque to balance the fluctuating torque [24,52]. Assume that the fluctuating torque is a sine wave, with a frequency of , the corresponding current amplitude and phase angle are and , respectively. Afterwards, the fluctuating torque expression can be expressed by Equation (4).
This oscillating torque causes speed fluctuations, according to the motor torque balance equation, and the fluctuation speed can be derived as Equation (5), so that the fluctuation of the angle can be expressed [24] as in Equation (6).
where, J is the inertia the rotor system. The change of angle leads to the phase modulation to the magnetic flux [24,52], so Equation (2) can be expressed as:
where . The flux produces a nonlinear effect that produces a corresponding electromagnetic force, thus generating a nonlinear current signal in the stator. The flux now can be explicitly simplified and examined in three components [24]:
Equation (8) shows that the fluctuating magnetic flux contains not only the fundamental frequency component, but also the two sidebands on both sides of the fundamental frequency. The current of the motor can be obtained [24,52] based on the motor equivalent circuit.
where represents the phase of the equivalent circuit impedance, and and are the RMS of the upper and lower side frequency components of the current. They are the currents caused by the back electromotive voltage that is generated by the changes in the flux frequencies and , respectively. This simplified current signal model is widely used in the fault diagnosis of electric motors and their driving equipment [24,25,26,53].
RCs have two basic working processes: suction and discharge. Among them, the gas is compressed during the process of discharging, and the piston needs to have a larger thrust [37]. Therefore, the driving motor generates a cyclically varying load during operation, thus resulting in high frequency oscillation of the motor current signal. According to Equation (9), the measured RC motor current signal can be expressed [24] as in Equation (10). and represent angular displacements of the upper and lower side frequencies, respectively.
Figure 4 is a time-frequency domain waveform of the 2 mm leakage valve current signal that is collected by the test bench in this paper. This figure shows that the maximum energy of 50.18 Hz represents the power supply component, which is the fundamental frequency of the current signal. The side frequencies on both sides (50.18 ± 15.36 Hz) characterize the fluctuation of the working condition of the RC, and they contain the fault characteristic information. The rest is the higher harmonics of the power component. The offset of the side frequency is closely related to the rotation frequency of the RC, from which the valve fault characteristic can be analyzed.
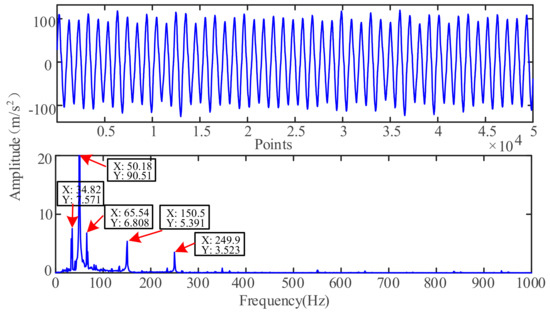
Figure 4.
Time-frequency domain waveform of excitation signal of 2 mm leakage valve.
2.3. Response Signal Selection
RC has a variety of response signals, such as: vibration signals, pressure signals, acoustic emission (AE) signals, temperature signals, and IAS signals et al. Among them, the pressure signal and temperature signal cannot be measured outside the RC, so it is necessary to remould the RC cylinder structure and embed the sensor for measurement. The fault characteristics will be adversely affected due to the damage to the original structure of the cylinder. The use of AE and IAS signals requires the sensors to have higher sensitivity and measurement accuracy. Additionally, the signal processing methods for IAS are less than those for the vibration signal. Moreover, vibration signal is easily obtained and most widely used in fault diagnosis.
The number of impacts whose amplitude exceeds 200 in Figure 5a is significantly greater than that in Figure 5b, and the periodicity of the signal waveform in Figure 5a is more obvious than that in Figure 5b, as shown in Figure 5. The vibration signal not only contains a wealth of fault features, but also maintains a system transfer characteristic relationship with the current signal. Therefore, this paper adopts vibration signal as a response signal to analyze the response characteristics of RC valve fault.
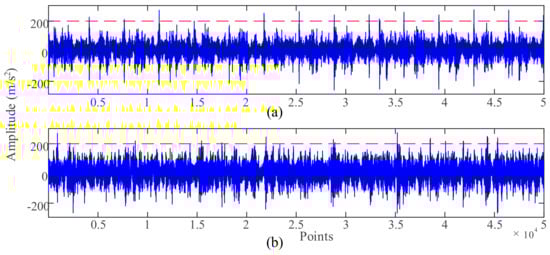
Figure 5.
Time-domain waveform of response signal; (a) normal valve, (b) 2 mm leakage valve.
3. Experimental Test-Rig and Data Acquisition
A RC valve leakage fault test rig was designed to study the quantitative diagnosis method of RC valve failure based on system characteristics diagnosis technology. Additionally, three different severities of exhaust valve leakage faults were simulated for comparative experiments.
3.1. Experimental Test-Rig Design
The test-rig that was designed in this paper consisted of a two-stage single-acting reciprocating air compressor, sensors, and data acquisition system, as shown in Figure 6. Among them, the acceleration vibration sensor has a sensitivity of 50 , a frequency response of , and it is mounted on the root of piston cylinder body, as shown in the A view of Figure 6. The current clamp has an accuracy of and a conversion ratio of , which is clamped to the power supply wire of the AC motor. The experimental speed of the air compressor crankshaft is 900 r/min, and the maximum pressure that the RC can provide is 1.6 MPa.
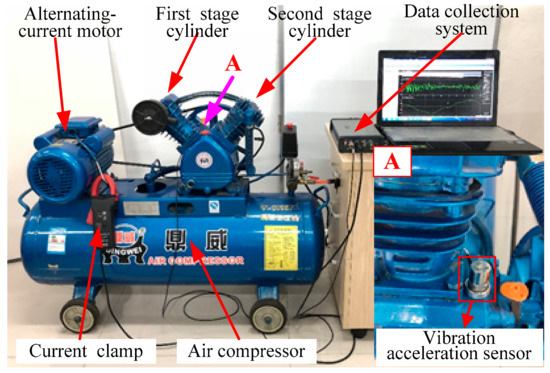
Figure 6.
Experimental test-rig for RC valve failure.
3.2. Data Collection
The training sample data are provided for the study of the pattern recognition and quantitative diagnosis method based on the system characteristic. Three different severity leakage faults of discharge valve are designed in this paper. A circular hole with diameters of 2 mm, 6 mm, and 8 mm is machined on the normal valve to simulate different severity leakage faults of the valve, as shown in Figure 7. Data are collected when the RC pressure reaches 1.0 MPa, and the vibration signal and the current signal are simultaneously collected, to improve the reliability of the data. In this experiment, three groups of discharge valve leakage experiments and a group of normal valve test were carried out. The sampling frequency was set to 51.2 kHz and the sampling time was 30 s.
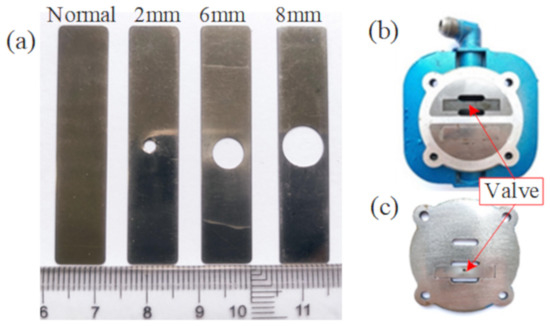
Figure 7.
Simulated leakage fault valve; (a) valves, (b) Upper valve body, and (c) Lower valve body.
4. Feature Extraction of RC Valve Fault
Four groups of vibration and current signals data of the RC were collected under the condition of discharge valve with normal, 2 mm leakage, 6 mm leakage, and 8 mm leakage. Based on these data, the feature extraction of RC valve leakage fault was performed from the perspectives of excitation and response characteristics, respectively.
4.1. Fault Characteristics Analysis of Excitation Signal
4.1.1. Spectrum Analysis of Excitation Signal
Figure 8 shows the frequency-domain waveform of each group of the current signals. This figure shows that the current signal contains the motor power supply component (50.18 Hz) with the largest energy, the side frequency component, and a large number of higher harmonics.
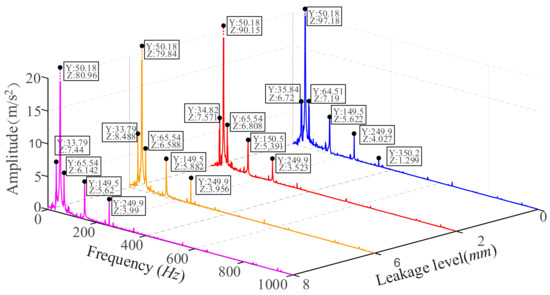
Figure 8.
Frequency-domain waveform of RC current signals with different leakage levels.
Taking the 2 mm leakage fault as an example, the fundamental frequency of 50.18 Hz represents the power supply component, and the both sides frequency (50.18 ± 15.36 Hz) represents the fluctuation of RC working status, which contains fault feature information. 150.5 Hz and 249.5 Hz are the third and fifth harmonics of power supply component, respectively. 15.36 Hz represents the working frequency of the RC, that is, the rotating frequency of the crankshaft. Being affected by the valve leakage, the rotating frequency of the RC is increased by 0.36 Hz when compared with the preset rotating frequency of 15 Hz, which is consistent with the actual analysis trend.
4.1.2. Excitation Signals EEMD and Selection of IMFs
The side frequency component of the current signal is the primary carrier for the failure characteristics of the RC valve. The power supply component and its higher harmonic will weaken the features of the side frequency component, which should be eliminated as much as possible. In this paper, EEMD is used to decompose the excitation signal to extract the side frequency component and other related components. After EEMD decomposition, 16 IMFs were obtained from each group of data and the spectrum of 16 IMFs was analyzed. The IMFs spectrum is shown in Figure 9, taking 6 mm leakage fault as an example.
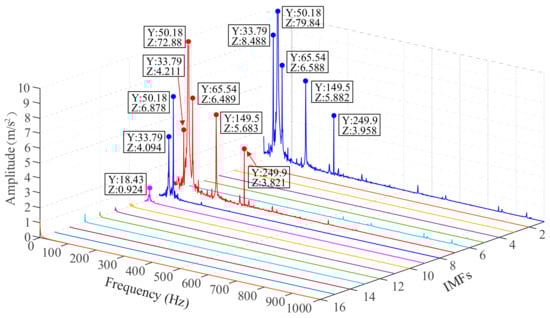
Figure 9.
Intrinsic mode functions (IMFs) spectrum of 6mm leakage fault data.
In Figure 9, IMF1 is the original current signal and IMF7 is very similar to the original current signal, including a strong power component and higher harmonic component, which is not conducive to the analysis of fault characteristic. IMF8 contains a significant sideband component, and 33.79 Hz is a single-side frequency component generated by RC operation and fault impact. Additionally, there are components that are related to the rotation frequency in IMF9, and 18.43Hz is the rotation frequency related component that is generated by the operation frequency of the RC.
Therefore, IMF8 and IMF9 of each group of IMFs were extracted for energy spectrum analysis, and the analysis results are shown in Figure 10. This figure shows that the IMF8 and IMF9 of each set of data all contain single side frequency components and rotation frequency related components. Moreover, IMF8 and IMF9 have no obvious harmonic components. Hence, the IMF8 and IMF9 of the current signal was used to reconstruct the excitation signal.
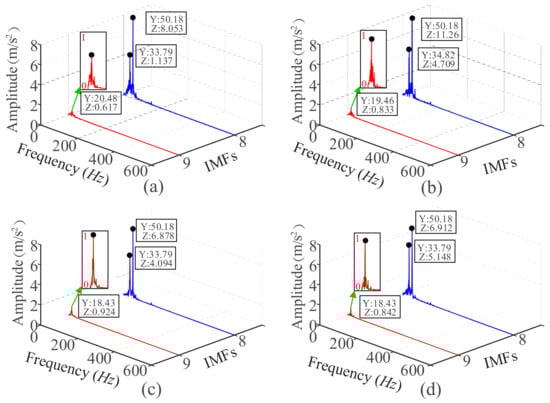
Figure 10.
Frequency-domain waveform of IMF8 and IMF9; (a)–(d) represent normal valve, 2 mm leakage, 6 mm leakage, and 8 mm leakage valve, respectively.
4.1.3. Extraction of Excitation CIs
The excitation CIs used in this paper are as follows:
The root mean square (RMS) is the square root of the mean value of the sum of squares of the sample signal, which reflects the amplitude and energy of the signal in the time domain.
Kurtosis (K) is the normalized fourth-order center distance of the sample data, which reflects the distribution characteristics of the data and it is particularly sensitive to shock signals. The formula is defined, as follows:
The correlation coefficient (CC) is used to characterize the degree of correlation between two data sets. The value range of CC is −1 to 1. The closer to 1 or −1, the stronger the correlation. The formula is defined, as follows:
where, , , represent sample data, number of samples, and mean value, respectively.
In this paper, CC is calculated by leaking valve data and normal valve data, and CC is processed by taking absolute value ().
From each group of data, 50,000 data were taken and divided into 50 parts, and EEMD decomposition was performed, respectively. The K, RMS, and CC are calculated while using the signals reconstructed by the IMF8 and IMF9 of each group. Table 1 shows the calculated excitation CIs of each group, and the number of each CI for each set of data is 50. The LL denotes the leakage level.

Table 1.
Excitation condition indicators (CIs).
From the CIs in Table 1, it can be roughly seen that, as the degree of valve leakage increases, the K and CC show a decreasing trend. The trend of the CI that is calculated by the experiment is consistent with the trend of the CI of the theoretical analysis.
4.2. Fault Characteristics Analysis of Response Signal
4.2.1. Spectrum Analysis of Response Signal
Figure 11 shows the frequency-domain waveforms of each group of vibration signals. Among them, , , , and , respectively, represent the rotation frequency of RC under the conditions of normal, 2 mm leakage, 6 mm leakage, and 8 mm leakage of the valve.
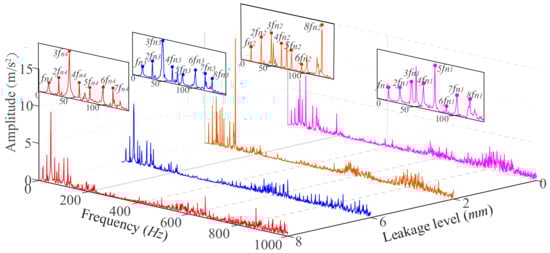
Figure 11.
Frequency-domain waveform of response signal.
In Figure 11, , , , and , it shows that the rotation frequency of the RC increases with the aggravation of valve leakage fault. During the actual operation of the RC, the pressure in the cylinder is reduced, due to the presence of the leak, which results in the reduction of the torque of the crankshaft, so that the rotational speed of the crankshaft is increased. The frequency spectrum of vibration signal contains a large number of frequency doubling of rotation frequency, and the frequency doubling will fluctuate when the rotation frequency changes. Therefore, the characteristic information of valve failure can be extracted from the rotation frequency and its frequency doubling of RC.
4.2.2. Extraction of Response CIs
The characteristic information of valve leakage is included in the rotation frequency and its frequency doubling components of RC. The high multiple frequency component is produced by rotor unbalance, which is less affected by the rotation frequency features and it contains fewer effective fault information. Therefore, it is difficult to extract fault features information from the high multiple frequency component. Thus, this paper only uses the one-fold, two-fold, and three-fold frequency components to extract fault feature information, and it ignores the high multiple frequency components.
The energy spectrum amplitude of the one-fold, two-fold, and three-fold frequency components of the rotation frequency are used as the response CIs. Taking one million data from each group and divided into 50 parts to conduct spectral analysis on each part. Additionally, the comb filter is used to obtain the response CIs from the spectrum of the response signal. Table 2 shows the response CIs.
Table 2.
Response CIs.
In Table 2, the number of each CI is 50. ERF, EDRF, and ETDF denote the energy spectrum value corresponding to one-fold, two-fold, and three-fold rotation frequency, respectively.
5. Pattern Recognition and Quantitative Diagnosis
Based on the extracted CIs, the pattern recognition and quantitative diagnosis of RC valve leakage fault was carried out from the perspectives of excitation, response, and system characteristics, respectively.
5.1. Pattern Recognition of RC Valve Leakage
After extracting CIs, they need to be classified to identify different fault modes. SVM is a powerful classification technology that is based on statistical learning theory [47,48]. SVM was originally introduced as a generalized linear classifier of binary classification. Its decision boundary is the maximum-margin hyperplane solved for learning samples, which is eventually transformed into a convex quadratic programming problem. Consider that are classification samples, and are classification labels. The optimization problem can be formulated, as follows:
where ω is a normal vector to the hyperplane and is a penalty factor. are slack variables. Function is a feature mapping rule, which is determined by the kernel function. The most widely used radial basis function (RBF) is selected as the kernel function of the SVM algorithm in this study [47]. The expression of the function is shown as in Equation (15).
The one-against-all method was used to train the SVM. While classifying different fault modes with SVM, a “three-regions and four-point sets” fault diagnoser was constructed to realize the quantitative diagnosis of different severity of valve leakage.
5.1.1. Contrast Experiment I: Fault Pattern Recognition Based on Excitation CIs
The K, RMS, and CC of the excitation signals of each group were pairwise combined as the two-dimensional feature indicators of the training SVM. The purpose of the training is to classify different RC failure modes based on the excitation CIs, and compare them with those that are based on the system CIs.
Firstly, the corresponding CIs of normal valve, 2 mm leakage valve, 6 mm leakage valve, and 8 mm leakage valve were respectively numbered as 1, 2, 3, and 4. Secondly, each group of CIs and their class labels were used for SVM training to generate an SVM trainer. Afterwards, various CIs with not assigned the class label were put into the SVM trainer to classify, and the classification effect is shown in Figure 12.
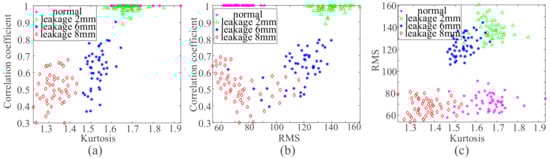
Figure 12.
SVM classification effect based on excitation CIs; (a–c) are the classification effect of K and CC, RMS and CC as well as K and RMS as characteristic indicators, respectively.
None of the three excitation CIs can completely classify the valve features of the four statuses, as shown in Figure 12. In Figure 12a, the normal valve is not separated from the 2 mm leakage valve. There are some feature points crossing each other between 6 mm and 8 mm leakage valve, and the distribution of feature points is relatively scattered, which is not conducive to feature classification, as in Figure 12b. Although, the four valve faults are not completely separated, and there are individual points that cross together in Figure 12c. However, the distribution of characteristic points is relatively concentrated, which is beneficial to classification.
5.1.2. Contrast Experiment II: Fault Pattern Recognition Based on Response CIs
In order to prove the performance of fault mode classification that is based on system characteristics, it is necessary to compare it with the result of fault mode classification while using response CIs.
Firstly, the ERF, EDRF, and ETRF of each group data were taken as the two-dimensional characteristic indicators of SVM classification, and the CIs of the four groups data were assigned class labels 1, 2, 3, and 4, respectively. Subsequently, each group of CIs and corresponding class labels are taken for SVM training. After that, all kinds of CIs were put into the trained SVM for classification, and Figure 13 shows the classification effect.
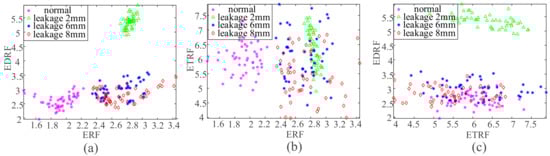
Figure 13.
SVM classification effect of response Cis; (a–c) are the classification effect of ERF and EDRF, ERF and ETRF as well as ETRF and EDRF as characteristic indicators, respectively.
The classification effect illustrated in Figure 13 shows that SVMs that are based on response CIs cannot completely separate the faults of different modes. Among them, in Figure 13a, the 6 mm and 8 mm leakage valves are not completely separated. In Figure 13c, only the 2 mm leakage valve is separated. The SVM classification effect that is based on ERF and EDRF is better than those based on the ERF and ETRF, and EDRF and ETRF, which further verifies that the low-multiple rotation frequency component contains more fault feature information.
5.1.3. Pattern Recognition Based on System CIs
Contrast experiment I and contrast experiment II show that both response-based and excitation-based pattern recognition cannot effectively classify the failure modes of RC valve while using simple signal processing methods. The system-based diagnostic method proposed in this paper exerts the system transfer characteristic relationship between excitation and response. The indicators that can best characterize the fault characteristics in response and excitation were extracted as the system CIs to identify the fault pattern of RC valve. The K and RMS of excitation CIs and the ERF and EDRE of response CIs were selected as system CIs to classify different RC valve fault nodes. Figure 14 shows the classification effect.
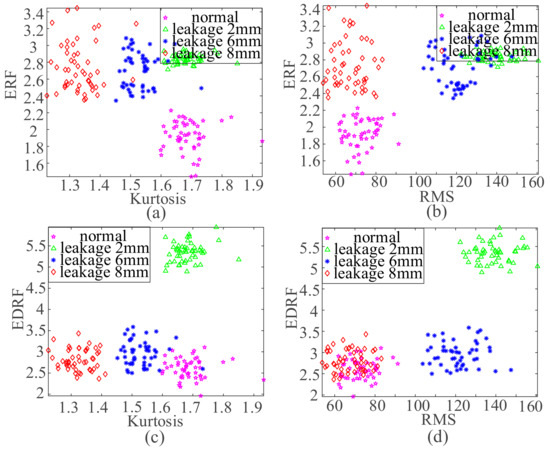
Figure 14.
SVM classification effect of system Cis; (a–d) are the classification effect of K and ERF, RMS and ERF, K and EDRF as well as RMS and EDRF as characteristic indicators, respectively.
It can be seen from Figure 14 that the classification effect of using K and ERF, EDRF on fault modes is better than that of using RMS and ERF, EDRF. In Figure 14b,d, RMS and ERF, EDRF do not completely separate the different RC fault modes. Although the four types of feature points in Figure 14a,c are separated, the data points in Figure 14c are more concentrated. Therefore, K and EDRF have a better classification effect on faults.
The comparative experimental analysis results proved the superiority of the diagnosis method that is based on system characteristics. The system-based diagnostic method can extract richer and more comprehensive fault information, has lower requirements on the complexity of data processing methods, and is more suitable for online fault diagnosis.
5.2. Quantitative Diagnostic
5.2.1. Quantitative Diagnoser Construction
Based on the above contrast experimental analysis, the system characteristic diagnosis method can effectively classify the different leakage levels of RC valve, and the classification effect of using K and EDRF, as the SVM characteristic indicator is the best. A fault quantitative diagnoser for RC discharge valve leakage was constructed in order to realize the quantitative diagnosis of valve leakage failure, according to the corresponding relationship between the best classification effect and the leakage levels of RC valve, as shown in Figure 15.
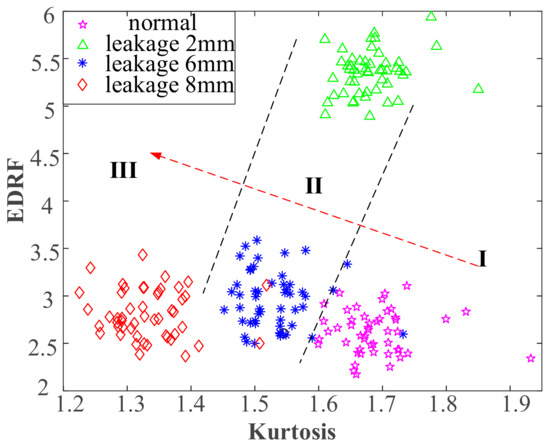
Figure 15.
Quantitative diagnoser of RC valve leakage.
In Figure 15, the classification effect diagram that is based on the system CIs K and EDRF is divided into three regions. Where, region I indicates a minor leakage failure (), region II represents a moderate leakage failure (), and region III indicates a severe leakage failure (). Combined with the feature point set of the four status as a reference template for quantitative diagnosis, a “three-region and four-point set” quantitative diagnoser for RC valve leakage is constructed.
5.2.2. Quantitative Diagnostic Verification
A 4 mm leakage discharge valve was designed in order to verify the diagnostic performance of the proposed quantitative diagnoser, as shown in Figure 16a. While using the designed test-rig, under the same conditions, the RC motor current signal and the vibration signal were collected and processed by the proposed method. The K and EDRF of the system CIs were calculated. Additionally, the leakage level of the valve was diagnosed while using the constructed diagnoser. Figure 16b shows the diagnostic effect.
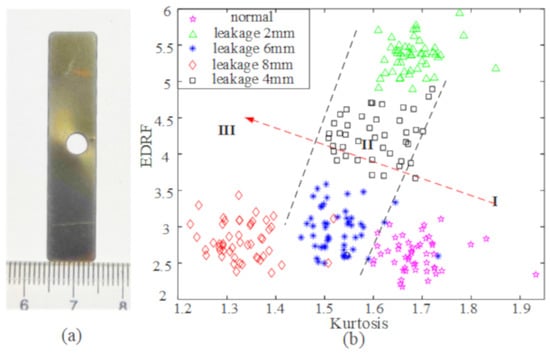
Figure 16.
Diagnostic device verification; (a) 4 mm leakage valve, (b) fault diagnosis effect of the valve based on the diagnostic device.
The black square hollow point is the distribution of the characteristic point of the discharge valve with 4 mm leakage fault in the diagnoser, as shown in Figure 16b. The characteristic points are distributed in the region II, between the point sets of 2 mm leak and 6mm leak, and close to the 2 mm leak point set. Accordingly, the leakage of the discharge valve can be diagnosed to be about 4 mm. Corresponding to the actual discharge valve leakage level, the quantitative diagnostic capability of the proposed diagnoser is verified.
5.3. Applications
The method is applied to the fault diagnosis of a discharge valve leakage fault generated by a reciprocating air compressor of the same type in actual operation in order to further verify the diagnostic performance of the proposed method. Using the same sensors and acquisition parameters to collect data, when the actual RC speed was set to 900 r/min. and the air pipe pressure was 1.0 MPa. The collected data is analyzed by the proposed method to obtain the K and EDRF CIs of the system. Additionally, the extracted K and EDRF were diagnosed while using the designed diagnoser in this paper. Figure 17 shows the diagnostic results.
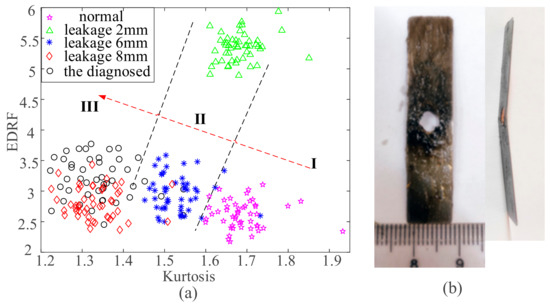
Figure 17.
Diagnosis effect of actual valve leakage fault; (a) fault diagnosis effect, (b) the disassembled leakage fault valve.
The black hollow dot indicates the distribution of the feature points of the actual faulty valve in the diagnoser, as shown in Figure 17a. Black hollow dots are basically distributed in the region III, and more closed to the point sets of 8 mm leakage. Moreover, there are a few points that are distributed to region 2, near the 6 mm leakage point set. Thus, it can be diagnosed that the valve has experienced serious leakage fault, the leakage level is about 7 mm, and the discharge valve needs to be replaced in time.
Disassemble the compressor cylinder to take out the faulty valve, as shown in Figure 17b. An approximately circular hole of about 5 mm was generated in the middle of the valve and a certain bending occurred. This bending creates a gap between the valve and the valve body, which can cause gas leakage. Therefore, the above diagnosis results were close to the actual leakage level of the valve, which further proves the quantitative diagnosis ability for the RC valve leakage fault of the method that is proposed in this paper.
6. Conclusions
This paper proposed a quantitative diagnosis method of RC valve leakage failure that is based on system characteristic diagnosis technology. The proposed fault diagnosis method has the advantages of both model-based and data-driven diagnosis methods. The results show that the effect of pattern recognition that is based on the system CIs is the best. This study applies the proposed method to construct a quantitative fault diagnoser to realize the quantitative evaluation of valve leakage of RC. The proposed method has strong anti-interference ability for the complex working conditions of reciprocating compressors and has obvious advantages for the fault diagnosis of long transmission paths. The experimental and the application verify that the proposed method was promising for quantitative diagnosis of RC valve leakage fault by the simple signal processing method. In subsequent studies, the author will focus on the application of the proposed method in the analysis of machine tool transmission errors.
Author Contributions
Conceptualization, L.H. and K.J.; Methodology, L.H. and K.J.; Software, L.H. and Y.Z.; Validation, L.H., K.J., X.W. and Y.Z.; Formal analysis, K.J., Q.W. and X.W.; Writing—Original draft preparation, L.H.; Writing—Review and editing, L.H., K.J. and Q.W. All authors have read and agreed to the published version of the manuscript.
Funding
This work was funded by the National Natural Science Foundation Project in China (51705003), Anhui Provincial Natural Science Foundation Project (1808085QE130), Anhui Provincial Education Department Fund (11673), State Key Laboratory of Mechanical Manufacturing System Engineering Open Research Fund (sklms2018009), Anhui Provincial Natural Science Foundation Project (1908085ME159), Research on key technology and industrialization application of unmanned intelligent patrol vehicle (1804a09020016), Anhui Provincial Key Laboratory of Intelligent Equipment and Technology Open Fund (201901004) and Anhui University of Science and Technology Innovation Fund (2019CX1004 and 2019CX2030).
Acknowledgments
The authors would like to thank the anonymous reviewers for their insightful comments and useful suggestions that help to improve the quality of this work.
Conflicts of Interest
The authors declare no conflict of interest.
References
- Zhao, H.Y.; Wang, J.; Lee, J.; Li, Y. A compound interpolation envelope local mean decomposition and its application for fault diagnosis of reciprocating compressors. Mech. Syst. Signal Process. 2018, 110, 273–295. [Google Scholar]
- Sim, H.Y.; Ramli, R.; Saifizul, A.; Soong, M.F. Detection and estimation of valve leakage losses in reciprocating compressor using acoustic emission technique. Measurement 2020, 152. [Google Scholar] [CrossRef]
- Tang, Y.F.; Lin, F. Fault feature extraction of reciprocating compressor based on adaptive waveform decomposition and Lempel-Ziv complexity. IEEE Access 2019, 7, 82522–82531. [Google Scholar] [CrossRef]
- Liu, W.H.; Jiang, Z.N.; Wang, Y.; Zhou, C.; Sun, X.; Zhang, J. Performance degradation analysis and optimization of the stepless capacity regulation system for reciprocating compressors. Appl. Sci. 2020, 10, 704. [Google Scholar] [CrossRef]
- Lu, Y.S.; Wang, F.L.; Jia, M.X.; Qi, Y. Centrifugal compressor fault diagnosis based on qualitative simulation and thermal parameters. Mech. Syst. Signal Process. 2016, 81, 259–273. [Google Scholar] [CrossRef]
- Figlus, T. The application of a continuous wavelet transform for diagnosing damage to the timing chain tensioner in a motorcycle engine. J. Vibroeng. 2015, 17, 1286–1294. [Google Scholar]
- Bi, F.R.; Li, L.; Zhang, J.; Ma, T. Source identification of gasoline engine noise based on continuous wavelet transform and EEMD-RobustICA. Appl. Acoust. 2015, 100, 34–42. [Google Scholar] [CrossRef]
- Madej, H.; Czech, P. Discrete wavelet transform and probabilistic neural network in IC engine fault diagnosis. Eksploat. Niezawodn. 2010, 4, 47–54. [Google Scholar]
- Sharma, V.; Parey, A. Performance evaluation of decomposition methods to diagnose leakage in a reciprocating compressor under limited speed variation. Mech. Syst. Signal Process. 2019, 125, 275–287. [Google Scholar] [CrossRef]
- Kordestani, M.; Zanj, A.; Orchard, M.E.; Saif, M. A modular fault diagnosis and prognosis method for hydro-control valve system based on redundancy in multisensor data information. IEEE Trans. Reliab. 2019, 68, 330–341. [Google Scholar] [CrossRef]
- Loukopoulos, P.; Zolkiewski, G.; Bennett, I.; Sampath, S.; Pilidis, P.; Li, X.; Mba, D. Abrupt fault remaining useful life estimation using measurements from a reciprocating compressor valve failure. Mech. Syst. Signal Process. 2019, 121, 359–372. [Google Scholar] [CrossRef]
- Roskosch, D.; Venzik, V.; Atakan, B. Thermodynamic model for reciprocating compressors with the focus on fluid dependent efficiencies. Int. J. Refrig. 2017, 82, 104–116. [Google Scholar] [CrossRef]
- Wang, T.; Guo, Y.; He, Z.L.; Peng, X.Y. Investigation on the delayed closure of the suction valve in the refrigerator compressor by FSI modeling. Int. J. Refrig. 2018, 91, 111–121. [Google Scholar]
- Liu, Z.; Lan, Z.J.; Guo, J.Z.; Zhang, J.; Xie, Y.; Cao, X.; Duan, Z. A new hybrid reciprocating compressor model coupled with acoustic fem characterization and gas dynamics. Appl. Sci. 2019, 9, 1179. [Google Scholar] [CrossRef]
- Liu, Z.; Jia, W.G.; Liang, L.H.; Duan, Z.Y. Analysis of pressure pulsation influence on compressed natural gas (CNG) compressor performance for ideal and real gas models. Appl. Sci. 2019, 9, 946. [Google Scholar] [CrossRef]
- Zhao, H.Y.; Wang, J.D.; Han, H.; Gao, Y.Q. A feature extraction method based on HLMD and MFE for bearing clearance fault of reciprocating compressor. Measurement 2016, 89, 34–43. [Google Scholar] [CrossRef]
- Zhu, S.-B.; Li, Z.-L.; Zhang, S.-M.; Yu, Y.; Zhang, H.-F. Deep belief network-based internal valve leakage rate prediction approach. Measurement 2019, 133, 182–192. [Google Scholar] [CrossRef]
- Jafarian, K.; Mobin, M.; Marandi, R.J.; Rabiei, E. Misfire and valve clearance faults detection in the combustion engines based on a multi-sensor vibration signal monitoring. Measurement 2018, 128, 527–536. [Google Scholar] [CrossRef]
- Potocnik, P.; Govekar, E. Semi-supervised vibration-based classification and condition monitoring of compressors. Mech. Syst. Signal Process. 2017, 93, 51–65. [Google Scholar] [CrossRef][Green Version]
- Pichler, K.; Lughofer, E.; Pichler, M.; Buchegger, T.; Klement, E.P.; Huschenbett, M. Fault detection in reciprocating compressor valves under varying load conditions. Mech. Syst. Signal Process. 2016, 70–71, 104–119. [Google Scholar] [CrossRef]
- Loukopoulos, P.; Zolkiewski, G.; Bennett, I.; Sampath, S.; Pilidis, P.; Duan, F.; Sattar, T.; Mba, D. Reciprocating compressor prognostics of an instantaneous failure mode utilising temperature only measurements. Appl. Acoust. 2019, 147, 77–86. [Google Scholar] [CrossRef]
- Flett, J.; Bone, G.M. Fault detection and diagnosis of diesel engine valve trains. Mech. Syst. Signal Process. 2016, 72–73, 316–327. [Google Scholar] [CrossRef]
- Qi, G.Q.; Zhu, Z.Q.; Erqinhu, K.; Chen, Y.; Chai, Y.; Sun, J. Fault-diagnosis for reciprocating compressors using big data and machine learning. Simul. Model. Pract. Theory 2018, 80, 104–127. [Google Scholar] [CrossRef]
- Gu, F.S.; Shao, Y.; Hu, N.; Naid, A.; Ball, A.D. Electrical motor current signal analysis using a modified bispectrum for fault diagnosis of downstream mechanical equipment. Mech. Syst. Signal Process. 2011, 25, 360–372. [Google Scholar] [CrossRef]
- Zhang, R.L.; Gu, F.S.; Mansaf, H.; Wang, T.; Ball, A.D. Gear wear monitoring by modulation signal bispectrum based on motor current signal analysis. Mech. Syst. Signal Process. 2017, 94, 202–213. [Google Scholar] [CrossRef]
- Huang, B.S.; Feng, G.J.; Tang, X.L.; Gu, J.X.; Xu, G.; Cattley, R.; Gu, F.; Ball, A.D. A Performance Evaluation of Two Bispectrum Analysis Methods Applied to Electrical Current Signals for Monitoring Induction Motor-Driven Systems. Energies 2019, 12, 1438. [Google Scholar] [CrossRef]
- Wang, Y.F.; Xue, C.; Jia, X.H.; Peng, X.Y. Fault diagnosis of reciprocating compressor valve with the method integrating acoustic emission signal and simulated valve motion. Mech. Syst. Signal Process. 2015, 56–57, 97–212. [Google Scholar] [CrossRef]
- Jiang, K.S.; Li, L.H.; Han, L.B.; Guo, S. In-process quality inspection of rolling element bearings based on the measurement of microelastic deformation of outer ring. Shock Vib. 2019. [Google Scholar] [CrossRef]
- Gornicka, D. Vibroacoustic symptom of the exhaust valve damage of the internal combustion engine. J. Vibroeng. 2014, 16, 1925–1933. [Google Scholar]
- Szymanski, G.M.; Tomaszewski, F. Diagnostics of automatic compensators of valve clearance in combustion engine with the use of vibration signal. Mech. Syst. Signal Process. 2016, 68–69, 479–490. [Google Scholar] [CrossRef]
- Verma, N.K.; Sevakula, R.K.; Dixit, S.; Salour, A. Intelligent condition based monitoring using acoustic signals for air compressors. IEEE Trans. Reliab. 2016, 65, 291–309. [Google Scholar] [CrossRef]
- Jiang, K.S.; Han, L.B.; Zhou, Y.Y. Quantitative evaluation of the impurity content of grease for low-speed heavy-duty bearing using an acoustic emission technique. Meas. Control 2019, 52, 1159–1166. [Google Scholar] [CrossRef]
- Figlus, T.; Gnap, J.; Skrucany, T.; Sarkan, B.; Stoklosa, J. The use of denoising and analysis of the acoustic signal entropy in diagnosing engine valve clearance. Entropy 2016, 18, 253. [Google Scholar] [CrossRef]
- Albarbar, A.; Gu, F.; Ball, A.D.; Starr, A. Acoustic monitoring of engine fuel injection based on adaptive filtering techniques. Appl. Acoust. 2010, 71, 1132–1141. [Google Scholar] [CrossRef][Green Version]
- Li, X.Y.; Peng, X.Y.; Zhang, Z.T.; Jia, X.; Wang, Z. A new method for nondestructive fault diagnosis of reciprocating compressor by means of strain-based p–V diagram. Mech. Syst. Signal Process. 2019, 133, 1–16. [Google Scholar] [CrossRef]
- Jiang, K.S.; Zhou, Y.Y.; Chen, Q.H.; Han, L.B. In processing fault detection of machinery based on instantaneous phase signal. IEEE Access 2019, 7, 123535–123543. [Google Scholar] [CrossRef]
- Elhaj, M.; Gu, F.S.; Ball, A.D.; Albarbar, A.; Al-Qattan, M.; Naida, A. Numerical simulation and experimental study of a two-stage reciprocating compressor for condition monitoring. Mech. Syst. Signal Process. 2008, 22, 374–389. [Google Scholar] [CrossRef]
- Tran, V.T.; AlThobiani, F.; Ball, A. An approach to fault diagnosis of reciprocating compressor valves using Teager-Kaiser energy operator and deep belief networks. Expert Syst. Appl. 2014, 41, 4113–4122. [Google Scholar] [CrossRef]
- Kandukuri, S.T.; Senanyaka, J.; Huynh, V.K.; Robbersmyr, K.G. A two-stage fault detection and classification scheme for electrical pitch drives in offshore wind farms using support vector machine. IEEE Trans. Ind. Appl. 2019, 55, 5109–5118. [Google Scholar] [CrossRef]
- Liu, Z.G.; Cui, Y.; Li, W.H. A classification method for complex power quality disturbances using EEMD and rank wavelet SVM. IEEE Trans. Smart Grid 2015, 6, 1678–1685. [Google Scholar] [CrossRef]
- Liu, D.; Xiao, Z.H.; Hu, X.; Zhang, C.; Malik, O.P. Feature extraction of rotor fault based on EEMD and curve code. Measurement 2019, 135, 712–724. [Google Scholar] [CrossRef]
- Lin, M.T.; Huang, D.R.; Zhao, L.; Chen, R.; Kuang, F.; Yu, J. An improved fault diagnosis method based on a genetic algorithm by selecting appropriate IMFs. IEEE Access 2019, 7, 60310–60321. [Google Scholar]
- Yang, C.Y.; Wu, T.Y. Diagnostics of gear deterioration using EEMD approach and PCA process. Measurement 2015, 61, 75–87. [Google Scholar] [CrossRef]
- Zhang, Z.; Fu, P.; Gao, G.; Jiang, L.; Wang, L.S. A rogowski digital integrator with comb filter signal processing system. IEEE Trans. Plasma Sci. 2018, 46, 1338–1343. [Google Scholar] [CrossRef]
- Zahradnik, P.; Vlcek, M.; Unbehauen, R. Design of optimal comb FIR filters-speed and robustness. IEEE Signal Process. Lett. 2009, 16, 465–468. [Google Scholar] [CrossRef]
- Zhang, D.C.; Yu, D.J. Multi-fault diagnosis of gearbox based on resonance-based signal sparse decomposition and comb filter. Measurement 2017, 103, 361–369. [Google Scholar] [CrossRef]
- Li, K.; Zhang, R.; Su, L.; Wang, H.; Chen, P. A new rotation machinery fault diagnosis method based on deep structure and sparse least squares support vector machine. IEEE Access 2019, 7, 26571–26580. [Google Scholar] [CrossRef]
- Gangsar, P.; Tiwari, R. A support vector machine based fault diagnostics of Induction motors for practical situation of multi-sensor limited data case. Measurement 2019, 135, 694–711. [Google Scholar] [CrossRef]
- Li, Y.B.; Yang, Y.T.; Wang, X.Z.; Liu, B.; Liang, X. Early fault diagnosis of rolling bearings based on hierarchical symbol dynamic entropy and binary tree support vector machine. J. Sound Vib. 2018, 428, 72–86. [Google Scholar] [CrossRef]
- Zou, J.; Chang, Q.; Arinez, J.; Xiao, G.X. Data-driven modeling and real-time distributed control for energy efficient manufacturing systems. Energy 2017, 127, 247–257. [Google Scholar] [CrossRef]
- Bellini, A.; Filippetti, F.; Franceschini, G.; Tassoni, V.; Kliman, G.B. Quantitative evaluation of induction motor broken bars by means of electrical signature analysis. IEEE Trans. Ind. Appl. 2001, 37, 1248–1255. [Google Scholar] [CrossRef]
- Zhen, D.; Wang, T.; Gu, F.; Ball, A.D. Fault diagnosis of motor drives using stator current signal analysis based on dynamic time warping. Mech. Syst. Signal Process. 2013, 34, 191–202. [Google Scholar] [CrossRef]
- Iglesias-Martínez, M.E.; Antonino-Daviu, J.A.; de Córdoba, F.P.; Conejero, J.A. Rotor fault detection in induction motors based on time-frequency analysis using the bispectrum and the autocovariance of stray flux signals. Energies 2019, 12, 597. [Google Scholar] [CrossRef]
© 2020 by the authors. Licensee MDPI, Basel, Switzerland. This article is an open access article distributed under the terms and conditions of the Creative Commons Attribution (CC BY) license (http://creativecommons.org/licenses/by/4.0/).