A Survey on Computer-Aided Diagnosis of Brain Disorders through MRI Based on Machine Learning and Data Mining Methodologies with an Emphasis on Alzheimer Disease Diagnosis and the Contribution of the Multimodal Fusion


Abstract
1. Introduction
2. Cad Systems of Brain Disorders Based on MRI Technology
2.1. CAD System Architecture
2.2. Segmentation of Brain Regions
2.2.1. Related-Work to the Segmentation of Brain Regions
2.2.2. Segmentation Techniques Proposed in Literature: Description, Advantages and Disadvantages
The Region Approach
- Artificial neural networks: ANNs used in several works related to neuroimaging [38,39,40,41,42,43,44,45,46] are a supervised deterministic method, represented by an interconnected group of artificial neurons using a mathematical model to process information. It performs well in complex and multivariate nonlinear domains, such as tumor segmentation where it becomes difficult to use decision trees or rule-based systems. It also works a little better for noisy data. Data allocation is not required as in the case of statistical modeling. Its learning process consumes enough time, usually with gradient-type methods. The representation of knowledge is not explicit, in the form of rules or other easily interpretable. Initialization may affect the result which may cause overtraining.
- Genetic algorithms: GAs exploited in many neuroimaging studies [47,48,49,50,51,52] are a supervised deterministic method of optimizing research that exploits the concepts of natural selection. It differs from traditional optimization methods in four points: (1) It is a parallel search approach in a population of points, thus having the possibility of avoiding being trapped in a local optimal solution. (2) Its selection rules are probabilistic. (3) She works on the chromosome, a coded version of the potential solutions of the parameters, rather than the parameters themselves. (4) It uses the fitness score, obtained from objective functions, without any other derived or auxiliary information. However, its optimization process depends on the fitness function. It is hard to create good heuristics that really reflect our goal. It is difficult to select the initial parameters (the number of generations, the size of the population, etc.).
- k-means:k-means [53,54,55,56,57] are a deterministic method based on unsupervised learning which makes it possible to divide a set of data into k clusters. It is widely used for brain segmentation with mainly satisfactory results, to overcome the isolated distribution of pixels inside the image segments. Its execution is simple to implement, fast in real time and in calculation even with a large number of variables. Unfortunately, the unstable quality of the results prevents its application in the case of automatic segmentation. Generally, a degradation of the quality of the segmentation is observed in the case of an automatic segmentation, or when the weight of the pixels in the neighboring local regions is added. Difficulty predicting the k value. Different initial partitions can result in different final clusters. The algorithm only works well when spherical clusters are naturally available in the original data.
- Fuzzy C-means: FCM [19,53,58,59,60,61,62,63,64] is an unsupervised deterministic method which represents the advanced version of k-means. It is based on the theory of fuzzy subsets giving rise to the concept of partial adhesion based on the membership functions. It is widely used in the segmentation and diagnosis of medical images. It provides better results for overlapping data. Unlike k-means where data must systematically belong to a single cluster, FCM assigns a fuzzy degree of belonging to each cluster for each data, which allows it to belong to several clusters. However, the computation time is considerable. It does not often provide standard results due to the randomness of the initial membership values. In addition, MRI images often contain a significant amount of noise, resulting in serious inaccuracies in segmentation. It only takes into account the intensity of the image, which causes unsatisfactory results for noisy images. The counterintuitive form of class membership functions limits its use.
- Mean shift: it’s an unsupervised deterministic method [62,65,66,67], which makes it possible to locate the maxima—the modes—of a density function, from discrete data sampled through this function. It is based on a non-parametric algorithm which does not take any predefined form on the clusters and assumes no constraint on the number of clusters. Robust with outliers and able to manage arbitrary function spaces. However, it is sensitive to the selection of the window h which is not trivial. An inappropriate window size may result in the merging of modes or the generation of additional “shallow” modes. Costly from a calculation point of view and does not adapt well to the size of the function space.
- Threshold-based techniques: the easiest way is to convert a grayscale image to a binary using a threshold value [68]. Pixels lighter than the threshold are white pixels in the resulting image and darker pixels are black pixels. Several improvements have been reported in which the threshold is selected automatically. They are very useful for the linearization of images, an essential task for any type of segmentation. They work well for fairly noisy images. Do not require prior image information. They are useful if the brightness of objects differs significantly from the brightness of the background. Their speed of execution is quite fast with minimum IT complexity. However, do not work properly for all types of MRI brain images, due to the large variation between foreground intensities and background image intensities. The reason why, selecting the appropriate threshold value is a tedious task. In addition, their performance degrades for images without apparent peaks or with a wide and flat valley [69].
- Region growing method: it allows to group pixels together in a homogeneous region, including growing, dividing and merging regions. It correctly separates the regions with the same characteristics already defined, especially when the criteria for region homogeneity are easy to define [69,70,71,72,73]. However, it is very sensitive to noise. Costly in memory and sequential from the calculation point of view. In addition, it requires manually selecting an origin point and requires deleting all the pixels connected to the preliminary source by applying a predefined condition.
- Mixture of laws (Gaussian mixture models): parametric probabilistic method which allows each observation to be assigned to the most probable class. The classes follow a probability distribution (law), normal in the case of Gaussian mixture models (GMM). GMMs [74,75,76,77,78] require few parameters estimated by a simple likelihood function. These parameters can be estimated by adopting the EM algorithm in order to maximize the likelihood function of the log. However, GMM assume that each pixel is independent of its neighbors; this does not take into account the spatial relationships between neighboring pixels [79]. Also, the previous distribution does not depend on the pixel index.
- Markov Random field: non parametric probabilistic method, which allows modeling the interactions between a voxel and its neighborhood. In the Markov random field (MRF), the local conditional probabilities are calculated by the Hammersley—Clifford theorem, which allows to pass from a probabilistic representation to the energy representation via the Gibbs field. MRF [80,81,82,83] is characterized by their statistical properties; non-directed graphs can succinctly express certain dependencies that Bayesian networks cannot easily describe. It is effectively applied for the segmentation of MRI images, for which there is no natural directionality associated with variable dependencies. In MRF, the computation of the normalization constant Z requires a sum over a number of potentially exponential assignments generally; it is an NP-difficult. In addition, many non-directed models are difficult to interpret or intractable which require approximation techniques.
- Hidden Markov models: similar to the MRF, it’s non parametric probabilistic method. It is possible to express a posterior probability of a label field from an observation in hidden Markov models (HMM), thanks to the Bayes theorem. HMMs [84,85,86,87,88] make it possible to model arbitrary characteristics of observations, making it possible to inject knowledge specific to the problem encountered into the model, in order to produce an ever finer resolution of spectral, spatial and temporal data. In the case of HMMs, the types of previous distributions that can be placed on masked states are severely limited; it is not possible to predict the probability of seeing an arbitrary observation. In practice, this limitation is often not a problem, as many common uses of HMMs do not require such probabilities.
- Support vector machines: SVMs [21,89,90,91,92] are a non-parametric probabilistic method whose objective is to find an optimal decision border (hyperplane) which separates the data into groups. The formation process depends on various factors such as the penalty parameter C or the kernel used, such as the linear, polynomial kernel, the radial-based function (RBF) and in its particular case the Gaussian kernel. The generalization performance of this method is high, especially when the dimension of the function space is very large. It makes it possible to train non-linearly generalizable classifiers in large spaces using a small learning set. It minimizes the number of classification errors for any set of samples. However, it requires a high learning time and memory space for data storage. Moreover, the optimality of the solution can depend on the kernel used unfortunately, there is no theory allowing to determine a priori which will be the best kernel for a concrete task. Also, SVMs assume that the data is distributed independently and identically, which is not appropriate for the segmentation of noisy medical images.
The Contour Approach
- Gaussian Scale-Space representation: this concept [93,94,95,96] makes it possible to manage image structures at different scales by generally smoothing. This representation is obtained by solving a linear diffusion equation. Its transparent and natural way of handling scales at the data level makes this concept popular. However, it is sensitive to signal noise since smoothing is applied without an average filter. In addition, parasitic characteristics are to be considered because of the high-frequency noises which introduce local extrema into the signal.
- Derived models: they make it possible to model image zones (contours) assuming that the digital image comes from a sample of a scalar function developed with a narrow and differentiable support. In this case, the variations in intensity of the image are characterized by a 3D variable which represents the light intensity corresponding to the illuminations (shadows), changes in orientation or distance, changes in surface reflectance, changes in absorption of rays, etc.
The Structural Approach
- Morphological gradient: it’s the difference between the operators of the gradient of expansion and erosion of an image [97,98]. In this case, the value of a pixel corresponds to the intensity of the contrast in the nearest neighbor. Generally, the extensive and anti-extensive operators exploited by gradient masks are effective in determining the intensity transitions of gray levels in the borders of objects. However, this technique suffers from the problem of the edge detail smearing. In addition, its sensitivity in particular to white Gaussian noise condensed on the high-frequency part of the signal.
- Watershed line: it interprets an image as a height profile, flooded from regional minima so that, the lines where the flooded areas touch represent the watersheds [99,100]. It makes it possible to use the a priori knowledge of the clinician and his intervention, which facilitates visual evaluation in the higher level. However, it is difficult to implement and slow from a calculation point of view. In addition, the over-segmentation of images is generally frequent.
The Form-Based Approach
- Deformable models: generate curves or surfaces (from a simple image), or hyper-surfaces (in the case of larger images). They use internal and external forces to delimit the limits of objects and thus distort images. We could distinguish parametric models (active contours or snake) [101,102,103,104,105] and geometric models [106]. They are robust to noise and parasitic edges thank to their ability to generate closed parametric surfaces or curves. Simple to implement on the continuum and achieve less than pixel accuracy, a property highly desirable for medical imaging applications. Ease of integrating border elements into a coherent mathematical description. They are able to enlarge or contract over time, within an image [52,107]. However, they risk producing shapes whose topology is inconsistent with the real object, when applied to noisy images with ill-defined borders.
- Atlas: allows an image segmented by an automated algorithm to correspond to a reference image (atlas) [108,109]. These techniques take into account a priori knowledge of brain structures and manage segmentation as a recording problem. They are used in clinical practice, for computer-assisted diagnosis and offer a standard system for detecting properties and morphological differences between patients. They allow segmentation even if there is not a well-defined relationship between the intensities of the pixels and associated regions. However, building an atlas takes time. Difficult to produce objective validation, because segmentation is used when the information from the gray level intensities is not sufficient.
- Wavelets: automatically extracts the histogram threshold from the image by wavelet transform. The threshold segmentation is carried out by exploiting multi-scale characteristics of the wavelet transformation [25,56,110,111,112]. It preserves the sharpness of the contours and provides frequency information located on a function of a signal, which is beneficial for segmentation. However, the overall threshold value is not constant, which leads to a sensitivity of the transformation to the shift. A transformation of dimension greater than 1 suffers from a bad direction when the transformation coefficients reveal only a few orientations of characteristics, in the spatial domain. In addition, there is no information available on the phase of a signal or vector with complex values; it is calculated by applying real and imaginary projections.
- Spherical harmonics: It offers solutions of the Laplace equation expressed in a spherical coordinate system [24,113,114,115]. A base of orthogonal functions is created, which ensures the uniqueness of the decomposition of a form on the unit sphere. So that any finite energy and differentiable function defined on the sphere can be approximated by a linear combination of spherical harmonics. The estimation of the harmonic coefficients makes it possible to model the form with a level of detail relatively linked to the level of the decomposition whose calculation is fast. However, certain continuity constraints should be included when estimating the coefficients. In addition, the results of the shape reconstruction from the decomposition into harmonics are poor when the missing data are concentrated in one area [116].
- Level set: consists of representing the segmentation of the contour by the zero level set of a smoothing [108,117,118,119,120,121]. There are two types of methods: geometric and geodesic. Its strong points are the ease of following forms that change topology. Best results for weak and variable signal-to-noise ratios and for non-uniform intensities. Allow to manage any cavity, concavity, convolution, split or fusion. Allow numerical calculations involving curves and surfaces to be performed on a fixed Cartesian grid without having to configure objects. However, the boundaries of the object are not clearly defined by strong image gradients or significant changes in the intensity distribution, this is common in several medical applications, for which image data often suffer from low contrast or fabric noise. In addition, for large images, the execution speed could be very slow and requires manual adjustment of the parameters to obtain optimal results. Possibility of being trapped by an undesirable local minimum which requires additional regularization to obtain the desired minimum.
The Theory of Graphs
- Hypergraph: enlargement of the graph, due to its hyper-edges linked with three or more vertices, which is advantageous for processing large data [124,125]. The concept of cross family (intersection of hyper-edges) derived suits the problem of segmentation on several levels and gives good results. In addition, it provides more meaningful and more robust edge maps. However, its algorithms are quite complex [126].
- Graph cut: the image is considered as an undirected graph whose pixels represent the nodes and where the distance between the neighboring pixels forms an edge. A weight is assigned to each edge so that the weight vectors characterize the segmentation parameters [29,127,128,129,130,131]. No initialization is required for this method which guarantees optimal global solutions. Easy to execute and delivers precise results. Ability to integrate constraints and approximate continuous cutting metrics with arbitrary precision. It is applicable for highly textured, noisy, colored images, complex backgrounds, etc. However, it is limited to binary segmentation, and to a special class of functional energy.
2.2.3. Overview of Software Toolkits for Segmentation of Brain Images
FMRIB Software Library
Insight segmentation and registration ToolKit
ITK-SNAP
FreeSurfer
Analysis of Functional NeuroImages
3D Slicer
2.2.4. Critical Discussion about Segmentation Techniques
2.3. Classification of Brain Images
2.3.1. Classification Techniques Proposed in Literature: Description, Advantages and Disadvantages
Techniques based on Supervised Learning
- Artificial neural networks: ANNs are used in many works related to neuroimaging as classification method [15,157,158,159,160,161,162,163] have been widely applied as a classifier to distinguish new test data. They are universal functional approximations allowing to approximate any function with arbitrary precision. They are flexible nonlinear models for modeling complex real-world applications. They are self-adapting adaptable to data, without explicit specification of the functional or distributional form with the underlying model. They are able to estimate the later probabilities, necessary to establish classification rules and statistical analyzes. However, the learning time is high for large ANNs and the adjustment of the parameters to be minimized requires a lot of calculation.
- k-nearest neighbors: the k-NNs proposed in many neuroimaging studies [164,165,166,167] allow a test sample to be classified in the class most frequently represented among the k closest training samples. In the case of two or more classes, it will be classified to the class with a minimum average distance. This classifier is powerful and simple to implement. It provides precise distance and weighted average information about the pixels. However, its efficiency degrades for large-scale and large-scale data due to its “lazy” learning algorithm. The choice of k affects classification performance which is slow and the memory cost is high.
- Gaussian mixing model: GMM suggested by many neuroimaging researchers [76,168,169,170,171,172] is easy to implement. Effective and robust due to its probabilistic basis. It does not require a lot of time, for large data sets. However, this classifier does not exclude exponential functions, and its ability to follow trends over time is slow.
- Support vector machines: SVMs used in several works [6,159,173,174,175,176] have high generalization performance, especially when the dimension of the function space is very large. These machines offer the possibility of training generalizable nonlinear classifiers in large spaces using a small learning set. They minimize the number of classification errors for any set of samples. However, learning SVM is slow and requires computation time for implementation. High cost of memory space to store data. No method is approved to determine a priori the best kernel for a concrete task. So the optimality of the solution can depend on the chosen kernel.
Techniques based on Unsupervised Learning
- Self-organizing map: SOM [112,176,177] is a type of ANN that produces a discrete, low-dimensional representation of the input space for learning samples. This classifier is simple to implement and easy to understand. Capable of handling various classification issues while providing a useful, interactive and intelligible summary of the data. However, despite the ease of viewing the distribution of input vectors on the map, it is difficult to properly assess the distances and similarities between them. In addition, if the output dimension and the learning algorithms are selected incorrectly, similar input vectors may not always be close to each other and the formed network may converge to local optima.
2.3.2. Critical Discussion about Classification Techniques
3. CAD Systems of Brain Disorders Based on Multimodal Fusion
3.1. Motivation for the Application of Multimodal Fusion
3.2. Multimodal Fusion Techniques Proposed in Literature: Description, Advantages and Disadvantages
3.2.1. Spatial Domain Techniques
- Principal components analysis: PCA used in many works [216,217,218,219,220,221,222,223] makes it possible to carry out a linear orthogonal transformation of a multivariate set of data which contains variables correlated with N dimensions in other containing new variables not correlated to M smaller size dimensions. The transformation parameters sought are obtained by minimizing the error covariance introduced by neglecting N-M of the transformed components. This technique is very simple and effective. It benefits from faster processing time with high spatial quality. It selects the optimal weighting coefficients according to the content of the information; it removes the redundancy present in the input image. It compresses a large amount of input data without much loss of information. However, a strong correlation between the input images and the merged image is necessary. In addition, the merged image quality is generally poor with spectral degradation and color distortion.
- Hue-intensity-saturation: HIS used in many works [224,225,226,227,228] converts a color image of the RGB space (red, green and blue) into an HIS color space. The intensity band (I) in the HIS space is replaced by a high-resolution panoramic image, then reconverted in the original RGB space at the same time as the previous hue band (H) and the saturation band (S), which creates an HIS fusion image. It is very simple, efficient in calculation and the processing time is faster. It provides high spatial quality and better visual effect. The change in intensity has little effect on the spectral information and is easy to manage. However, it suffers from artifact and noise which tend to weaken the contrast. It only processes multi-spectral bands and results in color distortion.
- Brovery transformation: It is a combination of arithmetic operations which normalize the spectral bands before they are multiplied by the panoramic image. It retains the corresponding spectral characteristic of each pixel and transforms all the luminance information into a high-resolution panoramic image. This technique proposed by many works [229,230,231] is very simple, effective on the computer level and has a faster processing time. It produces RGB images with a high degree of contrast. Good for multi-sensory images and provides a superior, high-resolution visual image. Generally the Bovery fusion image is used as a reference for comparison with other fusion techniques. However, it ignores the requirement for high-quality synthesis of spectral information and causes spectral distortion, which results in color distortion and high-contrast pixel values in the input image. It does not guarantee to have clear objects of all the images.
- Guided filtering: This technique [232,233,234,235] is based on a local linear model which takes into account the statistics of a region in the corresponding spatial neighborhood in the guide image while calculating the value of the output pixel. The process first uses a median filter to obtain the two-scale representations. Then the base and detail layers are merged using a weighted average method. It is very simple, in terms of computation and adaptable to real applications whose computational complexity is independent of the size of the filtering kernel. It has good smoothing properties preserving the edges and does not suffer from the gradient reversal artifacts observed when using a bilateral filter. It does not blur strong edges in the decomposition process. Despite the simplicity and effectiveness of this technique; however, the principal problem with the majority of guided filters is associated with ignorance of the structural inconsistency between the ground truth and target images such as color [234]. Moreover, the halos could represent an obstacle [235].
- Simple average: The pixel value of each image is added. The sum is then divided by 2 to obtain the average. The average value is assigned to the corresponding pixel of the output image. The principle is repeated for all pixel values. This technique [217,236] is a simple way to obtain a fusion image with focusing of all the regions of the original images. However, the quality of the output image is reduced by incorporating noise into the merged image, which results in undesirable effects, such as reduced contrast. In addition, the possibility of having clear objects from all of the images is not guaranteed.
- Weighted average: It calculates the sum of the pixels affected by coefficients, divided by the number of pixels. The weighted average value is assigned to each pixel of the input image to obtain the value of the corresponding pixel in the output image. This technique used in some works [217,231,237,238,239] improves the reliability of detection. However, there is a risk of increasing noise.
- Max and Min pixel values: These techniques are used in many works [217,236,240], they choose the focused regions of each input image by choosing the highest value (or the lowest in the case of the min pixel value technique) for each pixel. This value is assigned to the corresponding pixel in the merge image.
- Max-Min: For this technique [240], in the merged image, the output pixels are obtained by averaging the smallest and largest values of the corresponding pixels in all of the input images.
3.2.2. Frequency Domain Techniques
Discrete Transform
- Discrete Cosine Transform: The DCT described in many works [241,242,243,244,245,246] makes it possible to perform a discrete transformation which provides a division into N × N pixel blocks by operating on each block. As a result, it generates N coefficients which are quantified to reduce their magnitude. It reduces complexity by breaking down images into series of waveforms. It can be used for real applications. However, the merged image is not of good quality if the block size is less than 8 × 8 or equivalent to the size of the image itself.
- Curvelet Transform: The CT used in many works [247,248,249,250,251,252] is a means of characterizing curved shapes in images. The concept is to segment the complete image into small overlapping tiles, then the ridgelet transformation is performed on each tile. The curvelet transform provides fairly clear edges because the curvelets are very anisotropic. They are also adjustable to properly represent or improve the edges on several scales. However curvelet do not have time invariance.
- Wavelet Transform: In wavelet-based fusion, used in different studies [217,220,253,254,255,256,257,258], once the image is decomposed by wavelet transformation, a multi-scale composite representation is constructed by selecting the salient wavelet coefficients. The most applied techniques based on wavelet transform are discrete wavelet transform (DWT), stationary wavelet transform (SWT) and Kekre’s Wavelet transform (KWT).
- -
- Discrete wavelet transform: DWT [217,258] allows a discrete transformation for which the wavelets are discretely sampled. The key advantage of DWT is that it provides temporal resolution, in the sense that it captures frequency and location information. However DWT requires a large storage space, the lack of directional selectivity and causes the loss of information on the edges due to the down-sampling process, effect of blurring, etc.
- -
- Stationary wavelet transform: SWT [250,259], allowing a discrete transformation, begins by providing from the original image, information relating to the edges of levels 1 and 2. Then, a measurement of spatial frequency is used to merge the two contour images, and in order to obtain a complete contour image. From level 2 of the decomposition, the SWT offers satisfactory results. Its stationary property guarantees temporal invariance, which is obtained by suppressing the process of subsampling, but SWT is more complex in terms of computation and processing, which consume time. Moreover, although it performs better at separate discontinuities, its effectiveness degrades at the edges and textured locals.
- -
- Kekre’s wavelet transform: The KWT [260], which allows a discrete transformation to be carried out, is applicable for images of different sizes. Its results are generally good. In addition, different variations of KWT are simply generable, only by changing the size of the basic Kekre’s transformation. However, this type of transformation is not explored enough. Intensive research is; therefore, desired to bring out its weaknesses.
- Hybrid Approach-Based Fusion: To achieve a merger, some researchers have used hybrid methods which allow two or more methods to be combined in a single scheme. Below some of them are presented.
- -
- Hybrid SWT and curvelet transform: With the hybrid SWT/CT technique [261] we first decompose the input images by applying the SWT in order to obtain the high- and low-frequency components. Thereafter, a curvelet transform is applied to merge the low-frequency components. The principle is based on the segmentation of the whole image into small superimposed mosaics, then for each mosaic, we apply the transformation into crest. Components with high frequencies are merged according to the largest coefficients of absolute value. The final fusion image is finally obtained using the inverse SWT transformation. This hybrid method makes it possible to avoid the drawbacks of the two combined methods, namely the block effects of the fusion algorithm applied by the wavelet transformation, as well as the performance defects of the details of the image in the curvelet transformation. It retains image details and profile information such as contours. It adapts to real applications. However, a lot of time is consumed.
- -
- Discrete wavelet with Haar-based fusion: In the DWT with Haar-based fusion [262], once the image is decomposed by wavelet transformation; a multi-scale composite representation is constructed by selecting the salient wavelet coefficients. The selection can be based on the choice of the maximum of the absolute values or of a maximum energy based on the surface. The final step is a transformation into inverse discrete wavelets on the composite wavelet representation. It provides a good quality merged image and better signal-to-noise ratio. It also minimizes spectral distortion. Different rules are applied to the low- and high-frequency parts of the signal. However, pixel-by-pixel analysis is not possible and it is not possible to merge images of different sizes. The final merged image has a lower spatial resolution.
- -
- Kekre’s hybrid wavelet transform: This fusion technique [263] allowing a discrete transformation to be carried out, exploits various hybrid transformations to decompose the input images. Quoting the hybridization Kekre/Hadamard, Kekre/DCT, DCT/Hadamard, etc. Then the average is applied to merge the decomposed images, and to obtain its transformation components. The latter are subsequently converted to an output image by applying a reverse transformation. Like its similar KWT, its advantage is that it is applicable for images that are not only a whole power of 2.
- -
- Hybrid DWT/PCA: The DWT/PCA fusion [220] allows for a discrete transformation. It provides multi-level merging where the image is double-merged, which provides an improved output image containing both high spatial resolution and high-quality spectral content. However, this kind of merger is quite complex to achieve.
Pyramid Decomposition
3.3. Critical Discussion about Multimodal Fusion Techniques
3.4. Critical Discussion about the Multimodal Diagnosis of AD
- -
- All the classification models performed very well, distinguishing participants with normal aging from the patients with AD. The performance was worse for MCI vs. AD determination, which proved more difficult, probably due to the MCI biomarker scheme which is quite similar to that observed in AD. However, multimodal classification had better diagnostic and forecasting power than single-modal classification.
- -
- The majority of clinical studies in recognized biomedical laboratories have focused on binary classification problems (i.e., AD vs. HC and MCI vs. HC), neglecting to test the power of the models proposed for multi-class classification of AD, MCI and normal controls. It is true that the latter type of classification is more difficult to verify than the binary classification, but it is crucial to diagnose the different stages of dementia. In addition, longitudinal data may contain essential information for classification, while the proposed studies can only deal with basic data.
- -
- Few studies have used two or more biomarkers simultaneously among MRI, PET and CSF for the diagnosis of AD, using images from synthetic bases such as Alzheimer’s Disease Neuroimaging Initiative (ADNI) [293] and Open Access Series of Imaging Studies (OASIS) [295] to combine MRI with other modalities applying image fusion methods. The ADNI database, launched in 2003 by various institutes, companies and non-profit organizations, represents one of the largest databases to date; however, the limit of the ADNI data set is that it is not neuropathologically confirmed, which is like even a fairly delicate task to perform in practice.
4. Conclusions and General Requirements
Author Contributions
Funding
Acknowledgments
Conflicts of Interest
References
- Besga, A.; Termenon, M.; Graña, M.; Echeveste, J.; Pérez, J.M.; Gonzalez-Pinto, A. Discovering Alzheimer’s disease and bipolar disorder white matter effects building computer aided diagnostic systems on brain diffusion tensor imaging features. Neurosci. Lett. 2012, 520, 71–76. [Google Scholar] [CrossRef] [PubMed]
- Chen, C.-M.; Chou, Y.-H.; Tagawa, N.; Do, Y. Computer-Aided Detection and Diagnosis in Medical Imaging. Comput. Math. Methods Med. 2013, 2013. [Google Scholar] [CrossRef]
- Dessouky, M.M.; Elrashidy, M.A.; Taha, T.E.; Abdelkader, H.M. Computer-aided diagnosis system for Alzheimer’s disease using different discrete transform techniques. Am. J. Alzheimer Dis. Other Dement. 2016, 31, 282–293. [Google Scholar] [CrossRef] [PubMed]
- Doi, K. Computer-aided diagnosis in medical imaging: Historical review, current status and future potential. Comput. Med Imaging Graph. Off. J. Comput. Med Imaging Soc. 2007, 31, 198–211. [Google Scholar] [CrossRef] [PubMed]
- Karami, V.; Nittari, G.; Amenta, F. Neuroimaging computer-aided diagnosis systems for Alzheimer’s disease. Int. J. Imaging Syst. Technol. 2019, 29, 83–94. [Google Scholar] [CrossRef]
- Khedher, L.; Illán, I.A.; Górriz, J.M.; Ramírez, J.; Brahim, A.; Meyer-Baese, A. Independent component analysis-support vector machine-based computer-aided diagnosis system for Alzheimer’s with visual support. Int. J. Neural Syst. 2016, 27, 1650050. [Google Scholar] [CrossRef]
- Lazli, L.; Boukadoum, M.; Aït-Mohamed, O. Computer-aided diagnosis system for Alzheimer’s disease using fuzzy-possibilistic tissue segmentation and SVM classification. In Proceedings of the 2018 IEEE Life Sciences Conference (LSC), Montreal, QC, Canada, 28–30 October 2018; pp. 33–36. [Google Scholar]
- Lin, T.; Huang, P.; Cheng, C.W. Computer-aided diagnosis in medical imaging: Review of legal barriers to entry for the commercial systems. In Proceedings of the 2016 IEEE 18th International Conference on e-Health Networking, Applications and Services (Healthcom), Munich, Germany, 14–16 September 2016; pp. 1–5. [Google Scholar] [CrossRef]
- Park, H.J.; Kim, S.M.; La Yun, B.; Jang, M.; Kim, B.; Jang, J.Y.; Lee, J.Y.; Lee, S.H. A computer-aided diagnosis system using artificial intelligence for the diagnosis and characterization of breast masses on ultrasound: Added value for the inexperienced breast radiologist. Medicine 2019, 98, e14146. [Google Scholar] [CrossRef]
- Zhang, D.; Wang, Y.; Zhou, L.; Yuan, H.; Shen, D. Multimodal classification of Alzheimer’s disease and mild cognitive impairment. NeuroImage 2011, 55, 856–867. [Google Scholar] [CrossRef]
- Patterson, C. World Alzheimer Report 2018 The State of The Art of Dementia Research: New Frontiers (Alzheimer’s Disease International (ADI)). 2018. Available online: https://www.alz.co.uk/news/world-alzheimer-report-2018-state-of-art-of-dementia-research-new-frontiers (accessed on 19 October 2018).
- Geethanath, S.; Vaughan, J.T., Jr. Accessible magnetic resonance imaging: A review. J. Magn. Reson. Imaging 2019, 49, e65–e77. [Google Scholar] [CrossRef]
- Agüera-Ortiz, L.; Hernandez-Tamames, J.A.; Martinez-Martin, P.; Cruz-Orduña, I.; Pajares, G.; López-Alvarez, J.; Osorio, R.S.; Sanz, M.; Olazarán, J. Structural correlates of apathy in Alzheimer’s disease: A multimodal MRI study. Int. J. Geriatr. Psychiatry 2017, 32, 922–930. [Google Scholar] [CrossRef]
- Tondelli, M. Structural MRI changes detectable up to ten years before clinical Alzheimer’s disease. Neurobiol. Aging 2012, 33, 825.e25–825.e36. [Google Scholar] [CrossRef] [PubMed]
- Islam, J.; Zhang, Y. A novel deep learning based multi-class classification method for Alzheimer’s disease detection using brain MRI data. In Proceedings of the Brain Informatics: International Conference, BI 2017, Beijing, China, 16–18 November 2017; pp. 213–222. [Google Scholar] [CrossRef]
- Bhavana, V.; Krishnappa, H.K. Multi-modality medical image fusion using discrete wavelet transform. Procedia, Comput. Sci. 2015, 70, 625–631. [Google Scholar] [CrossRef]
- Lazli, L.; Boukadoum, M.; Ait Mohamed, O. Computer-Aided Diagnosis System of Alzheimer’s Disease Based on Multimodal Fusion: Tissue Quantification Based on the Hybrid Fuzzy-Genetic-Possibilistic Model and Discriminative Classification Based on the SVDD Model. Brain Sci. Clin. Neurosci. Sect. 2019, 9, 289. [Google Scholar] [CrossRef] [PubMed]
- Pham, D.L. Robust fuzzy segmentation of magnetic resonance images. In Proceedings of the 14th IEEE Symposium on Computer-Based Medical Systems, Bethesda, MD, USA, 26–27 July 2001; pp. 127–131. [Google Scholar]
- Wang, J.; Kong, J.; Lu, Y.; Qi, M.; Zhang, B. A modified FCM algorithm for MRI brain image segmentation using both local and non-local spatial constraints. Comput. Med. Imaging Graph. 2008, 32, 685–698. [Google Scholar] [CrossRef] [PubMed]
- Capelle, A.; Alata, O.; Fernandez, C.; Lefevre, S.; Ferrie, J.C. Unsupervised segmentation for automatic detection of brain tumors in MRI. In Proceedings of the 2000 International Conference on Image Processing, Vancouver, BC, Canada, 10–13 September 2000; Volume 1, pp. 613–616. [Google Scholar]
- Lee, C.-H.; Schmidt, M.; Murtha, A.; Bistritz, A.; Sander et, J.; Greiner, R. Segmenting brain tumors with conditional random fields and support vector machines. In Computer Vision for Biomedical Imaging Applications; Springer: Berlin, Heidelberg, 2005; pp. 469–478. [Google Scholar]
- Lao, Z.; Shen, D.; Jawad, A.; Karacali, B.; Liu, D.; Melhem, E.; Bryan, R.; Davatzikos, C. Automated segmentation of white matter lesions in 3D brain MR images, using multivariate pattern classification. In IEEE International Symposium on Biomedical Imaging: Macro to Nano; IEEE: Piscataway, NJ, USA, 2006; pp. 307–310. [Google Scholar]
- Mayer, A.; Greenspan, H. An Adaptive Mean-Shift Framework for MRI Brain Segmentation. IEEE Trans. Med Imaging 2009, 28, 1238–1250. [Google Scholar] [CrossRef]
- Goldberg-Zimring, D.; Azhari, H.; Miron, S.; Achiron, A. 3-D surface reconstruction of multiple sclerosis lesions using spherical harmonics. Magn. Reson. Med. 2001, 46, 756–766. [Google Scholar] [CrossRef]
- Zhou, Z.; Ruan, Z. Multicontext wavelet-based thresholding segmentation of brain tissues in magnetic resonance images. Magn. Reson. Med. 2007, 25, 381–385. [Google Scholar] [CrossRef]
- Nain, D.; Haker, S.; Bobick, A.; Tannenbaum, A. Multiscale 3-d shape representation and segmentation using spherical wavelets. IEEE Trans. Med Imaging 2007, 26, 598–618. [Google Scholar] [CrossRef]
- Taheri, S.; Ong, S.H.; Chong, V.F.H. Level-set segmentation of brain tumors using a threshold-based speed function. Image Vis. Comput. 2010, 28, 26–37. [Google Scholar] [CrossRef]
- Rital, S.; Cherifi, H.; Miguet, S. Weighted Adaptive Neighborhood Hypergraph Partitioning for Image Segmentation. In Proceedings of the 3rd International Conference on Advances in Pattern Recognition, ICAPR 2005, Lecture Notes in Computer Science, Bath, UK, 22–25 August 2005; Springer: Berlin/Heidelberg, Germany, 2005; Volume 3687, pp. 522–531. [Google Scholar] [CrossRef]
- Song, Z.; Tustison, N.; Avants, B.; Gee, J. Adaptive graph cuts with tissue priors for brain MRI segmentation. In Proceedings of the 3rd IEEE International Symposium on Biomedical Imaging: Nano to Macro, Arlington, VA, USA, 6–9 April 2006; pp. 762–765. [Google Scholar] [CrossRef]
- Xue, J.; Ruan, S.; Moretti, B.; Revenu, M.; Bloyet, D. Knowledge-based segmentation and labeling of brain structures from MRI images. Pattern Recognit. Lett. 2001, 22, 395–405. [Google Scholar] [CrossRef]
- Ruan, S.; Bloyet, D.; Revenu, M.; Dou, W.; Liao, Q. Cerebral magnetic resonance image segmentation using fuzzy Markov random fields. In Proceedings of the International Symposium on Biomedical Imaging, Washington, DC, USA, 7–10 July 2002; pp. 237–240. [Google Scholar]
- Mahmood, Q.; Chodorowski, A.; Mehnert, A. A novel Bayesian approach to adaptive mean shift segmentation of brain images. In Proceedings of the 25th IEEE International Symposium on Computer-Based Medical Systems, CBMS 2012, Rome, Italy, 20–22 June 2012. [Google Scholar] [CrossRef]
- Lazli, L.; Boukadoum, M. Quantification of Alzheimer’s Disease Brain Tissue Volume by an Enhanced Possibilistic Clustering Technique Based on Bias-Corrected Fuzzy Initialization. In Proceedings of the 16th IEEE International Conference on Ubiquitous Computing and Communications, Guangzhou, China, 12–15 December 2017; pp. 1434–1438. [Google Scholar] [CrossRef]
- Lazli, L.; Boukadoum, M. Brain tissues volumes assessment by fuzzy genetic optimization based possibilistic clustering: Application to Alzheimer patients images. In Proceedings of the 14th IEEE International Symposium on Pervasive Systems, Algorithms, and Networks, Exeter, UK, 21–23 June 2017; pp. 112–118. [Google Scholar] [CrossRef]
- Lazli, L.; Boukadoum, M.; Ait-Mohamed, O. Brain Tissue Classification of Alzheimer disease Using Partial Volume possibilistic Modeling: Application to ADNI Phantom Images. In Proceedings of the seventh International Conference on Image Processing Theory, Tools and Applications, Montreal, QC, Canada, 28 November–1 December 2017; pp. 1–5. [Google Scholar] [CrossRef]
- Lazli, L.; Boukadoum, M. Tissue segmentation by fuzzy clustering technique: Case study on Alzheimer’s disease. In Proceedings of the Medical Imaging: Imaging Informatics for Healthcare, Research, and Applications, Houston, TX, USA, 10–15 February 2018; p. 105791K. [Google Scholar] [CrossRef]
- Lazli, L.; Boukadoum, M. Dealing With Noise and Partial Volume Effects in Alzheimer Disease Brain Tissue Classification by a Fuzzy-Possibilistic Modeling Based on Fuzzy-Genetic Initialization. Int. J. Softw. Innov. (IJSI) 2019, 7, 119–143. [Google Scholar] [CrossRef]
- Akkus, Z.; Galimzianova, A.; Hoogi, A.; Rubin, D.L.; Erickson, B.J. Deep learning for brain MRI segmentation: State of the art and future directions. J. Digit. Imaging 2017, 30, 449–459. [Google Scholar] [CrossRef] [PubMed]
- Bahrami, K.; Rekik, I.; Shi, F.; Shen, D. Joint reconstruction and segmentation of 7t-like mr images from 3t mri based on cascaded convolutional neural networks. In International Conference on Medical Image Computing and Computer-Assisted Intervention; Springer: Cham, Switzerland, 2017; pp. 764–772. [Google Scholar] [CrossRef]
- Bernal, J.; Kushibar, K.; Asfaw, D.S.; Valverde, S.; Oliver, A.; Martí, R.; Lladó, X. Deep Convolutional Neural Networks for Brain Image Analysis on Magnetic Resonance Imaging: A Review. Artif. Intell. Med. 2019, 95, 64–81. [Google Scholar] [CrossRef] [PubMed]
- Brébisson, A.D.; Montana, G. Deep neural networks for anatomical brain segmentation. In Proceedings of the 2015 IEEE Conference on Computer Vision and Pattern Recognition Workshops (CVPRW), Boston, MA, USA, 7–12 June 2015; pp. 20–28. [Google Scholar]
- Hesamian, M.H.; Jia, W.; He, X.; Kennedy, P. Deep Learning Techniques for Medical Image Segmentation: Achievements and Challenges. J. Digit. Imaging 2019, 32, 582–596. [Google Scholar] [CrossRef] [PubMed]
- Mittal, M.; Goyal, L.M.; Kaur, S.; Kaur, I.; Verma, A.; Jude Hemanth, D. Deep learning based enhanced tumor segmentation approach for MR brain images. Appl. Soft Comput. 2019, 78, 346–354. [Google Scholar] [CrossRef]
- Moeskops, P.; Viergever, M.A.; Mendrik, A.M.; De Vries, L.S.; Benders, M.J.N.L.; Išgum, I. Automatic segmentation of MR brain images with a convolutional neural network. IEEE Trans. Med. Imaging 2016, 35, 1252–1261. [Google Scholar] [CrossRef]
- Wang, G.; Li, W.; Vercauteren, T.; Ourselin, S. Automatic Brain Tumor Segmentation Based on Cascaded Convolutional Neural Networks with Uncertainty Estimation. Front. Comput. Neurosci. 2019, 13, 56. [Google Scholar] [CrossRef]
- Zhou, T.; Ruan, S.; Canu, S. A review: Deep learning for medical image segmentation using multi-modality fusion. Array 2019, 31, 100004. [Google Scholar] [CrossRef]
- Ghosh, P.; Mitchell, M.; Tanyi, J.A.; Hung, A.Y. Incorporating priors for medical image segmentation using a genetic algorithm. Learn. Med. Imaging 2016, 195, 181–194. [Google Scholar] [CrossRef]
- Jedlicka, P.; Ryba, T. Genetic algorithm application in image segmentation. Pattern Recognit. Image Anal. 2016, 26, 497–501. [Google Scholar] [CrossRef]
- Kaushik, D.; Singh, U.; Singhal, P.; Singh, V. Medical Image Segmentation using Genetic Algorithm. Int. J. Comput. Appl. 2013, 81, 10–15. [Google Scholar] [CrossRef]
- Kavitha, A.R.; Chellamuthu, C. Brain tumour segmentation from MRI image using genetic algorithm with fuzzy initialisation and seeded modified region growing (GFSMRG) method. Imaging Sci. J. 2016, 64, 285–297. [Google Scholar] [CrossRef]
- Maulik, U. Medical Image Segmentation Using Genetic Algorithms. IEEE Trans. Inf. Technol. Biomed. Publ. IEEE Eng. Med. Biol. Soc. 2009, 13, 166–173. [Google Scholar] [CrossRef]
- McIntosh, C.; Hamarneh, G. Medial-Based Deformable Models in Nonconvex Shape-Spaces for Medical Image Segmentation. IEEE Trans. Med. Imaging 2011, 31, 33–50. [Google Scholar] [CrossRef]
- Bal, A.; Banerjee, M.; Sharma, P.; Maitra, M. Brain Tumor Segmentation on MR Image Using K-Means and Fuzzy-Possibilistic Clustering. In Proceedings of the 2nd International Conference on Electronics, Materials Engineering & Nano-Technology, Kolkata, India, 4–5 May 2018. [Google Scholar] [CrossRef]
- Dhanachandra, N.; Manglem, K.; Chanu, Y.J. Image Segmentation Using K -means Clustering Algorithm and Subtractive Clustering Algorithm. In Proceedings of the ICCN 2015/ICDMW/ ICISP 2015 2018 2015, Bangalore, India, 21–23 August 2015; Volume 54, pp. 764–771. [Google Scholar] [CrossRef]
- Liu, J.; Guo, L. An Improved K-means Algorithm for Brain MRI Image Segmentation. In 3rd International Conference on Mechatronics, Robotics and Automation; Atlantis Press: Shenzhen, China, 2015. [Google Scholar] [CrossRef]
- Liu, J.; Guo, L. A new brain MRI image segmentation strategy based on wavelet transform and K-means clustering. In Proceedings of the 2015 IEEE International Conference on Signal Processing 2015, Communications and Computing (ICSPCC), Ningbo, China, 19–22 September 2015; pp. 1–4. [Google Scholar] [CrossRef]
- Swathi, K.; Balasubramanian, K. Preliminary investigations on automatic segmentation methods for detection and volume calculation of brain tumor from MR images. Biomed. Res. 2016, 27, 563–569. [Google Scholar]
- Cai, W.; Chen, S.; Zhang, D. Fast and robust fuzzy C-means clustering algorithms incorporating local information for image segmentation. Pattern Recognit. 2007, 40, 825–838. [Google Scholar] [CrossRef]
- Chuang, K.-S.; Tzeng, H.-L.; Chen, S.; Wu, J.; Chen, T.-J. Fuzzy C-means clustering with spatial information for image segmentation. Comput. Med. Imaging Graph. 2006, 30, 9–15. [Google Scholar] [CrossRef] [PubMed]
- Shen, S.; Sandham, W.; Granat, M.; Sterr, A. MRI fuzzy segmentation of brain tissue using neighborhood attraction with neural-network optimization. IEEE Trans. Inf. 2005, 9, 459–467. [Google Scholar] [CrossRef] [PubMed]
- Sikka, K.; Sinha, N.; Singh, P.; Mishra, A. A fully automated algorithm under modified FCM framework for improved brain MR image segmentation. Magn. Reson. Imaging 2009, 27, 994–1004. [Google Scholar] [CrossRef]
- Sucharitha, M.; Jackson, D.; Anand, M.D. Brain Image Segmentation Using Adaptive Mean Shift Based Fuzzy C Means Clustering Algorithm. Int. Conf. Model. Optim. Comput. 2012, 38, 4037–4042. [Google Scholar] [CrossRef][Green Version]
- Szilagyi, L.; Benyo, Z.; Szilagyi, S.M.; Adam, H.S. MR brain image segmentation using an enhanced fuzzy C-means algorithm. In Proceedings of the 25th Annual International Conference of the IEEE Engineering in Medicine and Biology Society (IEEE Cat. No.03CH37439), Cancun, Mexico, 17–21 September 2003; Volume 1, pp. 724–726. [Google Scholar] [CrossRef]
- Zhang, D.-Q.; Chen, S.-C. A novel kernelized fuzzy C-means algorithm with application in medical image segmentation. Atificial Intell. Med. China 2004, 32, 37–50. [Google Scholar] [CrossRef] [PubMed]
- Mayer, A.; Greenspan, H. Segmentation of brain MRI by adaptive mean shift. In Proceedings of the 3rd IEEE International Symposium on Biomedical Imaging: Macro to Nano, Arlington, VA, USA, 6–9 April 2006; pp. 319–322. [Google Scholar] [CrossRef]
- Singh, B.; Aggarwal, P. Detection of brain tumor using modified mean-shift based fuzzy c-mean segmentation from MRI Images. In Proceedings of the 8th IEEE Annual Information Technology 2017, Electronics and Mobile Communication Conference (IEMCON), Vancouver, BC, Canada, 3–5 October 2017; pp. 536–545. [Google Scholar] [CrossRef]
- Vallabhaneni, R.B.; Rajesh, V. Brain tumour detection using mean shift clustering and GLCM features with edge adaptive total variation denoising technique. Alex. Eng. J. 2018, 57, 2387–2392. [Google Scholar] [CrossRef]
- Anithadevi, D.; Perumal, K. A hybrid approach based segmentation technique for brain tumor in MRI Images. arXiv 2016, arXiv:1603.02447. [Google Scholar]
- Wang, Z. An Automatic Region-Based Image Segmentation System for Remote Sensing Applications; Proquest: Ann Arbor, MI, USA, 2008. [Google Scholar]
- Chidadala, J.; Maganty, S.N.; Prakash, N. Automatic Seeded Selection Region Growing Algorithm for Effective MRI Brain Image Segmentation and Classification. In 2019—System Reliability, Quality Control, Safety, Maintenance and Management. ICICCT 2019; Gunjan, V., Garcia Diaz, V., Cardona, M., Solanki, V., Sunitha, K., Eds.; Springer: Singapore, 2020. [Google Scholar]
- Javadpour, A. and Mohammadi Improving Brain Magnetic Resonance Image (MRI). Segmentation via a Novel Algorithm based on Genetic and Regional Growth. J. Biomed. Phys. Eng. 2016, 6, 95–108. [Google Scholar]
- Mohammadi, A.; Javadpour, A. A New Algorithm Based on Regional Growth in Segmentation of Brain’s Magnetic Resonance Imaging: New Method to Diagnosis of Mild Cognitive Impairment; Academia.Edu: San Francisco, CA, USA, 2015. [Google Scholar]
- Weglinski, T.; Fabijańska, A. Brain tumor segmentation from MRI data sets using region growing approach. In Proceedings of the 2011 Proceedings of 7th International Conference on Perspective Technologies and Methods in MEMS Design 2015, Vancouver, BC, Canada, 3–5 October 2011. [Google Scholar]
- Balafar, M.A. Gaussian mixture model based segmentation methods for brain MRI images. Artif. Intell. Rev. 2014, 41, 429–439. [Google Scholar] [CrossRef]
- Ji, Z.; Xia, Y.; Zheng, Y. Robust generative asymmetric GMM for brain MR image segmentation. Comput. Methods Programs Biomed. 2017, 151, 123–138. [Google Scholar] [CrossRef]
- Moraru, L.; Moldovanu, S.; Dimitrievici, L.T.; Dey, N.; Ashour, A.S.; Shi, F.; Fong, S.J.; Khan, S.; Biswas, A. Gaussian mixture model for texture characterization with application to brain DTI images. J. Adv. Res. 2019, 16, 15–23. [Google Scholar] [CrossRef]
- Subashini, T.S.; Balaji, G.N.; Akila, S. Brain tissue segmentation in MRI images using GMM. Int. J. Appl. Eng. Res. 2015, 10, 102–107. [Google Scholar]
- Zhu, F.; Song, Y.; Chen, J. Brain MR image segmentation based on Gaussian mixture model with spatial information. In Proceedings of the 2010 3rd International Congress on Image and Signal Processing, Yantai, China, 16–18 October 2010; Volume 3, pp. 1346–1350. [Google Scholar] [CrossRef]
- Nguyen, T.M.; Wu, Q.J. Robust Student’s-t Mixture Model with Spatial Constraints and Its Application in Medical Image Segmentation. IEEE Trans. Med Imaging 2012, 31, 103–116. [Google Scholar] [CrossRef]
- Chen, M.; Yan, Q.; Qin, M. A segmentation of brain MRI images utilizing intensity and contextual information by Markov random field. Comput. Assist. Surg. 2017, 22, 200–211. [Google Scholar] [CrossRef] [PubMed]
- Scherrer, B.; Dojat, M.; Forbes, F.; Garbay, C. MRF Agent Based Segmentation: Application to MRI Brain Scans. In Artificial Intelligence in Medicine; Bellazzi, R., Abu-Hanna, A., Hunter, J., Eds.; Springer: Berlin, Germany, 2007; pp. 13–23. [Google Scholar]
- Yousefi, S.; Azmi, R.; Zahedi, M. Brain tissue segmentation in MR images based on a hybrid of MRF and social algorithms. Med Image Anal. 2012, 16, 840–848. [Google Scholar] [CrossRef]
- Zhang, Y.; Lu, P.; Liu, X.; Zhou, S. A modified MRF segmentation of brain MR images. In Proceedings of the 10th International Congress on Image and Signal Processing 2017, BioMedical Engineering and Informatics (CISP-BMEI), Shanghai, China, 14–16 October 2017; pp. 1–5. [Google Scholar] [CrossRef]
- Chen, Y.; Pham, T.D. Development of a brain MRI-based hidden Markov model for dementia recognition. Biomed. Eng. Online 2013, 12, S2. [Google Scholar] [CrossRef] [PubMed]
- Ibrahim, M.; John, N.; Kabuka, M.; Younis, A. Hidden Markov models-based 3D MRI brain segmentation. Image Vis. Comput. 2006, 24, 1065–1079. [Google Scholar] [CrossRef]
- Ismail, M.; Soliman, A.; Ghazal, M.; Switala, A.E.; Gimel’farb, G.; Barnes, G.N.; Khalil, A.; El-Baz, A. A fast stochastic framework for automatic MR brain images segmentation. PLoS ONE 2017, 12, e0187391. [Google Scholar] [CrossRef]
- Mirzaei, F.; Parishan, M.R.; Faridafshin, M.; Faghihi, R.; Sina, S. Automated brain tumor segmentation in mr images using a hidden markov classifier framework trained by svd-derived features. ICTACT J. Image Video Process. 2018, 9. [Google Scholar] [CrossRef]
- Sharma, S.; Rattan, M. An Improved Segmentation and Classifier Approach Based on HMM for Brain Cancer Detection. Open Biomed. Eng. J. 2019, 28, 13. [Google Scholar] [CrossRef]
- Ayachi, R.; Amor, B.; Brain, N. Tumor Segmentation Using Support Vector Machines. In Symbolic and Quantitative Approaches to Reasoning with Uncertainty; Sossai, C., Chemello, G., Eds.; Springer: Berlin, Germany, 2009; pp. 736–747. [Google Scholar]
- Kathane, M.S.; Thakare, V. Brain Segmentation using Support Vector Machine: Diagnostic Intelligence Approach. In International Conference on Benchmarks in Engineering Science and Technology ICBEST; Proceedings published by International Journal of Computer Applications® (IJCA): Maharashtra, India, 2012; pp. 12–14. [Google Scholar]
- Liu, Y.; Zhang, H.; Li, P. Research on SVM-based MRI image segmentation. J. China Univ. Posts Telecommun. 2011, 18, 129–132. [Google Scholar] [CrossRef]
- Reddy, U.J.; Dhanalakshmi, P.; Reddy, P.D.K. Image segmentation technique using SVM classifier for detection of medical disorders. Ing. Syst. Inf. 2019, 24, 173–176. [Google Scholar] [CrossRef]
- Romeny, B.M.H. Foundations of scale-space. In: Front-End Vision and Multi-Scale Image Analysis. In Computational Imaging and Vision; Springer: Dordrecht, The Netherlands, 2003; Volume 27. [Google Scholar]
- Lindeberg, T. Spatio-temporal scale selection in video data. In Proceedings of the Scale Space and Variational Methods in Computer Vision (SSVM 2017); Springer LNCS: Kolding, Denmark, 2017; Volume 10302, pp. 3–15. [Google Scholar]
- Tau, M.; Hassner, T. Dense correspondences across scenes and scales. IEEE Trans. Pattern Anal. Mach. Intell. 2015, 38, 875–888. [Google Scholar] [CrossRef]
- Witkin, A. Scale-space filtering. In Readings in Computer Vision; Morgan Kaufmann: Karlsruhe, Germany, 1983; pp. 1019–1022. [Google Scholar]
- Hsiao, Y.-T.; Chuang, C.-L.; Jiang, J.-A.; Chien, C.-C. A contour based image segmentation algorithm using morphological edge detection. In Proceedings of the 2005 IEEE International Conference on Systems, Man and Cybernetics, Waikoloa, HI, USA, 12 October 2005; Volume 3, pp. 2962–2967. [Google Scholar] [CrossRef]
- Senthilkumaran, N.; Kirubakaran, C. A Case Study on Mathematical Morphology Segmentation for MRI Brain Image. Int. J. Comput. Sci. Inf. Technol. 2014, 5, 5336–5340. [Google Scholar]
- Beare, R.; Chen, J.; Adamson, C.L.; Silk, T.; Thompson, D.K.; Yang, J.Y.; Wood, A.G. Brain extraction using the watershed transform from markers. Front. Neuroinform. 2013, 7, 32. [Google Scholar] [CrossRef] [PubMed]
- Ghosh, N.; Sun, Y.; Turenius, C.; Bhanu, B.; Obenaus, A.; Ashwal, S. Computational Analysis: A Bridge to Translational Stroke Treatment. In Translational Stroke Research; Springer: New York, NY, USA, 2012. [Google Scholar] [CrossRef]
- Akram, F.; Garcia, M.A.; Puig, D. Active contours driven by local and global fitted image models for image segmentation robust to intensity inhomogeneity. PLoS ONE 2017, 12, e0174813. [Google Scholar] [CrossRef] [PubMed]
- Al-Tamimi, M.; Sulong, G. A Review of Snake Models in Medical MR Image Segmentation. Jurnal Teknol. 2014, 2, 101–106. [Google Scholar] [CrossRef][Green Version]
- Chen, H.; Yu, X.; Wu, C.; Wu, J. An active contour model for brain magnetic resonance image segmentation based on multiple descriptors. Int. J. Adv. Robot. Syst. 2018, 25, 15. [Google Scholar] [CrossRef]
- Meng, X.; Gu, W.; Chen, Y.; Zhang, J. Brain MR image segmentation based on an improved active contour model. PLoS ONE 2017, 12, e0183943. [Google Scholar] [CrossRef]
- Voronin, V.; Semenishchev, E.; Pismenskova, M.; Balabaeva, O.; Agaian, S. Medical image segmentation by combing the local, global enhancement, and active contour model. Proc. SPIE 2019. [Google Scholar] [CrossRef]
- Tsechpenakis, G. Deformable Model-Based Medical Image Segmentation. In Multi Modality State-of-the-Art Medical Image Segmentation and Registration Methodologies: Volume 1; El-Baz, A.S., Acharya, U.R., Mirmehdi, M., Suri, J.S., Eds.; Springer: Boston, MA, USA, 2011; pp. 33–67. [Google Scholar] [CrossRef]
- Jayadevappa, D.; Kumar, S.S.; Murty, D.S. Medical Image Segmentation Algorithms using Deformable Models: A Review. IETE Tech. Rev. 2011, 28, 248–255. [Google Scholar] [CrossRef]
- Yang, Y.; Jia, W.; Yang, Y. Multi-atlas segmentation and correction model with level set formulation for 3D brain MR images. Pattern Recognit. 2019, 90, 450–463. [Google Scholar] [CrossRef]
- Huo, Y. Data-driven Probabilistic Atlases Capture Whole-brain Individual Variation. arXiv 2015, arXiv:1806.02300. [Google Scholar]
- Basukala, D.; Jha, D.; Kwon, G.-R. Brain Image Segmentation Based on Dual-Tree Complex Wavelet Transform and Fuzzy C-Means Clustering Algorithm. J. Med Imaging Health Inform. 2018, 8, 1776–1781. [Google Scholar] [CrossRef]
- Si, T.; De, A.; Bhattacharjee, A.K. Segmentation of Brain MRI Using Wavelet Transform and Grammatical Bee Colony. J. Circuits Syst. Comput. 2017, 27, 1850108. [Google Scholar] [CrossRef]
- Tian, D.; Fan, L. MR brain image segmentation based on wavelet transform and SOM neural network. In Proceedings of the 2010 Chinese Control and Decision Conference 2010, Xuzhou, China, 26–28 May 2010; pp. 4243–4246. [Google Scholar] [CrossRef]
- Goldberg-Zimring, D.; Talos, I.F.; Bhagwat, J.G.; Haker, S.J.; Black, P.M.; Zou, K.H. Statistical validation of brain tumor shape approximation via spherical harmonics for image-guided neurosurgery. Acad. Radiol. 2005, 12, 459–466. [Google Scholar] [CrossRef] [PubMed][Green Version]
- Guillaume, H.; Dillenseger, J.-L.; Patard, J.-J. Intra subject 3D/3D kidney registration/modeling using spherical harmonics applied on partial information. In Proceedings of the 26th Annual International Conference of the IEEE Engineering in Medicine and Biology Society, San Francisco, CA, USA, 1–5 September 2004. [Google Scholar]
- Nitzken, M.; Casanova, M.F.; Gimel’farb, G.; Khalifa, F.; Elnakib, A.; Switala, A.E.; El-Baz, A. 3D shape analysis of the brain cortex with application to autism. In Proceedings of the 2011 IEEE International Symposium on Biomedical Imaging: From Nano to Macro, Chicago, IL, USA, 30 March–2 April 2011; pp. 1847–1850. [Google Scholar] [CrossRef]
- Dillenseger, J.-L. Spherical Harmonics Based Intrasubject 3-D Kidney Modeling/Registration Technique Applied on Partial Information. In IEEE Transactions on Biomedical Engineering; IEEE: Piscataway, NJ, USA, 2006. [Google Scholar]
- Chen, Y.; Zhang, J.; Macione, J. An improved level set method for brain MR image segmentation and bias correction. Comput. Med imaging Graph. Off. J. Comput. Med Imaging Soc. 2009, 33, 510–519. [Google Scholar] [CrossRef] [PubMed]
- Chen, T.F. Medical Image Segmentation Using Level Sets. Technical Report #CS-2008-12. Available online: https://pdfs.semanticscholar.org/08cf/16fcdc3f2907f8ab1d0f5fe331c6b2254ee9.pdf (accessed on 4 May 2019).
- Duth, P.S.; Saikrishnan, V.P.; Vipuldas, V.P. Variational level set and level set method for mri brain image segmentation: A review. In Proceedings of the 2017 International Conference on Communication and Signal Processing (ICCSP), Chennai, India, 6–8 April 2017; pp. 1555–1558. [Google Scholar] [CrossRef]
- Lok, K.; Shi, L.; Zhu, X.; Wang, D. Fast and robust brain tumor segmentation using level set method with multiple image information. Impact of advanced parallel or cloud computing technologies for image guided diagnosis and therapy. J. X-ray Sci. Technol. 2017, 25, 301–312. [Google Scholar] [CrossRef]
- Duth, P.S.; Kulkarni, V.A. An enhanced variational level set method for MRI brain image segmentation using IFCM clustering and LBM. Int. J. Eng. Technol. 2018, 7, 23–28. [Google Scholar] [CrossRef]
- Durgadevi, R.; Hemalatha, B.; Kaliappan, K.V.K. Detection of Mammograms Using Honey Bees Mating Optimization Algorithm (M-HBMO). In Proceedings of the 2014 World Congress on Computing and Communication Technologies, Trichirappalli, India, 27 Feburary–1 March 2014. [Google Scholar]
- Abdallah, Y.; Abdelhamid, A.; Elarif, T.; Salem, A.B. Intelligent Techniques in Medical Volume Visualization. Procedia Comput. Sci. 2015, 65, 546–555. [Google Scholar] [CrossRef]
- Hu, J.; Wei, X.; He, H. Brain Image Segmentation Based on Hypergraph Modeling. In Proceedings of the 2014 IEEE 12th International Conference on Dependable, Autonomic and Secure Computing, Dalian, China, 24–27 August 2014. [Google Scholar] [CrossRef]
- Shen, Y.; Hu, J.; Lu, Y.; Wang, X. Stock trends prediction by hypergraph modeling. In Proceedings of the 2012 IEEE International Conference on Computer Science and Automation Engineering, Beijing, China, 22–24 June 2012. [Google Scholar]
- Bretto, A.; Gillibert, L. Hypergraph-Based Image Representation. In Graph-Based Representations in Pattern Recognition; Brun, L., Vento, M., Eds.; Springer: Berlin Heidelberg, 2005; pp. 1–11. [Google Scholar]
- Chen, V.; Ruan, S. Graph cut segmentation technique for MRI brain tumor extraction. In Proceedings of the 2010 2nd International Conference on Image Processing Theory 2010, Tools and Applications, Paris, France, 7–10 July 2010; pp. 284–287. [Google Scholar] [CrossRef]
- Dogra, J.; Jain, S.; Sood, M. Segmentation of MR Images using Hybrid kMean-Graph Cut Technique. Procedia Comput. Sci. 2018, 132, 775–784. [Google Scholar] [CrossRef]
- Masterravi. Interactive Segmentation using Graph Cuts. Biometrics, Computer Vision, Image Processing. TECH GEEK, My Understanding of Algorithms and Technology. 2011. Available online: https://masterravi.wordpress.com/2011/05/24/interactive-segmentation-using-graph-cutsmatlab-code/ (accessed on 28 March 2019).
- Song, Z.; Tustison, N.; Avants, B.; Gee, J.C. Integrated Graph Cuts for Brain MRI Segmentation. Medical Image Computing and Computer-Assisted Intervention–MICCAI 2006. In Lecture Notes in Computer Science; Larsen, R., Nielsen, M., Sporring, J., Eds.; Springer: Berlin, Heidelberg, 2006; Volume 4191. [Google Scholar] [CrossRef]
- Wels, M.; Carneiro, G.; Aplas, A.; Huber, M.; Hornegger, J.; Comaniciu, D.A. Discriminant Model-Constrained Graph Cuts Approach to Fully Automated Pediatric Brain Tumor Segmentation in 3-D MRI. In MICCAI’08 Proceedings of the 11th International Conference on Medical Image Computing and Computer-Assisted Intervention—Part I; Springer: Berlin, Heidelberg, 2008; pp. 67–75. [Google Scholar] [CrossRef]
- Dehdasht-Heydari, R.; Gholami, S. Automatic Seeded Region Growing (ASRG) Using Genetic Algorithm for Brain MRI Segmentation. Wirel. Pers. Commun. 2019, 109, 897–908. [Google Scholar] [CrossRef]
- Ilhan, U.; Ilhan, A. Brain tumor segmentation based on a new threshold approach. In Proceedings of the 9th International Conference on Theory and Application of Soft Computing, Computing with Words and Perception, ICSCCW 2017, Budapest, Hungary, 22–23 August 2017; Volume 120, pp. 580–587. [Google Scholar] [CrossRef]
- Ruf, A.; Greenspan, H.; Goldberger, J. Tissue Classification of Noisy MR Brain Images Using Constrained GMM. In Medical Image Computing and Computer-Assisted Intervention — MICCAI 2005; Duncan, J.S., Gerig, G., Eds.; Springer: Berlin, Germany, 2005; pp. 790–797. [Google Scholar]
- Ciofolo, C.; Barillot, C. Brain segmentation with competitive level sets and fuzzy control. In Information Processing in Medical Imaging; Lecture Notes in Computer Science; Springer: Heidelberg, Berlin, Germany, 2005; Volume 3565, pp. 333–344. [Google Scholar]
- Dong, P.; Guo, Y.; Gao, Y.; Liang, P.; Shi, Y.; Wang, Q.; Shen, D.; Wu, G. Multi-Atlas Based Segmentation of Brainstem Nuclei from MR Images by Deep Hyper-Graph Learning. In Patch-Based Techniques in Medical Imagin; Wu, G., Coupé, P., Zhan, Y., Munsell, B.C., Rueckert, D., Eds.; Springer International Publishing: Heidelberg, Berlin, Germany, 2016; pp. 51–59. [Google Scholar]
- Jenkinson, M.; Beckmann, C.F.; Behrens, T.E.; Woolrich, M.W.; Smith, S.M. FSL. NeuroImage. 2012, 62, 782–790. [Google Scholar] [CrossRef]
- Brugger, S.P.; Howes, O.D. Heterogeneity and Homogeneity of Regional Brain Structure in Schizophrenia: A Meta-analysis. JAMA Psychiatry 2017, 74, 1104–1111. [Google Scholar] [CrossRef] [PubMed]
- Gupta, L.; Besseling, R.M.; Overvliet, G.M.; Hofman, P.A.; de Louw, A.; Vaessen, M.J.; Aldenkamp, A.P.; Ulman, S.; Jansen, J.F.; Backes, W.H. Spatial heterogeneity analysis of brain activation in fMRI. NeuroImage Clin. 2014, 5, 266–276. [Google Scholar] [CrossRef] [PubMed]
- Wang, L.; Li, G.; Adeli, E.; Liu, M.; Wu, Z.; Meng, Y.; Lin, W.; Shen, D. Anatomy-guided joint tissue segmentation and topological correction for 6-month infant brain MRI with risk of autism. Hum. Brain Mapp. 2018, 39, 2609–2623. [Google Scholar] [CrossRef] [PubMed]
- Luo, Y.; Liu, L.; Huang, Q.; Li, X. A Novel Segmentation Approach Combining Region- and Edge-Based Information for Ultrasound Images. BioMed Res. Int. 2017. [Google Scholar] [CrossRef] [PubMed]
- Nosrati, M.S.; Hamarneh, G. Incorporating Prior Knowledge in Medical Image Segmentation: A Survey. arXiv 2016, arXiv:1607.01092. [Google Scholar]
- Klöppel, S.; Stonnington, C.M.; Chu, C.; Draganski, B.; Scahill, R.I.; Rohrer, J.D.; Fox, N.C.; Jack, C.R., Jr.; Ashburner, J.; Frackowiak, R.S. Automatic classification of MR scans in Alzheimer’s disease. Brain 2008, 131, 681–689. [Google Scholar] [CrossRef]
- Zhou, L.; Wang, Y.; Li, Y.; Yap, P.-T.; Shen, D. Hierarchical anatomical brain networks for MCI prediction by partial least square analysis. In Proceedings of the IEEE International Conference on Computer Vision and Pattern Recognition (CVPR), Providence, RI, USA, 20–25 June 2011; pp. 1073–1080. [Google Scholar]
- Li, S.; Shi, F.; Pu, F.; Li, X.; Jiang, T.; Xie, S.; Wang, Y. Hippocampal shape analysis of Alzheimer disease based on machine learning methods. Am. J. Neuroradiol. 2007, 28, 1339–1345. [Google Scholar] [CrossRef]
- Colliot, O.; Chételat, G.; Chupin, M.; Desgranges, B.; Magnin, B.; Benali, H.; Dubois, B.; Garnero, L.; Eustache, F.; Lehéricy, S. Discrimination between Alzheimer disease, mild cognitive impairment, and normal aging by using automated segmentation of the hippocampus. Radiology 2008, 248, 194–201. [Google Scholar] [CrossRef]
- Chaplot, S.; Patnaik, L.M.; Jagannathan, N.R. Classification of magnetic resonance brain images using wavelets as input to support vector machine and neural network. Biomed. Signal Process. Control 2006, 1, 86–92. [Google Scholar] [CrossRef]
- Zhang, Y.; Dong, Z.; Wu, L.; Wang, S. A hybrid method for MRI brain image classification. Expert Syst. Appl. 2011, 38, 10049–10053. [Google Scholar] [CrossRef]
- Magnin, B.; Mesrob, L.; Kinkingnéhun, S.; Pélégrini-Issac, M.; Colliot, O.; Sarazin, M.; Dubois, B.; Lehéricy, S.; Benali, H. Support vector machine-based classification of Alzheimer’s disease from whole-brain anatomical MRI. Neuroradiology 2009, 51, 73–83. [Google Scholar] [CrossRef] [PubMed]
- Chincarini, A.; Bosco, P.; Calvini, P.; Gemme, G.; Esposito, M.; Olivieri, C.; Rei, L.; Squarcia, S.; Rodriguez, G.; Bellotti, R.; et al. Local MRI analysis approach in the diagnosis of early and prodromal Alzheimer’s disease. NeuroImage 2011, 58, 469–480. [Google Scholar] [CrossRef] [PubMed]
- Li, Y.; Wang, Y.; Wu, G.; Shi, F.; Zhou, L.; Lin, W.; Shen, D. Discriminant analysis of longitudinal cortical thickness changes in Alzheimer’s disease using dynamic and network features. Neurobiol. Aging 2012, 33, e15–e30. [Google Scholar] [CrossRef]
- Plant, C.; Teipel, S.J.; Oswald, A.; Böhm, C.; Meindl, T.; Mourao-Miranda, J.; Bokde, A.W.; Hampel, H.; Ewers, M. Automated detection of brain atrophy patterns based on MRI for the prediction of Alzheimer’s disease. NeuroImage 2010, 50, 162–174. [Google Scholar] [CrossRef] [PubMed]
- Graña, M.; Termenon, M.; Savio, A.; Gonzalez-Pinto, A.; Echeveste, J.; Pérez, J.M.; Besga, A. Computer aided diagnosis system for Alzheimer disease using brain diffusion tensor imaging features selected by Pearson’s correlation. Neurosci. Lett. 2011, 502, 225–229. [Google Scholar] [CrossRef] [PubMed]
- Wolz, R.; Julkunen, V.; Koikkalainen, J.; Niskanen, E.; Zhang, D.P.; Rueckert, D.; Soininen, H.; Lötjönen, J. Multi-method analysis of MRI images in early diagnostics of Alzheimer’s disease. PLoS ONE 2011, 6, e25446. [Google Scholar] [CrossRef] [PubMed]
- Daliri, M.R. Automated diagnosis of Alzheimer disease using the scale-invariant feature transforms in magnetic resonance images. J. Med. Syst. 2012, 36, 995–1000. [Google Scholar] [CrossRef]
- Lahmiri, S.; Boukadoum, M. Automatic detection of Alzheimer disease in brain magnetic resonance images using fractal features. In Proceedings of the 6th International IEEE EMBS Conference on Neural Engineering, San Diego, CA, USA, 6–8 November 2013. [Google Scholar]
- Joshi, D.; Rana, N.K.; Misra, V.M. Classification of Brain Cancer using Artificial Neural Network. In Proceedings of the 2010 2nd International Conference on Electronic Computer Technology, Kuala Lumpur, Malaysia, 7–10 May 2010. [Google Scholar] [CrossRef]
- Latif, G.; Butt, M.M.; Khan, A.H.; Butt, M.O.; Al-Asad, J.F. Automatic Multimodal Brain Image Classification Using MLP and 3D Glioma Tumor Reconstruction. In Proceedings of the 2017 9th IEEE-GCC Conference and Exhibition (GCCCE), Manama, Bahrain, 8–11 May 2017; pp. 1–9. [Google Scholar] [CrossRef]
- Natteshan, N.V.; Jothi, J.A. Automatic Classification of Brain MRI Images Using SVM and Neural Network Classifiers. In Advances in Intelligent Informatics; EEl-Alfy, S.M., Thampi, S.M., Takagi, H., Piramuthu, S., Hanne, T., Eds.; Springer International Publishing: Cham, Switzerland, 2015; pp. 19–30. [Google Scholar]
- Samanta, A.; Khan, A. Computer Aided Diagnostic System for Detection and Classification of a Brain Tumor through MRI Using Level Set Based Segmentation Technique and ANN Classifier. World Academy of Science, Engineering and Technology. Int. J. Biomed. Biol. Eng. 2017, 11, 340–347. [Google Scholar]
- Veer, S.S.; Patil, P.M. Brain tumor classification using artificial neural network on mri images. Int. J. Res. Eng. Technol. 2015, 4, 218–226. [Google Scholar]
- Tandel, G.S.; Biswas, M.; Kakde, O.G.; Tiwari, A.; Suri, H.S.; Turk, M.; Laird, J.R.; Asare, C.K.; Ankrah, A.A.; Khanna, N.N. A Review on a Deep Learning Perspective in Brain Cancer Classification. Cancers 2019, 11, 111. [Google Scholar] [CrossRef]
- Varuna Shree, N.; Kumar, T. Identification and classification of brain tumor MRI images with feature extraction using DWT and probabilistic neural network. Brain Inform. 2018, 5, 23–30. [Google Scholar] [CrossRef] [PubMed]
- Arora, A.; Roy, P.; Venktesan, S.; Babu, R. k-NN Based Classification of Brain MRI Images using DWT and PCA to Detect Different Types of Brain Tumour. Int. J. Med. Res. Health Sci. 2017, 6, 15–20. [Google Scholar]
- Bharanidharan, N.; Rajaguru, H.; Geetha, V. Performance Analysis of KNN Classifier with and without GLCM Features in Brain Tumor Detection. Int. J. Innov. Technol. Explor. Eng. 2018, 8, 103–106. [Google Scholar]
- Meenakshi, R.; Anandhakumar, P. A Hybrid Brain Tumor Classification and Detection Mechanism Using Knn and Hmm. Curr. Med. Imaging 2015, 11, 70. [Google Scholar] [CrossRef]
- Sudharani, K.; Sarma, T.C.; Prasad, K.S. Brain stroke detection using K-Nearest Neighbor and Minimum Mean Distance technique. In Proceedings of the 2015 International Conference on Control, Instrumentation, Communication and Computational Technologies, Kumaracoil, India, 18–19 December 2015. [Google Scholar] [CrossRef]
- Chaddad, A.; Zinn, P.O.; Colen, R.R. Brain tumor identification using Gaussian Mixture Model features and Decision Trees classifier. In Proceedings of the 48th Annual Conference on Information Sciences and Systems (CISS), Princeton, NJ, USA, 19–21 March 2014; pp. 1–4. [Google Scholar] [CrossRef]
- Deepa, A.R.; Sam Emmanuel, W.R.M. Identification and classification of brain tumor through mixture model based on magnetic resonance imaging segmentation and artificial neural network. Concepts Magn. Reson. Part A. 2017, 45, e21390. [Google Scholar] [CrossRef]
- Forbes, F. Mixture Models for Image Analysis. In Handbook of Mixture Analysis; Sylvia, F.-S., Celeux, G., Christian, G.C., Robert, P., Eds.; CRC Press: Boca Raton, FL, USA, 2018; pp. 397–418. [Google Scholar]
- Gorriz, J.; Segovia, F.; Ramírez, J.; Lassl, A.; Salas-Gonzalez, D. GMM based SPECT image classification for the diagnosis of Alzheimer’s disease. Appl. Soft Comput. 2011, 11, 2313–2325. [Google Scholar] [CrossRef]
- Segovia, F.; Górriz, J.M.; Ramírez, J.; Salas-González, D.; Álvarez, I.; López, M.; Padilla, P. Classification of functional brain images using a GMM-based multi-variate approach. Neurosci. Lett. 2010, 474, 58–62. [Google Scholar] [CrossRef]
- Chinnu, A. Brain Tumor Classification Using SVM and Histogram Based Image Segmentation. Int. J. Sci. Res. 2015, 4, 1647–1650. [Google Scholar]
- Fabelo, H.; Ortega, S.; Casselden, E.; Loh, J.; Bulstrode, H.; Zolnourian, A.; Sarmiento, R. SVM Optimization for Brain Tumor Identification Using Infrared Spectroscopic Samples. Sensors 2018, 18, 4487. [Google Scholar] [CrossRef]
- Hamiane, M.; Saeed, F. SVM Classification of MRI Brain Images for Computer-Assisted Diagnosis. Int. J. Electr. Comput. Eng. 2017, 7, 2555. [Google Scholar] [CrossRef][Green Version]
- Vaishnavee, K.B.; Amshakala, K. An automated MRI brain image segmentation and tumor detection using SOM-clustering and Proximal Support Vector Machine classifier. In Proceedings of the 2015 IEEE International Conference on Engineering and Technology (ICETECH), Coimbatore, Indian, 20 March 2015. [Google Scholar] [CrossRef]
- Goswami, S.; Tiwari, A.; Pali, V.; Tripathi, A. A Correlative Analysis of SOM and FCM Classifier for Brain Tumour Detection. Int. J. Innov. Technol. Explor. Eng. 2019, 8, 718–723. [Google Scholar]
- Ahmmed, R.; Hossain, M.F. Tumor detection in brain MRI image using template based K-means and Fuzzy C-means clustering algorithm. In Proceedings of the 2016 International Conference on Computer Communication and Informatics (ICCCI), Coimbatore, India, 7–9 January 2016; pp. 1–6. [Google Scholar] [CrossRef]
- Alam, M.S.; Rahman, M.M.; Hossain, M.A.; Islam, M.K.; Ahmed, K.M.; Ahmed, K.T.; Singh, B.C.; Miah, M.S. Automatic Human Brain Tumor Detection in MRI Image Using Template-Based K Means and Improved Fuzzy C Means Clustering Algorithm. Big Data Cogn. Comput. 2019, 3, 27. [Google Scholar] [CrossRef]
- Duraisamy, B.; Shanmugam, J.V.; Annamalai, J. Alzheimer disease detection from structural MR images using FCM based weighted probabilistic neural network. Brain Imaging Behav. 2019, 13, 87–110. [Google Scholar] [CrossRef] [PubMed]
- Mathur, N.; Meena, Y.K.; Mathur, S.; Mathur, D. Detection of Brain Tumor in MRI Image through Fuzzy-Based Approach. High-Resolut. Neuroimaging—Basic Phys. Princ. Clin. Appl. 2018. [Google Scholar] [CrossRef]
- Miranda, E.; Aryuni, M.; Irwansyah, E. A survey of medical image classification techniques. In Proceedings of the 2016 International Conference on Information Management and Technology (ICIMTech), Bandung, Indonesia, 16–18 November 2016. [Google Scholar]
- Bhatnagar, G.; Wu, Q.M.J.; Liu, Z. A new contrast based multimodal medical image fusion framework. Neurocomputing 2015, 157, 143–152. [Google Scholar] [CrossRef]
- Apostolova, L.G.; Hwang, K.S.; Kohannim, O.; Avila, D.; Elashoff, D.; Jack, C.R.; Thompson, P.M. ApoE4 effects on automated diagnostic classifiers for mild cognitive impairment and Alzheimer’s disease. NeuroImage Clin. 2014, 4, 461–472. [Google Scholar] [CrossRef]
- Gray, K.R.; Aljabar, P.; Heckemann, R.A.; Hammers, A.; Rueckert, D. Random forest-based similarity measures for multi-modal classification of Alzheimer’s disease. NeuroImage 2013, 65, 167–175. [Google Scholar] [CrossRef]
- Zu, C.; Jie, B.; Liu, M.; Chen, S.; Shen, D.; Zhang, D.; Alzheimer’s Disease Neuroimaging Initiative. Label-aligned multi-task feature learning for multimodal classification of Alzheimer’s disease and mild cognitive impairment. Brain Imaging Behav. 2016, 10, 1148–1159. [Google Scholar] [CrossRef]
- Jie, B.; Zhang, D.; Cheng, B.; Shen, D.; The Alzheimer’s Disease Neuroimaging Initiative. Manifold regularized multitask feature learning for multimodality disease classification. Hum. Brain Mapp. 2015, 36, 489–507. [Google Scholar] [CrossRef]
- Trzepacz, P.T.; Yu, P.; Sun, J.; Schuh, K.; Case, M.; Witte, M.M.; Hake, A. Comparison of neuroimaging modalities for the prediction of conversion from mild cognitive impairment to Alzheimer’s dementia. Neurobiol. Aging 2014, 35, 143–151. [Google Scholar] [CrossRef]
- Foster, N.L.; Heidebrink, J.L.; Clark, C.M.; Jagust, W.J.; Arnold, S.E.; Barbas, N.R.; DeCarli, C.S.; Scott Turner, R.; Koeppe, R.A.; Higdon, R.; et al. FDG-PET improves accuracy in distinguishing frontotemporal dementia and Alzheimer’s disease. Brain 2007, 130, 2616–2635. [Google Scholar] [CrossRef] [PubMed]
- Drzezga, A.; Lautenschlager, N.; Siebner, H.; Riemenschneider, M.; Willoch, F.; Minoshima, S.; Schwaiger, M.; Kurz, A. Cerebral metabolic changes accompanying conversion of mild cognitive impairment into Alzheimer’s disease: A PET follow-up study. Eur. J. Nucl. Med. Mol. Imaging 2003, 30, 1104–1113. [Google Scholar] [PubMed]
- Das, S.; Kundu, M.K. NSCT-based multimodal medical image fusion using pulse-coupled neural network and modified spatial frequency. Med Biol. Eng. Comput. 2012, 50, 1105–1114. [Google Scholar] [CrossRef] [PubMed]
- Yang, Y.; Tong, S.; Huang, S.; Lin, P. Log-Gabor Energy Based Multimodal Medical Image Fusion in NSCT Domain. Comput. Math. Methods Med. 2014. [Google Scholar] [CrossRef]
- Yang, L.; Guo, B.L.; Ni, W. Multimodality medical image fusion based on multiscale geometric analysis of contourlet transform. Neurocomputing 2008, 72, 203–211. [Google Scholar] [CrossRef]
- Qu, G.; Zhang, D.; Yan, P. Medical image fusion by wavelet transform modulus maxima. Opt. Express 2001, 9, 184–190. [Google Scholar]
- Lee, H.; Hong, H. Hybrid surface-and voxel-based registration for MR-PET brain fusion. In Image Analysis and Processing–ICIAP; Springer: Berlin, Germany, 2005; pp. 930–937. [Google Scholar] [CrossRef]
- Wang, A.; Sun, H.; Guan, Y. The application of wavelet transform to multimodality medical image fusion. In Proceedings of the 2006 IEEE International Conference on Networking, Sensing and Control, Ft. Lauderdale, FL, USA, 23–25 April 2006; pp. 270–274. [Google Scholar]
- Teng, J.; Wang, X.; Zhang, J.; Wang, S.; Huo, P. A Multimodality Medical Image Fusion Algorithm Based on Wavelet Transform. In Proceedings of the International Conference, ICSI 2010, Beijing, China, 12–15 June 2010; pp. 627–633. [Google Scholar] [CrossRef]
- Garg, S.; Kiran, K.U.; Mohan, R.; Tiwary, U. Multilevel medical image fusion using segmented image by level set evolution with region competition. In Proceedings of the 27th Annual International Conference of the Engineering in Medicine and Biology Society, Shanghai, China, 17–18 January 2006; pp. 7680–7683. [Google Scholar]
- Forbes, F.; Doyle, S.; Lorenzo, D.G.; Barillot, C.; Dojat, M. Adaptive weighted fusion of multiple MR sequences for brain lesion segmentation. In Proceedings of the IEEE International Symposium on Biomedical Imaging: From Nano to Macro, Rotterdam, The Netherlands, 14–17 April 2010; pp. 69–72. [Google Scholar]
- Lee, J.-D.; Huang, B.-R.; Huang, C.-H. A surface-projection MMI for the fusion of brain MR and SPECT images. Biomed. Eng. Appl. Basis Commun. 2006, 18, 202–206. [Google Scholar] [CrossRef]
- Huang, C.-H.; Lee, J.-D. Improving MMI with enhanced-FCM for the fusion of brain MR and SPECT images. Biomed. Eng. Appl. Basis Commun. 2004, 16, 185–189. [Google Scholar] [CrossRef]
- Yuan, K.; Liu, W.; Jia, S.; Xiao, P. Fusion of MRI and DTI to assist the treatment solution of brain tumor. In Proceedings of the Second International Conference on Innovative Computing, Information and Control, Kumamoto, Japan, 5–7 September 2007; p. 620. [Google Scholar]
- Hinrichs, C.; Singh, V.; Xu, G.; Johnson, S. MKL for robust multi-modality AD classification. Med. Image Comput. Assist. Interv. 2009, 12, 786–794. [Google Scholar]
- Hinrichs, C.; Singh, V.; Xu, G.; Johnson, S.C. Predictive markers for AD in a multimodality framework: An analysis of MCI progression in the ADNI population. NeuroImage 2011, 55, 574–589. [Google Scholar] [CrossRef]
- Huang, S.; Li, J.; Ye, J.; Wu, T.; Chen, K.; Fleisher, A.; Reiman, E. Identifying Alzheimer s disease-related brain regions from multimodality neuroimaging data using sparse composite linear discrimination analysis. In Advances in Neural Information Processing systems 24; Shawe-Taylor, J., Zemel, R.S., Bartlett, P.L., Pereira, F., Weinberger, K.Q., Eds.; Curran Associates, Inc.: Red Hook, NY, USA, 2011. [Google Scholar]
- Zhang, D.; Shen, D.; The Alzheimer’s Disease Neuroimaging Initiative. Multi-modal multitask learning for joint prediction of multiple regression and classification variables in Alzheimer’s disease. NeuroImage 2012, 59, 895–907. [Google Scholar] [CrossRef] [PubMed]
- Westman, E.; Muehlboeck, J.-S.; Simmons, A. Combining MRI and CSF measures for classification of Alzheimer’s disease and prediction of mild cognitive impairment conversion. NeuroImage 2012, 62, 229–238. [Google Scholar] [CrossRef] [PubMed]
- Liu, F.; Wee, C.Y.; Chen, H.F.; Shen, D.G. Inter-modality relationship constrained multi-modality multitask feature selection for Alzheimer’s Disease and mild cognitive impairment identification. NeuroImage 2014, 84, 466–475. [Google Scholar] [CrossRef]
- Dai, Z.; Yan, C.; Wang, Z.; Wang, J.; Xia, M.; Li, K.; He, Y. Discriminative analysis of early Alzheimer’s disease using multi-modal imaging and multi-level characterization with multi-classifier (M3). NeuroImage 2012, 59, 2187–2195. [Google Scholar] [CrossRef] [PubMed]
- Liu, S.; Liu, S.; Cai, W.; Che, H.; Pujol, S.; Kikinis, R.; Feng, D.; Fulham, M.J.; ADNI. Multimodal neuroimaging feature learning for multiclass diagnosis of Alzheimer’s disease. IEEE Trans. Bio-Med. Eng. 2015, 62, 1132–1140. [Google Scholar] [CrossRef]
- Cheng, D.; Liu, M. CNNs based multi-modality classification for AD diagnosis. In Proceedings of the 2017 10th International Congress on Image and Signal Processing, BioMedical Engineering and Informatics (CISP-BMEI), Shanghai, China, 14–16 October 2017; pp. 1–5. [Google Scholar] [CrossRef]
- James, A.P.; Dasarathy, B.V. Medical Image Fusion—A Survey of the State of the Art. Inf. Fusion 2014, 19, 4–19. [Google Scholar] [CrossRef]
- Du, J.; Li, W.; Lu, K.; Xiao, B. A Overview of Multi-modal Medical Image Fusion. Neurocomputing 2016, 215, 3–20. [Google Scholar] [CrossRef]
- Mitchell, H. Image Fusion: Theories, Techniques and Applications; Springer Science & Business Media: Berlin, Germany, 2010. [Google Scholar] [CrossRef]
- Raut, G.N.; Paikrao, P.L.; Chaudhari, D.S. A Study of Quality Assessment Techniques For Fused Images. Int. J. Innov. Technol. Explor. Eng. 2010, 2, 290–294. [Google Scholar]
- Krishn, A.; Bhateja, V.; Himanshi; Sahu, A. PCA Based Medical Image Fusion in Ridgelet Domain. In Proceedings of the 3rd International Conference on Frontiers of Intelligent Computing: Theory and Applications (FICTA); Satapathy, S.C., Biswal, B.N., Udgata, S.K., Mandal, J.K., Eds.; Springer International Publishing: Cham, Switzerland, 2014; pp. 475–482. [Google Scholar]
- Rani, K.; Sharma, R. Study of Different Image fusion Algorithms. Int. J. Emerg. Technol. Adv. Eng. 2013, 3, 288–291. [Google Scholar]
- Kaya, I.E.; Pehlivanlı, A.C.; Sekizkardeş, E.G.; Ibrikci, T. PCA based clustering for brain tumor segmentation of T1w MRI images. Comput. Methods Programs Biomed. 2017, 140, 19–28. [Google Scholar] [CrossRef]
- Jiang, Y.; Wang, M. Image fusion with morphological component analysis. Inf. Fusion. 2014, 18, 107–118. [Google Scholar] [CrossRef]
- Naidu, V.P.S.; Roal, J.R. Pixel-level Image Fusion using Wavelets and Principal Component Analysis. Def. Sci. J. 2008, 58, 338–352. [Google Scholar] [CrossRef]
- Reba, M.N.M.; C’uang, O. Image Quality Assessment for Fused Remote Sensing Imageries. J. Teknol. 2014, 71, 175–180. [Google Scholar] [CrossRef][Green Version]
- Wan, T.; Zhu, C.; Qin, Z. Multifocus image fusion based on robust principal component analysis. Pattern Recognit. Lett. 2013, 34, 1001–1008. [Google Scholar] [CrossRef]
- Yang, J.; Han, F.; Zhao, D. A block advanced pca fusion algorithm based on pet/ct. In Proceedings of the 2011 International Conference on Intelligent Computation Technology and Automation (ICICTA), Shenzhen, China, 28–29 March 2011; Volume 2, pp. 925–928. [Google Scholar]
- Choi, M.-J.; Kim, H.-C.; Cho, N.I.; Kim, H.O. An Improved Intensity-Hue-Saturation Method for IKONOS Image Fusion. Int. J. Remote Senis. 2008, 13, 1–10. [Google Scholar]
- Chen, C. Fusion of PET and MR Brain Images Based on IHS and Log-Gabor Transforms. IEEE Sens. J. 2017, 17, 6995–7010. [Google Scholar] [CrossRef]
- Haddadpour, M.; Daneshvar, S.; Seyedarabi, H. PET and MRI image fusion based on combination of 2-D Hilbert transform and IHS method. Biomed. J. 2017, 40, 219–225. [Google Scholar] [CrossRef]
- Siddiqui, Y. The Modified IHS Method for Fusing Satellite Imagery. In Proceedings of the ASPRS 2003 Annual Conference, Anchorage, Alaska, 5 May 2003; pp. 5–9. [Google Scholar]
- Tu, T.M.; Huang, P.S.; Hung, C.L.; Chang, C.P. A Fast Intensity-Hue Saturation Fusion Technique with Spectral Adjustment for IKONOS Imagery. IEEE Geosci. Remote Sens. Lett. 2004, 1, 309–312. [Google Scholar] [CrossRef]
- Chen, R. The analysis of image fusion based on improved Brovery transform. In International Industrial Informatics and Computer Engineering Conference (IIICEC 2015); Atlantis Press: Shaanxi, China, 2015; pp. 1132–1134. [Google Scholar]
- Mandhare, R.A.; Upadhyay, P.; Gupta, S. Pixel Level Image Fusion Using Brovey Transforme and Wavelet Transform. International Journal of Advanced Research in Electrical. Electron. Instrum. Eng. 2013, 2, 2690–2695. [Google Scholar]
- Taxak, N.; Singhal, S. High PSNR based Image Fusion by Weighted Average Brovery Transform Method. In Proceedings of the 2019 Devices for Integrated Circuit (DevIC), Kalyani, India, 23–24 March 2019; pp. 451–455. [Google Scholar] [CrossRef]
- Li, S.; Kang, X.; Hu, J. Image Fusion With Guided Filtering. IEEE Trans. Image Process. 2013, 22, 2864–2875. [Google Scholar] [CrossRef]
- Ham, B.; Cho, M.; Ponce, J. Robust Guided Image Filtering Using Nonconvex Potentials. IEEE Trans. Pattern Anal. Mach. Intell. 2018, 40, 192–207. [Google Scholar] [CrossRef] [PubMed]
- He, K.; Sun, J.; Tang, X. Guided Image Filtering. Guided Image Filtering. IEEE Trans. Pattern Anal. Mach. Intell. 2013, 35, 1397–1409. [Google Scholar] [CrossRef] [PubMed]
- Yin, H.; Gong, Y.; Qiu, G. Side window guided filtering. Signal Process. 2019, 165, 315–330. [Google Scholar] [CrossRef]
- Sahu, D.K.; Parsai, M.P. Different Image Fusion Techniques—A Critical review. Int. J. Mod. Eng. Res. (IJMER) 2012, 2, 4298–4301. [Google Scholar]
- Noushad, M.; Preetha, S.L. Image Pair Fusion using Weighted Average Method. Int. J. Sci. Technol. Eng. 2017, 3, 397–402. [Google Scholar]
- Song, L.; Lin, Y.; Feng, W.; Zhao, M. A Novel Automatic Weighted Image Fusion Algorithm. In Proceedings of the 2009 International Workshop on Intelligent Systems and Applications, Wuhan, China, 23–24 May 2009. [Google Scholar] [CrossRef]
- Gorthi, S.; Cuadra, M.B.; Tercier, P.A.; Allal, A.S.; Thiran, J.P. Weighted shape based averaging with neighbourhood prior model for multiple atlas fusion based medical image segmentation. IEEE Signal Process. Lett. 2013, 20, 1034–1037. [Google Scholar] [CrossRef]
- Jiang, D.; Zhuang, D.; Huang, Y.; Fu, J. Survey of Multispectral Image Fusion Techniques in Remote Sensing Applications, Image Fusion and Its Applications. Image Fusion Appl. 2011, 24, 1–23. [Google Scholar] [CrossRef]
- Haghighat, M.B.A.; Aghagolzadeh, A.; Seyedarabi, H. Multi-focus image fusion for visual sensor networks in DCT domain. Comput. Electr. Eng. 2011, 37, 789–797. [Google Scholar] [CrossRef]
- Cao, L.; Jin, L.; Tao, H.; Li, G.; Zhuang, Z.; Zhang, Y. Multi-focus image fusion based on spatial frequency in discrete cosine transform domain. IEEE Signal Process. Lett. 2015, 22, 220–224. [Google Scholar] [CrossRef]
- Naidu, V.P.S. Discrete Cosine Transform based Image Fusion Techniques. J. Commun. Navig. Signal Process. 2012, 1, 35–45. [Google Scholar]
- Phamila, Y.A.V.; Amutha, R. Low complexity multifocus image fusion in discrete cosine transform domain. Opt. Appl. 2013, 43. [Google Scholar] [CrossRef]
- Phamila, Y.A.V.; Amutha, R. Discrete Cosine Transform based fusion of multi-focus images for visual sensor networks. Signal Process. 2014, 95, 161–170. [Google Scholar] [CrossRef]
- Tang, J. A contrast based image fusion technique in the DCT domain. Digit. Signal Process. 2004, 14, 218–226. [Google Scholar] [CrossRef]
- Alipour, S.; Houshyari, M.; Mostaar, A. A novel algorithm for PET and MRI fusion based on digital curvelet transform via extracting lesions on both images. Electron. Physician 2017, 9, 4872–4879. [Google Scholar] [CrossRef]
- Ali, F.E.; El-Dokany, I.M.; Saad, A.A.; El-Samie, F.A. Fusion of MR and CT Images using the Curvelet Transform. In Proceedings of the 25th National Radio Science Conference, Tanta, Egypt, 18–20 March 2008. [Google Scholar]
- Guo, L.; Dai, M.; Zhu, M. Multifocus color image fusion based on quaternion curvelet transform. Opt. Express 2012, 20, 18846. [Google Scholar] [CrossRef]
- Indira, K.P.; Hemamalini, R.R. Analysis on Image Fusion Techniques for Medical Applications. Int. J. Adv. Res. Electr. Electron. Instrum. Eng. 2014, 3, 12051–12057. [Google Scholar] [CrossRef]
- Nambiar, R.; Desai, U.; Shetty, V. Medical Image Fusion Analysis Using Curvelet Transform. In Proceedings of the International Conference on Advances in Computing, Communication and Information Science (ACCIS-14), Kerala, India, 27–29 August 2014; pp. 1–8. [Google Scholar] [CrossRef]
- Shah, P.; Merchant, S.N.; Desai, U.B. Fusion of surveillance images in infrared and visible band using curvelet, wavelet and wavelet packet transform. Int. J. Wavel. Multiresol. Inf. Process. 2014, 8, 271–292. [Google Scholar] [CrossRef]
- Chandana, M.; Amutha, S.; Kumar, N. A Hybrid Multi-focus Medical Image Fusion Based on Wavelet Transform. Int. J. Res. Rev. Comput. Sci. 2011, 2, 948. [Google Scholar]
- Chabi, N.; Yazdi, M.; Entezarmahdi, M. An Efficient Image Fusion Method Bsed on Dual Tree Complex Wavelet Transform. In Proceedings of the 8th Iranian Conference on Machine vision and Processing (MVIP), Zanjan, Iran, 10–12 September 2013; pp. 403–407. [Google Scholar]
- Huang, P.; Chen, C.; Chen, P.; Lin, P.; Hsu, L.-P. PET and MRI brain image fusion using wavelet transform with structural information adjustment and spectral information patching. In Proceedings of the 2014 IEEE International Symposium on Bioelectronics and Bioinformatics (IEEE ISBB 2014), Chung Li, Taiwan, 11–14 April 2014; pp. 1–4. [Google Scholar] [CrossRef]
- Sapkal, R.J.; Kulkarni, S.M. Image fusion based on Wavelet transform for medical application. Int. J. Res. Appl. 2012, 2, 624–627. [Google Scholar]
- Siddiqui, U.Z.; Thorat, P.R. A New Approach to Efficient Medical Image Fusion. Int. J. Adv. Res. Comput. Commun. Eng. 2015, 4, 66. [Google Scholar] [CrossRef]
- Zheng, Y.; Essock, E.; Hansen, B.; Haun, A. A new metric based on extended spatial frequency and its application to DWT based fusion algorithms. Inf. Fusion 2007, 8, 177–192. [Google Scholar] [CrossRef]
- Udomhunsakul, S.; Yamsang, P.; Tumthong, S.; Borwonwatanadelok, P. Multiresolution Edge Fusion using SWT and SFM. Proc. World Congr. Eng. 2011, 2, 6–8. [Google Scholar]
- Kekre, H.-B.; Sarode, T.-K.; Dhannawat, R.-A. Implementation and Comparison of Different Transform Techniques using Kekre’s Wavelet Transform for Image Fusion. Int. J. Comput. Appl. 2012, 4, 41. [Google Scholar]
- Davis, D.K.; Roy, R.C. Hybrid Super Resolution using SWT and CT. Int. J. Comput. Appl. 2012, 59, 0975–8887. [Google Scholar]
- Singh, R.; Khare, A. Multiscale Medical Image Fusion in Wavelet Domain. Sci. World J. 2013, 2013. [Google Scholar] [CrossRef] [PubMed]
- Dhannawat, R.A.; Sarode, T.K.; Kekre, H.B. Kekre ’s hybrid wavelet transform technique with dct, walsh, hartley and kekre’s transform for image fusion. Int. J. Comput. Eng. Technol. 2014, 4, 195–202. [Google Scholar]
- Sahu, A.; Bhateja, V.; Krishn, A. Medical Image Fusion with Laplacian Pyramids. In Proceedings of the International Conference on Medical Imaging, m-Health and Emerging Communication Systems (MedCom), Greater Noida, India, 7–8 November 2014. [Google Scholar]
- Tan, H.; Huang, X.; Tan, H.; He, C. Pixel-Like Image Fusion Algorithm Based On Maximum Likelihood And Laplacian Pyramid Transformation. J. Comput. Inf. Syst. 2013, 9, 327–334. [Google Scholar]
- Kakerda, R.K.; Kumar, M.; Mathur, G.; Yadav, R.P.; Maheshwari, J.P. Fuzzy Type Image Fusion Using Hybrid DCT-FFT Based Laplacian Pyramid Transform. In Proceedings of the International Conference on Communications and Signal Processing (ICCSP), Melmaruvathur, India, 2–4 April 2015. [Google Scholar]
- Yun, S.H.; Kim, J.H.; Kim, S. Image Enhancement Using a Fusion Framework of Histogram Equalization and Laplacian Pyramid. IEEE Trans. Consum. Electron. 2010, 56, 2763–2771. [Google Scholar] [CrossRef]
- Wang, W.; Chang, F. A Multi-Focus Image Fusion Method Based On Laplacian Pyramid. J. Comput. 2011, 6, 2559–2566. [Google Scholar] [CrossRef]
- Olkkonen, H.; Pesola, P. Gaussian Pyramid Wavelet Transform for Multiresolution Analysis of Images. Graph. Models Image Process. 1996, 58, 394–398. [Google Scholar] [CrossRef]
- Tian, J.; Chen, L.; Ma, L.; Yu, W. Multi-focus image fusion using a bilateral gradient-based sharpness criterion. Opt. Commun. 2011, 284, 80–87. [Google Scholar] [CrossRef]
- Toet, A. Image fusion by a ratio of low-pass pyramid. Pattern Recognit. Lett. 1989, 9, 245–253. [Google Scholar] [CrossRef]
- Bai, X.; Zhou, F.; Xue, B. Edge preserved image fusion based on multiscale toggle contrast operator. Image Vis. Comput. 2011, 29, 829–839. [Google Scholar] [CrossRef]
- Ramac, L.C.; Uner, M.K.; Varshney, P.K.; Alford, M.G.; Ferris, D.D. Morphological filters and wavelet-based image fusion for concealed weapons detection. In Proceedings of the Society of Photo-Optical Instrumentation Engineers (SPIE) Aerospace/Defense, Security, and Sensing, Sensor Fusion: Architectures, Algorithms, and Applications II, Orlando, FL, USA, 20 March 1998; Volume 3376, pp. 110–119. [Google Scholar] [CrossRef]
- Chandrashekar, L.; Sreedevi, A. A Novel Technique for Fusing Multimodal and Multiresolution Brain Images. Procedia Comput. Sci. 2017, 115, 541–548. [Google Scholar] [CrossRef]
- Piella, G. A general framework for multiresolution image fusion: From pixels to regions. Inf. Fusion 2003, 4, 259–280. [Google Scholar] [CrossRef]
- Do, M.N.; Vetterli, M. The contourlet transform: An efficient directional multiresolution image representation. IEEE Trans. Image Process. 2005, 14, 2091–2106. [Google Scholar] [CrossRef]
- Bhatnagar, G. Directive contrast based multimodal Medical image fusion in NSCT domain. IEEE Trans. Multimed. 2013, 15, 1014–1024. [Google Scholar] [CrossRef]
- Da Cunha, A.L.; Zhou, J.; Do, M.N. The nonsubsampled contourlet transform: Theory, design, and applications. IEEE Trans. Image Process. 2006, 15, 3089–3101. [Google Scholar] [CrossRef]
- Yang, Y.; Tong, S.; Huang, S.; Lin, P. Multifocus Image Fusion Based on NSCT and Focused Area Detection. IEEE Sens. J. 2015, 15, 2824–2838. [Google Scholar]
- Zhang, Q.; Guo, B.L. Multifocus image fusion using the nonsubsampled contourlet transform. Signal Process. 2009, 89, 1334–1346. [Google Scholar] [CrossRef]
- Chai, Y.; Li, H.F.; Qu, J.F. Image fusion scheme using a novel dualchannel PCNN in lifting stationary wavelet domain. Opt. Commun. 2010, 283, 3591–3602. [Google Scholar] [CrossRef]
- Javed, U.; Riaz, M.M.; Ghafoor, A.; Ali, S.S.; Cheema, T.A. MRI and PET image fusion using fuzzy logic and image local features. Sci. World J. 2014, 2014. [Google Scholar] [CrossRef] [PubMed]
- Jany Shabu, S.L.; Jayakumar, C. Multimodal image fusion using an evolutionary based algorithm for brain tumor detection. Biomed. Res. 2018, 29, 2932–2937. [Google Scholar]
- Sui, J.; Adali, T.; Pearlson, G.; Yang, H.; Sponheim, S.R.; White, T.; Calhoun, V.D. A CCA+ICA based model for multi-task brain imaging data fusion and its application to schizophrenia. NeuroImage 2010, 51, 123–134. [Google Scholar] [CrossRef] [PubMed]
- Gonzalez-Audicana, M.; Saleta, J.L.; Catalan, R.G. Fusion of multispectral and panchromatic images using improved IHS and PCA mergers based on wavelet decomposition. IEEE Trans. Geosci. Remote Sens. 2004, 42, 1204–1211. [Google Scholar] [CrossRef]
- He, C.; Liu, Q.; Li, H.; Wang, H. Multimodal medical image fusion based on HIS and PCA. Procedia Eng. 2010, 7, 280–285. [Google Scholar] [CrossRef]
- Zhang, Y.; Hong, G. An IHS and wavelet integrated approach to improve pan-sharpening visual quality of natural colour Ikonos and QuickBird images. Inf. Fusion 2005, 6, 225–234. [Google Scholar] [CrossRef]
- Al-Azzawi, N.; Sakim, H.A.; Abdullah, A.K.; Ibrahim, H. Medical Image Fusion Scheme using Complex Contourlet transform based on PCA. In Proceedings of the 31st International conference of the IEEE EMBS, Minneapolis, MN, USA, 2–6 September 2009. [Google Scholar]
- Thamarai, M.; Mohanbabu, K. An Improved Image Fusion and Segmentation using FLICM with GA for Medical Diagonosis. Indian J. Sci. Technol. 2016, 9, 12. [Google Scholar] [CrossRef]
- Wu, J.; Liu, J.; Tian, J.; Yin, B. Wavelet-based Remote Sensing Image Fusion with PCA and Feature Product. In Proceedings of the 2006 International Conference on Mechatronics and Automation, Luoyang, China, 25–28 June 2006; pp. 2053–2057. [Google Scholar] [CrossRef]
- Bedi, S.S.; Khandelwal, R. Comprehensive and Comparative Study of Image Fusion Techniques. Int. J. Soft Comput. Eng. 2013, 3, 300–304. [Google Scholar]
- Landau, M.J.; Meier, B.P.; Keefer, L.A. A metaphor-enriched social cognition. Psychol. Bull. 2010, 136, 1045–1067. [Google Scholar] [CrossRef]
- Fjell, A.M.; Walhovd, K.B.; Fennema-Notestine, C.; McEvoy, L.K.; Hagler, D.J.; Holland, D.; Brewer, J.B.; Dale, A.M. Alzheimer’s Disease Neuroimaging Initiative (2010) CSF biomarkers in prediction of cerebral and clinical change in mild cognitive impairment and Alzheimer’s disease. J. Neurosci. 2010, 30, 2088–2101. [Google Scholar] [CrossRef] [PubMed]
- Edison, P.; Carter, S.F.; Rinne, J.O.; Gelosa, G.; Herholz, K.; Nordberg, A.; Brooks, D.J.; Hinz, R. Comparison of MRI based and PET template based approaches in the quantitative analysis of amyloid imaging with PIB-PET. NeuroImage 2013, 70, 423–433. [Google Scholar]
- Marcus, D.S.; Fotenos, A.F.; Csernansky, J.G.; Morris, J.C.; Buckner, R.L. Open access series of imaging studies: Longitudinal MRI data in nondemented and demented older adults. J. Cogn. Neurosci. 2010, 22, 2677–2684. [Google Scholar] [CrossRef] [PubMed]


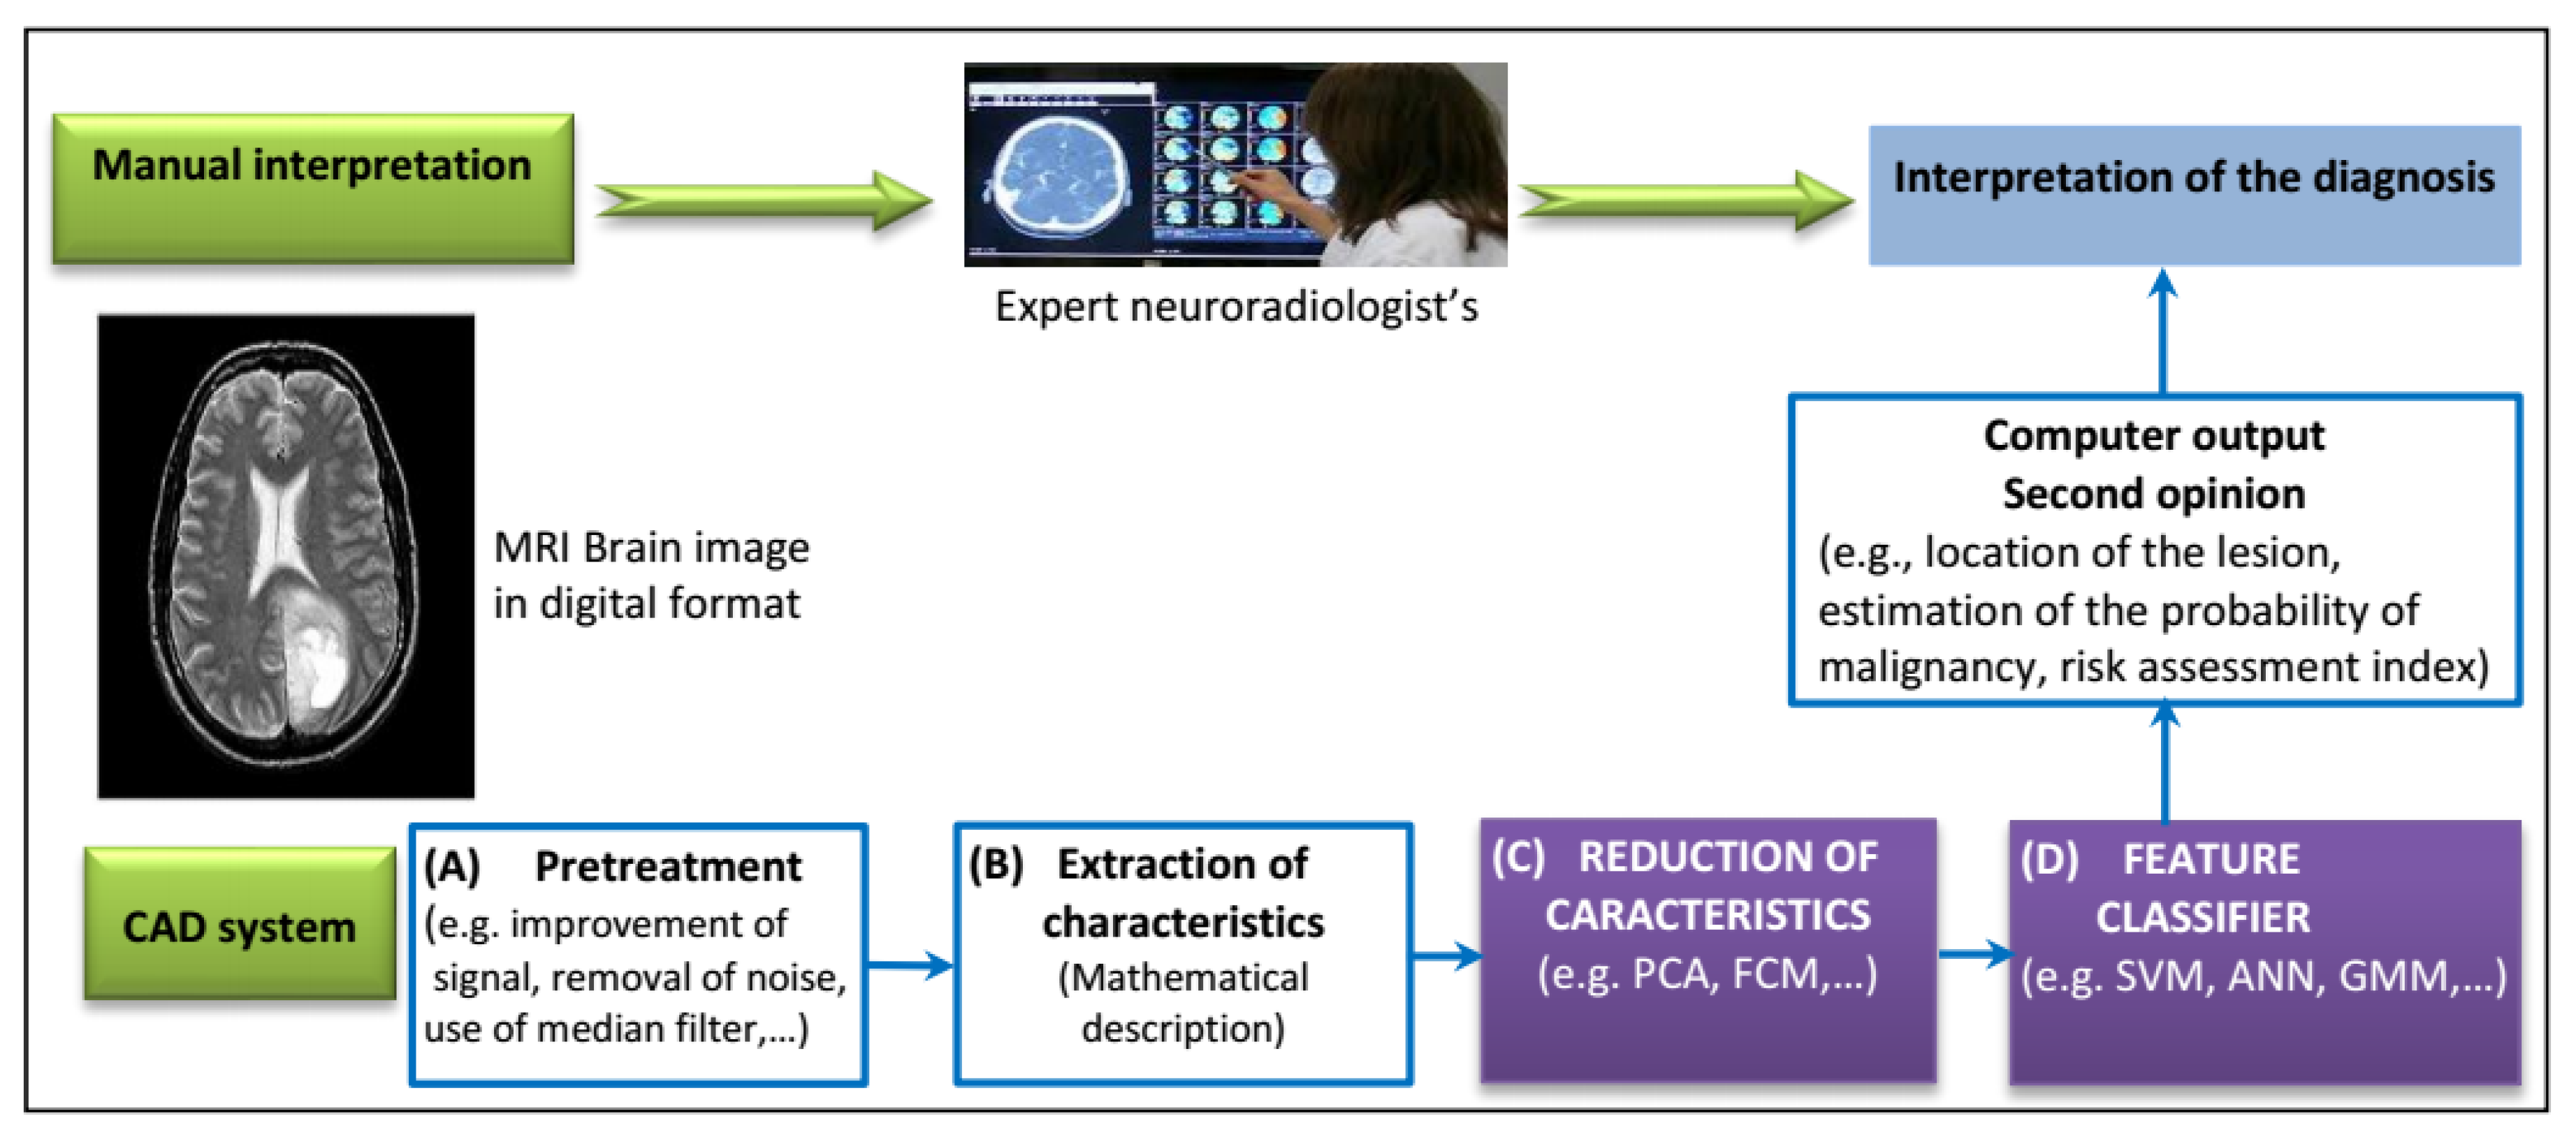
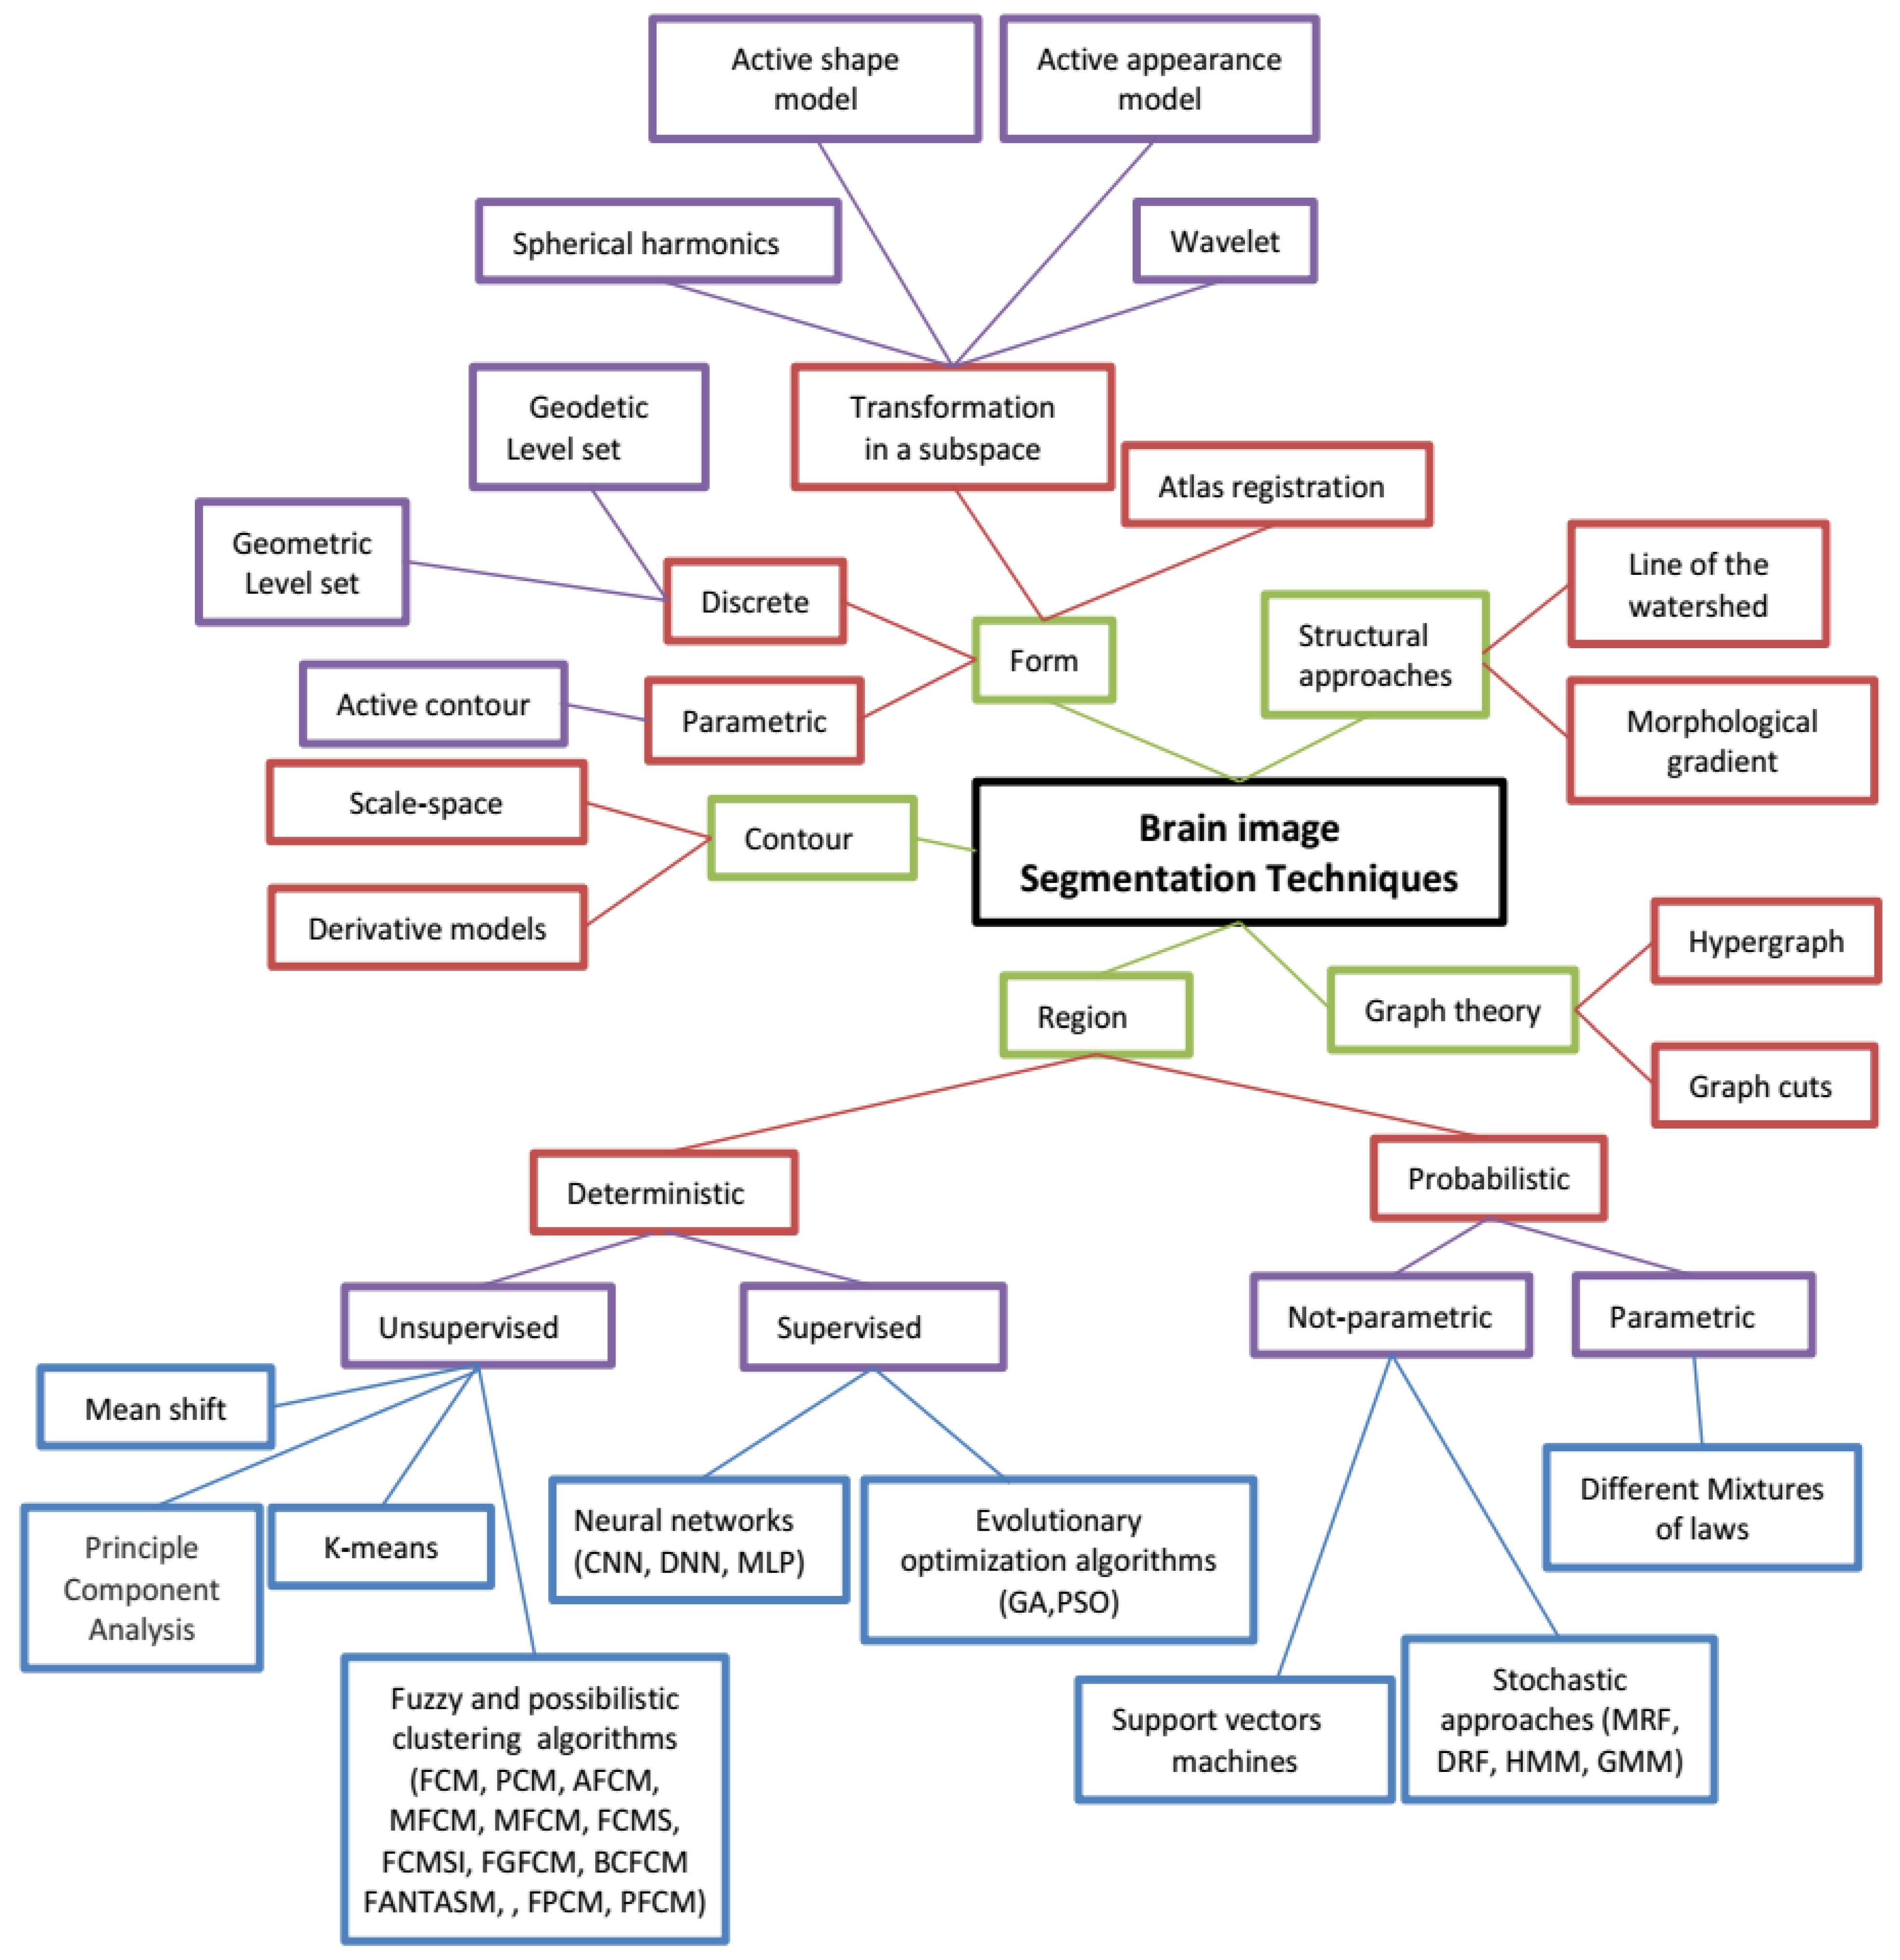
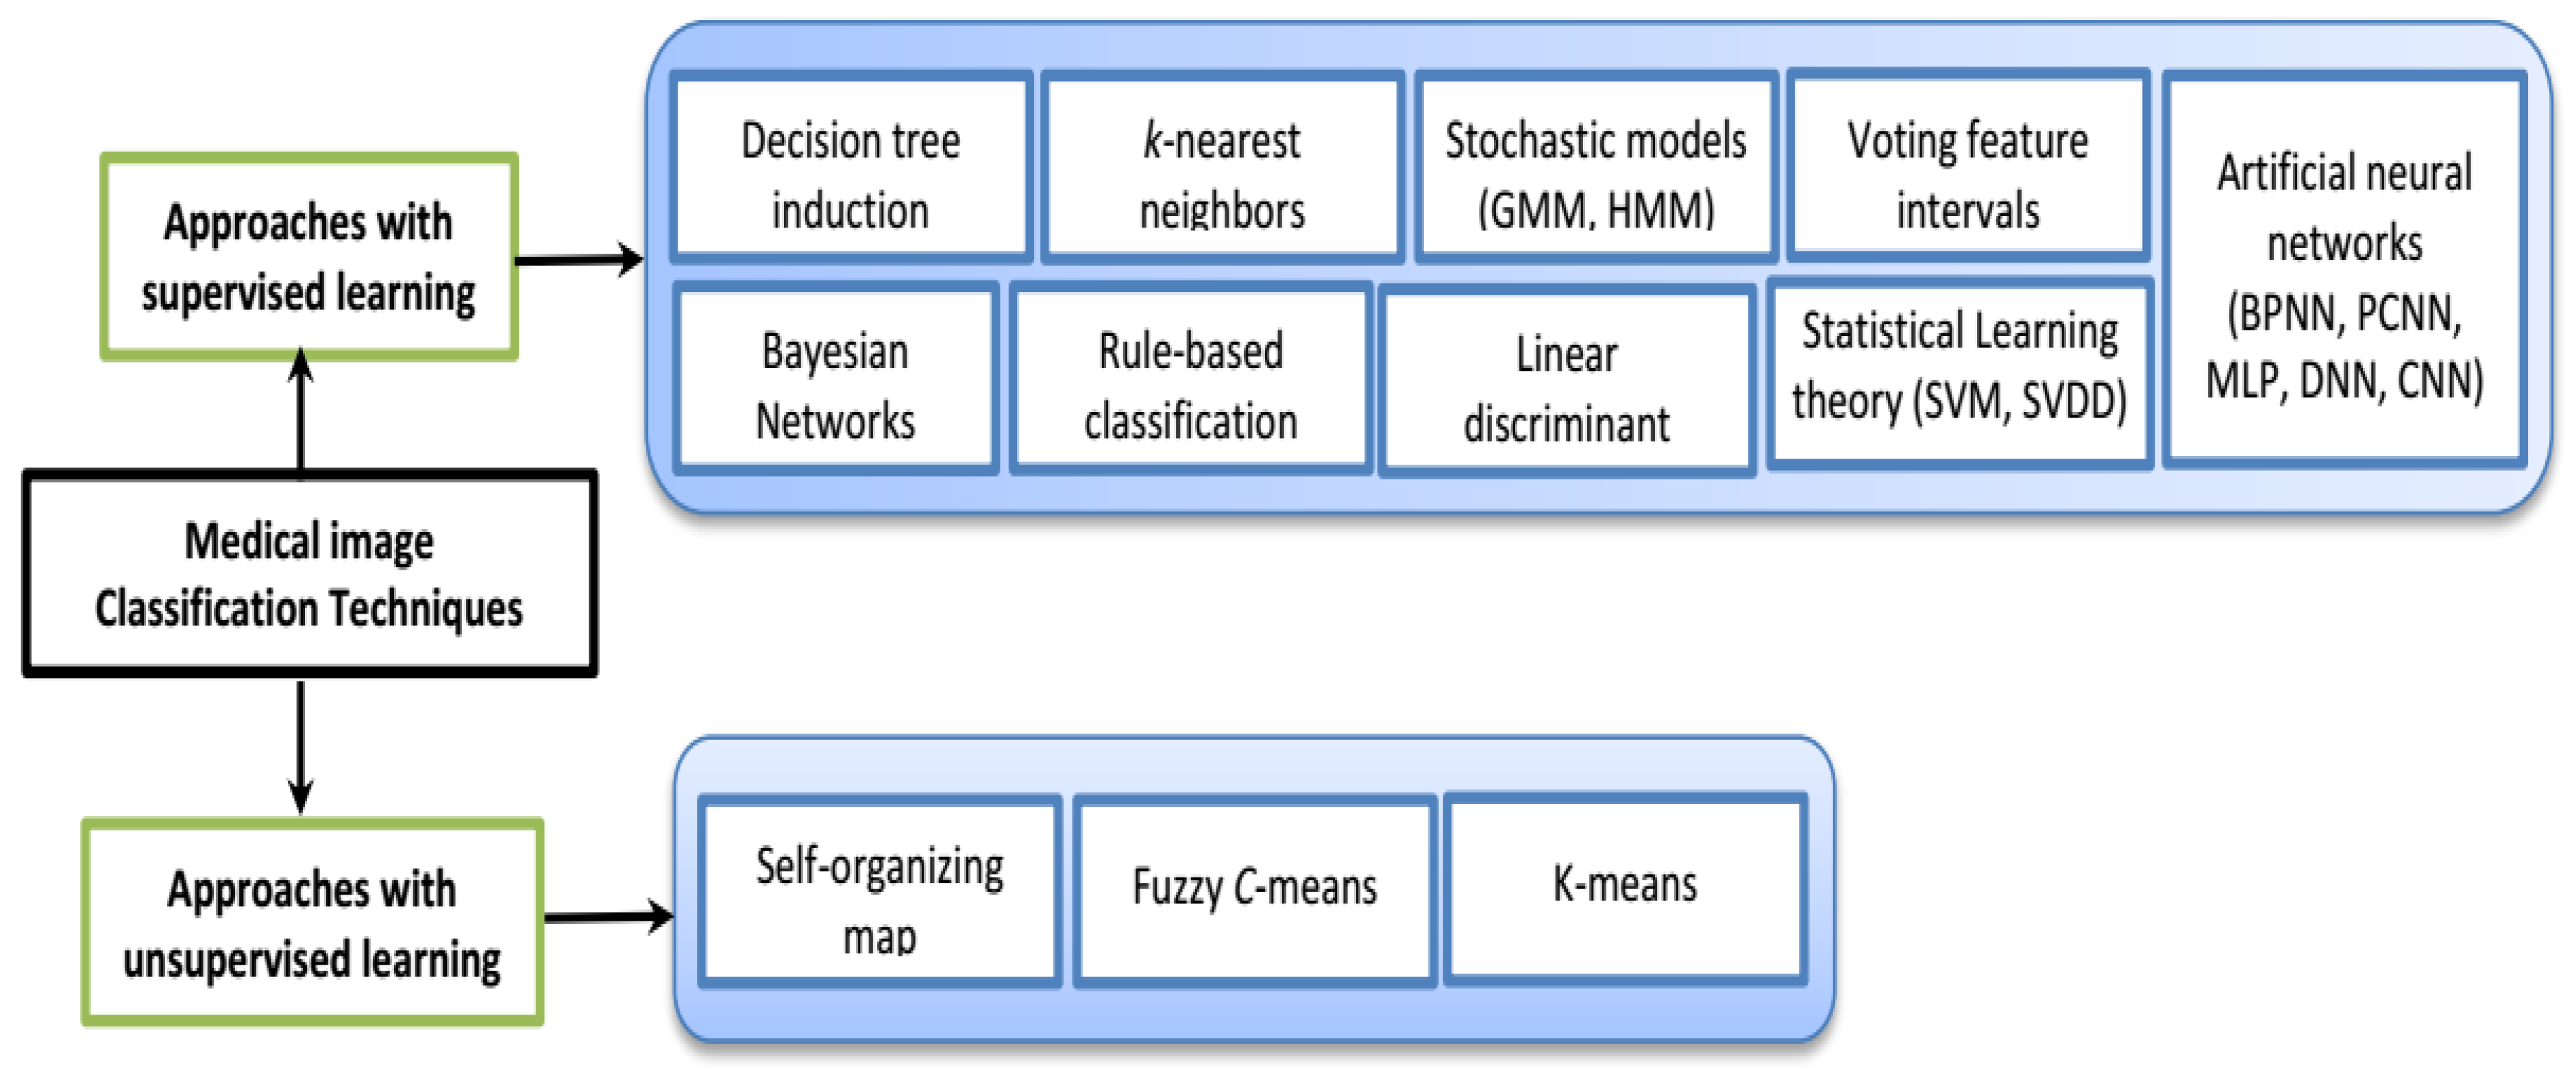
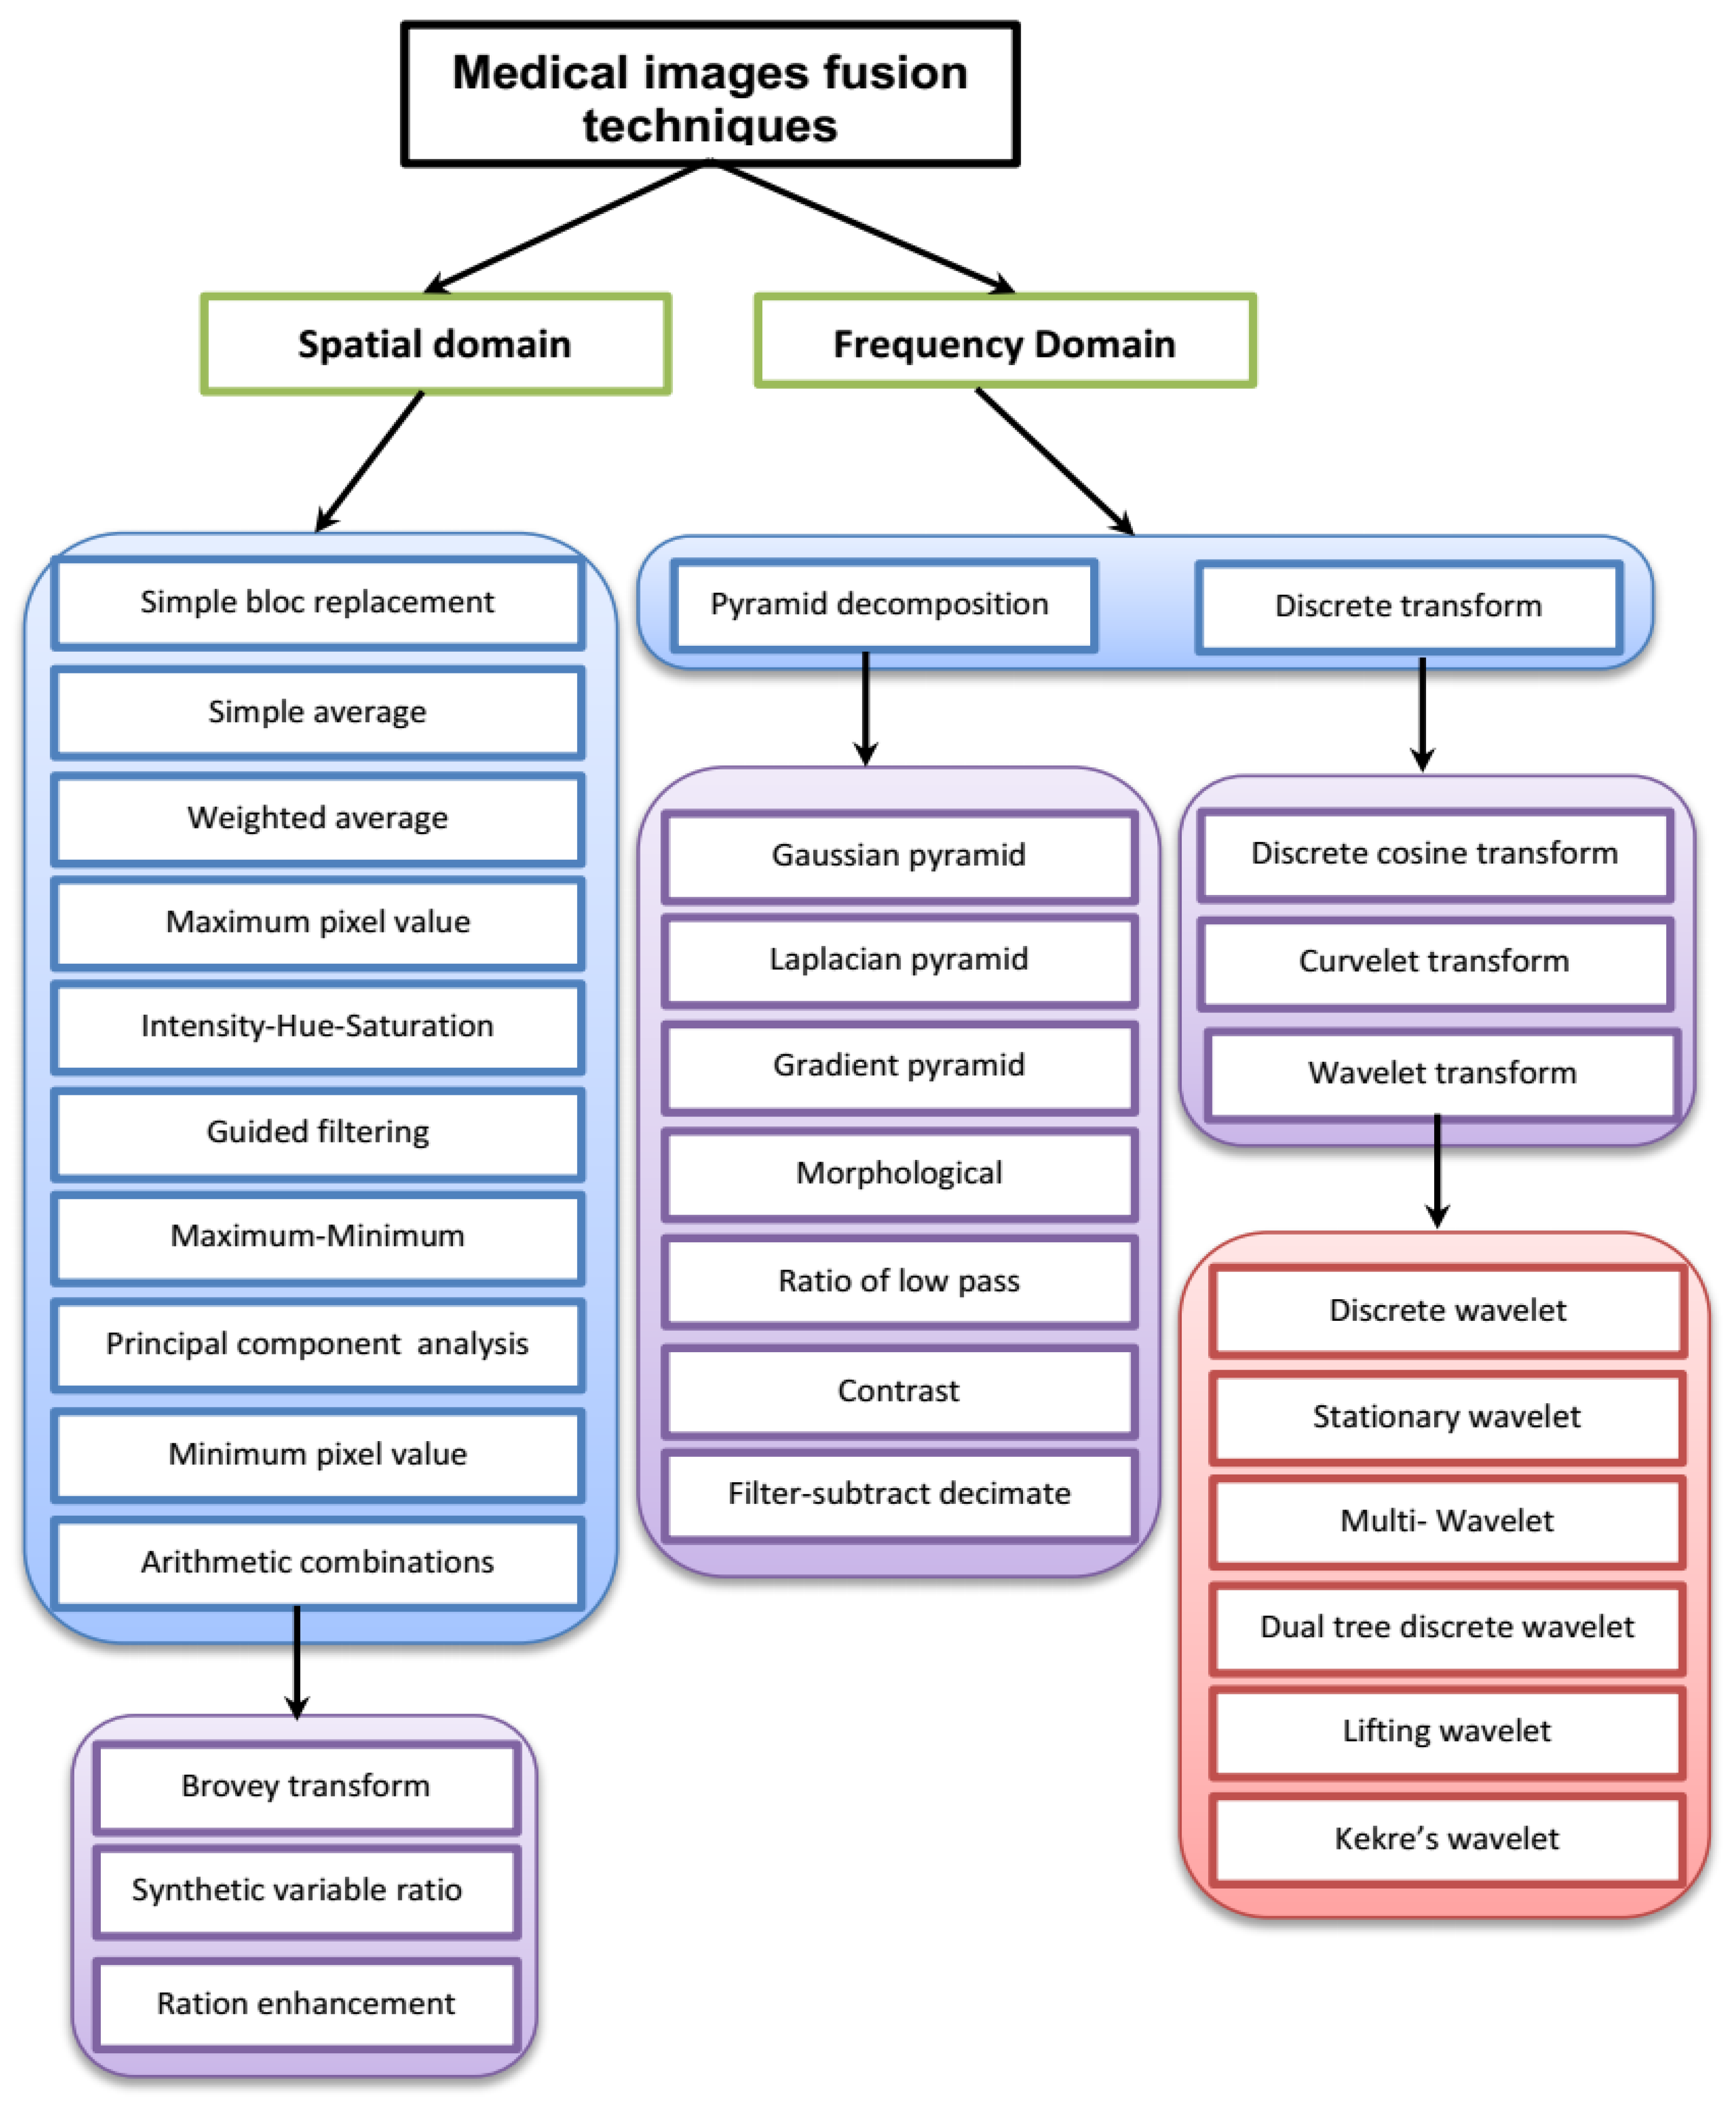
| Reference | Segmentation | Database | Comparison | Measuring Parameters |
|---|---|---|---|---|
| Region Approach Based Techniques | ||||
| [20] | MRF | Several GD-TI, TI and T2-weighted from radiology department of the Poitiers’s hospital | Clinical expert evaluation | Information criterion, MAP criterion |
| [18] | AFCM | Images from Brainweb http://www.bic.mni.mcgill.ca/brainweb | FANTASM | Misclassification rate, mean-squared error |
| [21] | DRF | Several T1, T1c, and T2 images from 7 patients. | MRF | Jaccard similarity index |
| [22] | SVM | Several T1, T2, PD and FLAIR-weighted of 45 diabetics. | Two experienced neuro-radiologists | Pearson correlation, Spearman correlation, coefficient of variation, reliability coefficient |
| [19] | MFCM | Simulated and real MR images. | FCM, FCMS, FCMSI and FGFCM | Similarity index, false positive ratio, false negative ratio |
| [23] | AMS | Images from Brainweb and IBSR http://www.cma.mgh.harvard.edu/ibsr/ | Adaptive MAP, MPM-MAP | Tanimoto coefficient |
| Form Approach Based Techniques | ||||
| [25] | Multi-context wavelet | Several T1-weighted with more than 150 slices for each | Wavelet, multigrid wavelet | NA |
| [26] | Spherical wavelet | Coronal SPGR images with 124 slices for each of 29 left caudate nucleus structures and 25 left hippocampus structures | Active shape model algorithm and expert neuroanatomist evaluation | Average max error, average min error |
| [24] | Spherical harmonics | PD images of multiple sclerosis patients | Slice stacking technique | Mean error and standard deviation. ANOVA criterion |
| [27] | Level sets | Images of 16 patients from Singapore National Cancer Center | Region-competition | Jaccard measure, Hausdorff distance, mean absolute surface distance |
| Graph Theory Based Techniques | ||||
| [28] | Hypergraph | Image with 265 × 256 pixel slices | Ncut algorithm | NA |
| [29] | Adaptive graph cut | Ten images from the Brainweb | Adaptive MRF-MAP, graph cut | Classification rate |
| Hybrid Approach Based Segmentation | ||||
| [30] | FCM/GA | Several images from Talairach stereotaxic atlas | Manually labeled images | Mean, standard deviation, false positive ration, false negative ration, similarity index and Kappa statistic |
| [31] | Fuzzy/MRF | Images from Brainweb and T1-weighted SPGR | Clinical experts evaluation | Average error rate |
| [32] | Bayesian/AMS | Images IBSR and Brainweb | k-NN/AMS | Dice and Tanimoto coefficients |
| [33] | PCM/FCM | PET and T1-weighted from ADNI (http://adni.loni.usc.edu/) | PCM, FCM | Tanimoto coefficient, specificity and sensitivity |
| [34] | PCM/BCFCM | T1-weighted, PET and SPECT scans from Gabriel Mont pied Hospital, France | PCM, FCM and hybrid PCM/FCM | Tanimoto coefficient, specificity and sensitivity |
| [35] | PCM/FCM/GA | PET and T1-weighted from ADNI | PCM, FCM and hybrid PCM/FCM | Tanimoto coefficient, specificity and sensitivity |
| [36] | PCM/FCM/GA 20% of noise | T1-weighted, PET and SPECT scans from Gabriel Mont Pied Hospital, France and ADNI | PCM, FCM | Tanimoto coefficient, specificity and sensitivity |
| [37] | FPCM/FCM/GA 20% of noise | SPECT, PET and T1-weighted from Gabriel Mont Pied Hospital and ADNI | PCM, FCM and hybrid PCM/FCM | Tanimoto coefficient, specificity and sensitivity |
| [17] | PFCM/BCFCM/GA 20% of noise | PET and T1-weighted from Gabriel Mont Pied Hospital and ADNI | FPCM, PCM, FCM and many hybrid clustering algorithms | Tanimoto coefficient, Jaccard similarity index |
| (A) Region Approach-Based Methods | ||
 MRI brain segmentation using Convolutional Neural Networks (CNN): (left) Original image, (right) Results of segmentation; illustration reproduced with the permission of Springer Nature [39]. |  Segmentation of brain tumors from MRI with Support vector machines (SVM): (left) Original MRI, (right) Full brain segmentation; illustration reproduced with the permission of Springer Nature [21]. |  MRI brain image segmentation with K-Means Algorithm: (left) Original image, (right) Results of segmentation; illustration reproduced with the permission from Elsevier [62]. |
 Segmentation of brain MRI image with graph cut approach: (left) Original MRI, (right) Segmentation result; illustration reproduced with the permission of Springer Nature [130]. |  Segmentation of brain MRI image with Spherical harmonics: (left) frontal oligodendroglioma, (right) the result of segmentation; illustration reproduced with the permission fom Elsevier [113]. |  Tissue segmentation from MRI using stochastic models: (left to right) Original MRI, CSF, GM, and WM; illustrations reproduced with the permission of PLoS ONE [86]. |
 Tissue segmentation from MRI using region growing method: (left to right) Original image, grey matter, white matter and CSF; illustration reproduced with the permission of Springer Nature [132]. |  Brain tumor segmentation from MRI image using Threshold method: (left) Original image and (right) Segmentation result; illustration reproduced with the permission from Elsevier [133]. |  Tissue segmentation of brain MRI image with Gaussian Markov Models (GMM): (left) Brainweb sample slice, (middle) Ground truth and (right) Result of segmentation; illustration reproduced with the permission of Springer Nature [134]. |
 Segmentation of brain MRI with means shift: (left) Original MRI and (right) Result of segmentation; illustration reproduced with the permission from Elsevier [62]. |  Brain tumor segmentation from MRI image using Fuzzy C-Means (FCM) algorithm: (left) Original image, (right) Results of segmentation; illustration reproduced with the permission of Taylor & Francis Ltd. [50]. |  Example of brain tumour segmentation of MRI image using genetic algorithms (GA): (left) Original MRI, (right) the result of segmentation; illustration reproduced with the permission of Taylor & Francis Ltd [50]. |
| (B) Form Approach-Based Methods and (E) Contour Approach-Based Methods | ||
 (B): Segmentation of brain MRI image with atlas approach; illustration reproduced with the permission of the authors [109]. |  (B): Examples of brain MRI image segmentation with wavelet approach: (left) original MRI, (right) the result of segmentation; illustration reproduced with the permission of Elsevier [25]. |  (B): Segmentation of brain MRI image with level set of the left hemisphere, right hemisphere and cerebellum; illustration reproduced with the permission of Springer Nature [135]. |
 (B): Segmentation of white matter in a brain MR image with level set approach: Temporal ordering is from top to bottom, left to right; illustration reproduced with the permission of the author [118]. |  (B): Example of brain MR image segmentation and bias correction with active contour approach; illustration reproduced with the permission of PLoS ONE [101]. |  (E): Multi-scale representation of an MRI brain image: (top row) Gaussian blur scale-space of a sagittal MRI, resolution 1282, (bottom row) Laplacian scale-space of the same image, same scale range; illustrations reproduced with the permission of Springer Nature [93]. |
| (C) Graph theory based methods and (D) Structural approach based methods | ||
 (C): The Brainstem Nuclei segmentation result with hypergraph approach: (left to right) Original image, Brainstem Nuclei, predicted labels and segmentation result (automatic segmentation in red contours and manual segmentations yellow contours); illustration reproduced with the permission of Springer Nature [136]. |  (C): Discriminant model-constrained graph cuts approach to fully automated pediatric brain tumor segmentation in 3-D MRI; illustration reproduced with the permission of Springer Nature [131]. |  (D): Automated tissue segmentation of brain MRI parsing with line of watershed: (green) gray matter, (red) white matter, (blue) cerebrospinal fluid; illustration reproduced with the permission of Springer Nature [100]. |
| Reference | Classification Techniques | Database | Performance Measures (%) | ||
|---|---|---|---|---|---|
| AC | SE | SP | |||
| [143] | Classification: SVM (linear basis kernel) with supervised learning | Group 1: 20 AD and 20 HC, samples from the Rochester community, Minnesota, USA. Group 2: 14AD and 14 HC from the Dementia Research Centre, Univ. College London, UK. Group 3: 33 probable mild AD and 57 HC sample in Rochester, Minnesota, USA. Group 4: 19 subjects with pathologically confirmed FTLD | AD: 96 PMAD: 89 FTLD: 89 | NA | NA |
| [144] | Segmentation: hierarchical networks Classification: SVM with supervised learning | ADNI: 100 P-MCI and 125 HC subjects http://adni.loni.usc.edu/ | MCI: 84.35 | NA | NA |
| [145] | Classification: SVM with leave-1-out CV and 3-fold CV and supervised learning | 19 AD and 20 HC subjects | AD: 80 | NA | NA |
| [146] | Segmentation: SPM5 software from department of Imaging Neuroscience, London, UK and using Student t tests | 25 AD subjects (11 men, 14 women), 24 MCI subjects (10 men, 14 women) and 25 HC (13 men, 12 women) subjects | AD: 84 MCI: 73 | 84 75 | 84 70 |
| [147] | Feature extraction: Wavelet coefficients Classification: SOM neural network with unsupervised learning SVM (linear, Polynomial, RBF basis kernel) with supervised learning | AANLIB of Harvard Medical School: 46 AD and 6 HC subjects. http://med.harvard.edu/AANLIB/ | AD-SOM: 94 AD-SVM: 98 | NA | NA |
| [148] | Feature extraction: Wavelet transform Segmentation: PCA Classification: BPNN with supervised learning | 48 AD, glioma, meningioma, visual agnosia, Pick’s disease, sarcoma, and Huntington’s disease and 18 HC subjects | 100 | NA | NA |
| [149] | Classification: SVM (bootstrap method) with supervised learning | 16 AD and 22 HC subjects | AD: 94.5 | 91.5 | 96.6 |
| [150] | Feature extraction: Random forest Classification: SVM (bootstrap estimation and 20-fold CV) with supervised learning | 144 AD and 189 HC subjects | AD: 0.97 | 89 | 94 |
| [151] | Classification: SVM (leave-one-out CV) with supervised learning | 37 AD and 40 HC subjects. | AD:96.1 | NA | NA |
| [152] | Classification: SVM, Bayes statistics, VFI with supervised learning | 32 AD, 24 MCI and 18 HC subjects | AD: 92 MCI-c: 75 | NA | NA |
| [153] | Feature selection: Pearson’s correlation Classification: SVM (linear basis kernel and leave-one-out CV) with supervised learning | 20 AD and 25 HC subjects from Hospital de Santiago Apostol, Mexico. | AD: 100 | NA | NA |
| [154] | Features extraction: MBL Classification: LDA, SVM with supervised learning | ADNI: 198 AD, 238 S-MCI, 167 progresses MCI and 231 HC subjects | AD-SVM: 86 AD-LDA: NA | 94 93 | 78 85 |
| [155] | Feature extraction: SIFT Segmentation: k-means Classification: SVM (leave-one-out CV) with supervised learning | 100 AD and 98 HC subjects. | AD: 86 | NA | NA |
| [156] | Feature extraction: fractal analysis Classification: SVM (quadratic kernel) with supervised learning | 13 AD and 10 HC subjects. | AD: 100 | NA | NA |
| [7] | Segmentation: Hybrid FCM/PCM Classification: SVM (RBF kernel and leave-one-out CV) with supervised learning | 45 AD and 50 HC subjects from ADNI phantom with noisiest images and spatial intensity inhomogeneity | AD-MRI: 75 AD-PET: 73 | 84.87 86.36 | 81.58 82.67 |
| Reference | Fusion Approach | Modalities | Performance Criteria | Computation Time (in Sec.) | |||
|---|---|---|---|---|---|---|---|
| [191] | Hybrid NSCT/PCNN | QMI | QS | QAB/F | |||
| MRI-T1 + MRI-T2 | 3.9161 | 0.6561 | 0.6841 | 2.2198 | |||
| MRI + CT | 1.8028 | 0.4651 | 0.6652 | 2.2220 | |||
| [192] | QMI | QS | QAB/F | ||||
| NSCT | MRI-T1 + MRI-T2 | 3.9133 | 0.6892 | 0.6961 | 2.2189 | ||
| NSCT | MRI + CT | 1.8499 | 0.4703 | 0.6814 | 2.2245 | ||
| [183] | QMI | QS | QAB/F | ||||
| NSCT | MRI-T1 + MRI-T2 | 3.9493 | 0.6950 | 0.6990 | 2.2194 | ||
| NSCT | MRI + CT | 1.8503 | 0.4725 | 0.6772 | 2.2198 | ||
| PCA | MRI-T1 + MRI-T2 | 3.6627 | 0.6760 | 0.6645 | 0.0333 | ||
| PCA | MRI + CT | 2.6001 | 0.5133 | 0.6092 | 0.0328 | ||
| [193] | QMI | QS | QAB/F | ||||
| Contourlet | MRI-T1 + MRI-T2 | 3.8314 | 0.6674 | 0.6816 | 1.9522 | ||
| Contourlet | MRI + CT | 1.6025 | 0.4277 | 0.6485 | 1.9682 | ||
| [194] | QMI | QS | QAB/F | ||||
| Wavelet | MRI-T1 + MRI-T2 | 3.0773 | 0.6585 | 0.6176 | 0.0759 | ||
| Wavelet | MRI + CT | 1.5420 | 0.4187 | 0.5175 | 0.0780 | ||
| [195] | RMSE | ||||||
| Hybrid Surface/Voxel | MRI + PET | 0.047796 | 24.2 | ||||
| Surface | MRI + PET | 1.69186 | 3.4 | ||||
| Voxel | MRI + PET | 0.050478 | 639.18 | ||||
| [196] | PSNR | ||||||
| Wavelet | MRI + CT | 72.1172 | NA | ||||
| Pyramid | MRI + CT | 70.1061 | NA | ||||
| Weighted average | MRI + CT | 68.4456 | NA | ||||
| [197] | Mean | Var | Entropy | Cros-Ent | |||
| Weighted average/WT | MRI + CT | 59.6862 | 59.6871 | 6.7599 | 0.5632 | NA | |
| Wavelet | MRI + CT | 32.0674 | 32.0678 | 5.8570 | 0.8999 | NA | |
| Weighted average/WT | MRI + PET | 45.3537 | 45.3543 | 5.6779 | 0.7714 | NA | |
| Wavelet | MRI + PET | 30.1334 | 30.1339 | 5.3272 | 0.9629 | NA | |
| [198] | MI | ||||||
| Level set | MRI-T1 + MRI-T2 | 1.7176 | NA | ||||
| Pixel-based | MRI-T1 + MRI-T2 | 1.5540 | NA | ||||
| Edge detection | MRI-T1 + MRI-T2 | 1.6726 | NA | ||||
| [199] | DC | ||||||
| Bayesian multi-sequence Markov model with adaptive weighted EM | MRI-T1 + MRI-T2 + MRI-Flair | 12 (+8) (9% SNR) | NA | ||||
| [200] | EFA | EFLA EFSA | |||||
| SP-MMI algorithm | MRI + SPECT | 0.001 | 0.003 0.007 | NA | |||
| [201] | EFA | EFLA EFSA | |||||
| FCM/MMI algorithm | MRI + SPECT | 0.06 | 0.16 0.04 | NA | |||
| [202] | DR | ||||||
| Regional growing approach | MRI-T2 + DTI | Edema: 2.96 | NA | ||||
| Tumor solid: 8.07 | |||||||
| Tumor: 11.03 | |||||||
| Reference | Multimodal Classifier | ADNI Subjects | Modalities | Performance Criteria (%) | |||||||
|---|---|---|---|---|---|---|---|---|---|---|---|
| AD Vs. HC | MCI Vs. HC | ||||||||||
| AC | SE | SP | AUC | AC | SE | SP | AUC | ||||
| [16] | HIS | NA | MRI + PET | 80-90 | NA | NA | NA | NA | NA | NA | NA |
| [10] | MKL | 51AD + 99MCI + 52HC | MRI CSF PET MRI + FDG−PET MRI + FDG−PET + CSF | 86.2 82.1 86.5 90.6 93.2 | 86.0 81.9 86.3 91.4 NA | 86.3 82.3 86.6 91.6 NA | NA NA NA NA NA | 72.0 71.4 74.5 76.4 NA | 78.5 78.0 81.8 80.4 NA | 59.6 58.8 66.0 63.3 NA | NA NA NA NA NA |
| [203] | MKL | 77AD + 82HC | MRI FDG−PET MRI + FDG−PET | 75.27 79.36 81.0 | 63.06 78.61 78.52 | 81.86 78.94 81.76 | 82.48 83.9 88.5 | NA NA NA | NA NA NA | NA NA NA | NA NA NA |
| [204] | MKL | 48AD + 66HC 48AD + 66HC | MRI + FDG−PET MRI + FDG−PET + CSF + ApoE + Cognitive scores | 87.6 92.4 | NA NA | NA NA | NA NA | NA NA | NA NA | NA NA | NA NA |
| [205] | SCLDA model | 49AD + 67HC | MRI + FDG−PET | 94.3 | NA | NA | NA | NA | NA | NA | NA |
| [206] | M3T | 45AD + 91MCI + 50HC | MRI FDG−PET CSF MRI + FDG−PET + CSF | 84.8 84.5 80.5 93.3 | NA NA NA NA | NA NA NA NA | NA NA NA NA | 73.9 79.7 53.6 83.2 | NA NA NA NA | NA NA NA NA | NA NA NA NA |
| [207] | Multivariate analysis of OPLS | 96AD + 162MCI + 111HC | MRI CSF MRI + CSF | 87.0 81.6 91.8 | 83.3 84.4 88.5 | 90.1 79.3 94.6 | 0.930 0.861 0.958 | 71.8 70.3 77.6 | 66.7 66.7 72.8 | 79.3 75.7 84.7 | 78.26 77.06 87.6 |
| [185] | Random forest | 37AD + 75MCI + 35HC | MRI FDG−PET CSF Genetic MRI + PET + CSF + Genet | 82.5 86.4 76.1 72.6 89.0 | 88.6 85.8 72.8 71.3 87.9 | 75.6 87.1 79.8 74.1 90.0 | NA NA NA NA NA | 67.3 53.5 61.7 73.8 74.6 | 64.3 42.3 61.6 94.7 77.5 | 73.9 78.0 61.8 26.6 67.9 | NA NA NA NA NA |
| [208] | Multitask feature selection method + MKL | 51AD + 99MCI + 52HC | MRI FDG−PET MRI + FDG−PET | 91.10 91.02 94.37 | 91.57 89.02 94.71 | 92.88 90.58 94.04 | 96.55 95.84 97.24 | 73.54 72.08 78.80 | 81.01 75.56 84.85 | 65.38 59.23 67.06 | 78.26 77.06 82.84 |
| [188] | Multivariate modeling + SVM | 50 MCI | MRI FDG−PET PIB−PET MRI + PIB−PET MRI + FDG−PET | NA NA NA NA NA | NA NA NA NA NA | NA NA NA NA NA | NA NA NA NA NA | 67 62 45 76 37 | 37 10 45 53 37 | 87 97 80 90 90 | NA NA NA NA NA |
| [184] | Multimodal biomarker classifier + SVM | 95AD + 182MCI + 111HC | MRI CSF MRI + CSF MRI + CSF + ApoE | 73 82 84 85 | NA NA NA NA | NA NA NA NA | 78 85 90 88 | 70 74 77 79 | NA NA NA NA | NA NA NA NA | 68 77 78 79 |
| [187] | M2TFS + MKL | 51AD + 99MCI + 52HC | MRI FDG−PET CSF MRI + FDG−PET MRI + FDG−PET + CSF | 88.68 84.42 82.26 95.00 95.40 | 84.51 83.53 82.55 94.90 94.71 | 92.50 84.81 81.54 95.00 95.77 | 94 91 87 97 98 | 73.12 67.11 70.72 79.27 82.99 | 78.28 75.96 71.62 85.86 89.39 | 63.65 50.19 69.04 66.54 70.77 | 79 72 75 82 84 |
| [186] | MKL with multitask feature learning | 51AD + 99MCI + 52HC | MRI FDG−PET MRI + FDG−PET | 92.25 91.65 95.95 | 92.16 92.94 95.10 | 92.12 90.19 96.54 | 96 96 97 | 73.84 74.34 80.26 | 77.27 85.35 84.95 | 66.92 53.46 70.77 | 77 78 81 |
| [209] | M3 | 16AD + 22HC | MRI + PET | 89.47 | 87.5 | 90.91 | NA | NA | NA | NA | NA |
| [210] | DNN | 180AD + 160 MCI + 204HC 85AD + 67MCI + 77 HC | MRI MRI + FDG−PET | 82.59 91.40 | 86.83 92.32 | 77.78 90.42 | NA NA | 71.98 82.10 | 49.52 60.00 | 84.31 92.32 | NA NA |
| [211] | CNN | 93 AD + 100 HC | MRI + PET | 89.64 | 87.1 | 92 | 94.45 | NA | NA | NA | NA |
| [17] | SVDD | 77 AD + 82 HC | MRI FDG−PET MRI + FDG−PET | 88.15 85.16 93.65 | 89.02 86.84 90.08 | 90.18 84.14 92.75 | 95.00 92.04 97.30 | NA NA NA | NA NA NA | NA NA NA | NA NA NA |
© 2020 by the authors. Licensee MDPI, Basel, Switzerland. This article is an open access article distributed under the terms and conditions of the Creative Commons Attribution (CC BY) license (http://creativecommons.org/licenses/by/4.0/).
Share and Cite
Lazli, L.; Boukadoum, M.; Mohamed, O.A. A Survey on Computer-Aided Diagnosis of Brain Disorders through MRI Based on Machine Learning and Data Mining Methodologies with an Emphasis on Alzheimer Disease Diagnosis and the Contribution of the Multimodal Fusion. Appl. Sci. 2020, 10, 1894. https://doi.org/10.3390/app10051894
Lazli L, Boukadoum M, Mohamed OA. A Survey on Computer-Aided Diagnosis of Brain Disorders through MRI Based on Machine Learning and Data Mining Methodologies with an Emphasis on Alzheimer Disease Diagnosis and the Contribution of the Multimodal Fusion. Applied Sciences. 2020; 10(5):1894. https://doi.org/10.3390/app10051894
Chicago/Turabian StyleLazli, Lilia, Mounir Boukadoum, and Otmane Ait Mohamed. 2020. "A Survey on Computer-Aided Diagnosis of Brain Disorders through MRI Based on Machine Learning and Data Mining Methodologies with an Emphasis on Alzheimer Disease Diagnosis and the Contribution of the Multimodal Fusion" Applied Sciences 10, no. 5: 1894. https://doi.org/10.3390/app10051894
APA StyleLazli, L., Boukadoum, M., & Mohamed, O. A. (2020). A Survey on Computer-Aided Diagnosis of Brain Disorders through MRI Based on Machine Learning and Data Mining Methodologies with an Emphasis on Alzheimer Disease Diagnosis and the Contribution of the Multimodal Fusion. Applied Sciences, 10(5), 1894. https://doi.org/10.3390/app10051894