Article

Fine-Grained Butterfly Classification in Ecological Images Using Squeeze-And-Excitation and Spatial Attention Modules

1
College of Computer Science and Information Technology, Central South University of Forestry and Technology, Hunan 410004, China
2
College of Information Science and Engineering, Ritsumeikan University, 1-1-1 Nojihigashi, Kusatsu 525-8577, Japan
*
Authors to whom correspondence should be addressed.
Appl. Sci. 2020, 10(5), 1681; https://doi.org/10.3390/app10051681
Submission received: 5 February 2020 / Revised: 27 February 2020 / Accepted: 27 February 2020 / Published: 2 March 2020
(This article belongs to the Section Computing and Artificial Intelligence)

Abstract

:
Most butterfly larvae are agricultural pests and forest pests, but butterflies have important ornamental value and the ability to sense and respond to changes in the ecological environment. There are many types of butterflies, and the research on classification of butterfly species is of great significance in practical work such as environmental protection and control of agricultural and forest pests. Butterfly classification is a fine-grained image classification problem that is more difficult than generic image classification. Common butterfly photos are mostly specimen photos (indoor photos) and ecological photos (outdoor photos/natural images). At present, research on butterfly classification is more based on specimen photos. Compared with specimen photos, classification based on ecological photos is relatively difficult. This paper mainly takes ecological photos as the research object, and presents a new classification network that combines the dilated residual network, squeeze-and-excitation (SE) module, and spatial attention (SA) module. The SA module can make better use of the long-range dependencies in the images, while the SE module takes advantage of global information to enhance useful information features and suppress less useful features. The results show that the integrated model achieves higher recall, precision, accuracy, and f1-score than the state-of-the-art methods on the introduced butterfly dataset.

1. Introduction

There are many kinds of butterflies. “Systematic butterfly names of the world” [1] records 17 families, 47 subfamilies, 1690 genera, and 15,141 species of butterflies in the world. Among them, there are 12 families, 33 subfamilies, 434 genera and 2153 species of Chinese butterflies. Not only do butterflies have great ornamental value, they also play an important role in the overall stability of the ecosystem. Butterflies are also particularly effective at indicating subtle ecosystem changes, as they have a short lifespan and can respond quickly to these changes. Butterflies are very helpful for scientists monitoring global climate change. In addition, the larvae of most butterfly species are agricultural and forestry pests, which directly affect the living environment of humans and animals and food sources. Therefore, the research on automatic identification of butterfly species is of great significance not only in the research of species identification, but also in practical work such as environmental protection, control of agricultural and forest pests, and border quarantine. Butterfly classification is a fine-grained image classification problem, which is more difficult than general/generic image classification [2].
Some published studies have reported on butterfly classification using low-level features and mid-level features combined with traditional machine learning methods. The authors of [3,4,5] take advantage of multi-scale curvature histogram (HoMSC) to describe the shape of butterfly wings, and utilize gray-level co-occurrence matrix (GLCMoIB) of image blocks to describe the texture of butterfly wings. The k-nearest neighbor algorithm (KNN) is adopted as the butterfly classification algorithm. DSY Kartika et al. [6] combine local binary pattern (LBP) and region attributes to extract texture feature and shape feature, respectively. Then, the texture feature extraction and shape feature are combined to classify the butterfly. DSY Kartika et al. [7] propose to make use of the HSV (Hue, Saturation, Value) color space and local binary patterns (LBP) to extract color feature and texture feature, and combine these two features to classify butterflies. The authors of [8,9] adopted local binary pattern (LBP) and artificial neural network (ANN) to classify two and five types of butterflies, respectively. M Clément et al. [10] proposed to characterize the spatial relationship and shape information between paired sub-portions of butterflies based on histogram decomposition (FHD). Based on this, a bags-of-features framework is proposed, and then K-Means is used to implement butterfly classification.
In recent years, the high-level feature representation of deep convolutional neural networks (DCNN) has proven to be superior to hand-crafted low-level features and mid-level features. Deep learning techniques have also been applied to butterfly classification. Li Ce et al. [11] used ResNet-101 as a backbone network to construct a deformable convolution model. A deep convolutional neural network is established by combining a region proposal network (RPN) and Soft non-maximum suppression (Soft-nms), and the network is trained by transfer learning. In another paper, Zhou Aiming et al. [12] introduced the Caffe framework and ImageNet pre-trained convolutional neural network model to classify species of 1117 butterflies of six families. Experiments are performed using specimen images and ecological images of butterflies. The results show that the classification effect of specimen images is much better than that of ecological images. Taking 120 common butterfly images in Asia as research objects, NNK Arzar et al. [13] proposed a convolutional neural network (CNN) using GoogLeNet as a pre-trained model. Z Lin et al. [14] proposed a skip-connections convolutional neural network (S-CCNN) classification method for butterfly specimen images. M López-Antequera et al. [15] proposed a CNN-based combination of shifted filter responses (COSFIRE) model. This method used the CNN-COSFIRE feature vector to train the SVM classifier.
Ayad et al. [16] compared the performance of three convolutional neural networks (VGG16, VGG19, and ResNet50) on butterfly classification. The results showed that ResNet50 has the highest training accuracy rate, while VGG16 has the highest test accuracy rate. Nie et al. [17] established a new butterfly dataset, which includes indoor photos and outdoor photos, and compared the performance of three convolutional neural networks (AlexNet, VGGNet, and ResNet) on butterfly classification. The results showed that ResNet has the highest recognition accuracy rate. Carvajal et al. [18] used different convolutional neural networks (AlexNet VGG-F, VGG16, VGG19) to conduct butterfly recognition research. Chang et al. [19] built a dataset of butterflies and moths, and used four models (VGG-19, Inception-v3, Resnet18, and Resnet34) for identification research. The authors of [20,21] used AlexNet to calculate global CNN features and used SVM to classify butterfly specimen images. The author of [22] established a dataset composed of ecological butterfly images and butterfly images in monograph of Chinese. On this dataset, the authors of [22,23] used Faster R-CNN for automatic recognition of butterflies.
In this study, we focus on butterfly classification in ecological images. Compared with the specimen images, the ecological images have a complex background and different scales and different illuminations. The classification of butterflies in ecological images is a challenging task. We propose a deep-learning-based method for fine-grained butterfly classification in ecological images using squeeze-and-excitation (SE) and spatial attention (SA) modules. The attention modules are used to focus on the most discriminative area and enhance the meaningful features in both channel and spatial dimensions. The SA module can make better use of the long-range dependencies in the images, while the SE module takes advantage of global information to enhance useful information features and suppress less useful features. Experimental results show that the proposed method is superior to other state-of-the-art methods.
The remainder of this paper is organized as follows. Section 2 provides a detailed description of our dataset and the proposed method. The experimental results are reported in Section 3. Section 4 provides the conclusions.

2. Materials and Methods
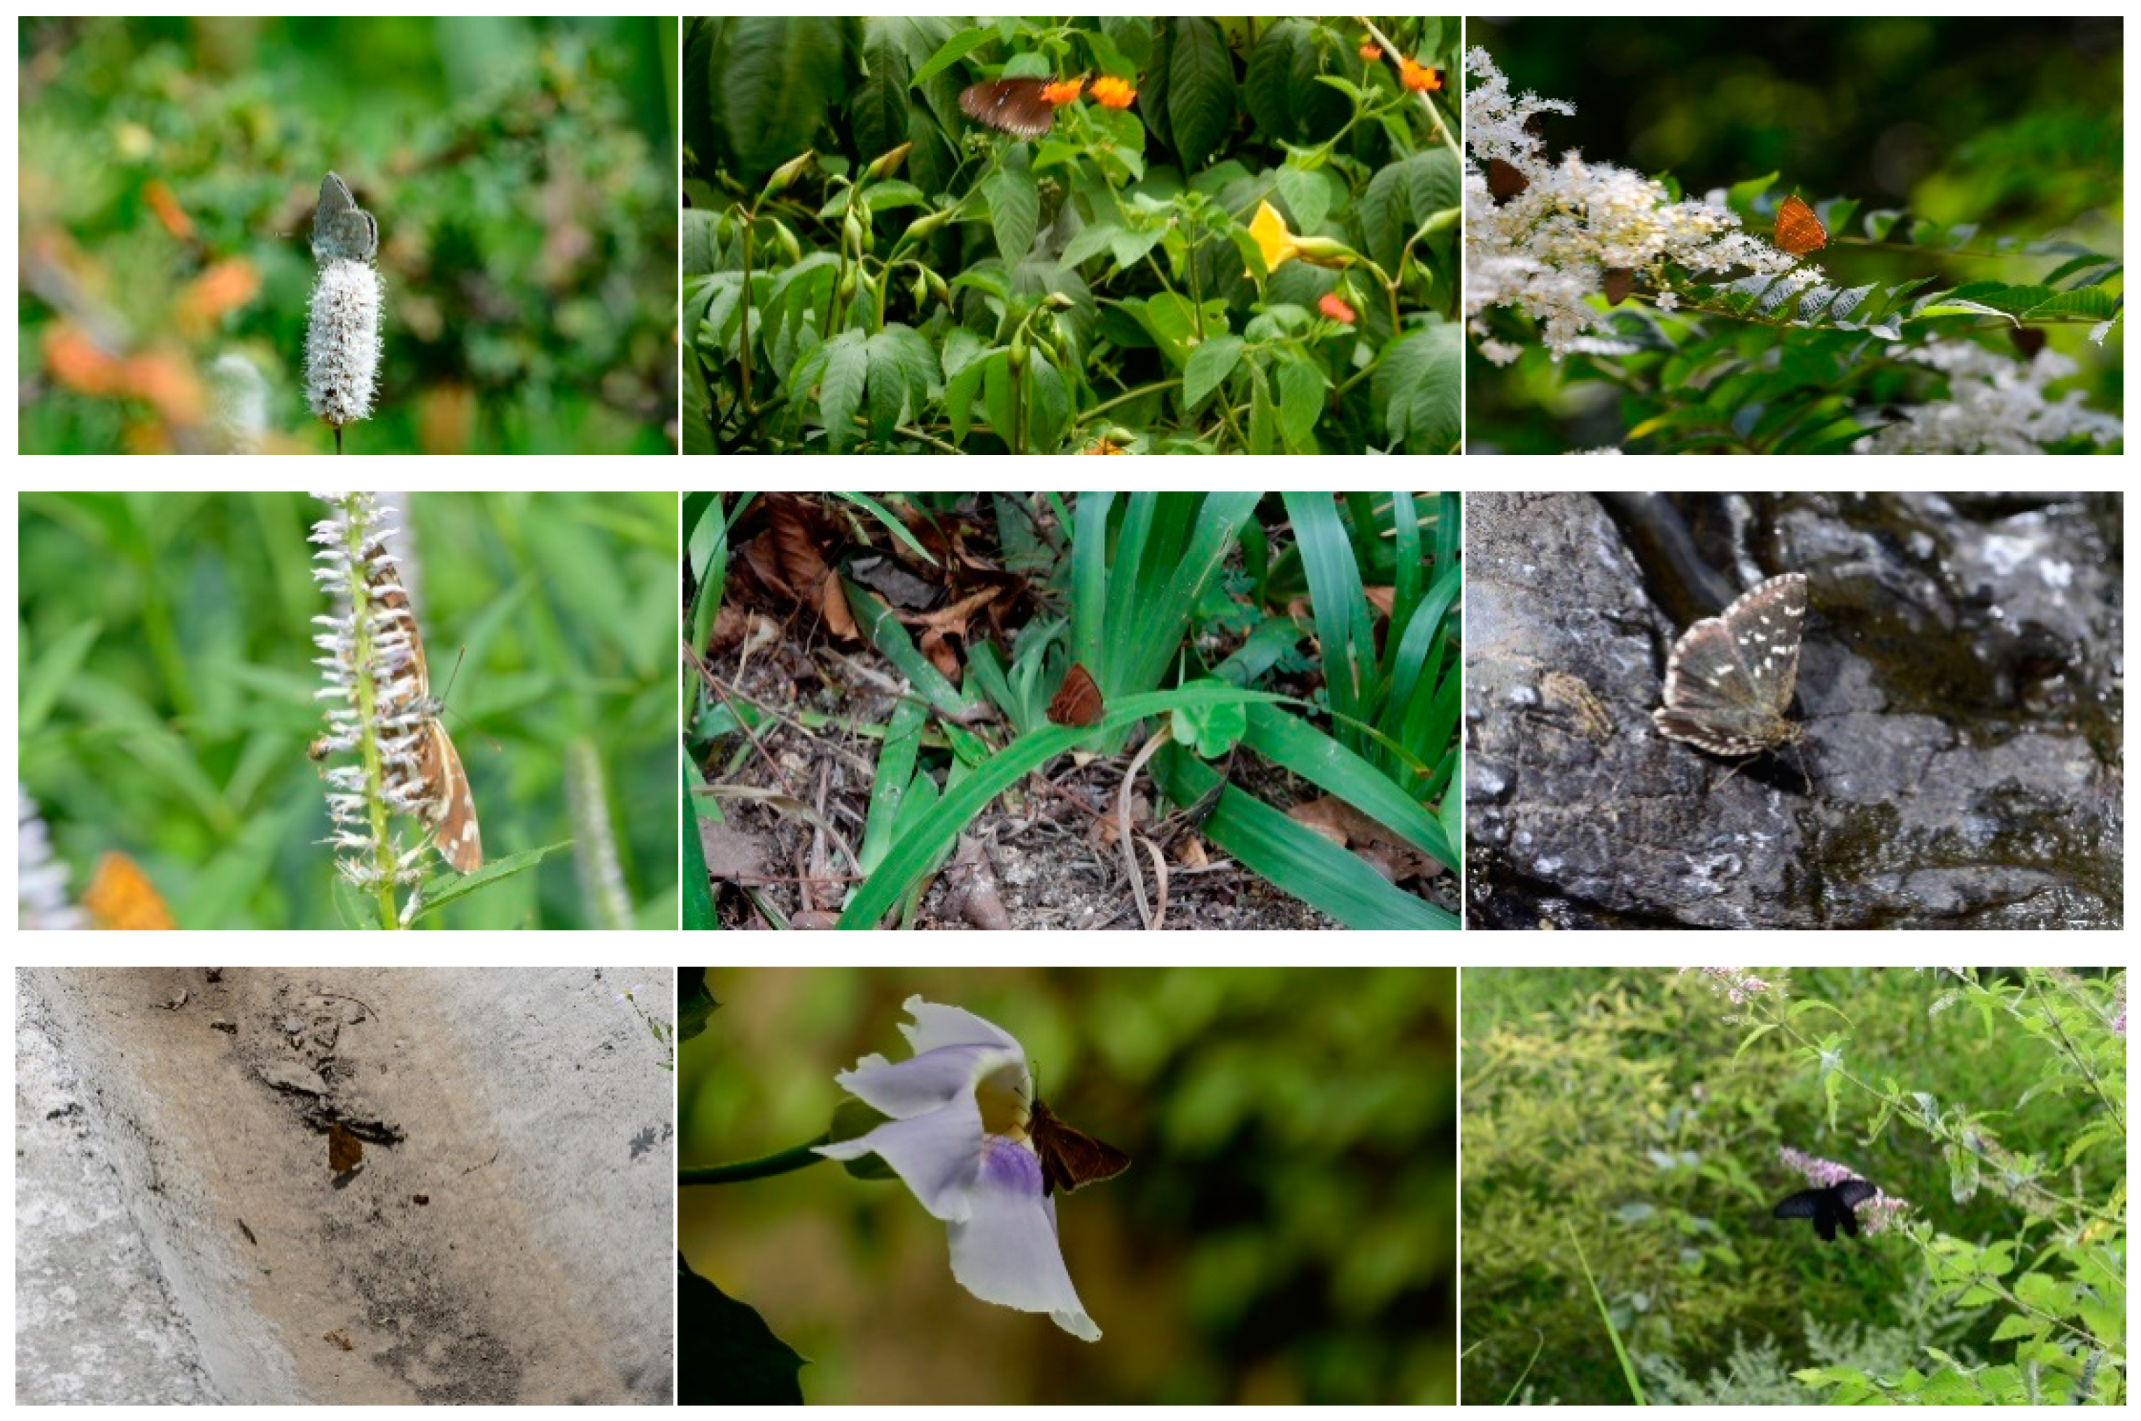
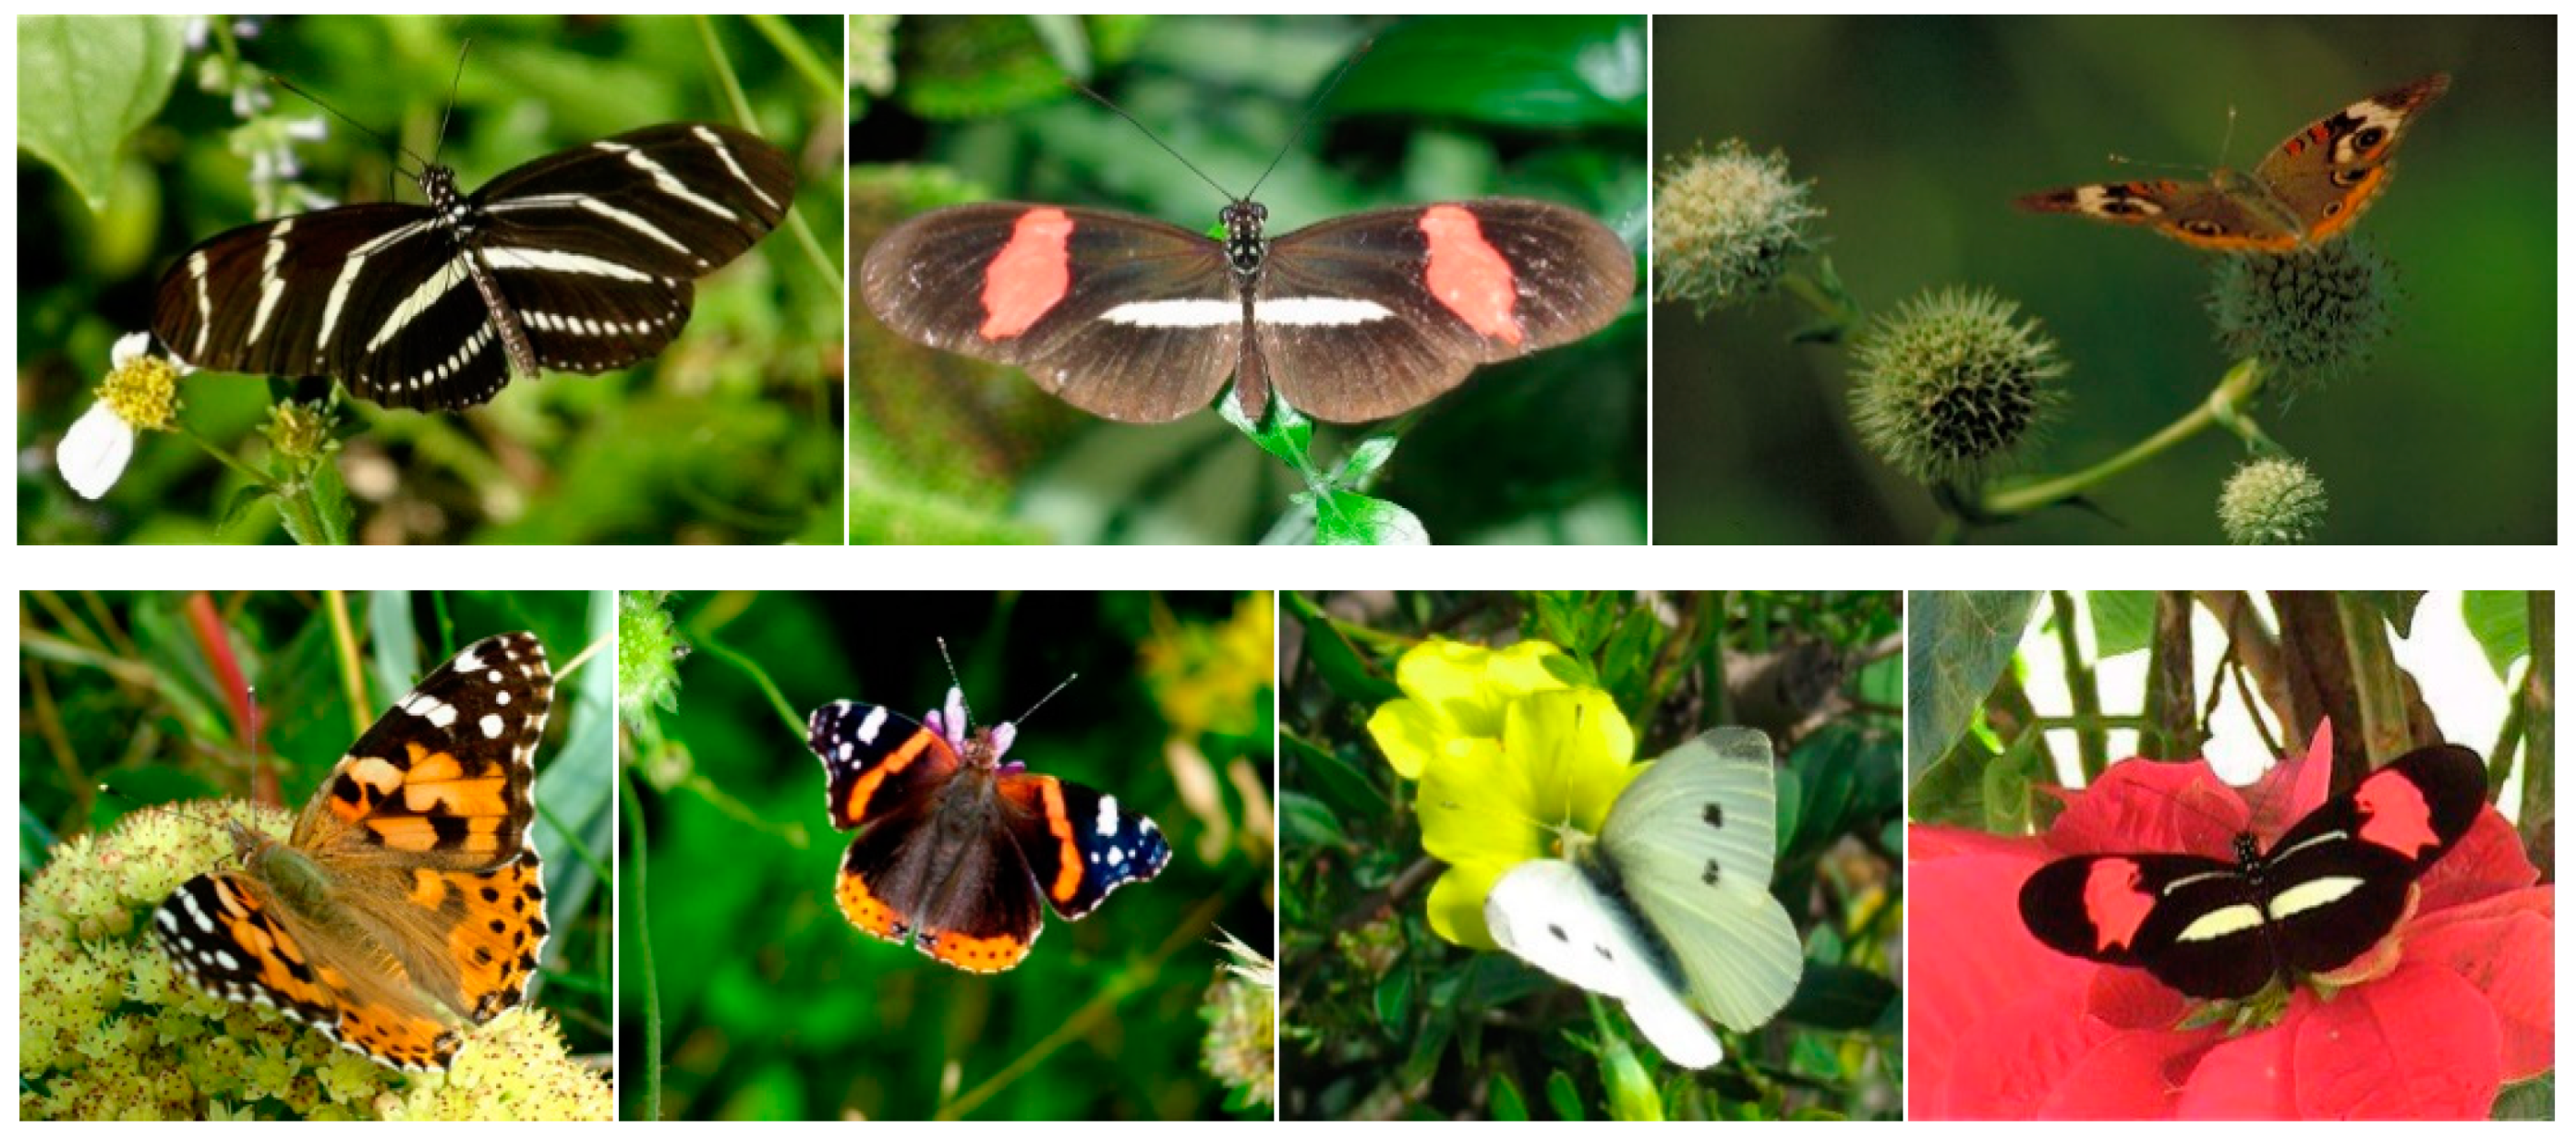
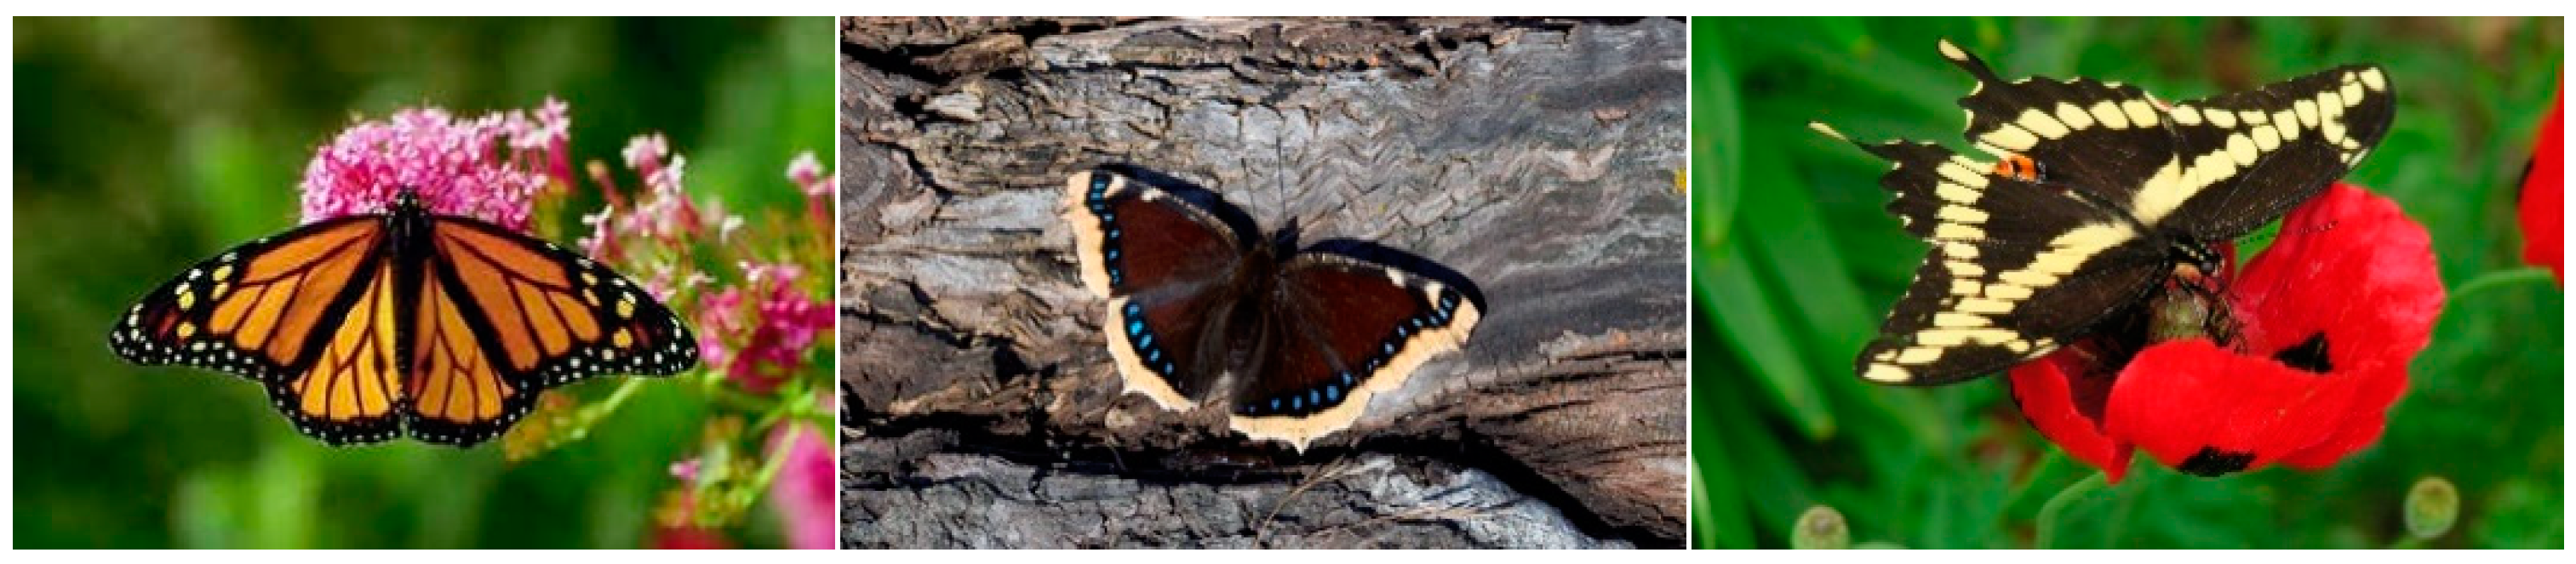
2.1. Datasets

This study uses the Chinese butterfly image dataset [22] and the Leeds Butterfly Dataset [24]. Table 1 lists the scientific names of 30 species of butterflies and number of images per butterfly species. The Chinese butterfly dataset includes specimen images of butterflies (indoor photos) and images of butterflies in the ecological environment (outdoor photos/natural images). Ecological images of butterflies come from field photography and donations from butterfly lovers. The sizes of many of the images reaches 5184 × 3456 and the butterfly is not segmented from the background. The mimicry of butterflies also brings great challenges to the detection and recognition of butterflies in ecological images. Therefore, this paper only studies the problem of butterfly classification in ecological images. This study uses 20 species of butterfly images from the Chinese butterfly dataset. There are 10 images in the smallest category and 61 images in the largest category, for a total of 467 images. Figure 1 shows sample images of some Chinese butterfly species. As you can see from the image, the posture of the butterfly and the background of the image are very different. Some butterflies are similar in color to the background. These all pose challenges for classification.
The Leeds Butterfly Dataset contains 10 categories of butterfly images. There are 55 images in the smallest category and 100 images in the largest category, for a total of 832 images, as shown in Figure 2 and Table 1.
In this experiment, a total of 1299 butterfly images were used and the size of the images was adjusted to 224 × 224 × 3. For each category, we randomly split the dataset using ratios of approximately 60%, 21% and 19% for training, validation, and testing. There are 768 training samples, 280 validation samples, and 251 testing samples, respectively. The data distribution is listed in Table 1.

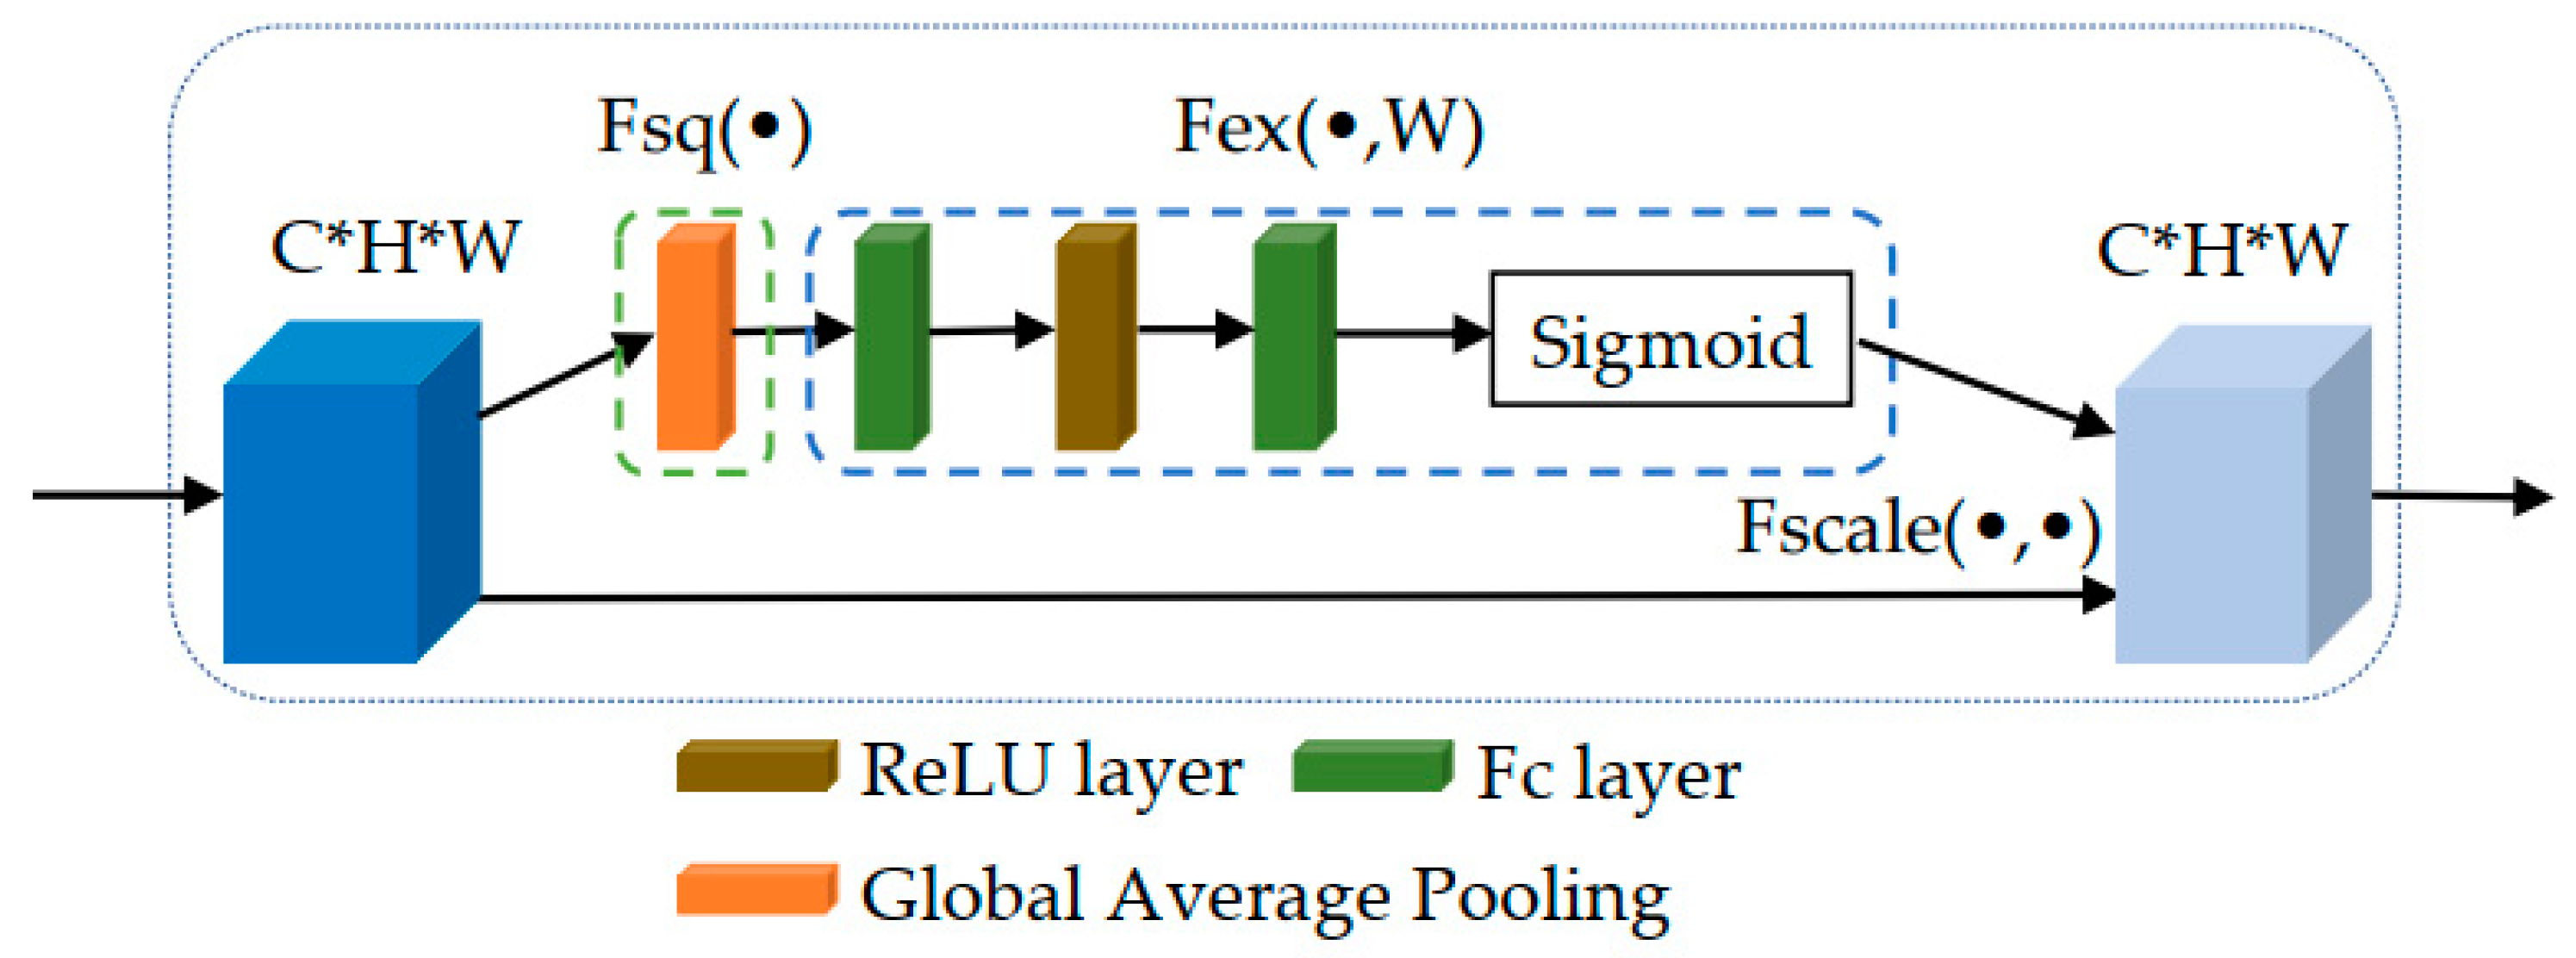
2.2. Squeeze-And-Excitation Modules

Convolutional neural networks use the idea of local receptive fields to fuse channel information and spatial information to extract features containing information. The squeeze-and-excitation (SE) module proposed by Jie Hu et al. [25] can capture channel information. It is well applied in a variety of classification tasks [26,27,28,29]. The SE module considers the relationships between feature channels and adds a focus mechanism for feature channels. This mechanism is particularly helpful for improving the recognition ability of the proposed model [19]. For fine-grained classification problems such as butterfly classification, the SE module can weaken the similarity problem between classes. By assigning different weights to different channels, the SE module enables the network to selectively enhance the characteristics of large amounts of information and suppress the useless characteristics. The structure of the SE module is shown in Figure 3.
In order to achieve global information embedding, the global information is squeezed into the channel descriptor by using a global average pooling. The squeeze operation compresses each two-dimensional feature channel into a real number. The real number has a global acceptance field, and the size of the output matches the number of input feature channels. For feature maps U = [ u 1 , u 2 , , u c ] C × H × W , where u k H × W is a feature map at the k-th channel. The k-th element of z ( z C ) can be obtained by using Equation (1).
z k = F s q ( u k ) = 1 W × H i = 1 W j = 1 H u k ( i , j )
After the squeeze operation, the excitation operation is performed. The excitation operation relies on the information gathered in the squeeze operation to capture channel-wise dependencies. Weights are generated for each feature channel by a parameter w, which is used to explicitly model the correlation between functional channels. The weight of the excitation output after feature selection represents the importance of each feature channel. Then, multiplication is used to achieve channel-by-channel weighting of the previous features to complete the rescaling of the original features in the channel dimension.
The structure of the excitation operation includes 1 × 1 convolution layer, ReLU layer, 1 × 1 convolution layer and Sigmoid activations layer, in order. The results of the excitation operation can be obtained using Equation (2).
s = F e x ( z , W ) = S i g m o i d ( W 2 × R e L U ( W 1 z ) )
Here, W 1 C r × C and W 2 C × C r . Reduction ratio r = 16 [30].
After the squeeze and excitation operations, according to Equation (3), the final output x ˜ k at the k-th channel is obtained by the rescaling of the feature map u k with the activations s k .
x ˜ c = F s c a l e ( u k , s k ) = s k × u k
Here, X ˜ = [ x ˜ 1 , x ˜ 2 , , x ˜ c ] .

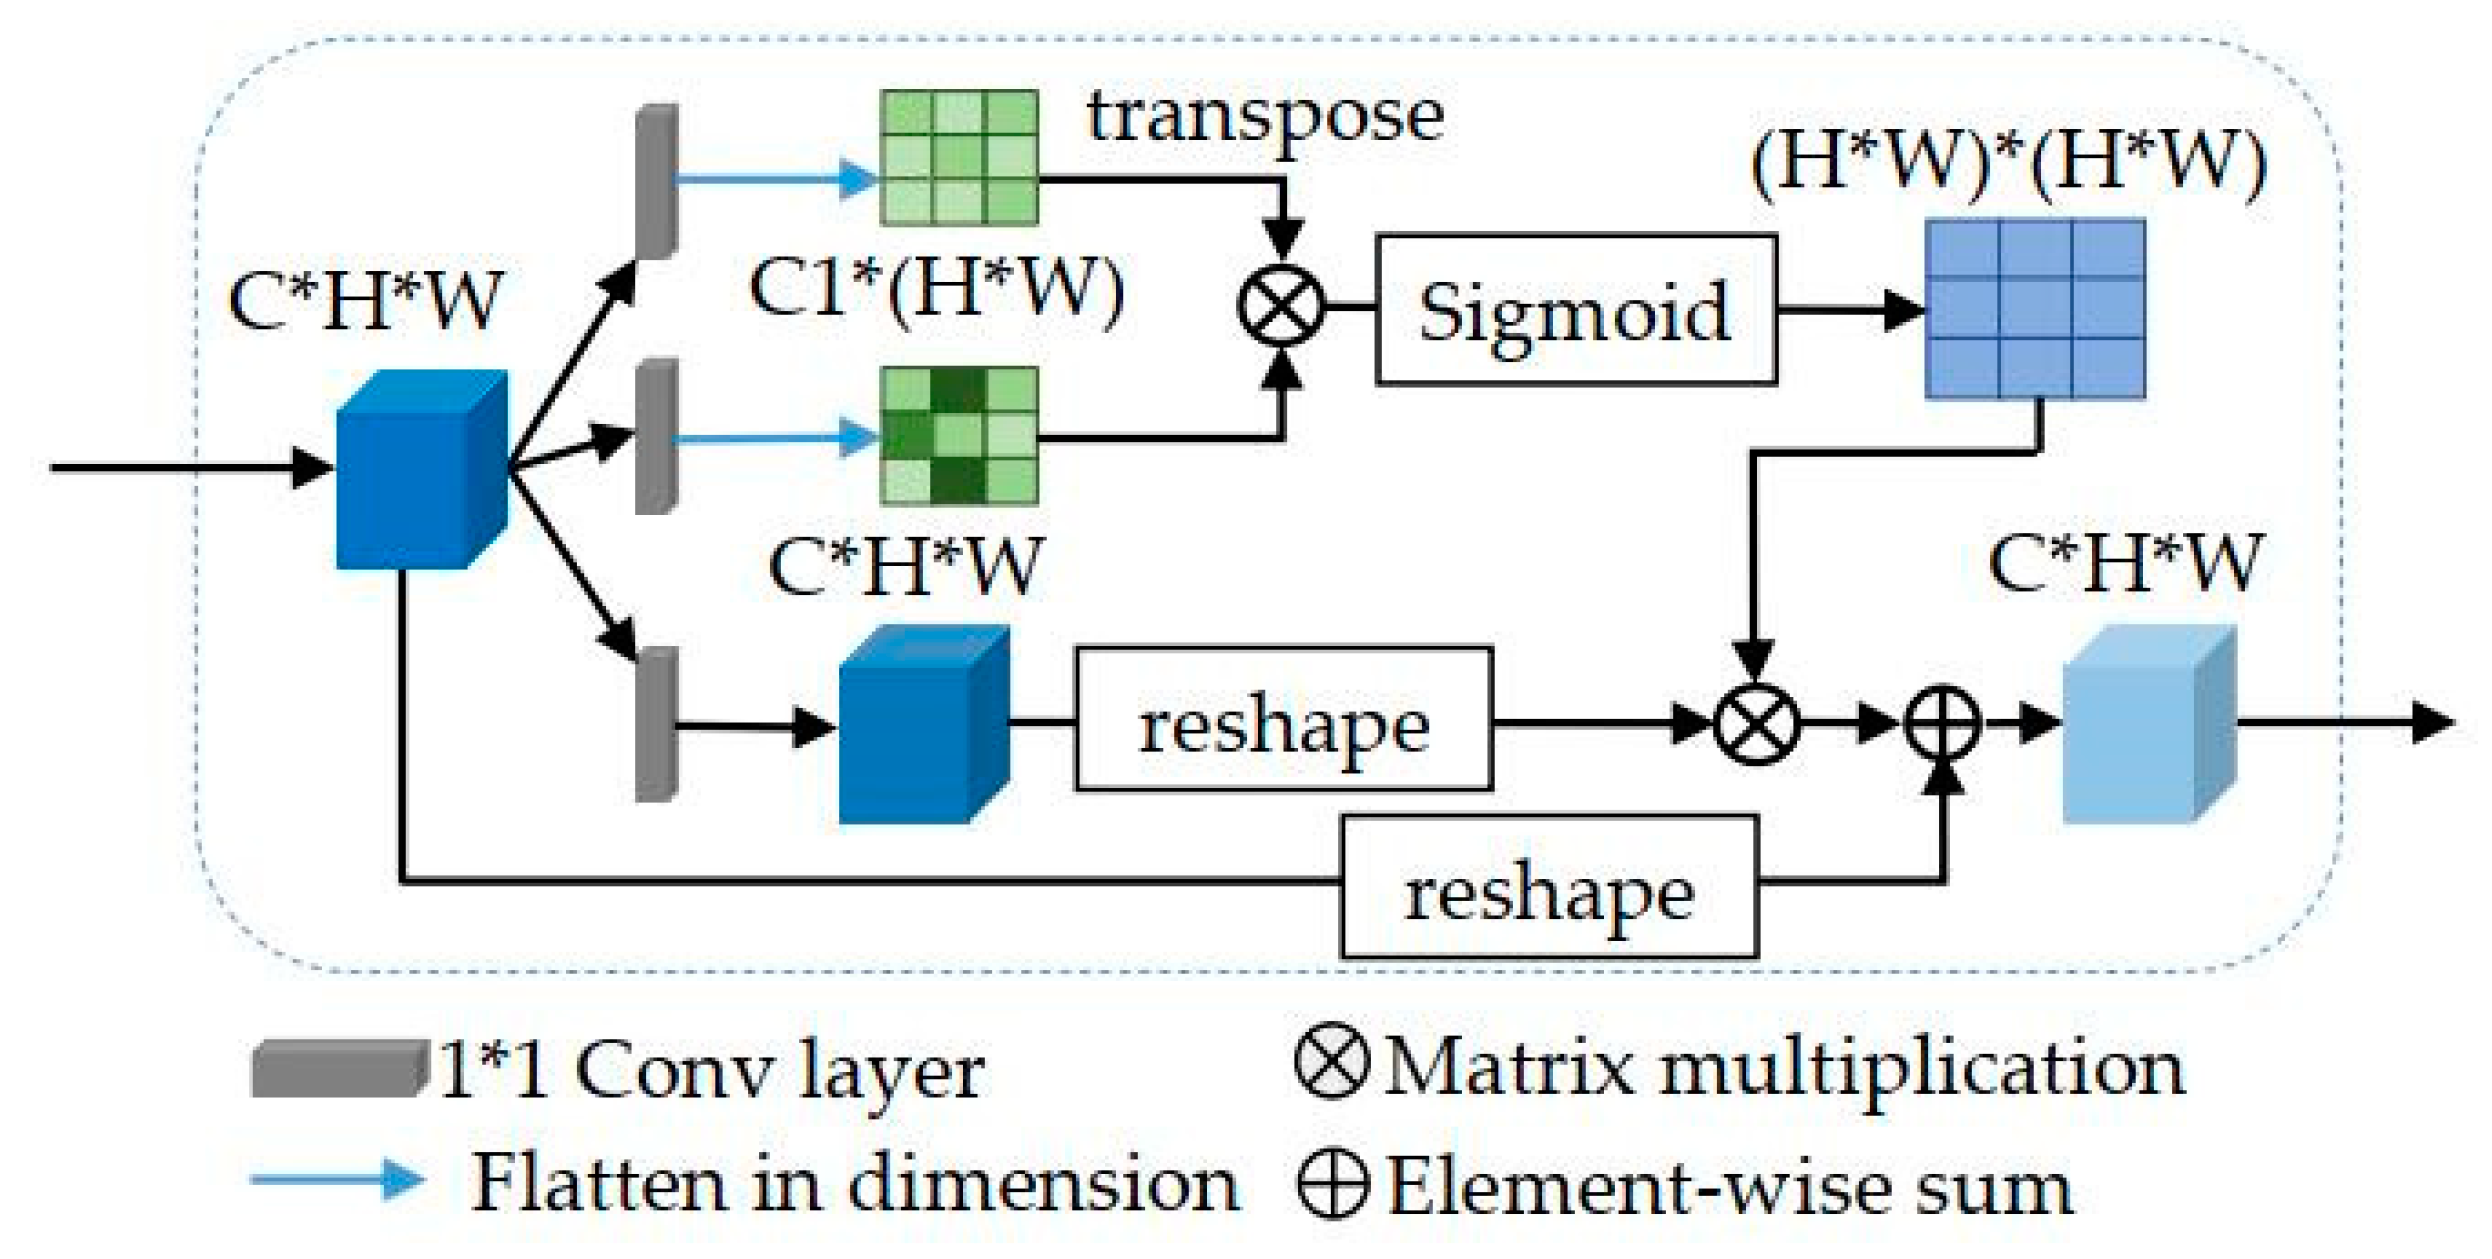
2.3. Spatial Attention Modules

Local features generated by the fully convolutional network (FCN) may cause object classification errors [31]. Xiao Chen et al. [32] believe that the spatial attention module can capture remote context information. The spatial attention module (SA module) enhances its representation ability by encoding extensive contextual information as local features. The structure of the spatial attention module is shown in Figure 4.
After inputting the global feature map U C × H × W into three 1 × 1 convolutional layers (conv1, conv2 and conv3), conv1 and conv2 are transformed into feature spaces B , C C 1 × ( H × W ) . The spatial attention map S ( H × W ) × ( H × W ) can be calculated using a softmax layer shown in Equation (4).
s j i = exp ( i j ) i = 1 N exp ( i j ) ,   where   i j = B i · C j
The convolutional layers conv3 is transformed into a feature map D C × H × W . The value of sji indicates the degree of influence of the i-th position on the j-th position. The new feature map o = {o1, o2, …, oN} is obtained by performing matrix multiplication with the spatial attention map S and the feature map D shown in Equation (5).
o j = i = 1 N s j i D i ,   where   N = H × W
The element-wise summation between feature attention map o and feature map U is the final output of spatial attention module y, as shown in Equation (6),
y j = β o j + U j
where β is the weight obtained through learning.

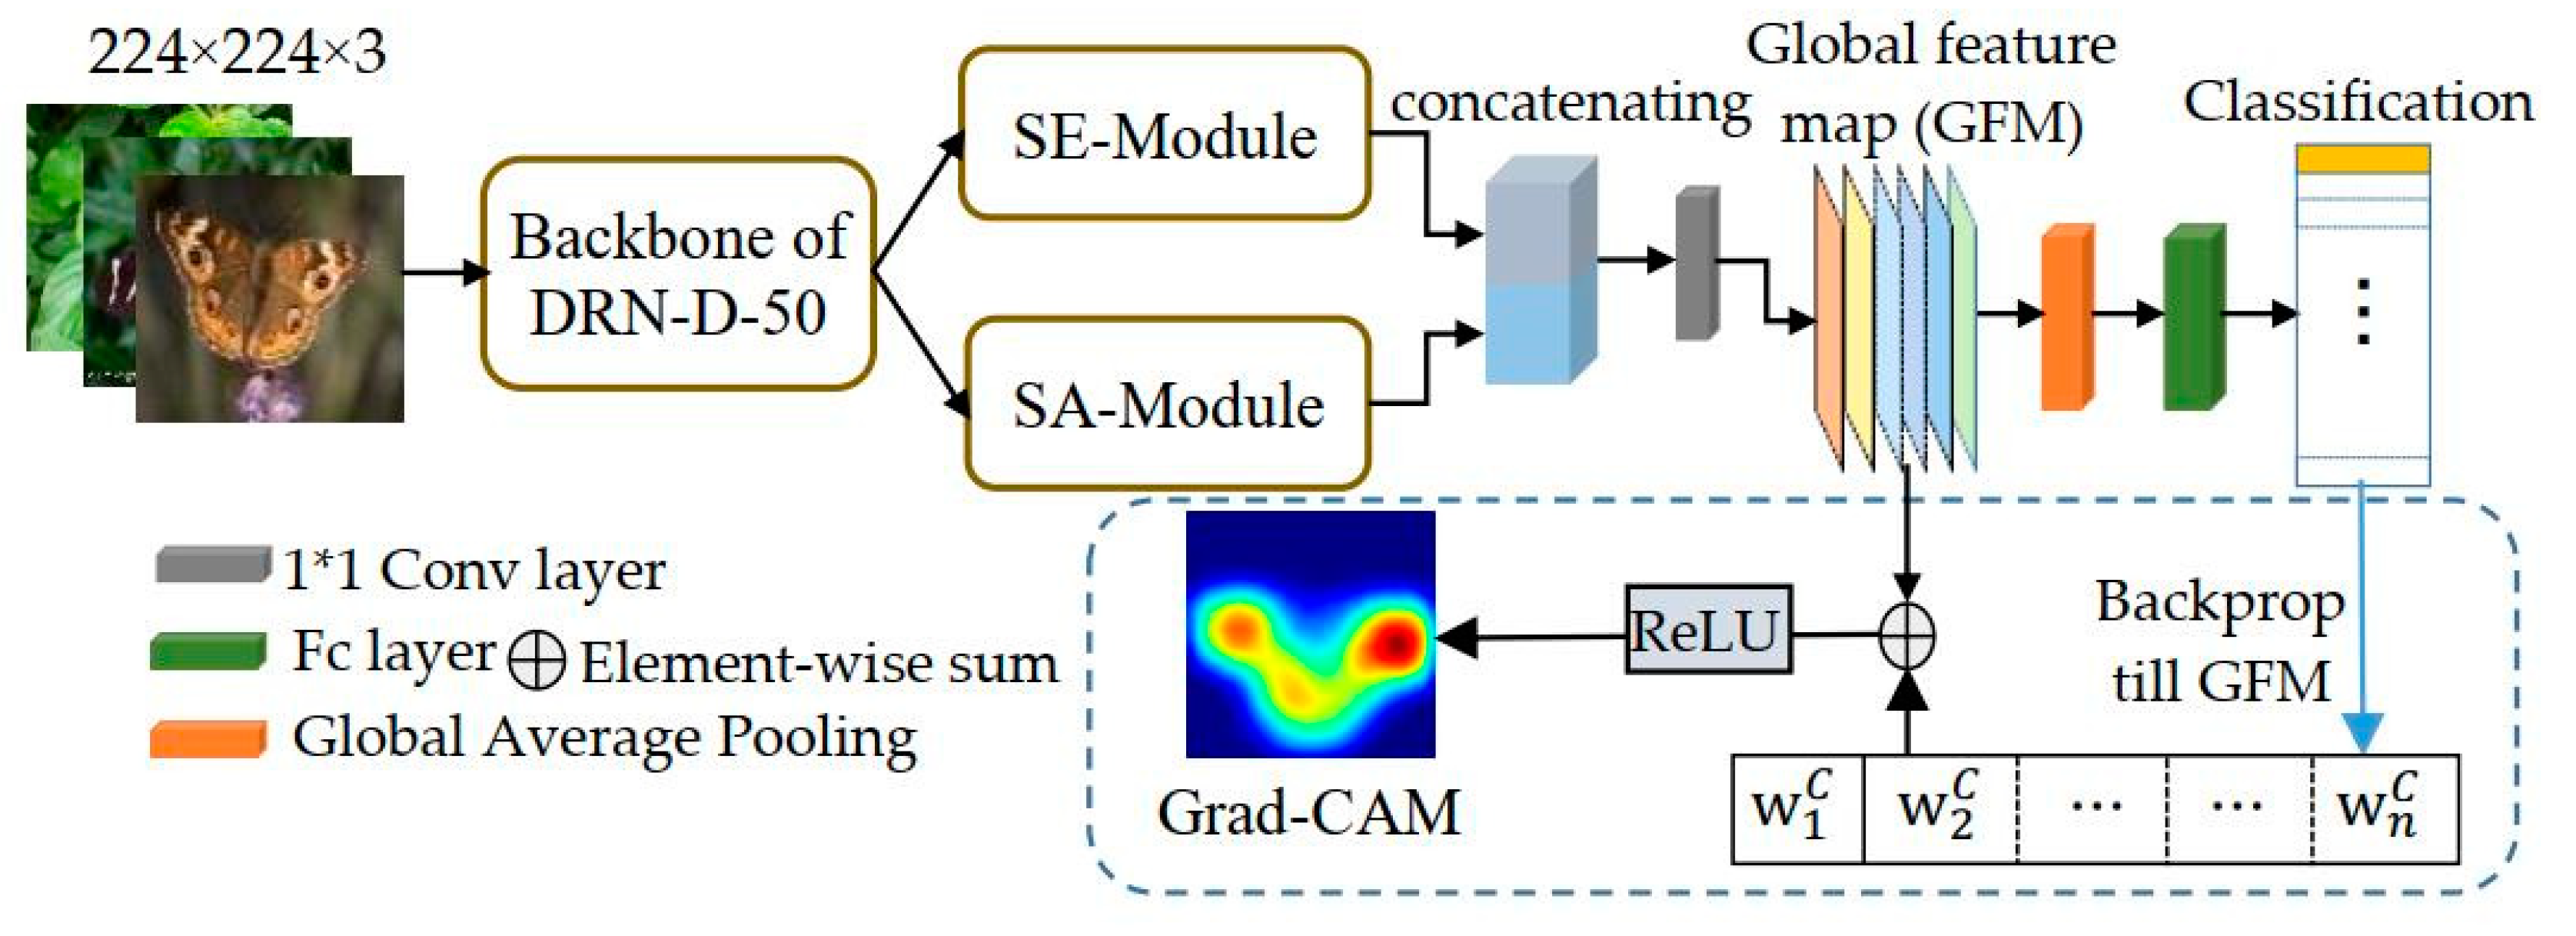
2.4. Overall SESADRN Architecture

The dilated residual network (DRN) [33] has a good classification performance. In this paper, we used DRN-D-54 as the backbone to build a classification network with the squeeze-and-excitation (SE) and spatial attention (SA) modules, named as SESADRN. The overall SESADRN architecture is shown in Figure 5. The size of the original image is adjusted to 224 × 224 × 3 as the input image of the model. The outputs (feature maps with a size of C × H × W) of SE and SA modules are concatenated to feed into a 1 × 1 convolution layer to obtain a global feature map AC×H×W. Finally, the global average pooling and fully connected layers are used to implement the butterfly classification.
Gradient-weighted Class Activation Mapping (Grad-CAM) [34] can provide visual explanations for classification decision. For the global feature map AC × H × W, and the gradient ys of the predicted score of the target category s, the weight w t s of the target category s corresponding to the t-th feature map At (t ∈ [1, C]) can be calculated by Equation (7). After performing the ReLU operation on the weighted combination of the feature map, a Grad-CAM heatmap is obtained:
L G r a n d C A M s = R e L U ( t w t s × A t ) , w t s = 1 H × W i H j W y s A i j t

3. Experiments and Results

This section aims at the evaluation and analysis of our proposed model (SESADRN, used DRN54 pre-trained model) and other state-of-art models for butterfly classification. These comparison models are squeeze-and-excitation model based Resnet architecture (SE-Resnet50 [30]), Residual attention network (RAN56 [35], RAN92 [35]), and dual-attention dilated residual network (DADRN [32], used DRN54 pre-trained model). All models were pre-trained by the use of ImageNet. All experiments were performed on the Pytorch platform. The models were trained with 300 training epochs and the batch size was set to 16. The parameters were optimized by the use of the Adam optimizer. The initial learning rate was set to 0.0001, and the attenuation after every 50 cycles was 0.1. To avoid the problem of overfitting, we used a weight decay (weight decay = 1 × 10⁻⁴) and online data augmentation strategy in training. Four online data augmentation methods were used in the paper (random mirroring, random rotation, adding Gaussian noise (0, 0.01), and resizing image size). The models were trained on a computer with 32 GB of memory and two NVIDIA GeForce GTX 980Ti. Since the number of each category is different, accuracy, weighted prediction, weighted recall, and weighted f1-scores were used as evaluation metric. All models employed the same parameters and configurations. In addition, Gradient-weighted Class Activation Mapping (Grad-CAM) [25] is used to visualize the classification results.

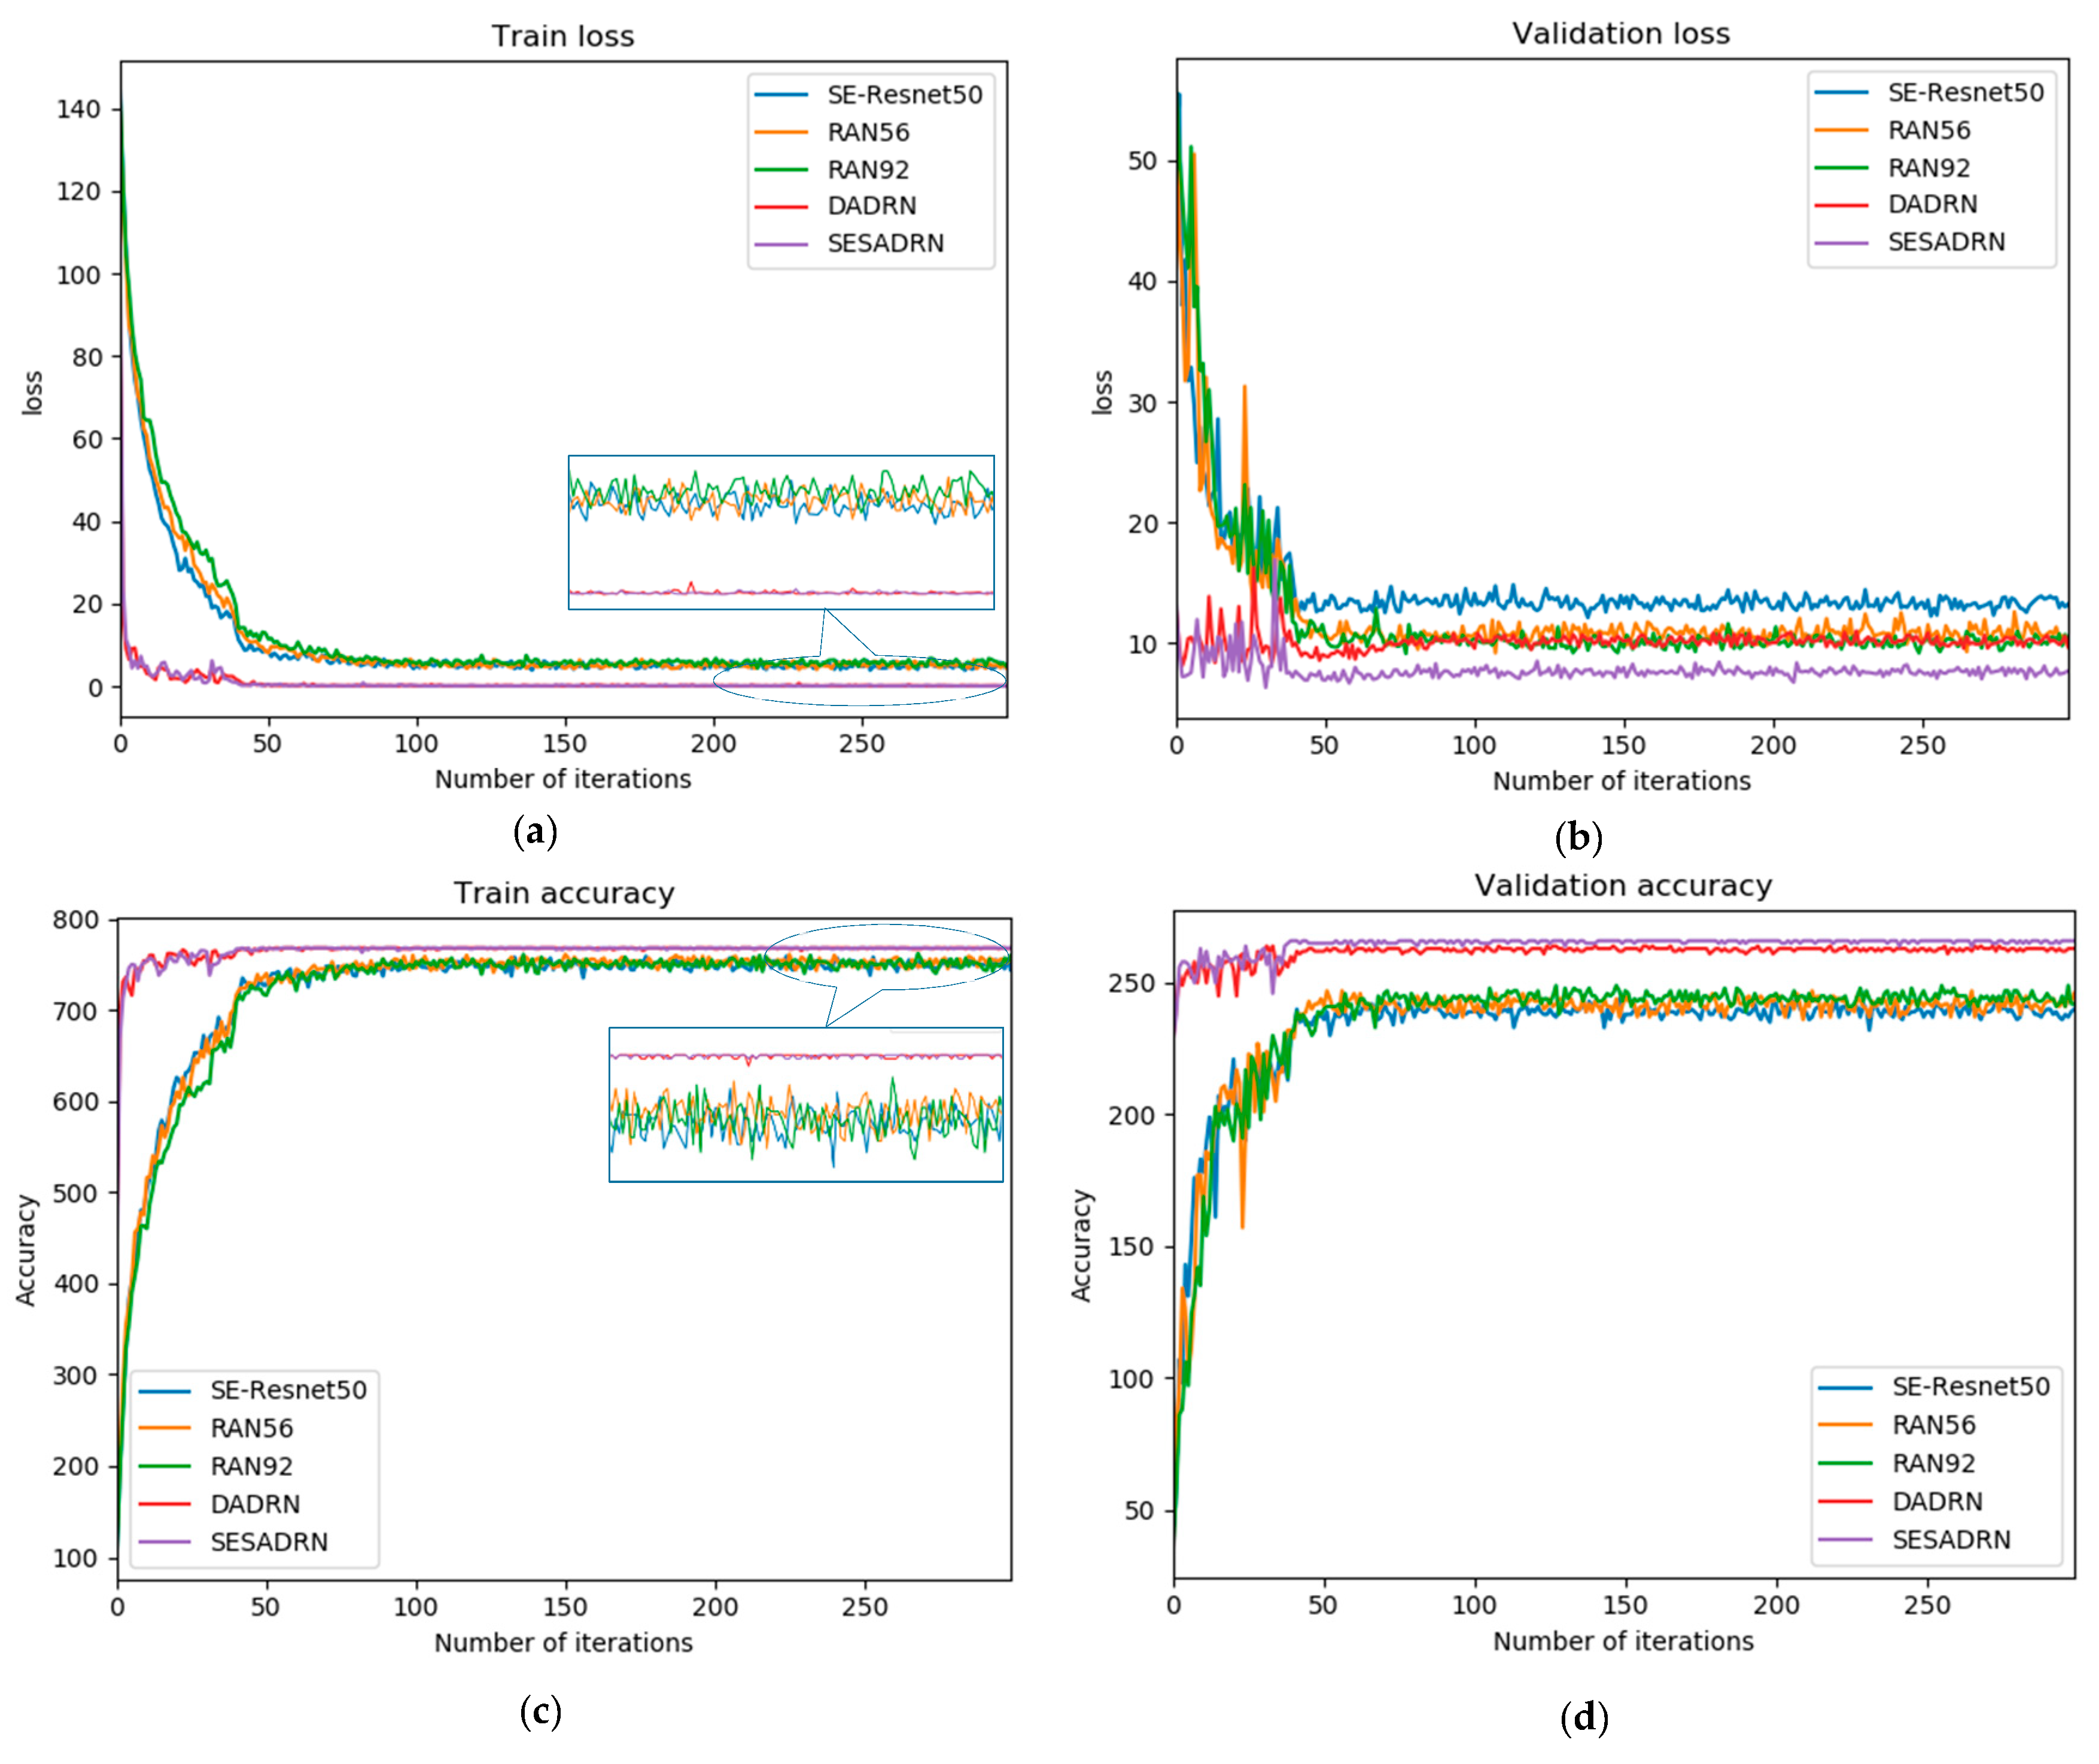
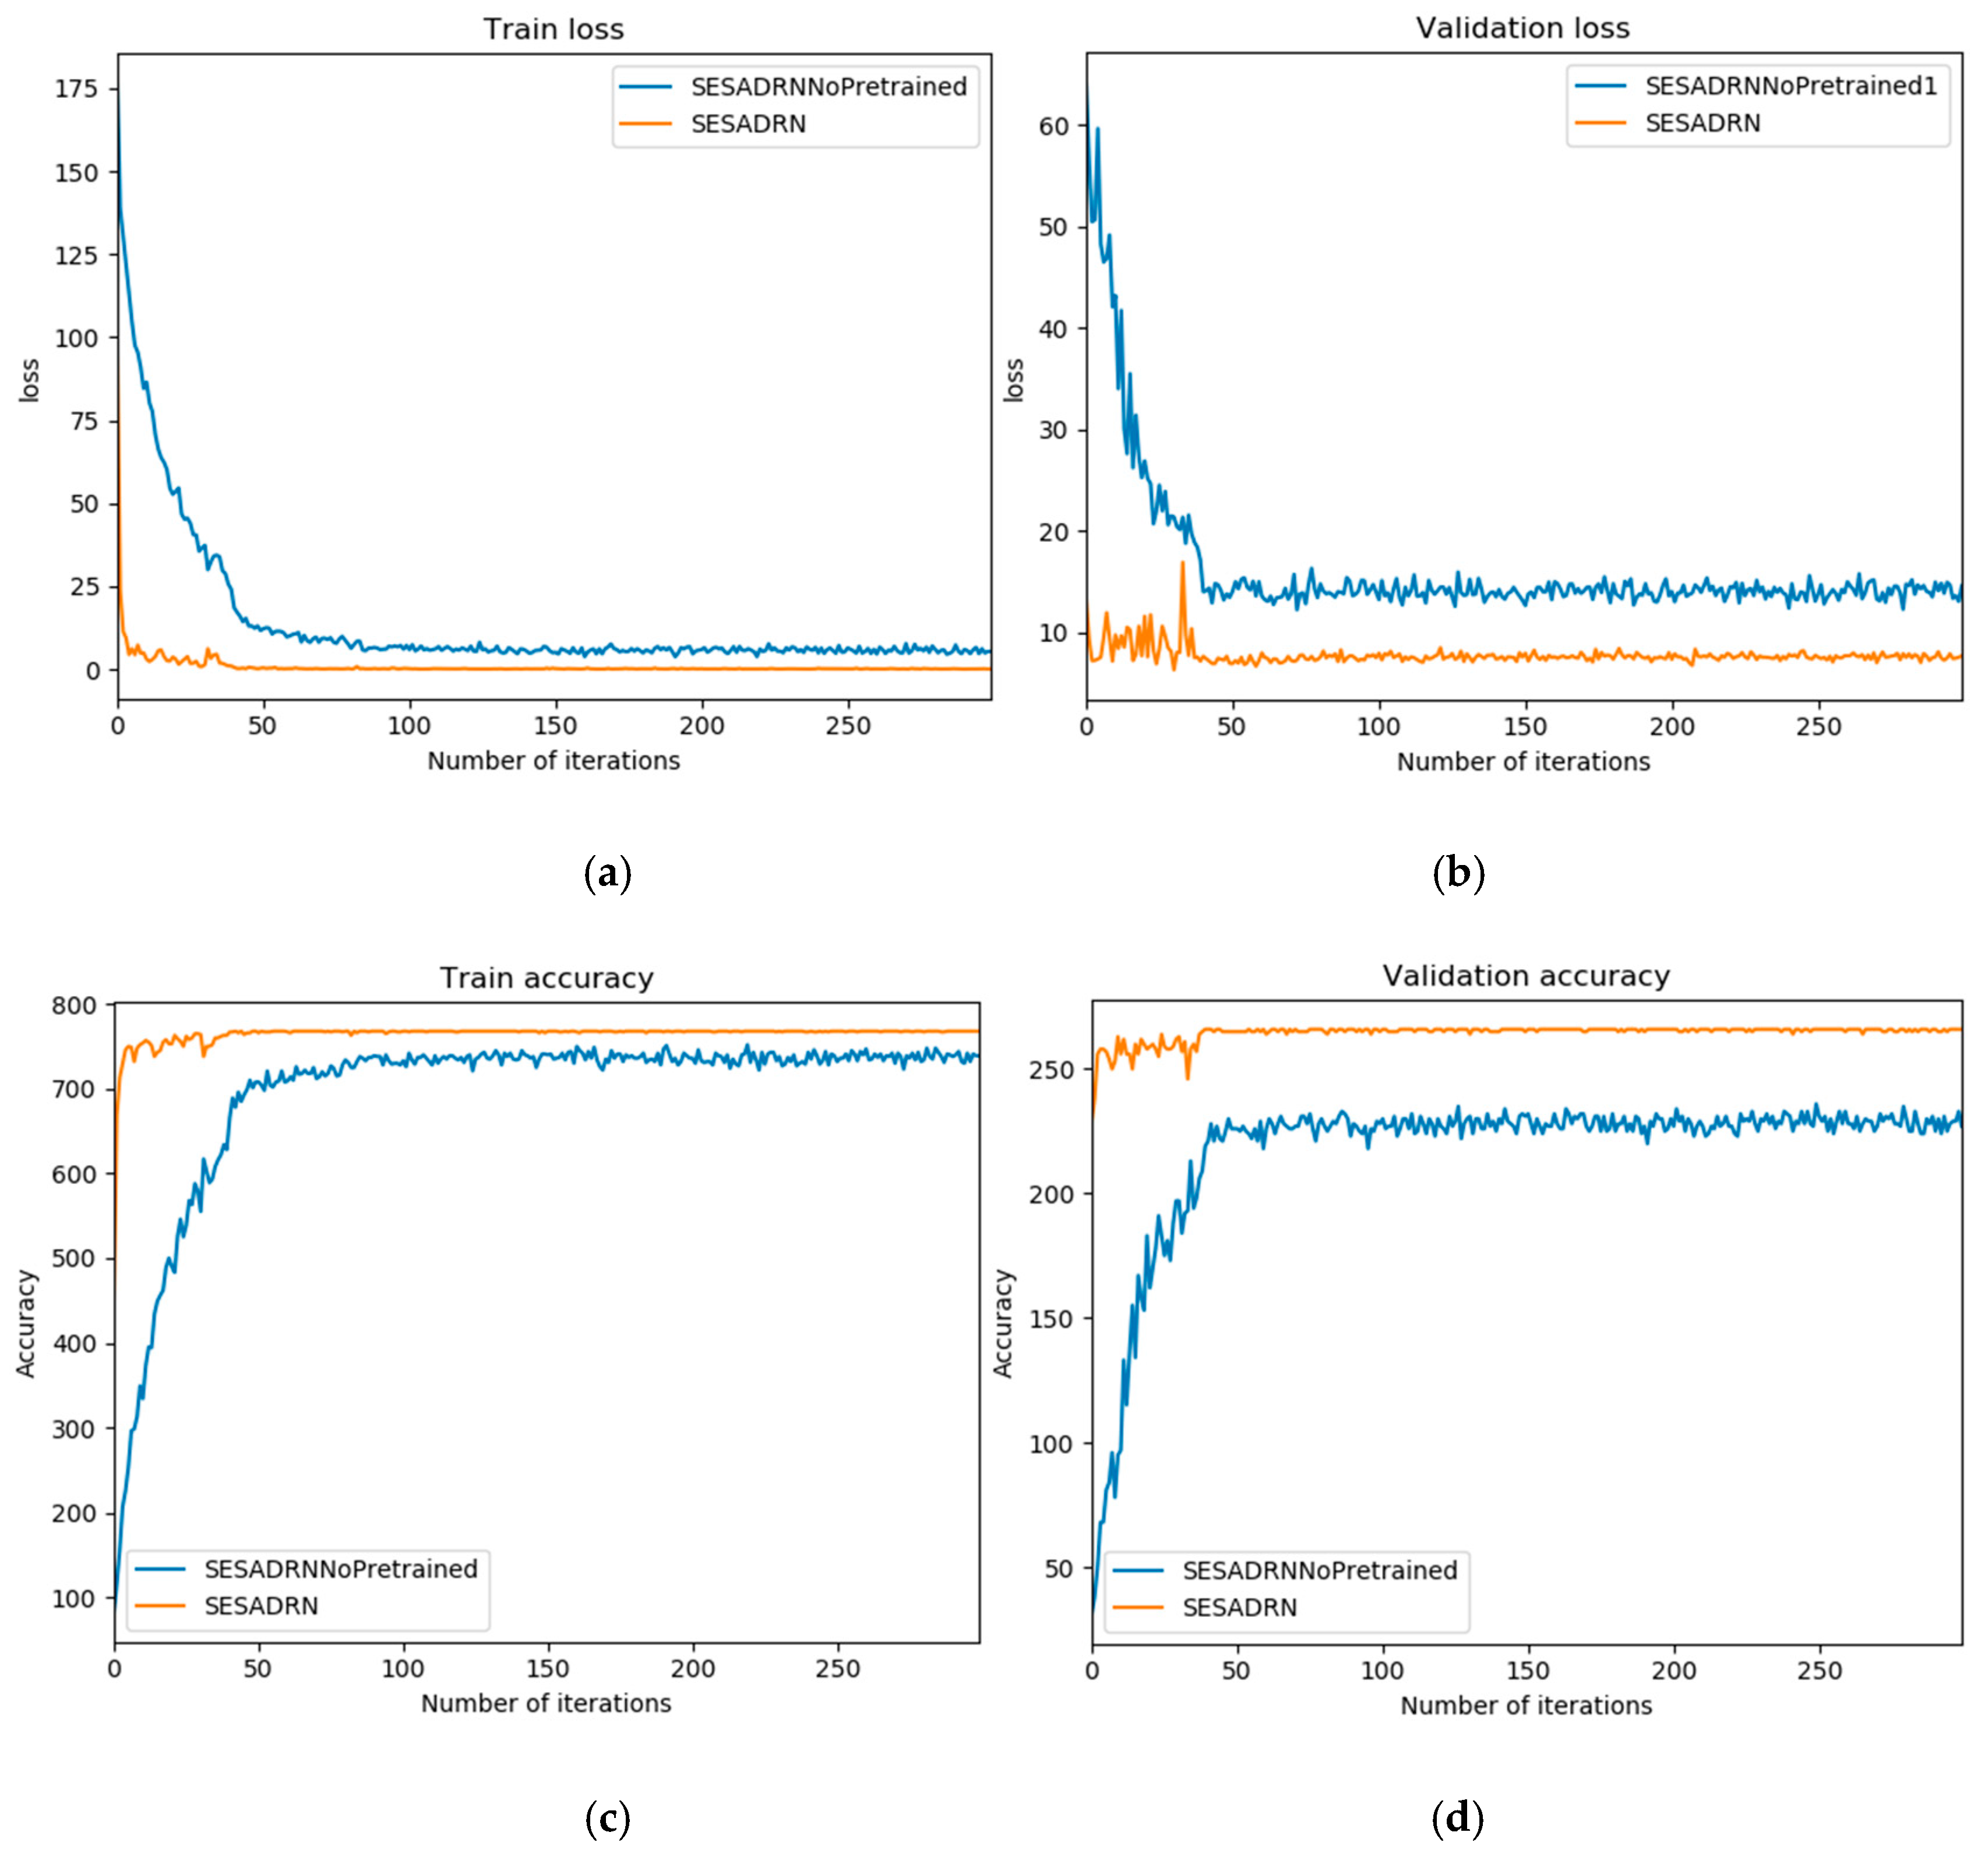
3.1. Performance Comparison with Other Methods

We compared the performance of different models and the results are shown in Figure 6, Table 2 and Table 3. Figure 6 shows the accuracy and loss of training and validation for each epoch. As shown in Figure 6a,c, it can be seen that the training results of DADRN and SESADRN are similar and they are significantly better than those of SE-Resnet50, RAN56, and RAN92. The loss and accuracy of the DADRN and SESADRN models tend to stabilize more quickly, that is, they converge faster. For validation, it can be seen more clearly from the validation loss and accuracy figures that the SESADRN model has lower loss and higher accuracy.
Table 2 lists the results of model accuracy, weighted precision, weighted recall, and weighted F1-scores on the test set. As shown in Table 2, the proposed method is the best of the five models for all four evaluation metrics. The accuracy, weighted precision, weighted recall, and weighted F1-scores of the proposed method are 0.956, 0.954, 0.948, and 0.960, respectively. We can also see that the DADRN model achieved better results than those of the other three models (SE-Resnet50, RAN56, RAN92). This is consistent with the results in Figure 6.
The comparison of the class-wise classification accuracy of the models is shown in Table 3. For the test samples of 30 categories, the classification accuracy of the SE-Resnet50 model is the lowest, and only 10 categories are completely correctly classified. The proposed SESADRN model has the highest classification accuracy, and 23 out of 30 categories are completely correctly classified. For the SESADRN model, the classification accuracy of only one of the 30 categories is lower than that of the DADRN model. There are 4 test samples in this category. The accuracy of the SESADRN model is 0.5, while the accuracy of the DADRN model is 0.75.
Next, we compare the proposed method (SESADRN) with the method without a pre-trained model (SESADRNNoPretrained). The comparison results are shown in Figure 7. The results demonstrated that the use of pre-trained models can significantly improve the accuracy of recognition.

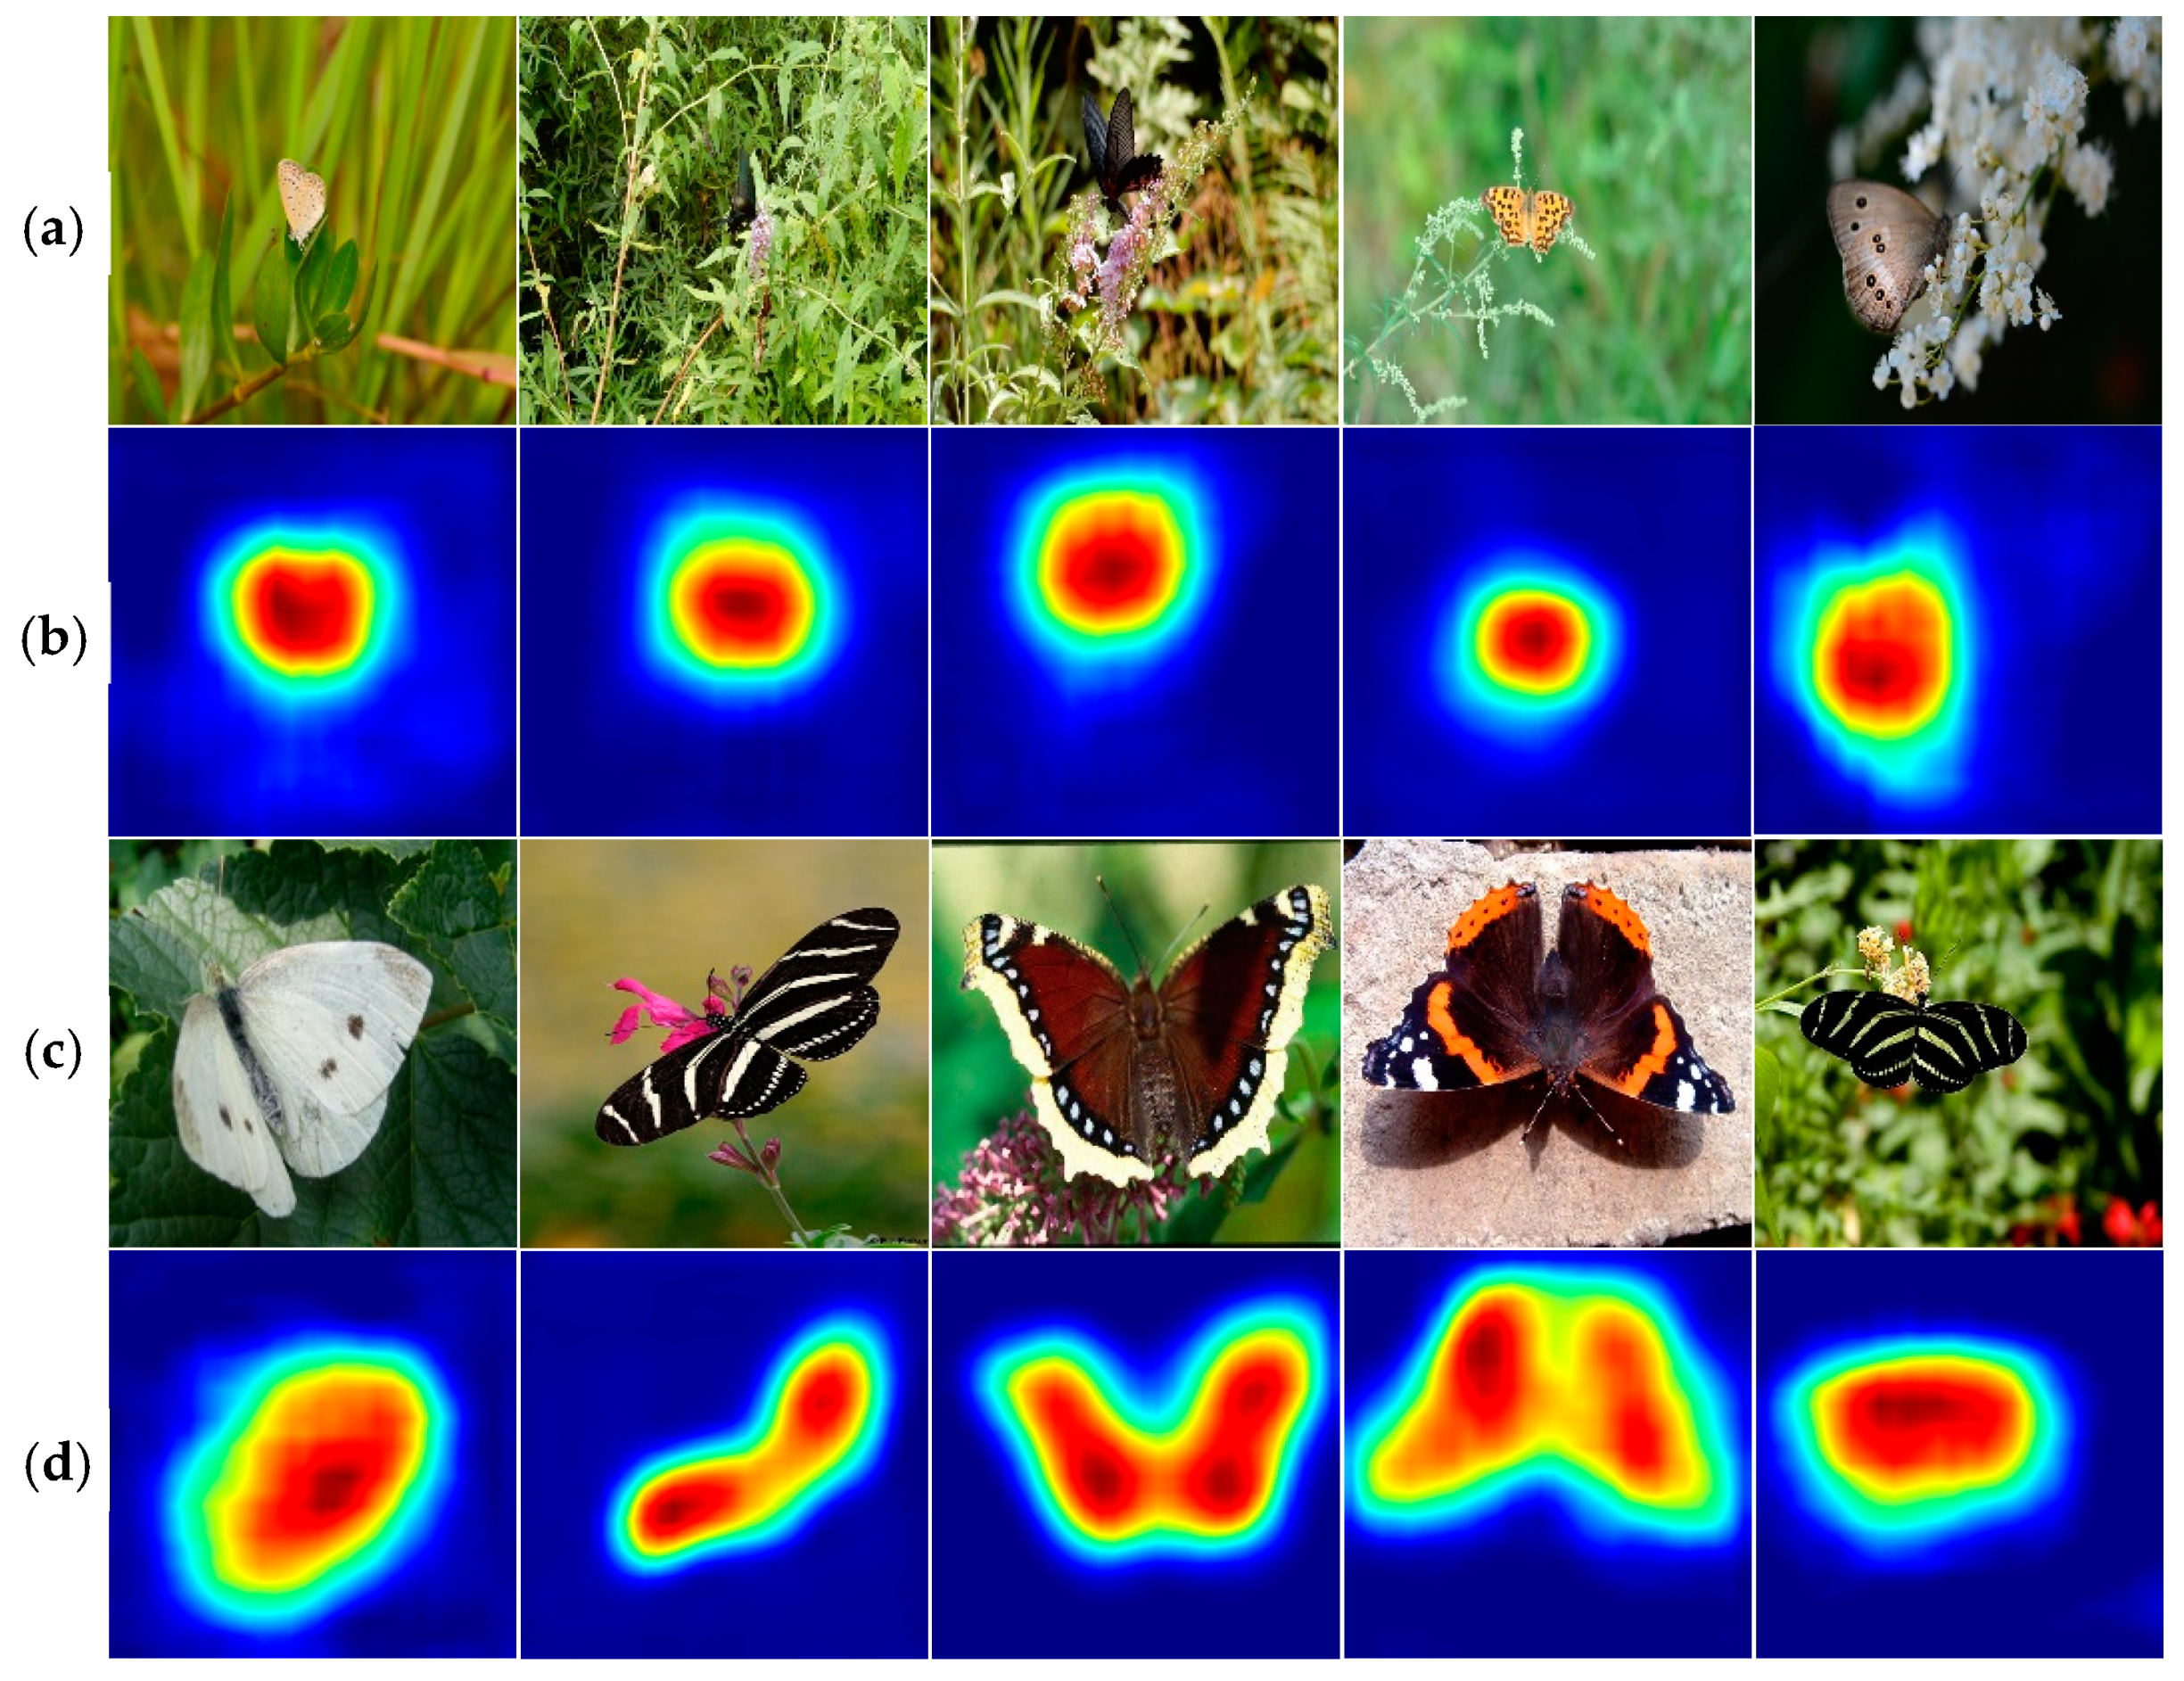
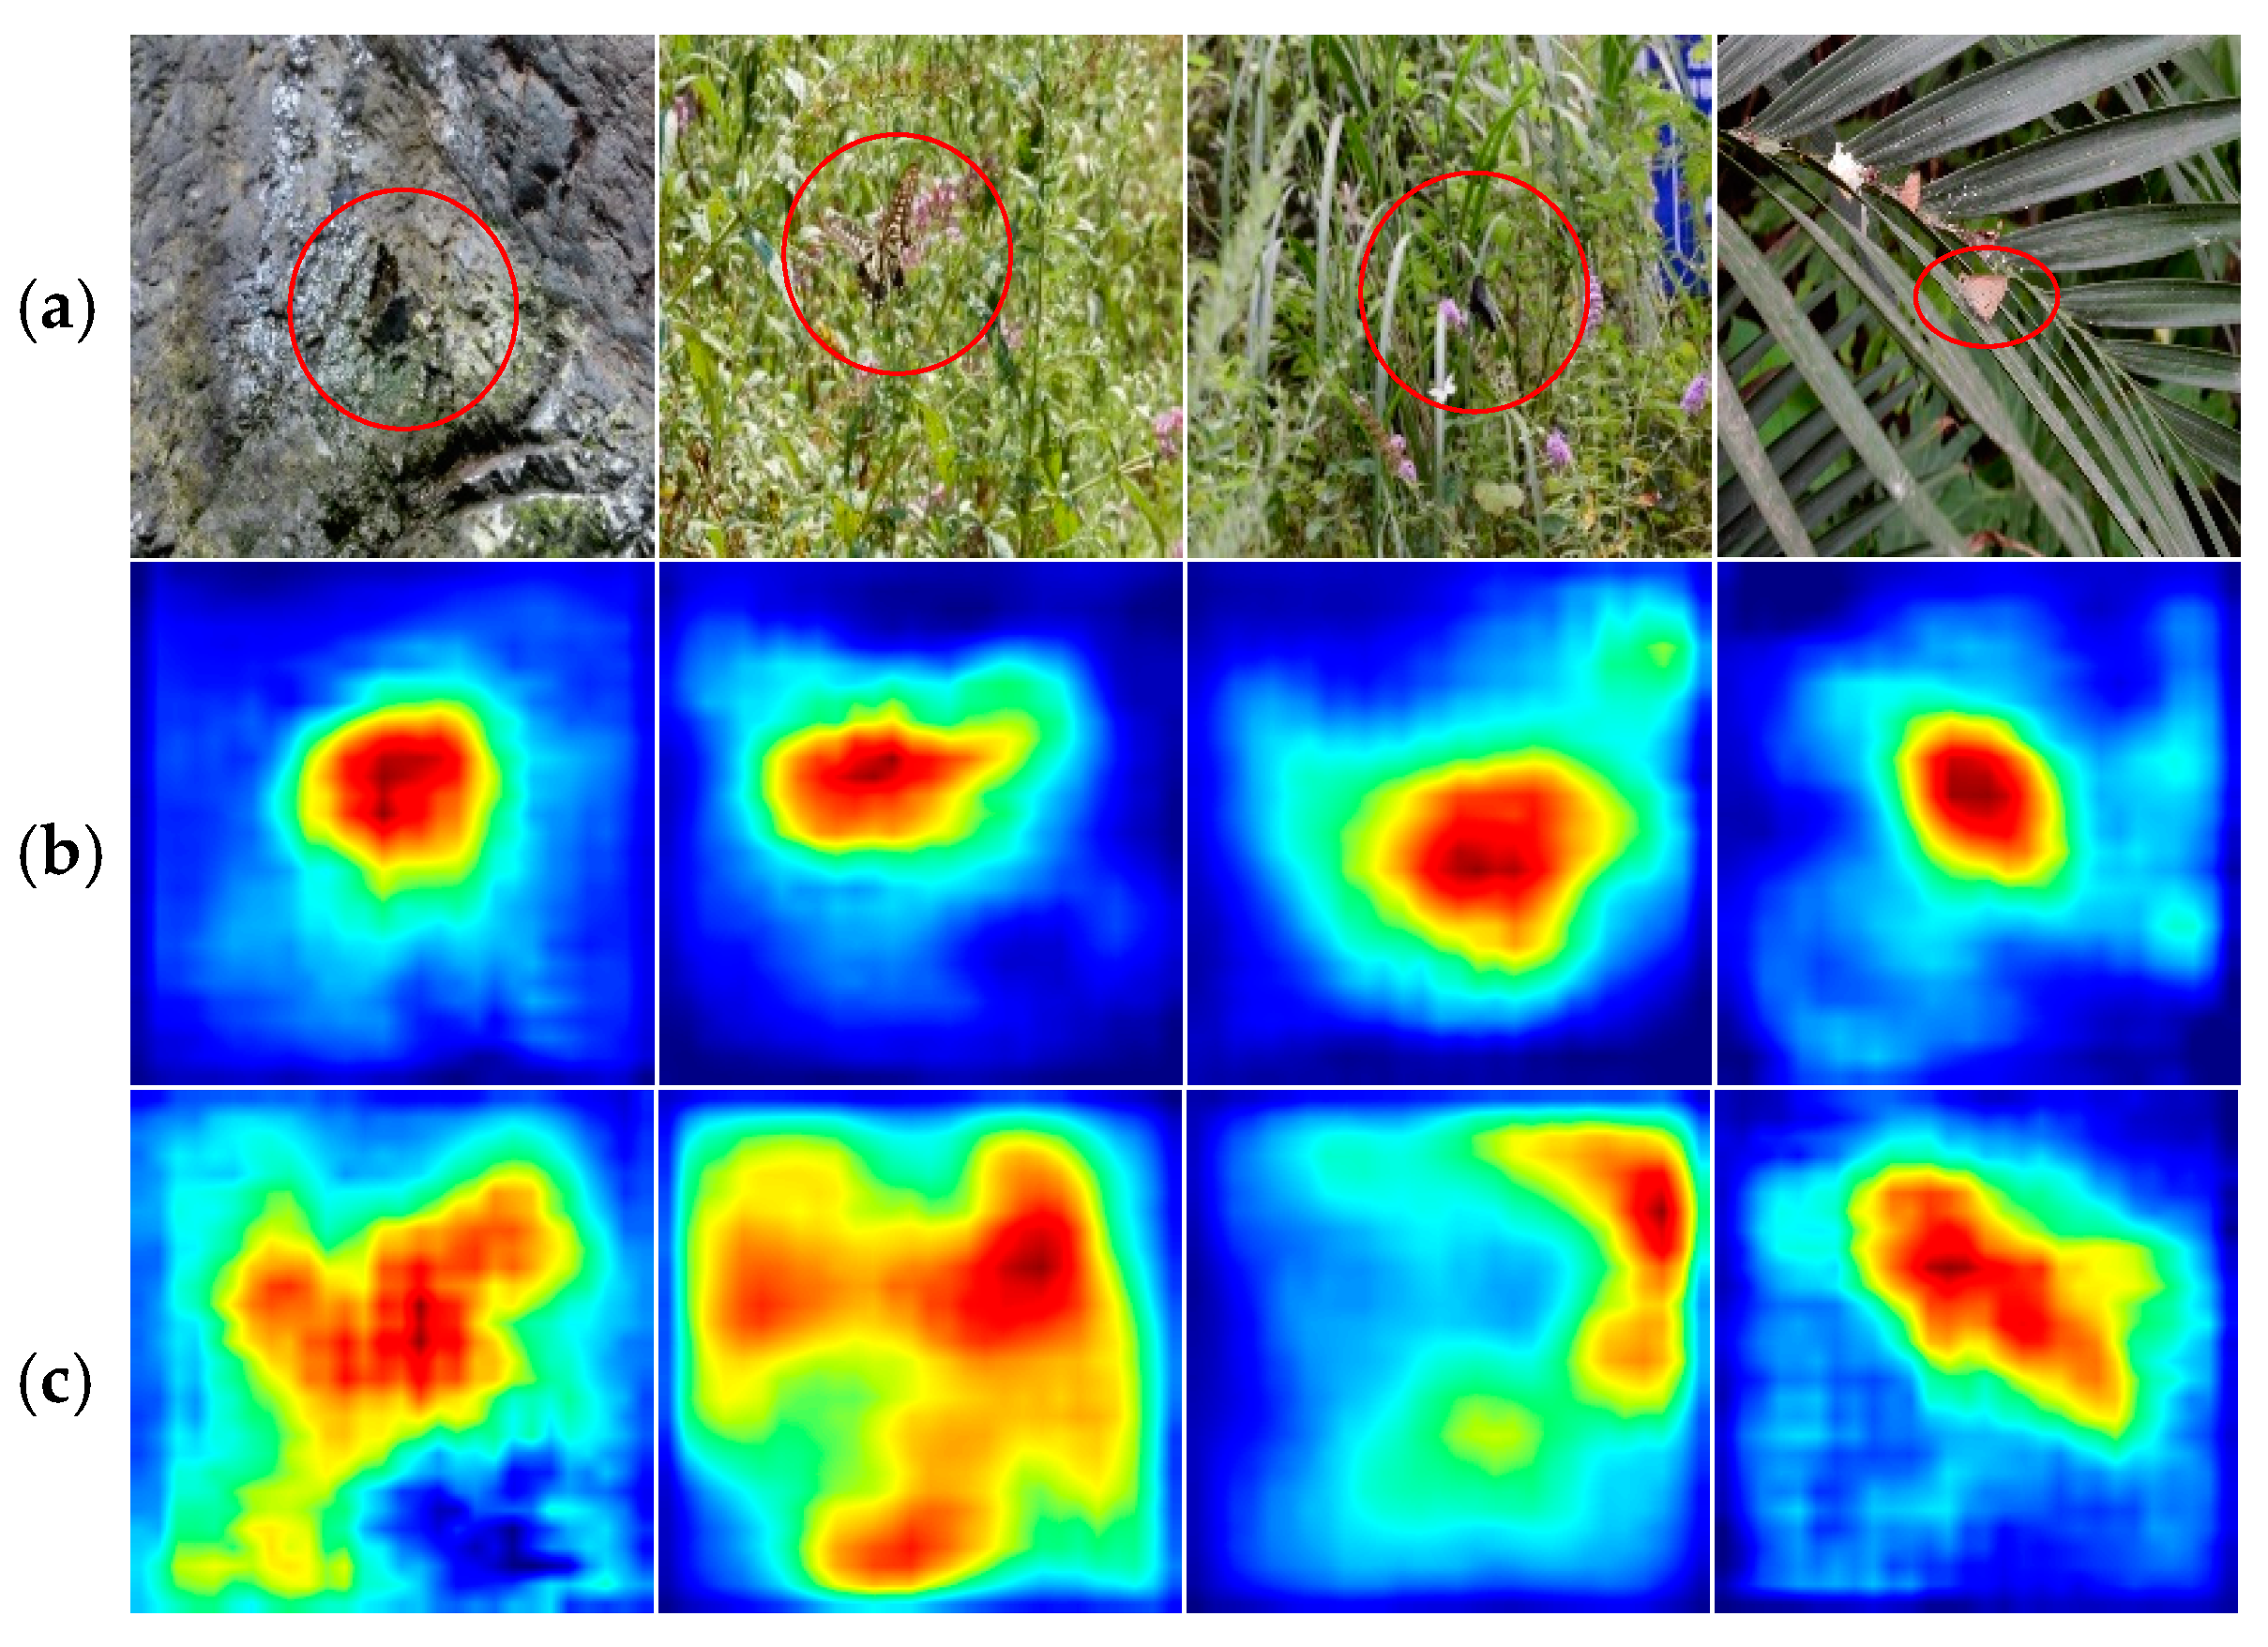
3.2. Classification Analysis Based on Grad-CAM

Class activation mapping (CAM) can give a good visual explanation for classification results, and can achieve weak supervised positioning of the target object (the butterfly in this study) [25,36]. For different network models, even if all of them make the identical prediction, Grad-CAM can tell us which network is a “stronger” classification network. We used Grad-CAM to provide visual explanations of the classification performance for our proposed SESADRN. The butterfly images of the China butterfly dataset and their Grad-CAMs are shown in Figure 8a,b, respectively. The butterfly images of Leeds Butterfly Dataset and their Grad-CAMs are shown in Figure 8c,d, respectively. By visualizing a specific prediction area of the image with Grad-CAM, we can see that the SESADRN classification model locates the butterfly area well in the image.
We compared the Grad-CAMs of the proposed SESADRN with those of DADRN [32], which achieved the second best performance as shown in Table 2 and Table 3. The original sample images are shown in Figure 9a. Their Grad-CAMs obtained by SESADRN and DADRN are shown in Figure 9b,c, respectively. For the SESADRN model and the DADRN model, the heatmaps shown in Figure 9b,c, respectively. As well as the results shown in Figure 8, the proposed SESADRN can localize the target object (butterfly) well and enhance the and enhance the meaningful features (Figure 9b), while DADRN could not localize the target object (butterfly) well (Figure 9c). The visualization of the Grad-CAMs provided us a visual explanation why the proposed SESADRN is superior than DADRN.

4. Conclusions and Future Work

In this work, we proposed a SESADRN model for fine-grained butterfly classification in ecological images. In the SESADRN model, the SA module can make better use of the long-range dependencies in the images, while the SE module takes advantage of global information to enhance useful information features and suppress less useful features. The results show that the SESADRN model has better classification performance on a given butterfly dataset than other state-of-the-art models.
However, there are still some issues in our research, such as: (1) the number of butterfly images in most categories is small, and (2) some categories are basically multiple images of the same butterfly taken from different angles. Some butterflies have only one image, and the background of this image is completely different from the background of other images. These factors can cause target detection errors. Therefore, the following ideas can further improve the performance of the proposed method:
(1)
Augment the butterfly database by collecting more butterfly photos.
(2)
Try to use more appropriate models to classify butterflies, such as introducing a few-shot learning algorithm into the model. We are also going to apply the proposed method to other applications.

Author Contributions

Conceptualization, D.X. and Y.-W.C.; methodology, D.X. and Y.-W.C.; software, D.X.; validation, D.X.; investigation, J.L.; data curation, J.L.; writing—original draft preparation, D.X.; writing—review and editing, D.X., Y.-W.C. and J.L.; supervision, Y.-W.C.; project administration, X.X.; funding acquisition, J.L. All authors have read and agreed to the published version of the manuscript.

Funding

This research was funded by the National Natural Science Foundation of China (No. 31570627).

Acknowledgments

Thanks to the research support of the Intelligent Image Processing Laboratory of Ritsumeikan University, Japan and the funding from China scholarship council.

Conflicts of Interest

The authors declare no conflict of interest.

References

  1. Shou, J.; Zhou, Y.; Li, Y. Systematic Butterffly Names of the World; Shaanxi Science and Technology Press: Xi’an, China, 2006. [Google Scholar]
  2. Wang, W.; Zhang, J.; Wang, F. Attention bilinear pooling for fine-grained classification. Symmetry 2019, 11, 1033. [Google Scholar] [CrossRef] [Green Version]
  3. Andrian, R.; Maharani, D.; Muhammad, M.A.; Junaidi, A. Butterfly identification using gray level co-occurrence matrix (glcm) extraction feature and k-nearest neighbor (knn) classification. Regist. J. Ilm. Teknol. Sist. Inf. 2019, 6, 11–21. [Google Scholar] [CrossRef]
  4. Li, F.; Xiong, Y. Automatic identification of butterfly species based on HoMSC and GLCMoIB. Vis. Comput. 2018, 34, 1525–1533. [Google Scholar] [CrossRef]
  5. Xue, A.; Li, F.; Xiong, Y. Automatic identification of butterfly species based on gray-level co-occurrence matrix features of image block. J. Shanghai Jiaotong Univ. 2019, 24, 220–225. [Google Scholar] [CrossRef]
  6. Kartika, D.S.Y.; Herumurti, D.; Yuniarti, A. Local binary pattern method and feature shape extraction for detecting butterfly image. Int. J. 2018, 15, 127–133. [Google Scholar] [CrossRef]
  7. Kartika, D.S.Y.; Herumurti, D.; Yuniarti, A. Butterfly image classification using color quantization method on hsv color space and local binary pattern. IPTEK J. Proc. Ser. 2018, 78–82. [Google Scholar] [CrossRef] [Green Version]
  8. Kaya, Y.; Kayci, L.; Uyar, M. Automatic identification of butterfly species based on local binary patterns and artificial neural network. Appl. Soft Comput. 2015, 28, 132–137. [Google Scholar] [CrossRef]
  9. Alhady, S.S.N.; Kai, X.Y. Butterfly Species Recognition Using Artificial Neural Network. In Proceedings of the Intelligent Manufacturing & Mechatronics; Hassan, M.H.A., Ed.; Springer: Singapore, 2018; pp. 449–457. [Google Scholar]
  10. Clément, M.; Kurtz, C.; Wendling, L. Learning spatial relations and shapes for structural object description and scene recognition. Pattern Recognit. 2018, 84, 197–210. [Google Scholar] [CrossRef]
  11. Li, C.; Zhang, D.; Du, S.; Zhu, Z.; Jia, S.; Qu, Y. A butterfly detection algorithm based on transfer learning and deformable convolution deep learning. Acta Autom. Sin. 2019, 45, 1772–1782. [Google Scholar]
  12. Zhou, A.; Ma, P.; Xi, T.; Wang, J.; Feng, J.; Shao, Z.; Tao, Y.; Yao, Q. Automatic identification of butterfly specimen images at the family level based on deep learning method. Acta Entomol. Sin. 2017, 60, 1339–1348. [Google Scholar]
  13. Arzar, N.N.K.; Sabri, N.; Johari, N.F.M.; Shari, A.A.; Noordin, M.R.M.; Ibrahim, S. Butterfly species identification using Convolutional Neural Network (CNN). In Proceedings of the 2019 IEEE International Conference on Automatic Control and Intelligent Systems (I2CACIS), Shah Alam, Malaysia, 29 June 2019; IEEE: Piscataway, NJ, USA, 2019; pp. 221–224. [Google Scholar]
  14. Lin, Z.; Jia, J.; Gao, W.; Huang, F. Fine-grained visual categorization of butterfly specimens at sub-species level via a convolutional neural network with skip-connections. Neurocomputing 2019, 384, 295–313. [Google Scholar] [CrossRef]
  15. López-Antequera, M.; Vallina, M.L.; Strisciuglio, N.; Petkov, N. Place and Object Recognition by CNN-based COSFIRE filters. IEEE Access 2019, 7, 66157–66166. [Google Scholar] [CrossRef]
  16. Almryad, A.S.; Kutucu, H. Automatic identification for field butterflies by convolutional neural networks. Eng. Sci. Technol. Int. J. 2020, 23, 189–195. [Google Scholar] [CrossRef]
  17. Nie, L.; Wang, K.; Fan, X.; Gao, Y. Fine-grained butterfly recognition with deep residual networks: A new baseline and benchmark. In Proceedings of the 2017 International Conference on Digital Image Computing: Techniques and Applications (DICTA), Sydney, Australia, 29 November–1 December 2017; IEEE: Piscataway, NJ, USA, 2017; pp. 1–7. [Google Scholar]
  18. Carvajal, J.A.; Romero, D.G.; Sappa, A.D. Fine-tuning based deep convolutional networks for lepidopterous genus recognition. In Proceedings of the Iberoamerican Congress on Pattern Recognition, Lima, Peru, 8–11 November 2016; Springer: Berlin/Heiderbeg, Germany, 2016; pp. 467–475. [Google Scholar]
  19. Chang, Q.; Qu, H.; Wu, P.; Yi, J. Fine-Grained Butterfly and Moth Classification Using Deep Convolutional Neural Networks. Available online: https://pdfs.semanticscholar.org/4cf2/045b811c9e0807f9c94fc991566a6f5adbf4.pdf (accessed on 28 February 2020).
  20. Rodner, E.; Simon, M.; Brehm, G.; Pietsch, S.; Wägele, J.W.; Denzler, J. Fine-grained recognition datasets for biodiversity analysis. arXiv 2015, arXiv:1507.00913. [Google Scholar]
  21. Zhu, L.Q.; Ma, M.Y.; Zhang, Z.; Zhang, P.Y.; Wu, W.; Wang, D.D.; Zhang, D.X.; Wang, X.; Wang, H.Y. Hybrid deep learning for automated lepidopteran insect image classification. Orient. Insects 2017, 51, 79–91. [Google Scholar] [CrossRef]
  22. Xie, J.; Hou, Q.; Shi, Y.; Lv, P.; Jing, L.; Zhuang, F.; Zhang, J.; Tan, X.; Xu, S. The automatic identification of butterfly species. J. Comput. Res. Dev. 2018, 55, 1609–1618. [Google Scholar]
  23. Zhao, R.; Li, C.; Ye, S.; Fang, X. Butterfly recognition based on faster R-CNN. In Journal of Physics: Conference Series; IOP Publishing: Bristol, UK, 2019; Volume 1176, p. 32048. [Google Scholar]
  24. Wang, J.; Markert, K.; Everingham, M. Learning models for object recognition from natural language descriptions. In Proceedings of the British Machine Vision Conference, London, UK, 7–10 September 2009. [Google Scholar]
  25. Hu, J.; Shen, L.; Sun, G. Squeeze-and-excitation networks. In Proceedings of the IEEE Conference on Computer Vision and Pattern Recognition, Salt Lake City, UT, USA, 18–22 June 2018; pp. 7132–7141. [Google Scholar]
  26. Park, Y.J.; Tuxworth, G.; Zhou, J. Insect classification using squeeze-and-excitation and attention modules-a benchmark study. In Proceedings of the 2019 IEEE International Conference on Image Processing (ICIP), Taipei, Taiwan, 22–29 September 2019; IEEE: Piscataway, NJ, USA, 2019; pp. 3437–3441. [Google Scholar]
  27. Kitada, S.; Iyatomi, H. Skin lesion classification with ensemble of squeeze-and-excitation networks and semi-supervised learning. arXiv 2018, arXiv:1809.02568. [Google Scholar]
  28. Cao, Y.; Xu, J.; Lin, S.; Wei, F.; Hu, H. GCNet: Non-local networks meet squeeze-excitation networks and beyond. arXiv 2019, arXiv:1904.11492. [Google Scholar]
  29. Gong, L.; Jiang, S.; Yang, Z.; Zhang, G.; Wang, L. Automated pulmonary nodule detection in CT images using 3D deep squeeze-and-excitation networks. Int. J. Comput. Assist. Radiol. Surg. 2019, 14, 1969–1979. [Google Scholar] [CrossRef] [PubMed]
  30. Hu, J.; Shen, L.; Albanie, S.; Sun, G.; Wu, E. Squeeze-and-Excitation Networks. In Proceedings of the IEEE Conference on Computer Vision and Pattern Recognition, Long Beach, CA, USA, 16–20 June 2019. [Google Scholar]
  31. Peng, C.; Zhang, X.; Yu, G.; Luo, G.; Sun, J. Large kernel matters—Improve semantic segmentation by global convolutional network. In Proceedings of the IEEE Conference on Computer Vision and Pattern Recognition, Honolulu, HI, USA, 21–26 July 2017; pp. 4353–4361. [Google Scholar]
  32. Chen, X.; Lin, L.; Liang, D.; Hu, H.; Zhang, Q.; Iwamoto, Y.; Han, X.-H.; Chen, Y.-W.; Tong, R.; Wu, J. A dual-attention dilated residual network for liver lesion classification and localization on CT images. In Proceedings of the 2019 IEEE International Conference on Image Processing (ICIP), Taipei, Taiwan, 22–25 September 2019; IEEE: Piscataway, NJ, USA, 2019; pp. 235–239. [Google Scholar]
  33. Yu, F.; Koltun, V.; Funkhouser, T. Dilated residual networks. In Proceedings of the IEEE Conference on Computer Vision and Pattern Recognition, Honolulu, HI, USA, 21–26 July 2017; pp. 472–480. [Google Scholar]
  34. Selvaraju, R.R.; Cogswell, M.; Das, A.; Vedantam, R.; Parikh, D.; Batra, D. Grad-CAM: Visual explanations from deep networks via gradient-based localization. In Proceedings of the IEEE International Conference on Computer Vision, Cardiff, UK, 9–12 September 2019. [Google Scholar]
  35. Wang, F.; Jiang, M.; Qian, C.; Yang, S.; Li, C.; Zhang, H.; Wang, X.; Tang, X. Residual attention network for image classification. In Proceedings of the IEEE Conference on Computer Vision and Pattern Recognition, Honolulu, HI, USA, 21–26 July 2017; pp. 3156–3164. [Google Scholar]
  36. Zhou, B.; Khosla, A.; Lapedriza, A.; Oliva, A.; Torralba, A. Learning deep features for discriminative localization. In Proceedings of the IEEE Conference on Computer Vision and Pattern Recognition, Las Vegas, NV, USA, 26 June–1 July 2016; pp. 2921–2929. [Google Scholar]
Figure 1. Sample images in the Chinese butterfly dataset.
Applsci 10 01681 g001
Figure 2. Sample images of 10 categories in the Leeds Butterfly Dataset.
Applsci 10 01681 g002aApplsci 10 01681 g002b
Figure 3. Squeeze-and-excitation module.
Applsci 10 01681 g003
Figure 4. Spatial attention module.
Applsci 10 01681 g004
Figure 5. Overall SESADRN architecture.
Applsci 10 01681 g005
Figure 6. Accuracy and loss of training and validation. (a) Training loss of 300 epochs. (b) Validation loss of 300 epochs. (c) Training accuracy of 300 epochs. (d) Validation accuracy of 300 epochs.
Applsci 10 01681 g006
Figure 7. Accuracy and loss of training and validation (SESADRNNoPretrained, SESADRN). (a) Training loss of 300 epochs. (b) Validation loss of 300 epochs. (c) Training accuracy of 300 epochs. (d) Validation accuracy of 300 epochs.
Applsci 10 01681 g007
Figure 8. Visualization of the proposed SESADRN’s Gradient-weighted Class Activation Mapping (Grad-CAM). Butterfly sample images of China butterfly dataset (a) and their Grad-CAM (b); butterfly sample images of Leeds Butterfly Dataset (c) and their Grad-CAM (d).
Applsci 10 01681 g008
Figure 9. (a) Butterfly sample images, (b) Grad-CAM obtained by the proposed SESADRN model, (c) Grad-CAM obtained by the existing state-of-the-art model (DADRN) [32].
Applsci 10 01681 g009
Table 1. The scientific names of butterfly species and distribution of dataset.
DatasetsSpeciesQuantityTrain DatasetVal DatasetTest Dataset
China Butterfly DatasetSpeyeria aglaja61361312
Achillidesbianor Cramer4325108
Limenitis helmanni352177
Aphantopus hyperanthus352177
Elymnias hypermnestra281675
Suastus gremius261565
Celastrina oreas251555
Papilio paris231364
Papilio xuthus231364
Eurema hecabe221354
Papilio alcmenor Felder211254
Iambrix salsala201244
Polygonia c-aureum201244
Pyrgusmaculatus Bremeret Grey181053
Abisara echerius13742
Neptis themis Leech13742
Thecla betulae11632
Albulina orbitula10622
Menelaides protenor10622
Euploea midamus10622
Leeds Butterfly DatasetDanaus plexippus82491716
Heliconius charitonius93552018
Heliconius erato61361312
Junonia coenia90541818
Lycaena phlaeas88521917
Nymphalis antiopa100602020
Papilio cresphontes89531917
Pieris rapae55331111
Vanessa atalanta90541818
Vanessa cardui84501816
Total 1299768280251
Table 2. Comparison of 30-class classification performance.
ModelAccuracyWeighted Precision Weighted RecallWeighted
F1-Score
SE-Resnet50 [30]0.8730.8740.8620.886
RAN56 [35]0.8610.8590.8470.870
RAN92 [35]0.8920.8890.8730.905
DADRN [32]0.9320.9320.9240.940
SESADRN0.9560.9540.9480.960
Table 3. Comparison of class-wise classification accuracy.
SpeciesNumber of Test Samples SE-Resnet50 RAN56 RAN92DADRNSESADRN
Danaus plexippus1611111
Heliconius charitonius180.9440.94410.9441
Heliconius erato1211111
Junonia coenia180.8891111
Lycaena phlaeas170.9411111
Nymphalis antiopa200.850.90.950.950.95
Papilio cresphontes1711111
Pieris rapae110.8180.9090.81811
Vanessa atalanta180.9441111
Vanessa cardui160.9381111
Speyeria aglaja120.9170.5830.9170.9171
Achillidesbianor Cramer80.50.6250.50.6250.75
Limenitis helmanni70.5710.5710.4290.7140.714
Aphantopus hyperanthus710.7140.8570.7141
Elymnias hypermnestra50.80.80.811
Suastus gremius511111
Celastrina oreas50.80.8111
Papilio paris40.50.250.50.750.5
Papilio xuthus410.75111
Eurema hecabe40.50.50.50.50.5
Papilio alcmenor Felder40.750.750.750.750.75
Iambrix salsala410.5111
Polygonia c-aureum411111
Pyrgusmaculatus Bremeret Grey30.6670.6670.33311
Abisara echerius20.50.50.50.50.5
Neptis themis Leech200011
Thecla betulae20.50.50.511
Albulina orbitula211111
Menelaides protenor211111
Euploea midamus20.50001
Average0.8730.8610.8920.9320.956

