Abstract
In the construction of high dams, many high rock slope failures occur due to flood discharge atomized rain. Based on the steel frame lifting technique and strength reduction materials, a comprehensive method is proposed in this paper to study the stability of high bedding rock slope subjected to atomized rain. The safety factor expression of the comprehensive method and the evaluation method for deformation instability were established according to the similarity theory of geomechanical model, failure criterion, and mutation theory. Strength reduction materials were developed to simulate the strength reduction of structural planes caused by rainfall infiltration. A typical test was carried out on the high bedding rock slope in the Baihetan Hydropower Station. The results showed that the failure modes of the bedding rock slope were of two types: sliding–fracturing and fracturing–sliding. The first slip block at the exposed place of the structural plane was sliding–fracturing. Other succeeding slip blocks were mainly of the fracturing–sliding type due to the blocking effect of the first slip block. The failure sequence of the slip blocks along the structural planes was graded into multiple levels. The slip blocks along the upper structural planes were formed first. Concrete plugs had effective reinforcement to improve the shear resistance of the structural planes and inhibit rock dislocation. Finite element method (FEM) simulation was also performed to simulate the whole process of slope failure. The FEM simulation results agreed well with the test results. This research provides an improved understanding of the physical behavior and the failure modes of high bedding rock slopes subjected to atomized rain.
1. Introduction
High rock slopes are inevitable in the construction of high dams, and the problem of slope stability is a key issue for engineering safety. For high dam projects with characteristics of high water head, large flood discharge, and narrow canyon, there is a class of bedding rock slope instability problems that is induced by rainfall and flood discharge atomized rain. Here, atomized rain refers to the rain produced by the discharge of flood from high dams. Due to rainfall infiltration being the most frequent triggering factor for natural bedding rock slope failure, substantial research has been carried out to study the failure mechanisms of rainfall-induced landslides. Various relevant aspects have been investigated, such as those concerned with causes, triggering factors, and their impact priority under rainfall. This class of bedding rock slope stability problems is mainly affected by the mechanical parameter reduction of structural planes and the internal pore water pressure [1,2,3].
At present, numerical simulation and physically based tests are widely used to study slope stability [4,5,6]. Finite element method (FEM) simulation has been extensively used to study the complex problem of slope stability subject to rainfall, rising/lowering water levels, and earthquakes. For example, Gong and Wang [7] used FEM based on the shear strength reduction method to simulate and analyze the stress, displacement, friction on contact surface, and stability of bedding rock cutting slope in different excavated stages. Numerical simulation methods are not overly costly to undertake. These methods have provided improved insight into slope failure mechanisms [8,9,10,11]. However, it is difficult for these numerical methods to reliably simulate all the details of the failure mode and mechanism.
Physically based tests can provide an improved insight into the failure mode and mechanism of slopes. For example, the steel frame lifting technique was first used by Ashby [12] to study the sliding and toppling failure mechanism of jointed rock slopes. Zhou et al. [13] adopted the same method to study the global stability of the high slope in the Jinping Power Station project. Based on the centrifuge method, Avgherinos et al. [14,15,16,17] studied the failure mechanism of a slope by increasing the unit weight of the rock mass. However, in an actual project, besides an increase in the rock mass unit weight and slope sliding force, the slope failure is also affected by rainfall, reservoir water level fluctuations, etc. [1,2,3,18]. Chen and Zhang [19] proposed a physically based distributed cell model to predict regional rainfall-induced shallow slope failures in two-layer soils under realistic rainfall conditions. He and Wang [3] analyzed the seepage characteristics, mechanical characteristics, and deformation laws of a slope under the conditions of long-time heavy rain and short-time rainstorm. However, as far as the authors know, none of the existing physically based methods consider multifactor impacts that may lead to high rock slope failure. Additionally, the safety factor expression of a rock slope by a physically based test needs further study and establishment.
In this paper, based on the steel frame lifting technique and strength reduction materials, a comprehensive method is proposed to study the stability of high bedding rock slope subjected to atomized rain. Safety factor expression of the comprehensive method and the evaluation method for deformation instability were established according to the similarity theory of geomechanical model, failure criterion, and mutation theory. Using the high bedding rock slope in the Baihetan Hydropower Station, this paper presents the details of the comprehensive method as well as an analysis of the test results. Load–displacement characteristics and the macroscopic failure process were recorded during the strength reduction and uplift stage. The failure modes of high bedding rock slope subjected to atomized rain were examined. This research provides an improved understanding of the physical behavior and the failure modes of high bedding rock slopes subjected to atomized rain.
2. Comprehensive Method for High Bedding Rock Slope
In the high rock slopes of high dam projects, landslides often occur after heavy rainfall or a long period of rain. In particular, during flood discharge atomized rain, the rock slope stability is controlled by rain infiltration, atomized rain infiltration, and groundwater action. The actions of water on the rock slope mainly involve increasing the unit weight of the rock mass, reducing the mechanical parameters of the structural planes, and varying groundwater seepage.
For high bedding rock slopes, the actions of rain infiltration and groundwater seepage can be simplified to increase the sliding force and reduce the mechanical parameters of the structural planes. Therefore, in this comprehensive method, the mechanical parameter reduction of structural planes is simulated by strength reduction materials, and the increase in sliding forces is simulated by the steel frame lifting technique.
The theory of the comprehensive method includes the overloading method and the strength reduction method [20,21].
In the overloading method, rock mass loads are gradually increased until global failure of slope occurs, while the mechanical parameters of rock mass and structural plane are kept constant [12,13,14,15,16,17]. The overload ratios obtained from the tests are called the overload safety factor. The centrifuge method demands not only stable and reliable loading equipment but also requires customized deformation monitoring devices during the overloading process. Therefore, this method is costly to perform and lacks monitoring reusability. The steel frame lifting technique is adopted to study the failure mechanism of slopes by increasing the rock mass sliding force. Although the overloading method considers a single factor of increased sliding forces of rock mass, it is able to investigate the influence of sliding forces of rock mass on the slope stability and find the weak parts of the slope. Moreover, this method can be applied together with other methods (such as numerical simulation), which provides reference for analysis and verification of the test results.
In the strength reduction method, the mechanical parameters of the structural planes are gradually reduced until global failure of slope occurs, while the slope load (rock mass deadweight) is kept constant. The strength reduction ratio obtained from the test is called the strength reserve factor. The advantage of this method is that it is convenient to adjust the local mechanical parameters of structural planes. This method is easy to implement in numerical simulation. However, each slope geomechanical model is supposed to be performed corresponding to any single group of material parameters of the structural planes. In order to obtain the strength reserve factor, various model tests need to be performed corresponding to the different mechanical parameters. These studies are costly to perform, and few such studies have been undertaken.
In order to reduce the mechanical parameters of the structural planes, numerous material tests have been conducted to develop strength reduction materials. Strength reduction materials are developed by adding a fusible polymer material to a conventional structural material. The f′ and c′ values of the material will reduce with the increase in temperature from the heating system embedded in the model. Thus, this material can simulate the strength reduction of structural planes under rain.
In the comprehensive method proposed in this paper, the rock mass loads are first kept constant. The mechanical parameters of the structural planes are then gradually reduced to a specified value, and the model steel frame is finally lifted until global failure of slope occurs. Therefore, the mechanical parameter reduction of the structural planes can be simulated by strength reduction materials, and the sliding forces can be simulated by the steel frame lifting technique.
3. Theoretical Research on the Comprehensive Method
3.1. Safety Factor Expression of the Comprehensive Method
Based on the similarity theory of physical model and limit equilibrium method, the safety factor expression of rock slope by the comprehensive method can be derived.
(1) Strength reduction method (the mechanical parameter reduction of structural planes)
Schematic diagrams of the rock slope under natural condition and under loads are shown in Figure 1.
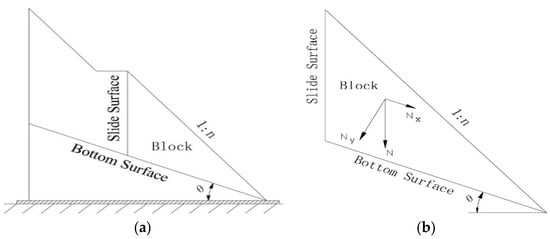
Figure 1.
Schematic diagram of rock slope in natural state and load analysis: (a) slope in natural state; (b) load analysis.
According to the shear strength formula, the antislide force F and sliding force T of the slope block are expressed as follows:
where f′ is the friction factor of the bottom surface, c′ is the cohesion force of the bottom surface, A is the contact area of block per unit width, N is the deadweight of block per unit width, Nx is the horizontal component of N on the bottom surface, Ny is the vertical component of N on the bottom surface, and θ is the dip angle of the bottom surface in the natural state.
The slope safety factor K in the natural state is defined as follows:
For the strength reduction method, the decrease in mechanical parameters of the structural planes is mainly achieved by reducing the values of and c′. Here, global slope failure occurs when these values are reduced as the values of and c′ are divided by Ks. The K′s in the ultimate state is defined as follows:
Thus, the strength reserve factor Kss can be derived by dividing the right side of Formula (3) by that of Formula (4):
Formula (5) clearly shows that Kss equals the reduction ratios of and c′, which is to say that Kss depends on the reduction ratios of the structural plane’s mechanical parameters.
(2) Overloading method by steel frame lifting technique
Schematic diagrams of the rock slope and the loads at the lifting state are shown in Figure 2.
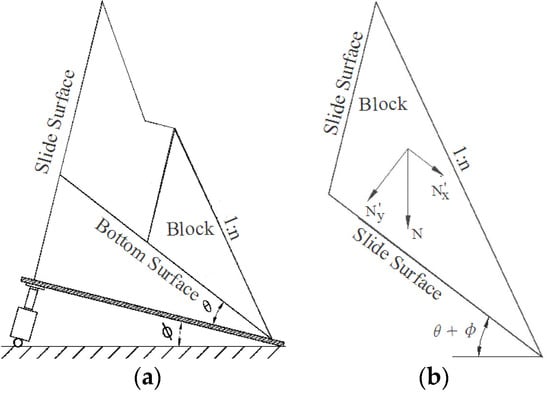
Figure 2.
Schematic diagram of rock slope in lifting state and load analysis: (a) slope in lifting state; (b) load analysis.
In the overloading method, the increased sliding forces of the slope rock mass are mainly achieved by lifting the steel frame. Here, global slope failure occurs when the uplift angle of the steel frame equals to Φ. The K′p at the ultimate state is defined as follows:
Thus, the overload factor Ksp can be derived by dividing the right side of Formula (3) by that of Formula (6):
If the adjustment coefficient of the overload method is assumed to be , then Formula (7) can be simplified to
(3) Comprehensive method
The comprehensive method combines the strength reduction method and the overloading method. In the comprehensive method, a decrease in the mechanical parameters of the structural planes are achieved by reducing the and c′ values. The increased sliding forces of the slope rock mass are achieved by lifting the steel frame until the slope becomes unstable. Here, global slope failure occurs when the and c′ values are reduced when divided by Ks and the uplift angle of the steel frame equals to ϕ. The Kc at the ultimate state is defined as follows:
Thus, the comprehensive method Ksc can be obtained by dividing the right side of Formula (3) by that of Formula (9):
Formula (10) clearly illustrates that Ksc is a multiple function of Kss and Ksp.
3.2. Failure Definition in the Comprehensive Method
In the comprehensive method, a key problem is to determine the failure criterion. Formula (10) shows that Ksc depends on Kss and Ksp. For the strength reduction range of structural planes, Yang [20] conducted triaxial compression tests and the water-rock coupling triaxial compression test in MTS815 rock mechanics testing system, and the weakening rates of weak rock and structural planes were obtained. According to substantial engineering experience and test data [20,21,22], the strength reduction range of the structural planes is normally 15–30%, which means the strength reserve factor Kss is approximately 1.15–1.3. For the uplift stage, the overload factor Ksp can be obtain by formula 8. Under the co-action of the increasing sliding force and inducing mechanical parameters of the structural planes, the slope failure modes are uncertain to some extent. Therefore, it is a challenge to accurately assess the slope stability using any routine analysis method.
With respect to the definition of failure, the mutation of the characteristic point displacement combined with the continuum of cracks can be regarded as a reliable definition of failure, and it can be widely used to analyze slope stability problems [23,24].
The typical relationship curve of slope displacement vs. Ksc for the comprehensive method is shown in Figure 3. From this figure, two feature points of slope deformation can be obtained. One is the initial crack feature point, and the other is the penetrating crack feature point. Thus, the basis for judging the safety factor of the comprehensive method is defined as follows: the Kc (f′1, c′1, and ϕ1) corresponding to the initial crack feature point is the initial safety factor KInitial, and the Kc (f′2,c′2, and ϕ2) corresponding to the penetrating feature point is the ultimate safety factor KUltimate.
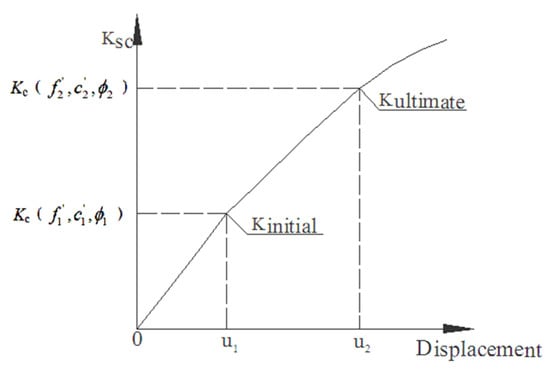
Figure 3.
Typical relationship curve of slope displacement vs. Ksc.
4. Development of Strength Reduction Material
The geomechanical model can realistically simulate rock mass, fault, joint, fracture, interlayer, and other weak structures. Numerous tests have been conducted to develop strength reduction materials. Strength reduction materials are prepared by adding fusible polymer materials to conventional structural materials. The material temperature will increase due to the heating system, which causes the polymer material to melt. Then, the antishear strength τ (f′, c′) of the materials will be decreased accordingly. Thus, strength reduction materials can be used to simulate reduction of the mechanical parameters of structural planes [21,22,25].
In this study, according to the strength reduction principle of structural plane materials, the heating system and temperature control monitoring system were set in the footwall rock block under the structural plane. The heating system was composed of a heating equipment embedded inside the model and a heating control equipment outside the model. The temperature control monitoring system included a thermocouple embedded inside the model and a temperature monitoring equipment outside the model. The layout of the temperature control system is shown in Figure 4.
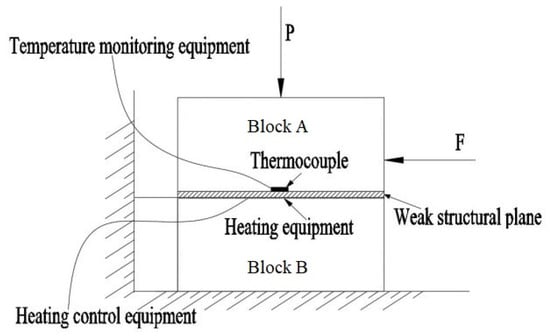
Figure 4.
Layout of the temperature control system.
According to the similarity relationship of antishearing strength and deformation modules of structural planes at normal temperature, strength reduction materials were prepared, which were mainly composed of barite powder, machine oil, and fusible polymer. The shear test with the variable temperature process was performed to obtain the relationship curve between the antishearing strength of the material τ (f′, c′) and the temperature T. A typical τ–T relationship curve of strength reduction material is shown in Figure 5. According to this relationship curve, the mechanical parameters of structural planes can be accurately reduced. This reduction technique provides a strong technical basis for the comprehensive method.
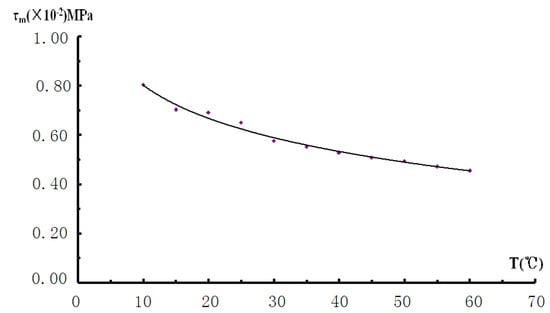
Figure 5.
Typical τ–T relationship curve of strength reduction material.
5. Case Study
5.1. Engineering Situation
The Baihetan Hydropower Station is located at the downstream of the Jinsha River in China. The high bedding rock slope is located on the left bank of the hydropower station. The slope height is up to 300 m. The slope rock mainly consists of basalt, includes layer distribution of two layers of soft rock (tuff), and develops faults, fractures, an interlaminar dislocation zone, unloading fractures, and other unfavorable geological structures. Therefore, the problem of high slope stability is prominent.
The object of the slope stability study was the I5 section of the left bank high slope after excavation. The simulation range and the geological structure of the two-dimensional slope model are shown in Figure 6. Physical–mechanical parameters of the structural planes are shown in Table 1. There were six simulated weak structural planes, namely, LS337, C3-1, f101, J110, J136, and J108, of which LS337 and C3-1 were bottom slip planes, and f101, J110, J136, and J108 were rear edge planes. The simulated strengthening measures mainly included two small concrete plugs, i.e., #2 and #3 (3 m × 5 m) in the first phase, and a large concrete plug, i.e., #1 (6 m × 8 m) in the second phase on the LS337 plane.
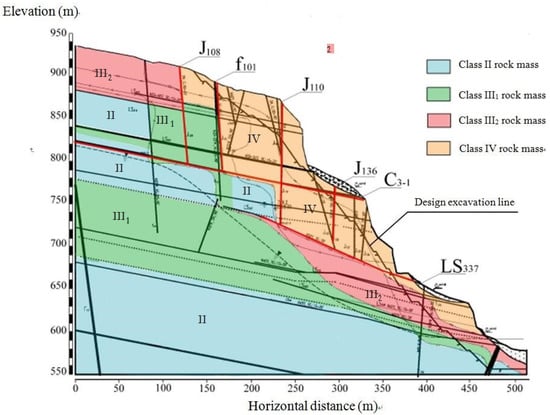
Figure 6.
Simulation range and geological structure of the I5 section.

Table 1.
Physical–mechanical parameters of the structural planes.
5.2. Slope Model Design
According to the field-testing scale, experimental precision requirements, and engineering characteristics of high bedding rock slope, we selected the model geometric ratio CL = 200, deformation modulus ratio CE = 200, volume-to-weight ratio Cγ = 1, and strain ratio Cε = 1. The model size was 2.0 m × 2.65 m (vertical direction × transverse direction), which was equivalent to a 400 m × 530 m range in the original project.
During the modeling process, the four rock classifications (II, III1, III2, and IV) were simulated through different materials from their geometric characteristics and spatial locations relative to each other. This test focused on the simulation of six weak structural planes, namely, LS337, C3-1, J110, J136, f101, and J108, in the I5 section. The model adopted two-dimensional cross control along the river and elevation directions. The two-dimensional geomechanical model of slope is presented in Figure 7.
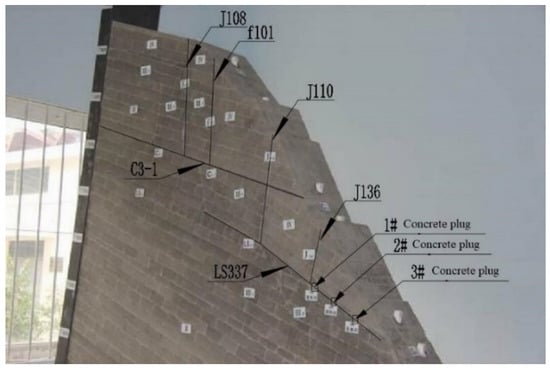
Figure 7.
Two-dimensional geomechanical model of slope.
According to substantial engineering experience and test data, the shear strength of the structural planes decreases by about 20% under rainy conditions. Therefore, this research mainly reduced the mechanical parameters of the low-angle structural planes LS337 and C3-1 and developed strength reduction materials, which were mainly composed of barite powder, machine oil, and fusible polymer. The increased sliding forces could be simulated by the steel frame lifting technique.
The displacement transformers were installed to monitor the displacements, and their data were collected by digital displacement measuring instruments (UCAM-8BL, UCAM-70A) and displacement meters [26], which included the slope surface displacements and relative displacements of structural planes. Additionally, a temperature monitoring system was attached to monitor the change in temperature during the strength reduction stage.
5.3. Test Program
For failure mode of the high bedding rock slope subjected to atomized rain, the rain infiltration first led to weakening of the mechanical parameter of the structural planes. Then, the sliding forces increased by the internal pore water pressure until the slope showed a trend of global instability.
Thus, the procedure to test the geomechanical model were as follows. First, we increased the temperature to simulate the strength reduction of LS337 and C3-1. The process of increasing the temperature consisted of 21 test steps, during which the temperature rose from T0 to T21. The shear strength of the structural planes decreased by about 20%. Then, with the strength parameters kept constant, the platform was uplifted to simulate the sliding forces increased by the steel frame lifting technique until the slope showed a trend of global instability. The uplift stage consisted of 24 test steps, where the step length of uplift was 2 cm. The test procedure for the comprehensive method is shown in Table 2.
Table 2.
Test procedure for the comprehensive method.
5.4. Distribution Characteristics of Displacement
The curves of the slope displacements are shown in Figure 8 and Figure 9. Outward is positive for horizontal direction displacement, while up is positive for vertical direction displacements. According to the distribution characteristics of the slope displacement, the deformation process of the slope consisted of three stages: uniform stage (1st to 35th step), dislocation stage (35th to 37th step), and failure stage (42nd to 45th step).
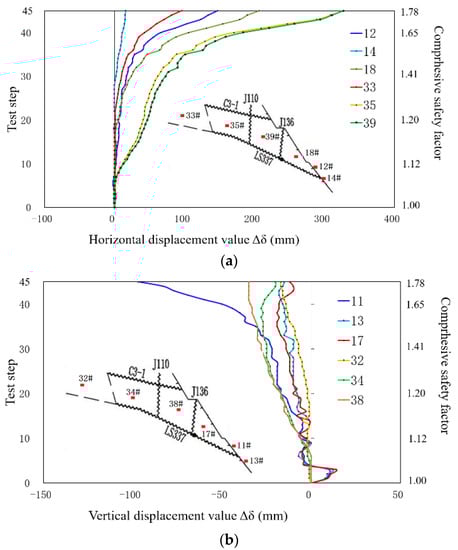
Figure 8.
Typical curve of slope surface displacement (monitoring points near LS337). (a) Horizontal displacement; (b) vertical displacement.
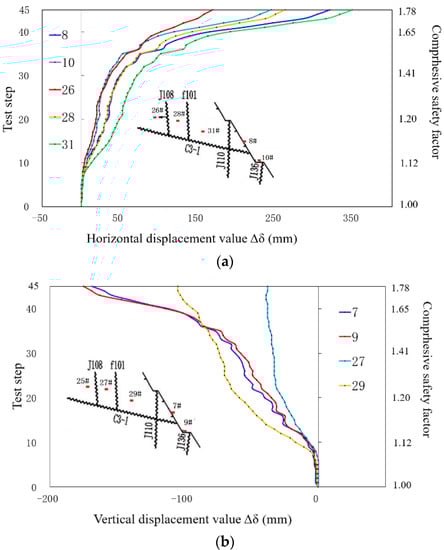
Figure 9.
Typical curve of slope surface displacement (monitoring points near C3-1). (a) Horizontal displacement; (b) vertical displacement.
5.4.1. Distribution Characteristics of Surface Displacement
The surface displacement distribution resulted in outward deformation in horizontal displacement and downward subsidence in vertical displacement. The horizontal displacement was greater than the vertical displacement. The displacement of C3-1 upper rock mass was larger than that of LS337. The displacement of monitoring points located between J136 and f101 (such as #35, #39, #8, and #31) was relatively large, but the displacement near the concrete plugs (such as #12 and #18) was relatively smaller than that of other locations.
At the strength reduction stage, the block with C3-1 and LS337 as the bottom slip plane gradually slipped outward with the increase in the amount of strength reduction. When the strength of structural planes decreased by 1.2, the horizontal displacement of #8, located at the exit of C3-1, was 36 mm (outward, prototype value); the vertical displacement value of #7 was 42 mm (sink); the horizontal displacement of #12, located at the exit of LS337, was 36 mm (outward); and the vertical displacement value of #11 was 17 mm (sink).
During the lifting stage, the displacement curve fluctuated slightly during the second to sixth steps. The C3-1 and LS337 began to creep, expansive deformation occurred near the exit of the LS337, the vertical displacement exhibited upper convex displacement, and displacement fluctuation was fairly apparent (Figure 8b and Figure 9b). Most curves began to turn back during the 8th to 12th steps, and displacement gradually increased. During the 20th to 22nd steps, the lifting test began, the inflection point of the displacement curve occurred, and the displacement increased further. Most displacement curves exhibited turning and inflection points during the 35th to37th steps, the displacement curves decreased, and the increase became apparently greater. Finally, the displacement quickly increased, and the slope exhibited a trend of global instability.
5.4.2. Distribution Characteristics of Relative Displacement along Structural Plane
Relative displacement curves of LS337 and C3-1 are shown in Figure 10.
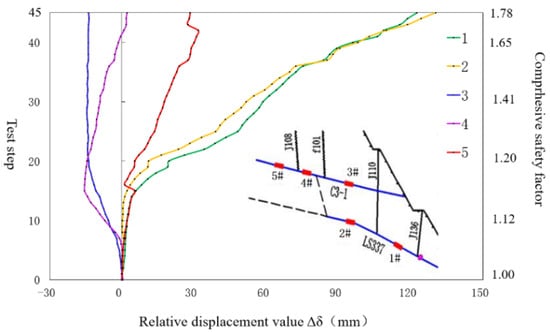
Figure 10.
Relative displacement curve of LS337 and C3-1.
In the strength reduction phase, the shear strength of C3-1 and LS337 decreased by 1.2, the relative displacement was very sensitive to the strength reduction, and the curves exhibited obvious fluctuation.
During the second to sixth steps, the displacement curves exhibited a slight fluctuation, and the relative displacement value gradually increased. In particular, the relative displacement of C3-1 significantly increased (such as #3 and #4). During the 14th to 16th steps, the displacement curves exhibited apparent fluctuation and transition. At this time, the front edge rock of the slip block #II-1 cracked, and the bottom slip plane and rear edge plane of #I-1 cracked, grew, and intersected each other. During the lifting stage, the relative displacement of LS337 significantly increased (such as #1 and #2), but the relative displacement of C3-1 increased relatively slowly. This was mainly because C3-1 was located within the upper rock of LS337 and both the upper and lower rock of C3-1 slip along LS337; therefore, the relative dislocation between the hanging wall and footwall of C3-1 was apparently less than that of LS337. During the 35th to 37th steps, the displacement curve exhibited apparent fluctuation and an inflection point. The increase in the relative displacement of LS337 became greater. At this time, all the structural plane cracks penetrated, leading to the formation of multiple blocks. The blocks slipped outward along the C3-1 and LS337, and the slope showed a trend of global instability.
5.5. Observed Failure Mode
Failure patterns of the full process are shown in Figure 11, where the black line represents an instability crack.
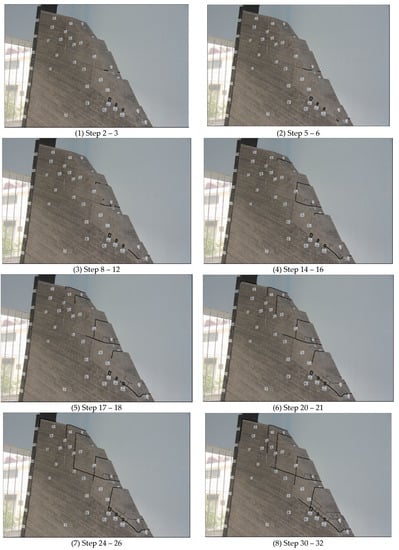
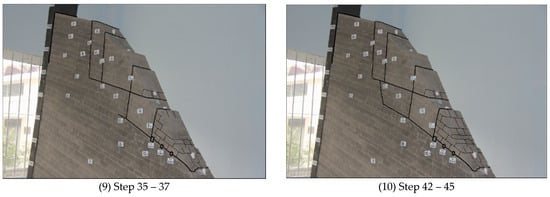
Figure 11.
Failure pattern of the full process.
During the second and third steps (KS = 1.05–1.059), C3-1 exhibited microcracks at the exit, with a crack length of about 2 cm (Figure 11(1)). After that, the steep structural planes on the back edge of the slip blocks were pulled apart from the exit of the slope surface one after another. After the first block slipped, its rear edge tensile crack surface became the front edge empty surface of the next block. This resulted in the slip of the rear edge blocks one after another, and the failure area gradually developed from the slope surface to the interior.
During the 35th to 37th steps (KS = 1.2, KP = 1.272–1.313), cracks J110, C3-1, and J108 grew downward and joined with LS337 to form multiple slip blocks. The cracks at the rear edge surface of the slope opened to C3-1. The landslide steps were easily observed at the exit of J136 and J110. The blocks between J136 and J110 sank and formed a landslide step (Figure 11(9)).
During the 42nd to 45th steps (KS = 1.2, KP = 1.42–1.487), all structural planes had been cracked through. The cracks apparently opened and intermingled to form multiple slip blocks, of which the crack gap of J108 was relatively large, with a maximum gap of up to 2 mm (model value). The multiple slip blocks exhibited crushing-types of cracks, generated a great number of cracks along the joints, and tended to collapse. The slope showed global instability (Figure 11(10)).
Failure sequence diagram of the slip blocks is shown in Figure 12. The slip blocks were gradually formed along the structural plane. For LS337, the failure sequence of the slip block was as follow: I-1 > I-2 > I-3. For C3-1, the failure sequence of the slip block was as follow: II-1 > II-2 > II-3. Therefore, the whole failure sequence of the slip blocks along the structural planes was graded into three levels. The slip blocks along the lower structural planes were formed at a later time than that along the upper structural planes.
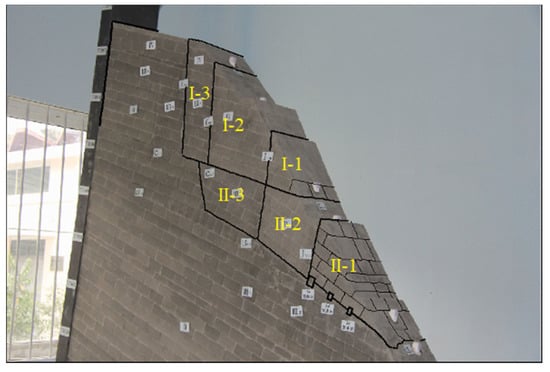
Figure 12.
Failure sequence diagram of the slip blocks.
The failure modes of the slope are shown in Figure 13. The failure modes of the bedding rock slope were of two types: sliding–fracturing and fracturing–sliding. The slip blocks of sliding–fracturing were I-1, II-1, and II-3, while the slip blocks of fracturing–sliding were I-2, I-3, and II-2. In summary, the slip block of sliding–fracturing was the first slip block at the exposed place of the structural planes. Due to the blocking effect of the first slip block, the sliding of the lower slope body was restricted. Other blocks that formed behind the first block were mainly fracturing–sliding.
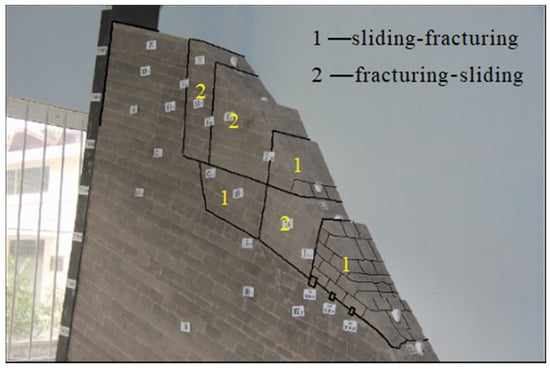
Figure 13.
Failure modes of the slope.
5.6. Reinforcement Effect of Concrete Plugs
According to typical curve of displacement surface near the concrete plugs (Figure 14), during the 14th to 16th steps, cracks grew down along J110 and joined with C3-1 to form a complete #I-1 slip block; the crack at the front edge rock of LS337 just opened to #3 concrete plug due to reinforcement effects of the concrete plugs. During the 24th to 26th steps, cracks grew downward along f101 and joined with C3-1 to form a complete #I-2 slip block. Meanwhile, cracks grew downward along J136 and joined with LS337 to form a complete #II-1 slip block. When the slope exhibited a trend of global instability, all structural planes had been cracked through; the cracks apparently opened and led to the formation of multiple slip blocks.
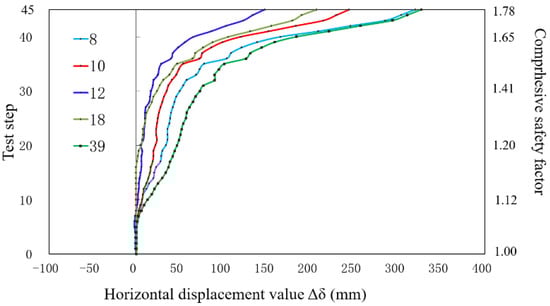
Figure 14.
Typical curve of slope surface displacement (monitoring points near concrete plugs).
The test showed that the concrete plugs could improve the shear resistance of structural planes and inhibit the dislocation between two layers. The displacement magnitude near the concrete plugs was relatively smaller. The slip block reinforced by concrete plugs (such as #12 and #18) would be formed later than without it.
5.7. Safety Factor Assessment
According to the mutation of the characteristic point displacements and the continuums of cracks, Ksc was calculated as follows:
5.8. Verification of Test Results with FEM
5.8.1. FEM Analysis
To verify the test results of the comprehensive method, the finite element method was utilized to compare the slope failure process. The two-dimensional calculation grid graph of the left bank slope is presented in Figure 15.
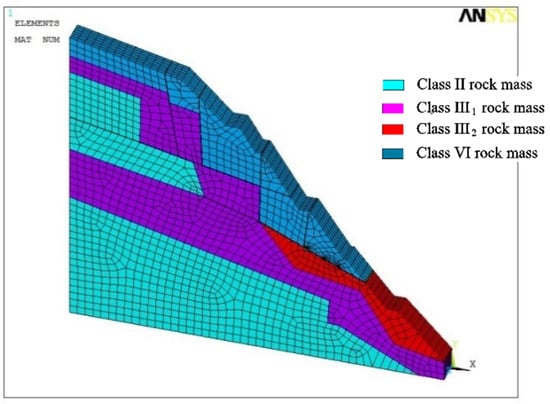
Figure 15.
Two-dimensional numerical calculation grid graph of the slope.
The simulation range, load combination, and mechanical parameters utilized in the calculation were consistent with the model test. The finite element software ANSYS was utilized for nonlinear analysis of materials. The Drucker–Prager yielding criterion was utilized for strength criterion analysis. The rock utilized the solid45 element, and the concrete plug utilized the solid65 element. The model contained 9354 discrete elements and 11,476 nodes. The model coordinate system used the X-axis for the horizontal direction with the positive direction to the right, the Y-axis for the vertical direction with the positive direction pointing upward, and the Z-axis for the water flow direction with upstream as the positive direction.
(1) Distribution characteristics of the displacement
According to the relationship curves of the slope surface displacement (Figure 16), during the fourth to fifth steps (KS = 1.08 – 1.10), the displacement curve showed fluctuation. Prior to the 10th step (KS = 1.20), the surface displacement of the slope was dominated by the vertical settlement toward the valley, and the displacement curve exhibited a steady increase in linear mode with a smaller displacement. During the 16th to 18th steps (KP = 1.295 – 1.401), most of the curves began to turn back, and the displacement gradually increased. The settlement displacements showed apparent increases in both the X and Y directions. The displacements of #10 and #24 in the X direction were very significant, as were #1 and #2 in the Y direction.
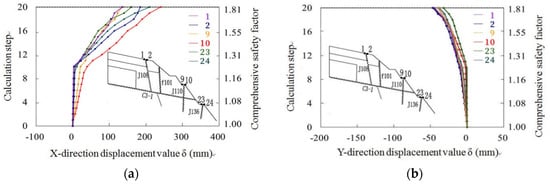
Figure 16.
Typical curve of slope surface displacement. (a) Horizontal displacement; (b) vertical displacement.
(2) Plastic failure analysis
According to the distribution graph of the plastic zone (Figure 17), it was found that under the application of slope self-weight, plastic zones showed up at the exit of C3-1 and LS337. The intersected locations of the structural planes between C3-1 and J108 and between LS337 and J110 all showed relatively small plastic zones. When the slope model was uplifted 5° (KP = 1.243), the plastic zone on the cracked plane J110 penetrated C3-1 and extended to LS337, and the cracked plane J136 was penetrated. Thus, multiple slip blocks were formed. When the slope model was uplifted 10° (KP = 1.512), the plastic zones of various structural planes grew, penetrated, and intersected each other, and the slope showed global instability.
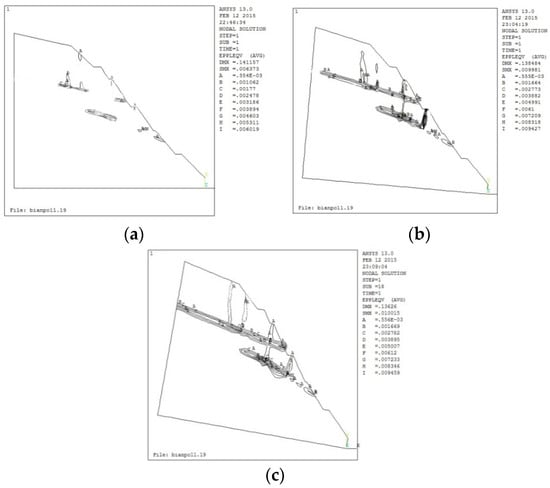
Figure 17.
Plastic failure process isoline of numerical calculation. (a) Under the self-weight; (b) KP = 1.243 (with uplift 5°); (c) KP = 1.512 (with uplift 10°).
(3) Safety factor assessment
In numerical calculations, when the shear strength of the C3-1 and LS337 decreased by 1.2 and the angle was uplifted by 6°–7° (Ksp = 1.295–1.347), the curve of the characteristic point gradually showed turning, and displacement showed a significant increasing trend. This indicated the instability failure of the slope. Therefore, Ksc is as follows:
Ksc = 1.20 × (1.295 − 1.347) = 1.554 − 1.617
5.8.2. Comparison Results of Comprehensive Method and FEM
(1) Distribution characteristics of the displacement
The model test and numerical calculation results all indicated that the maximum displacement was mainly concentrated at the upper and lower rock mass of C3-1 and the exposed locations of the unloading cracks. The slope surface displacement was greater than the slope interior displacement. The displacement at the strengthened location was apparently less than that of the untreated location. The overall regularity of displacement tended to be consistent, and the numerical calculation results were slightly less than that of the model test. The displacement curves obtained by both methods showed a similar evolution process. At the initial cracking, various displacement curves began to show inflection points and fluctuation, and the surface displacement curves of the monitoring points at the exposed locations on C3-1 and LS337 showed a slight fluctuation. After the strength reduction by a factor of 1.2, the slope model was subjected to the steel frame lift. The displacement curves gradually increased and eventually showed a turning point. The increase in displacement became greater, and the slope showed a trend toward instability.
(2) Failure pattern
From the global instability trend and regularity, the slope failure pattern tended to be consistent. In the model test, the exposed locations of the structural planes first cracked, the shear cracks on the bottom slip plane and tensile cracks on the cracked plane kept growing toward the interior of the rock, and cracks intermingled and penetrated to jointly form multiple slip blocks. When the slope finally failed due to instability, all the structural planes cracked and mutually penetrated, the surface of the rock was concentrated with cracks, and the rock showed an obvious trend of slip instability. Due to the concrete plugs, the crack-growing velocity of LS337 was slow relative to C3-1.
In numerical calculations, the slope was primarily affected by the structural planes. Plastic failure first occurred on these structural planes. When the strength was reduced by a factor of 1.2, the two bottom slip planes and four cracked planes showed plastic failure, and apparent shear failure was observed on the bottom slip planes. With the increase of the uplift angle, the cracked plane was fractured by tension from the upper to the lower part. The plastic zones on the two bottom slip planes grew toward the interior and penetrated. When the slope finally failed, the plastic zones on various structural planes grew and penetrated, intersected with each other, and formed slip blocks and slip channel. Due to the concrete plugs, the plastic zone in the front edge of LS337 was not penetrated. The failure pattern was consistent with the model test results.
(3) Safety factor
Comprehensive method: Ksc = 1.526–1.576
FEM method: Ksc = 1.554–1.617
Therefore, the calculation results were basically consistent with the model test results, and the comparison proved the reliability and feasibility of the model test.
6. Conclusions and Perspectives
In this study, a comprehensive method was established to study the stability of high bedding rock slope subjected to atomized rain. Testing was carried out on the high bedding rock slope of the Baihetan Hydropower Station. The failure modes of high bedding rock slope subjected to atomized rain were revealed. The following conclusions can be drawn.
(1) Based on the steel frame lifting technique and strength reduction materials, a comprehensive method was first proposed to study the stability of high bedding rock slope subjected to atomized rain. The safety factor expression of the comprehensive method was established as Ksc = Ksp × Kss. Strength reduction materials were developed to simulate the strength reduction of structural planes caused by rainfall infiltration. This type of material can also be used to simulate weak structural planes of reservoir slope, dam abutment slope, and dam foundation subjected to rainfall, atomized rain, and rising/lowering water levels.
(2) The failure modes of the bedding rock slope were revealed as being of two types: sliding–fracturing and fracturing–sliding. The slip block of sliding–fracturing was the first slip block formed at the exposed place of the structural planes. Due to the blocking effect of the first slip block, the sliding action of the lower slope body was restricted. Other blocks formed behind the first slip block were mainly fracturing–sliding.
(3) The whole failure sequence of the slip blocks along the structural planes was graded into multiple levels. The slip blocks along the lower structural planes were formed later than that along the upper structural planes.
(4) The concrete plugs could improve shear resistance of the structural planes and inhibit dislocation between the upper and lower rock bodies. The displacement magnitude near the concrete plugs was relatively small. The bedding rock slope could be effectively reinforced by the measures of concrete plugs set on the structural planes.
(5) For strength reduction materials, there are two problems that need to be considered. First, the strength reduction extent of the materials is limited. Second, the mechanical parameters of the materials will decrease with the increase in temperature, and the resulting temperature field in the model will affect the accuracy of the results of the geomechanical model test. Consequently, some further considerations are necessary.
Author Contributions
Writing—Original draft preparation, Z.-j.H. and B.-q.Y.; project administration, L.Z.; resources, B.-q.Y. and Y.C.; data curation, Z.-j.H., B.-q.Y., and G.-x.Y.; supervision, Y.C. and L.Z.; writing—review and editing, B.-q.Y. and Z.-j.H.; formal analysis, Z.-j.H. and B.-q.Y. All authors have read and agreed to the published version of the manuscript.
Funding
This research was supported by the National Natural Science Foundation of China (No. 51609163) and the National Key R&D Projects with Grant No. 2016YFC0401908.
Conflicts of Interest
The authors declare no conflict of interest.
References
- Yang, Y.C.; Xing, H.G.; Yang, X.G.; Chen, M.L.; Zhou, J.W. Experimental study on the dynamic response and stability of bedding rock slopes with weak interlayers under heavy rainfall. Environ. Earth. Sci. 2018, 77, 433. [Google Scholar] [CrossRef]
- Li, S.D.; Li, X.; Wu, J.; Liu, Y. Evolution process and pattern of sliding zone in large consequent bedding rock landslide. Chin. J. Rock Mech. Eng. 2007, 12, 2473–2480. [Google Scholar]
- He, Z.M.; Wang, B.L. Instability Process Model test for bedding rock slope with weak interlayer under different rainfall conditions. Adv. Civ. Eng. 2018, 2018, 8201031. [Google Scholar] [CrossRef]
- Tarun, K.R. Plane failure in rock slopes—A review on stability analysis techniques. J. King Saud Univ. Sci. 2019, 31, 101–109. [Google Scholar]
- Jia, G.W.; Zhan, L.T.; Chen, Y.M.; Fredlund, D.G. Performance of a large-scale slope model subjected to rising and lowering water levels. Eng. Geol. 2009, 106, 92–103. [Google Scholar] [CrossRef]
- Zhan, Z.F.; Qi, S.W. Numerical study on dynamic response of a horizontal layered-structure rock slope under a normally incident Sv Wave. Appl. Sci. 2017, 7, 716. [Google Scholar] [CrossRef]
- Gong, W.H.; Wang, P. Simulation analysis of elastoplastic FEM for stability of bedding rock cutting slope. Rock Soil Mech. 2006, 7, 1114–1118. [Google Scholar]
- Stead, D.; Eberhardt, E.; Coggan, J.S. Developments in the characterization of complex rock slope deformation and failure using numerical modeling techniques. Eng. Geol. 2006, 83, 217–235. [Google Scholar] [CrossRef]
- Abderrahmane, T.H.; Abdelmadjid, B. Assessment of slope stability by continuum and discontinuum methods. Int. J. Civ. Environ. Eng. 2006, 10, 543–548. [Google Scholar]
- Li, Y.J.; Qian, C.; Fu, Z.Z.; Li, Z. On Two Approaches to slope stability reliability assessments using the random Finite Element Method. Appl. Sci. 2019, 9, 4421. [Google Scholar] [CrossRef]
- Weng, M.C.; Lin, M.L.; Lo, C.M.; Lin, H.H. Evaluating failure mechanisms of dip slope using a multiscale investigation and discrete element modeling. Eng. Geol. 2019, 263, 105303. [Google Scholar] [CrossRef]
- Ashby, J.A. Sliding and Toppling Modes of Failure in Model and Jointed Rock Slope. M.S. Thesis, Imperial College Royal School of Mines, London, UK, 1971. [Google Scholar]
- Zhou, W.Y.; Lin, P.; Yang, Q. Experimental research on stability of Jinping high slope with three-dimensional geomechanical model. Chin. J. Rock Mech. Eng. 2008, 27, 893–901. [Google Scholar]
- Avgherinos, P.J.; Schofield, A. Drawdown failures of centrifuged models. Proc. 7th Int. Conf. Soil Mech. Found. Eng. 1969, 2, 497–505. [Google Scholar]
- Schofield, A.N. Use of centrifugal model testing to assess slope stability. Can. Geotech. J. 1978, 15, 14–31. [Google Scholar] [CrossRef]
- Harris, C.; Smith, J.S.; Michael, C.R. An investigation of periglacial slope stability in relation to soil properties based on physical modeling in the geotechnical centrifuge. Geomorphology 2008, 93, 437–459. [Google Scholar] [CrossRef]
- Li, M.; Zhang, G.; Hu, Y. Centrifuge model tests on excavation-induced failure of slopes. Rock Soil. Mech. 2010, 31, 366–370. [Google Scholar]
- Sasahara, K.; Sakai, N. Development of shear deformation due to the increase of pore pressure in a sandy model slope during rainfall. Eng. Geol. 2014, 170, 43–51. [Google Scholar] [CrossRef]
- Chen, H.X.; Zhang, L.M. A physically-based distributed cell model for predicting regional rainfall-induced shallow slope failures. Eng. Geol. 2014, 176, 79–92. [Google Scholar] [CrossRef]
- Yang, B.Q.; Zhang, L.; Chen, Y.; Dong, J.H.; Chen, J.Y. Study on weakening effect of structural plane and stability analysis of Jinping I high arch dam. Chin. J. Hydr. Eng. 2016, 7, 907–915. [Google Scholar]
- Chen, Y.; Zhang, L.; Yang, B.Q. Geomechanical model test on dam stability and application to Jinping High arch dam. Int. J. Rock. Mech. Min. 2015, 76, 1–9. [Google Scholar] [CrossRef]
- Zhang, L.; Fei, W.P.; Li, G.L.; Cheng, J.Y.; Hu, C.Q. Experimental study on global geomechanical model for stability analysis of high arch dam foundation and abutment. Chin. J. Rock Mech. Eng. 2005, 24, 3465–3469. [Google Scholar]
- He, Y.; Wang, X.Y.; Yuan, Y.; Liu, K.W. On the computational precision of Finite Element Algorithms in slope stability problems. Math. Probl. Eng. 2018, 2019, 9391657. [Google Scholar] [CrossRef]
- Zhang, K.; Cao, P.; Bao, R. Progressive failure analysis of slope with strain-softening behaviour based on strength reduction method. Chin. J. Zhejiang. Univ. Sci. A Appl. Phys. Eng. 2013, 14, 101–109. [Google Scholar] [CrossRef]
- He, X.S.; Ma, H.Q.; Zhang, L.; Li, C.L. Study on temperature characteristics of temperature analogous material in geomechanical model test. Chin. J. Rock Mech. Eng. 2009, 28, 980–986. [Google Scholar]
- Yang, B.Q.; Zhang, L.; Liu, E.L.; Dong, J.H.; Zhu, H.H.; Chen, Y. Deformation monitoring of geomechanical model test and Its application in overall stability analysis of a high arch dam. J. Sens. 2015, 2015, 470905. [Google Scholar] [CrossRef]
© 2020 by the authors. Licensee MDPI, Basel, Switzerland. This article is an open access article distributed under the terms and conditions of the Creative Commons Attribution (CC BY) license (http://creativecommons.org/licenses/by/4.0/).