Article

Simulation and Experimental Analysis on the Load Characteristics of a Temperature-Control Curtain in a Thermally-Stratified Reservoir

1
State Key Laboratory of Hydraulic Engineering Simulation and Safety, Tianjin University, Tianjin 300072, China
2
School of Water Conservancy and Hydropower, Hebei University of Engineering, Handan 056038, China
*
Author to whom correspondence should be addressed.
Appl. Sci. 2020, 10(4), 1461; https://doi.org/10.3390/app10041461
Submission received: 30 December 2019 / Revised: 12 February 2020 / Accepted: 18 February 2020 / Published: 21 February 2020

Abstract

:
Low-temperature discharged water from thermally-stratified reservoirs in spring and summer will have a negative environmental impact on fish breeding and agricultural irrigation downstream. The temperature-control curtain (TCC) is a selective withdrawal structure that can effectively change the discharged water temperature. Compared with a traditional selective withdrawal project, a TCC project has the advantages of low cost and simple construction and can even be added to operating reservoirs without impacting power generation. Analysis of the load characteristics is the key to the application of TCC engineering. This paper establishes a three-dimensional numerical model simulation and verifies it with physical model experimental results. The crucial parameters affecting the load characteristics of TCC are investigated, including the water blocking rate, area ratio, inclination ratio, inflow velocity, and water temperature stratification ratio. The results show that: (1) This numerical simulation approach can be used to predict the drag coefficient and the load of a TCC; (2) the water blocking rate has the greatest influence on the drag coefficient, and it is the most critical indicator of the TCC load; and (3) the drag coefficient exponentially increases with an increasing water blocking rate, quadratically increases with an increasing area ratio, linearly increases with an increasing inclination ratio, and linearly increases with an increasing water temperature stratification ratio.

1. Introduction

The construction of a reservoir dam change the natural environment and the river course, and the water temperature in the reservoir may exhibit an obvious vertical stratification phenomenon [1]. The intake elevation of traditional hydropower stations is low because of the engineering reasons, especially in reservoir with large water level fluctuations. As a result, the discharged water temperature in spring and summer is lower than that in natural conditions, while that in winter is higher [2]. Low-temperature outflow water in spring and summer may have an important impact on downstream farmland irrigation, fish breeding, and water quality [3,4,5,6] and can cause a series of ecological and environmental problems [7]. Regulation of the discharged water temperature and mitigation of the impact of low-temperature outflow water on the downstream ecology have become the focus of current environmental protection efforts [8].
Several selective withdrawal structures [9] have been adopted in thermally stratified reservoirs to regulate low-temperature outflow water, including stop log gates [10], temperature-control curtains (TCCs) [11], and side-type orifice intakes [12]. Traditional selective withdrawal structures, such as stop log gates and side-type orifice intakes, need to be built before reservoir operation and will cause a certain loss of power generation. TCCs can be constructed in reservoir water storage and anhydrous environments, so this structure can be used in reservoirs that have been put into operation but do not have selective withdrawal structures. Compared with a traditional selective withdrawal project, a TCC project has the advantages of low cost and simple construction and can even be added to operating reservoirs without impacting power generation.
Top TCCs can effectively improve water quality and prevent algae blooms in thermally-stratified reservoirs [13]. Takashi Asaeda [14] proposed using vertical curtains to control algae blooms in downstream areas of the Terauchi Dam Reservoir in Japan. Chae-Hong Park [15] monitored the vertical curtain in front of a water intake and indicated that the vertical curtain could reduce harmful organic matter content and improve water quality in a drinking water intake zone during active algal growth and bloom periods. Lee et al. [16] concluded that a vertically moveable curtain weir could effectively prevent eutrophic substances from flowing downstream and alleviate algae blooms in the Daecheong Reservoir.
As a low-cost and easy-to-construct selective withdrawal structure, the TCC has been increasingly applied to change the outflow water temperature. A TCC is composed of a gravity anchorage system on the bottom, a main cable, a water-proof curtain wall and a floating bridge system on the top [17,18]. Vermeyen [19] showed that top curtains could effectively stop surface high-temperature water and allow the survival and breeding of cold-water fish downstream through prototype observations of the Lewiston Reservoir and Whiskeytown Reservoir in the United States.
Shammaa et al. [20] studied the evolution of the flow field near a TCC through a two-layer flow model test in fresh water and saline water. Politano et al. [21] adopted a three-dimensional model to simulate the effects of a TCC on the discharged water temperature of the McNary Dam and the temperature distribution in front of the dam. Through a three-dimensional hydrodynamic simulation model, Lian et al. [22] analyzed the effect of a bottom TCC on low-temperature outflow water and the main influencing factors. He et al. [23] analyzed the pressure on a TCC as a hydrostatic pressure difference and a hydrodynamic pressure difference and obtained the effect of thermal stratification on the hydrodynamic characteristics.
Currently, no engineering guidelines for designing an effective TCC system are available due to the lack of understanding of the complex interactions between the flexible curtain structure and water flow. The present research mainly focuses on the improvement in outflow water temperature regulation and water quality by TCCs, but few studies have been conducted on the mechanical characteristics of TCCs. Analysis of the mechanical characteristics of a bottom TCC is the key to safe operation of the TCC as a selective withdrawal structure for intercepting low-temperature water [24].
In this study, a generalized numerical simulation model of a stratified reservoir is established and verified via physical model experimentation and prototype observation, which proves the feasibility of using a simulation model to analyze TCC mechanical characteristics. The working program is shown in Figure 1. This paper aims to investigate the influence factors of TCC arrangement and the resulting flow field, including water blocking rate, area ratio, inclination ratio, flow velocity, and water temperature stratification ratio, on the load characteristics and provides technical support for future theoretical research and engineering application of TCC projects.

2. Materials and Methods

2.1. Case Study

The case study is a large and deep reservoir located in Southern China. The average water depth in front of the dam is about 32.5 m and the maximum water depth is 36 m. The reservoir has a dam height of 40 m. Figure 2 shows the comparison of monthly average water temperature in downstream areas of the hydropower station before and after reservoir construction. The reservoir has obvious thermally stratification characteristics. Outflow water temperature tends to be colder in the spring and summer than natural inflow. The vertical temperature distributions immediately upstream the dam were recorded every 10 days from May 2013 to April 2014. The inflow and outflow water temperatures were recorded daily.

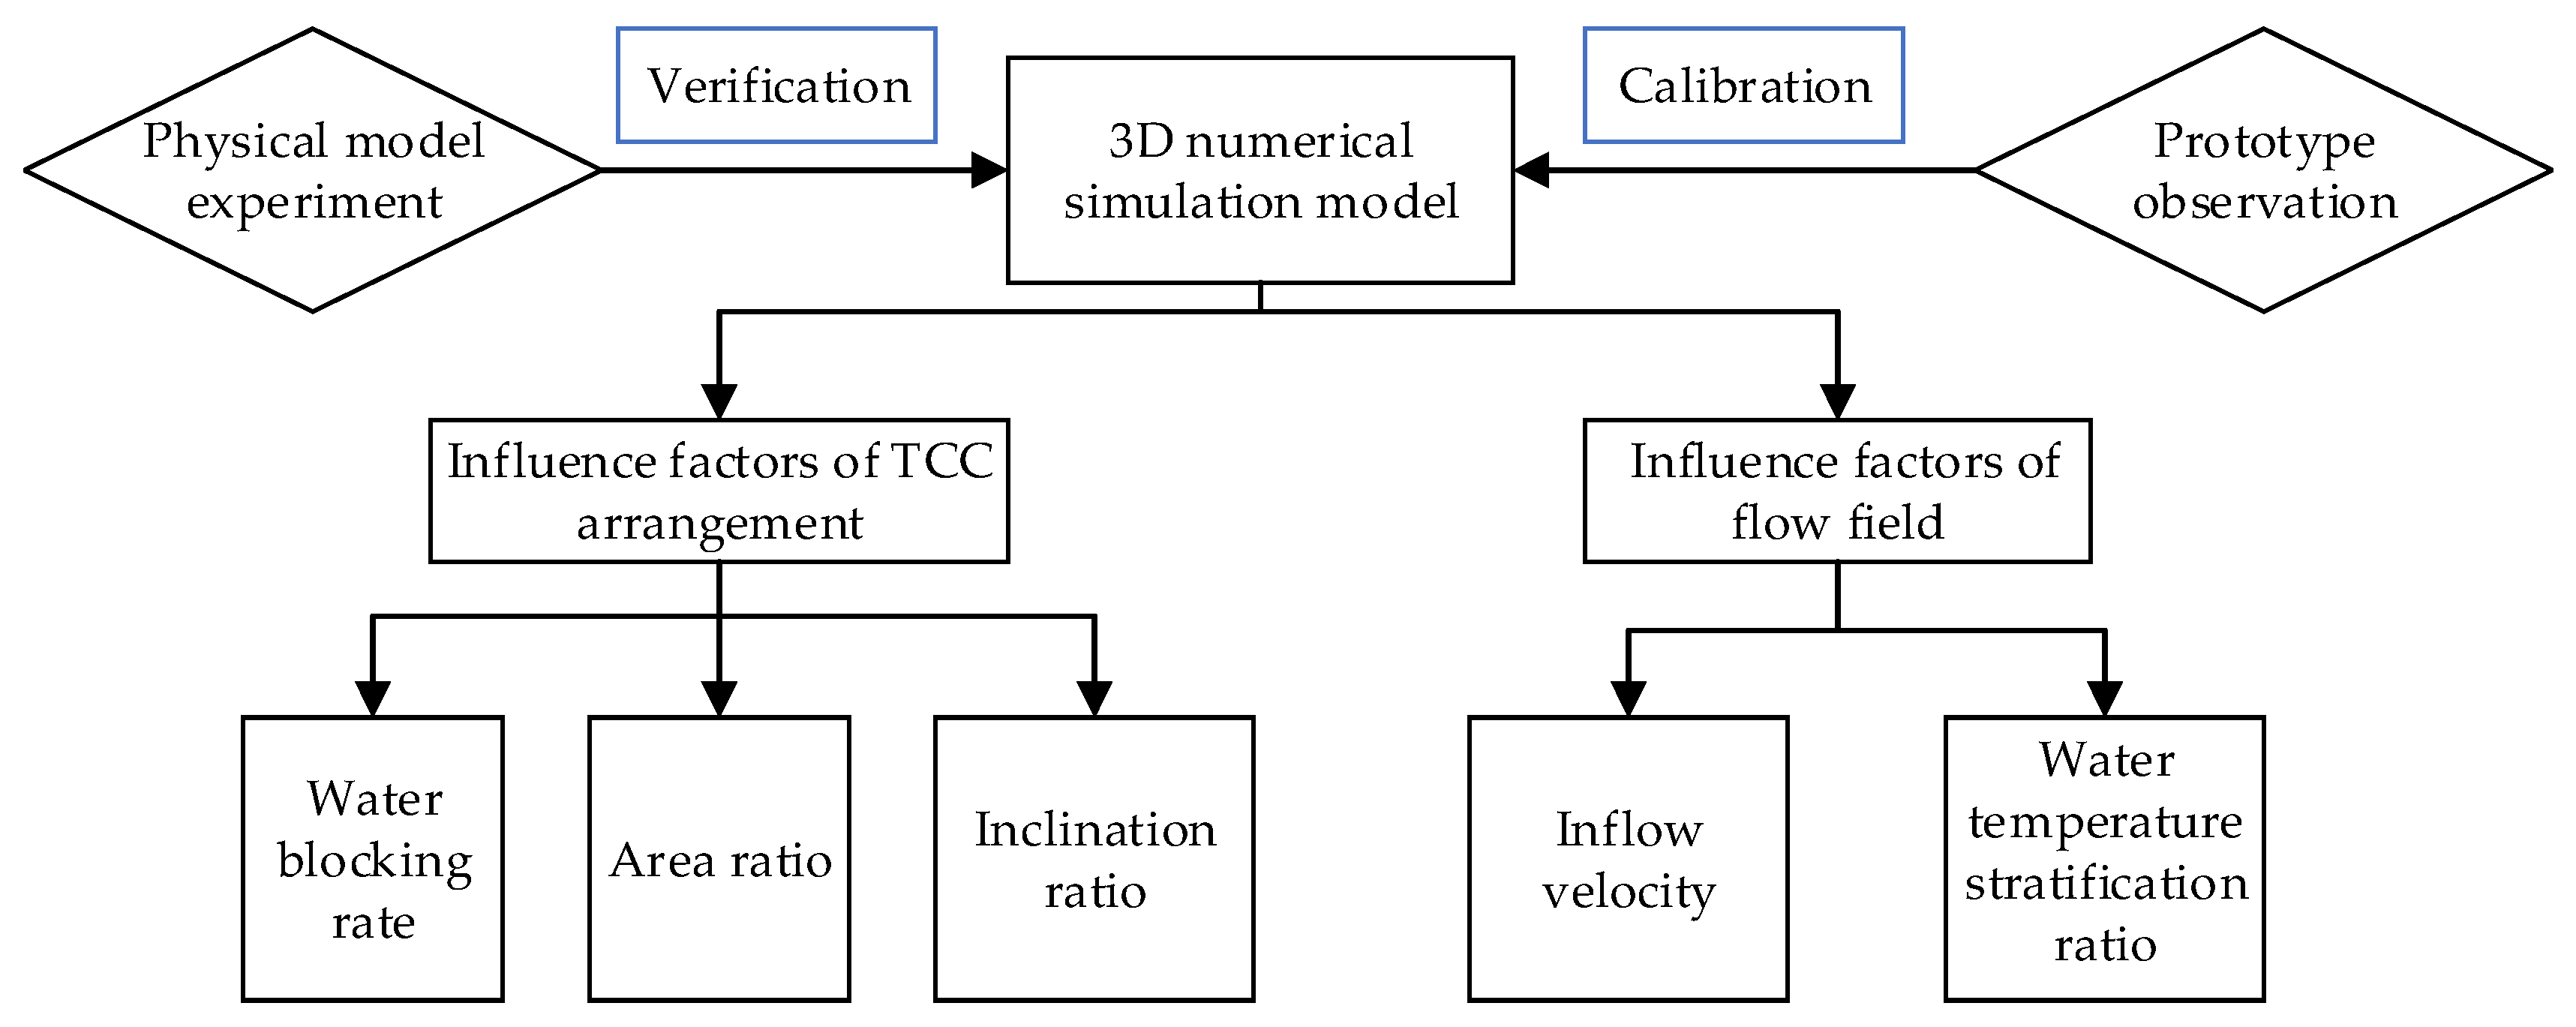
2.2. Main Parameters

To analyze the mechanical characteristics of a TCC, the water blocking rate, area ratio, inclination ratio and water temperature stratification ratio are mainly considered. Figure 3 shows the geometry of the TCC and the main parameters are defined as follows:
(1)
Water blocking rate (Prh): water blocking area divided by cross-sectional area.
(2)
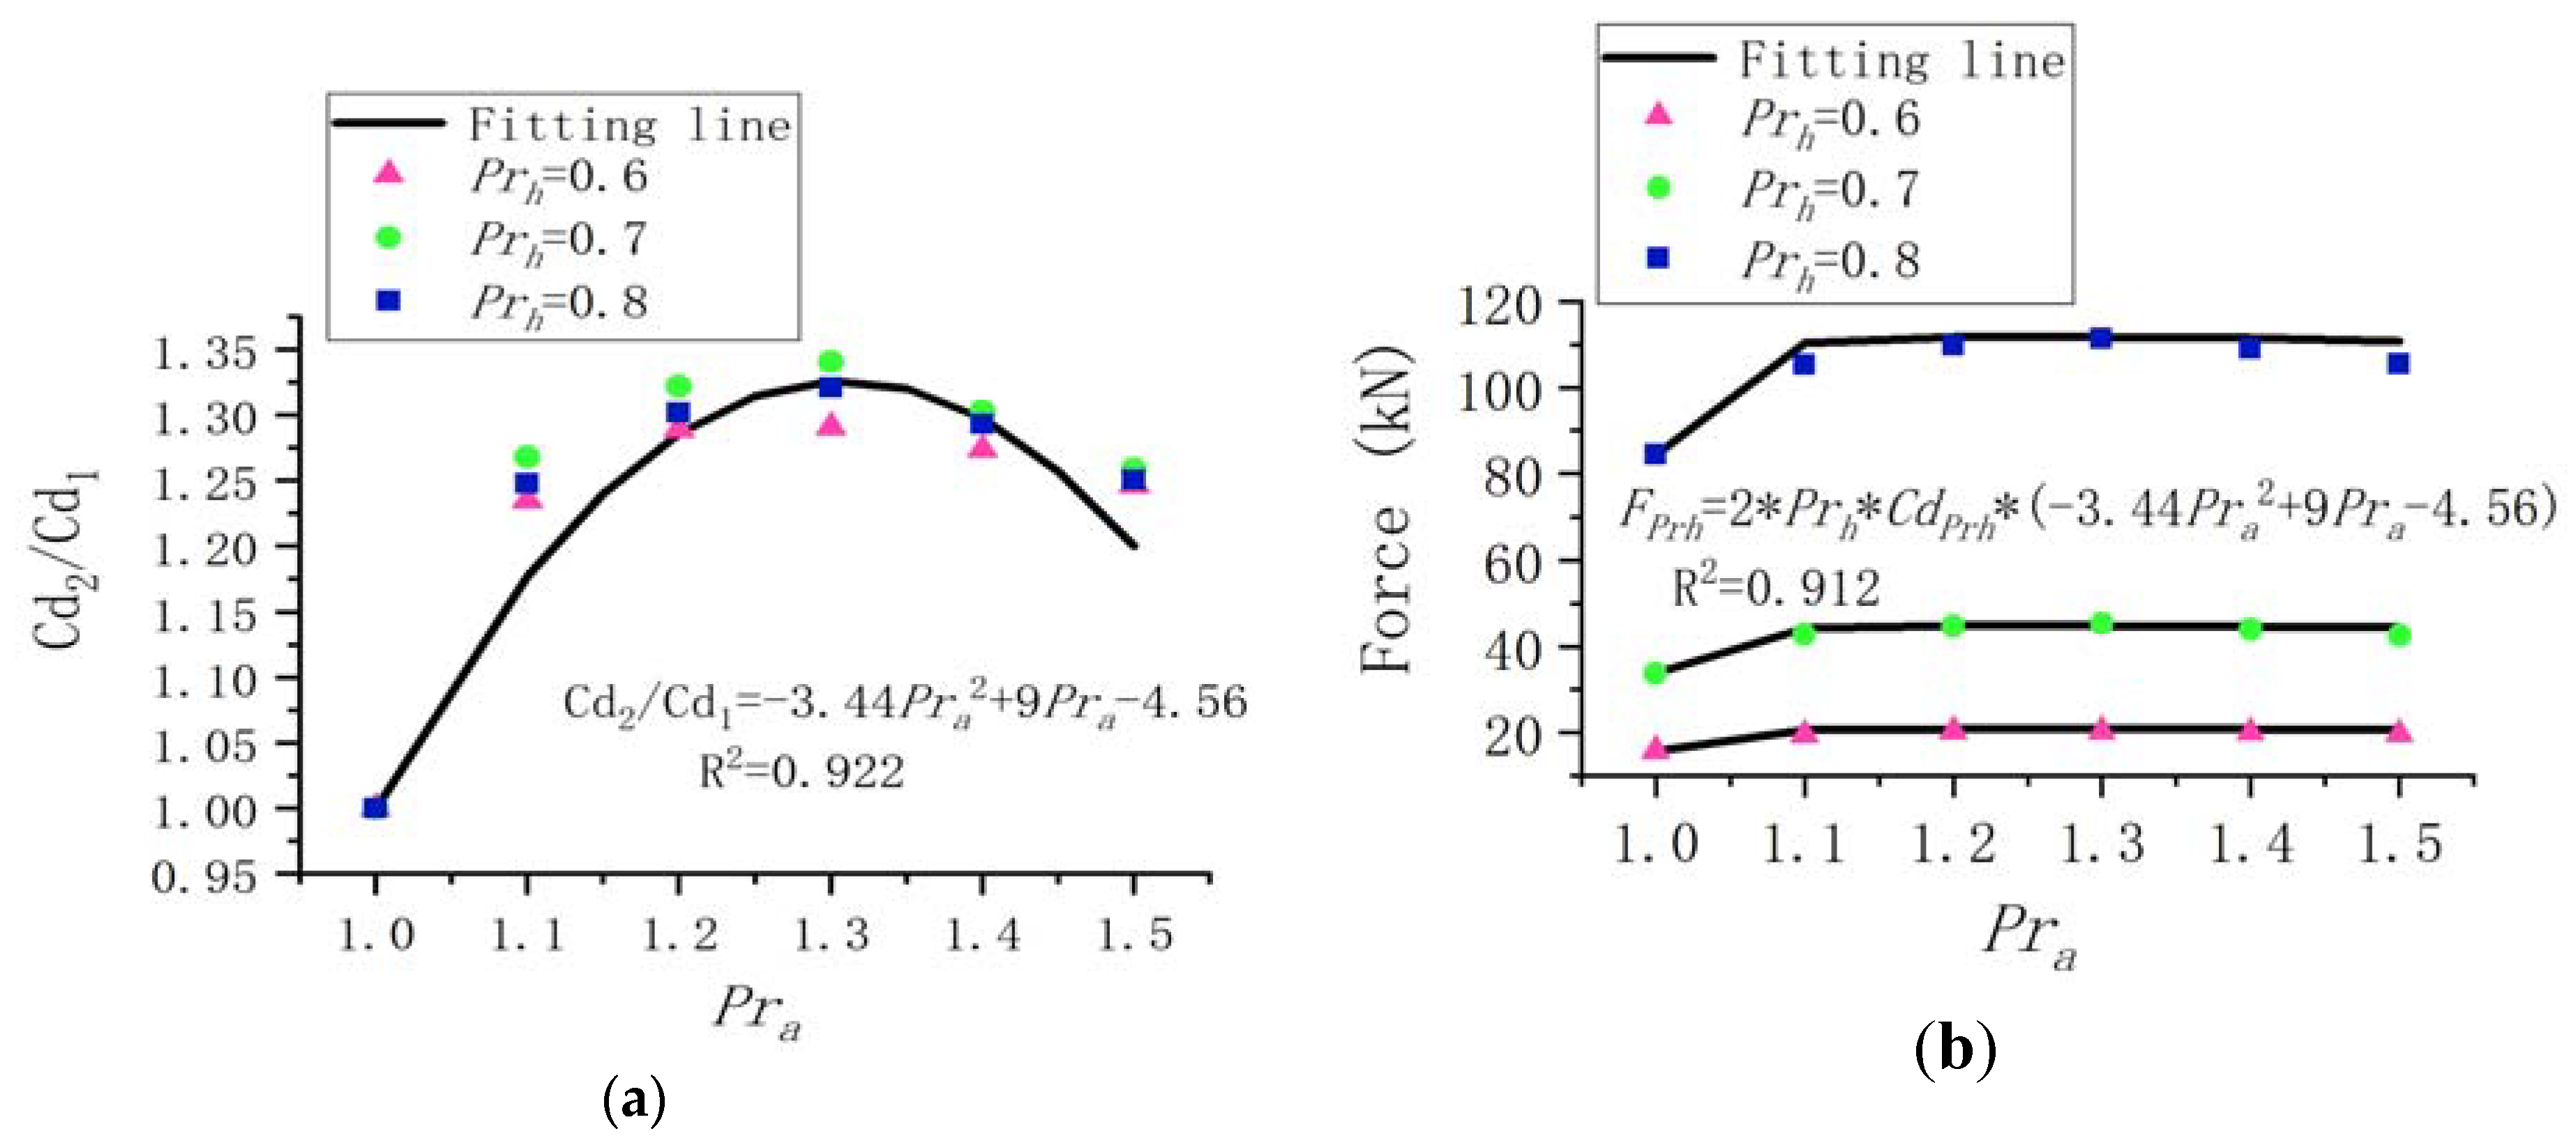
Area ratio (Pra): total area divided by vertical projection area.
(3)
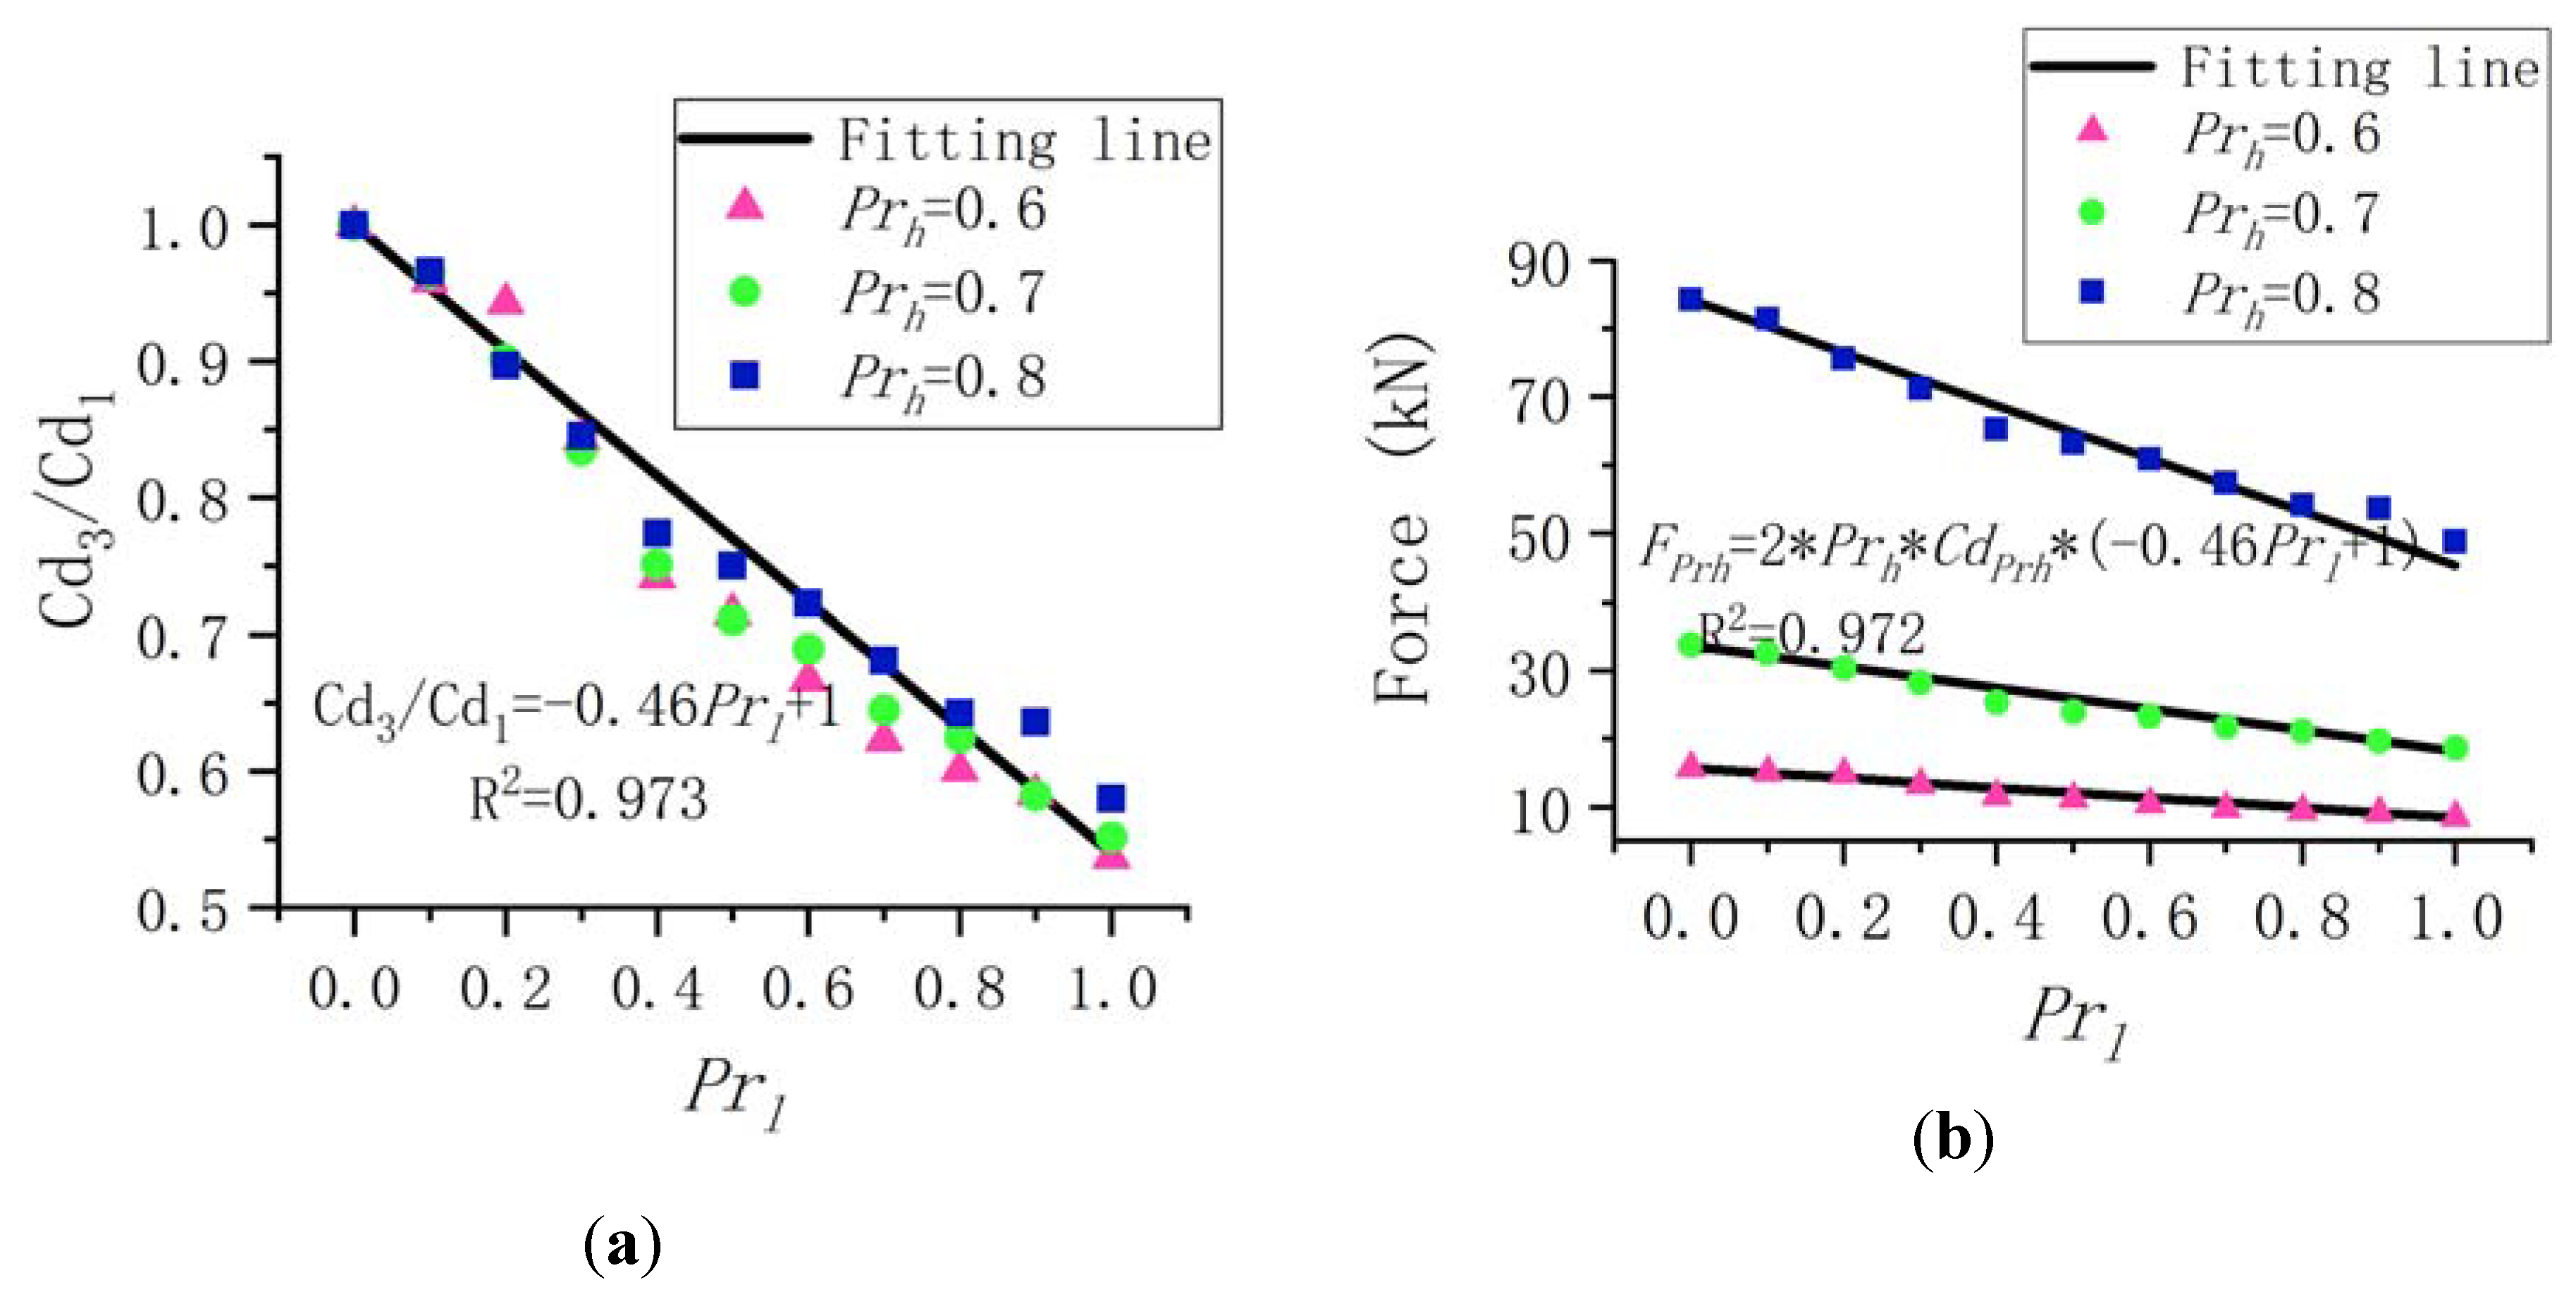
Inclination ratio (Prl): inclination distance divided by vertical height.
(4)
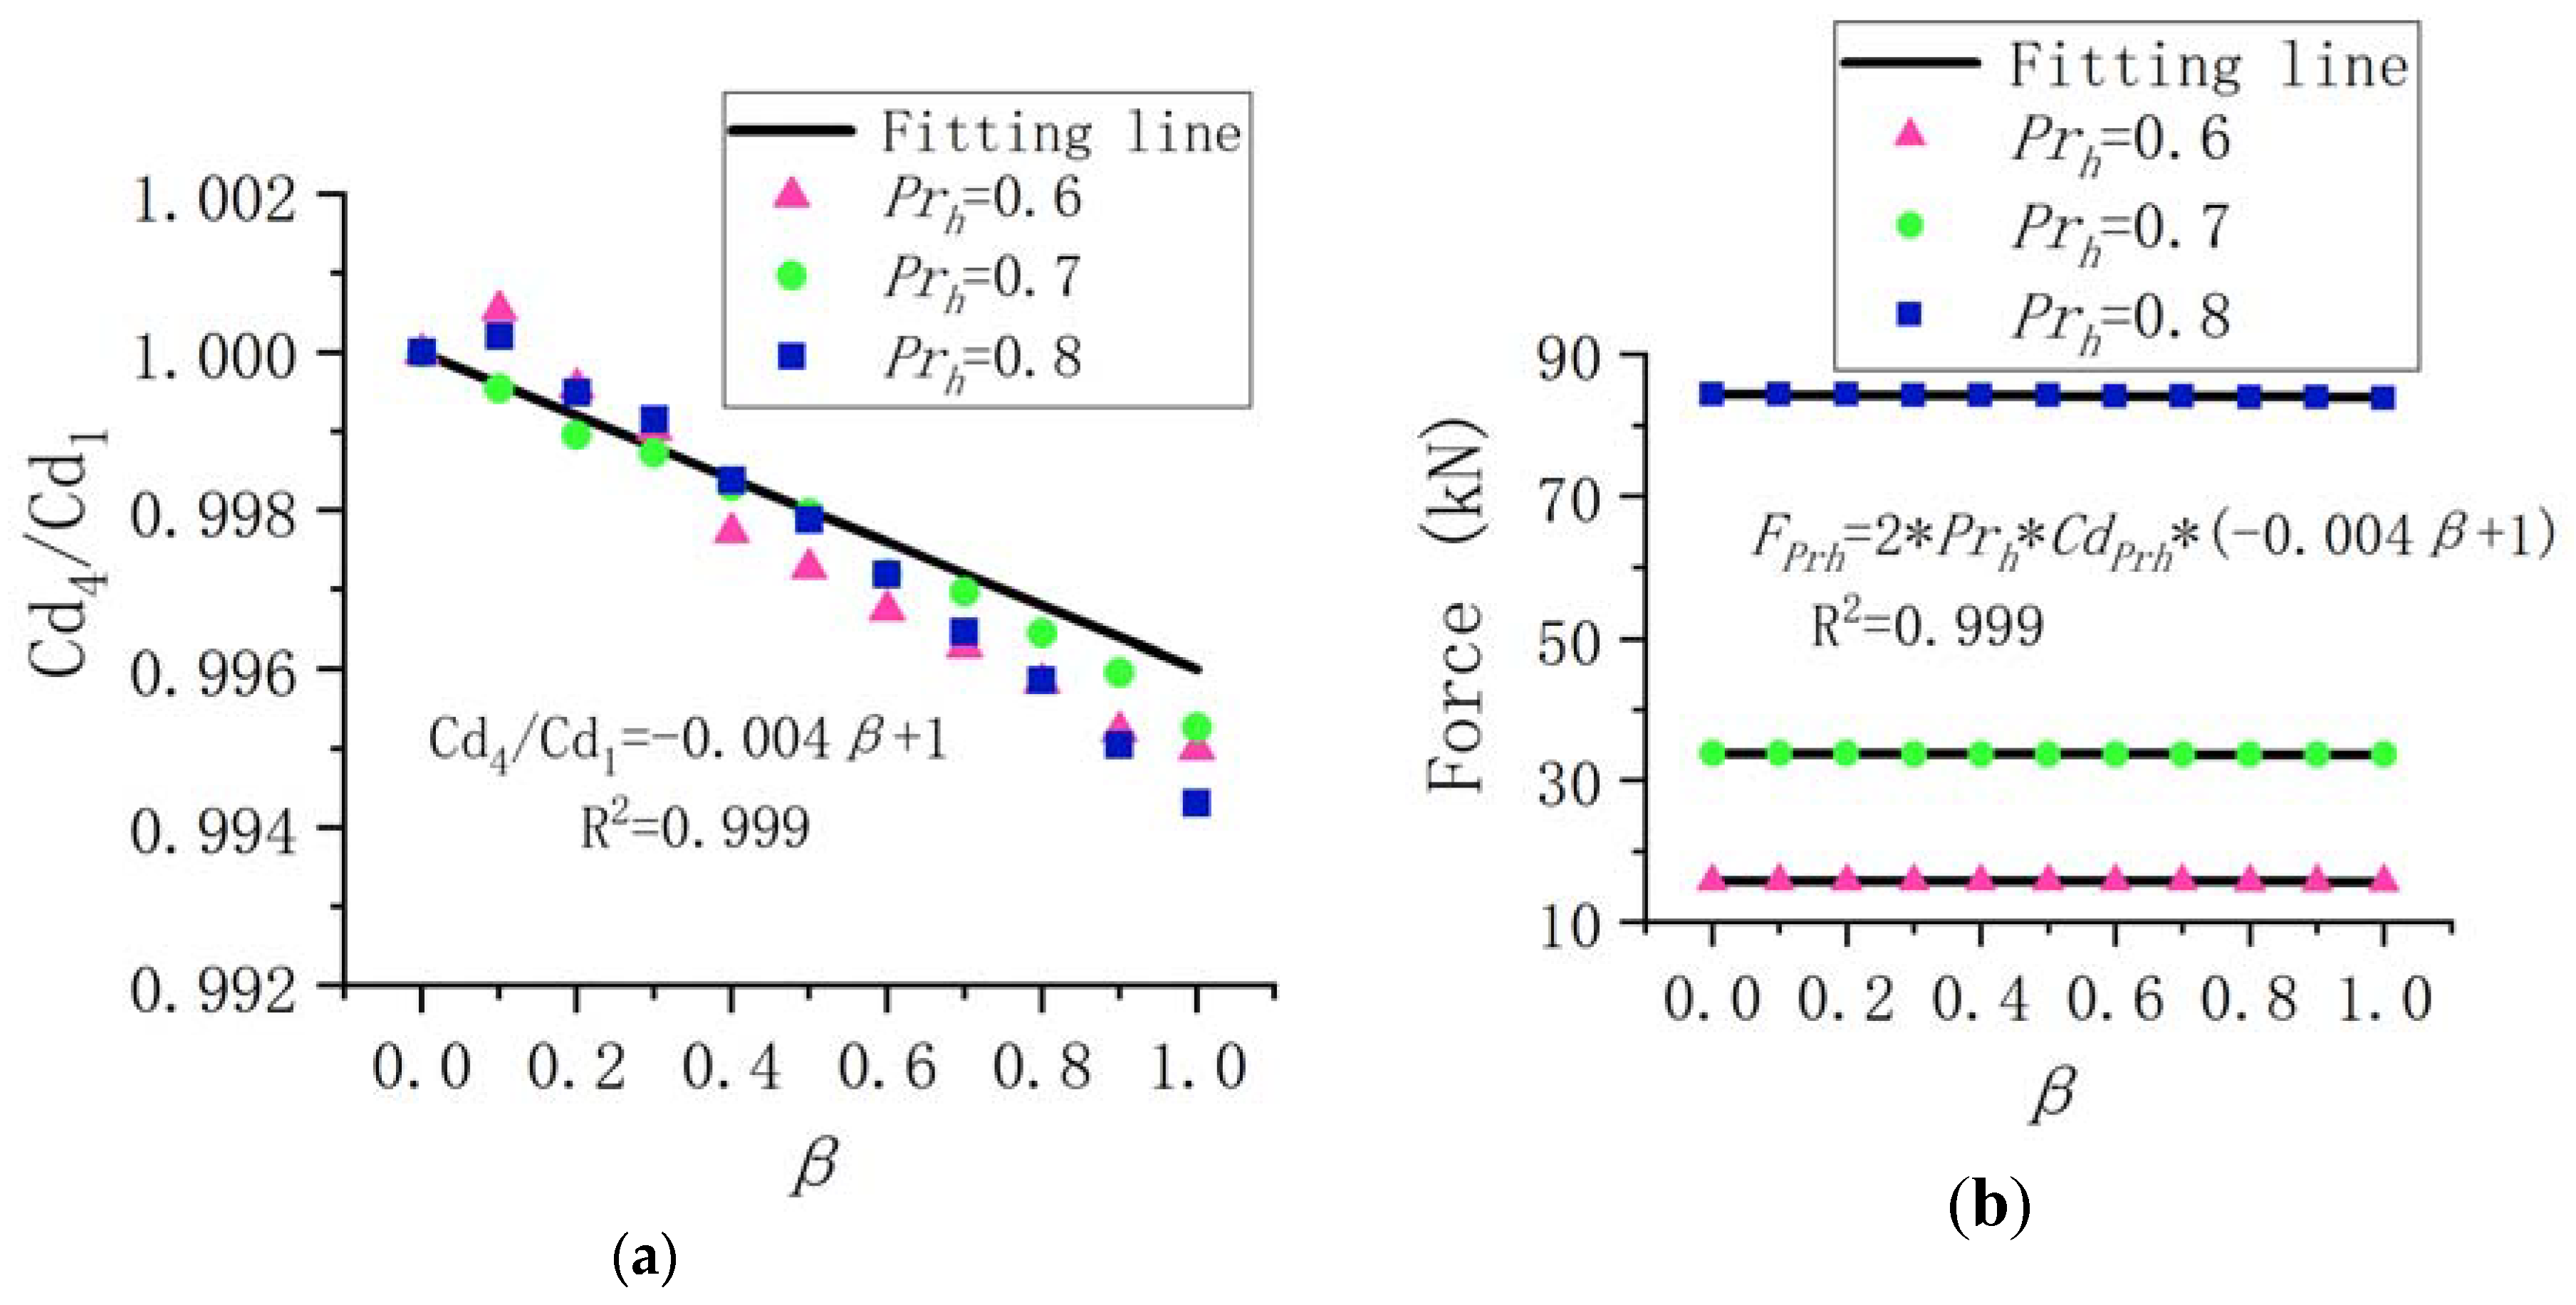
Water temperature stratification ratio (β): temperature difference between surface and bottom divided by water depth.
The formulas are shown as follows:
P r h = 0.5 ( D + b ) h 0.5 ( D + B ) H
P r a = 0.5 ( D + b ) l a 0.5 ( D + b ) h = l a h
P r l = l h
β = T t T b H
where Prh is the water blocking rate; Pra is the area ratio; Prl is the inclination ratio; β is the water temperature stratification ratio; H is the water depth (m); h is the water blocking height of the TCC (m); la is the arc length of the TCC (m); l is the slope distance (m); D is the base width of the cross section (m); B is the top width of the cross section (m); b is the top width of the TCC (m); Tt is the surface water temperature of the reservoir (°C); and Tb is the bottom water temperature (°C).

2.3. Numerical Simulation

2.3.1. Governing equations

Assuming that the fluid is not compressible, the continuity equation, momentum equation, and energy equation of fluid motion are as follows:
( u i ) x i = 0
( ρ u j ) t + ( ρ u i u j ) x j = P x j + μ x j [ u i x j + u j μ x i ]
T t + x i ( u i T ) = x i [ λ ρ C p T u i ] + S T C p
where u i and u j are the velocity components (m s−1); x i and x j are the position coordinates (m); P is the fluid pressure (Pa); t is the time (s); μ is the dynamic viscosity coefficient (Pa*s); T is the temperature (K); λ is the thermal conductivity [W/(m*K)]; C p is the specific heat of the water [J/(kg*K)]; and S T is the heat source term (kg*K/m3*s).

2.3.2. Model establishment and boundary conditions

A generalized numerical simulation of the reservoir with a trapezoidal section is established using computational fluid dynamics (CFD) software Fluent [25]. The trapezoidal cross-section has a top width of 78 m, a bottom width of 20 m and a water depth of 32.5 m. The calculation domain length is 165 m. To accurately simulate the flow, the grid is refined near the TCC area. The simulation model adopts an adaptive unstructured grid. The overall computing domain grid step size is 2 m, and the encrypted grid near TCC is 0.2 m. The total number of grids is approximately 2,210,000 (Figure 4).
As a flexible structure, the TCC can experience large deformation and small strain in a hydrodynamic environment. The physical experiments and previous studies [26,27] have shown that under tension boundary conditions and a stable flow environment, the TCC can maintain a relatively stable form. In the numerical simulation, the TCC is simplified to a solid wall boundary by ignoring the mechanical deformation due to the fluid-TCC interaction.
The inflow boundary condition of the numerical simulation is set as a mass flow inlet, and a mass flow outlet is adopted for the outflow boundary condition. The free surface in the computational domain is assumed to be a rigid cover, and a symmetrical boundary condition is set to simulate the free sliding wall. Fixed-wall boundary conditions simulate that the side and bottom surfaces are nonslip walls. The vertical temperature distribution is imported by editing a user-defined function (UDF).
The Reynolds stress turbulence model is adopted in this numerical simulation to ensure the accuracy of calculation. The SIMPLEC algorithm is applied for pressure-velocity coupling, and the second-order upwind scheme is selected for the discrete control equation. When the mean square deviation of the calculated results is less than 10−4 and the surface pressure of the model tends to be stable, the calculated results are assumed to have converged.

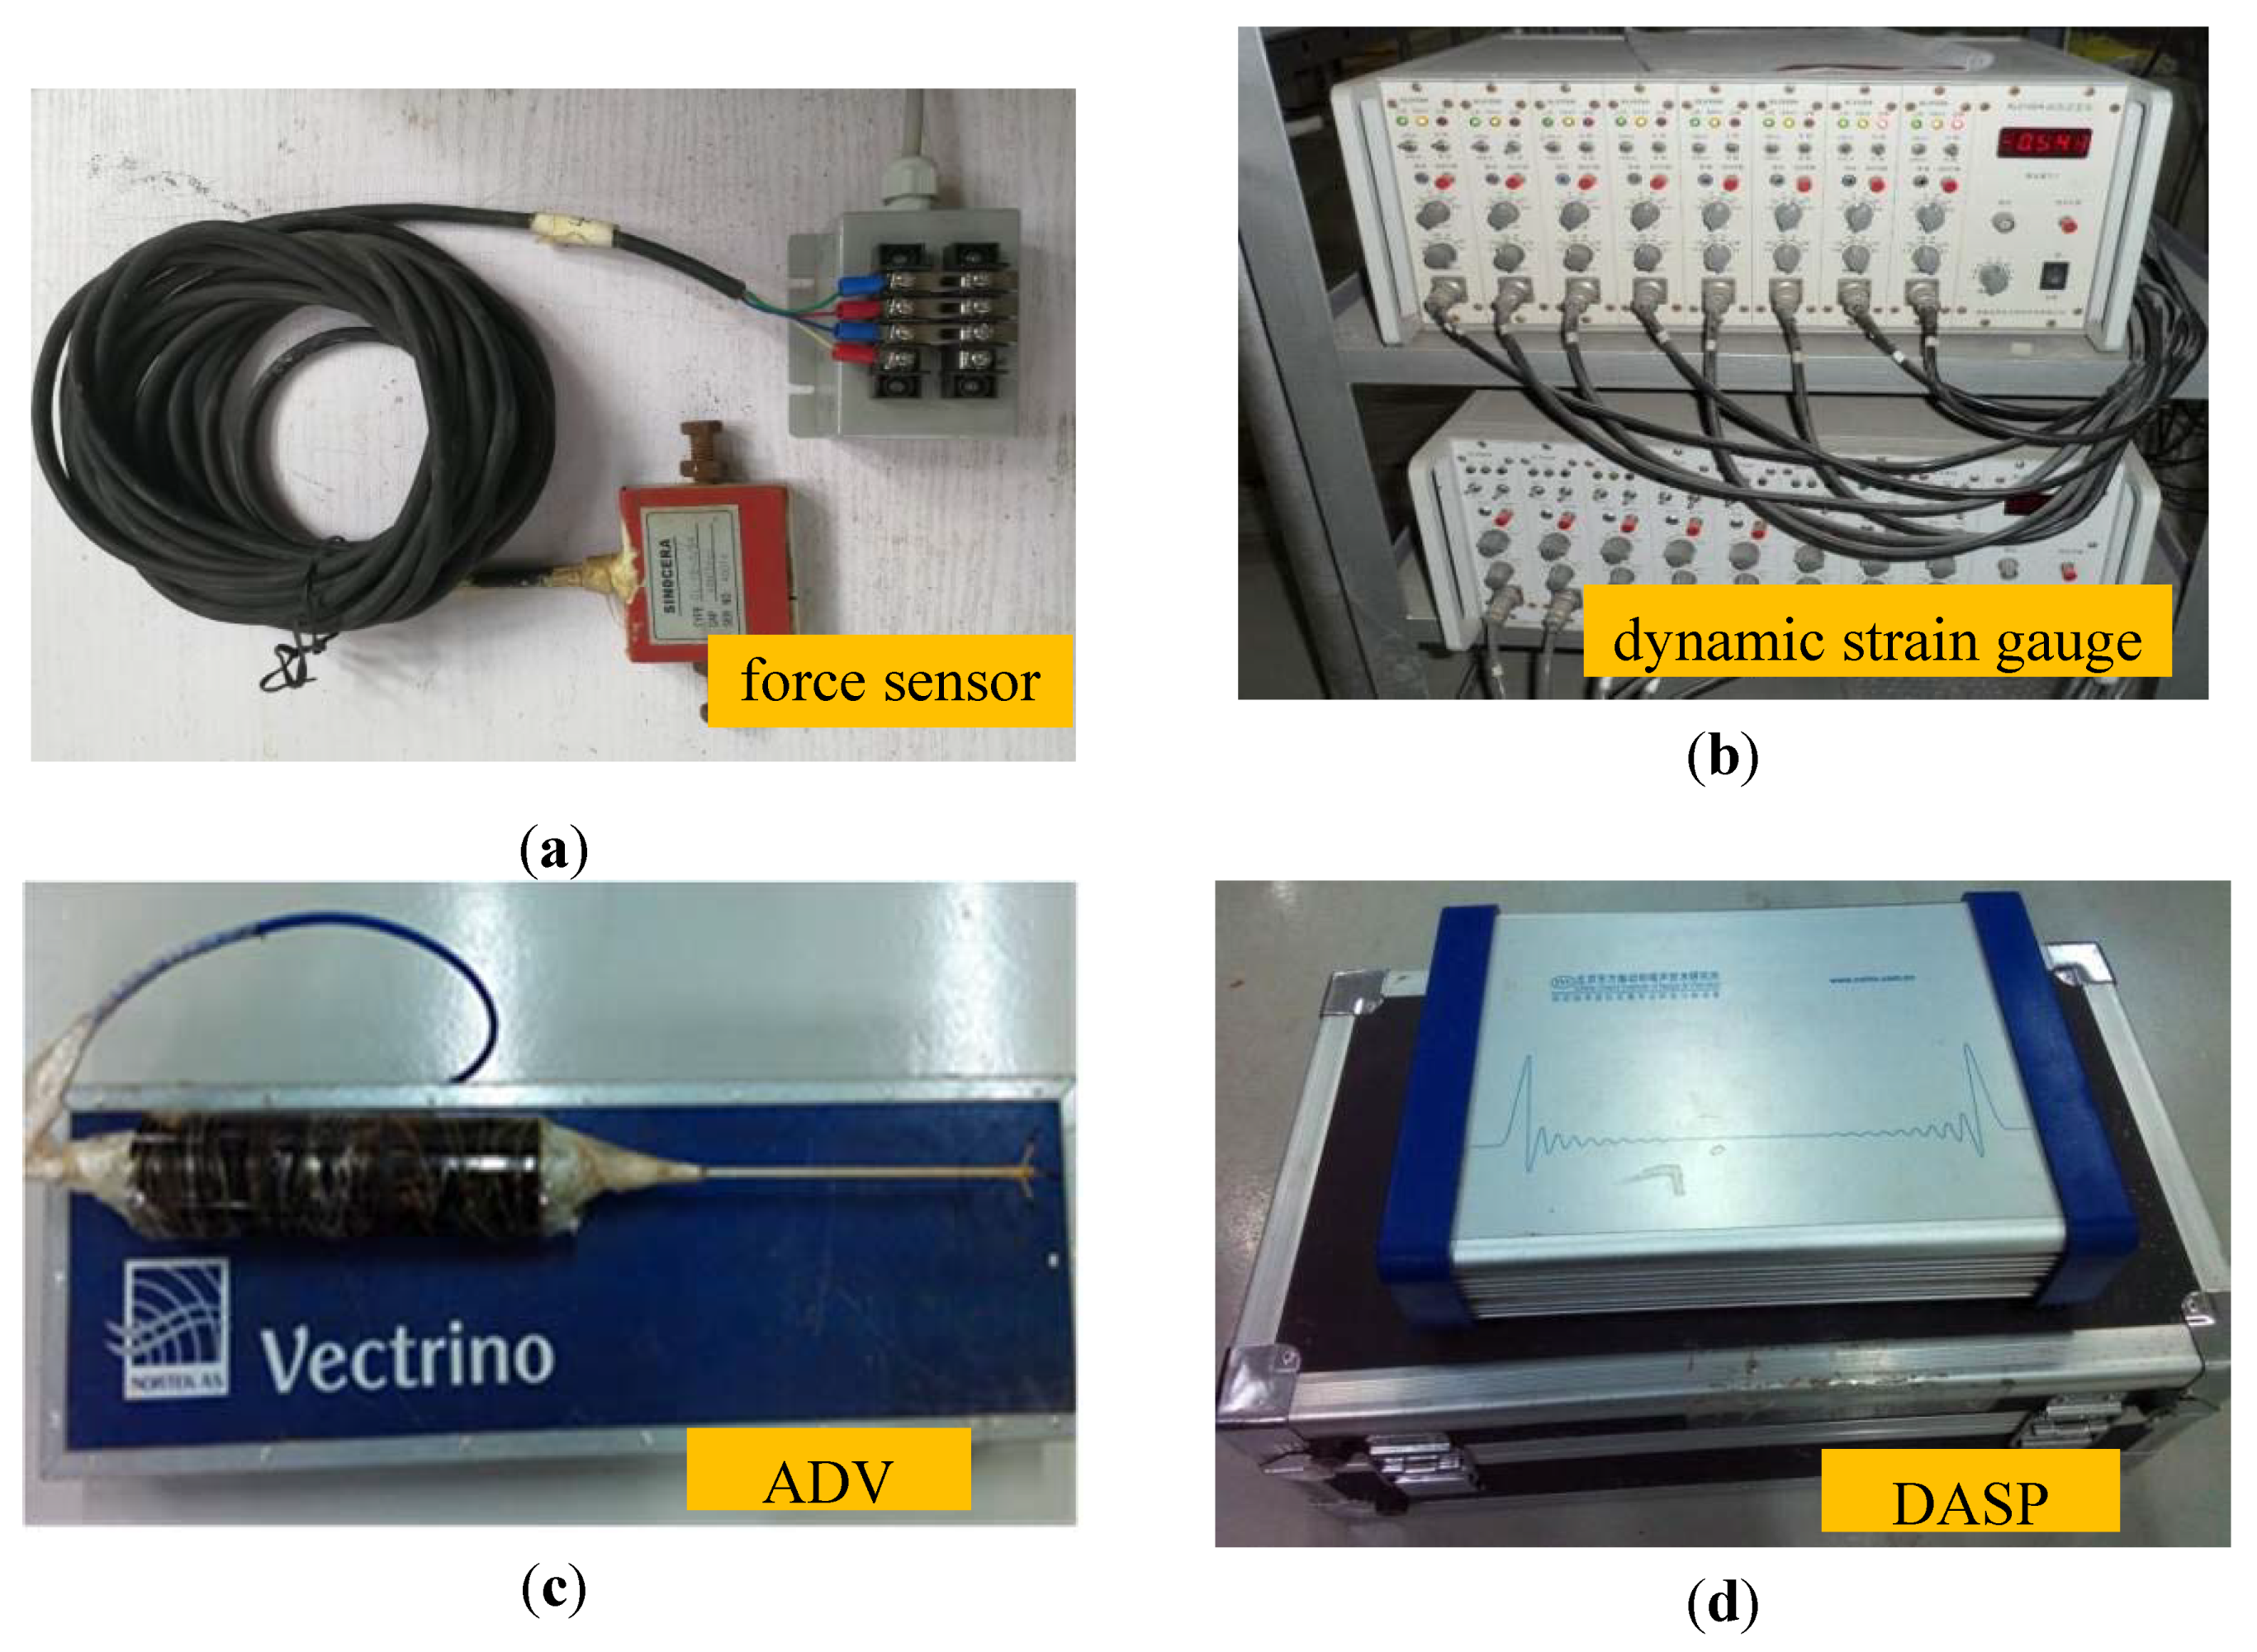
2.4. Physical Model Experiment

Load results of numerical simulation model are verified by physical model experiment. Physical model experiments can analyze the hydrodynamic field and the mechanical characteristics under variable TCC arrangement patterns by measuring the water velocities and loads [28]. The physical model experiment was performed at the Hydraulic Engineering Laboratory at Tianjin University, and the experimental model is shown in Figure 5. The experimental model is designed according to gravity similarity theory and with a geometric scale of 1/25 (Table 1).
The experimental instruments mainly include acoustic-doppler velocimeter (ADV), force sensors, a dynamic strain gauge, a flowmeter, and a digital alias-free signal processing (DASP) digital acquisition instrument (Figure 6). The experimental materials mainly include impermeable nylon cloth, nylon ropes, sensor support frames, a protractor and rubber blocks. The physical quantities measured by the physical model experiments include the flow velocity, pulling force, angle between pulling force and flow direction, gravity of the rubber block, bottom friction coefficient and water depth.
The TCC is connected to the force sensor through a nylon rope to measure the top tension. Three force measuring points are arranged above the curtain, connected to the left, middle and right parts of the curtain. Rubber blocks are located at the bottom of the structure to maintain stability of the TCC system. The bottom friction coefficient is 0.45, as determined through experimentation with rubber blocks and different weights. The load of the water flow on the TCC can be obtained by measuring the tension at the top, the angle between the nylon rope and the water flow direction, and the bottom friction force.
The load of the TCC at different flow velocities was measured under two working conditions in the physical model experiments. In the first working condition, the height of the water level, the flow depth above the curtain and the water blocking rate are 1.44 m, 0.16 m, and 0.828, respectively. In the second working condition, the height of the water level, the flow depth above the curtain and the water blocking rate are 1.3 m, 0.25 m, and 0.716, respectively. The scenarios and results of the physical model experiments are shown in Table 2.

2.5. Numerical Simulation Model Scenarios

The numerical simulation scenarios first select 11 groups corresponding to different water blocking rates varying between 0.3 and 0.8. Then, four influencing factors, the area ratio, inclination ratio, inflow velocity, and water temperature stratification ratio, are considered under three different water blocking rates (0.6, 0.7, 0.8). When one influencing factor varies, the others remain constant. Area ratios from 1.0 to 1.5 are tested via six groups. Inclination ratios between 0 and 1.0 are tested via 11 groups. Inflow velocities from 0.025 to 0.2 m/s are tested through eight groups. Water temperature stratification ratios from 0 to 1.0 are tested via 11 groups. In total, there are 119 numerical simulation scenarios, and the details are summarized in Table 3.

2.6. Resistance Equation

The flow-around motion of submerged structures is a classical subject in hydrodynamics, and the resistance equation for hydropower and coastal engineering problems has previously been summarized [29,30]. As a type of water blocking structure, the TCC induces similar hydrodynamic characteristics as those of flow-around motion. The resistance equation is as follows:
F = q A = C d 1 2 ρ v 2 A
where F is the time-averaged force (N); A is the water blocking area (m2); q is the time-averaged uniform pressure (N/m2); Cd is the time-averaged drag coefficient; v is the average cross-sectional velocity (m/s); and ρ is the water density (kg/m3).
The drag coefficient (Cd) is the key factor in determining the load of a TCC. Cd is calculated according to the resistance equation, force F and velocity. Research on the drag coefficient of different TCC arrangements has an important influence on the design, construction and safety evaluation of TCC engineering.

3. Results

3.1. Model Validation

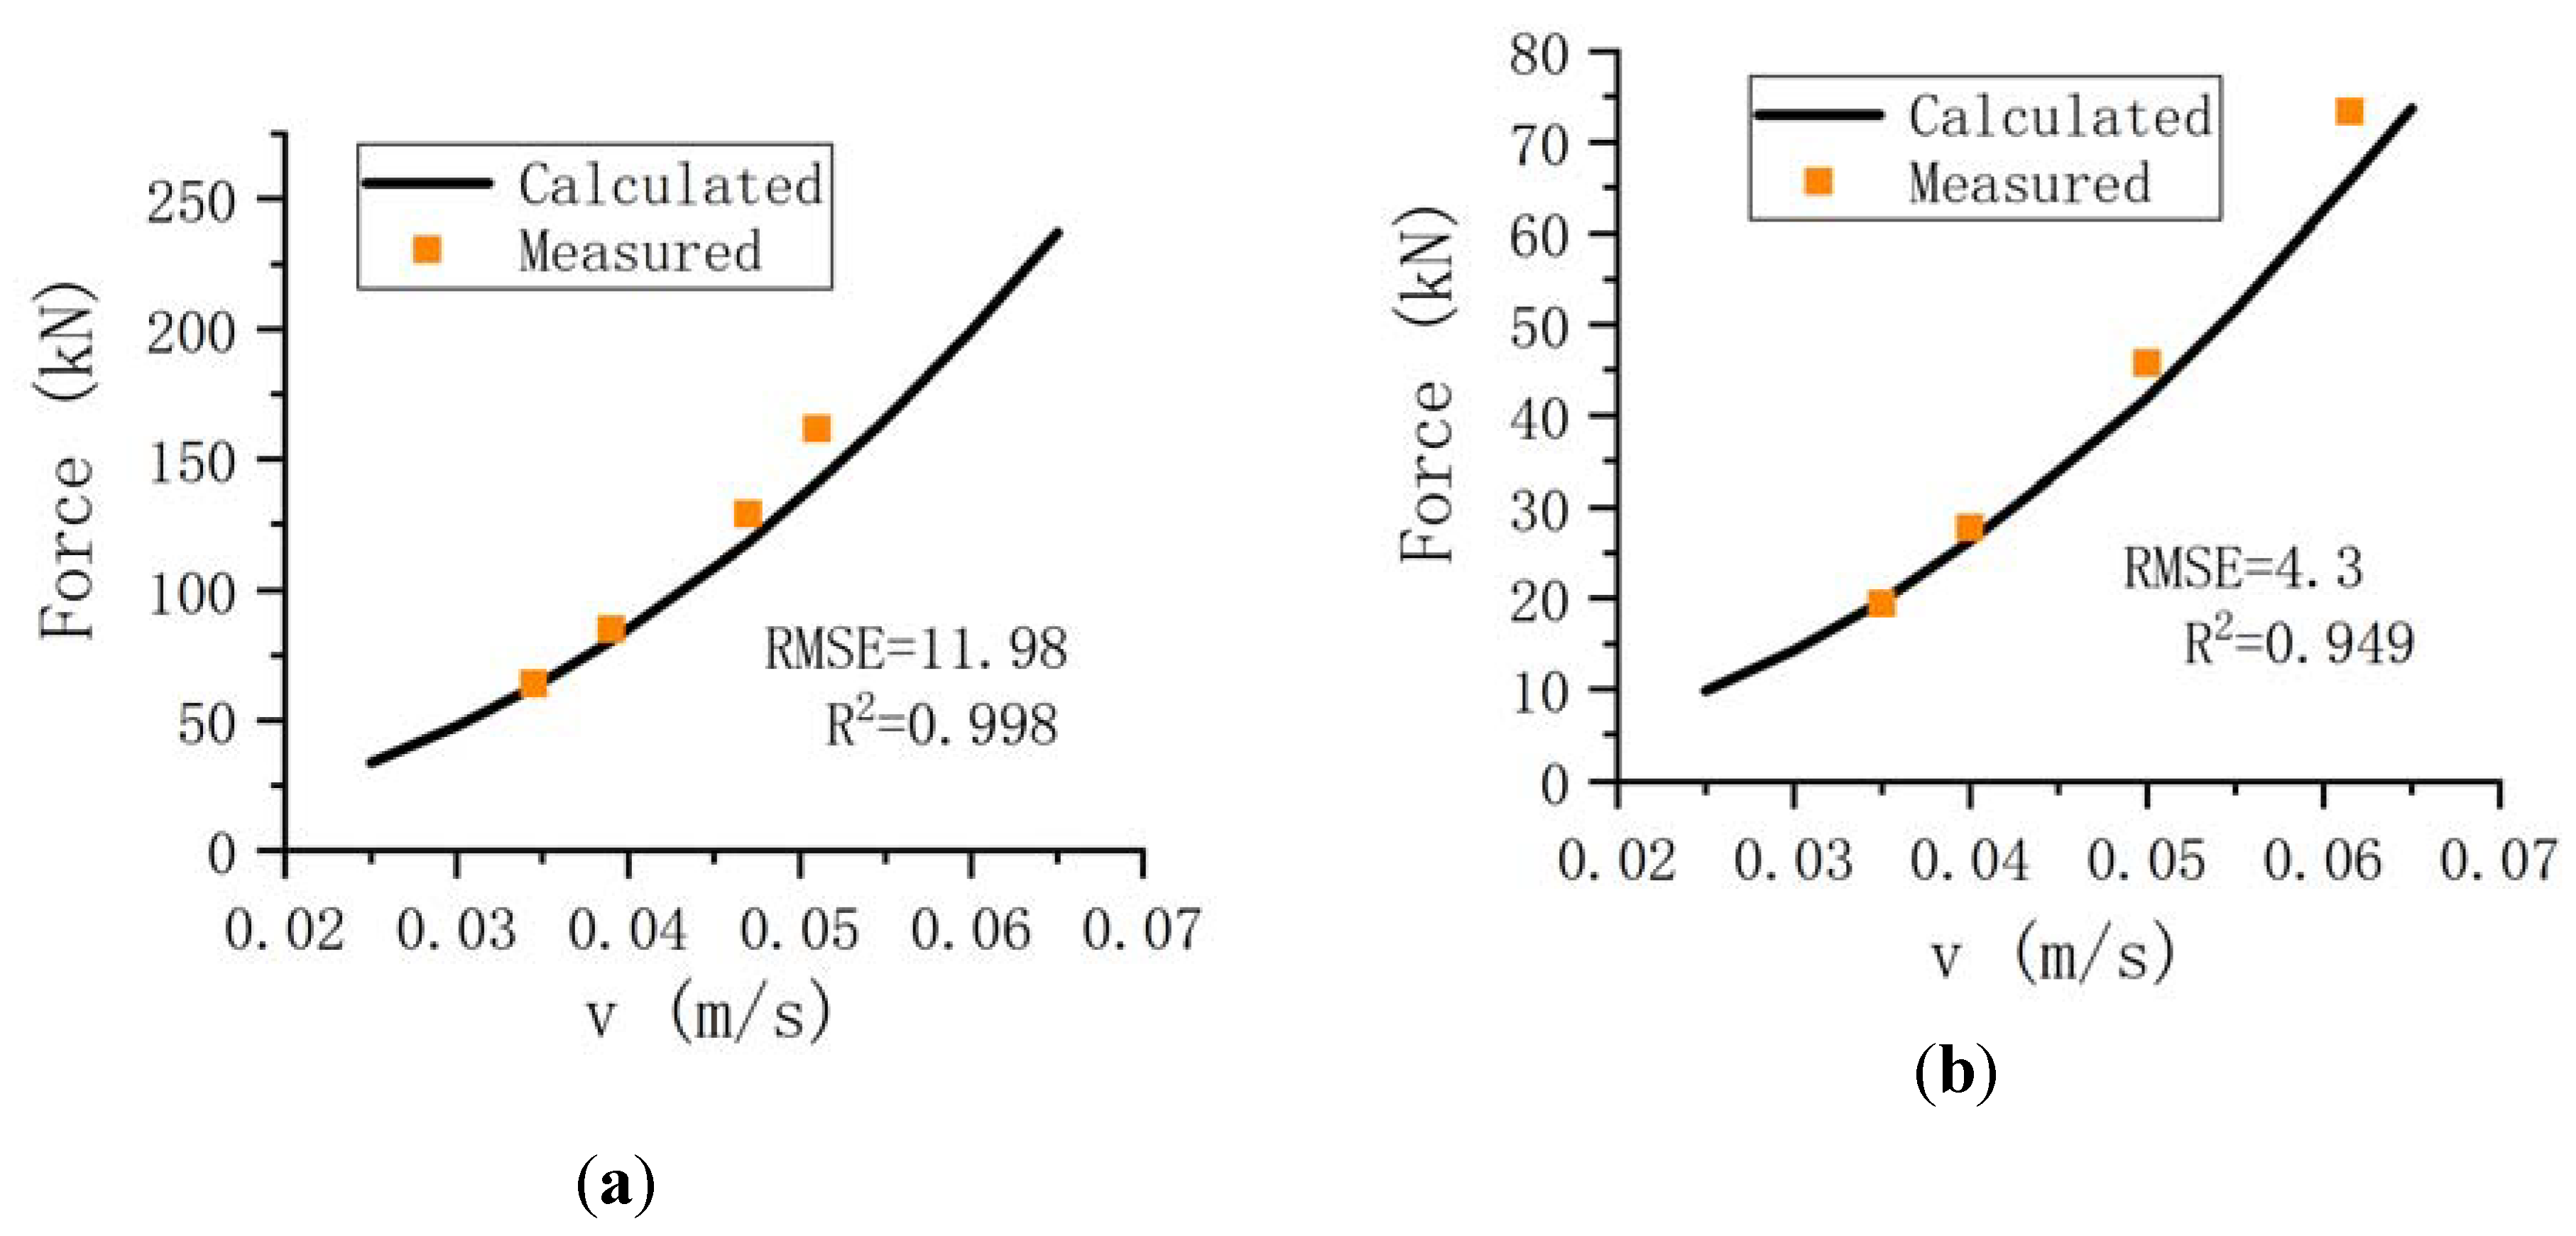
3.1.1. Physical model experiment verification

According to the similarity criterion, the experimental data are converted into prototype data and compared with the numerical simulation results. The measured data and simulation results are analyzed by the root mean squared error (RMSE) and coefficient of determination (R2). The closer the coefficient of determination (R2) is to 1, the better the fit between the measured values and simulation values.
A comparison between the numerical simulation values and experimentally measured values (converted into prototype values) of the load is shown in Figure 7. When the water blocking ratio is 0.8264, the maximum relative error of the load is less than 13%, the average relative error is 7%, the RMSE is less than 12 kN, and the R2 is greater than 0.96. Under the condition of a water blocking ratio of 0.716, the maximum relative error is less than 11%, the average relative error is 6.27%, the RMSE is less than 4.3 kN, and the R2 is greater than 0.94. The numerical simulation results fit the experimentally measured data well, which means that the numerical simulation results are dependable. The simulation model can predict the load, and the following research results are accurate and reliable.

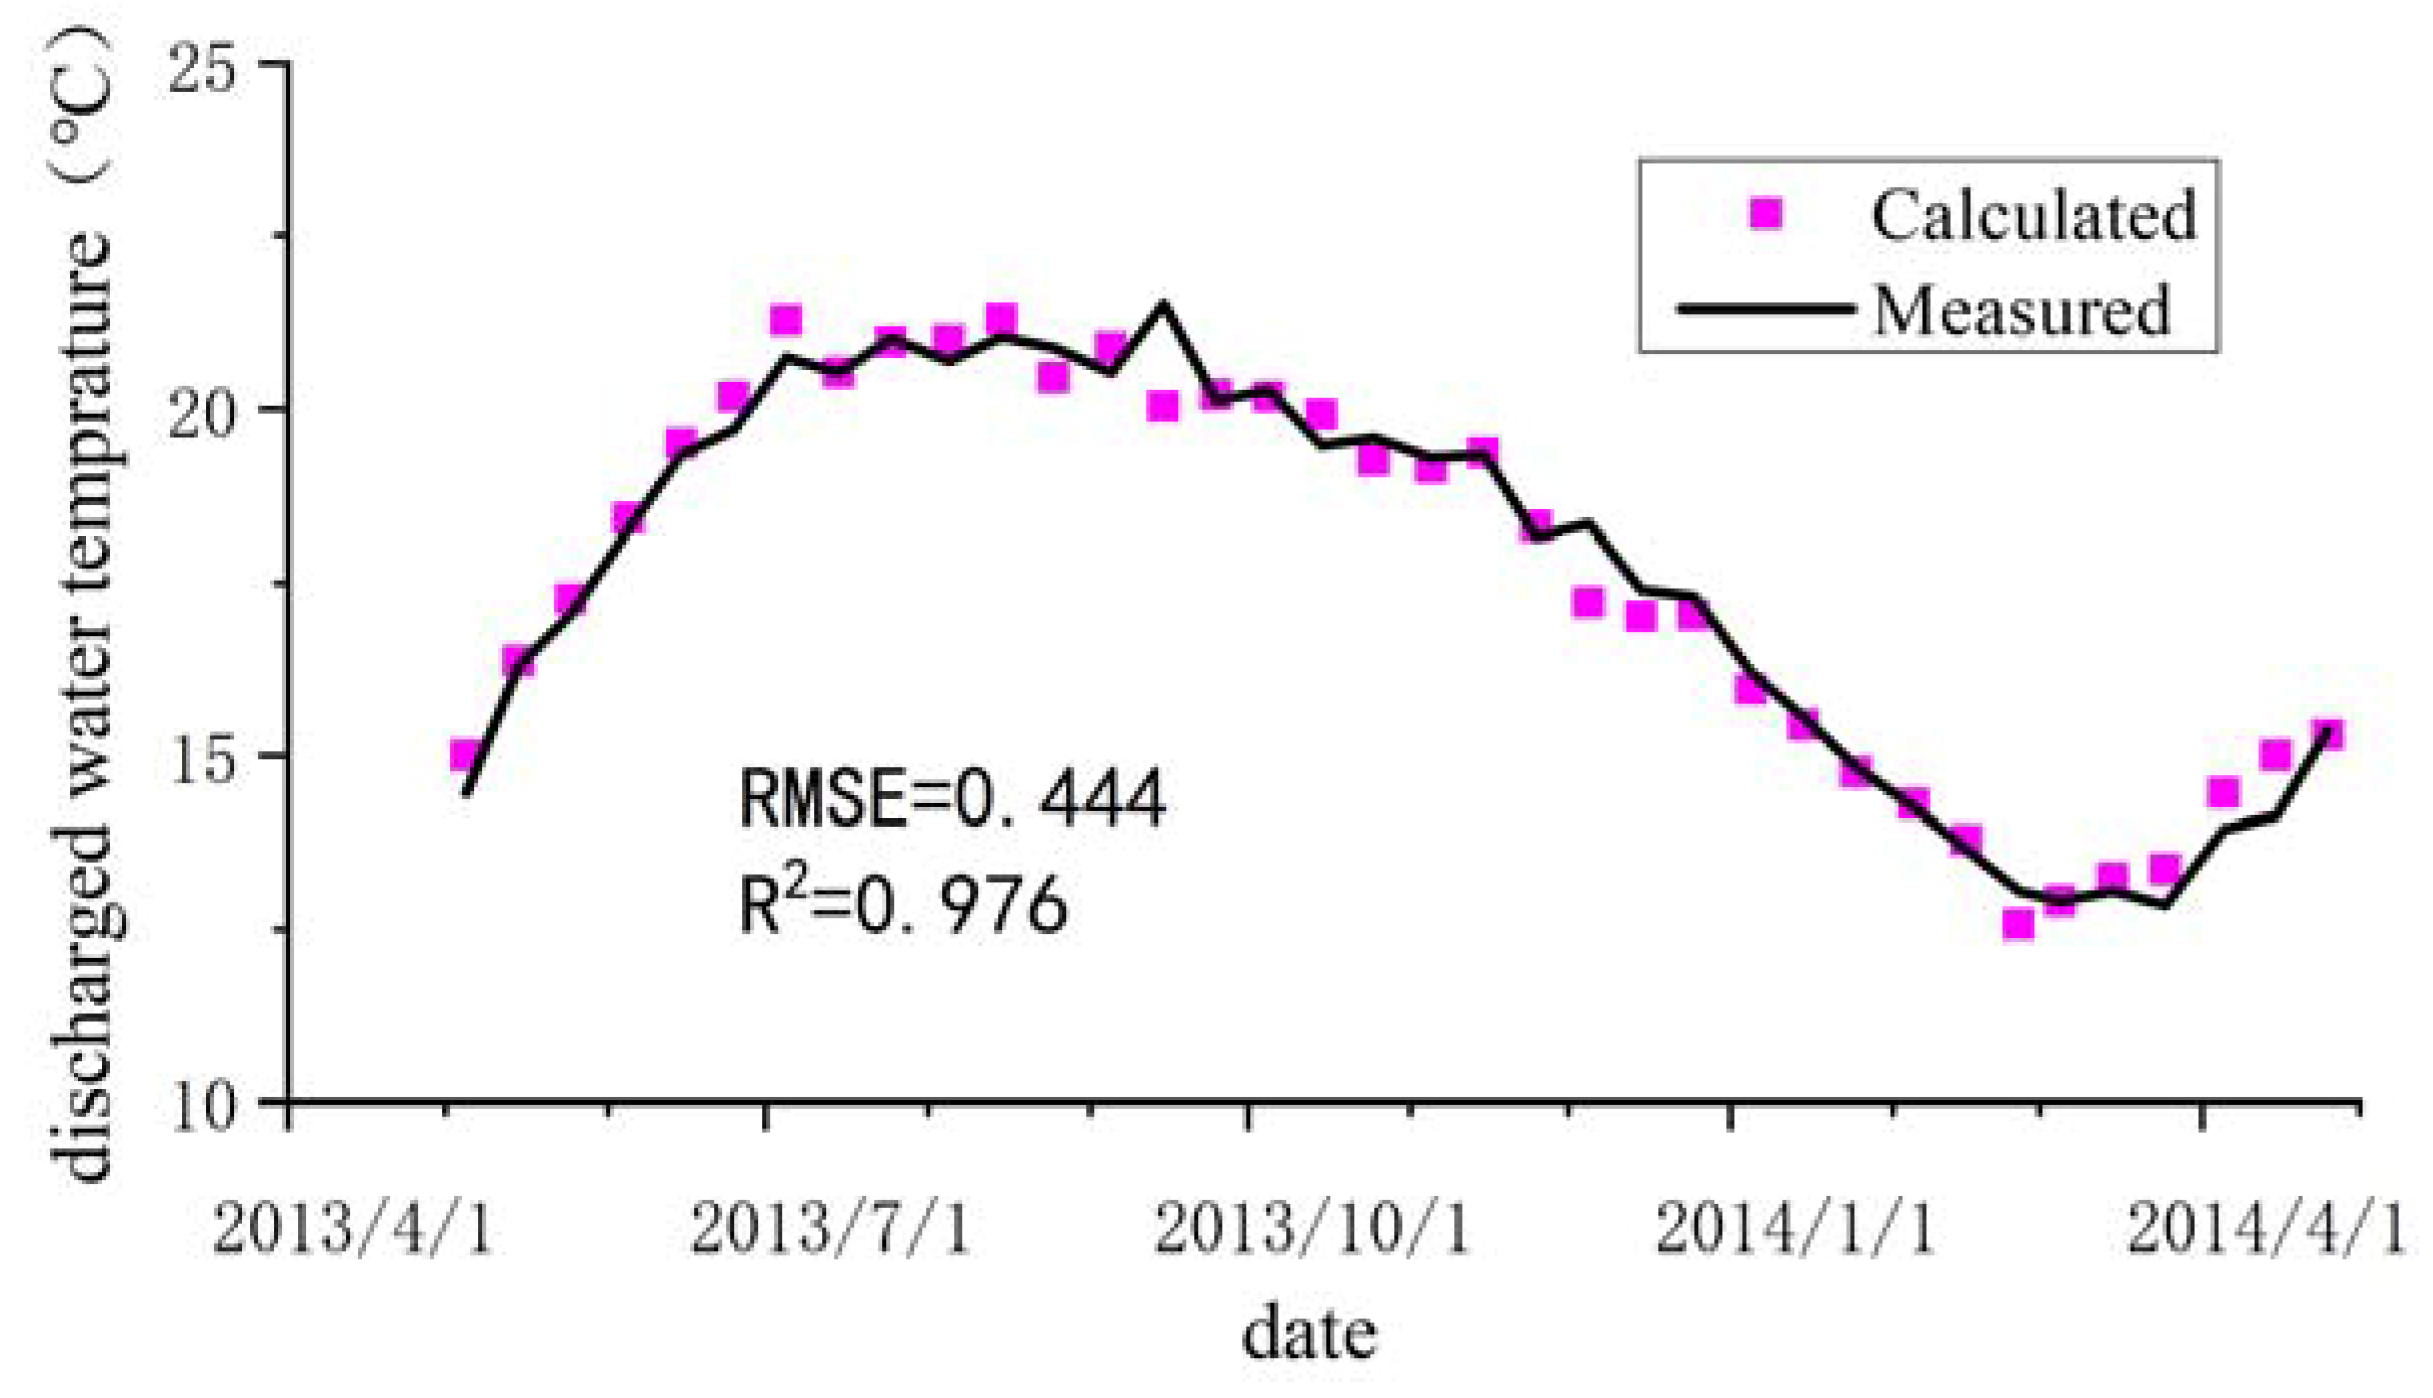
3.1.2. Prototype observation verification

Discharged water temperature of numerical simulation model is verified by prototype observation. Taking the prototype measured water level, outflow discharge and vertical water temperature distribution from May 2013 to April 2014 as boundary conditions, the discharged water temperature is calculated by the numerical simulation model. To ensure the accuracy of the numerical model, the simulation-calculated values are compared with the prototype observation of reservoir outflow water temperature, as shown in Figure 8. The RMSE is 0.444 °C, and the R2 is 0.976, which indicates that the simulation model error is acceptable. The satisfactory results show that the simulation calculation model can properly simulate the vertical temperature distribution and discharged water temperature of stratified reservoirs.

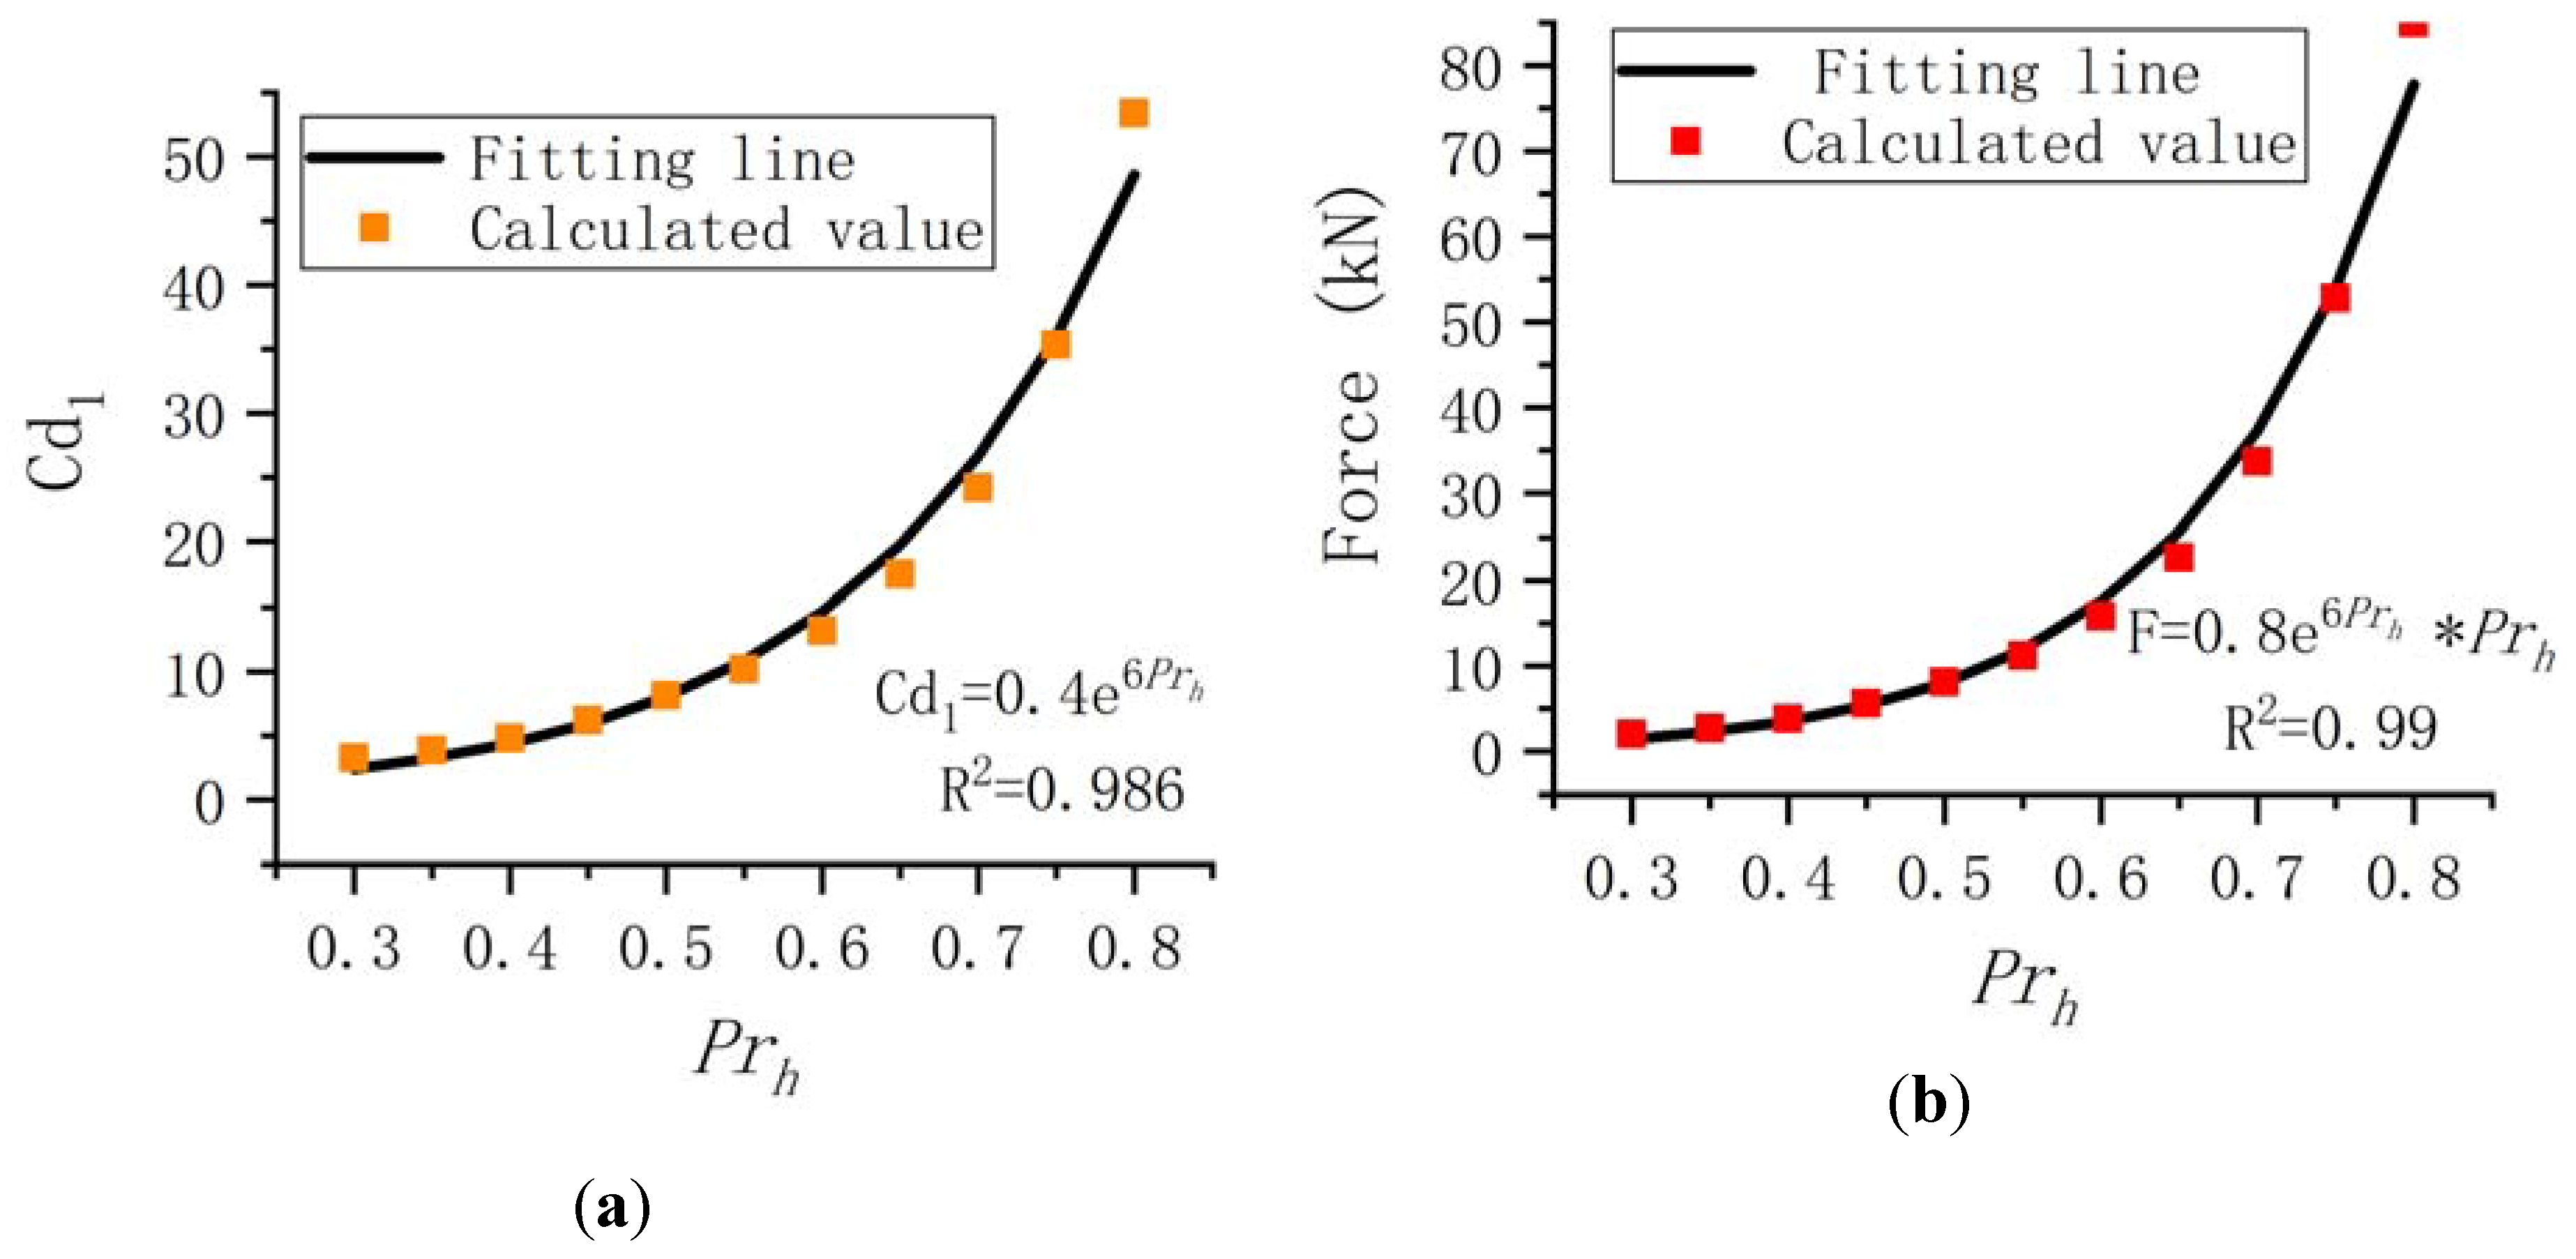
3.2. Effect of Water Blocking Rate

As a water retaining structure, the water blocking rate of a TCC is the main feature of its water retaining capacity. The water blocking rate of the bottom TCC is generally between 0.3 and 0.8 [31], which will affect the temperature increase effect if it is too low and will affect the water flow if it is too high. Assuming that when water blocking rate (Prh) varies, the other main parameters remain constant. According to Table 3, the inflow velocity (v) is uniform and the value is 0.05 m/s, the area ratio (Pra) is 1.0, the inclination ratio (Prl) is 0, and the water temperature stratification ratio (β) is 0. The TCC load (F) of various Prh is measured at the same inflow velocity (v = 0.05 m/s). From resistance equation F = q A = C d 1 2 ρ v 2 A , Where A = P r h A T (AT is the cross-section area (m2)); Cd for each Prh is calculated according to the given force (F), inflow velocity (v) and cross-section area (AT). Then from that we can further calculate F for any velocity using the Cd obtained. Figure 9 shows that as the water blocking rate increases, the drag coefficient and the load increase significantly. To analyze the effect of the water blocking rate, a fitting formula is investigated to quantify the relationship between the water blocking rate and the drag coefficient. The results of the fitting formula show that the change in the drag coefficient obeys an exponential growth function at different water blocking rates. According to the fitting formula, the drag coefficient can be calculated based on the corresponding water blocking rate.

3.3. Effect of Area Ratio

In a stable hydrodynamic environment, the TCC will take on a specific shape. In general, as the inflow velocity increases, the TCC deformation increases, and the area ratio increases. When the water blocking rate is constant, the curtain load can be accurately predicted by analyzing the influences of different area ratios on the drag coefficient. The range of area ratio is 1.0~1.5, and the step size is 0.1. Assuming that when area ratio (Pra) varies, the other main parameters remain constant. According to Table 3, the inflow velocity (v) is uniform and the value is 0.05 m/s, the water blocking rate (Prh) is 0.6, 0.7, and 0.8, respectively, the inclination ratio (Prl) is 0, and the water temperature stratification ratio (β) is 0. For the convenience of comparison, the calculated drag coefficient is normalized; that is, the calculated drag coefficient is divided by the basic working condition drag coefficient. As the area ratio increases, the drag coefficient first increases and then decreases (Figure 10). When the area ratio is 1.3, the drag coefficient reaches a maximum value of 1.35. A fitting formula is investigated to quantify the effect of the area ratio on the drag coefficient. The results of the fitting formula show that the change in the drag coefficient obeys a quadratic function at different area ratios. When the inflow velocity remains constant, the relationship between the TCC load and the area ratio also follows a quadratic function. The area ratio mainly influences the drag coefficient, thus affecting the load.

3.4. Effect of Inclination Ratio

In a dynamic water environment, the upper part of the TCC will have a certain offset from the lower stable pier. In general, as the inflow velocity increases, the inclination distance increases, and the inclination ratio increases. The range of inclination ratio is 0~1.0, and the step size is 0.1. The assumptions are similar to the area ratio. As the inclination ratio increases, the drag coefficient decreases linearly (Figure 11). When the inclination ratio is 0, the calculated maximum drag coefficient is 1. A fitting formula is investigated to quantify the effect of the inclination ratio on the drag coefficient. The results of the fitting formula show that the change in the drag coefficient obeys a linear distribution and linearly decreases at different inclination ratios. When the inflow velocity remains constant, the relationship between the TCC load and the inclination ratio also follows a linear function.

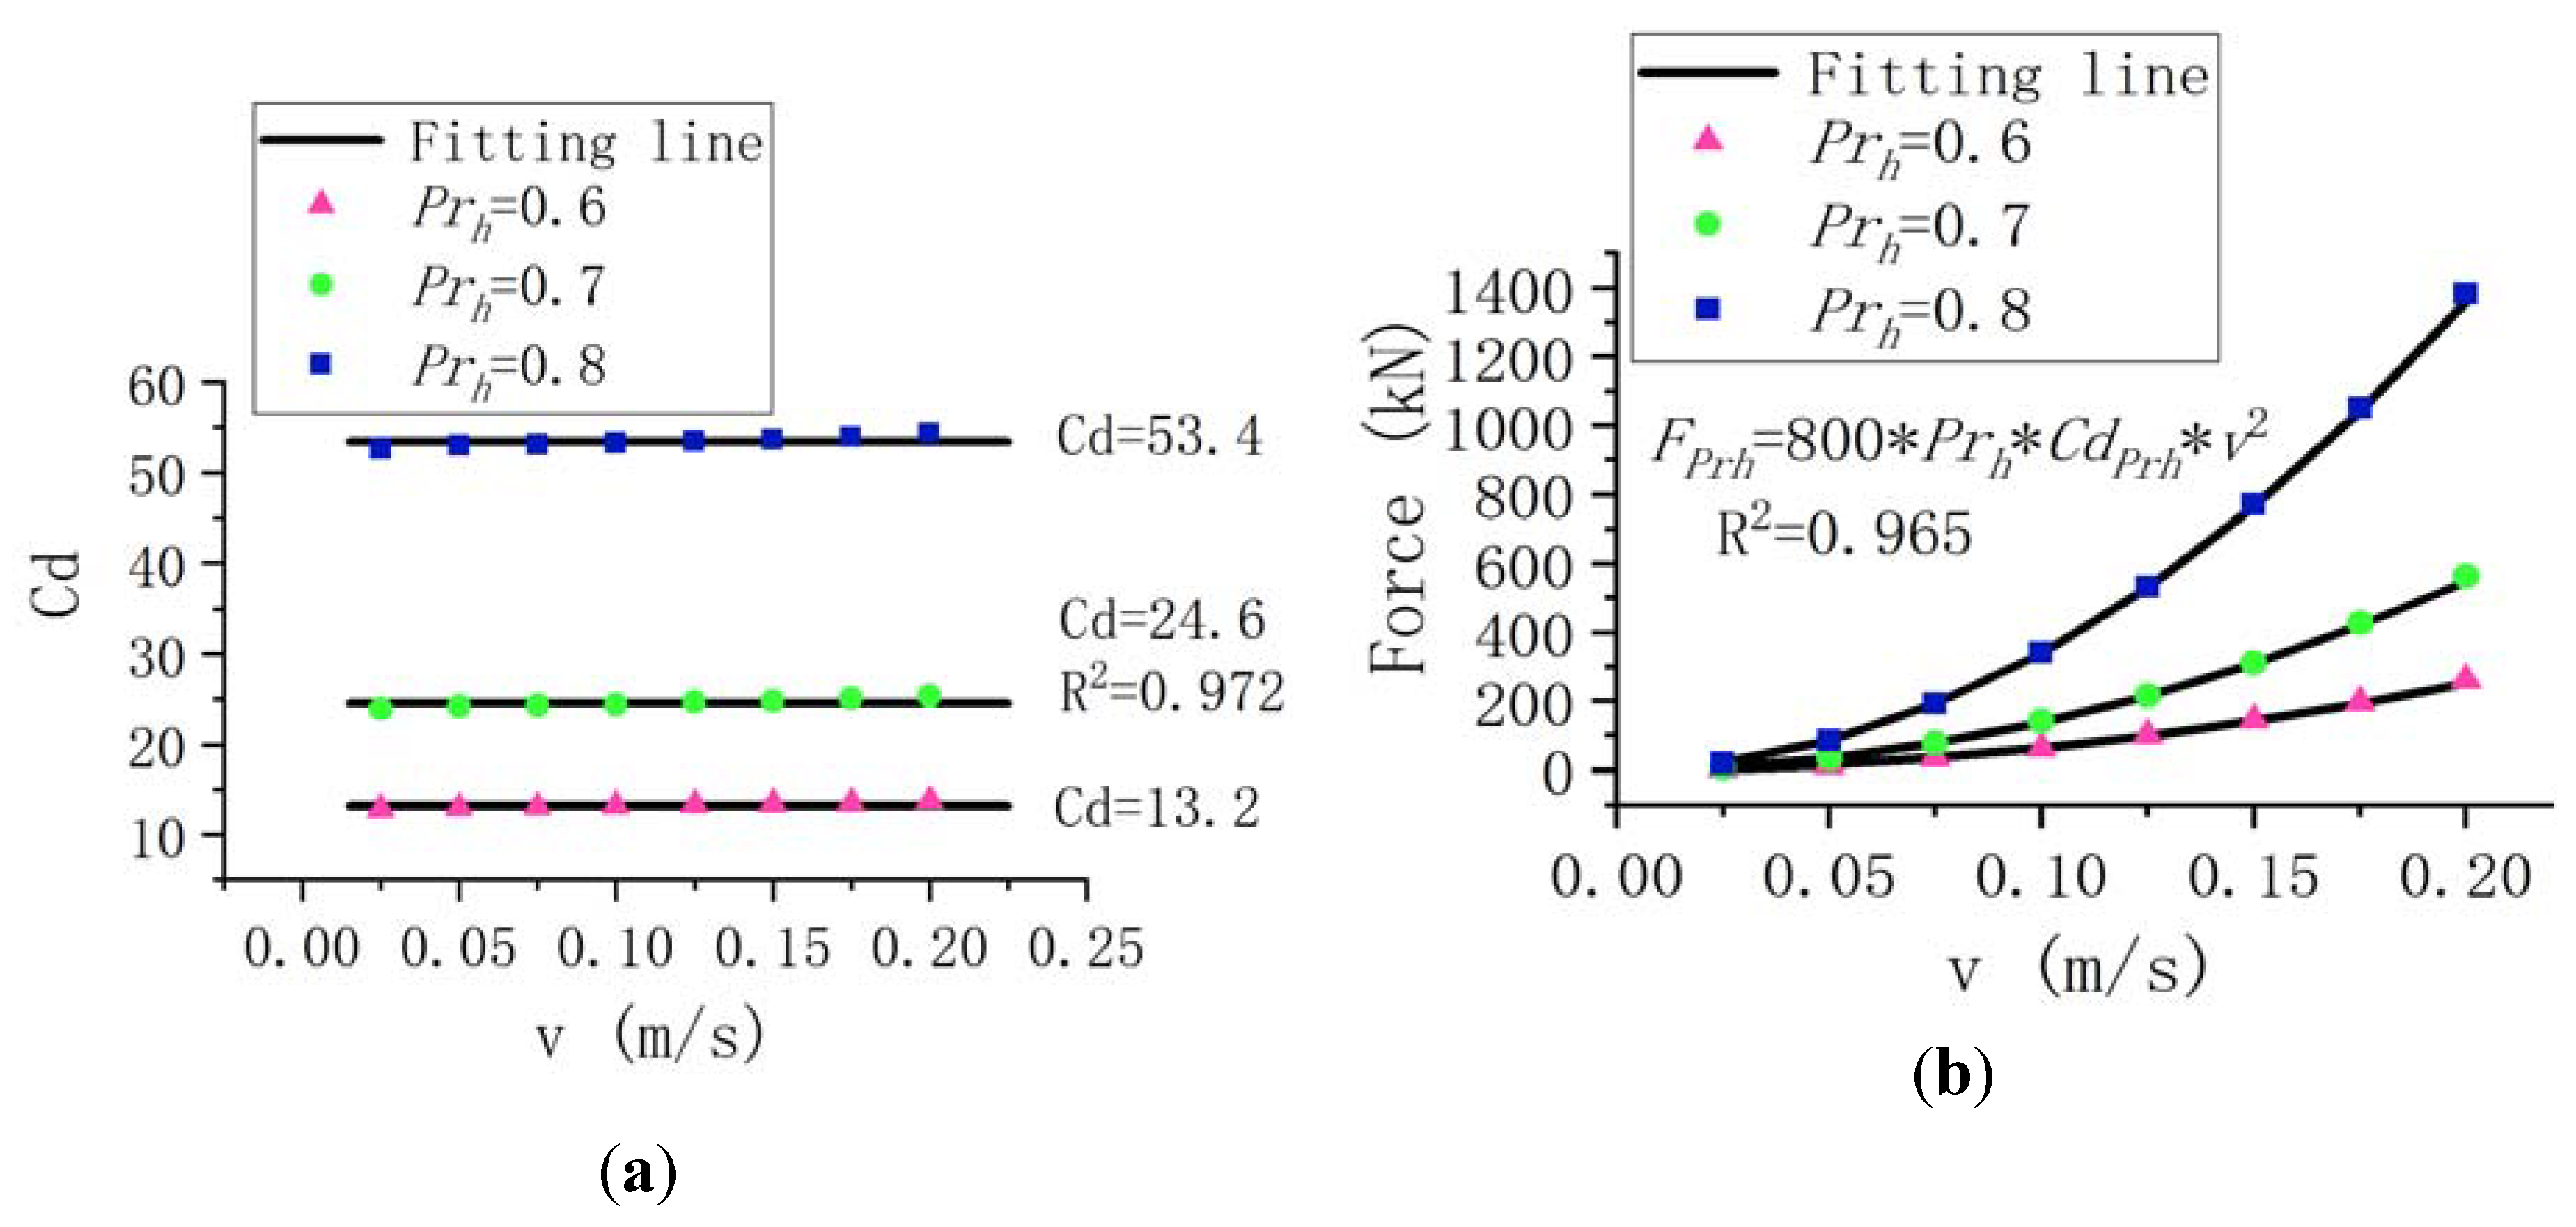
3.5. Effect of Inflow Velocity

The inflow velocity is one of the most important parameters affecting the flow field. The analysis of a TCC load under different inflow velocities has a significant impact on the safe operation of TCC projects. The range of inflow velocity is 0.025~0.2 m/s, and the step size is 0.025 m/s. The assumptions are similar to the area ratio. Figure 12 shows that when the water blocking rate remains constant, the force increases rapidly with the increase in inflow velocity, while the drag coefficient remains basically unchanged. The variation law of the TCC load is in accordance with the resistance equation. The curtain force is proportional to the square of the inflow velocity, while the drag coefficient is independent by the inflow velocity.

3.6. Effect of Water Temperature Stratification Ratio

The water temperature stratification ratio is the ratio of the temperature difference between the surface layer and the bottom layer to the water depth. Here, the TCC is in a stratified reservoir environment, and the difference between the surface water temperature and the bottom water temperature is large. The water temperature affects the water density, which affects the TCC load. The range of water temperature stratification ratio is 0~1.0, and the step size is 0.1. The assumptions are similar to the area ratio. When the water temperature stratification ratio changes, the drag coefficient changes only slightly (Figure 13). A fitting formula is investigated to quantify the effect of the water temperature stratification ratio on the drag coefficient. The results of the fitting formula show that the change in the drag coefficient obeys a linear relationship with the water temperature stratification ratio and that the change range is small. When the inflow velocity remains constant, the relationship between the load and the water temperature stratification ratio is also linear.

4. Discussion

4.1. Simulation Model

A generalized numerical simulation model is calibrated by physical model experimentation and verified by prototype observation data. The comparison between the numerical simulation values and experimentally results of the load is small. The simulation-calculated values fit well with the prototype observation of reservoir outflow water temperature. This indicates that the simulation model error is acceptable. The satisfactory results show that the simulation calculation model can properly simulate the TCC load and outflow water temperature.
The simulation model established in this paper can be applied to other similar thermally stratified reservoirs, such as the regulation of discharged water temperature, the setting of water intake location and flow, and the influence of water temperature stratification. However, the simulation model is a generalized model with a trapezoidal section. With the development of technology and the improvement of computing ability, the simulation model which accords with the actual terrain should be developed. In the future design, CFD software can be adopted to simulate the temperature control effect and the load characteristics of TCCs, which will greatly save time and experiment cost.

4.2. Engineering Applications

The influence of main parameters on the drag coefficient is considered through the water blocking rate, area ratio, inclination ratio, inflow velocity and water temperature stratification ratio. Among them, the water blocking rate has the greatest influence on the drag coefficient, and it is the most critical indicator of the TCC load. The water temperature stratification ratio has little effect on the drag coefficient. In engineering applications, the influence of the water temperature stratification ratio on the TCC load can be neglected, which indicates that isothermal water temperature can be assumed to calculate the TCC load.
In this paper, the relationship between drag coefficient and main parameters is obtained, and expressed by fitting formulas. On one hand, the reservoir studied is a generalized trapezoidal section. In practical engineering application, the cross-section of most reservoirs is irregular. In the calculation of dimensionless drag coefficient, the water blocking rate should be noted. On the other hand, for area ratio, inclination ratio, and the water temperature stratification ratio, these main parameters are variable in the actual environment, and it is not easy to determine the specific parameters in the design process. According to the fitting formulas, it is recommended to use conservative safety factors to express the influence of these main parameters on dimensionless drag coefficient (Cd), so that the load obtained is partial to safety.
The research results of this paper can be used to guide the design of TCCs. First, according to the requirements of discharged water temperature, a suitable bottom-TCC or top-TCC is selected. In spring and summer, the main purpose of applying bottom-TCC is to increase the water temperature. To lower the water temperature or improve the water quality, the top TCC is more suitable. Then, the simulation model is established by CFD software and verified by physical model experiment. According to the measured vertical temperature distribution, the actual discharged water temperature and the required discharged temperature, the main parameters of TCCs are simulated. Third, the main parameters and the fitting formula in this paper can estimate the corresponding drag coefficient. Finally, using the flow resistance equation, the TCC loads under different velocities can be determined quickly, which is of great significance in the design and construction of TCC projects.

4.3. Limitations

There are some limitations and prospects in this paper. First, as the bottom-TCC is mainly studied, the range of water blocking rate in this paper is 0.3–0.8. For the top-TCCs with the function of blocking floating objects on the water surface, its water blocking rate may be less than 0.3, which is not applicable to the analysis in this paper. Second, the results are obtained under the condition of uniform inflow velocity, and the effects of inhomogeneous velocity and large local velocity should be noted. Third, the simulation model in this paper ignores the mechanical deformation of TCCs caused by the fluid-structure interaction, which could be improved in future studies. Finally, this study only focuses on the case study reservoir, and the results should be further validated by expanding to other reservoirs.

4.4. Further Work

4.4.1. Flood condition

The working conditions analyzed in this paper are normal working conditions for the reservoir, and the flow is low. However, there is still a lack of analysis on high-flow conditions on TCC load. In a follow-up study, the bearing capacity of the bottom stable piles under flood conditions will be investigated, and measures to address flooding will be proposed. This work will improve the load analysis accuracy of TCC projects under extreme working conditions.

4.4.2. Various engineering applications

TCCs have great application prospects in hydropower and coastal engineering. In addition to controlling the water temperature of stratified reservoirs, it can improve downstream water quality. A curtain arranged in the upper part of a river can effectively block high-nutrient flow into downstream areas, thus alleviating eutrophication and algal bloom. Curtains can also be applied to isolate water of different densities, such as fresh water and sea water, thus building marine reservoirs to support the freshwater demand for offshore engineering. With the development of material science and technology, flexible materials will be widely used in hydraulic structures.

4.4.3. Implementation plan

Research on the implementation plans of TCCs has mainly focused on the structural materials, construction and water level operation modes. The next step of such research can propose overall floating transport, installation and maintenance plans for TCC projects suitable for deepwater reservoirs and water temperature improvement technologies for thermally stratified reservoirs.

5. Conclusions

The TCC is a selective withdrawal structure that can effectively change the discharged water temperature. Combining numerical simulation and model experiments, this paper investigates the load characteristics of different types of TCCs, and the following conclusions are obtained:
1. First, the simulated results agree well with the experimental results. The numerical simulation model established in this paper can be used to reliably predict TCC loads and outflow water temperature.
2. Second, among the main influencing parameters, the water blocking rate has the greatest influence on the drag coefficient, followed by the area ratio and the inclination ratio. The water temperature stratification ratio has little effect on the drag coefficient.
3. Finally, the drag coefficient exponentially increases with an increasing water blocking rate, quadratically increases with an increasing area ratio, linearly increases with an increasing inclination ratio, and linearly increases with an increasing water temperature stratification ratio. When the water blocking rate remains constant, the drag coefficient remains independent at different inflow velocities.

Author Contributions

Conceptualization: J.L.; methodology: H.W. and C.L.; formal analysis: C.L., H.W., and W.L.; software: C.L. and W.L.; resources: C.L. and F.L.; data curation: H.W. and F.L.; writing—original draft preparation: C.L.; writing—review and editing: H.W., C.L., and Y.Z.; supervision: J.L.; validation: H.W.; funding acquisition: J.L. and H.W. All authors have read and agreed to the published version of the manuscript.

Funding

This research was supported by the Fund for National Key Research and Development Project of China (2016YFC0401708) and the National Science Foundation of Tianjin (18JCYBJC22300).

Acknowledgments

All workers from the State Key Laboratory of Hydraulic Engineering Simulation and Safety of Tianjin University are acknowledged. The writers acknowledge the assistance of anonymous reviewers as well.

Conflicts of Interest

The authors declare no conflict of interest.

References

  1. Jamali, M.; Haddadzadegan, H. Effects of a sill on selective withdrawal through a point sink in a linearly stratified fluid. Adv. Water Resour. 2010, 33, 1517–1523. [Google Scholar] [CrossRef]
  2. Zouabi-Aloui, B.; Adelana, S.M.; Gueddari, M. Effects of selective withdrawal on hydrodynamics and water quality of a thermally stratified reservoir in the southern side of the Mediterranean Sea: A simulation approach. Environ. Monit. Assess 2015, 187, 292. [Google Scholar] [CrossRef]
  3. Lindim, C.; Pinho, J.L.; Vieira, J.M.P. Analysis of spatial and temporal patterns in a large reservoir using water quality and hydrodynamic modeling. Ecol. Model. 2011, 222, 2485–2494. [Google Scholar] [CrossRef]
  4. Dai, L.; Dai, H.; Jiang, D. Temporal and spatial variation of thermal structure in Three Gorges Reservoir: A simulation approach. J. Food Agric. Environ. 2012, 10, 1174–1178. [Google Scholar]
  5. Wang, S.; Qian, X.; Han, B.; Luo, L.; Hamilton, D.P. Effects of local climate and hydrological conditions on the thermal regime of a reservoir at Tropic of Cancer, in southern China. Water Res. 2012, 46, 2591–2604. [Google Scholar] [CrossRef]
  6. Ma, J.; Liu, D.; Wells, S.A.; Tang, H.; Ji, D.; Yang, Z. Modeling density currents in a typical tributary of the Three Gorges Reservoir, China. Ecol. Model. 2015, 296, 113–125. [Google Scholar] [CrossRef]
  7. Lian, J.; Yao, Y.; Ma, C.; Guo, Q. Reservoir Operation Rules for Controlling Algal Blooms in a Tributary to the Impoundment of Three Gorges Dam. Water 2014, 6, 3200–3223. [Google Scholar] [CrossRef] [Green Version]
  8. Shen, X.; Liu, S.; Li, R.; Ou, Y. Experimental study on the impact of temperature on the dissipation process of supersaturated total dissolved gas. J. Environ. Sci.-China 2014, 26, 1874–1878. [Google Scholar] [CrossRef] [PubMed]
  9. Bradford, S. Scoping Options for Mitigating Cold Water Discharges from Dams; CSIRO Land and Water: Canberra, Australia, 2000. [Google Scholar]
  10. Gao, X.; Chen, H.; Li, Y.; Xu, M. Flow Patter and Effect of Withdrawal Water from Stop Log Gate with Multi-Levels in Hydropower Station. J. Tianjin Univ. (Sci. Technol.) 2013, 46, 895–900. (In Chinese) [Google Scholar]
  11. Vermeyen, T. Application of Flexible Curtains to Control Mixing and Enable Selective Withdrawal in Reservoirs. In Proceedings of the 5th International Symposium on Stratified Flows, Vancouver, BC, Canada, 10–13 July 2000; IAHR: Madrid, Spain, 2000. [Google Scholar]
  12. Gao, X.; Li, G.; Han, Y. Effect of Flow Rate of Side-Type Orifice Intake on Withdrawn Water Temperature. Sci. World J. 2014, 2014, 1–7. [Google Scholar] [CrossRef] [Green Version]
  13. Asaeda, T.; Priyantha, D.G.N.; Saitoh, S.; Gotoh, K. A new technique for controlling algal blooms in the withdrawal zone of reservoirs using vertical curtains. Ecol. Eng. 1996, 7, 95–104. [Google Scholar] [CrossRef]
  14. Asaeda, T.; Pham, H.S.; Nimal Priyantha, D.G.; Manatunge, J.; Hocking, G.C. Control of algal blooms in reservoirs with a curtain: A numerical analysis. Ecol. Eng. 2001, 16, 395–404. [Google Scholar] [CrossRef]
  15. Park, C.; Park, M.; Kim, K.; Kim, N.; Kim, Y.; Gwon, E.; Kim, B.; Lim, B.; Hwang, S. A Physical Pre-Treatment Method (Vertical Weir Curtain) for Mitigating Cyanobacteria and Some of Their Metabolites in a Drinking Water Reservoir. Water 2017, 9, 775. [Google Scholar] [CrossRef] [Green Version]
  16. Lee, H.S.; Chung, S.W.; Choi, J.K.; Min, B.H. Feasibility of curtain weir installation for water quality management in Daecheong Reservoir. Desalin. Water Treat. 2012, 19, 164–172. [Google Scholar] [CrossRef]
  17. Lian, J.J.; Yan, X.; Peng, X.M.; Ma, C.; Liu, F.; Wang, H.J. A Kind of Floating and Hanging Flexible Water Blocking Curtain. Chinese Patent China CN 204753530U, 11 November 2015. (In Chinese). [Google Scholar]
  18. He, W.; Lian, J.; Yao, Y.; Wu, M.; Ma, C. Modeling the effect of temperature-control curtain on the thermal structure in a deep stratified reservoir. J. Environ. Manag. 2017, 202, 106–116. [Google Scholar] [CrossRef]
  19. Vermeyen, T. Use of Temperature Control Curtains to Control Reservoir Release Water Temperatures; Report 97-09; US Bureau of Reclamation: Denver, CO, USA, 1997.
  20. Shammaa, Y.; Zhu, D.Z. Experimental Study on Selective Withdrawal in a Two-Layer Reservoir Using a Temperature-Control Curtain. J. Hydraul. Eng. 2010, 136, 234–246. [Google Scholar] [CrossRef]
  21. Politano, M.; Haque, M.M.; Weber, L.J. A numerical study of the temperature dynamics at McNary Dam. Ecol. Model. 2008, 212, 408–421. [Google Scholar] [CrossRef]
  22. Lian, J.; Du, H.; Ma, C. Effects of temperature control curtain on water releases in deep water reservoirs. J. Hydraul. Eng. 2016, 47, 942–948. (In Chinese) [Google Scholar]
  23. He, W.; Lian, J.; Ma, C.; Wu, M.; Liu, F. Analysis of the Thrust Force on the Temperature-Control Curtain in a Large Stratified Reservoir. J. Hydraul. Eng. 2017, 143, 04017049. [Google Scholar] [CrossRef]
  24. Wang, H.; Si, F.; Lou, G.; Yang, W.; Yu, G. Hydrodynamic Characteristics of a Suspended Curtain for Sediment Trapping. J. Waterw. Port Coast. 2015, 141, 04014030. [Google Scholar] [CrossRef]
  25. ANSYS. ANSYS Fluent 16.0 Theory Guide; ANSYS, Inc.: Canonsburg, PA, USA, 2015. [Google Scholar]
  26. Wang, J.; Fan, H.; Zhu, L. Experimental study on mechanism and shape characteristics of suspended flexible dam. China Ocean Eng. 2014, 28, 869–878. [Google Scholar] [CrossRef]
  27. Sheng, C.; Lian, J.; Liu, F.; Xu, B. Force analysis on water barrier curtain for released flow with low temperature from deep reservoirs. J. Hydraul. Eng. 2016, 47, 1548–1557. (In Chinese) [Google Scholar]
  28. Lian, J.J.; He, J.L.; Liu, F.; Ran, D.J.; Wang, X.Q.; Wang, C. An Improved Empirical Model for Flood Discharge Atomization and Its Application to Optimize the Flip Bucket of the Nazixia Project. Int. J. Environ. Res. Public Health 2019, 16, 316. [Google Scholar] [CrossRef] [PubMed] [Green Version]
  29. Ren, H.; Xu, Y.; Zhang, M.; Fu, S.; Meng, Y.; Huang, C. Distribution of drag coefficients along a flexible pipe with helical strakes in uniform flow. Ocean Eng. 2019, 184, 216–226. [Google Scholar] [CrossRef]
  30. Lou, X.; Zhou, T.; Cheng, L. Hydrodynamic coefficients of a yawed square cylinder in oscillatory flows. Ocean Eng. 2017, 130, 510–522. [Google Scholar] [CrossRef]
  31. Lian, J.J.; Li, P.Y.; Yao, Y.; He, W.; Shao, N. Experimental and Numerical Study on the Effect of the Temperature Control Curtain in Thermal Stratified Reservoirs. Appl. Sci. 2019, 9, 5354. [Google Scholar] [CrossRef] [Green Version]
Figure 1. Working program.
Applsci 10 01461 g001
Figure 2. Comparison of monthly average water temperature in downstream areas of the hydropower station before and after reservoir construction.
Applsci 10 01461 g002
Figure 3. Geometry of the TCC: (a) downstream direction; (b) cross-section.
Applsci 10 01461 g003
Figure 4. Schematic and meshes of the numerical simulation model: (a) computational domain of simulation model; (b) global mesh; (c) encrypted grid near TCC (model size: length 165 m, top width 78 m, bottom width 20 m, water depth 32.5 m).
Applsci 10 01461 g004
Figure 5. Schematic of physical model experiment and force measurement (a) test site; (b) TCC; (c) schematic of force measurement (measured parameters: flow velocity (v), pulling force (T), gravity of the rubber block (G), bottom friction coefficient ( μ ), angle between pulling force and flow direction ( θ ), and water depth (H)).
Applsci 10 01461 g005
Figure 6. Experimental measuring instruments: (a) force sensor; (b) dynamic strain gauge; (c) ADV; and (d) DASP.
Applsci 10 01461 g006
Figure 7. Comparison of experimentally measured results (converted to prototype results) and simulation-calculated values: (a) water blocking rate of 0.82; (b) water blocking rate of 0.716.
Applsci 10 01461 g007
Figure 8. Comparison of the calculated and measured values of discharged water temperature.
Applsci 10 01461 g008
Figure 9. (a) Drag coefficient and (b) force at different water blocking rates (data sources: C1–C11).
Applsci 10 01461 g009
Figure 10. (a) Drag coefficient and (b) force at different area ratios (data sources: D1–D18).
Applsci 10 01461 g010
Figure 11. (a) Drag coefficient and (b) force at different inclination ratios (data sources: E1–E33).
Applsci 10 01461 g011
Figure 12. (a) Drag coefficient and (b) force at different inflow velocities (data sources: F1–F24).
Applsci 10 01461 g012
Figure 13. (a) Drag coefficient and (b) force at different water layer strength ratios (data sources: G1–G33).
Applsci 10 01461 g013
Table 1. Experimental hydraulic parameters and geometric scale.
Similarity CriterionPhysical QuantityScale RelationScale
Gravity similarity theoryLengthλL25
Velocityλt = λL0.55
ForceλF = λL315,625
Timeλt = λL0.55
Table 2. Scenarios and results of the physical model experiments.
NumberDepth (m)Flow Depth Above TCC (m)Water Blocking RateAverage Velocity (m/s)Load of TCC (N)
A11.440.160.8280.00694.09
A21.440.160.8280.00785.44
A31.440.160.8280.00948.25
A41.440.160.8280.010210.35
B11.300.250.7160.0071.40
B21.300.250.7160.0082.00
B31.300.250.7160.013.30
B41.300.250.7160.01235.29
Table 3. Numerical simulation model scenarios.
NumberDescriptionWater Blocking Rate PrhArea Ratio PraInclination Ratio PrlInflow Velocity vin (m/s)Water Temperature Stratification Ratio β
C1–C11Varying water blocking rates Prh (basic working condition)Range: 0.3–0.8 step size 0.051.000.050
D1–D6Varying area ratios Pra0.6Range: 1.0–1.5, step size: 0.100.050
D6–D120.700.050
D13–D180.800.050
E1–E11Varying inclination ratios Prl0.61.0Range: 0–1.0, step size: 0.10.050
E12–E220.71.00.050
E23–E330.81.00.050
F1–F8Varying inflow velocities vin0.61.00Range: 0.025–0.2, step size: 0.0250
F9–F160.71.000
F17–F240.81.000
G1–G11Varying water temperature stratification ratios β0.61.000.05Range: 0–1.0, step size: 0.1
G12–G220.71.000.05
G23–G330.81.000.05

