Characteristics of the Wind Environment above Bridge Deck near the Pylon Zone and Wind Barrier Arrangement Criteria
Abstract
1. Introduction
2. Theoretical Basis
2.1. Continuity Equation
2.2. Momentum Equation
2.3. Navier‒Stokes Equation
3. Experimental and Numerical Simulation Setup
3.1. Experimental Setups
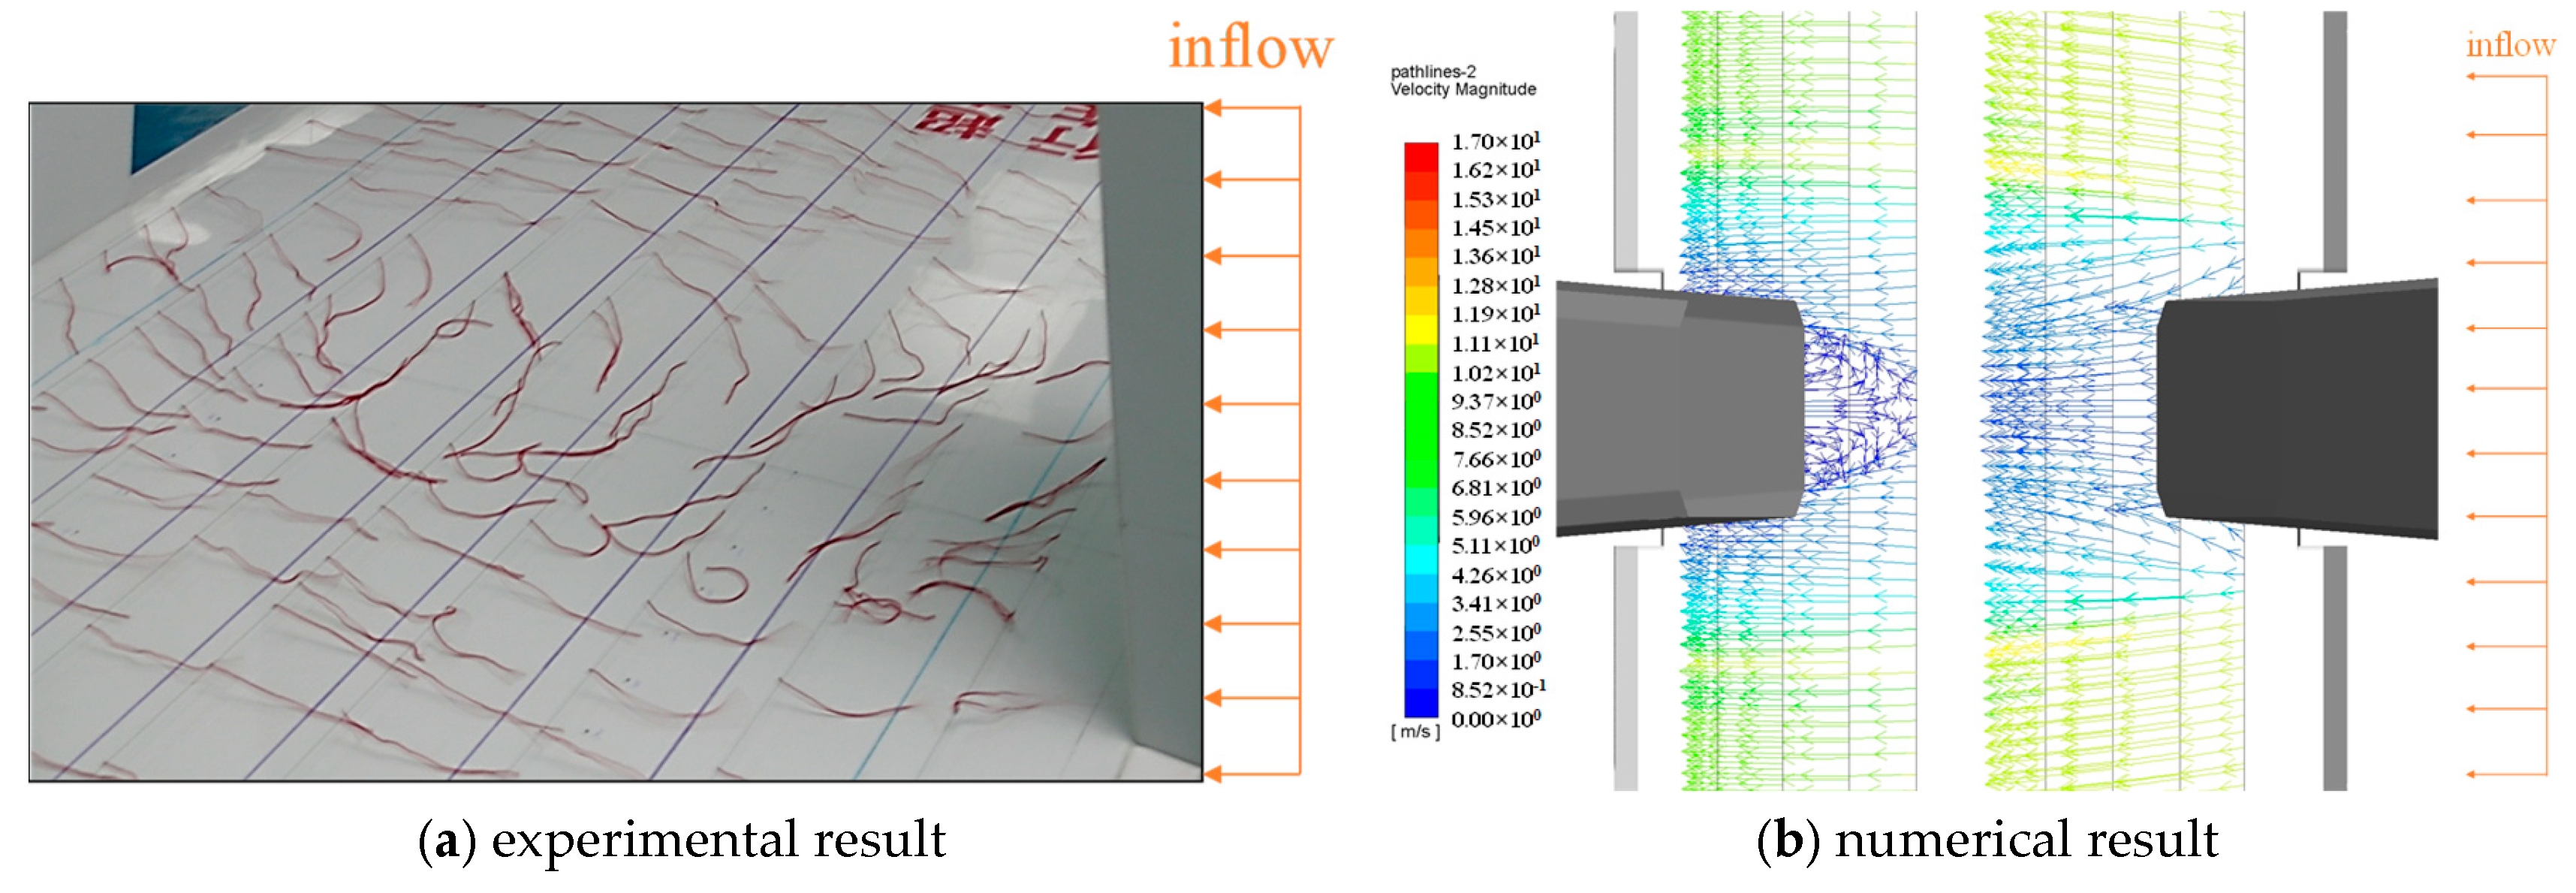
3.1.1. Flow Pattern Observation
3.1.2. Wind Speed above the Bridge Deck
- ①
- Upstream main lane (Y = −0.184 m): x = 0, 0.05, 0.1, 0.15, 0.2, 0.25, 0.3, 0.4, 0.5, 0.6, 0.8, 1.0, 1.2, 2.0 m;
- ②
- Downstream main lane (Y = +0.184 m): x = 0, 0.05, 0.1, 0.15, 0.2, 0.25, 0.3, 0.4, 0.5, 0.6, 0.8, 1.0, 1.2, 2.0 m;
- ③
- For each longitudinal measuring position, the height z = 0.005, 0.01, 0.015, 0.02, 0.025, 0.03, 0.04, 0.05, 0.06, 0.08, 0.1, 0.12 m.
3.2. Numerical Simulation Setups
4. Wind Environment around the Bridge Pylon
4.1. Flow Visualization at the Bridge Pylon Zone
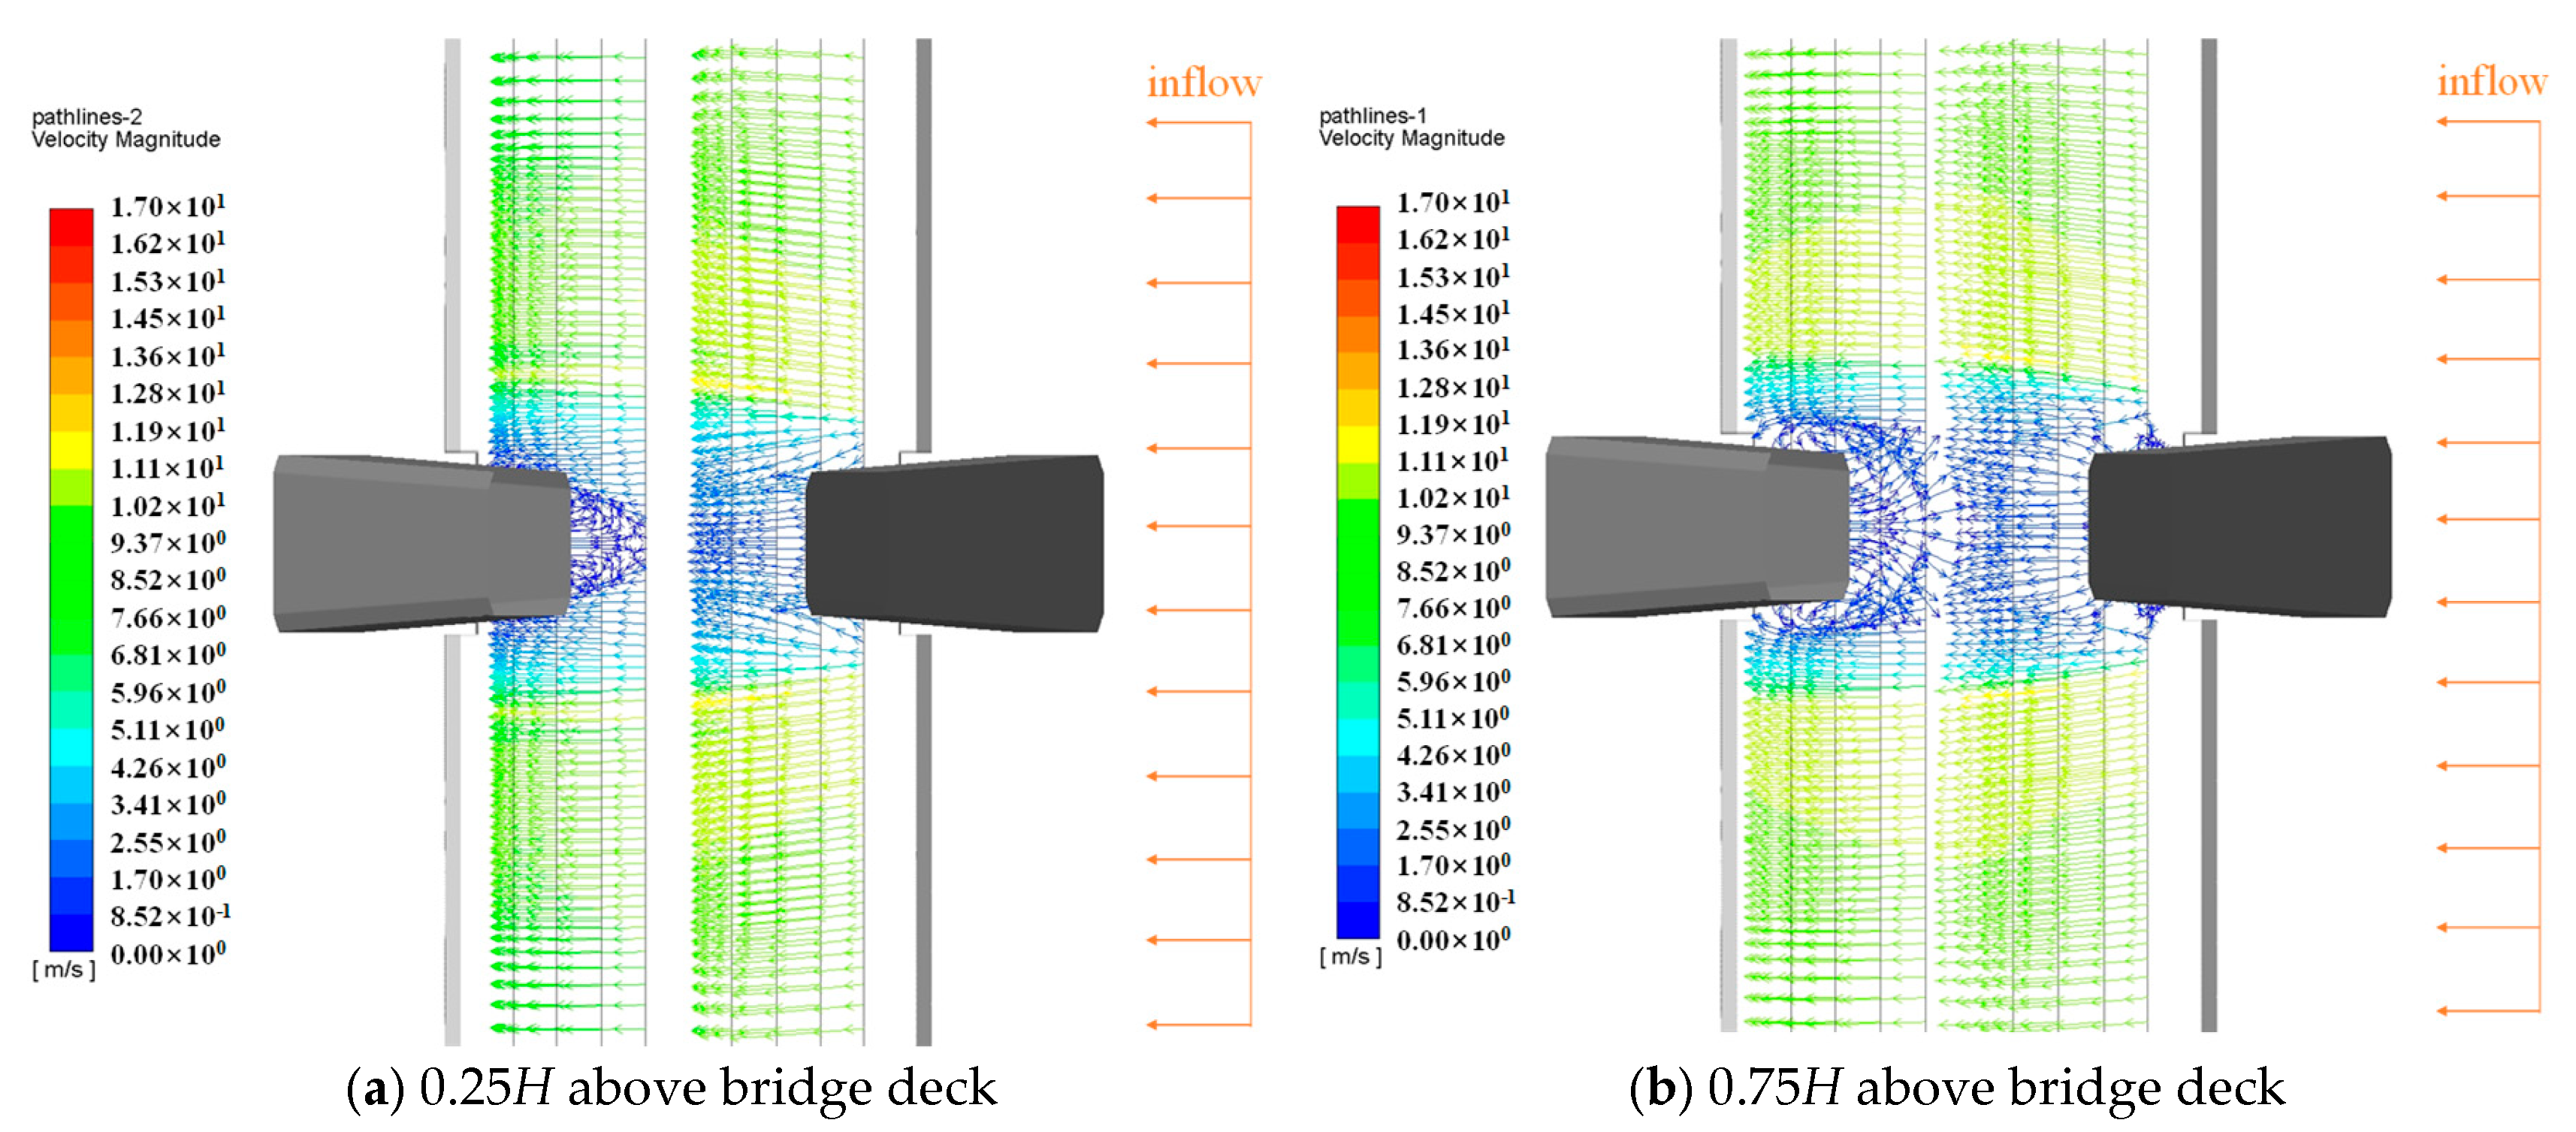
4.1.1. The Section with Guardrails
4.1.2. The Section without Any Ancillary Facility
4.2. Wind Speed Distribution at the Bridge Pylon Zone
4.2.1. Nondimensional Wind Speed Definition
4.2.2. Wind Speed Coefficient Result
- (1)
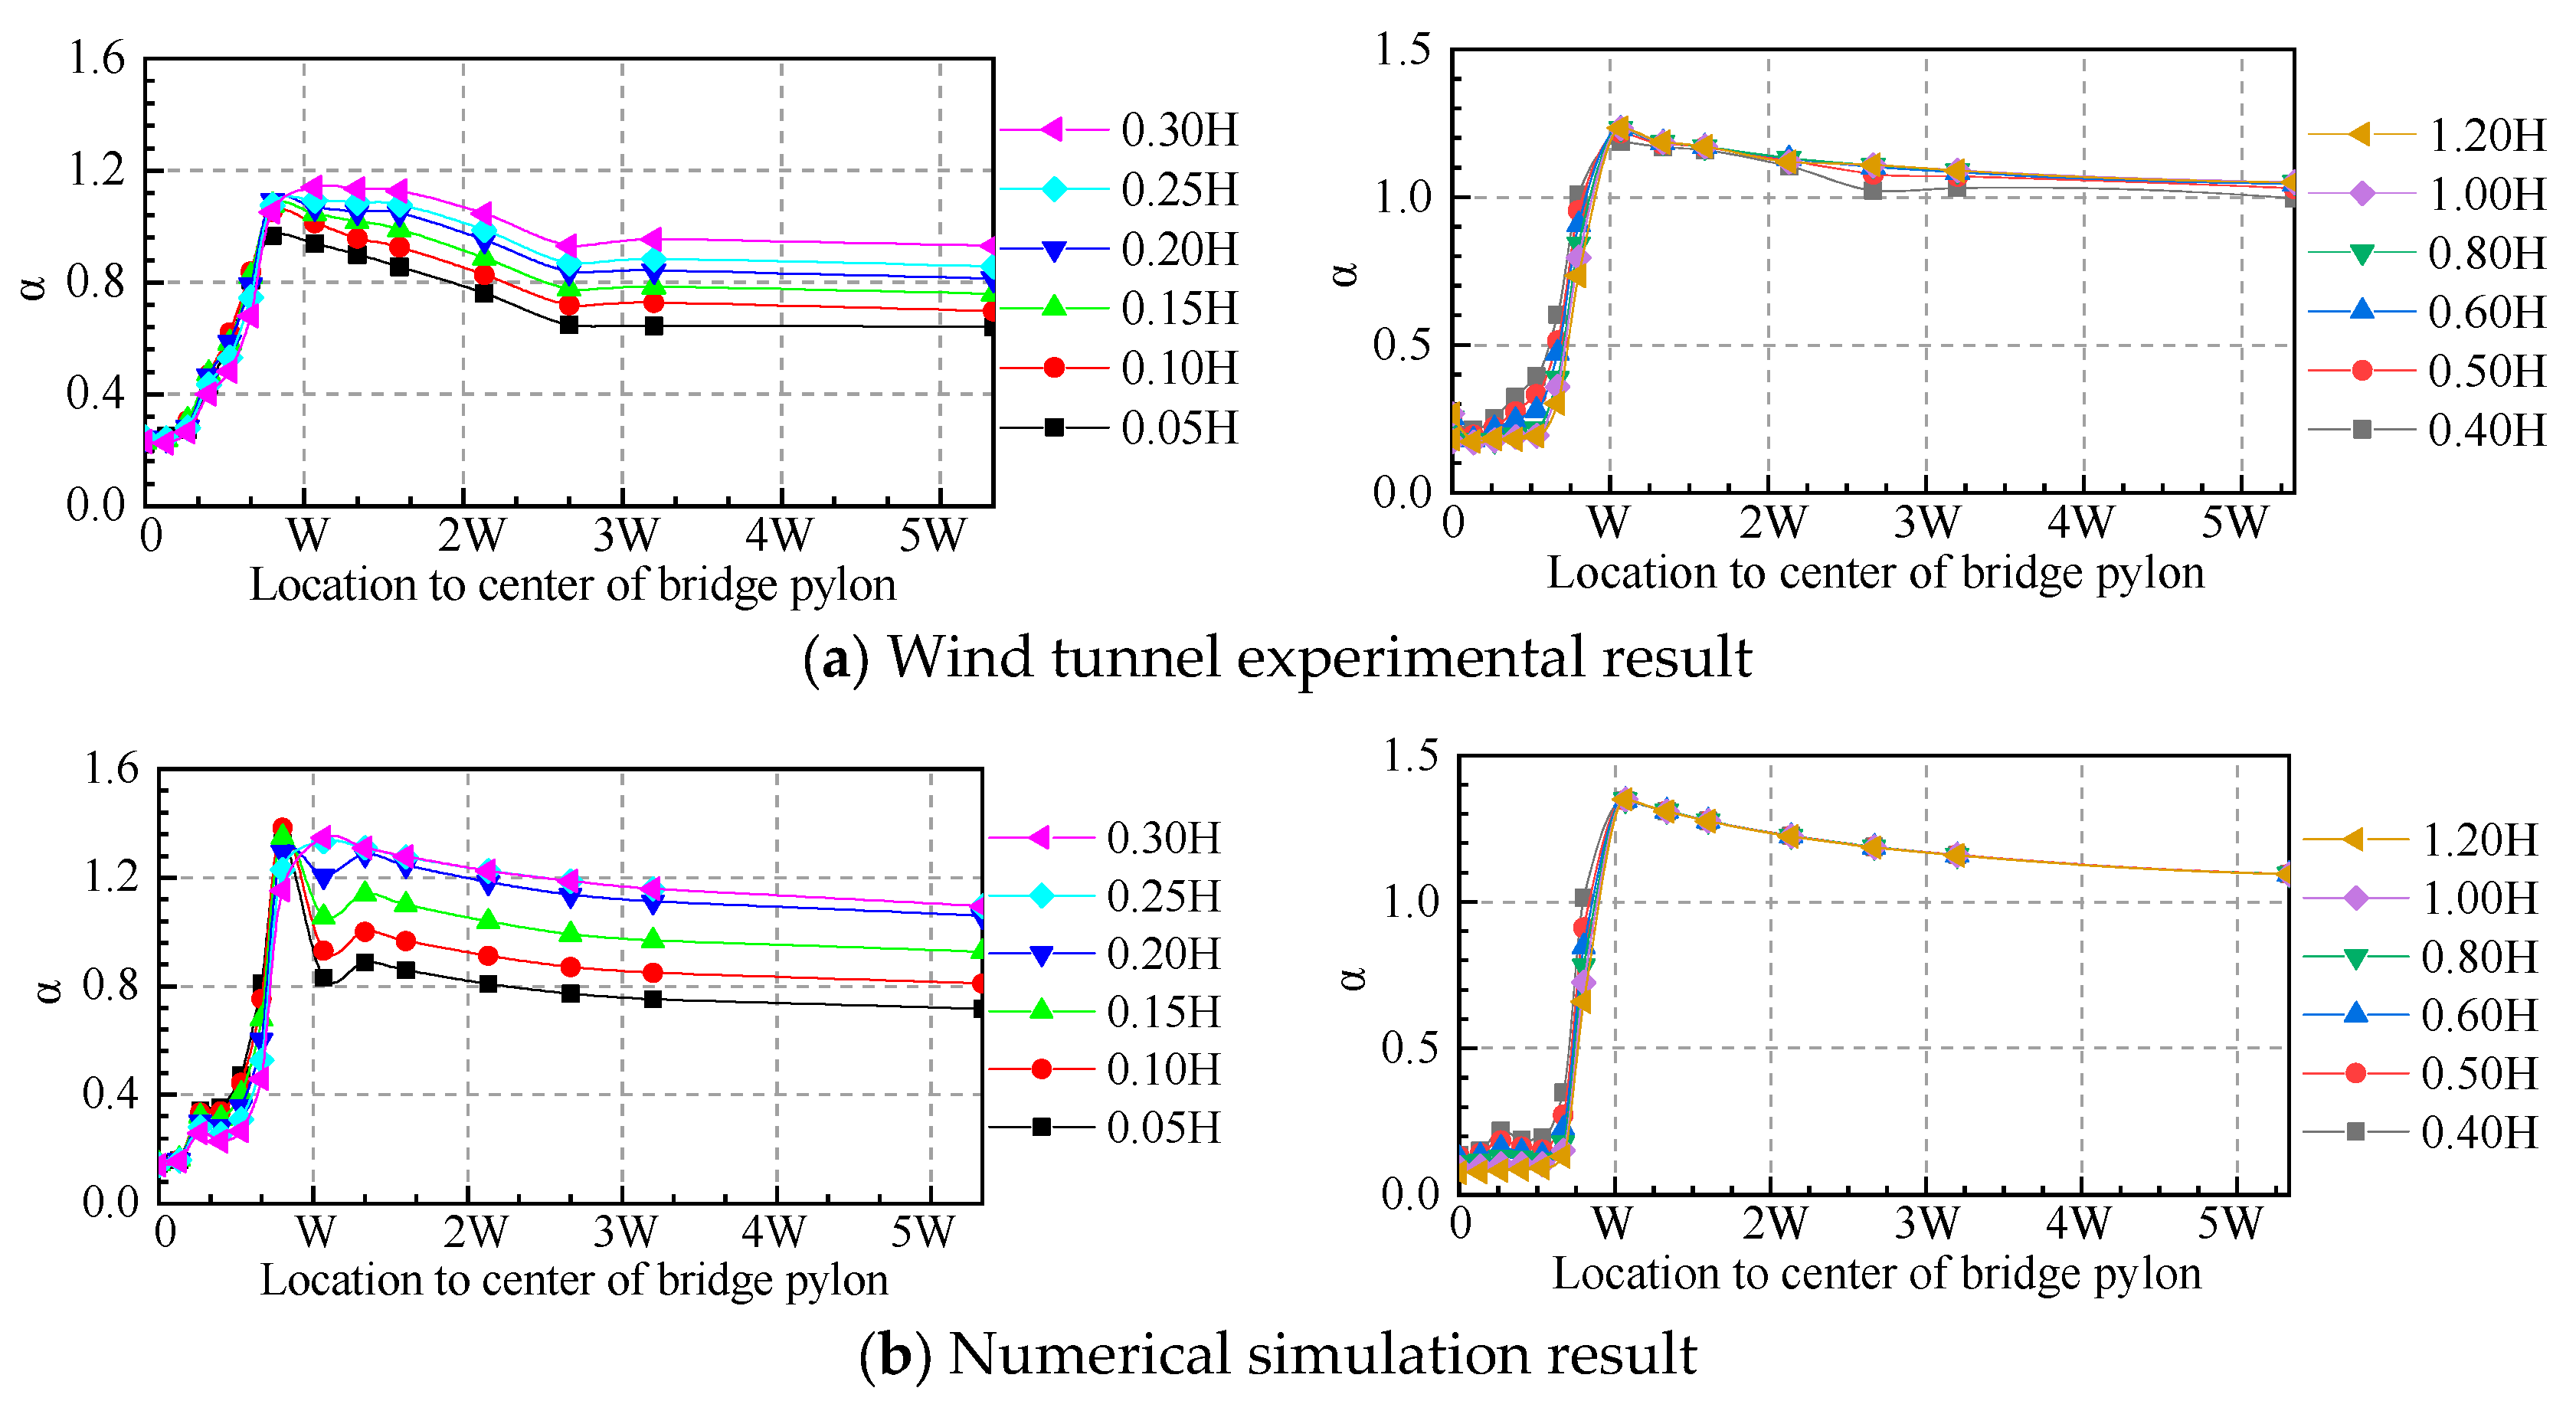
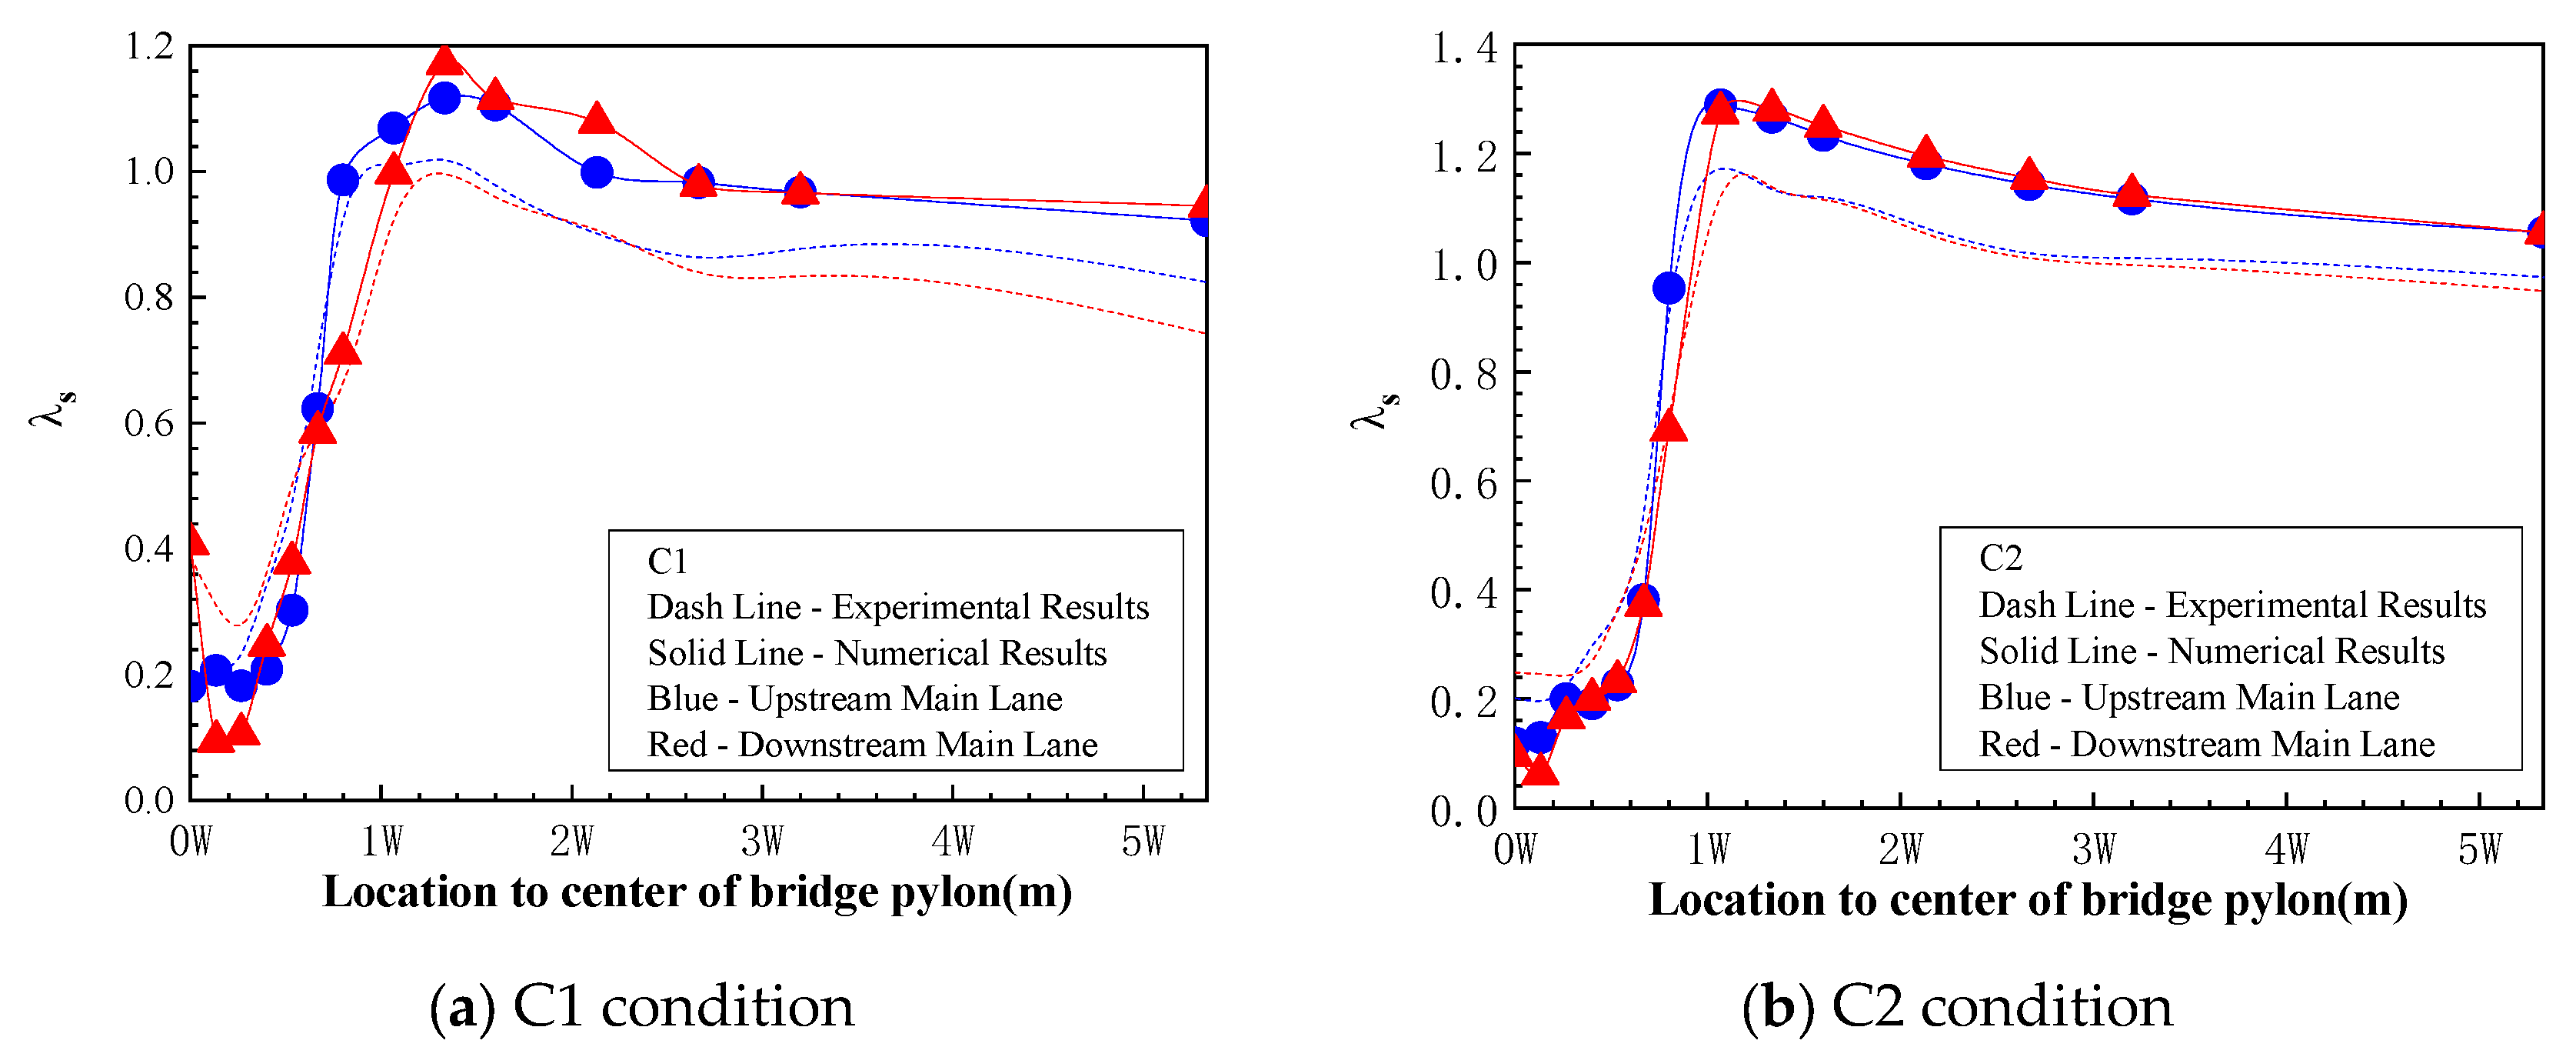
- The wind speed coefficient increases at first, then decreases along the longitudinal direction, consistent with the analysis in the flow visualization section.
- (2)
- The wind speed coefficient is very small from the bridge pylon center to 0.5W, and has a sudden increase from 0.5W to W, which is unfavorable for bridge driving safety. W represents the width of the bridge pylon of 15 m.
- (3)
- tends to be static at a distance further than 3W, and the largest appears near the distance of W distant from the pylon column’s center, which indicates that the flow around the pylon is dominant in this range.
- (4)
- The magnitude of increases as the height above the bridge deck increases, which is caused by the boundary layer flow of the bridge deck.
- (5)
- is a unimodal curve at higher locations above the bridge deck, which means that the flow around the bridge pylon is dominant at higher locations.
- (6)
- In the range of 0.8 to 1.2H above the bridge deck, is basically coincident. In addition, the magnitudes of are very close in the C1 and C2 conditions. This indicates that the wind environment within 0.8H is controlled by the flow around the bridge girder.
- (7)
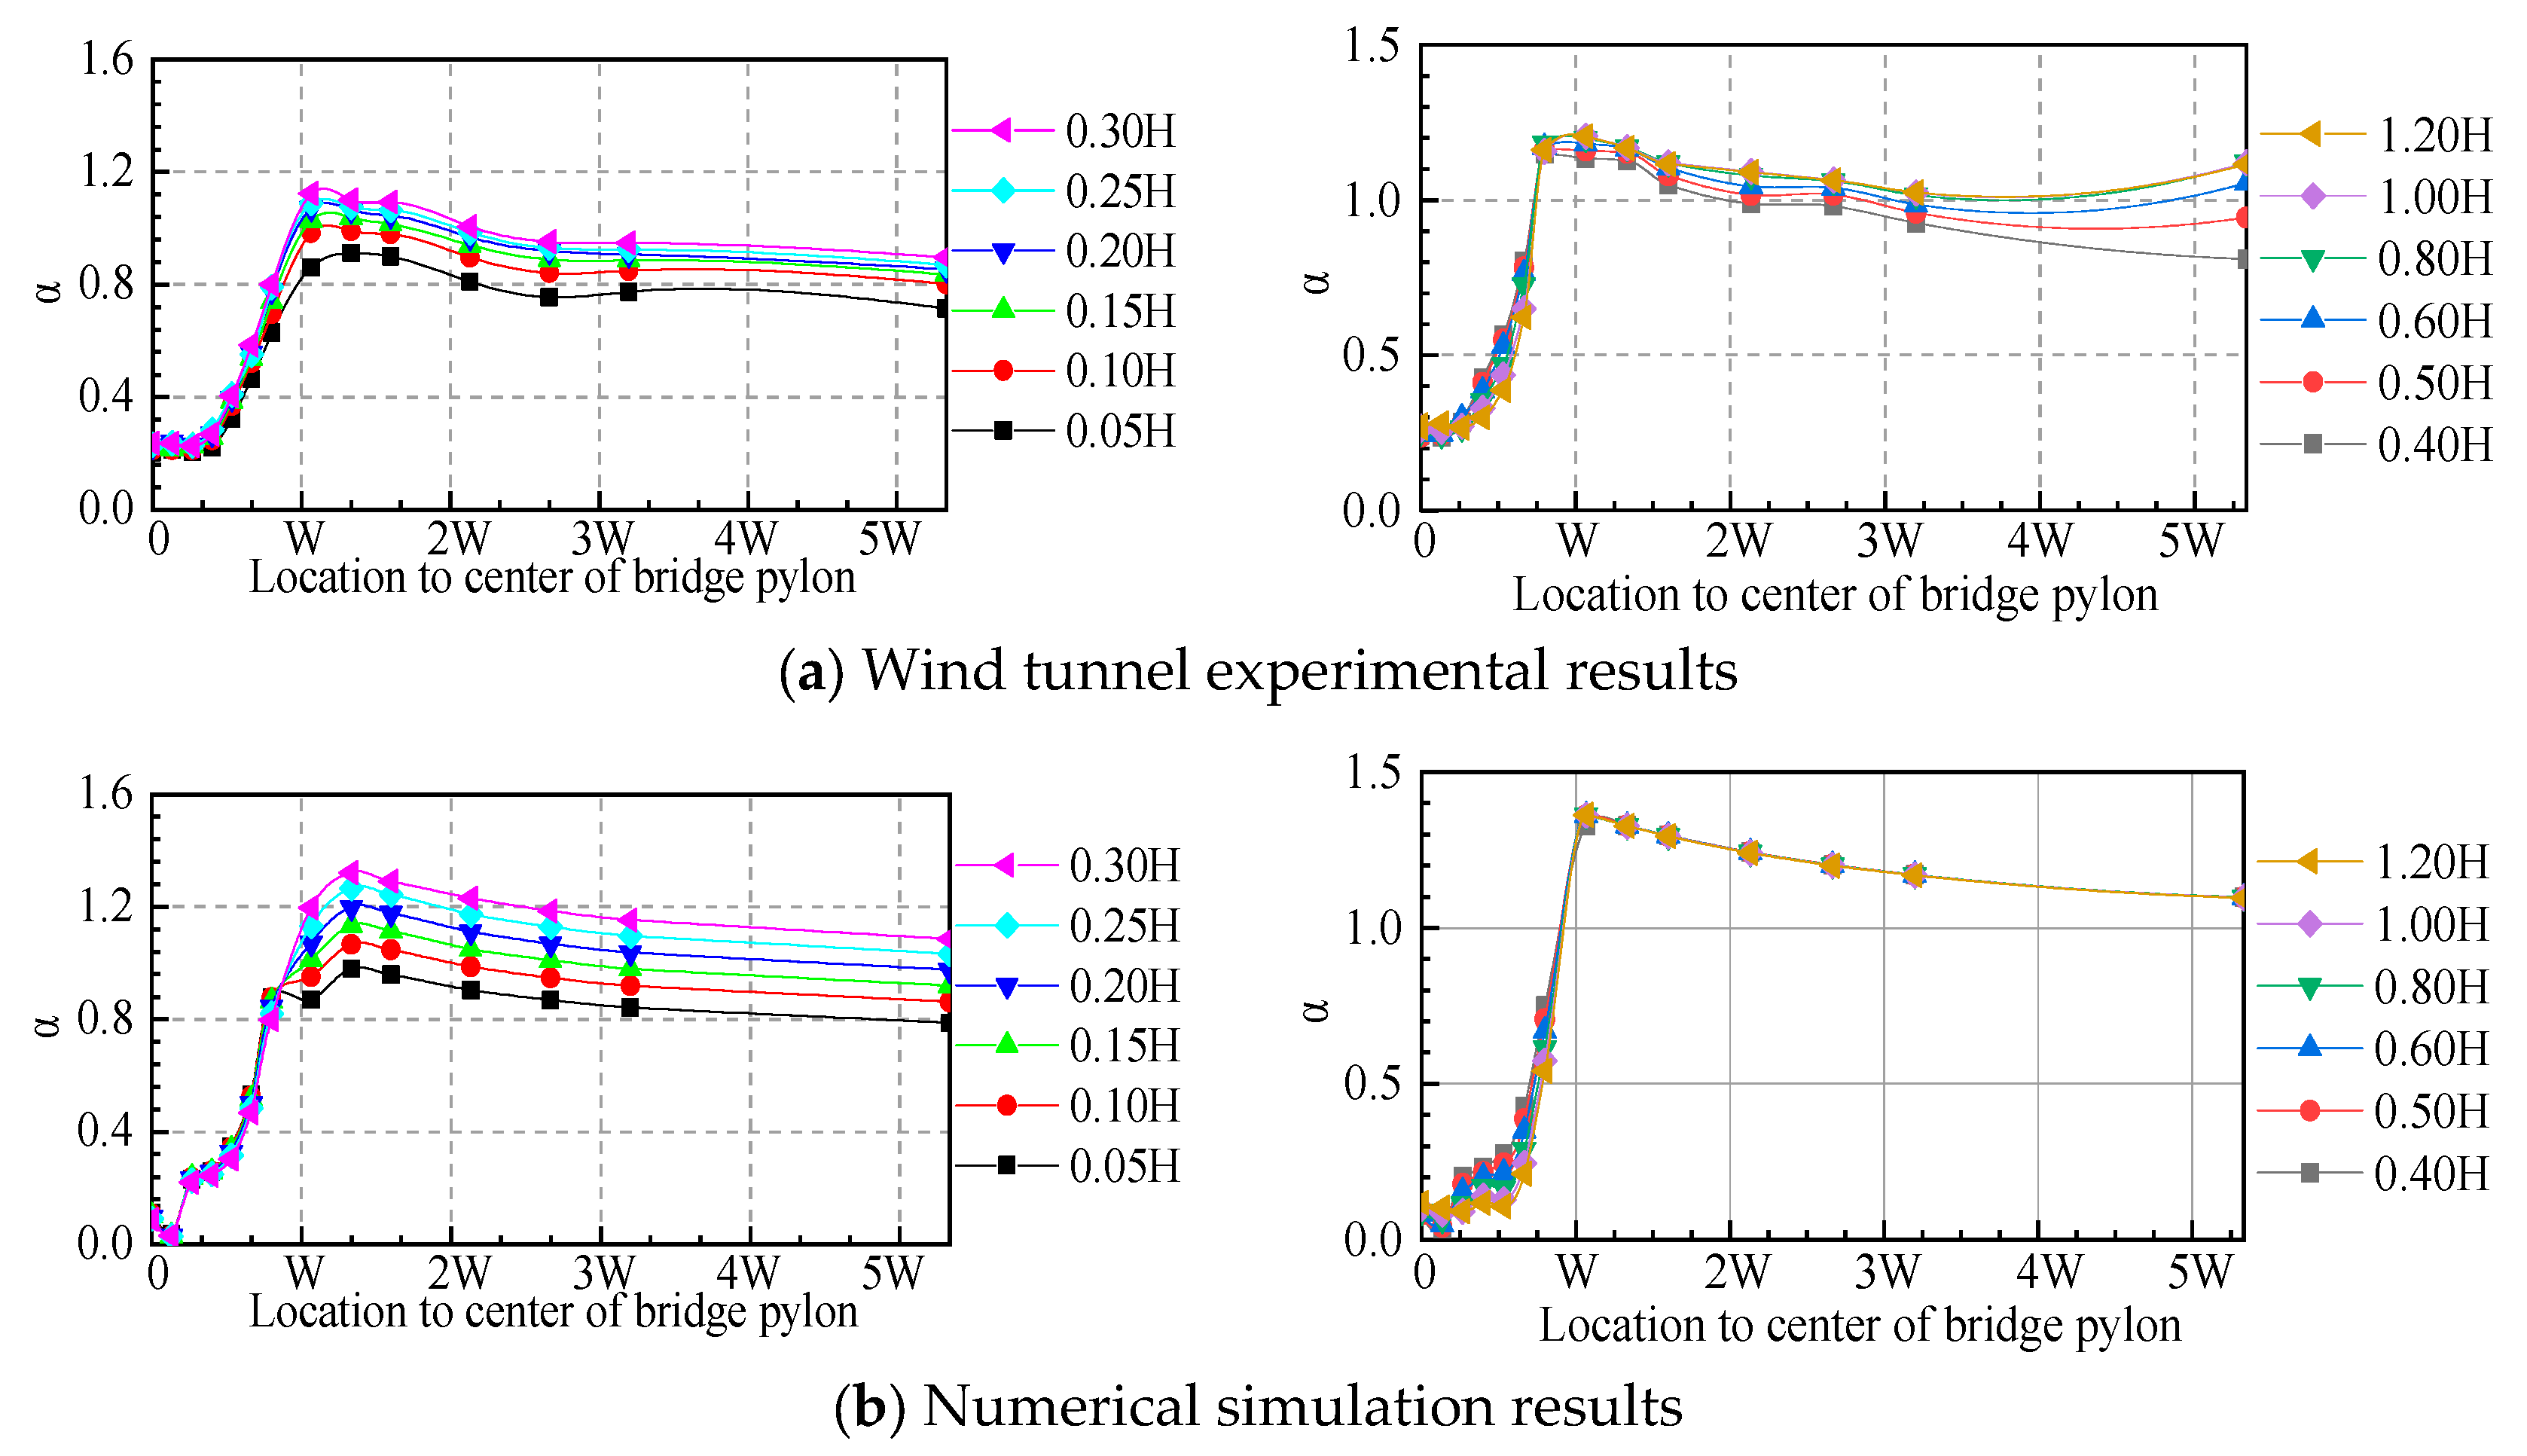
- The numerical simulation result has the same trend and same location of , and corresponds with the experimental result, though its value is generally larger than in the experimental results. A possible reason for this is that the wind speed is considered as a 3D resultant velocity in the numerical simulation, but as 1D along the inflow direction in the experimental results. If the measuring points are in the vortex zone, the velocity cannot be accurately obtained from the wind tunnel experiment.
i. Upstream Main Lane
- (1)
- is located 0.67W from the center of the pylons, and within 0.3H above the deck (H is the girder height 4 m and W is the bridge pylon width 15 m at bridge deck elevation). The magnitudes of within 0.3H are all smaller than the inflow velocity.
- (2)
- From 0.4 to 0.6H above the bridge deck, appears at 1.33W from the center of the pylon columns.
- (1)
- Under the C2 condition, for all heights above the bridge deck of the upstream main lane is located near the distance of W from the center of pylon columns.
- (2)
- The magnitude of the wind speed coefficient within 0.3H above the deck is larger than that of the C1 condition, and the curve is more complicated in the C1 condition. In addition, for locations higher than 0.4H above the bridge deck, these curves are basically overlapping in the C2 condition, which occurs higher than 0.8H above the bridge deck in the C1 condition. The main reason is that the guardrails can disturb the inflow and cause airflow detouring.
ii. Downstream Main Lane
4.2.3. Influence Coefficient Result
- (1)
- The peak value of appears around the distance of W from the center of the pylon.
- (2)
- is very small from the pylon center to 0.5W, and it has a sudden increase from 0.5W to W, which is unfavorable for bridge driving safety.
- (3)
- for distances larger than 3W tends to be static up to a certain value, which means that the wind environment is dominated by the flow around the pylon within the range of 3W from the pylon center, outside this range, the flow around the bridge girder is dominant.
- (4)
- Compared with the C2 condition, the peak value of in the C1 condition is obviously smaller. This implies that the guardrail and other ancillary facilities are helpful for reducing the wind speed above the deck.
- (5)
- The values of from the numerical simulation and the wind tunnel test are very close, and the trend of along the longitudinal direction is same for both methods. The maximum value of is generally larger in the numerical simulation, possibly for the same reason discussed with regard to the wind speed coefficients.
5. Evaluation Method of Wind Barrier Arrangement
5.1. Evaluation Indicators Definitions
5.2. Evaluating Different Wind Barrier Arrangements near a Bridge Pylon Zone
6. Conclusions
- (1)
- The wind environment above the bridge deck near the pylon zone has the obvious characteristics of a typical three-dimensional flow field controlled by the flow around the pylon and girder. The influence range of the flow around the girder is dominant within 0.8 times the girder height in the vertical direction, and the flow around the bridge pylon is dominant within 3 times the pylon width in the longitudinal direction.
- (2)
- The wind velocity above the bridge deck is small behind the pylon columns and suddenly increases outside the pylon, and the maximum value appears near a distance equals to the pylon column width from the center of the bridge pylons. The sudden change caused by the flow around the pylon is unfavorable for driving safety under a crosswind. The wind tunnel experiment and the numerical simulation results both confirm the flow pattern and wind speed distribution. This distribution pattern of the wind environment can effectively guide the arrangement of wind barriers near the bridge pylon zone.
- (3)
- To effectively evaluate the wind barrier effects, this paper proposes a double-index evaluation method that contains the ratio of maximum influence coefficient R and the safety factor of response time K. With the wind distribution pattern and the proposed evaluation scheme, the optimal scheme for the wind barrier arrangement of Sutong Bridge can be determined, and the driving safety significantly improved.
Author Contributions
Funding
Conflicts of Interest
References
- Kim, S.J.; Kim, H.K. Feasibility of a Quasi-Static Approach in Assessing Side-Wind Hazards for Running Vehicles. Appl. Sci. 2019, 9, 3377. [Google Scholar] [CrossRef]
- Baker, C.J. The quantification of risk for road vehicles in cross winds. J. Wind Eng. Ind. Aerodyn. 1994, 52, 93–107. [Google Scholar] [CrossRef]
- Baker, C.J.; Reynolds, S. Wind-induced accidents of road vehicles. Accid. Anal. Prev. 1992, 24, 559–575. [Google Scholar] [CrossRef]
- Snaebjoernsson, J.T.; Baker, C.J.; Sigbjoernsson, R. Probabilistic assessment of road vehicle safety in windy environments. J. Wind Eng. Ind. Aerodyn. 2007, 95, 1445–1462. [Google Scholar] [CrossRef]
- Baker, C.J.; Humphreys, N.D. Assessment of the adequacy of various wind tunnel techniques to obtain aerodynamic data for ground vehicles in cross winds. J. Wind Eng. Ind. Aerodyn. 1996, 60, 49–68. [Google Scholar] [CrossRef]
- Zhu, L.D.; Li, L.; Xu, Y.L.; Zhu, Q. Wind tunnel investigations of aerodynamic coefficients of road vehicles on bridge deck. J. Fluids Struct. 2012, 30, 35–50. [Google Scholar] [CrossRef]
- Han, Y.; Cai, C.S.; Zhang, J.R.; Chen, S.R.; He, X.H. Effects of aerodynamic parameters on the dynamic responses of road vehicles and bridges under cross winds. J. Wind Eng. Ind. Aerodyn. 2014, 134, 78–95. [Google Scholar] [CrossRef]
- Han, Y.; Hu, J.X.; Cai, C.S.; Chen, Z.Q.; Li, C.G. Experimental and numerical studies of aerodynamic forces on vehicles and bridges. Wind Struct. 2013, 17, 163–184. [Google Scholar] [CrossRef]
- Salati, L.; Schito, P.; Rocchi, D.; Sabbioni, E. Aerodynamic Study on a Heavy Truck Passing by a Bridge Pylon under Crosswinds Using CFD. J. Bridge Eng. 2018, 23. [Google Scholar] [CrossRef]
- Cao, J.F.; Zhu, W.J.; Shen, W.Z.; Sorensen, J.N.; Wang, T.G. Development of a CFD-Based Wind Turbine Rotor Optimization Tool in Considering Wake Effects. Appl. Sci. 2018, 8, 1056. [Google Scholar] [CrossRef]
- Chen, W.L.; Gao, D.L.; Laima, S.J.; Li, H. A Field Investigation on Vortex-Induced Vibrations of Stay Cables in a Cable-Stayed Bridge. Appl. Sci. 2019, 9, 4556. [Google Scholar] [CrossRef]
- Huang, Z.W.; Li, Y.Z.; Hua, X.G.; Chen, Z.Q.; Wen, Q. Automatic Identification of Bridge Vortex-Induced Vibration Using Random Decrement Method. Appl. Sci. 2019, 9, 2049. [Google Scholar] [CrossRef]
- Argentini, T.; Ozkan, E.; Rocchi, D.; Rosa, L.; Zasso, A. Cross-wind effects on a vehicle crossing the wake of a bridge pylon. J. Wind Eng. Ind. Aerodyn. 2011, 99, 734–740. [Google Scholar] [CrossRef]
- Li, Y.L.; Hu, P.; Cai, C.S.; Zhang, M.J.; Qiang, S.Z. Wind Tunnel Study of a Sudden Change of Train Wind Loads due to the Wind Shielding Effects of Bridge Towers and Passing Trains. J. Eng. Mech. 2013, 139, 1249–1259. [Google Scholar] [CrossRef]
- Wang, D.; Chen, A.; Ma, R. Influence of wind barrier on aerodynamic characteristics of automobiles on bridge girder near pylon. Eng. Mech. 2013, 30, 244–250. (In Chinese) [Google Scholar]
- Wang, D.; Chen, A. Assessment of lateral driving stability of automobiles passing by the pylon zone under cross wind. Res. J. Appl. Sci. Eng. Technol. 2012, 4, 2735–2739. [Google Scholar]
- Bettle, J.; Holloway, A.G.L.; Venart, J.E.S. A computational study of the aerodynamic forces acting on a tractor-trailer vehicle on a bridge in cross-wind. J. Wind Eng. Ind. Aerodyn. 2003, 91, 573–592. [Google Scholar] [CrossRef]
- Zhang, N.; Ge, G.H.; Xia, H.; Li, X.Z. Dynamic analysis of coupled wind-train-bridge system considering tower shielding and triangular wind barriers. Wind Struct. 2015, 21, 311–329. [Google Scholar] [CrossRef]
- Su, Y.; Xiang, H.Y.; Fang, C.; Wang, L.; Li, Y.L. Wind tunnel tests on flow fields of full-scale railway wind barriers. Wind Struct. 2017, 24, 171–184. [Google Scholar] [CrossRef]
- Wu, X.X.; Zou, X.Y.; Zhang, C.L.; Wang, R.D.; Zhao, J.Y.; Zhang, J.Q. The effect of wind barriers on airflow in a wind tunnel. J. Arid Environ. 2013, 97, 73–83. [Google Scholar] [CrossRef]
- Liu, H.S.; Lei, J.Q.; Zhu, L. Identification and Application of the Aerodynamic Admittance Functions of a Double-Deck Truss Girder. Appl. Sci. 2019, 9, 1818. [Google Scholar] [CrossRef]
- Lo, K.H.; Sriram, R.; Kontis, K. Wake Flow Characteristics over an Articulated Lorry Model with/without AC-DBD Plasma Actuation. Appl. Sci. 2019, 9, 2426. [Google Scholar] [CrossRef]
- Zhang, L.Q.; Chen, G.B.; Chen, W.L.; Gao, D.L. Separation Control on a Bridge Box Girder Using a Bypass Passive Jet Flow. Appl. Sci. 2017, 7, 501. [Google Scholar] [CrossRef]
- Alonso-Estebanez, A.; Del Coz Diaz, J.J.; Rabanal, F.P.A.; Pascual-Munoz, P. Performance analysis of wind fence models when used for truck protection under crosswind through numerical modeling. J. Wind Eng. Ind. Aerodyn. 2017, 168, 20–31. [Google Scholar] [CrossRef]
- Kozmar, H.; Procino, L.; Borsani, A.; Bartoli, G. Optimizing height and porosity of roadway wind barriers for viaducts and bridges. Eng. Struct. 2014, 81, 49–61. [Google Scholar] [CrossRef]
- Telenta, M.; Duhovnik, J.; Kosel, F.; Sajn, V. Numerical and experimental study of the flow through a geometrically accurate porous wind barrier model. J. Wind Eng. Ind. Aerodyn. 2014, 124, 99–108. [Google Scholar] [CrossRef]
- Anderson, J.D. Computational Fluid Dynamics: The Basics with Applications; McGraw-Hill, Inc.: New York, NY, USA, 1995. [Google Scholar]
- Zhong, W.; Tang, H.W.; Wang, T.G.; Zhu, C.Y. Accurate RANS Simulation of Wind Turbine Stall by Turbulence Coefficient Calibration. App. Sci. 2018, 8, 1444. [Google Scholar] [CrossRef]
- Kim, S.J.; Yoo, C.H.; Kim, H.K. Vulnerability assessment for the hazards of crosswinds when vehicles cross a bridge deck. J. Wind Eng. Ind. Aerodyn. 2016, 156, 62–71. [Google Scholar] [CrossRef]
- Wang, D.L. Study on Wind-induced Driving Safety of Vehicle on Bridges. In Civil Engineering; Tongji University: Shanghai, China, 2010. [Google Scholar]







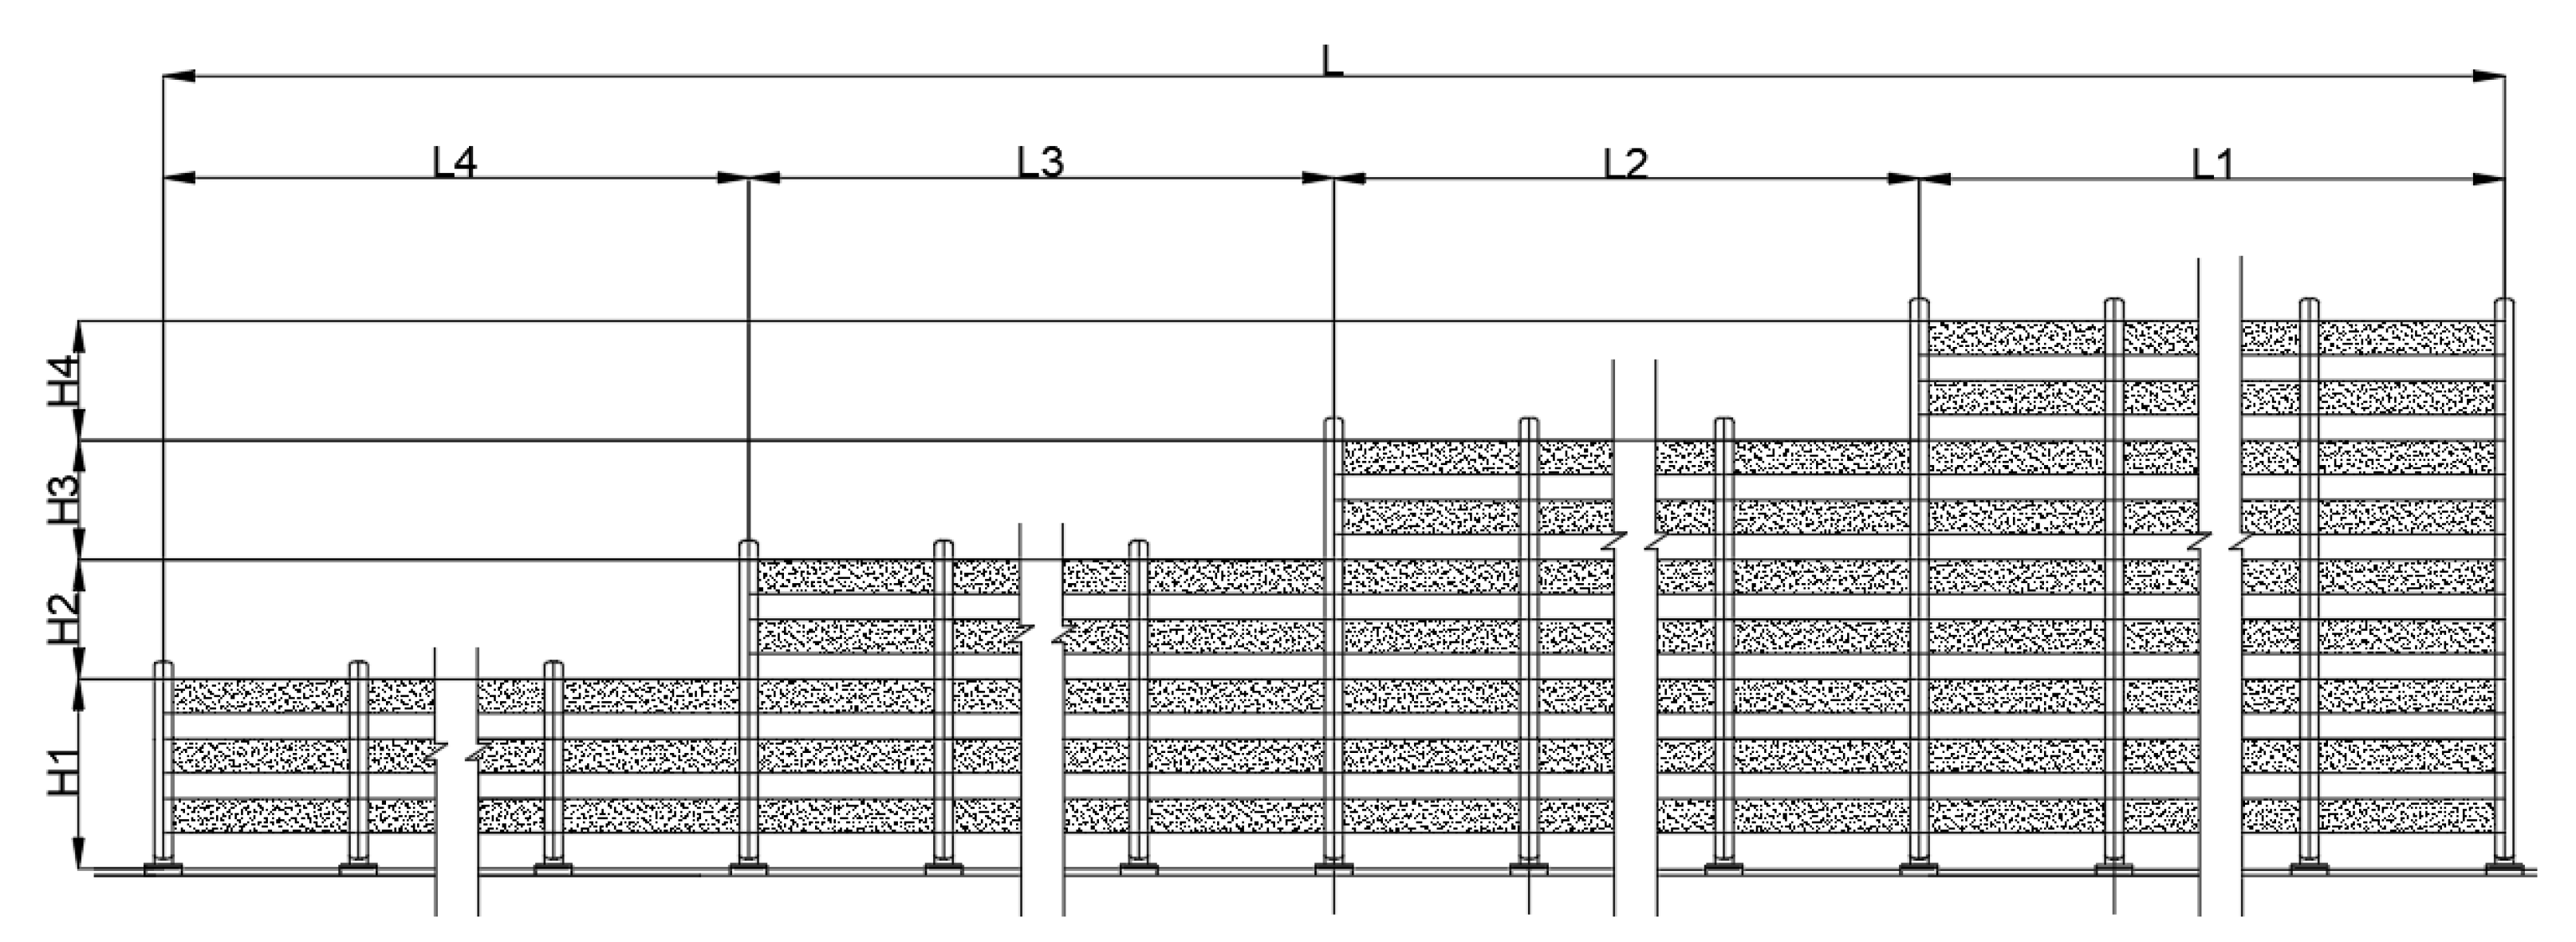

| L* | L1 | L2 | L3 | L4 | |
|---|---|---|---|---|---|
| Scheme 1 | 25 | 7 | 6 | 6 | 6 |
| Scheme 2 | 41 | 11 | 10 | 10 | 10 |
| Scheme 3 | 57 | 15 | 14 | 14 | 14 |
| Condition | λs | R | Ld (m) | K | ||
|---|---|---|---|---|---|---|
| V1* | V2 | V3 | ||||
| C1 | 1.304 | 1.427 | 16.00 | 0.7 | 0.9 | 1.2 |
| C2 | 1.114 | 1.219 | 20.00 | 0.9 | 1.1 | 1.5 |
| Scheme 1 | 1.009 | 1.104 | 40.00 | 1.8 | 2.3 | 3.0 |
| Scheme 2 | 0.965 | 1.056 | 56.00 | 2.5 | 3.2 | 4.2 |
| Scheme 3 | 0.918 | 1.004 | 72.00 | 3.2 | 4.1 | 5.4 |
© 2020 by the authors. Licensee MDPI, Basel, Switzerland. This article is an open access article distributed under the terms and conditions of the Creative Commons Attribution (CC BY) license (http://creativecommons.org/licenses/by/4.0/).
Share and Cite
Wang, D.; Zhang, Y.; Sun, M.; Chen, A. Characteristics of the Wind Environment above Bridge Deck near the Pylon Zone and Wind Barrier Arrangement Criteria. Appl. Sci. 2020, 10, 1437. https://doi.org/10.3390/app10041437
Wang D, Zhang Y, Sun M, Chen A. Characteristics of the Wind Environment above Bridge Deck near the Pylon Zone and Wind Barrier Arrangement Criteria. Applied Sciences. 2020; 10(4):1437. https://doi.org/10.3390/app10041437
Chicago/Turabian StyleWang, Dalei, Yiquan Zhang, Mengjin Sun, and Airong Chen. 2020. "Characteristics of the Wind Environment above Bridge Deck near the Pylon Zone and Wind Barrier Arrangement Criteria" Applied Sciences 10, no. 4: 1437. https://doi.org/10.3390/app10041437
APA StyleWang, D., Zhang, Y., Sun, M., & Chen, A. (2020). Characteristics of the Wind Environment above Bridge Deck near the Pylon Zone and Wind Barrier Arrangement Criteria. Applied Sciences, 10(4), 1437. https://doi.org/10.3390/app10041437


