Article

Steady-Suction-Based Flow Control of Flutter of Long-Span Bridge

1
School of Civil Engineering, Harbin Institute of Technology, Harbin 150090, China
2
School of Civil Engineering, Northeast Forestry University, Harbin 150040, China
3
Hunan Provincial Key Lab for Wind Engineering & Bridge Engineering, Hunan University, Changsha 410082, China
*
Author to whom correspondence should be addressed.
Appl. Sci. 2020, 10(4), 1372; https://doi.org/10.3390/app10041372
Submission received: 15 January 2020 / Revised: 11 February 2020 / Accepted: 13 February 2020 / Published: 18 February 2020
(This article belongs to the Special Issue Bridge Dynamics)

Abstract

:

Featured Application

In this work, the effect of steady-suction-based flow control method on flutter performance of long-span bridges was studied by wind tunnel tests. This work can assist the application of this method in practical engineering.

Abstract

The present wind tunnel study focuses on the effects of the steady-suction-based flow control method on the flutter performance of a 2DOF bridge deck section model. The suction applied to the bridge model was released from slots located at the girder bottom. The suction rates of all slots along the span were equal and constant. A series of test cases with different combinations of suction slot positions, suction intervals, and suction rates were studied in detail for the bridge deck model. The experimental results showed that the steady-suction-based flow control method could improve the flutter characteristics of the bridge deck with a maximal increase in the critical flutter speed of up to 10.5%. In addition, the flutter derivatives (FDs) of the bridge deck with or without control were compared to investigate the fundamental mechanisms of the steady-suction-based control method. According to the results, installing a suction control device helps to strengthen aerodynamic damping, which is the primary cause for enhanced flutter performance of bridge decks.

1. Introduction

Bridge flutter is a catastrophic dynamic aeroelastic phenomenon that occurs due to interactions between wind and the vibrating bridge deck and can induce a total structural collapse. When the inflowing wind is faster than the critical flutter speed, the bridge girder structure extracts energy from the free stream flow for a divergent response. Therefore, flutter is one of the most important factors in the design of a long-span bridge and must not occur during its life cycle. Owing to the increasing bridge span, the flutter problem has become increasingly prominent, and new wind-resisting strategies and techniques are necessary.
Alternative approaches have been presented for cases where the parameters of the structure itself cannot meet the design requirements (i.e., the critical flutter wind speed) of the structure. These are classified into mechanical strategies and flow control strategies. Regarding the mechanical methods, passive approaches with tuned mass dampers (TMDs) have been widely studied. Nobuto et al. [1] studied the control effectiveness of a TMD to suppress the coupled flutter of a bridge deck. The result was a maximal critical flutter wind speed increment of approximately 14%. Pourzeynali and Datta [2] introduced an effective TMD control system with two degrees of freedom for a suspension bridge. Furthermore, they optimized important TMD parameters for a better control effect. However, the excellent control performance of TMDs relies heavily on exact tuning to the controlled mode. Hence, the control causes severe deteriorations when the system parameters slightly deviate from their optimal values. To overcome the poor robustness of TMDs, Igusa and Xu [3] first proposed multiple TMDs (MTMDs). These are composed of many small TMDs, which are each tuned to a different dominant frequency. Numerous studies have been carried out on MTMDs and have proved the robustness of the system [4,5,6]. Nevertheless, MTMDs occupy a large working space because of their complex configuration and are thus inapplicable to long-span bridges. Therefore, active mass dampers (AMDs) have been investigated and proposed. Körlin and Starossek [7] achieved a critical wind speed increase of up to approximately 16.5% through the implementation of an AMD to a bridge section model. Although the AMD control effect is remarkable, the economic efficiency is relatively unsatisfactory owing to the high external energy consumption.
The flutter control measurements mentioned previously focus on optimizing the dynamic properties of a bridge structure. Modifying the flow field around the bridge deck and redistributing the aerodynamic forces exerted on the structure is another, more economical approach to mitigate wind-induced excitations. The so-called flow control method can be divided into passive and active methods. The passive approaches have been widely applied to practical engineering applications owing to their simplicity and reliability. The central stabilizer for the Runyang Bridge, the central slot for the Xihoumen Bridge, the Tsing Ma Bridge, the slot and stabilizer for the Akashi Kaikyo Bridge, and the guide vane for the Great Belt Bridge are a few examples [8]. However, passive control methods cannot solve the flutter problem for any velocity and attack angle of the oncoming wind. For this reason, active flow control methods that require external energy provided by auxiliary devices have been developed. Furthermore, the energy required for active flow facilities is much lower than that required for AMD systems because the former is only used to modify the flow field around the deck rather than to stabilize the structure directly. Munshi et al. [9] and Kubo et al. [10] experimentally investigated the effects of active flow control on the aerodynamic characteristics of a structure. The results showed that the boundary layer separation could be delayed, which led to a remarkable drag reduction and a significant improvement in the structural stability. In addition, in recent years, the study of fluid-conveying tubes has also received more and more attention from researchers [11,12,13].
Steady-suction-based flow control, inspired by the aerospace industry, is regarded as a promising open-loop active flow control technique. It is a classical method that improves the aerodynamic performance of the bluff body by changing its aerodynamic shape instead of its physical shape. The suction applied to the surface can cause a global modification of the flow field around the bluff body through interaction with the boundary layer. Thus, the separation of the flow and vortex shedding can be inhibited, and the aerodynamic loading can be greatly reduced. Evidently, modifying the aerodynamic shape is much easier and more economical than modifying the structural shape. Thus, many researchers have conducted further investigations to improve the aerodynamic shape through various methods. Although extensive studies on the suction flow control (mainly for aeronautical applications) have been conducted in recent decades, relatively low effort has been devoted toward exploiting this method to enhance the wind resistance capacity of bridges. Chen et al. [14] successfully controlled the vortex-induced vibration (VIV) of stay cables of cable-stayed bridges by adopting the suction control method. Furthermore, Xin and Ou [15] first proposed the application of the suction control method to mitigate the wind-induced vibrations of a bridge girder. In a follow-up study, they verified the effectiveness of the steady-suction method regarding the improvement of the flutter performance of long bridges based on numerical simulations [16]. However, the necessary experimental verification has not been conducted, and the effect of the installed suction device on the bridge girder is unknown.
Therefore, the objective of the present study was to design a steady-suction control system applicable to bridge section models and to investigate the control effect on structural flutter performance through wind tunnel tests. The suction rate of all slots along the span were constant and equal. We considered three experimental variables: the suction slot position, suction interval, and suction rate. The critical flutter speeds of the bridge model with or without a control system were compared to examine the effectiveness and applicability of the self-designed control system. In addition, the measured flutter derivatives (FDs), which are essential for flutter analysis, were compared and analyzed for all test cases to thoroughly examine the control mechanism of the steady-suction flow control.

2. Experimental Set-Up
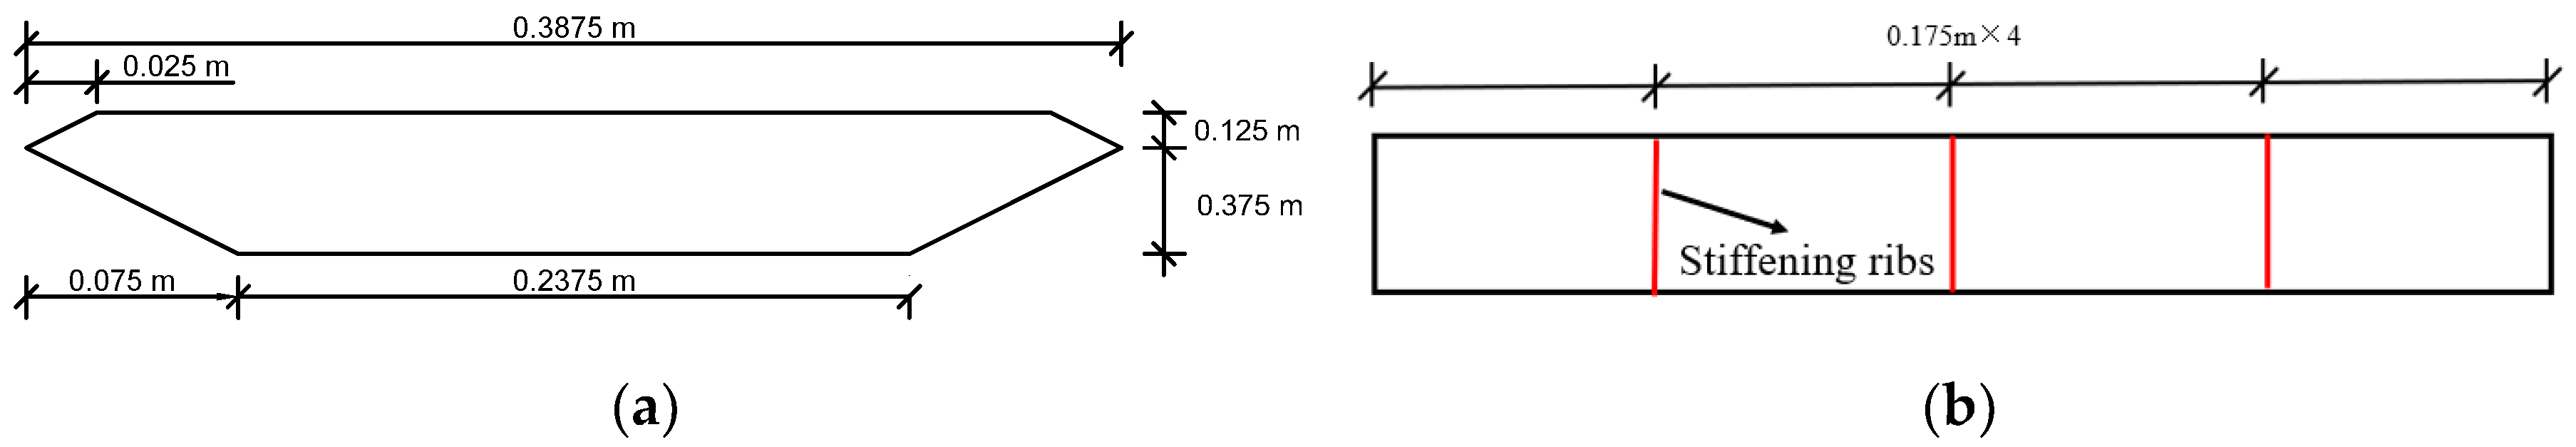
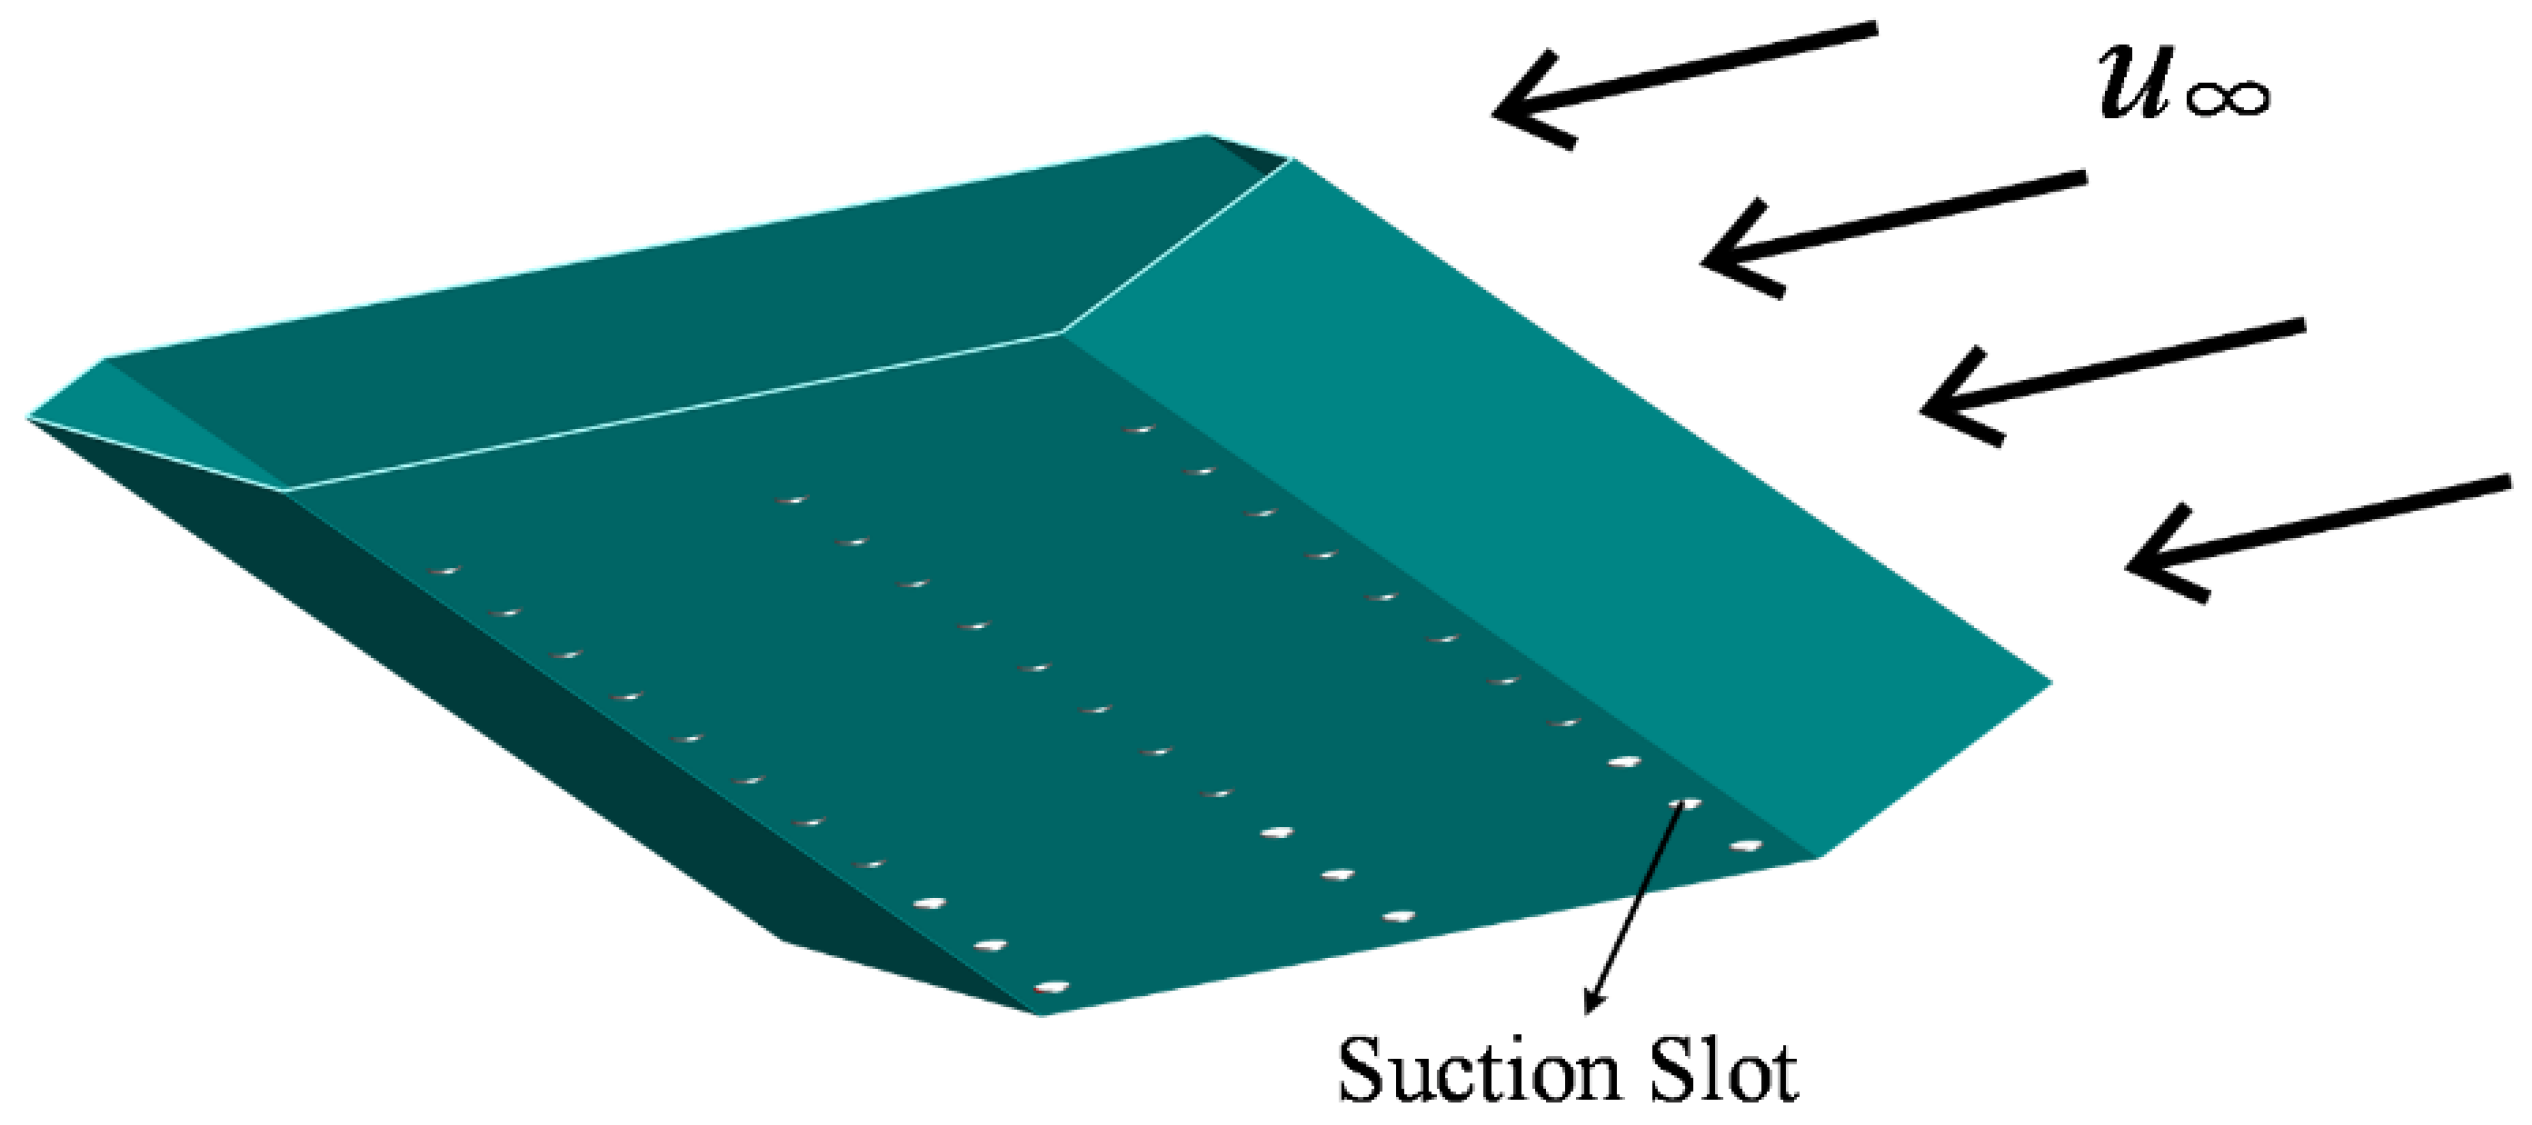
2.1. Models

A simplified bridge deck section model of the Great Belt East Bridge without deck-related facilities was manufactured (1:80 scale, 0.7 m length, 0.3875 m width, and 0.05 m girder depth; Figure 1). The model surface was made of acrylonitrile–butadiene–styrene Plexiglas, and stiffening ribs were rigidly installed inside the model for an adequate vertical stiffness. The mass and mass moment inertia of the deck section, including the contribution from the suction pipes, were 3.701 kg/m and 0.061 kg·m2/m, respectively. The end plates were placed on both sides of the bridge section model to ensure the two-dimensional characteristics of the oncoming wind flow. According to the geometrical size of the model, the wind tunnel blockage ratio was approximately 1.7%. Hence, its influence was considered to be negligible. Furthermore, three rows of suction slots were introduced to the low surface of the bridge deck. One row had 11 suction slots, and the distance between two adjacent slots was 0.05 m, which was equal to the section model depth. The detailed layout of the suction slots is shown in Figure 2.

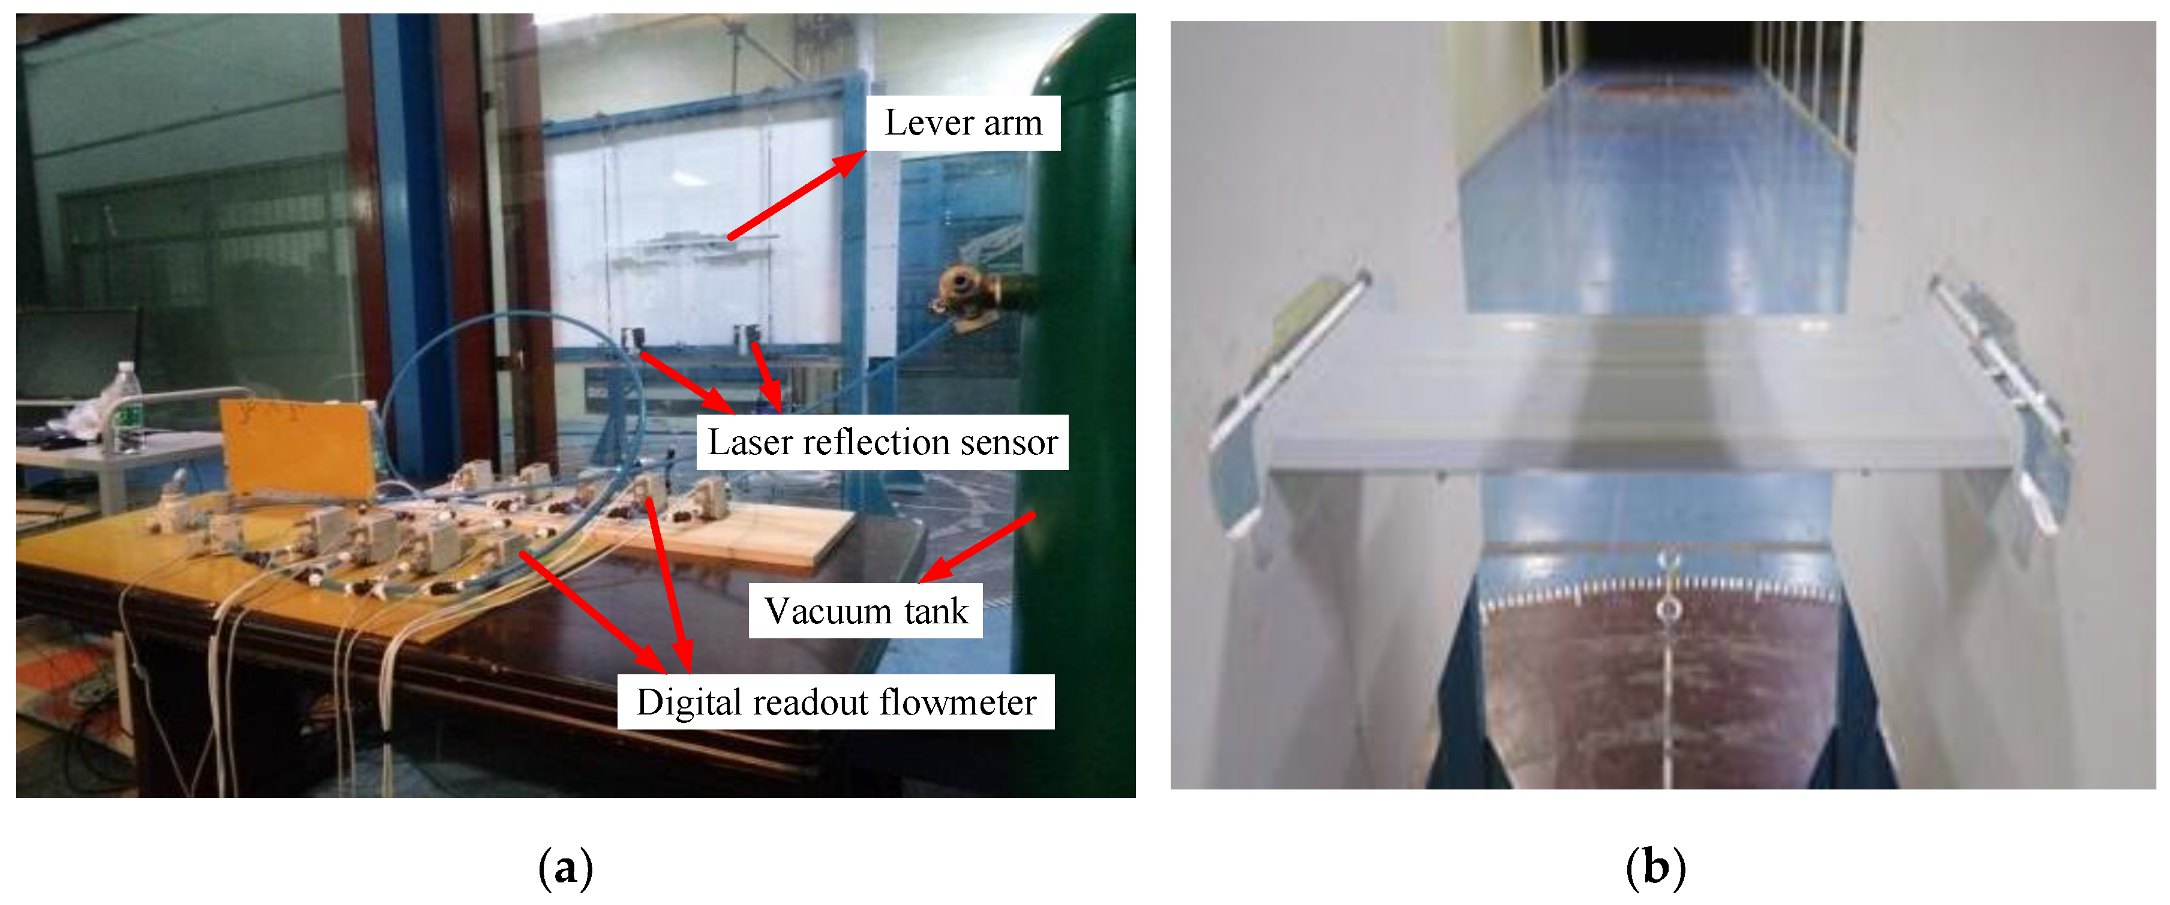
2.2. Wind Tunnel Set-Up and Test Measurements

The experiments were conducted in a closed-circuit wind tunnel located in the Department of Civil Engineering at the Harbin Institute of Technology. The test section of the wind tunnel was 3.0 m in height, 4.0 m in width, and 25 m in length; the available wind velocity range was 2–45 m/s. Moreover, the maximal free-stream turbulence intensity was 0.46%, and the maximal free-stream nonuniformity was 1%. In this study, the oncoming flow was uniform and smooth. A very fine scan of the wind speed range of interest was conducted for each test case. During the tests, the bridge model was mounted inside the wind tunnel with a suspension system consisting of eight coil springs and two supporting frames, which established the heave and pitch stiffness of the bridge section model. The natural vertical and torsional frequencies of the overall test model in still air were 2.586 and 6.8 Hz, respectively, with an acceptable deviation within 5% compared to the design values of 2.548 and 7.092 Hz, respectively. The vertical and torsional damping ratio of the overall test model were 0.44% and 0.74%, respectively. It should be mentioned that, whether or not suction control was applied, the bridge model was connected to the suction control device throughout the test process, including the measurement stage of frequencies and damping ratios. Two laser reflection sensors set in pairs were installed underneath one side of the test section and aimed at the reflected target set on the lever arm. They were used to measure the vertical and torsional responses of the model. The signals from the reflection gauges were sampled at 1000 Hz. Furthermore, steady suction was realized by installing a self-designed suction control system. Figure 3a depicts details of the control system. The suction pump pumped the air out of the vacuum tank to generate differential pressure. This provided suction power at the bottom of the bridge deck. The digital readout flowmeter used to monitor the flow rate and the pneumatic junction throttle employed to adjust the suction flow were installed in the control system to ensure a precise control device. Moreover, the suction control device was connected to the test model through air suction pipes. The overall model configuration of the wind tunnel is shown in Figure 3a,b.
In this study, the effects of the test variables, including the suction slot position, suction interval, and suction rate, on the control were studied in detail. To distinguish between the positions of the suction slots, positions on the windward side were denoted by l, positions in the middle were denoted by m, and positions on the leeward side were denoted by b. The suction interval was expressed in a nondimensional form as λ = d / H , where λ is the relative suction interval, d is the distance between two adjacent slots, and H is the model section height. The suction rate was also described in a nondimensional form as C q = Q / U max L H , where C q is the relative single-slot suction flow rate, Q the single-slot suction flow rate, U max the maximal upcoming wind velocity, and L the model length.
Three test cases with three different locations of suction slot rows (i.e., on the windward side, in the middle, and on the leeward side) were investigated to determine the best suction position. In addition, to systematically investigate the influence of different suction intervals and suction flow rates on the flutter instability of the bridge, four representative relative suction intervals ( λ ) (i.e., λ = 1, 2, 3, 4) and three relative suction flow rates (i.e., C q = 0.00174, 0.0244, and 0.00348 corresponding to Q = 5, 7, and 10 L/min, respectively) were selected for the specified suction positions. In total, nine test cases (Table 1) were adopted with a naming standard. For example, l-2d-10 implies that the suction position was on the windward side, the relative suction interval ( λ ) was 2, and the single-slot suction flow rate was 10 L/min. Moreover, s00 denotes the single-deck case without steady-suction control.

3. Results and Discussion

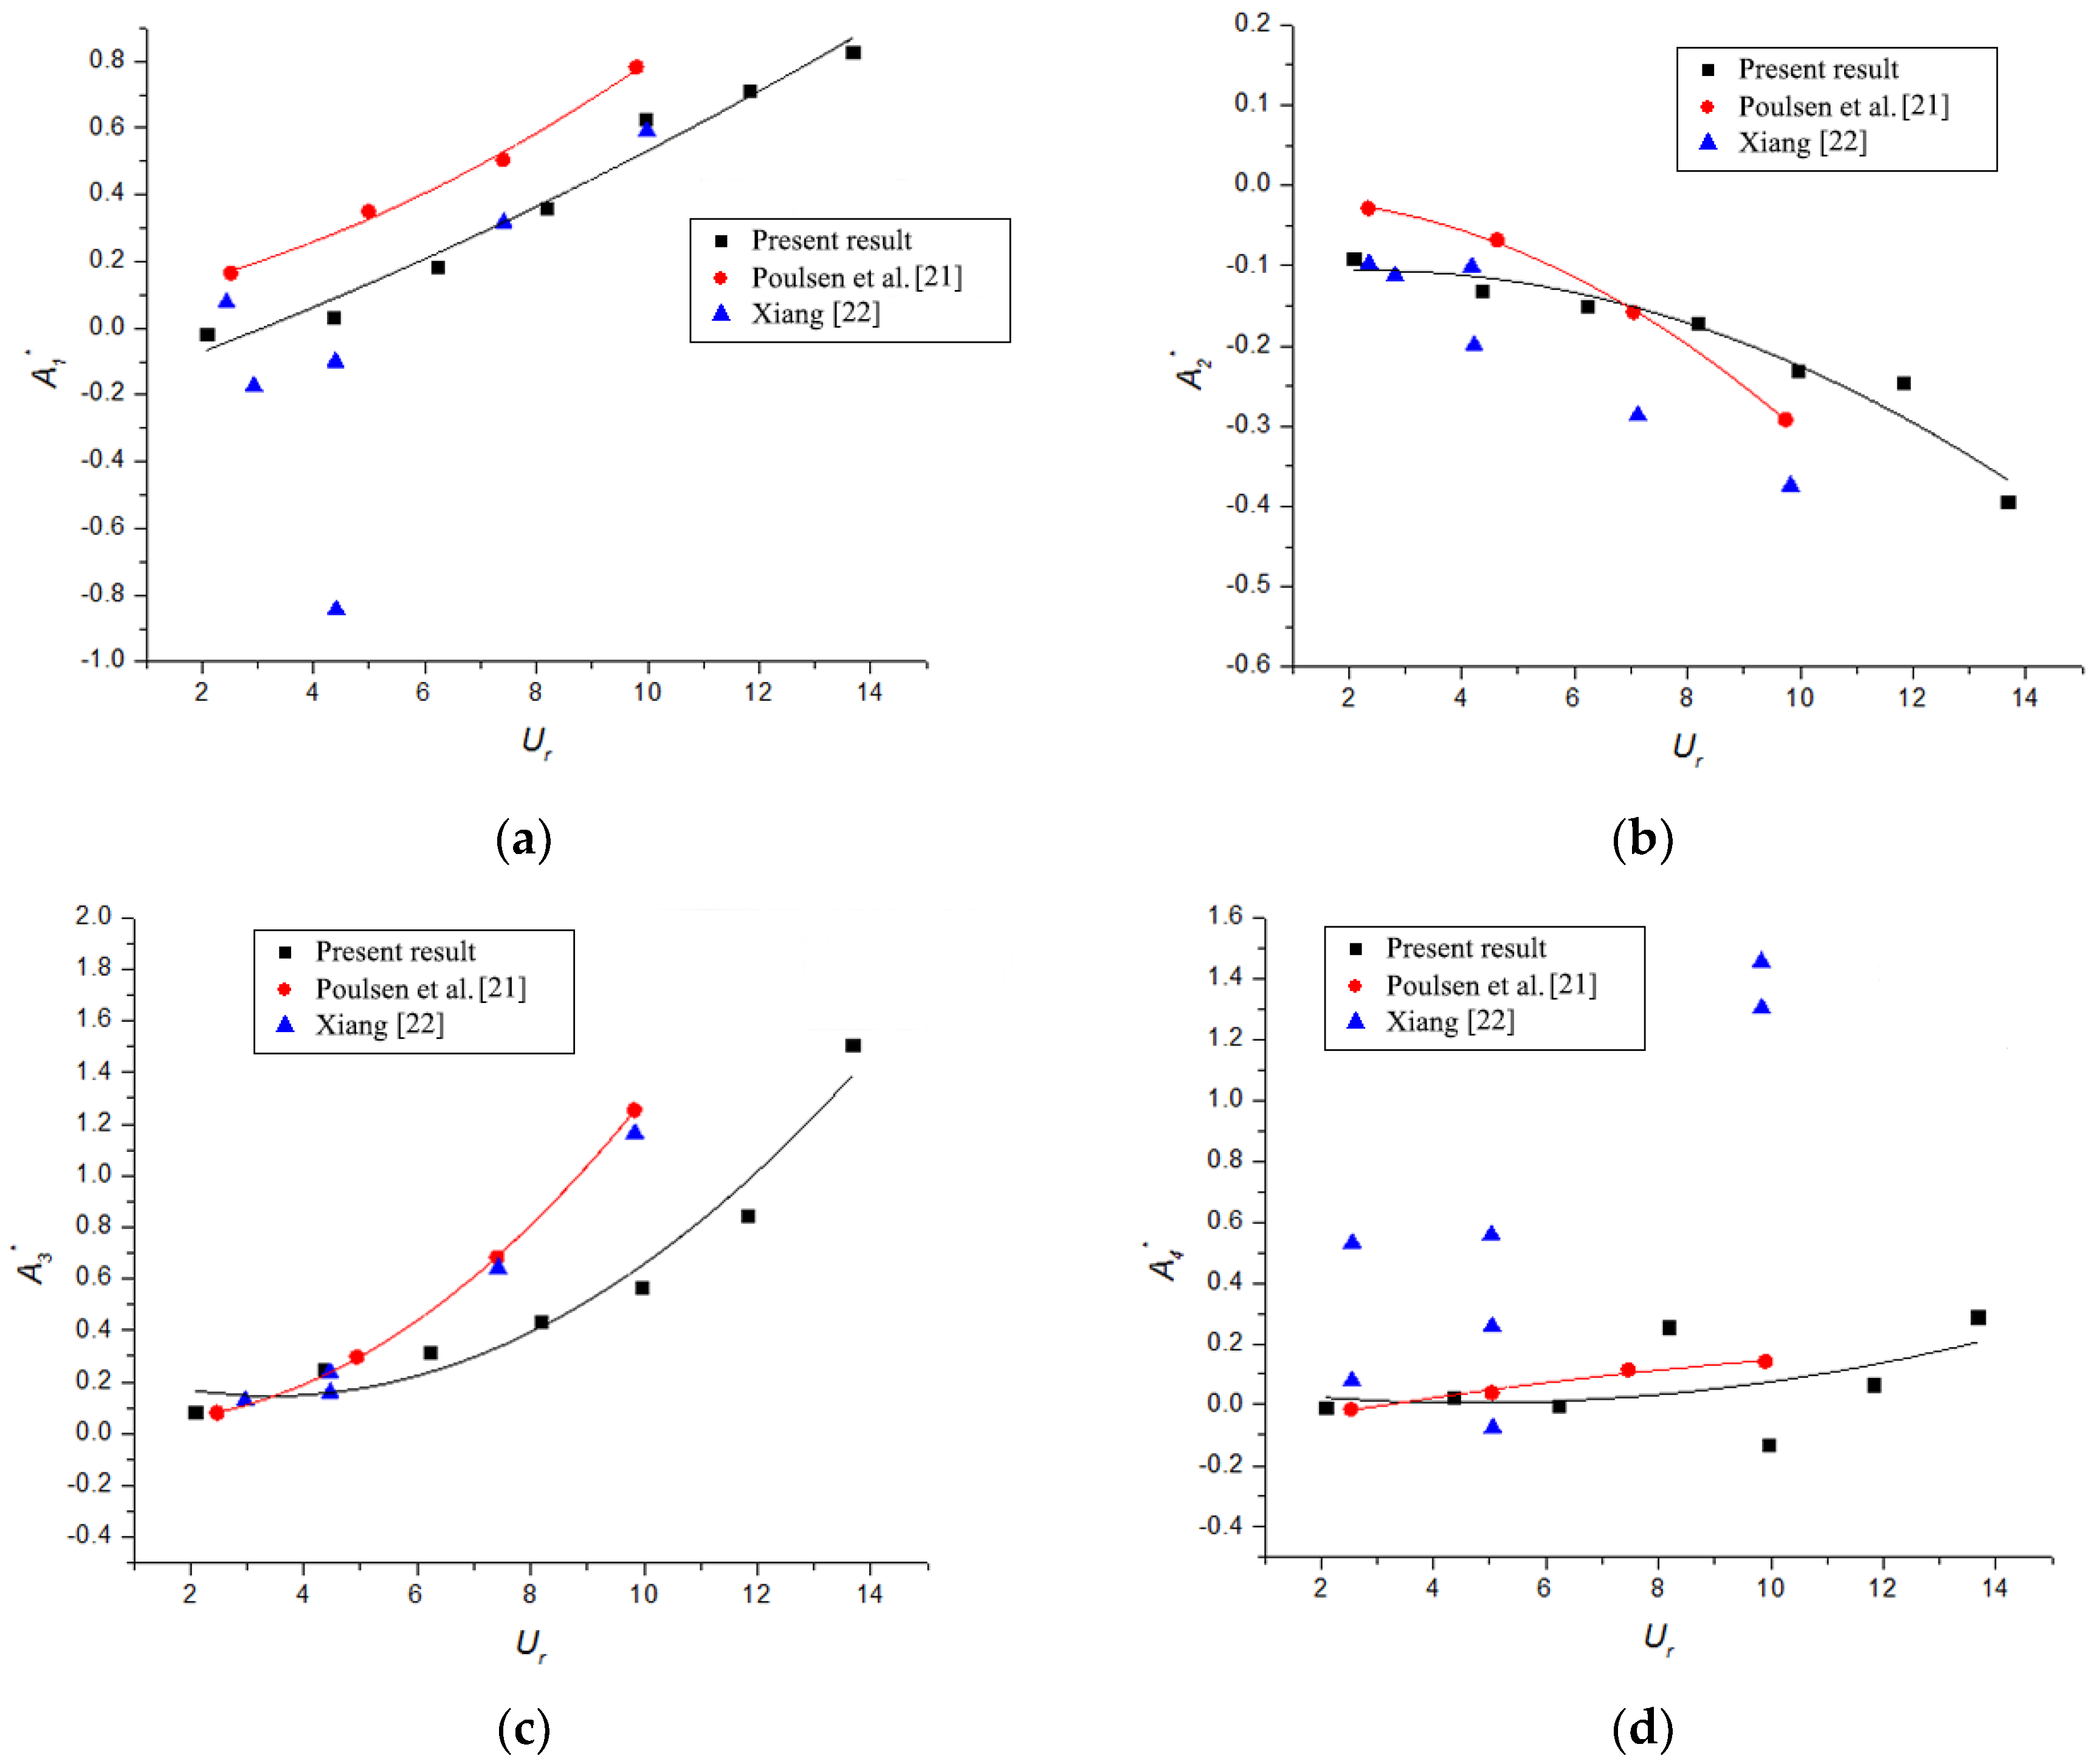
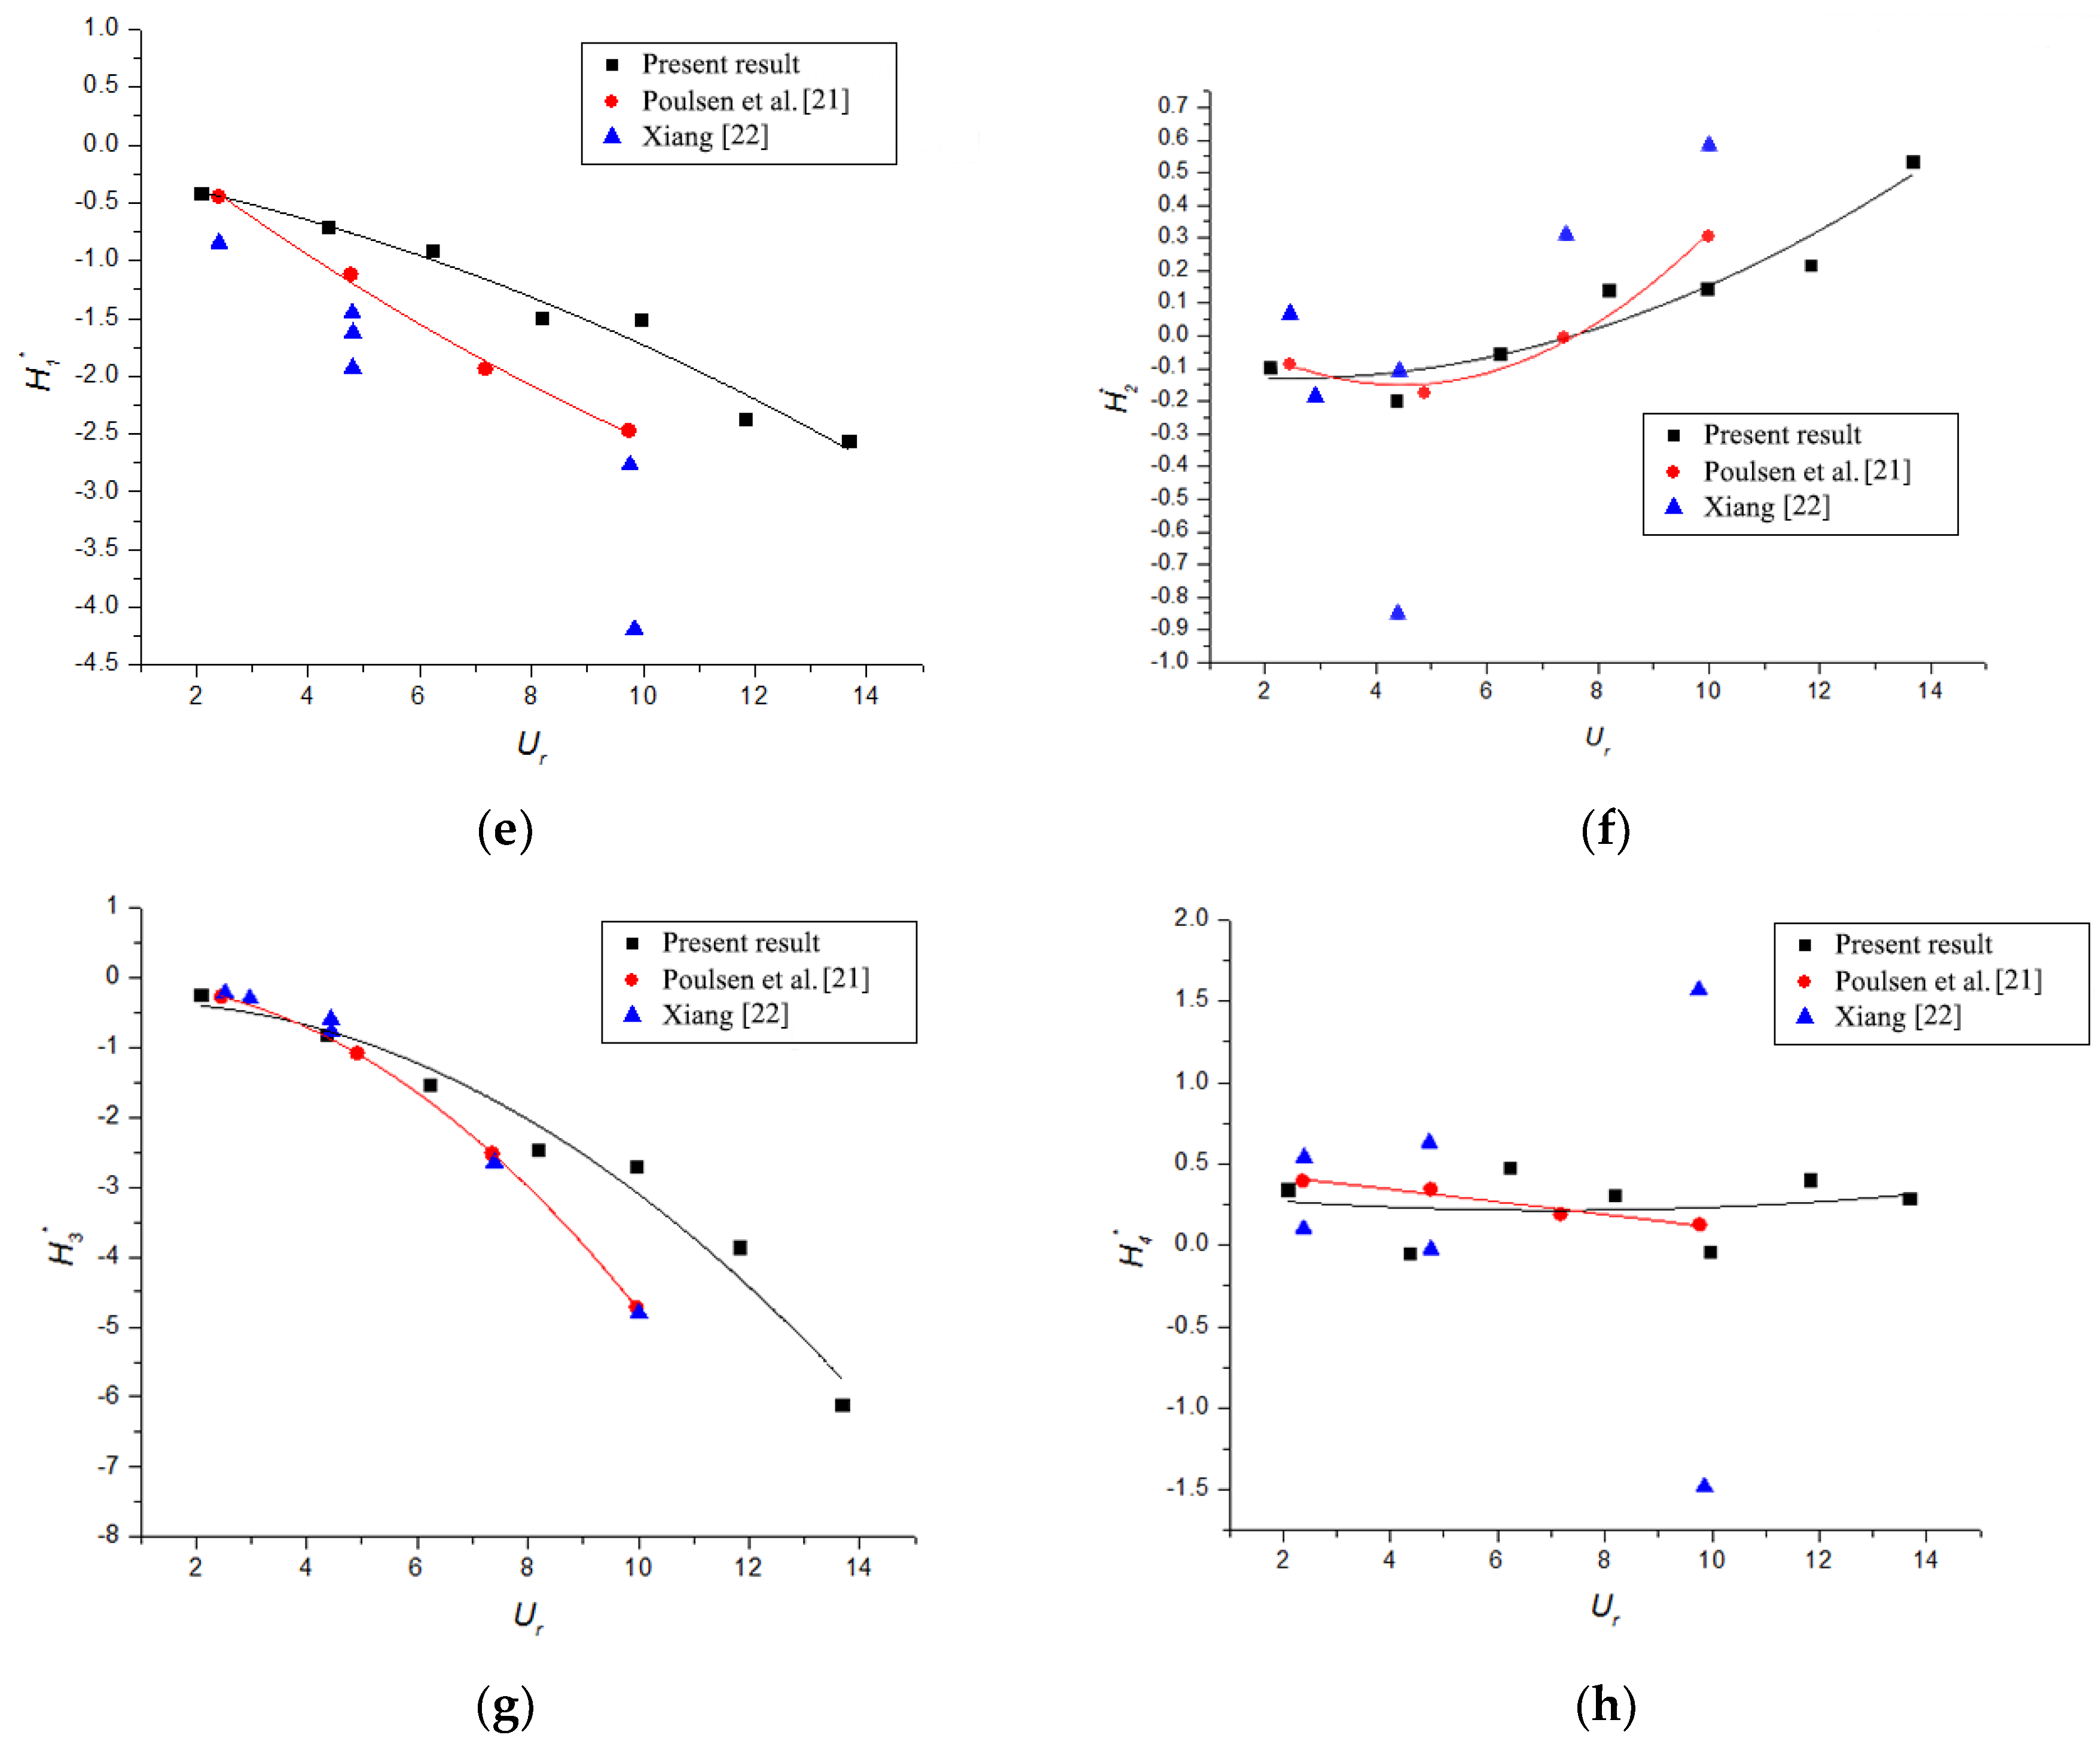
3.1. Experiment Validation

To verify the positive effect of the steady-suction control on the bridge flutter performance, two types of information should be collected: (1) the geometric information of the model and (2) important aerodynamic parameters, including the FDs and critical flutter speed obtained through the FDs. Table 2 lists the structural information of the actual bridge and bridge section model, including the geometric dimensions, mass characteristics, and vertical and torsional frequencies.
Flutter derivatives are important aerodynamic parameters for the evaluation of the vibration tendency of a bluff body under flow action, and they provide a better insight into the flutter sensitivity of bridge decks. Therefore, FD identification is an indispensable step. Scanlan and Tomo [17] proposed the application of FDs to define a linear aeroelastic system. The FDs are identified in experiments and used to estimate the self-excited forces acting on the vibrating body, which can be expressed as linear combinations of the body motions:
F s e = [ 1 2 ρ U 2 B ( K H 1 * h U + K H 2 * B α U + K 2 H 3 * α + K 2 H 4 * h B ) 1 2 ρ U 2 B ( K A 1 * h U + K A 2 * B α U + K 2 A 3 * α + K 2 A 4 * h B ) ]
where F s e represents the motion-related self-excited forces, including the aeroelastic lift and pitching moment forces; B denotes the section width, ρ is the air density, U is the far-field wind speed, K is the reduced frequency defined as K = 2 π f B / U with f as vibration frequency of the model; H i and A i ( i = 1 4 ) are the FDs; and h and α are the vertical and torsional displacements, respectively.
Numerous theories have been developed to determine the FDs in wind tunnel tests [18,19,20]. In this study, the iterative least-squares (ILS) theory proposed by Chowdhury and Sarkar [20] was adopted to determine the FDs. Specifically, the experiments were conducted with the free-vibration technique, and the initial forced displacements were applied to the bridge model in the vertical and rotational directions. Then, the free-decay oscillations under different wind speeds were measured (inlet wind speeds of 2, 4, 6, 8, 10, 12, and 14 m/s were considered). After obtaining the time history response, the FDs were determined using the ILS method. Finally, based on the determined FDs, the flutter motion equation was solved to obtain the critical flutter velocity with the conventional method (omitted for brevity).
To validate the reported results, the FDs and critical flutter speed of the bridge section model without a control system were compared with previous results of a similar bridge deck section investigated by Poulsen et al. [21] and Xiang [22]. Figure 4 compares the results of eight FDs. In order to clearly compare the trends of FDs, the data were fitted into a smooth curve using a quadratic polynomial with one variable. The values and trends of the FDs A 1 , A 2 , A 4 , H 2 , and H 4 agreed well with those of previous studies. However, some deviations at isolated points, as shown in Figure 4c,e,g, existed, which belonged to A 3 , H 1 , and H 3 . Nevertheless, the overall trends were consistent. Two possible reasons exist for the previously mentioned discrepancy. The first one might be the minor differences in the design of the tested bridge deck section; the second reason is that the ILS method used for extracting the FDs is dependent on the actual situation. In general, the extraction results of the FDs were acceptable for subsequent analysis. The obtained FDs were used to deduce the critical flutter speed, which was 76.65 m/s and approximately the results of other researchers (73 and 74 m/s in Poulsen et al. [21] and Xiang [22], respectively). The comparison implies that the experimental results are credible.

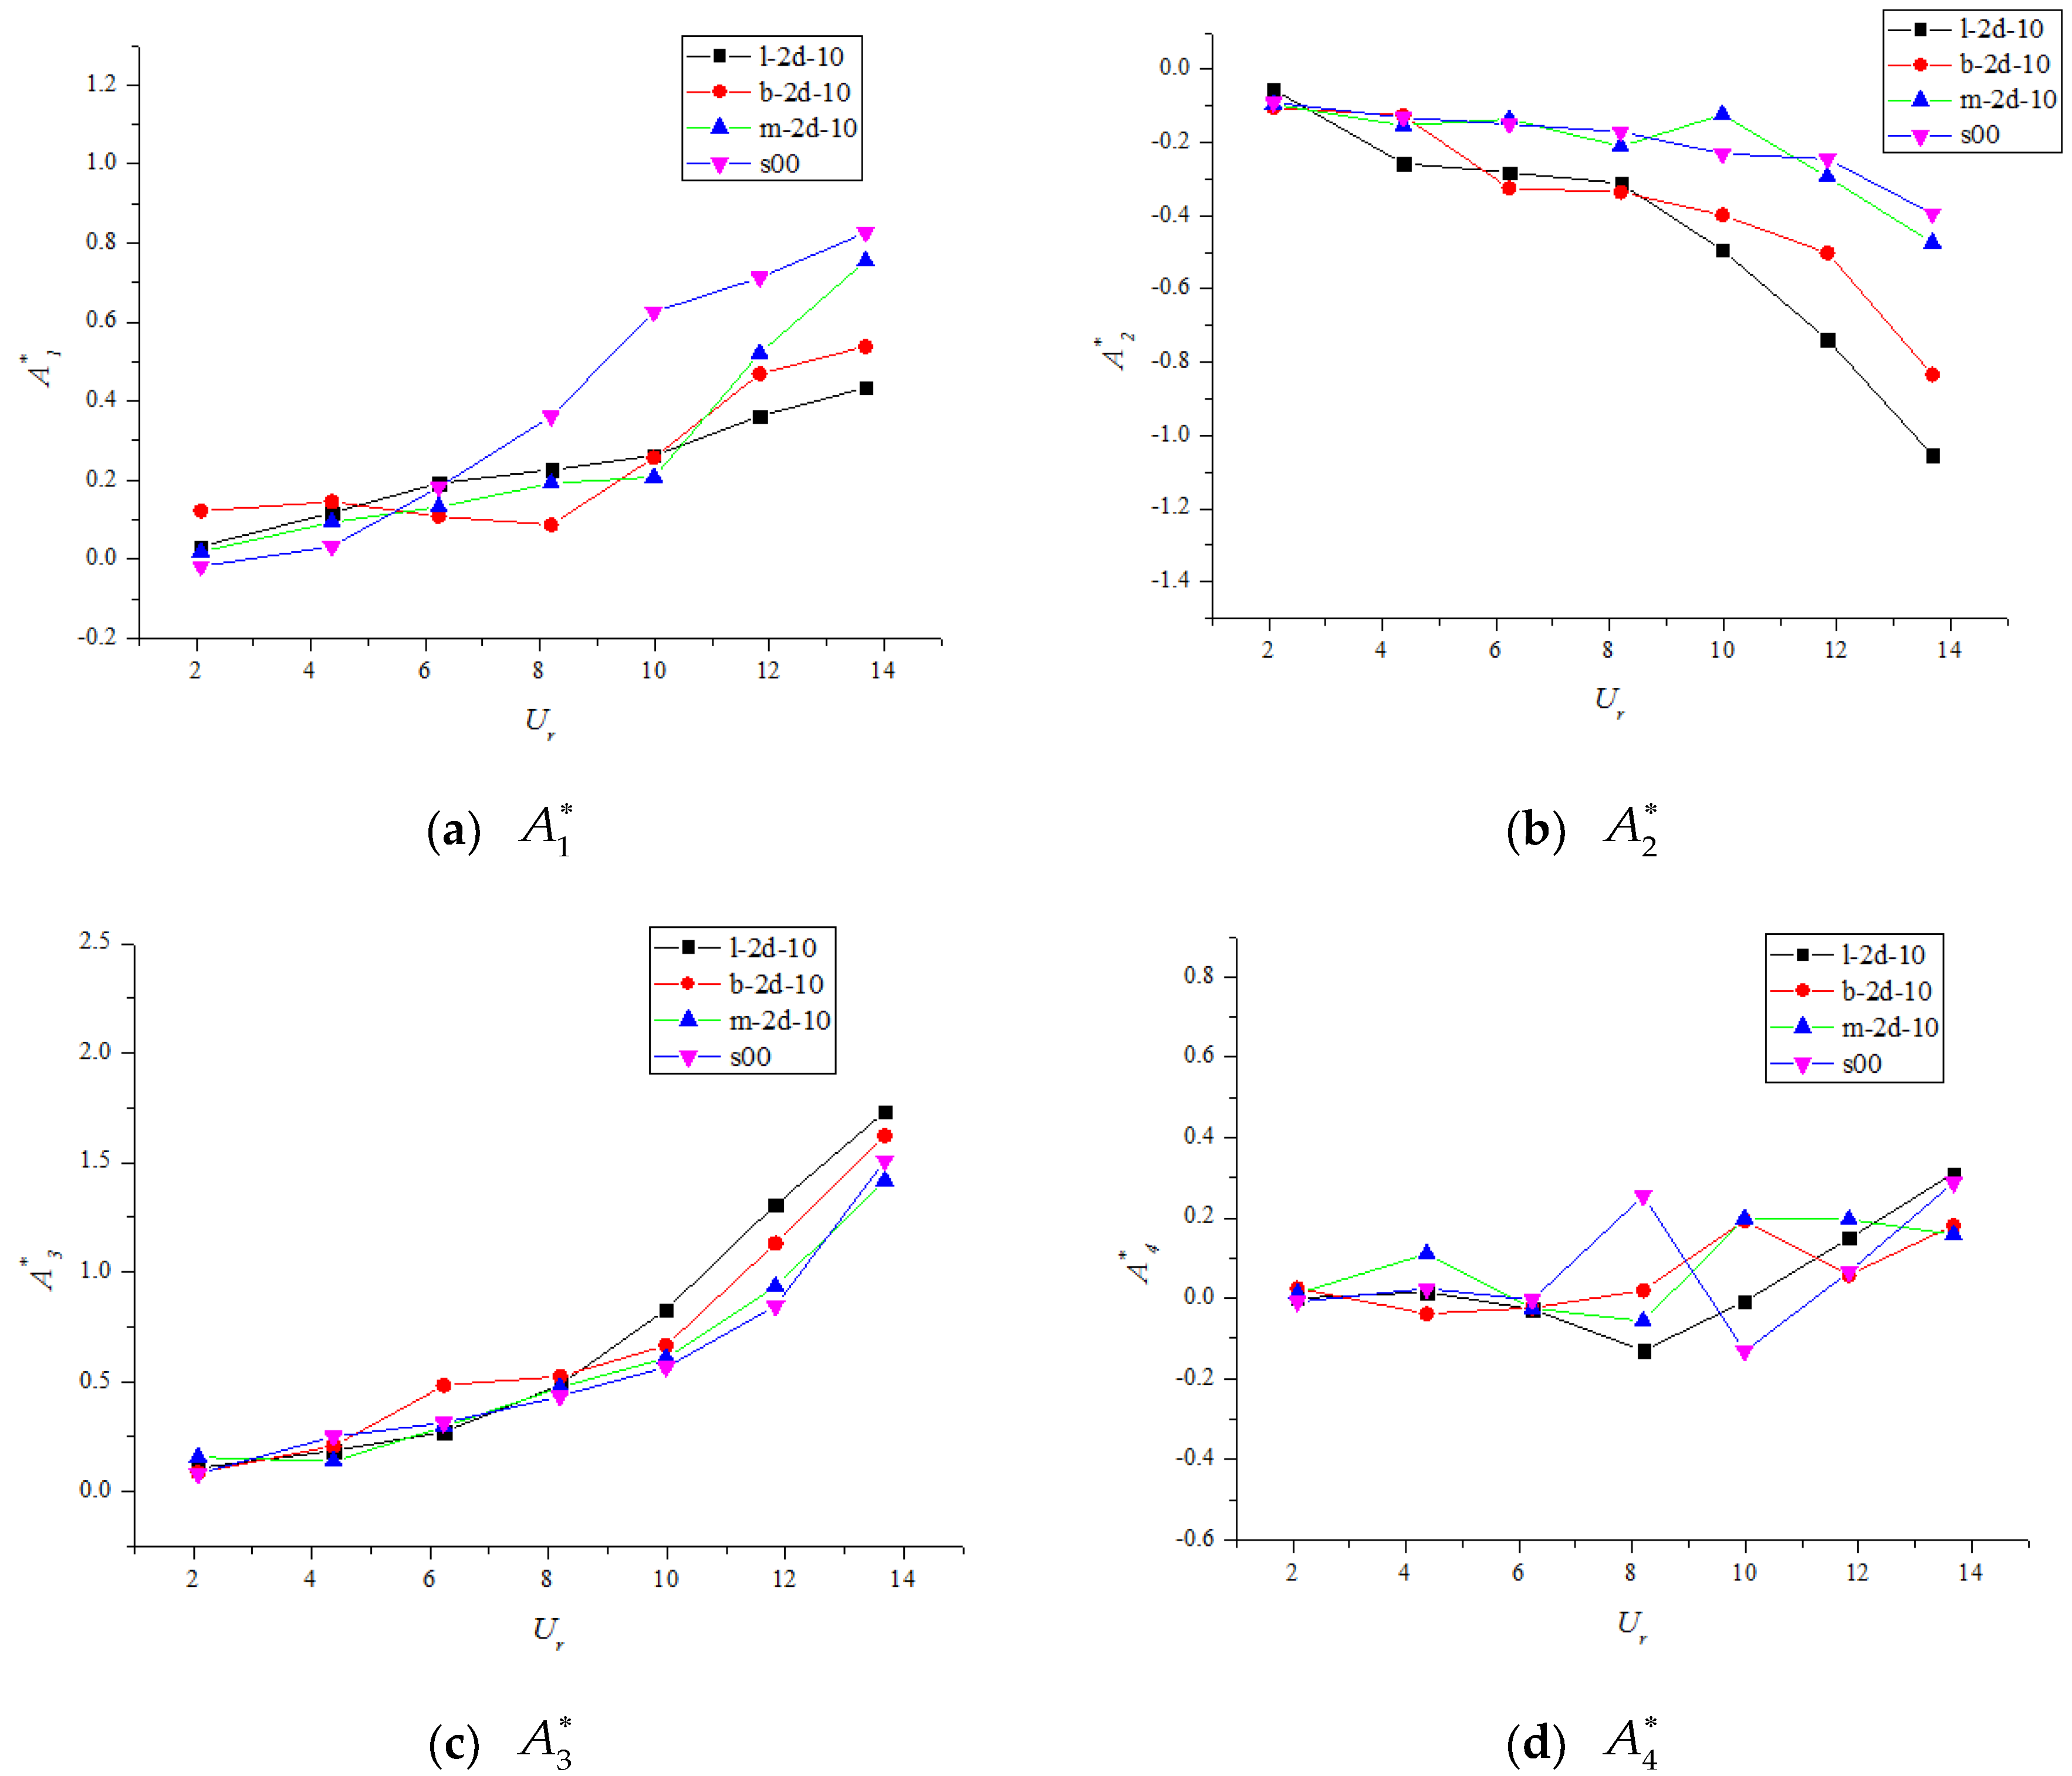
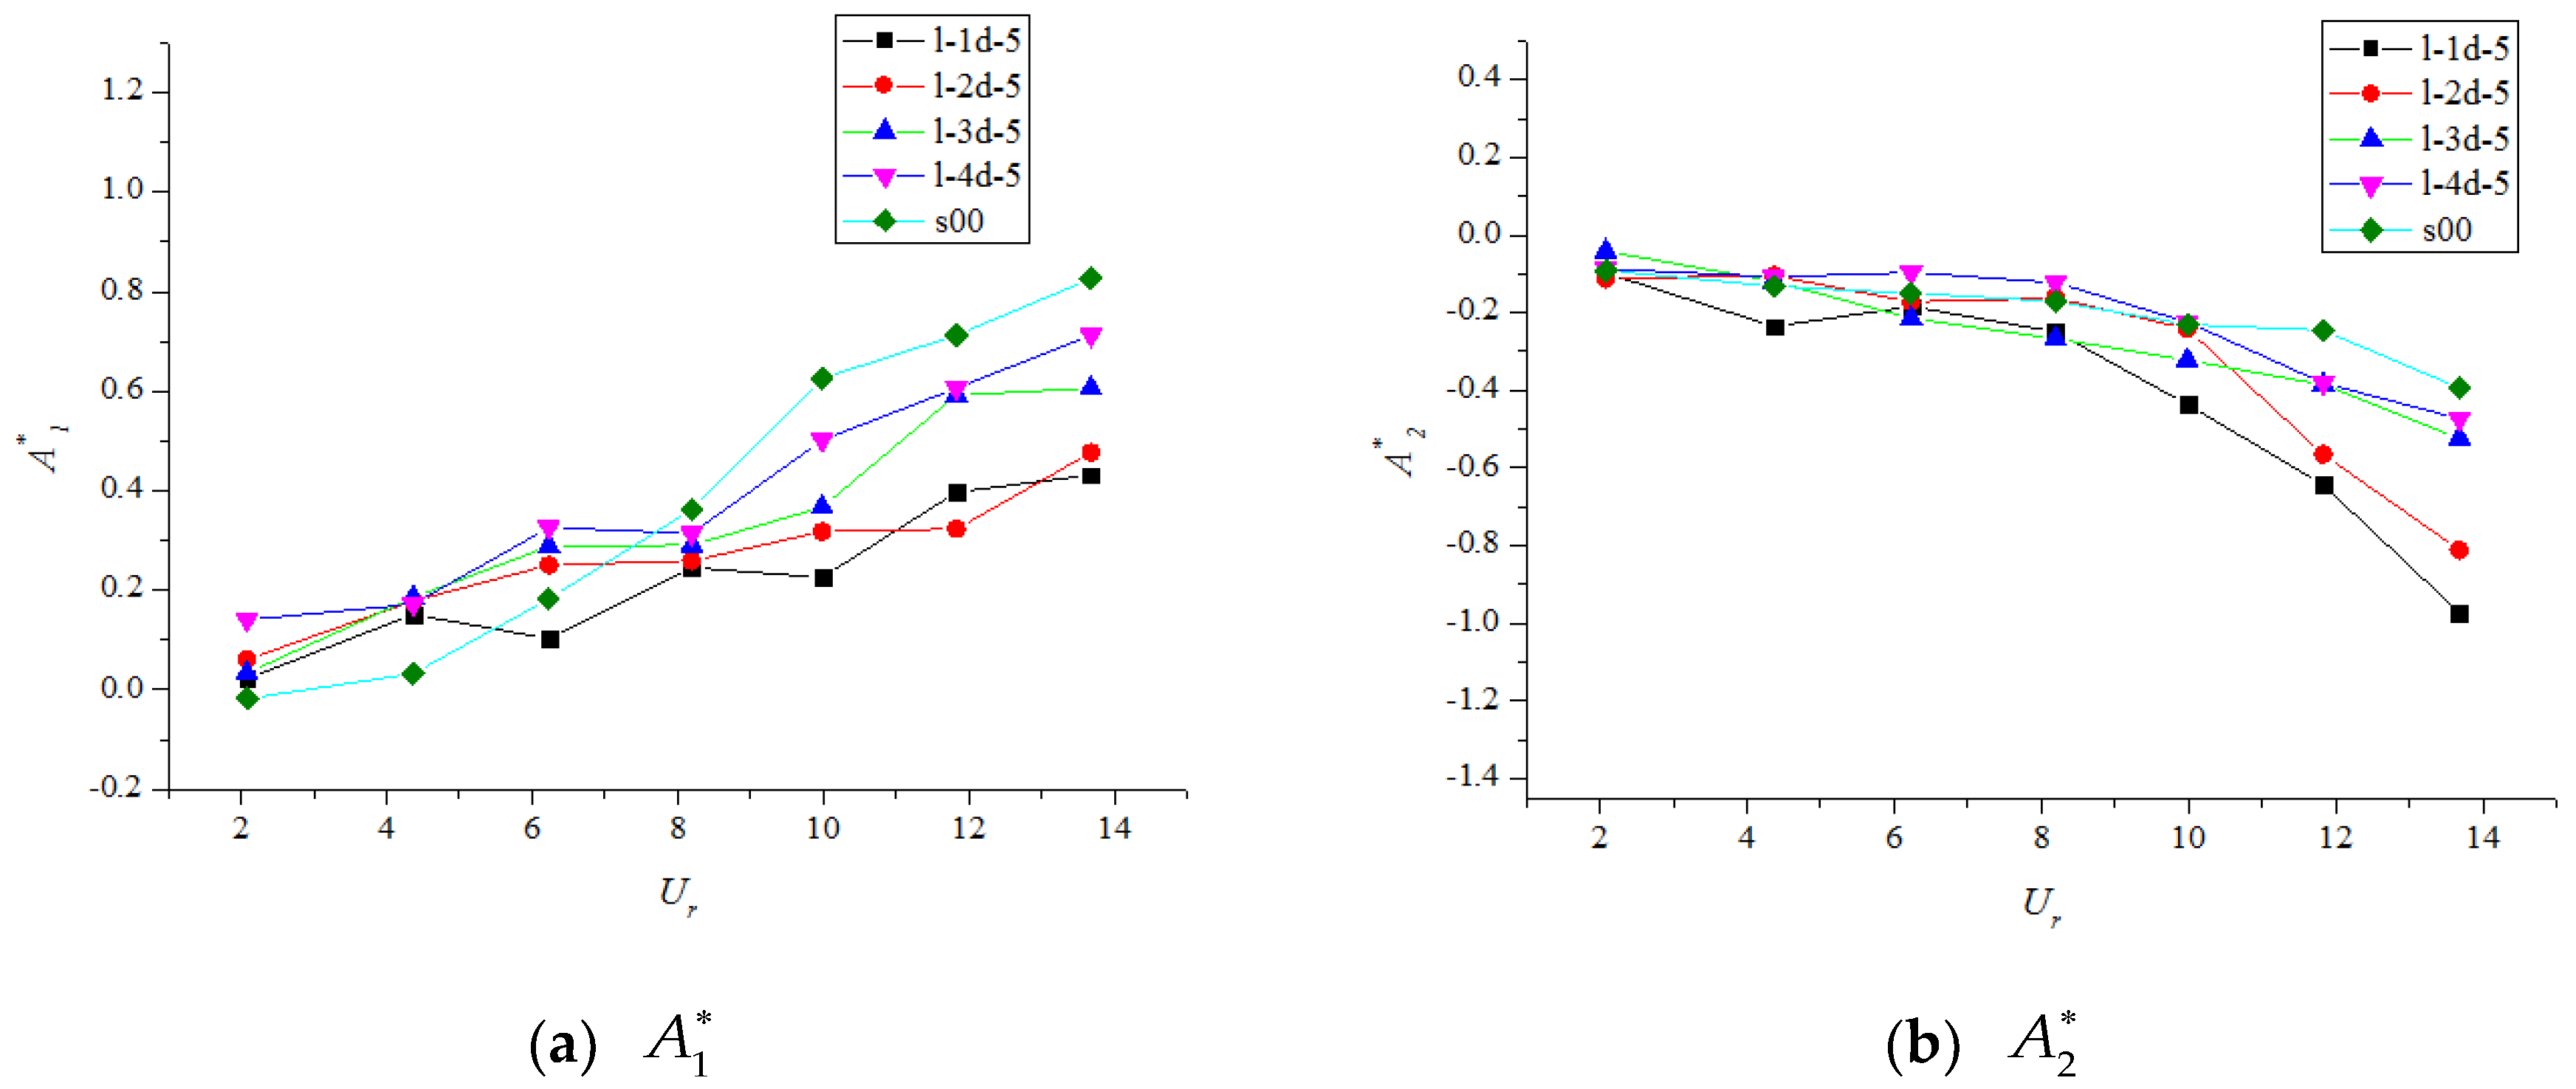
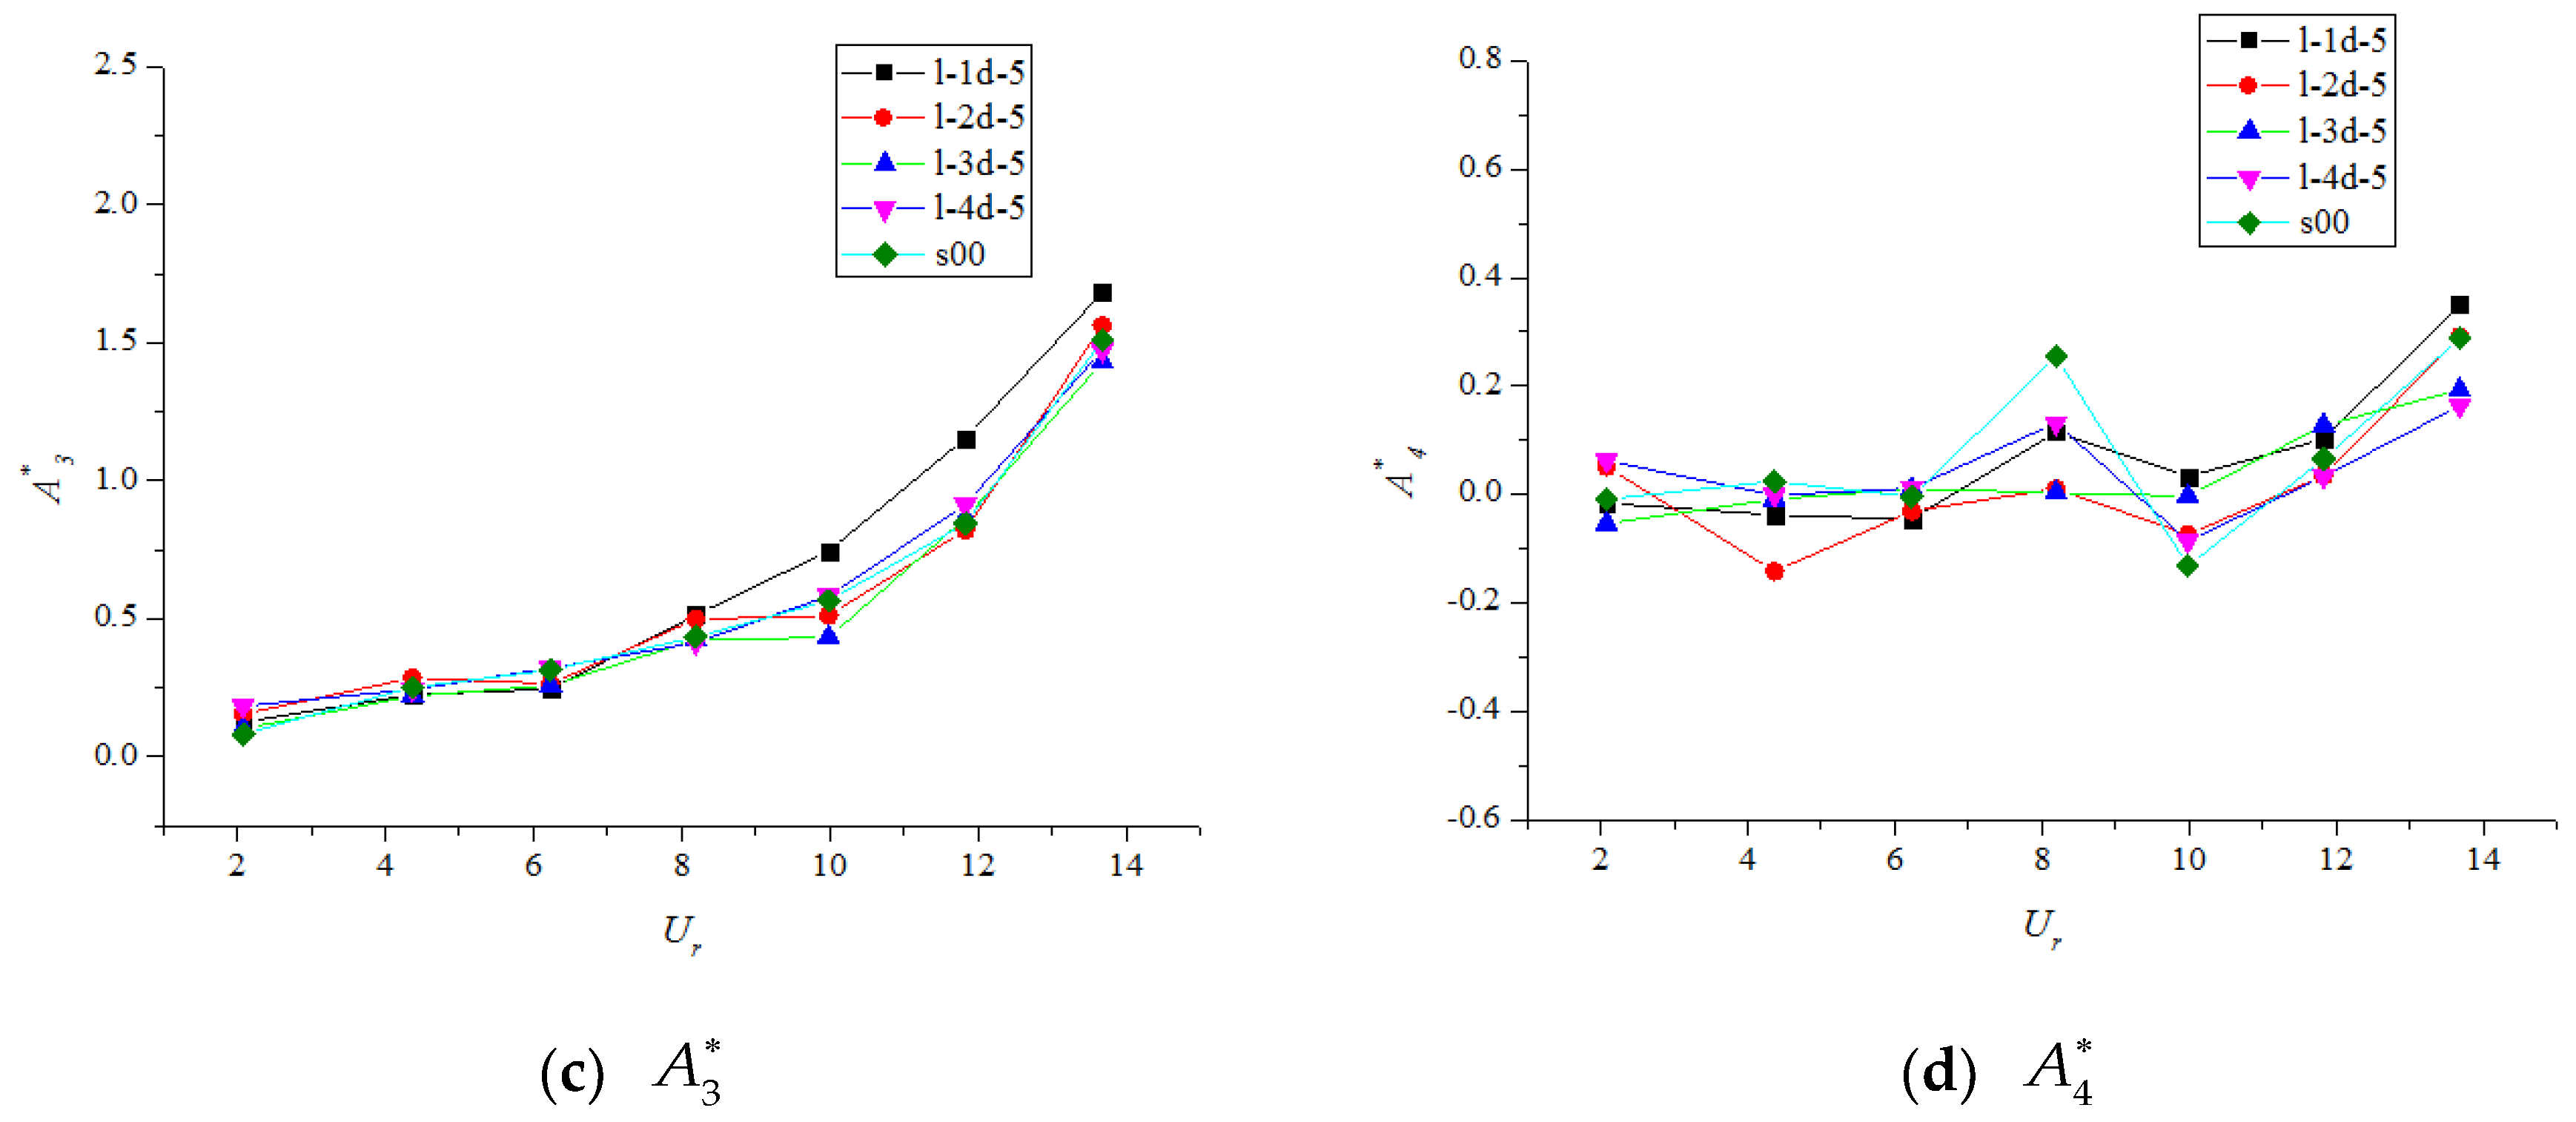
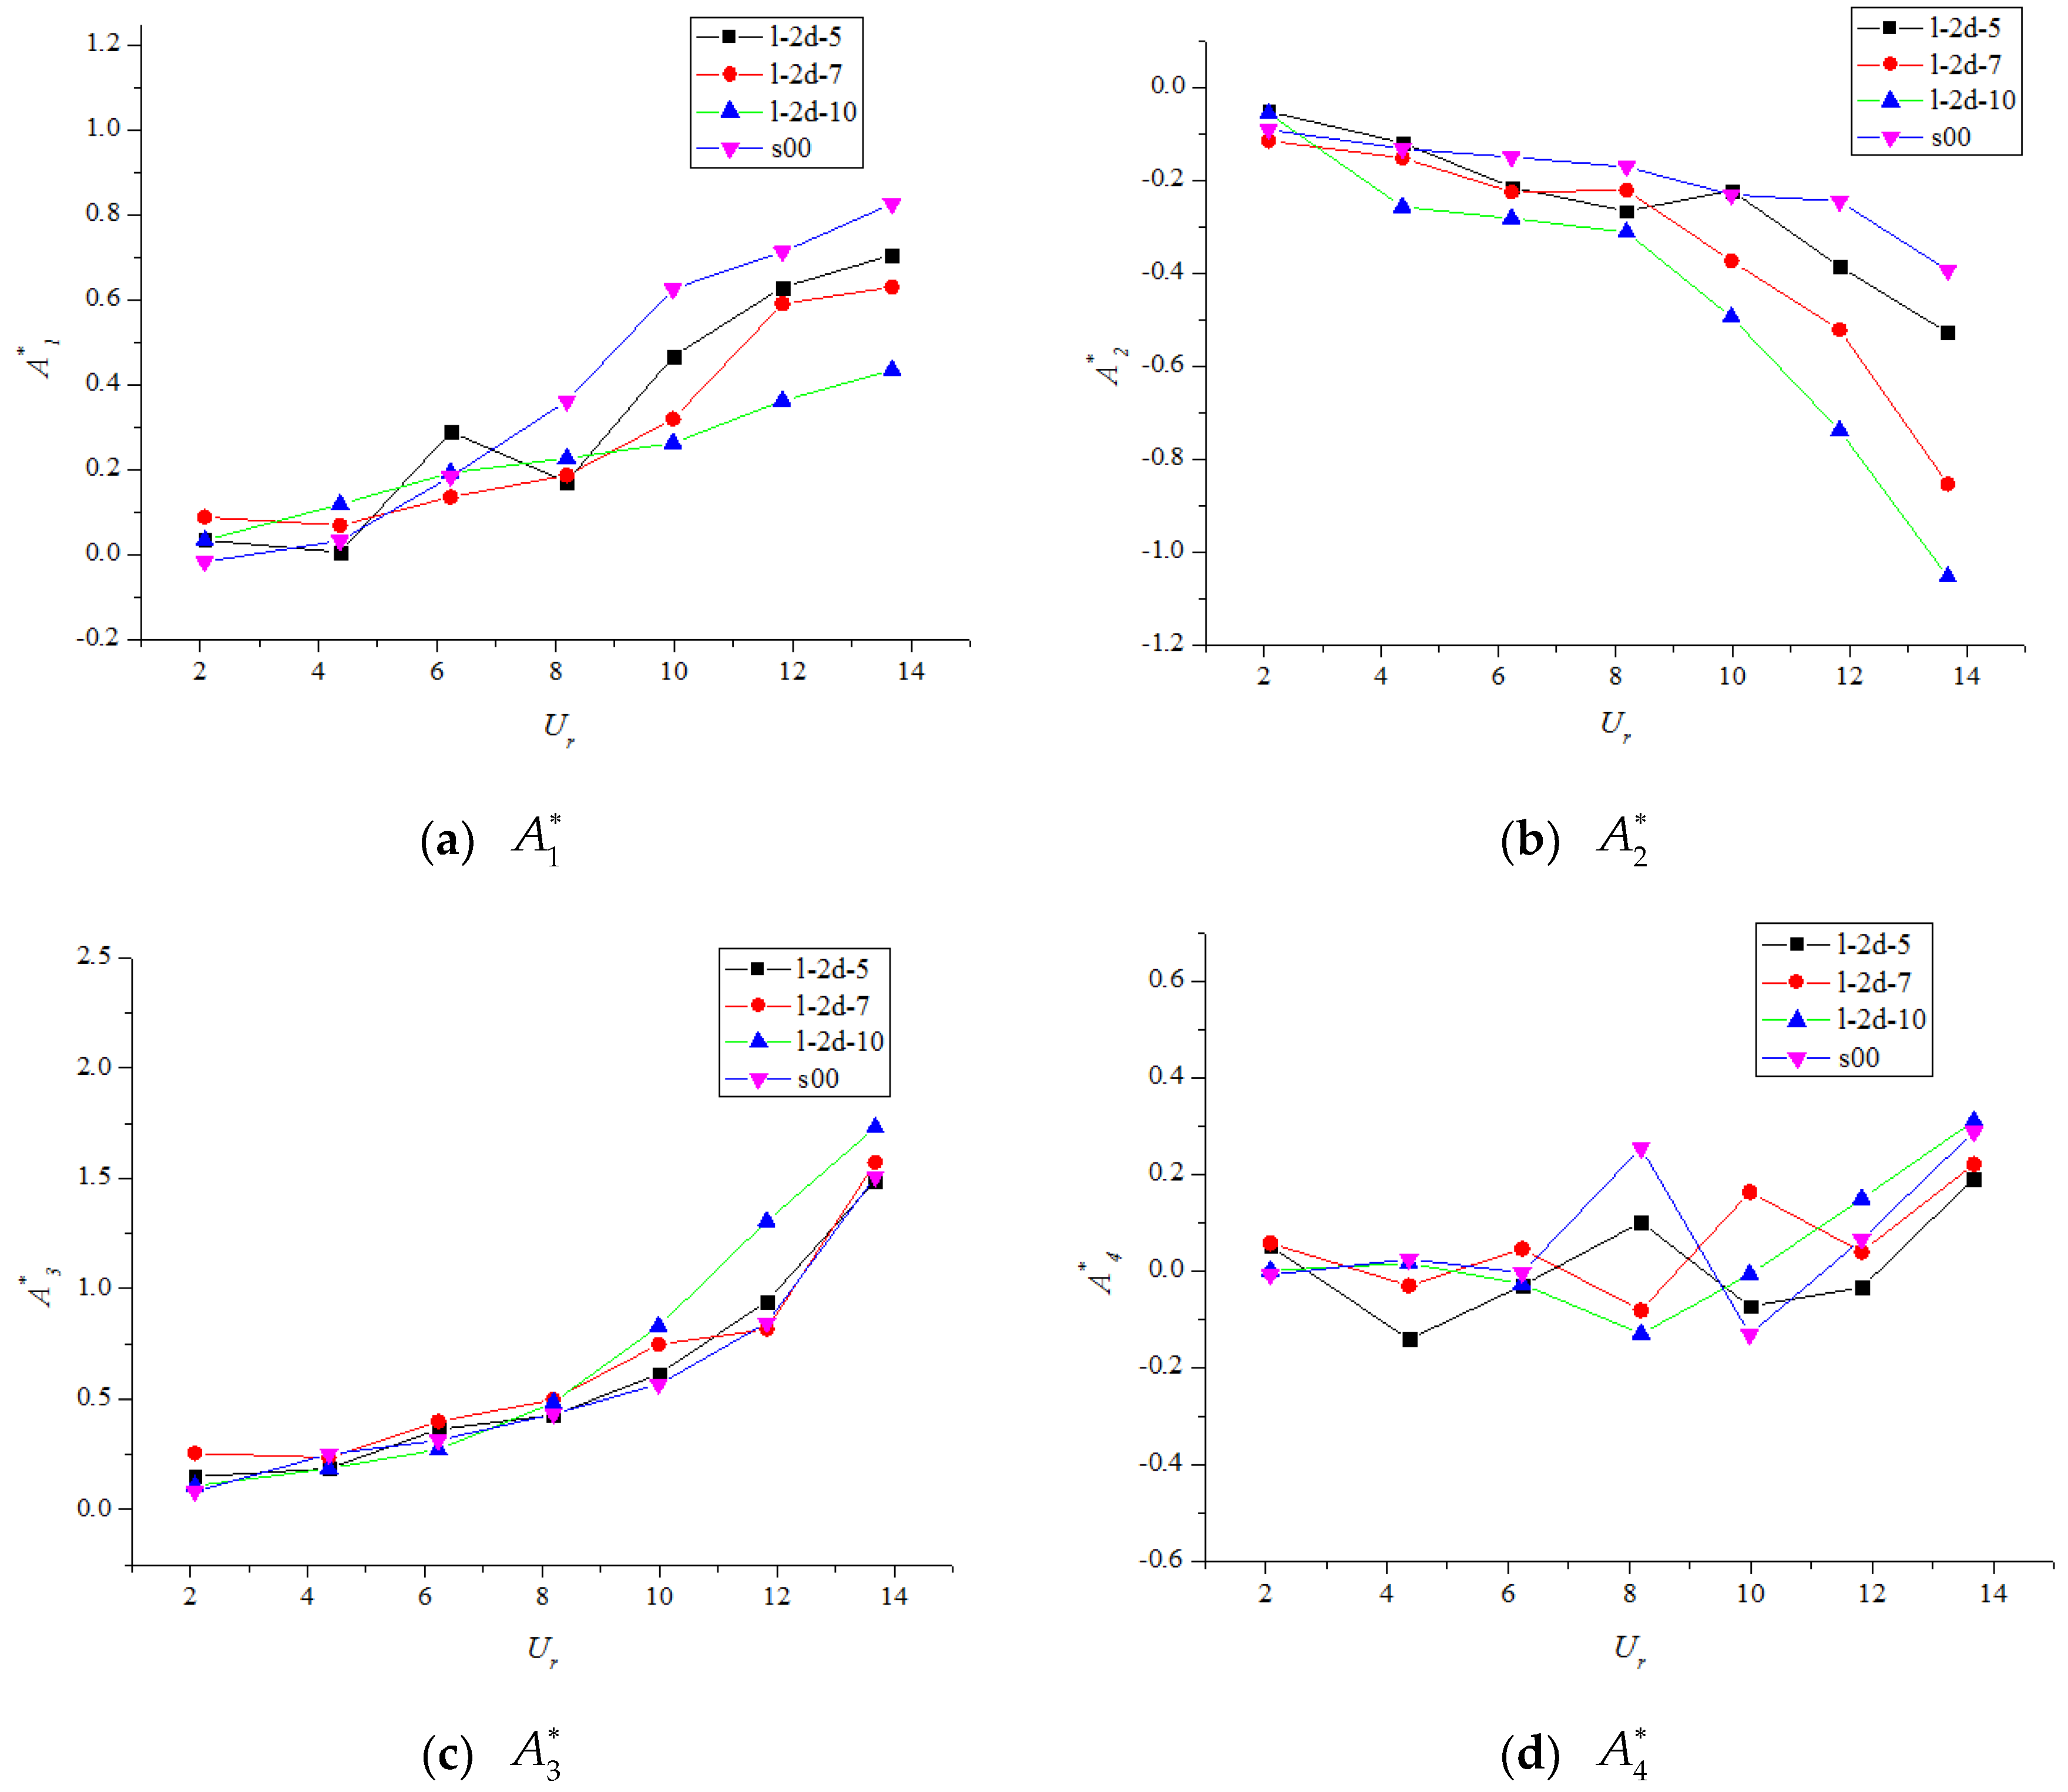
3.2. Effects of Steady-Suction-Based Flow Control on Flutter Derivatives

Based on Equation (1), the FDs are transfer functions of bridge displacements to self-excited forces that might lead to flutter. They are regarded as indicators of the bridge deck flutter susceptibility. Therefore, they are often employed to assess the aerodynamic stability of structures. The purpose of this part is to discuss the effects of steady-suction flow control on FDs to theoretically analyze the control mechanism.
All eight FDs, i.e., H 1 H 4 and A 1 A 4 , of the different cases extracted through the ILS method are presented in Figure 5, Figure 6, Figure 7, Figure 8, Figure 9 and Figure 10 as functions of the reduced wind velocity U r = U / f ν B , where U is the oncoming-wind velocity, f ν is the vertical frequency of the dynamic system, and B denotes the model width. The FDs were normalized with respect to the vertical natural frequency of the oscillation ( H 1 , H 4 , A 1 , A 4 ) and the torsional natural frequency of the oscillation ( H 2 , H 3 , A 2 , A 3 ). The results for H i ( i = 1 4 ) and A i ( i = 1 4 ) are presented and discussed separately.
The H 1 derivative is an important FD for the analysis of the heave motion because it is associated with aerodynamic damping in a heave motion; H 1 is positive for negative aerodynamic damping, which indicates a potential dynamic instability of the bridge deck section. To be specific, if the negative aerodynamic damping is stronger than the positive structural damping, the total heave damping (the sum of aerodynamic damping and mechanical damping of a structure) in the heave motion becomes negative. In this case, any external disturbance to the system can lead to divergent oscillations or even the collapse of the bridge. The trends of H 1 were similar for the cases with different suction slot positions (i.e., l-2d-10, m-2d-10, b-2d-10, and s00; Figure 5a): H 1 gradually decreased with increasing reduced wind speed from 2.08 to 13.68. When U r < 8 , the suction position influenced the H 1 derivative negligibly. However, when the reduced wind speed exceeded 8, the negative slope of l-2d-10 became steeper than those of the other two cases (m-2d-10 and b-2d-10). Thus, activating the suction slots on the windward side is the best choice to effectively reduce the negative aerodynamic damping of the bridge deck. For cases with different suction intervals (i.e., l-1H-5, l-2d-5, l-3d-5, l-4d-5, and s00; Figure 6a), the trends of H 1 were approximately equal. Generally, the values of l-1d-5 and l-2d-5 were lower than those of the other cases, particularly in the range U r 10 14 . This implies that shorter suction intervals tend to alleviate negative aerodynamic damping, which enhances the flutter performance of the bridge. For cases with variable suction flow rate (i.e., l-2d-5, l-2d-7, l-2d-10, and s00; Figure 7a), the trends of H 1 were still similar; the value decreased with increasing wind velocity. However, for l-2d-10, H 1 was significantly lower than those of the other cases, resulting in the lowest negative aerodynamic damping. This explains why a higher suction rate leads to a better control effect.
The H 2 derivative is an indirect coefficient used to interpret the effect of the torsional aerodynamic damping on the heave motion. If H 2 is positive, the aerodynamic instability phenomenon might occur owing to negative aerodynamic damping. As shown in Figure 5b, installing the control equipment on the windward side (l-2d-10) reduced the negative aerodynamic damping to a certain extent. However, for the remaining cases with control (b-2d-10 and m-2d-10), the installation did not cause great differences with respect to the single-deck case. Moreover, as seen in Figure 6b and Figure 7b, the H 2 derivative was not significantly affected by the other two control variables (suction interval and suction flow rate). The trends of H 2 of all the studied cases were approximately equal; they increased with increasing reduced wind speed. Please note that H 2 was negative when the wind speed was relatively low. However, H 2 became positive as the wind speed increased to a certain value, which is worthy of attention.
According to Equation (1), the H 3 derivative is related to the aerodynamic stiffness in the pitch motion. A positive H 3 leads to negative aerodynamic stiffness, thereby adversely affecting the aerodynamic stability of the bridge deck. As shown in Figure 5c, Figure 6c and Figure 7c, the steady-suction control system increased H 3 , which resulted in a decrease in the total stiffness of the bridge. Nevertheless, H 3 remained almost constantly negative. Hence, a negative aerodynamic stiffness cannot be generated with or without a control system. Although the presented control method reduced the net stiffness in the pitch motion, it did not deteriorate the flutter performance of the bridge.
According to Figure 5d, Figure 6d and Figure 7d, the H 4 derivative exhibited a relatively unpredictable behavior in all the studied cases owing to its sensitivity to the input-signal noise. High absolute values of this derivative generally indicate adverse differences in the natural frequency of the oscillations in the heave motion with respect to the initial condition at zero reduced velocity. This was not observed for the presented test cases with or without a control system and requires further investigation.
The indirect A 1 derivative is associated with the aerodynamic damping in the heave motion caused by torsional motion. As for H 1 , a positive A 1 leads to negative aerodynamic heave damping. As depicted in Figure 8a, Figure 9a and Figure 10a, A 1 exhibited an upward trend with increasing wind speed, and A 1 of all the cases were similar for U r 2 8 . However, when the reduced wind velocity U r exceeded 8, the control system applied to reduce A 1 strengthened the total damping. To be specific, regarding the cases l-2d-10, m-2d-10, and b-2d-10, the values of A 1 of l-2d-10 were generally below those of the other cases, which explains why the windward side is the best choice. In addition, for the cases with different suction intervals (Figure 9a), the values of cases with shorter intervals (l-1d-5 and l-2d-5) were generally lower than those of the cases with longer intervals (l-3d-5 and l-4d-5). Thus, a shorter interval is the better choice. Regarding the cases with different suction flow rates (Figure 10a), the growth rate of A 1 decreased with increasing suction flow rate. Thus, increasing the suction flow rate reduces the negative aerodynamic damping, and flutter can be avoided.
The A 2 derivative is crucial for studying pitch dynamic stability because it is directly related to the aerodynamic damping in the pitch motion. The critical destabilizing role of A 2 was reported by Matsumoto et al. [23]. Negative aerodynamic damping in the pitch motion due to positive values of A 2 can lead to negative total damping and therefore flutter. The suction strengthens the dynamic stability in a torsional motion because the resulting negative slope of A 2 is greater than that of the single-deck case. According to Figure 8b, case l-2d-10 exhibited the sharpest decrease in A 2 , followed by the cases m-2d-10 and b-2d-10. Figure 9b and Figure 10b show that a shorter suction interval and higher suction flow rate caused A 2 to decrease more rapidly. Thus, the net damping increased. This demonstrates the positive influence of the suction control system on the aerodynamic characteristics of the bridge deck from another angle.
Although the A 3 derivative tended to increase with installed control system for U r > 8 indicating that the total torsional stiffness decreased, flutter is generally not caused by a negative torsional stiffness because of the relatively large structural torsional stiffness. Moreover, A 4 has proven to be small and sensitive to noises [24]. Although the A 4 derivative had a relatively unpredictable trend for the entire range of the studied wind velocities, it is reported for the sake of completeness.
In general, the FDs were significantly influenced by the steady-suction-based control method, particularly A 1 , A 2 , H 1 , and H 2 , which were related to the aerodynamic damping of the structure. According to the results, installing the control device with optimal control parameters reduced the negative aerodynamic damping and therefore the total damping of the structure.

3.3. Influence of Steady-Suction-Based Flow Control on Critical Flutter Speed

The objective here was to investigate the influence of different control parameters, including the suction slot position, suction interval, and suction rate, on the critical flutter speed ( U c ) of the bridge girder to verify the effectiveness of the steady-suction control regarding the flutter performance. Moreover, the sensitivity of the control effect to various parameters was studied. The critical flutter speeds and the corresponding growth rates β at three slot positions and for four suction intervals and three suction flow rates were compared and analyzed. The growth rates β of U c were calculated with β = ( U c U c 0 ) / U c 0 × 100 % , in which U c 0 is the value of U c without steady-suction-based control system. All test cases were conducted under a 0° wind attack angle.

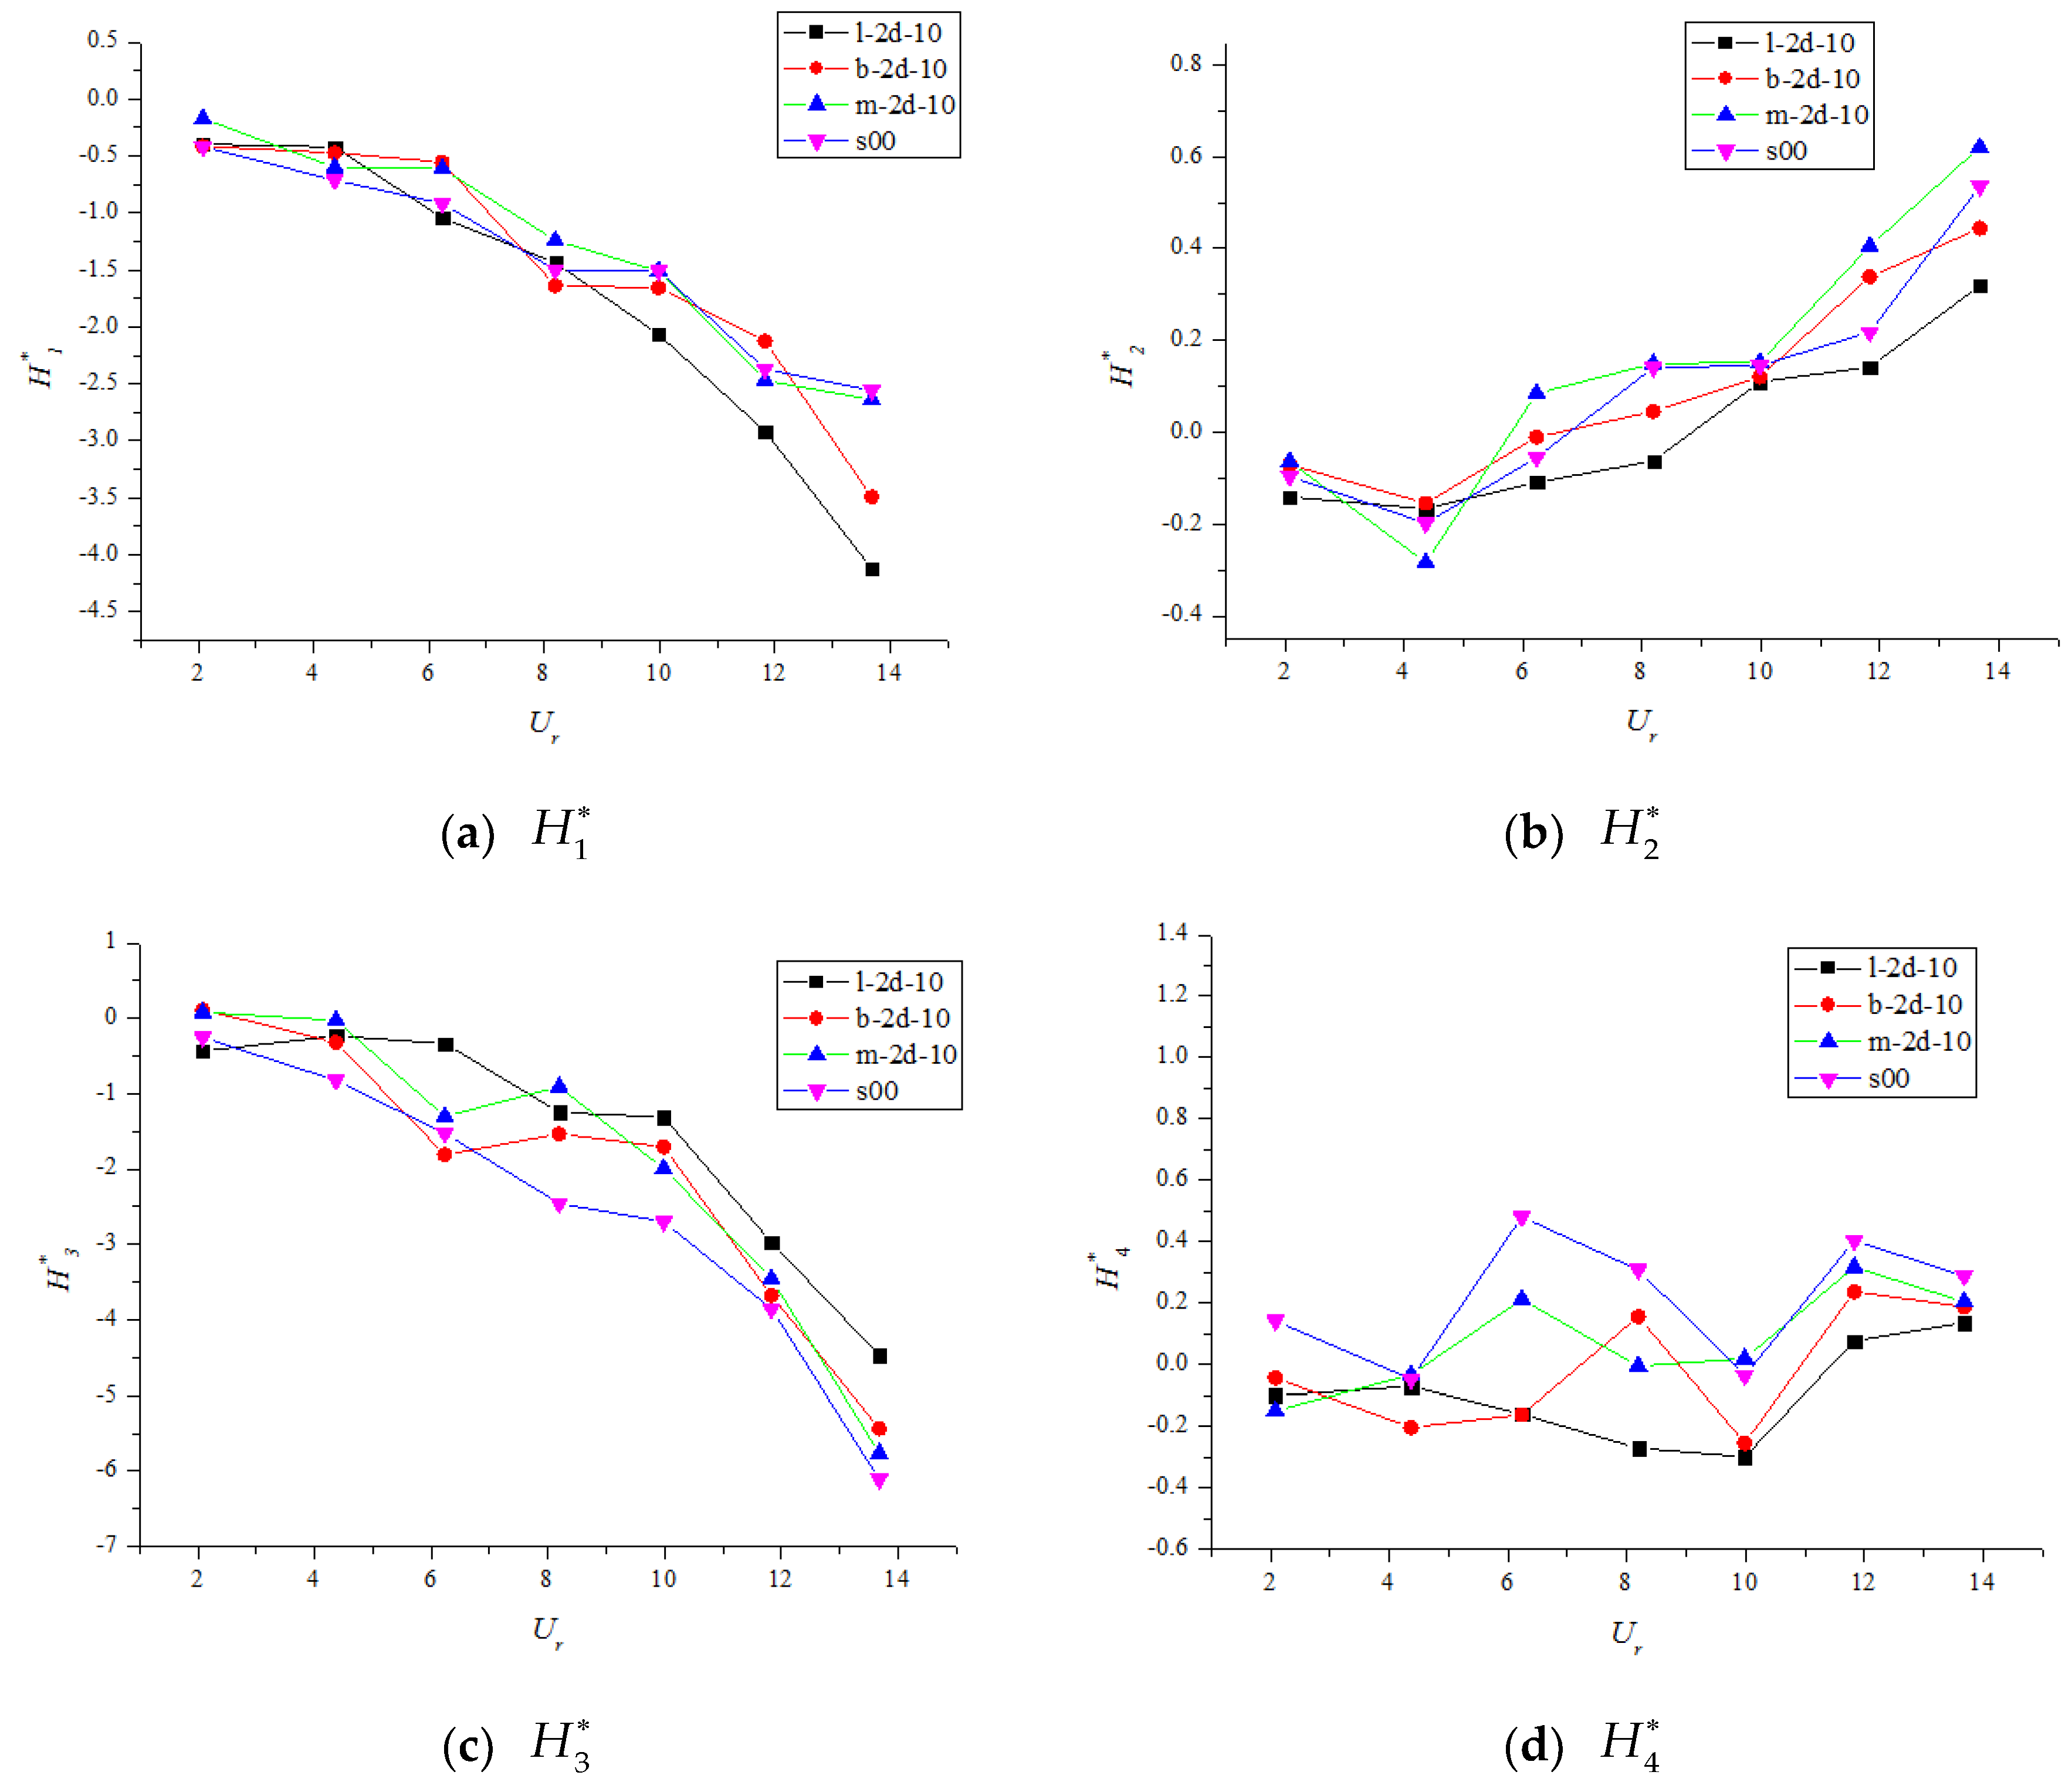
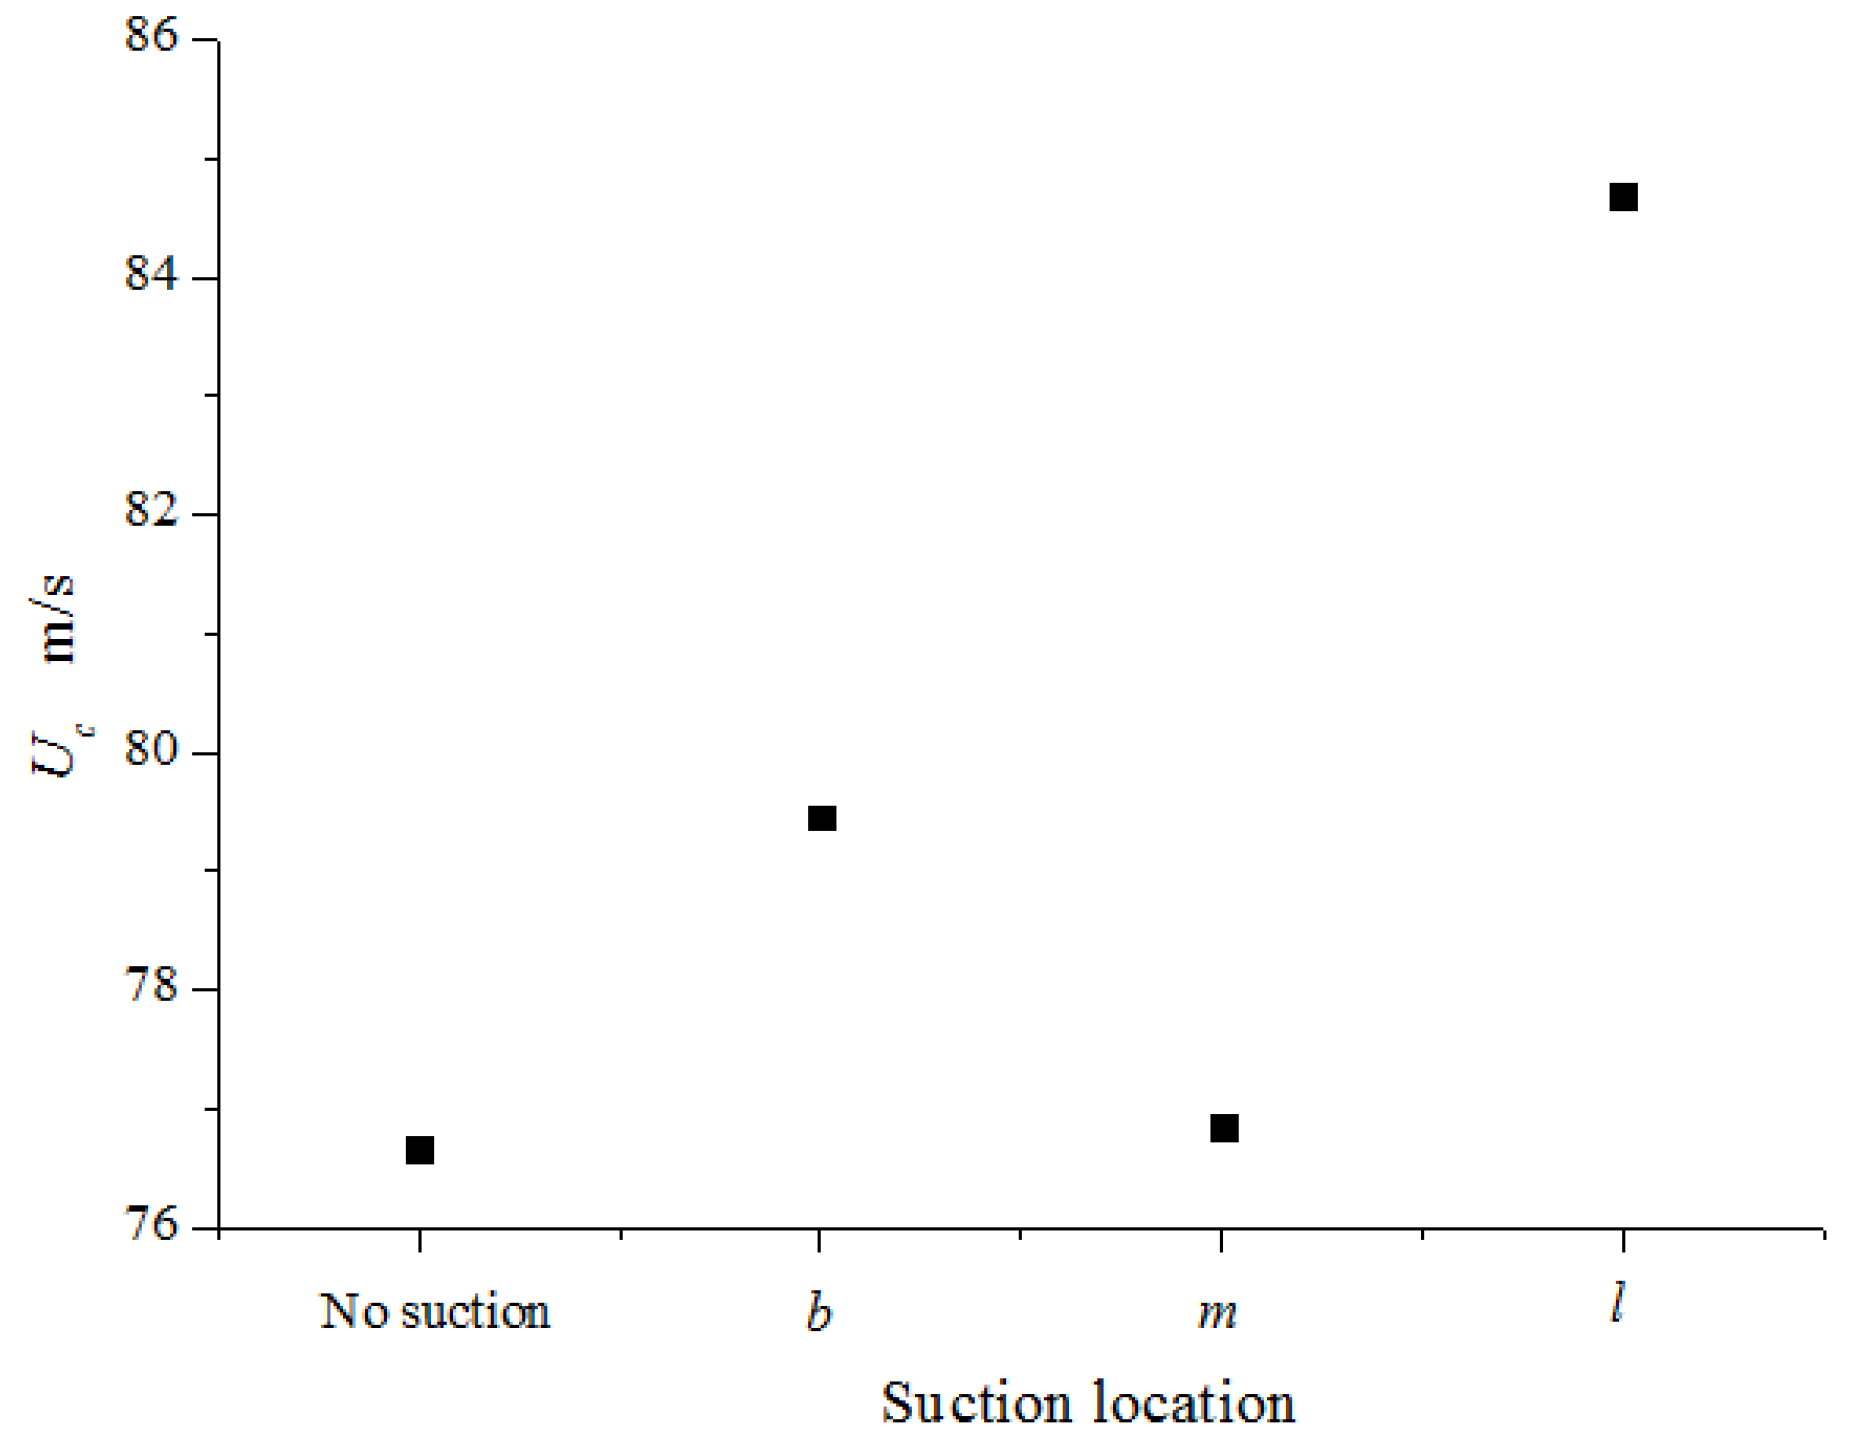
3.3.1. Influence of Suction Slot Position

Three representative test cases with different slot positions (i.e., l-2d-10, m-2d-10, and b-2d-10) were performed to determine the influence of the slot position on the flutter control effect. Figure 11 shows the critical flutter speeds of the three test cases and that of the single-deck case (i.e., s00). The critical flutter speeds ( U c ) of cases l-2d-10, m-2d-10, and b-2d-10 were 84.68, 76.84, and 79.45 m/s, respectively, which were higher than that of the single-deck case ( U c 0 of 76.65 m/s). The corresponding β were 10.5%, 0.25%, and 3.7%, respectively. According to the control results, case l-2d-10 was the best choice. The other two cases had relatively limited positive influence on the flutter characteristics, and case m-2d-10 resulted in the worst outcomes. It can be concluded that disturbing the flow separation directly at the windward edge of the girder is better than disturbing the vortex drift. In conclusion, the steady-suction-based method can improve the flutter performance of the bridge based on critical flutter speed. However, the control effect is sensitive to the suction slot position, and the optimal position is located on the windward side of the low surface.

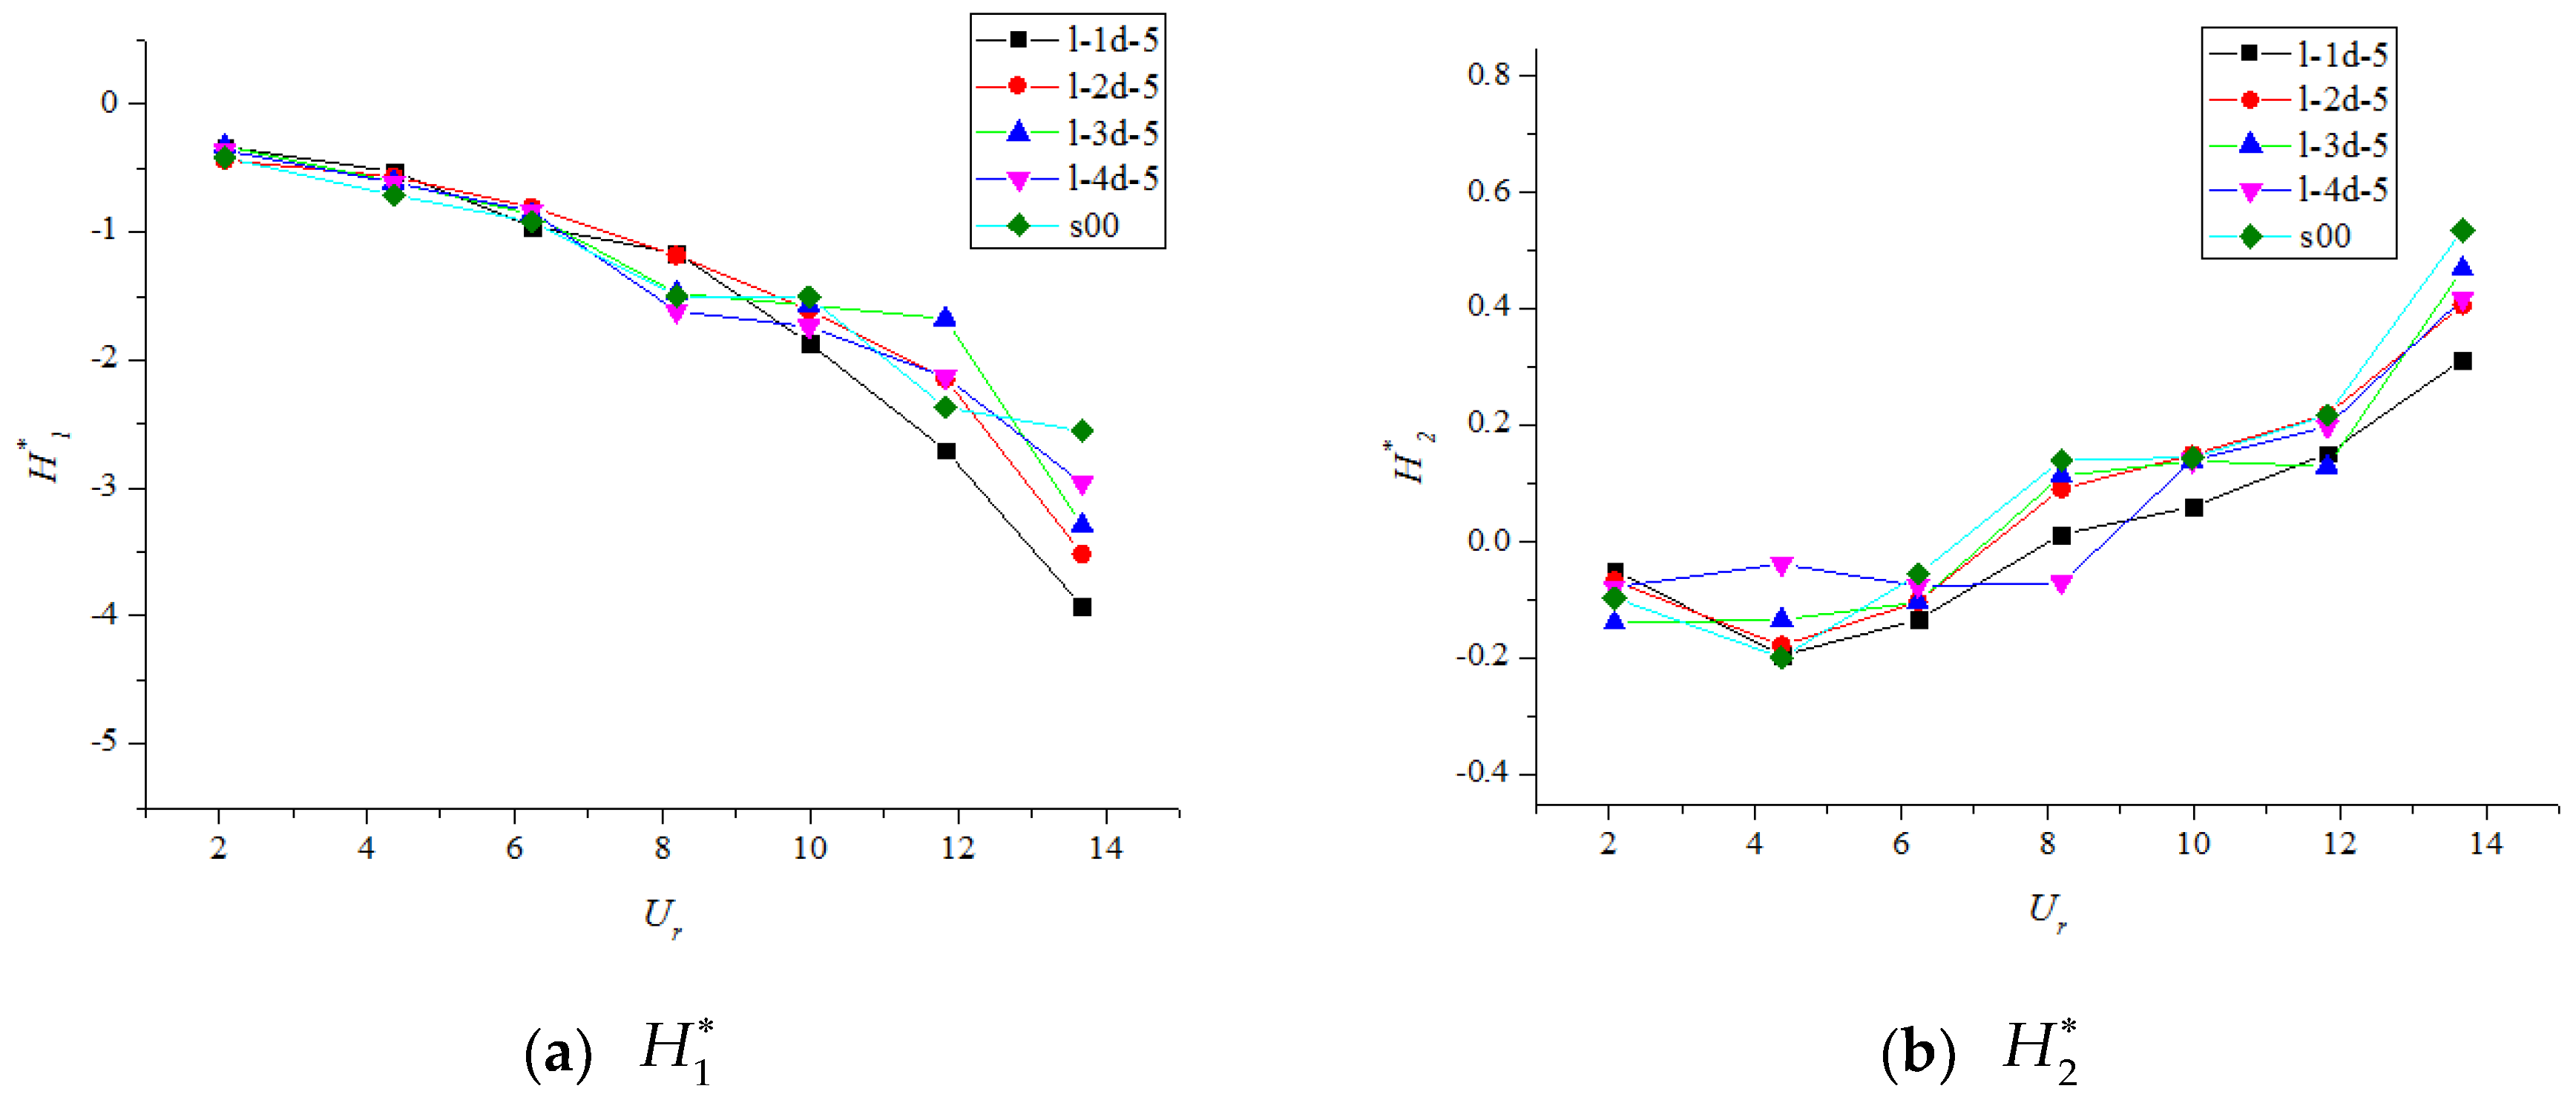
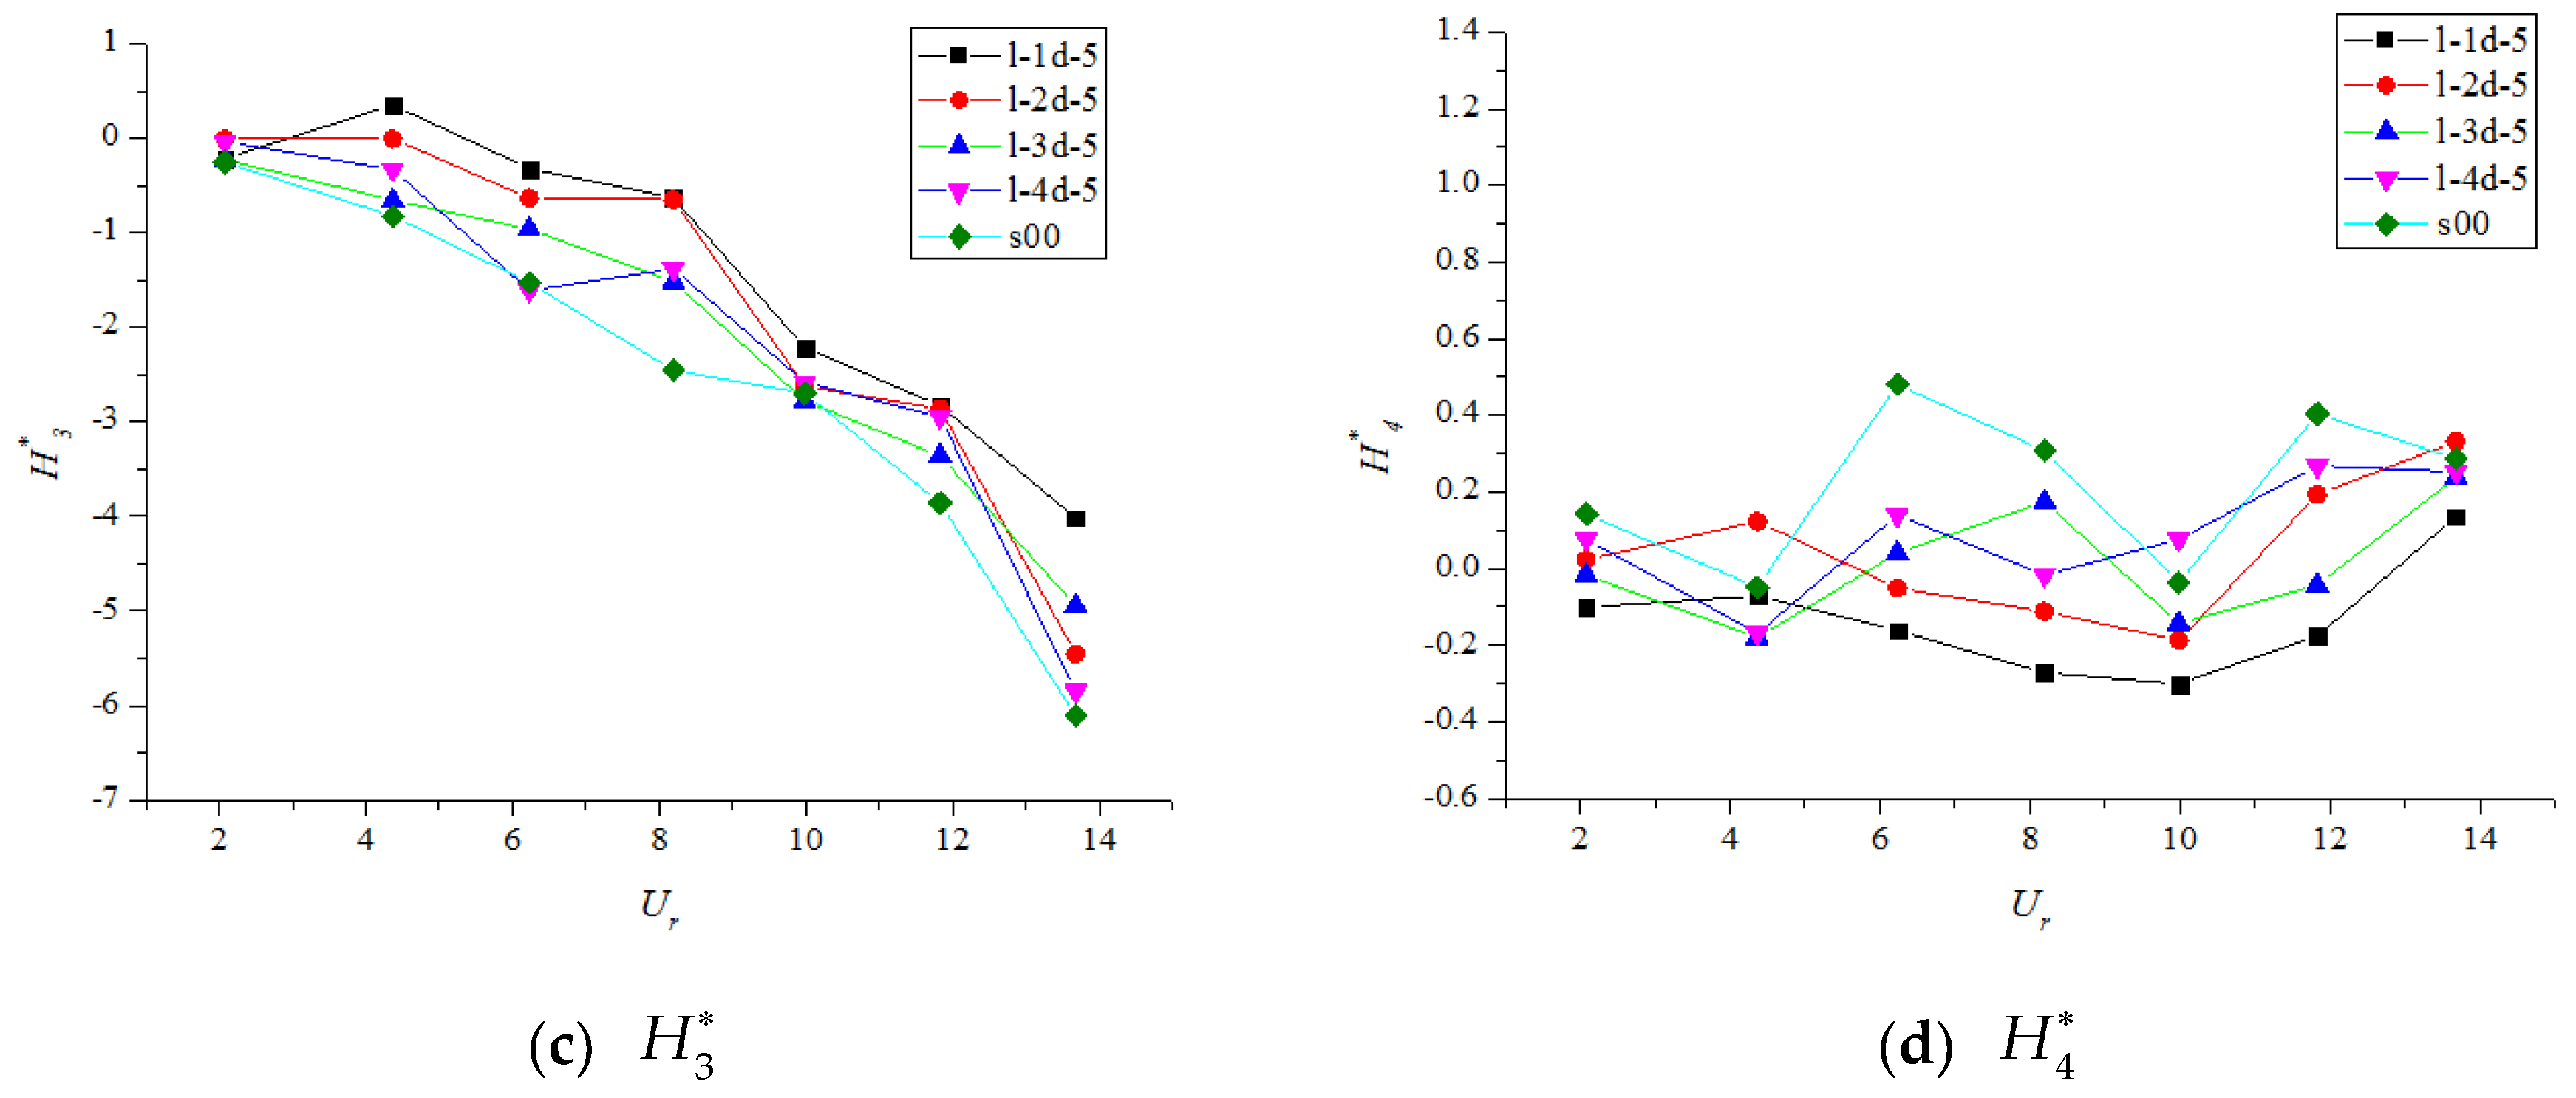
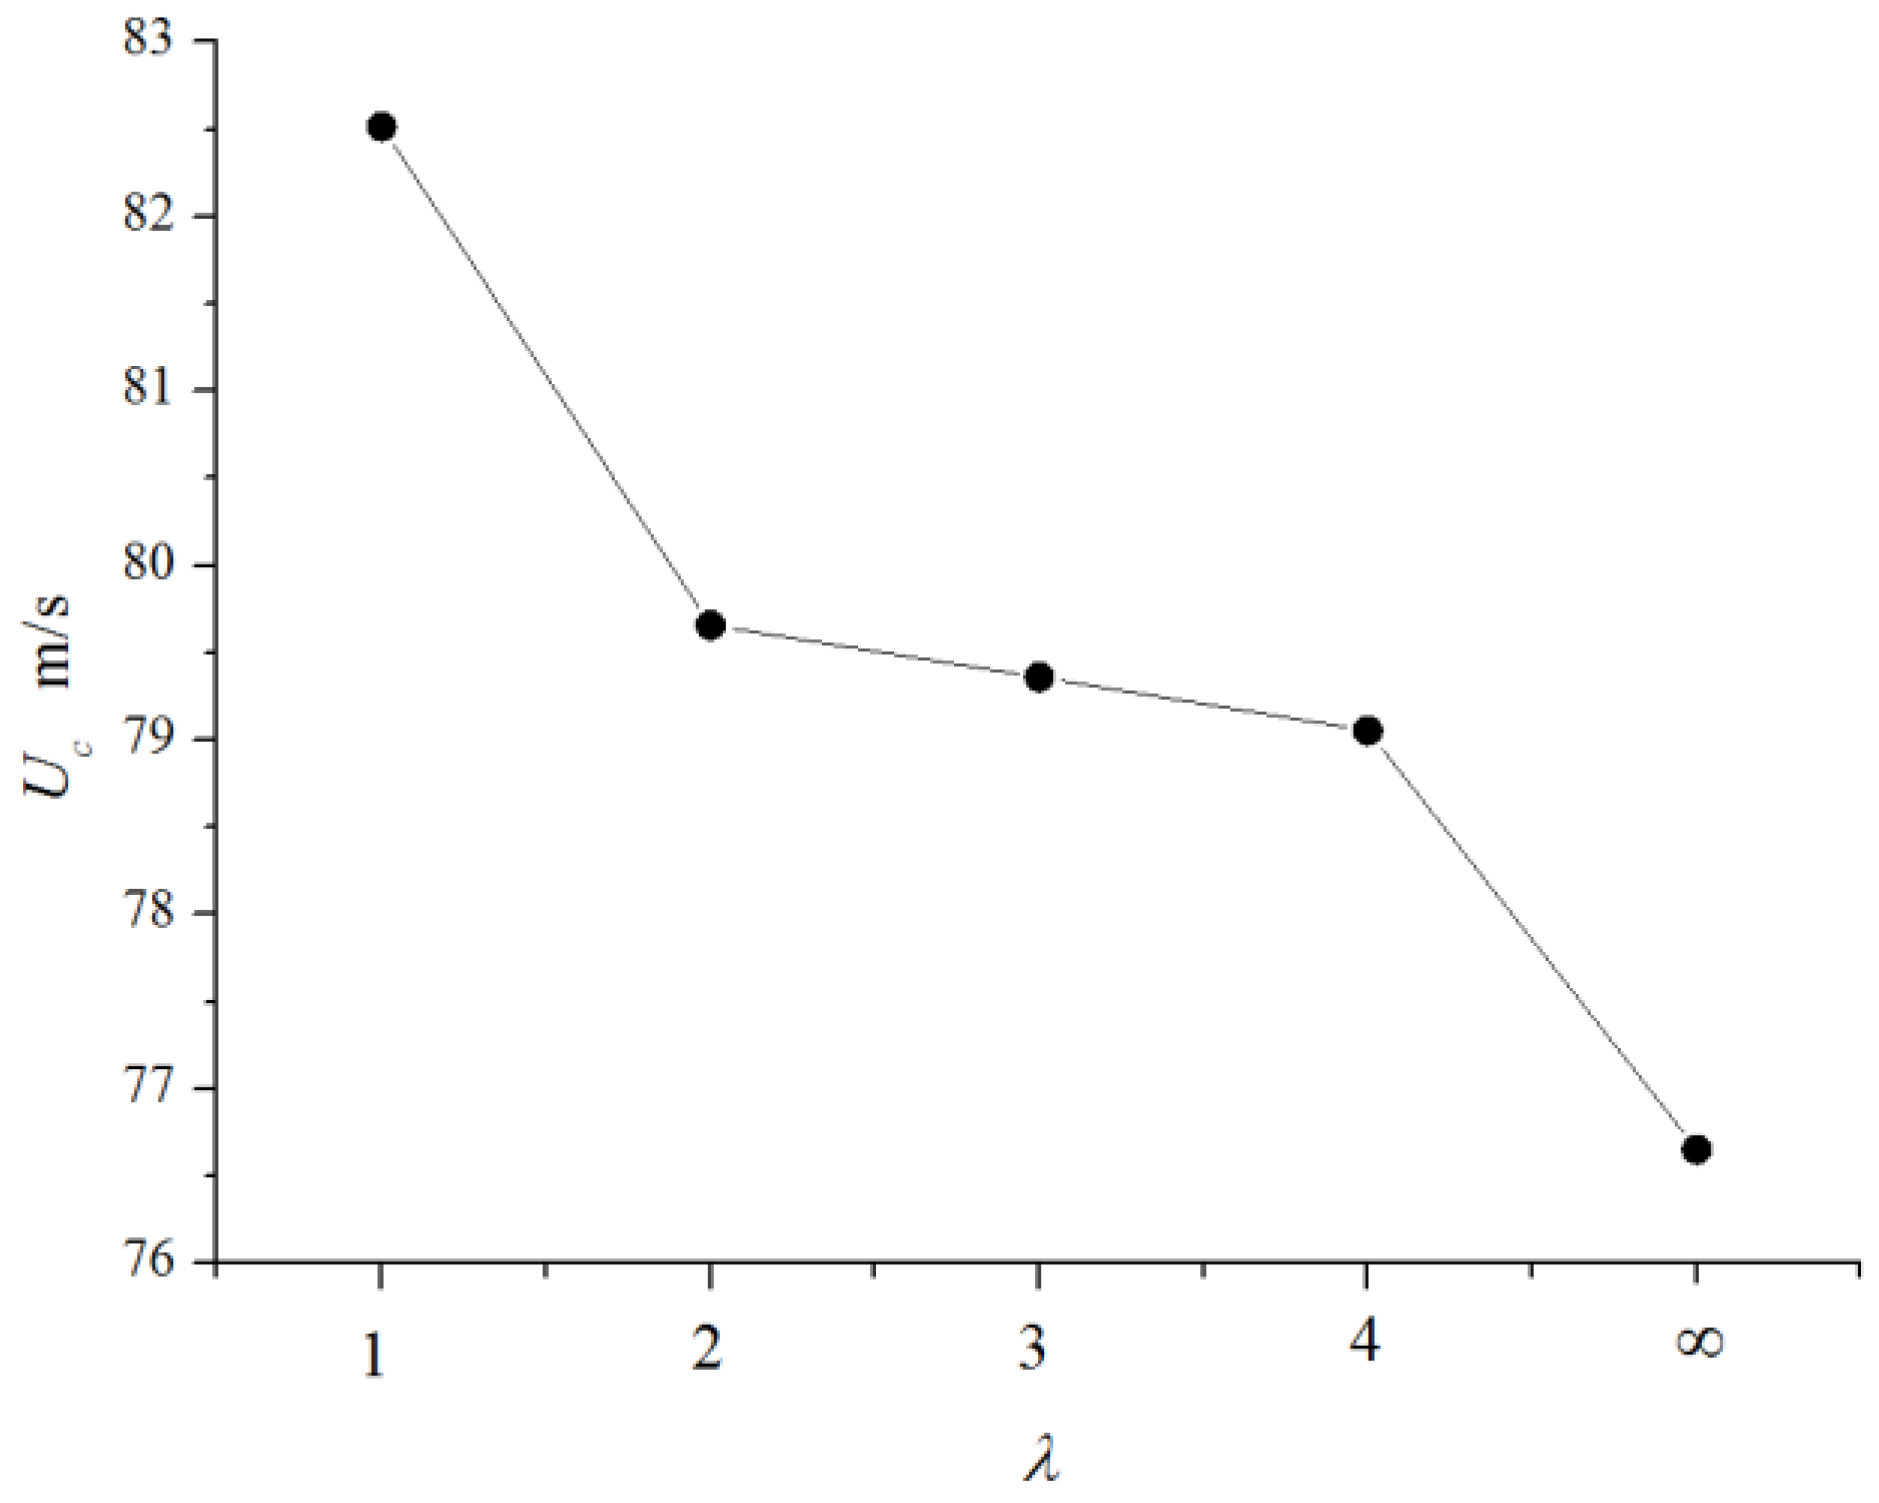
3.3.2. Influence of Suction Interval

To investigate the influence of the suction interval on the control effect, five test cases with different relative suction intervals (i.e., λ = 1, 2, 3, 4, and ) were selected. The infinity value denotes the case without control (i.e., s00). As shown in Figure 12, the flutter onset velocities of cases l-1d-5, l-2d-5, l-3d-5, and l-4d-5 were 82.51, 79.66, 79.36, and 79.05 m/s, respectively, and the corresponding β were 7.6%, 3.9%, 3.5%, and 3.1%, respectively. According to the test results, U c of the model constantly decreased with increasing suction interval. For a relative suction interval of λ = 1, a maximal U c increment of 7.6% was obtained. In general, the control effect highly depended on the suction interval. Moreover, a short suction interval had a significant effect on the surrounding flow field and flutter performance of the structure. Thus, setting a suction interval as narrow as possible within a reasonable range is a recommended flutter countermeasure for a bridge deck.

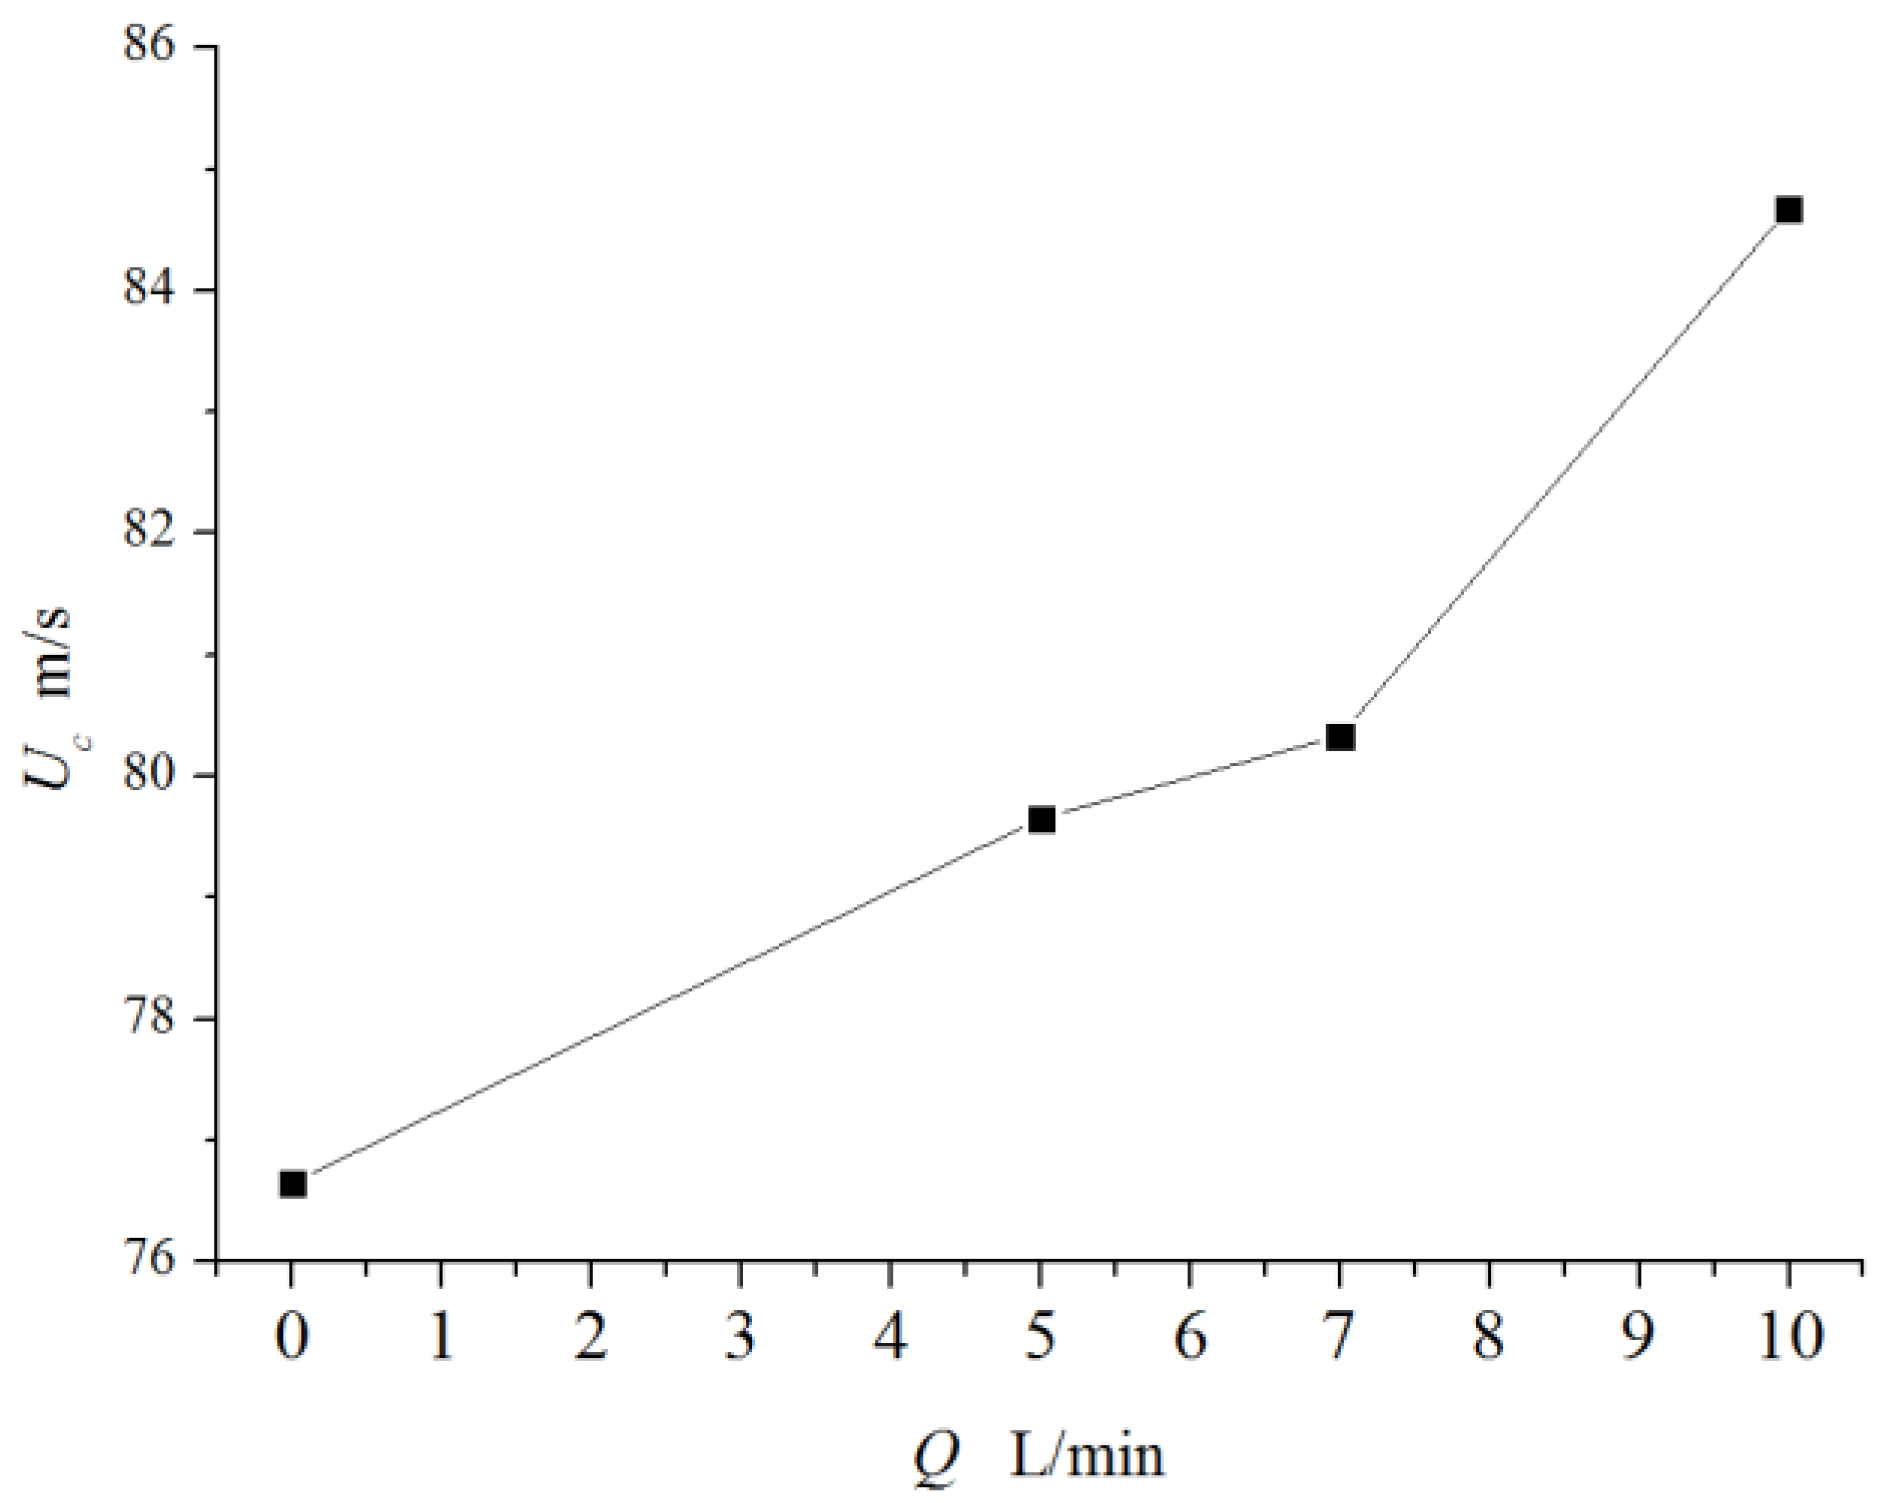
3.3.3. Influence of Suction Flow Rate

Four cases (i.e., l-2d-0, l-2d-5, l-2d-7, and l-2d-10) with the suction rate as a single variable were designed to study their control effects. As shown in Figure 13, the control effect was observable for the relative suction flow rates of C q = 0, 0.00174, 0.0244, and 0.00348 L/min, which corresponded to Q = 0, 5, 7, and 10 L/min, respectively. Further increasing the suction flow rate led to a higher flutter onset velocity with a peak value at the highest relative flow rate of C q = 0.00348 L/min. More specifically, the critical flutter speeds measured for suction flow rates Q = 5, 7, and 10 L/min were 79.66, 80.34, and 84.68 m/s, respectively. The corresponding β were 3.9%, 4.8%, and 10.5%, respectively. These results imply that a high suction flow rate (i.e., Q = 10 L/min) tends to provide more power for the interaction with the flow around the bridge deck. Thus, a superior aerodynamic shape can be reconstructed.

4. Concluding Remarks

Wind tunnel experiments were conducted to prove the feasibility of the steady-suction-based flow control method in practical applications and to investigate the control effect on the flutter stability of the bridge deck. The impact of the self-defined control parameters (i.e., suction slot position, suction interval, and suction rate) was studied in detail, and the FDs were analyzed to investigate the control mechanisms. The following conclusions can be drawn:
The flutter performance of the 2DOF bridge section model could be improved with the steady-suction-based flow control. The critical flutter speed was increased by up to 10.5% with optimal control parameters.
The effectiveness of the steady-suction-based flow control method was influenced by various control parameters, including the suction slot position, suction interval, and suction flow rate of the single slots. The experimental results showed that activating the suction slot on the windward side of the bridge to directly disturb the flow separation was the best control choice. Moreover, a superior aerodynamic shape was constructed when the relative suction interval was reduced and the suction flow rate increased to strengthen the control effect.
Based on the FD analysis of all the studied cases, the steady-suction control system influenced the FDs, particularly A 1 , A 2 , H 1 , and H 2 , which were related to the aerodynamic damping of the structure. In conclusion, the steady-suction-based control method strengthens the total damping of the structure by reducing negative aerodynamic damping, which promotes the dissipation of vibration energy and improves the flutter stability of the bridge deck.

Author Contributions

Conceptualization, D.X.; methodology, H.Z. and Z.L.; validation, J.Z.; formal analysis, H.L.; investigation, Z.L.; resources, D.X.; data curation, H.Z.; writing—original draft preparation, J.Z. and H.L.; writing—review and editing, J.Z.; visualization, H.Z.; supervision, J.O.; project administration, Z.L. and H.L.; funding acquisition, D.X. All authors have read and agreed to the published version of the manuscript.

Funding

This research was funded by the National Natural Science Foundation of China, grant number 51878131.

Acknowledgments

The work was conducted in the Joint Laboratory of Wind Tunnel & Wave Flume at the School of Civil Engineering, Harbin Institute of Technology, China.

Conflicts of Interest

The authors declare no conflict of interest.

References

  1. Nobuto, J.; Fujino, Y.; Ito, M. A study on the effectiveness of TMD to suppress a coupled flutter of bridge deck. Doboku Gakkai Ronbunshu 1988, 398, 413–416. [Google Scholar] [CrossRef] [Green Version]
  2. Pourzeynali, S.; Datta, T. Control of flutter of suspension bridge deck using TMD. Wind Struct. 2002, 5, 407–422. [Google Scholar] [CrossRef]
  3. Igusa, T.; Xu, K. Wide-Band Response of Multiple Subsystems with High Modal Density; Springer: Berlin, Germany, 1991. [Google Scholar] [CrossRef]
  4. Kwon, S.D.; Park, K.S. Suppression of bridge flutter using tuned mass dampers based on robust performance design. J. Wind Eng. Ind. Aerodyn. 2004, 92, 919–934. [Google Scholar] [CrossRef]
  5. Li, C.; Qu, W. Optimum properties of multiple tuned mass dampers for reduction of translational and torsional response of structures subject to ground acceleration. Eng. Struct. 2006, 28, 472–494. [Google Scholar] [CrossRef]
  6. Guo, Y.; Chen, W. Dynamic analysis of space structures with multiple tuned mass dampers. Eng. Struct. 2007, 29, 3390–3403. [Google Scholar] [CrossRef]
  7. Körlin, R.; Starossek, U. Wind tunnel test of an active mass damper for bridge decks. J. Wind Eng. Ind. Aerody. 2007, 95, 267–277. [Google Scholar] [CrossRef]
  8. Ge, Y.; Xiang, H. Aerodynamic stabilization for box-girder suspension bridges with super-long span. In Proceedings of the 5th European and African Conference Wind Engineering, Florence, Italy, 19–23 July 2009. [Google Scholar]
  9. Munshi, S.; Modi, V.; Yokomizo, T. Aerodynamics and dynamics of rectangular prisms with momentum injection. J. Fluids Struct. 1997, 11, 873–892. [Google Scholar] [CrossRef]
  10. Kubo, Y.; Yukoku, E.; Modi, V.J.; Yamaguchi, E.; Kato, K.; Kawamura, S.-I. Control of flow separation from leading edge of a shallow rectangular cylinder through momentum injection. J. Wind Eng. Ind. Aerody. 1999, 83, 503–514. [Google Scholar] [CrossRef]
  11. Farajpour, A.; Farokhi, H.; Ghayesh, M.H.; Hussain, S. Nonlinear mechanics of nanotubes conveying fluid. Int. J. Eng. Sci. 2018, 133, 132–143. [Google Scholar] [CrossRef]
  12. Ghayesh, M.H.; Farokhi, H.; Farajpour, A. Global dynamics of fluid conveying nanotubes. Int. J. Eng. Sci. 2019, 135, 37–57. [Google Scholar] [CrossRef]
  13. Farajpour, M.R.; Shahidi, A.R.; Farajpour, A. Elastic waves in fluid-conveying carbon nanotubes under magneto-hygro-mechanical loads via a two-phase local/nonlocal mixture model. Mater. Res. Express 2019, 6. [Google Scholar] [CrossRef]
  14. Chen, W.; Xin, D.; Xu, F.; Li, H.; Ou, J.; Hu, H. Suppression of vortex-induced vibration of a circular cylinder using suction-based flow control. J. Fluids Struct. 2013, 42, 25–39. [Google Scholar] [CrossRef]
  15. Xin, D.; Ou, J. Numerical study on improving wind-induced static characteristics of bridge section by steady air-suction. J. Shenyang Jianzhu Univ. 2008, 24, 1–5. (In Chinese) [Google Scholar]
  16. Xin, D.; Ou, J.; Li, H.; Li, Z. Suppression method for wind-induced flutter of long-span bridge based on steady air-suction. J. Jilin Univ. (Eng. Technol. Ed.) 2011, 41, 1273–1278. (In Chinese) [Google Scholar]
  17. Scanlan, R.H.; Tomo, J. Air foil and bridge deck flutter derivatives. J. Soil Mech. Found. Div. 1971, 97, 1717–1737. [Google Scholar]
  18. Sarkar, P.P.; Jones, N.P.; Scanlan, R.H. System identification for estimation of flutter derivatives. J. Wind Eng. Ind. Aerody. 1992, 42, 1243–1254. [Google Scholar] [CrossRef]
  19. Singh, L.; Jones, N.; Scanlan, R.; Lorendeaux, O. Identification of lateral flutter derivatives of bridge decks. J. Wind Eng. Ind. Aerody. 1996, 60, 81–89. [Google Scholar] [CrossRef]
  20. Chowdhury, A.G.; Sarkar, P.P. A new technique for identification of eighteen flutter derivatives using a three-degree-of-freedom section model. Eng. Struct. 2003, 25, 1763–1772. [Google Scholar] [CrossRef]
  21. Poulsen, N.K.; Damsgaard, A.; Reinhold, T.A. Determination of flutter derivatives for the Great Belt Bridge. J. Wind Eng. Ind. Aerody. 1992, 41, 153–164. [Google Scholar] [CrossRef]
  22. Xiang, H. Modern Theory and Practice on Bridge Wind Resistance; China Communications Press: Beijing, China, 2005; pp. 307–312. [Google Scholar]
  23. Matsumoto, M.; Daito, Y.; Yoshizumi, F.; Ichikawa, Y.; Yabutani, T. Torsional flutter of bluff bodies. J. Wind Eng. Ind. Aerody. 1997, 69, 871–882. [Google Scholar] [CrossRef]
  24. Gu, M.; Zhang, R.; Xiang, H. Identification of flutter derivatives of bridge decks. J. Wind Eng. Ind. Aerody. 2000, 84, 151–162. [Google Scholar] [CrossRef]
Figure 1. Size of the section model: (a) cross section; (b) longitudinal section.
Applsci 10 01372 g001
Figure 2. Suction slot arrangement.
Applsci 10 01372 g002
Figure 3. Experimental setup: (a) steady-suction device and (b) section model.
Applsci 10 01372 g003
Figure 4. Flutter derivatives (FDs) extracted by the present experiment and comparison with results obtained by Poulsen et al. [21] and Xiang [22]. (ad) A i ( i = 1 4 ); (eh) H i ( i = 1 4 ).
Applsci 10 01372 g004aApplsci 10 01372 g004b
Figure 5. (ad) Flutter derivatives H i ( i = 1 4 ) for test cases with different suction positions.
Applsci 10 01372 g005
Figure 6. (ad) Flutter derivatives H i ( i = 1 4 ) for test cases with different suction intervals.
Applsci 10 01372 g006aApplsci 10 01372 g006b
Figure 7. (ad) Flutter derivatives H i ( i = 1 4 ) for test cases with different suction flow rates.
Applsci 10 01372 g007
Figure 8. (ad) Flutter derivatives A i ( i = 1 4 ) for test cases with different suction positions.
Applsci 10 01372 g008
Figure 9. (ad) Flutter derivatives A i ( i = 1 4 ) for test cases with different suction intervals.
Applsci 10 01372 g009aApplsci 10 01372 g009b
Figure 10. (ad) Flutter derivatives A i ( i = 1 4 ) for test cases with different suction flow rates.
Applsci 10 01372 g010
Figure 11. Flutter wind speed versus suction position.
Applsci 10 01372 g011
Figure 12. Flutter wind speed versus relative suction interval.
Applsci 10 01372 g012
Figure 13. Flutter wind speed versus suction flow rate.
Applsci 10 01372 g013
Table 1. Test cases for flutter performance of section model with various control parameters.
CaseWind Velocity (m/s)PositionIntervalFlow Rate
s002, 4, 6, 8, 10, 12, 14---
l-2d-102, 4, 6, 8, 10, 12, 14windward2H10 L/min
m-2d-102, 4, 6, 8, 10, 12, 14middle2H10 L/min
b-2d-102, 4, 6, 8, 10, 12, 14leeward2H10 L/min
l-1d-52, 4, 6, 8, 10, 12, 14windward1H5 L/min
l-2d-52, 4, 6, 8, 10, 12, 14windward2H5 L/min
l-3d-52, 4, 6, 8, 10, 12, 14windward3H5 L/min
l-4d-52, 4, 6, 8, 10, 12, 14windward4H5 L/min
l-2d-72, 4, 6, 8, 10, 12, 14windward2H7 L/min
Table 2. Parameters of bridge section model.
PropertyUnitReal BridgeSimilarity RatioSection Model
Length/Lm1624 0.7
Breadth/Bm311/800.3875
Height/Hm41/800.05
Equivalent masskg/m23,6871/8023.701
Equivalent mass moment of inertiakg·m2/m2.501 × 1051/8040.061
Frequency of heaving modeHz0.09726.662.586
Frequency of pitching modeHz0.2725.196.8
Frequency ratio 2.780.95/12.63

