Article

Prediction of Fracture Damage of Sandstone Using Digital Image Correlation

1
School of Science, Qingdao University of Technology, Qingdao 266033, Shandong, China
2
Sustainable Construction, The State University of New York, Syracuse, NY 13210, USA
*
Author to whom correspondence should be addressed.
Appl. Sci. 2020, 10(4), 1280; https://doi.org/10.3390/app10041280
Submission received: 10 January 2020 / Revised: 10 February 2020 / Accepted: 11 February 2020 / Published: 14 February 2020
(This article belongs to the Special Issue Applications of Remote Image Capture System in Agriculture)

Abstract

:

Featured Application

A non-contact digital image correlation technique is used to predict sandstone failure. Failure strain for the tested sandstone is estimated to be around 0.004. Finite element analysis verifies the accuracy of prediction results based on experiments.

Abstract

Investigation on the deformation mechanism of sandstone is crucial to understanding the life cycle patterns of pertinent infrastructure systems considering the extensive adoption of sandstone in infrastructure construction of various engineering systems, e.g., agricultural engineering systems. In this study, the state-of-the-art digital image correlation (DIC) method, which uses classical digital photography, is employed to explore the detailed failure course of sandstone with physical uniaxial compression tests. Four typical points are specifically selected to characterize the global strain field by plotting their corresponding strain–time relationship curves. Thus, the targeted failure thresholds are identified. The Hill–Tsai failure criterion and finite element simulation are then used for the cross-check process of DIC predictions. The results show that, though errors exist between the experimental and the theoretical values, overall, they are sufficiently low to be ignored, indicating good agreement. From the results, near-linear relationships between strain and time are detected before failure at the four chosen points and the failure strain thresholds are almost the same; as low as 0.004. Failure thresholds of sandstone are reliably determined according to the strain variation curve, to forecast sandstone damage and failure. Consequently, the proposed technology and associated information generated from this study could be of assistance in the safety and health monitoring processes of relevant infrastructure system applications.

1. Introduction

As one typical type of sedimentary rock, often consisting of sand-scale mineral particles (e.g., quartz, feldspar), sandstone has long been used as a functional construction material in various project types of pavements, hydraulic systems, warehouses, and underground structures for structural purposes in diverse agricultural and industrial sectors [1,2,3,4]. The failure mechanism and pattern of sandstone imposes an important role on the safe construction and operation of pertinent structures. Moreover, the material properties of sandstone are often observed and characterized to be of discontinuity, nonlinearity, anisotropy, and non-elasticity [5]. This leaves the prediction of the structural behavior and performance of sandstone as a significant challenge. Consequently, mechanical properties and failure patterns of sandstone have been the common research focus of various disciplines integrating mechanics, material science, and engineering [6,7].
Significant research efforts were committed to understanding and profiling mechanical behavior, material properties, and failure modes of sandstone through various methods, techniques, and tools, e.g., multi-scale analysis, digital image correlation technique, strain gage method, three-point bending test, and empirical simulation in [2,4,8,9,10]. Traditional engineering measurement methods for motions and strains were often criticized for their limitations in real applications due to their underlying deficiencies resulting from contacting and localized operations [11]. In contrast, the digital image correlation (DIC) technique can compensate with its unique advantages of being contactless and able to capture full-field strain and displacement over the traditional measurement approaches. Moreover, DIC technology utilizes classical digital photography and it is relatively cost-effective when compared to other optical methods, such as laser shearography [12]. Therefore, DIC has been extensively employed in various engineering applications since the 1980s [13,14,15,16], with no exception to relevant investigations on sandstone and rock materials. Munoz and Taheri [17] studied stress-strain features of sandstone under monotonic uniaxial compression. Strain pattern development of sandstone with varying aspect ratios was inspected by a three-dimensional digital image correlation technique since it can capture field strain during the whole compression process. Their study revealed that different strain development features are associated with pre- and post-peak regimes. They found that, in the pre-peak regime, strains localize gradually and develop at a slower speed, but in the post-peak regime, strains develop at diverse speeds due to varying impacts of local deformations. Yue et al. [8] perceived that little information is available on whether DIC and the strain gage method are accurate for fracture mechanism characterization. Then, they conducted a study to examine the accuracy of DIC and the strain gage method in characterizing crack patterns for white marble specimens. The DIC technique was discovered to be flexible and stable for characterizing rock failure mechanisms. Song et al. [18] investigated the damage evolution and crack growth of rocks using digital image correlation analysis. It was found that the cyclic value has a significant influence on strain localization and damage evolution when the cyclic loading amplitude exceeds a certain value. By performing tests on Springwell sandstone, Stirling et al. [19] utilized DIC technology to qualitatively and numerically examine how loading method and object geometry can affect strain localization processes over sample faces. In their study, the applicability of DIC to substitute for traditional strain measurement methods for Brazilian testing process was demonstrated. To support the applications of rock and sandstone materials in secure underground construction, Wu et al. [4] performed uniaxial compression tests to understand the mechanical behavior of holed sandstone using the DIC method. Compared to the intact specimens, those artificially holed ones show almost half of the expected mechanical performance depending on hole shapes. DIC technology is able to visualize strain and displacement fields to consistently profile failure patterns. The digital image correlation method was used by Lin and Labuz [20] to successfully assess the mode I fracture parameters including process-zone magnitude and critical opening displacement for Berea sandstone with a three-point bending test. The tensile fracture features covering opening displacement and crack size were identified, showing that over all the tests, process-zone retains a stable length and critical opening. Li et al. [21] examined the micro behavior of mode I crack of sandstone due to varied loading speeds using acoustic emission and digital image correlation. All the previous studies are helpful in facilitating the understanding and characterization of mechanical behavior and performance of sandstone components within various application contexts. Nevertheless, in the existing literature several disadvantages are associated with DIC applications. First, based on a literature search, few studies have been carried out yet to particularly concentrate on the dynamic failure process to obtain full-field strain values of sandstone which can provide more direct, specific, and deeper information on a sandstone failure course. Moreover, to the best of our knowledge, no studies have been performed to systematically examine the specific thresholds of failure strain of sandstone materials. Finally, most studies used the DIC technique for sandstone behavior investigation without knowing the reliability and accuracy of the obtained results.
The present research expects to fill out this research gap. Compared to the existing literature, this study provides a more specialized and detailed investigation into the full-field strain of sandstone under different loading scenarios by examining multiple representative field regions using DIC. Different from previous studies, this research especially explores the specific failure thresholds of sandstone materials. Advantageous over the literature, this study combines three different methods including optical DIC, theoretical analysis, and finite element simulation for the cross-check of result accuracy. By conducting uniaxial compression experiments on sandstone, this paper proposes to use the state-of-the-art digital image correlation method to gain the full-field strain of sandstone model subject to the process of uniaxial compression. In particular, deep investigations are carried out on four typical points selected from the four areas and moments of the full-field failure. These four points are considered to be the typical representatives characterizing the specimen failures course. A total of 12 specimens with identical dimensions are tested. Dynamic strain–time curves are derived, corresponding to the four chosen points in the course of the compression test in order to detect the range values of failure thresholds for sandstone samples. Based on the obtained thresholds, failure patterns can then be forecasted for sandstone, and further, the pertinent structure components and systems. The DIC processing results are cross-checked by the Hill–Tsai failure criterion and finite element method (FEM), which have been widely used for analyzing failure mechanisms from two distinct perspectives.

2. Digital Image Correlation Technique

The DIC technique represents an optical approach for reliably measuring the two-dimensional or three-dimensional image alterations to quantify deformations and strains via advanced image registration and target tracking algorithms [17]. Compared to other approaches, such as mechanical deflectometers and speckle shearing interferometry, for deformation and strain measurement, DIC is an easy to operate and cost-effective technique. For example, in many cases, it does not need any special working environment and can even work for extreme conditions, e.g., at the temperature higher than 1000 °C. Meanwhile, it is more accurate than manual measurements. DIC can be used to estimate strains in a wide range (e.g., from the lower order of 0.001 to the higher order of 1) with its measurement sensitivity on deformations reaching 1/100,000 of the view field in-plane. With clean cameras and patterned speckles, the strain resolution can be around 20 microstrains. Due to these advantages, along with advances in computer technology, DIC has been extensively adopted for monitoring deformation patterns, failure modes of materials, and structural health without damaging the objects under investigation.

2.1. Working Principle of the DIC Technique

For mechanical performance tests, DIC works to obtain micro details of targeted process information including local and average strain and displacement. To achieve this, DIC processes the digital images collected during physical experiments through image processing techniques and statistical cross-correlations. More specifically, as in Figure 1a, it first defines the specific pixel intensity subsets referring to the small regions of interest on the raw pre-deformation image and then, as in Figure 1b, the cross-correlations between pre-deformation and post-deformation are computed. With the pre-deformation image as the reference, best cross-correlation coefficients between the subsets, which define the fundamental computing units in DIC, on pre-deformation and post-deformation images are calculated to seek the mapping correspondences between subsets. After the mapping process, displacements are calculated for each subset center point to get the information of full-field deformation. Strains are then calculated based on the obtained information on displacements, as in Figure 1c. Among many options, the standardized covariance correlation function [22,23] defines an alternative approach for the computation of the two-dimensional discrete correlation C(u,v) (Equation (1)):
C ( u , v ) = x = M M y = M M [ f ( x , y ) f m ] [ g ( x + u , y + v ) g m ] x = M M y = M M [ f ( x , y ) f m ] 2 x = M M y = M M [ g ( x + u , y + v ) g m ] 2
where f(x,y) and g(x + u, y + v) represent the grey-scale function values of all the pixels on the images taken before and after deformation (x, y indicate point locations prior to deformation.); fm and gm are the average grey-scale values of image subsets; u, v mean the displacement values in the center of relevant subset in terms of pixels.
This assumes that maximum correlations indicate correspondence [24]. That is, for a specific pre-deformation subset, the subset on the post-deformation image having the largest correlation with this designated subset, is regarded as its counterpart after deformation. The corresponding matching accuracy can be in the order of 0.01 pixels. By contrasting the counterpart pairs on pre- and post-deformation images, the desired deformation information at all points can finally be derived. The full-field strain can further be estimated based on the deformations of all these individual points.
In general, the DIC method uses charge-coupled device (CCD) camera systems with specific resolutions to record the images for the irregular distribution profiles of speckles on the surfaces of specimens before and after deformations. These digital images are then processed and analyzed using the chosen numerical methods to acquire such process information as displacement and strain. For image shooting, additional lighting sources may be required where natural lights are not capable of providing enough luminance. The demand of lighting intensity depends on the quality requirements of images taken by the CCD. In addition, for the use of DIC, the cross-correlation calculation requires detailed information of randomly scattered speckles on the surfaces of studied objects. As such, when natural speckles are of insufficient utility, extra speckles can be artificially created by painting the targeted surfaces in either black or white [25].

2.2. Implementation of DIC for Strain Measurement in This Study

Based on the principle of DIC described above, this study combines the use of a universal testing machine, automation control system, charge-coupled device camera, and computer system for the characterization and prediction of the failure pattern of sandstone materials. Figure 2 shows the implementation procedure of the study. For each experiment cycle, five steps are essentially executed. Step 1 is to prepare specimens in specific dimensions and set up equipment systems. To ensure test effects, specimens can be artificially treated, e.g., painted to create scattered speckles. The equipment systems used for compression testing, image recording, and storing are set up. Step 2 is loading specimens. Equipment positions are adjusted to enable the studied specimens to be placed at the center of the universal testing machine for accurate experiment processes. Step 3 records pre-deformation images and stores them on the computer as reference images. Step 4 operates the testing machine and obtains post-deformation images at different time points. Step 5 is to conduct DIC analysis to calculate numerical displacement and strain information based on the process in Figure 1. Dynamic strain–time curves are plotted based on the received information. Specific equipment and operation environment information is as follows. A Basler SCA1600 14FM CCD black-white camera was used for image collection. It is equipped with a Sony ICX274 CCD sensor and can supply up to 14 frames per second with a 2 MP resolution and 4.4 × 4.4 µm pixel size. The adopted universal testing machine has a loading capacity of 0–600 kN. A regular HP-Z600 workstation was used for image storage and processing. VIC-2D software from Correlated Solutions was installed on the workstation for DIC analysis. All the experiments were performed in fall with a dry bulb temperature around 24 °C and a relative humidity about 55% in Qingdao City, China.

3. Theoretical Modeling of Sandstone Failure with Hill–Tsai Criterion

Sandstone, as one type of natural composite material, often consists of sand-size grains of multiple single materials of varying characteristics with certain combinations. Physical properties and mechanical behavior of sandstone materials vary significantly depending on the random distribution of material constituents. From this perspective, sandstone materials cannot be viewed and analyzed simply through some particular models and theories aiming at single non-composite materials. Models and theories for investigating mechanical performance of composite materials are demanded.
Based on [26,27], in this study, the classical stress-based Hill–Tsai yield criterion (Equation (2)) put forward by Hill in 1948 for characterizing the properties and behavior of anisotropy composite materials [27] was adopted for theoretical analysis of sandstone failure process.
cos 4 θ X 2 + ( 1 S 2 1 X 2 ) cos 2 θ sin 2 θ + sin 2 θ Y 2 = 1 σ 2
where X, Y, S represent axial strength, lateral strength, and shear strength, respectively. For example, the axial strength, lateral strength, and shear strength of sandstone are around 40, 20, and 10 MPa, respectively. The letter θ symbolizes off-axis angle, while σ means failure stress.
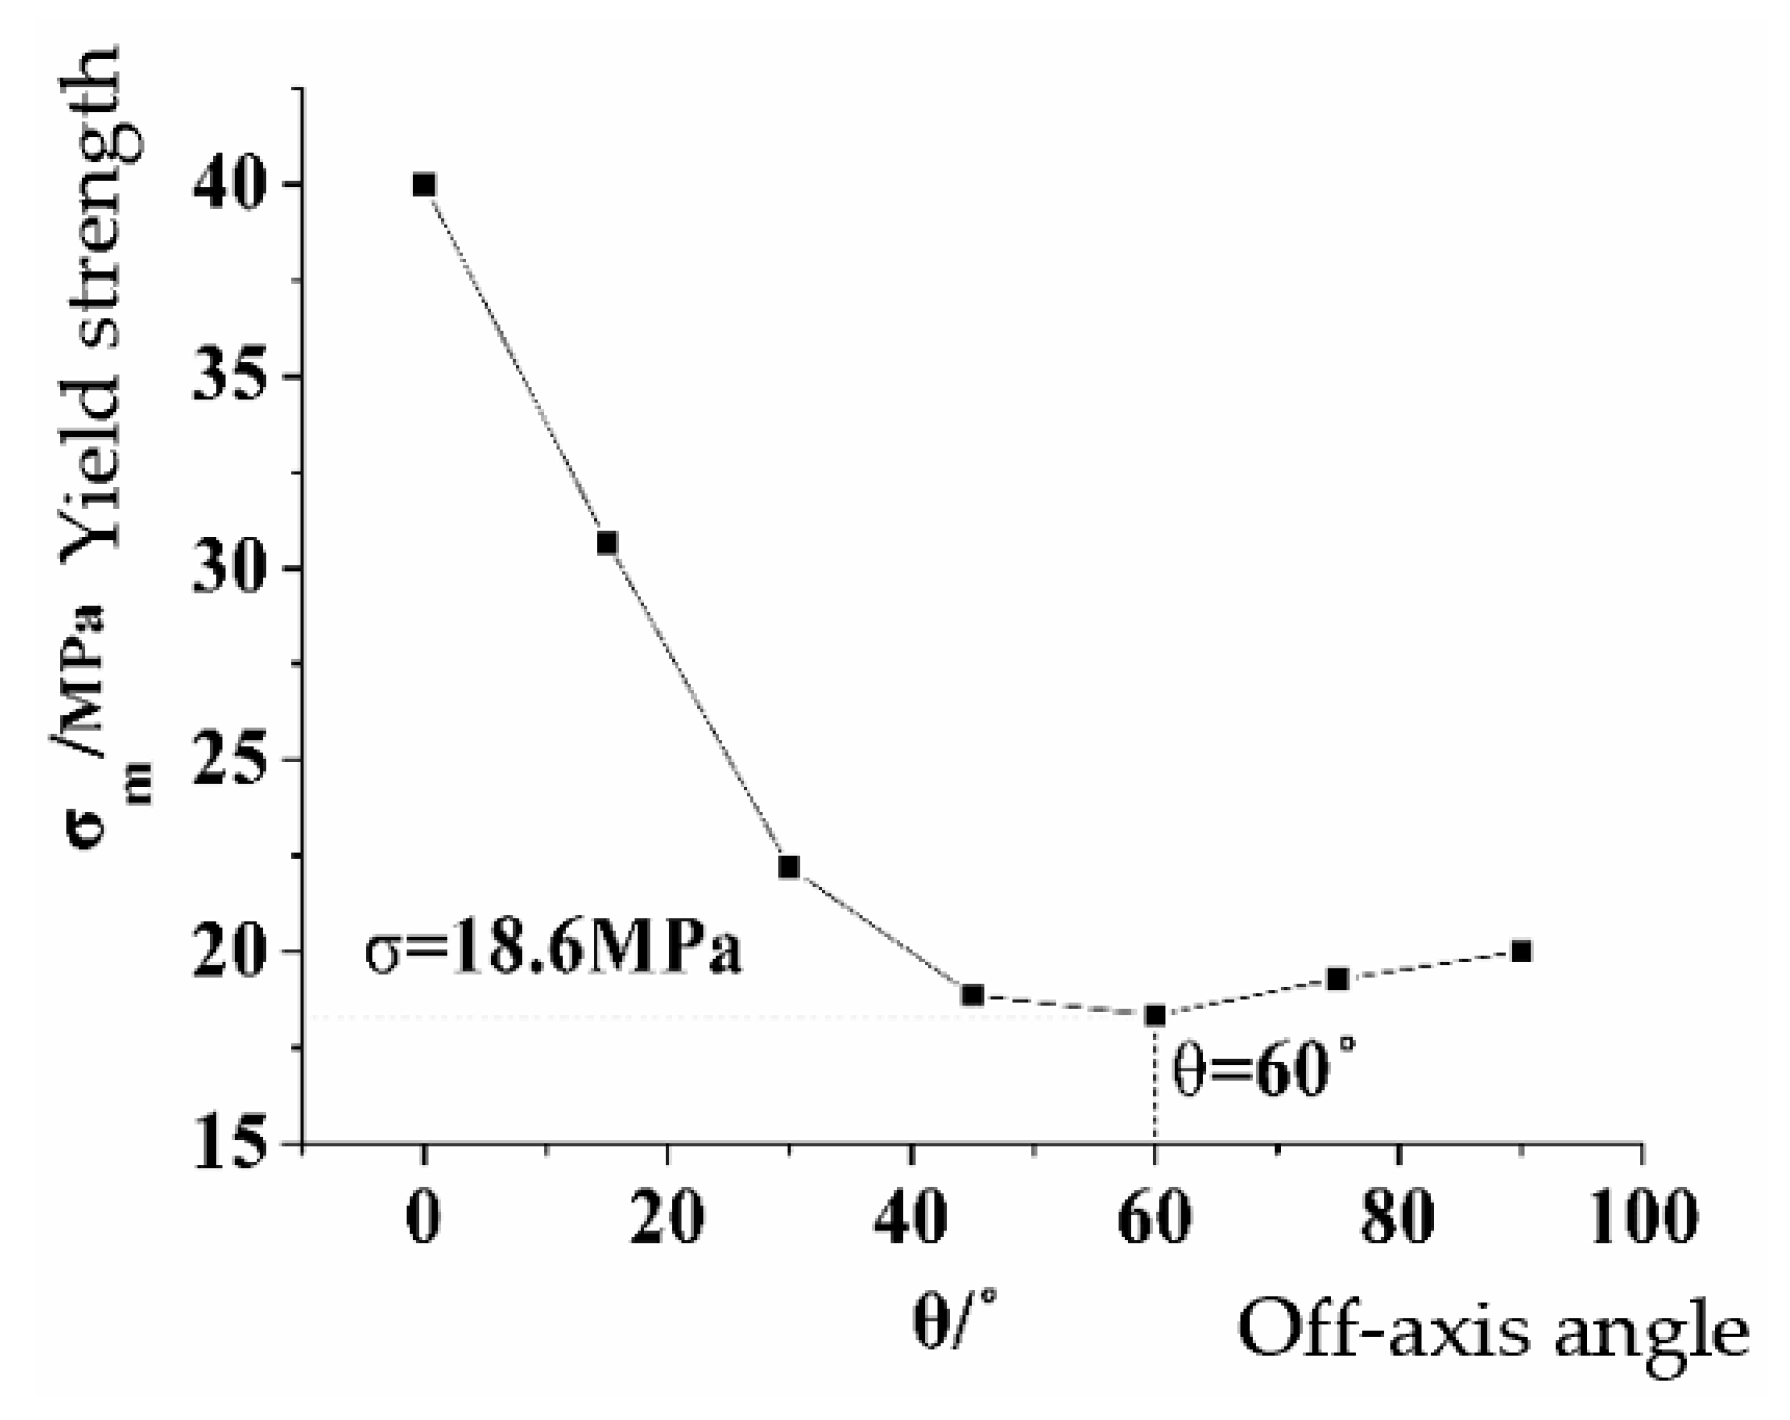
Figure 3 shows the relation between stress strength and off-axis angle for sandstone. It can be seen from Figure 3 that the stress strength of sandstone is 40 MPa when θ = 0. As θ increases, stress strength drops at first and then goes up. When θ = 60°, the smallest stress strength reaches 18.3 MPa. When θ is 90°, the stress strength arrives at 20 MPa. That is to say, the minimal stress strength occurs at the position where a 60° angle is formed. This identifies the weakest point where failure easily occurs. The Young’s elasticity modulus of this class of sandstone is about E = 5 × 10³ MPa. Combining the failure stress of 18.3 MPa, as obtained by the Hill–Tsai criterion, through Young’s modulus formula (Equation (3)), failure strain ε of the sample sandstone can be calculated as 3.7 × 10⁻³.
ε = σ E
where ε represents the dimensionless strain and σ means the stress. E is Young’s modulus.
These theoretical results may be utilized as numerical benchmarks against which the testing results obtained from the following physical experiments are to be compared. These mutual comparisons and cross-checks are expected to help to validate the feasibility of the DIC technique for reliable characterization and forecasts on the failure patterns and modes of sandstone materials.

4. Experiment Design

The chosen rock test-piece was a sandstone cylinder 50 mm in diameter and 100 mm in height. As mentioned, a CCD black-white camera Basler SCA1600 14FM was used for shooting images. It is a 1/1.8” CCD Firewire camera having 1628 × 1236 pixel resolution with a maximum frame rate of 14 fps and a pixel size of 4.4 × 4.4 µm. All the during-process figures were automatically recorded and stored onto an HP-Z600 workstation in bmp format at the frequency of 2 fps. The loading range of the adopted universal testing machine was 0–600 kN. During the compression process, the compressing head of the machine can automatically adjust its pressure direction corresponding to the dynamic specimen movements so as to satisfy the required experimental conditions of uniaxial compression. Our specific goal was to obtain the profiles of the strain field of the specimens to trace relevant failure modes. Therefore, the robust two-dimensional digital image correlation system of VIC-2D was adopted for image analysis due to its sufficiency for dealing with in-plane deformations and its greater convenience when compared to three-dimensional DIC procedures. The recorded images were uploaded into VIC-2D software, which is installed on the HP-Z600 workstation for image analysis. For experimental purposes, in total, the same experimental protocol was repeated on 12 identical sandstone specimens to secure reliable outcomes.
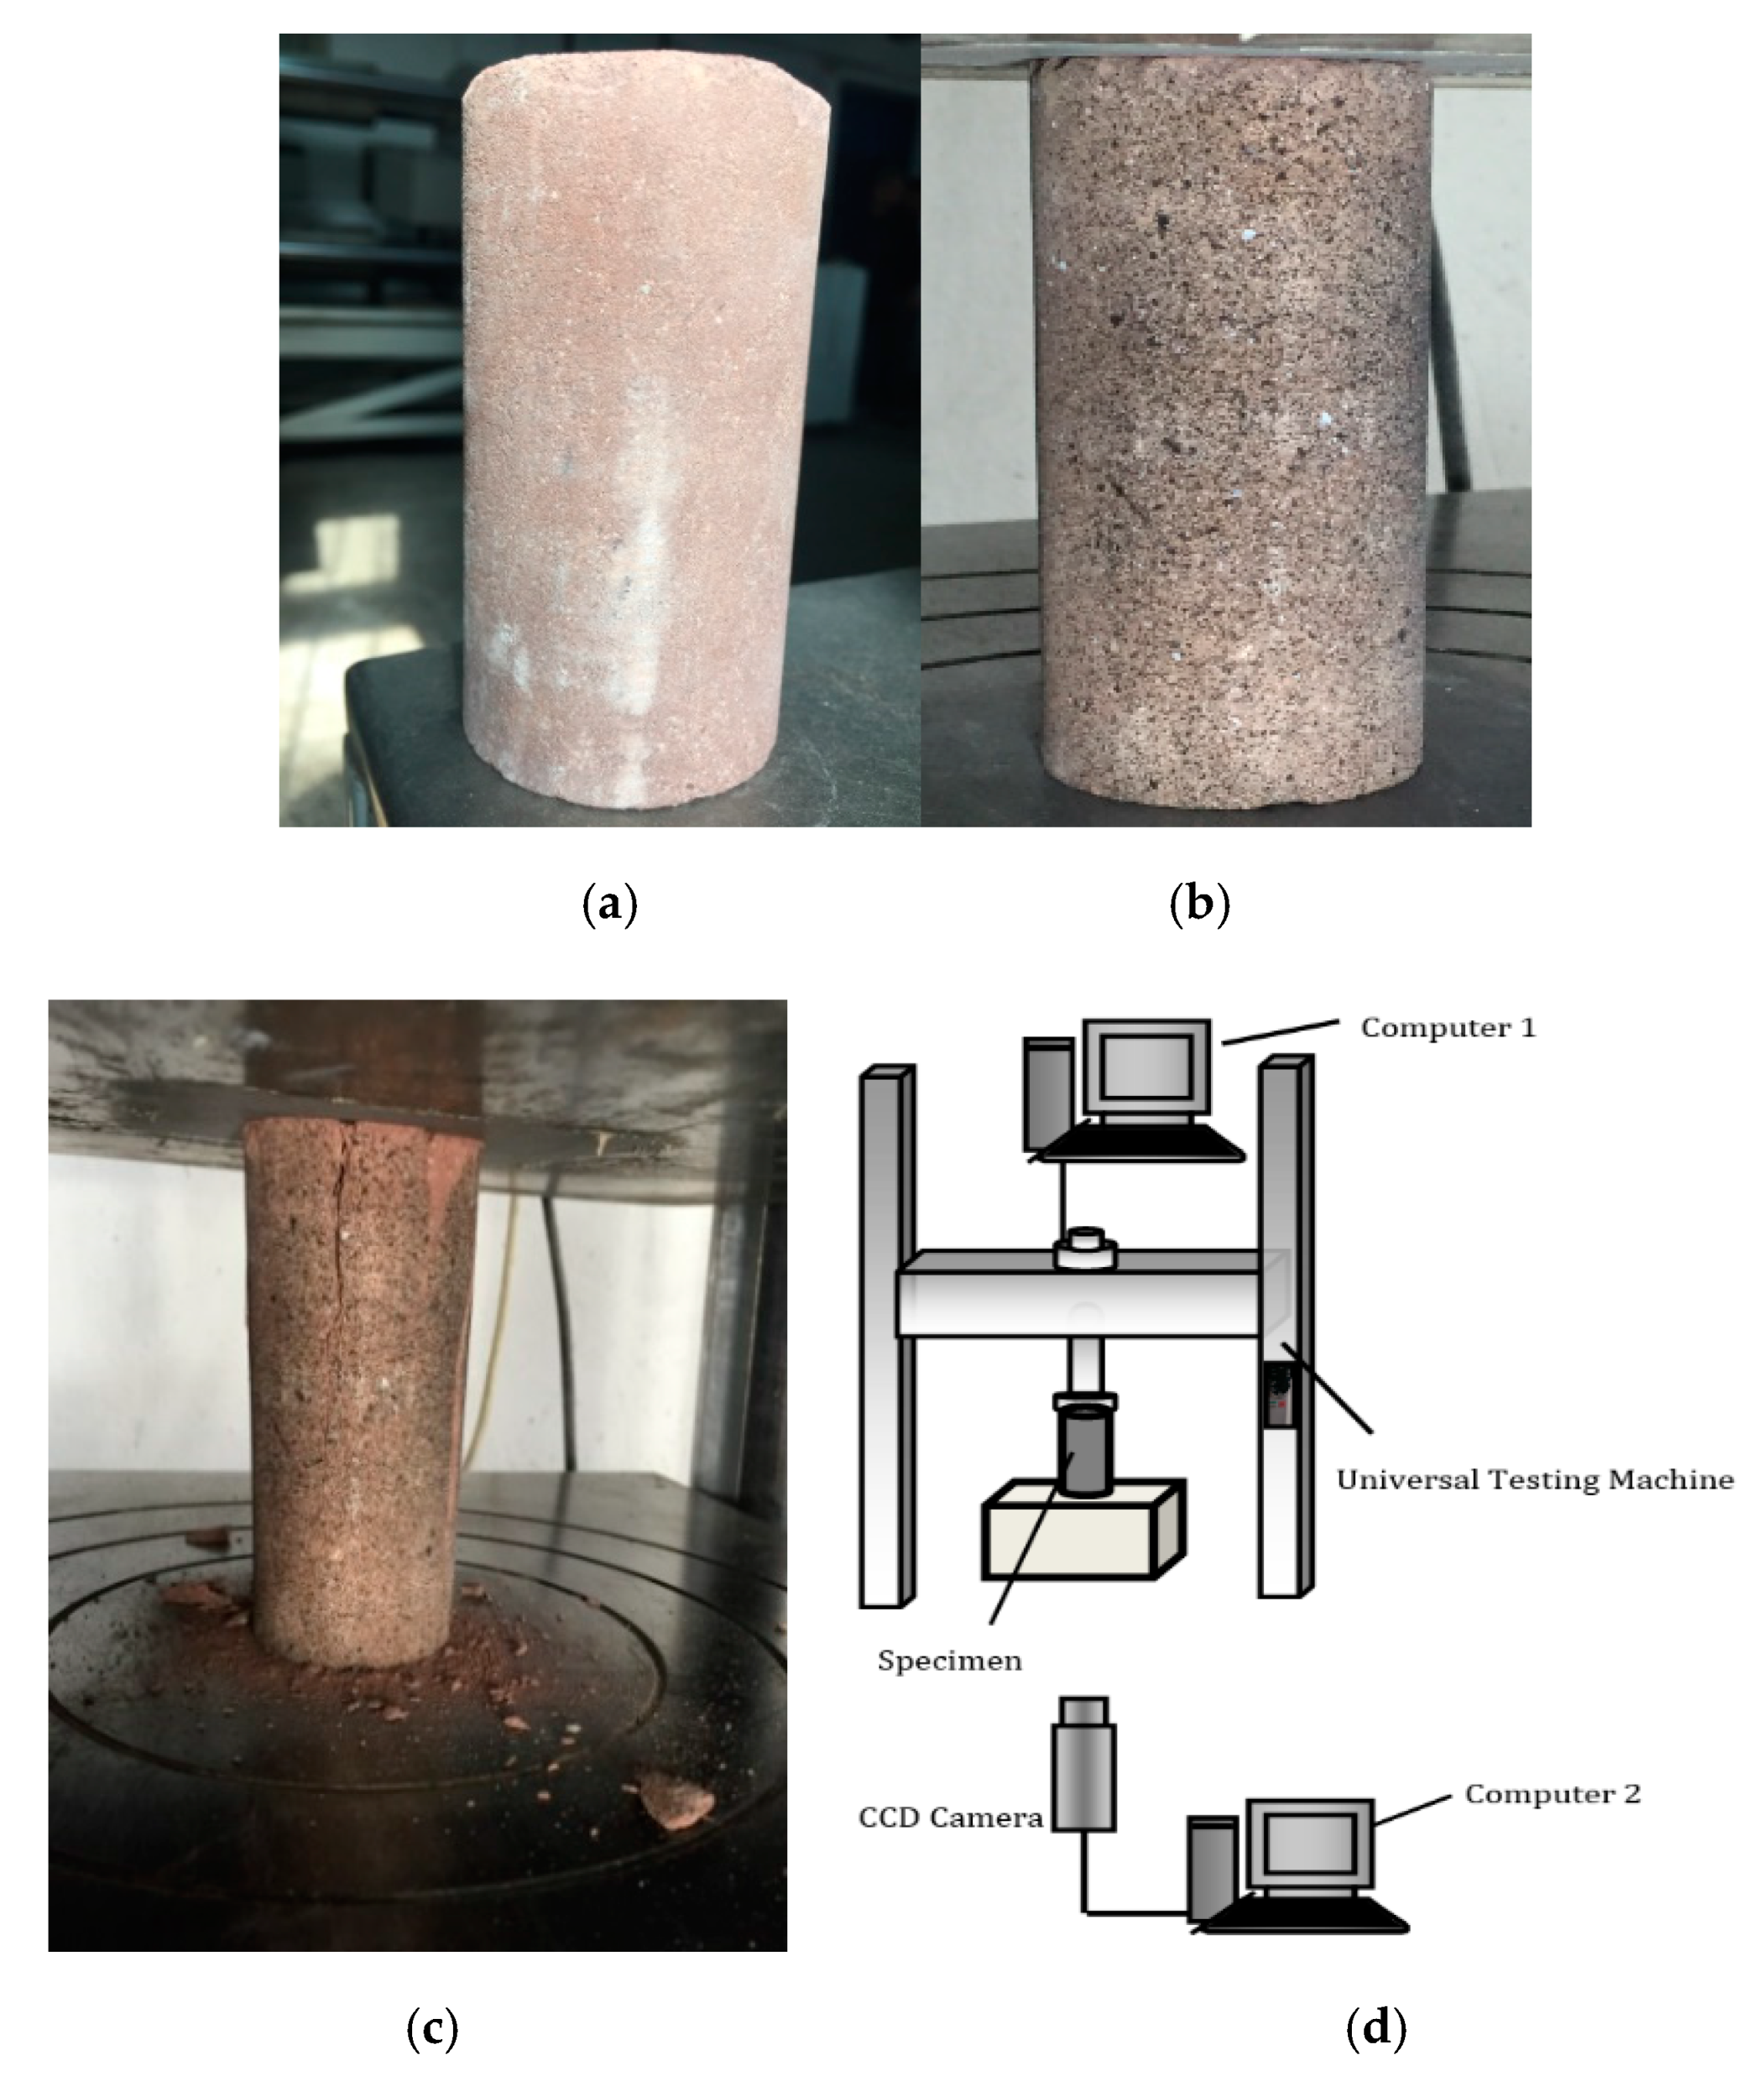
Figure 4 displays the tested samples and the image recording system. While Figure 4a shows the raw tested specimen, Figure 4b presents the corresponding specimen, which was manually painted to highlight the related surface speckles for better testing effects. First, the surfaces of the sandstone test-piece were thoroughly cleaned. Matte black paint was subsequently sprayed to the surface, resulting in randomly scattered speckles for the sandstone test-piece. After ventilating to dry, the painted specimen was placed at the center of the testing machine. Figure 4c shows an example of specimen failure. The measurement system is shown in Figure 4d. The recording camera was calibrated to be able to view the surface facing the camera and acquire quality images on the piece by adjusting its focal length. Meanwhile, an external lighting source with uniform luminance was added. The testing machine was turned on and then adjusted to enable the machine head to just touch the specimen. Loading rate was first controlled at 0.1 MPa/s by an automating process, and then at 0.3 MPa/s to see if a loading rate change can alter the value of failure strain for sandstone. The CCD-based system was used to record the whole loading process at the image shooting rate of two images per second until the compression process ended.

5. Experiment Results and Discussion

As mentioned earlier, the experimental tests were repeated on 12 identical sandstone specimens. Decent consistency was found among all the specimens in terms of failure areas and damage patterns. All the specimens incurred shear failures, with failure angles ranging between 65° and 75°. Some variations were associated with failure angles of specimens, possibly due to random errors and hooping effects from the testing machine on the specimen ends. Limited to the DIC technique, all the following results and discussion correspond to the specimen surface areas captured by the used recording system. The cylinder areas that could not be captured by the system were not considered. Due to unevenness of rock materials, symmetric failures may not have occurred.

5.1. Scenario 1: Loading Rate at 0.1 MPa/s

5.1.1. Results on X-Direction Strain Dynamics

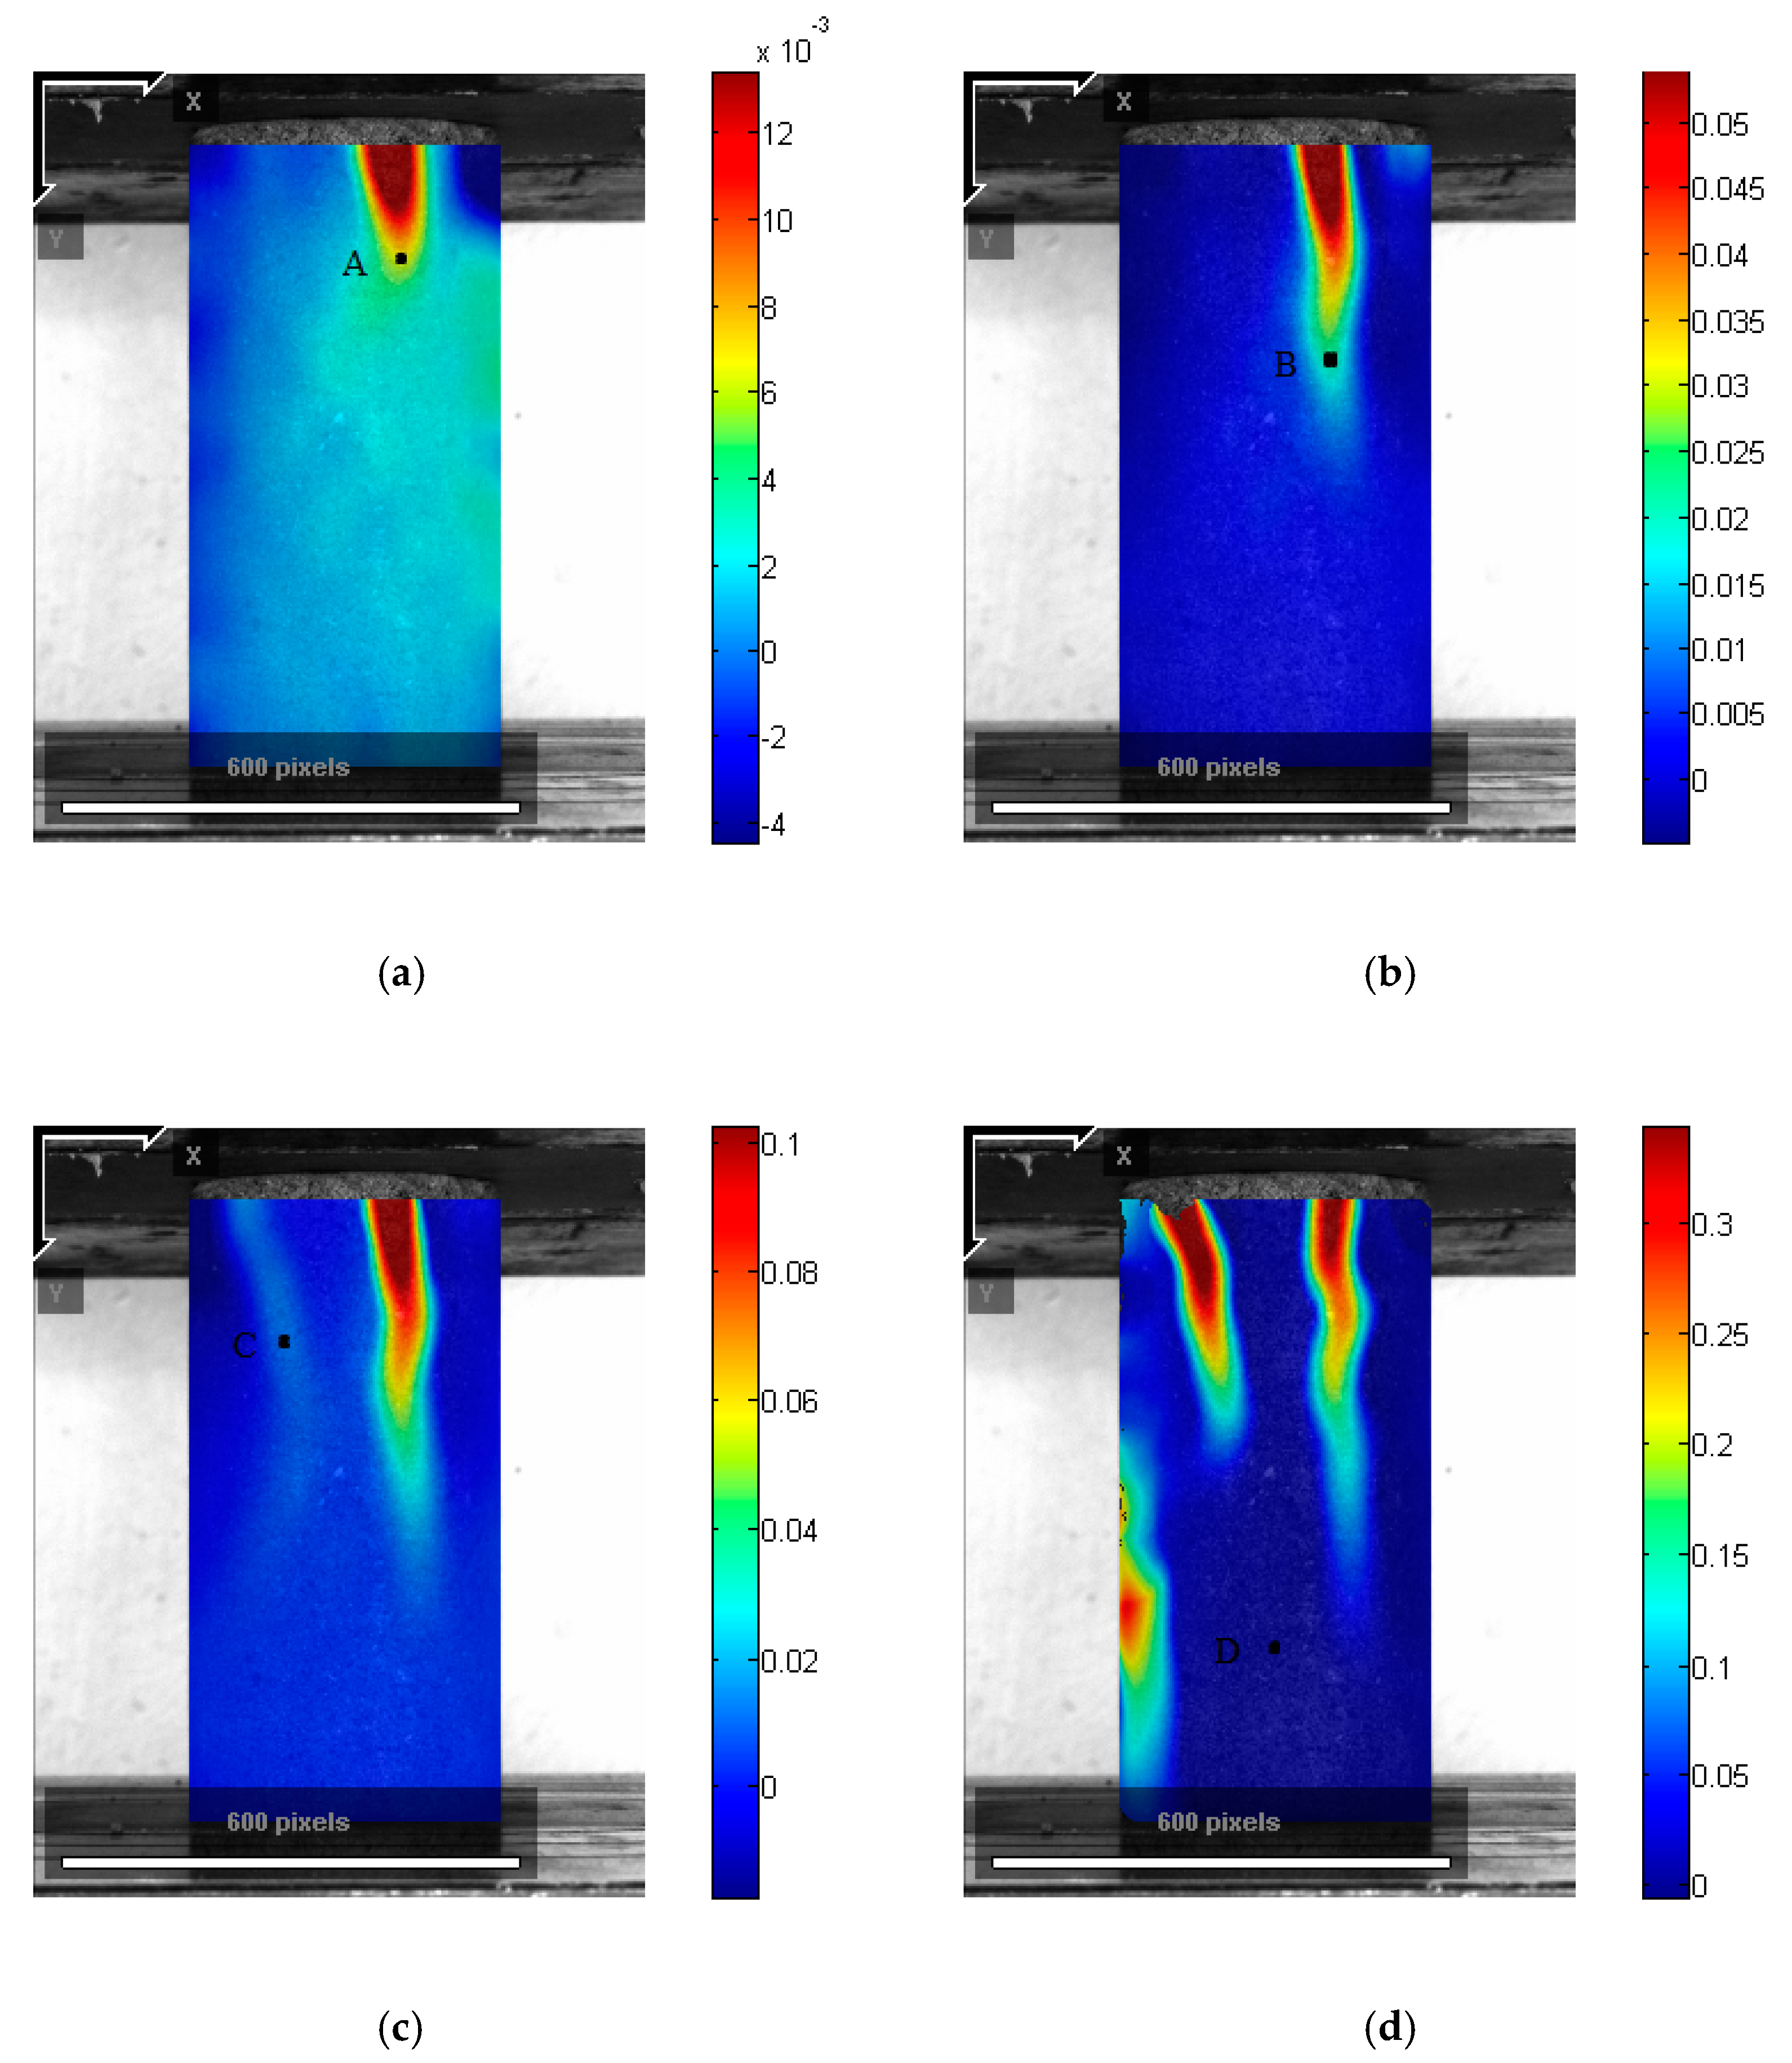
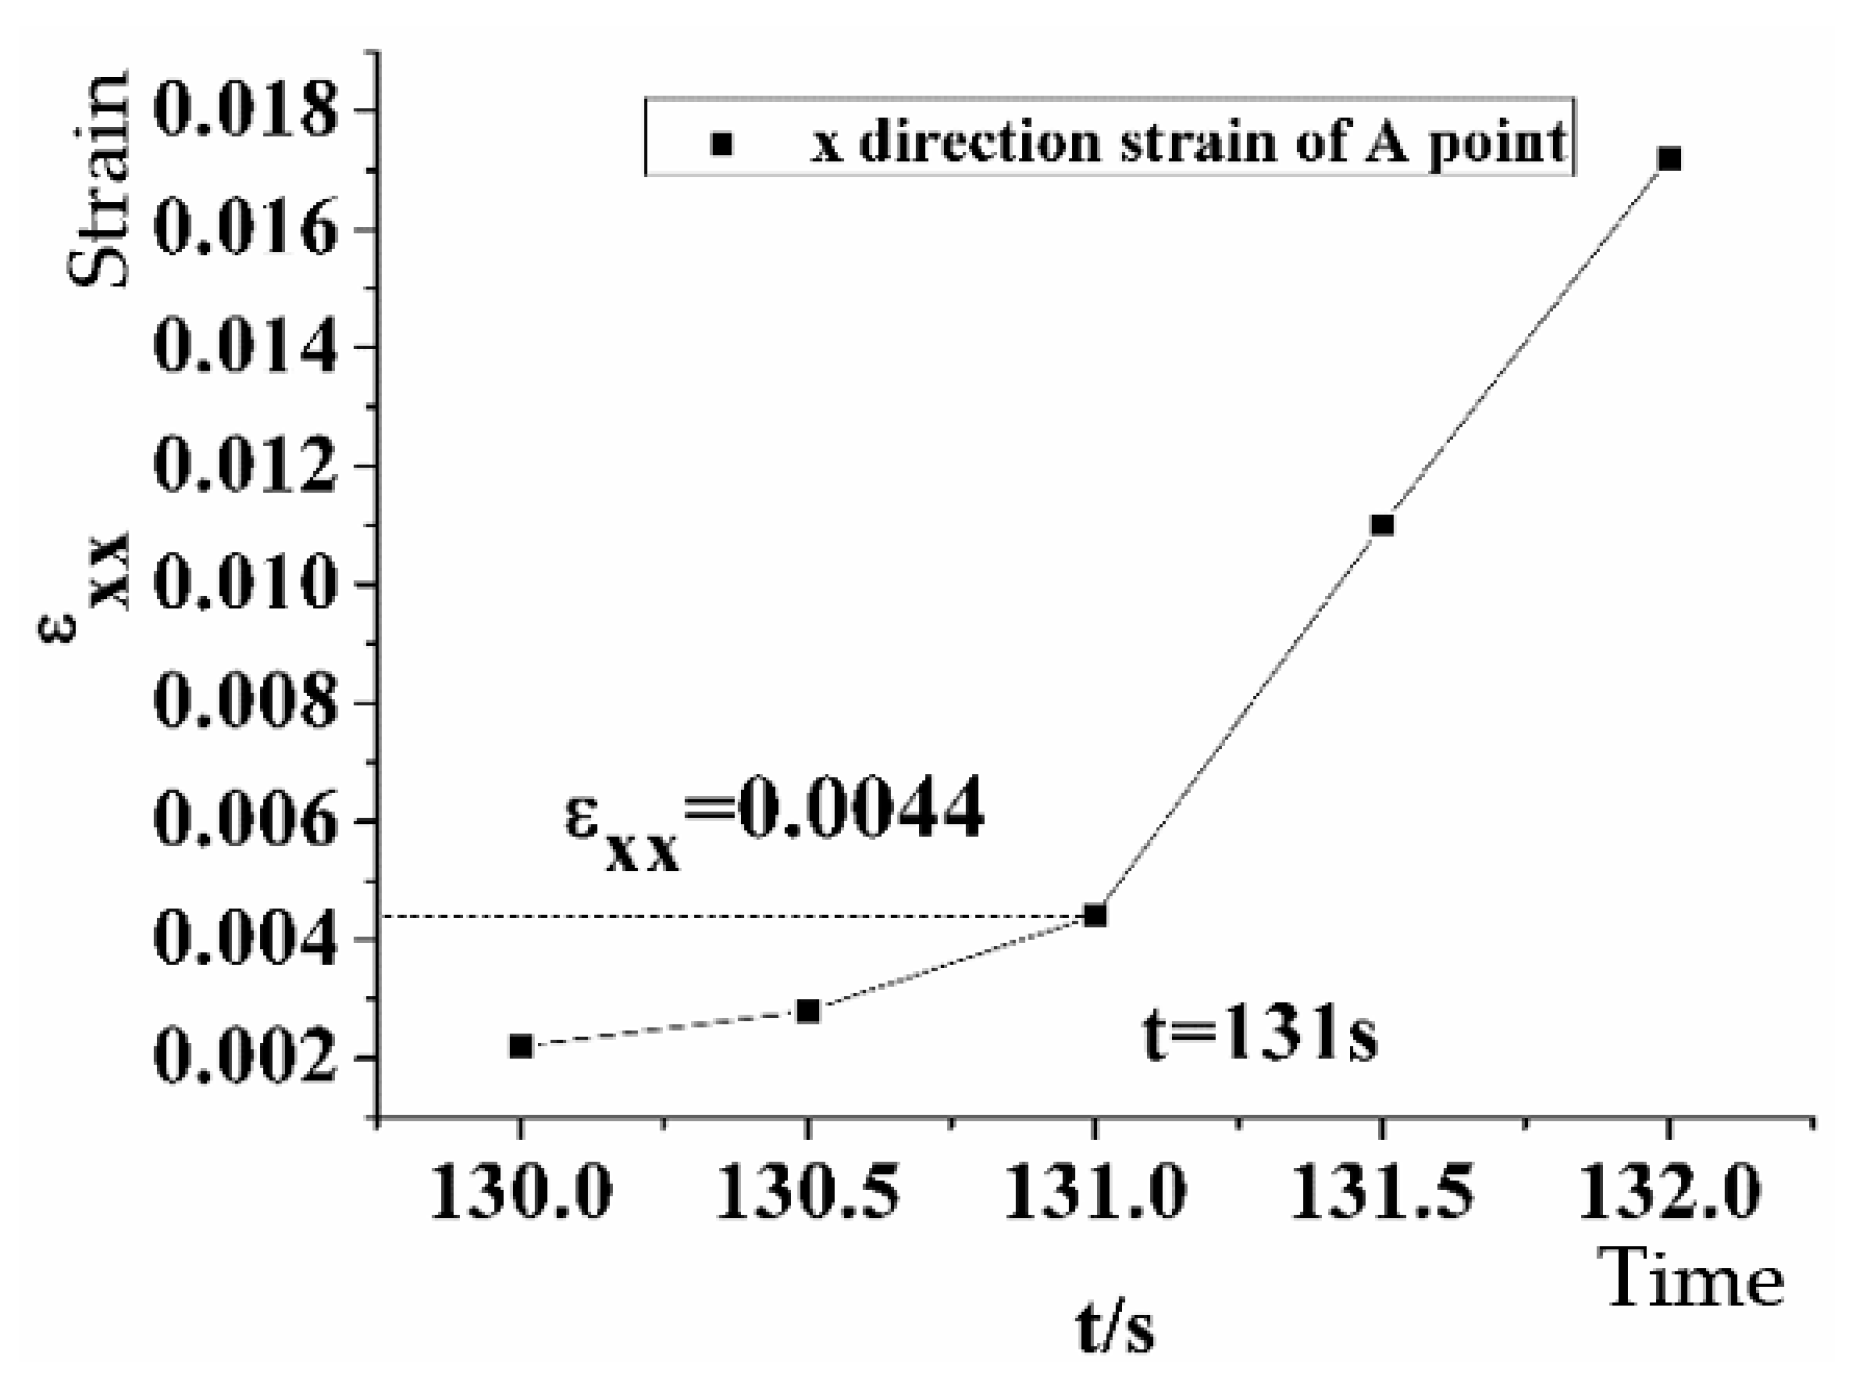
During compression, the dynamic strain change along the x-direction of sandstone is displayed in Figure 5. Figure 5a–d characterizes the compression profiles at the time points of t = 131, 139, 140.5, and 141 s, respectively. They correspond to the failure time at A, B, C, and complete failure. A slight crack can be seen from the right upper side of Figure 5a and the strain value at the crack is relatively large. The strain value at point A reaches a failure threshold value of 0.0044, so failure occurs at point A. The occurrence of failure at point A can be clearly seen from Figure 5a. At this time (the initial stage of compression), point B has not reached the failure value, so failure does not occur, but as compression continues, the strain value at point B begins to increase slowly. When it reaches t = 139 s, the crack suddenly turns much larger with a clear indication of failure. The strain value grows rapidly, and failure occurs suddenly at point B, as shown in Figure 5b. Point C does not show any failure during the initial and middle stages of compression, with the corresponding strain value always fluctuating within a reasonable range. Nevertheless, during the later stage of compression, as shown in Figure 5c, the preceding failure trace further expands. A new curved failure segment with greater failure strain values appears at the upper left. Point C is right on this segment, and then failure occurs at point C. Compression continues to t = 141 s at which the whole sandstone test-piece fails, as shown in Figure 5d.
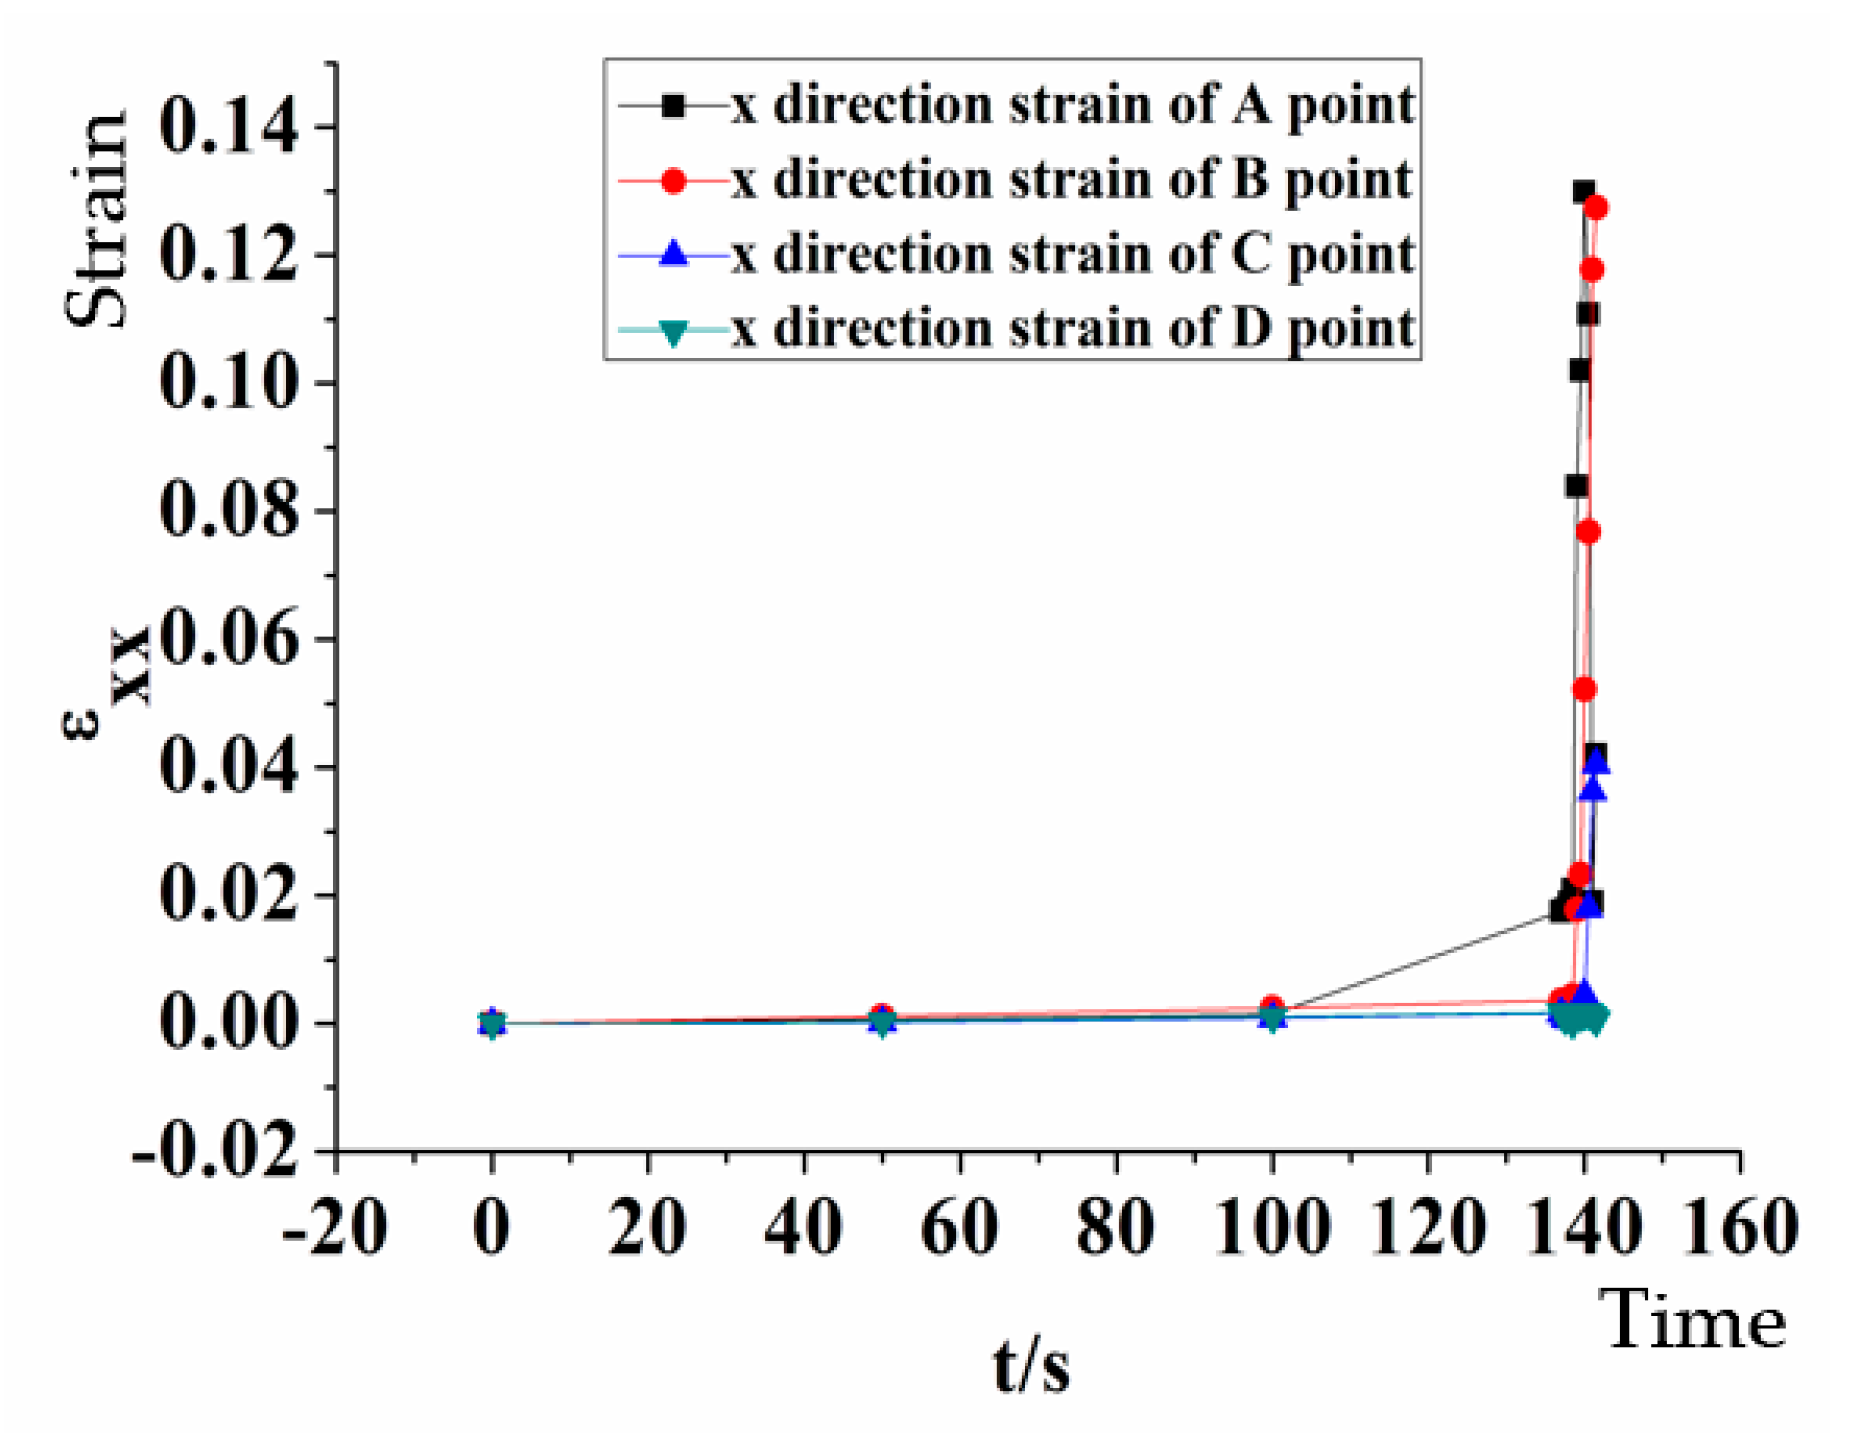
Figure 6 shows the full profiles of strain dynamics at the points A, B, C, and D during the whole compression process, which is in accordance with the phenomenon seen from Figure 5. As seen from Figure 6, the process of sandstone failure is almost instantaneous without a substantial transition course, and therefore, it is a challenge to find the specific features of the failure process, not to mention the accurate prediction of the failure of sandstone. To understand the failure process of sandstone more delicately, this paper conducts more detailed investigations on different individual points to examine and visualize the corresponding failure processes. As mentioned before, these individual points were chosen from the four regions of the full-field in terms of the time sequence of failure occurrence. More clearly, four typical points were selected based on the preliminary results shown in Figure 5. As seen from Figure 5, points A, B, and C indicate the tip locations of the first three failure regions of the tested specimen at the three moments of image collection (t = 131, 139, and 140.5 s). Strain dynamics were analyzed in detail at these three points to identify the failure pattern of the rock specimen. Point D represents a typical location that does not reach failure during the whole failure process. This point was intentionally selected to be compared with the other three points to demonstrate strain pattern differences. These four points expect to represent the corresponding regions and moments of specimen failure.
In general, for elastic materials, during the early period of failure, the strain–time curve shows linearity or near-linearity, with its slope usually low. Once the change in strain value appears nonlinear or shows an exponential growth with time, the material is most likely to be or has already been destructed. In this study, failure at point A occurs at about t = 131 s. From Figure 7, we can see that before t = 131 s, the strain value changes slightly, and shows a near-linear rise. Between t = 131 s and t = 131.5 s, the strain value undergoes a big change from 0.0044 to 0.011. It is then deduced that the strain value of failure is between 0.0044 and 0.011.
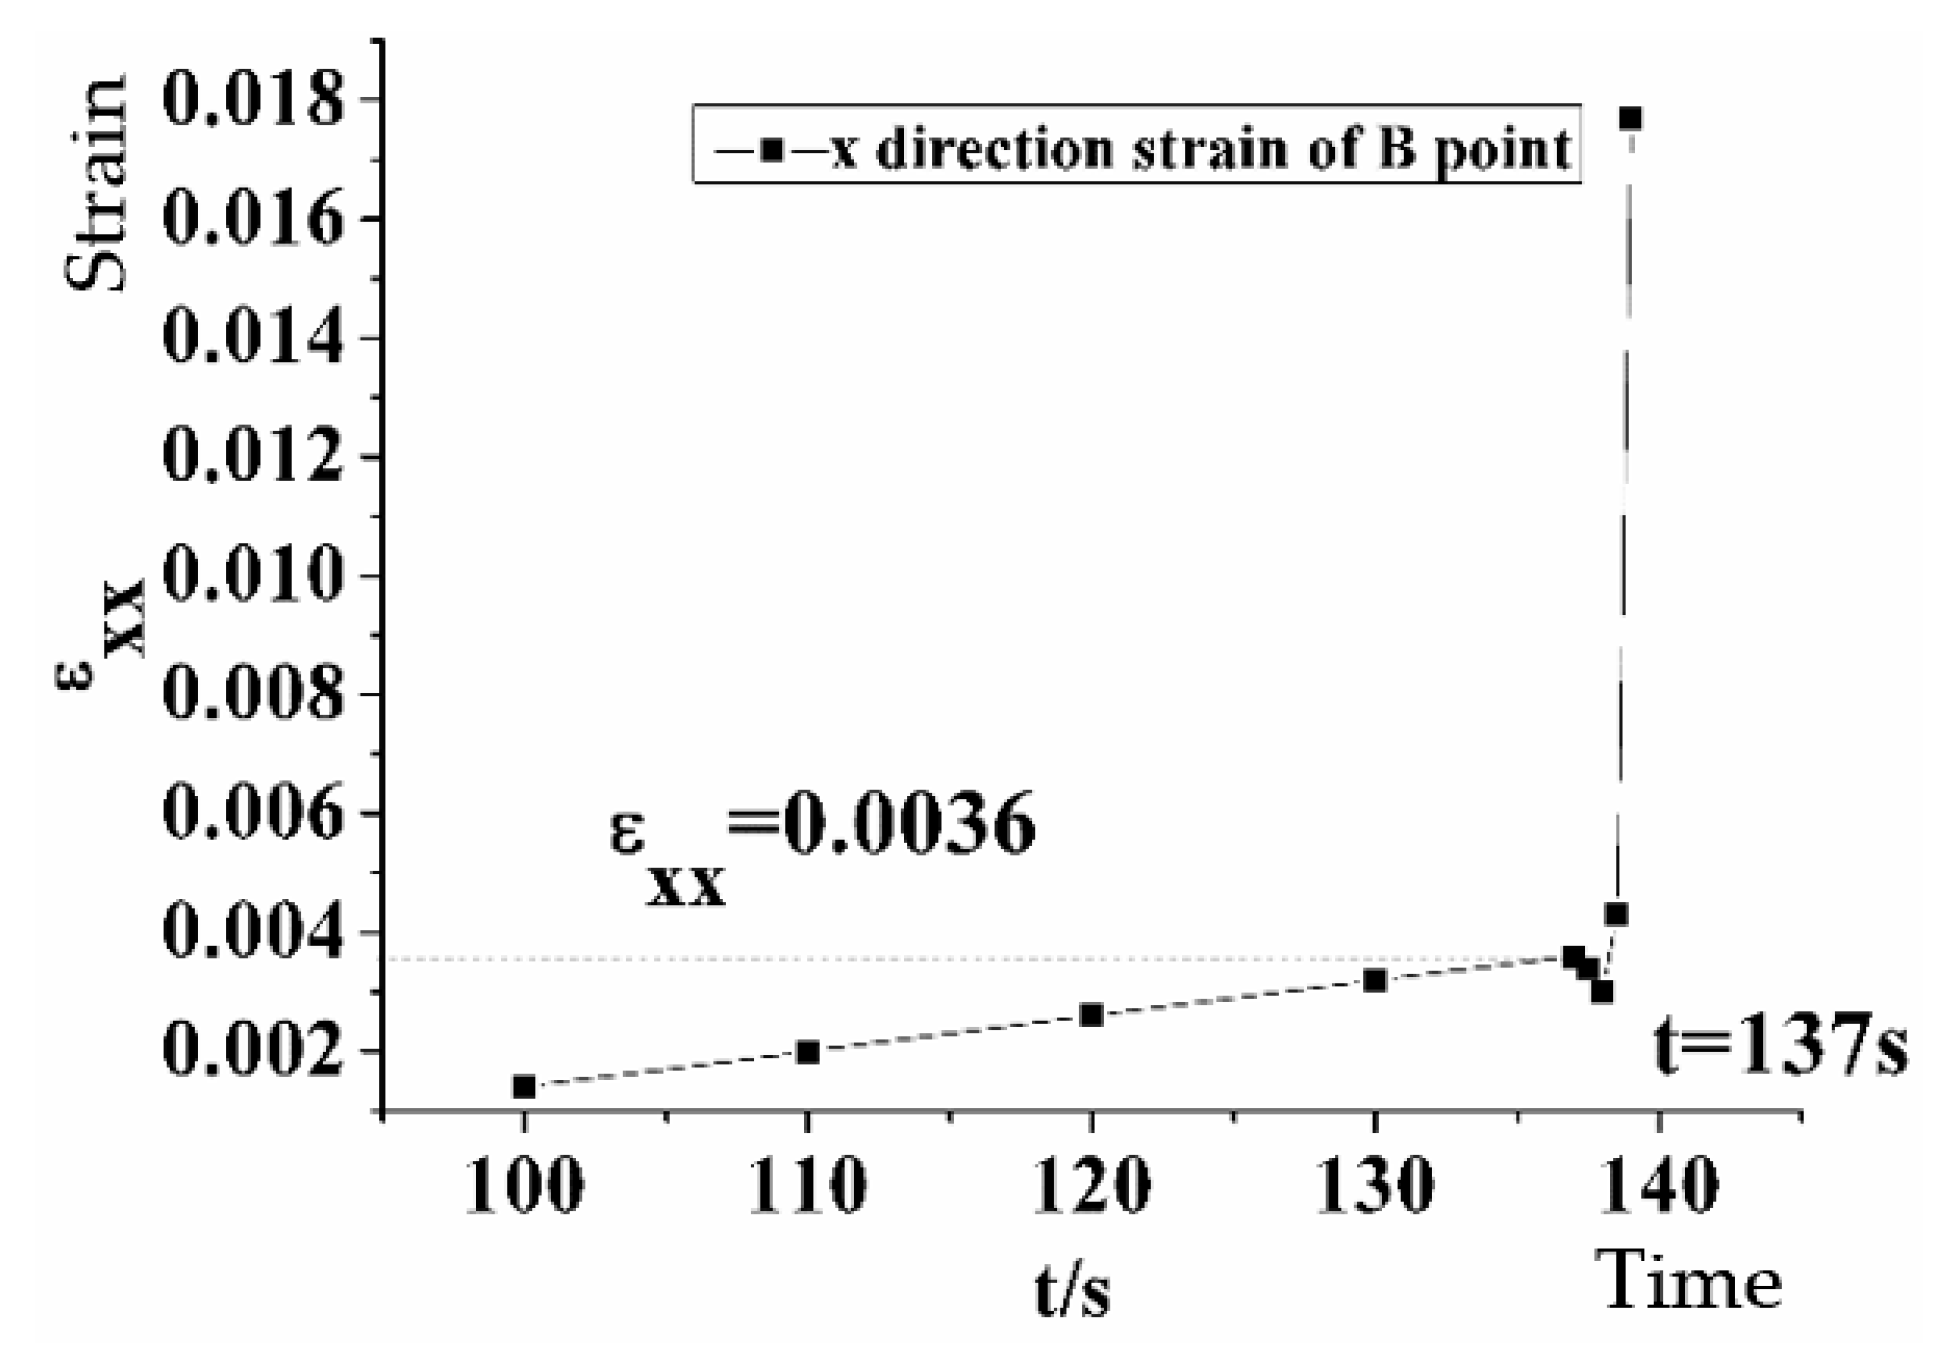
It can be seen from Figure 8 that the strain value at point B before t = 137 s generally increases linearly. The strain value is 0.0036 at t = 137 s when strain begins to show nonlinear change and eventually reaches its strain limit. At t = 140 s, the strain value suddenly increases to 0.0177. Within this period, strain value change is dramatic and instantaneous. The strain value of failure is then expected to be between 0.0036 and 0.0177.
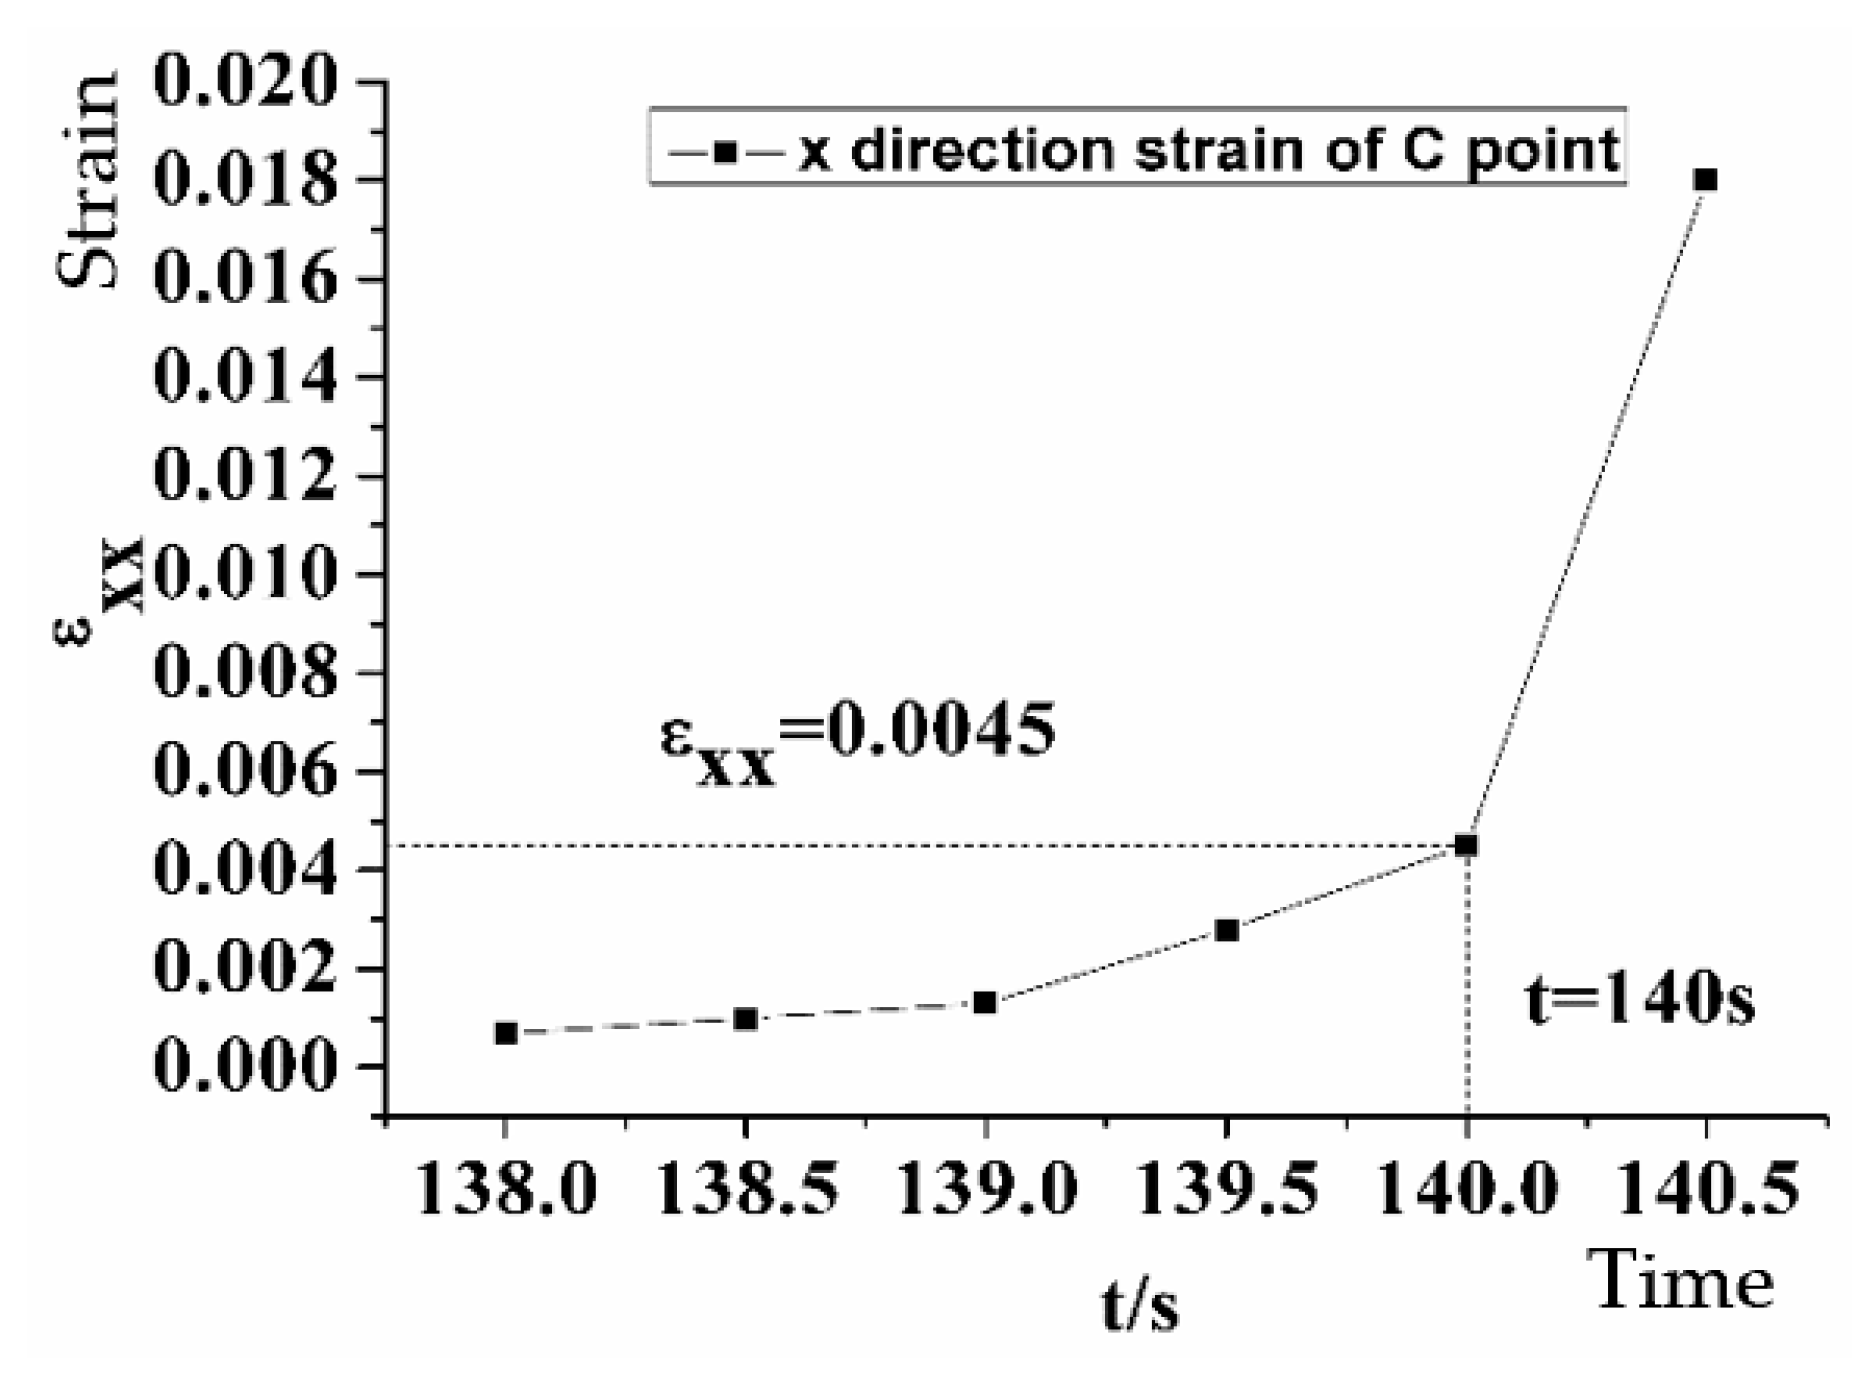
As is shown in Figure 9, the strain value before t = 140 s changes very slightly and almost linearly for point C. At t = 140 s, it is 0.0045, while at t = 140.5 s, it is 0.018. During this period of time, similar to those at points A and B, the strain value changes significantly. The strain value of failure is expected to be between 0.0045 and 0.018.
From the above, points A, B, and C fail one after another during the loading process. Through the detailed study on the failure processes at each point, the range of the strain values at failure related to points A, B, and C can be revealed. It can be concluded that the strain value of failure for sandstone is approximately between 0.004 and 0.011 when the loading speed lies at 0.1 MPa/s.

5.1.2. Results on Shear Strain and Y-Direction Strain Dynamics

According to the Hill–Tsai criterion [27], the tensile failure strain of the sandstone is about 0.0037 and the shear failure strain is about 0.011, which is three times as large as the tensile strain. The compressive strain is about 0.015–0.1, which is 5 to 50 times as large as the tensile strain.
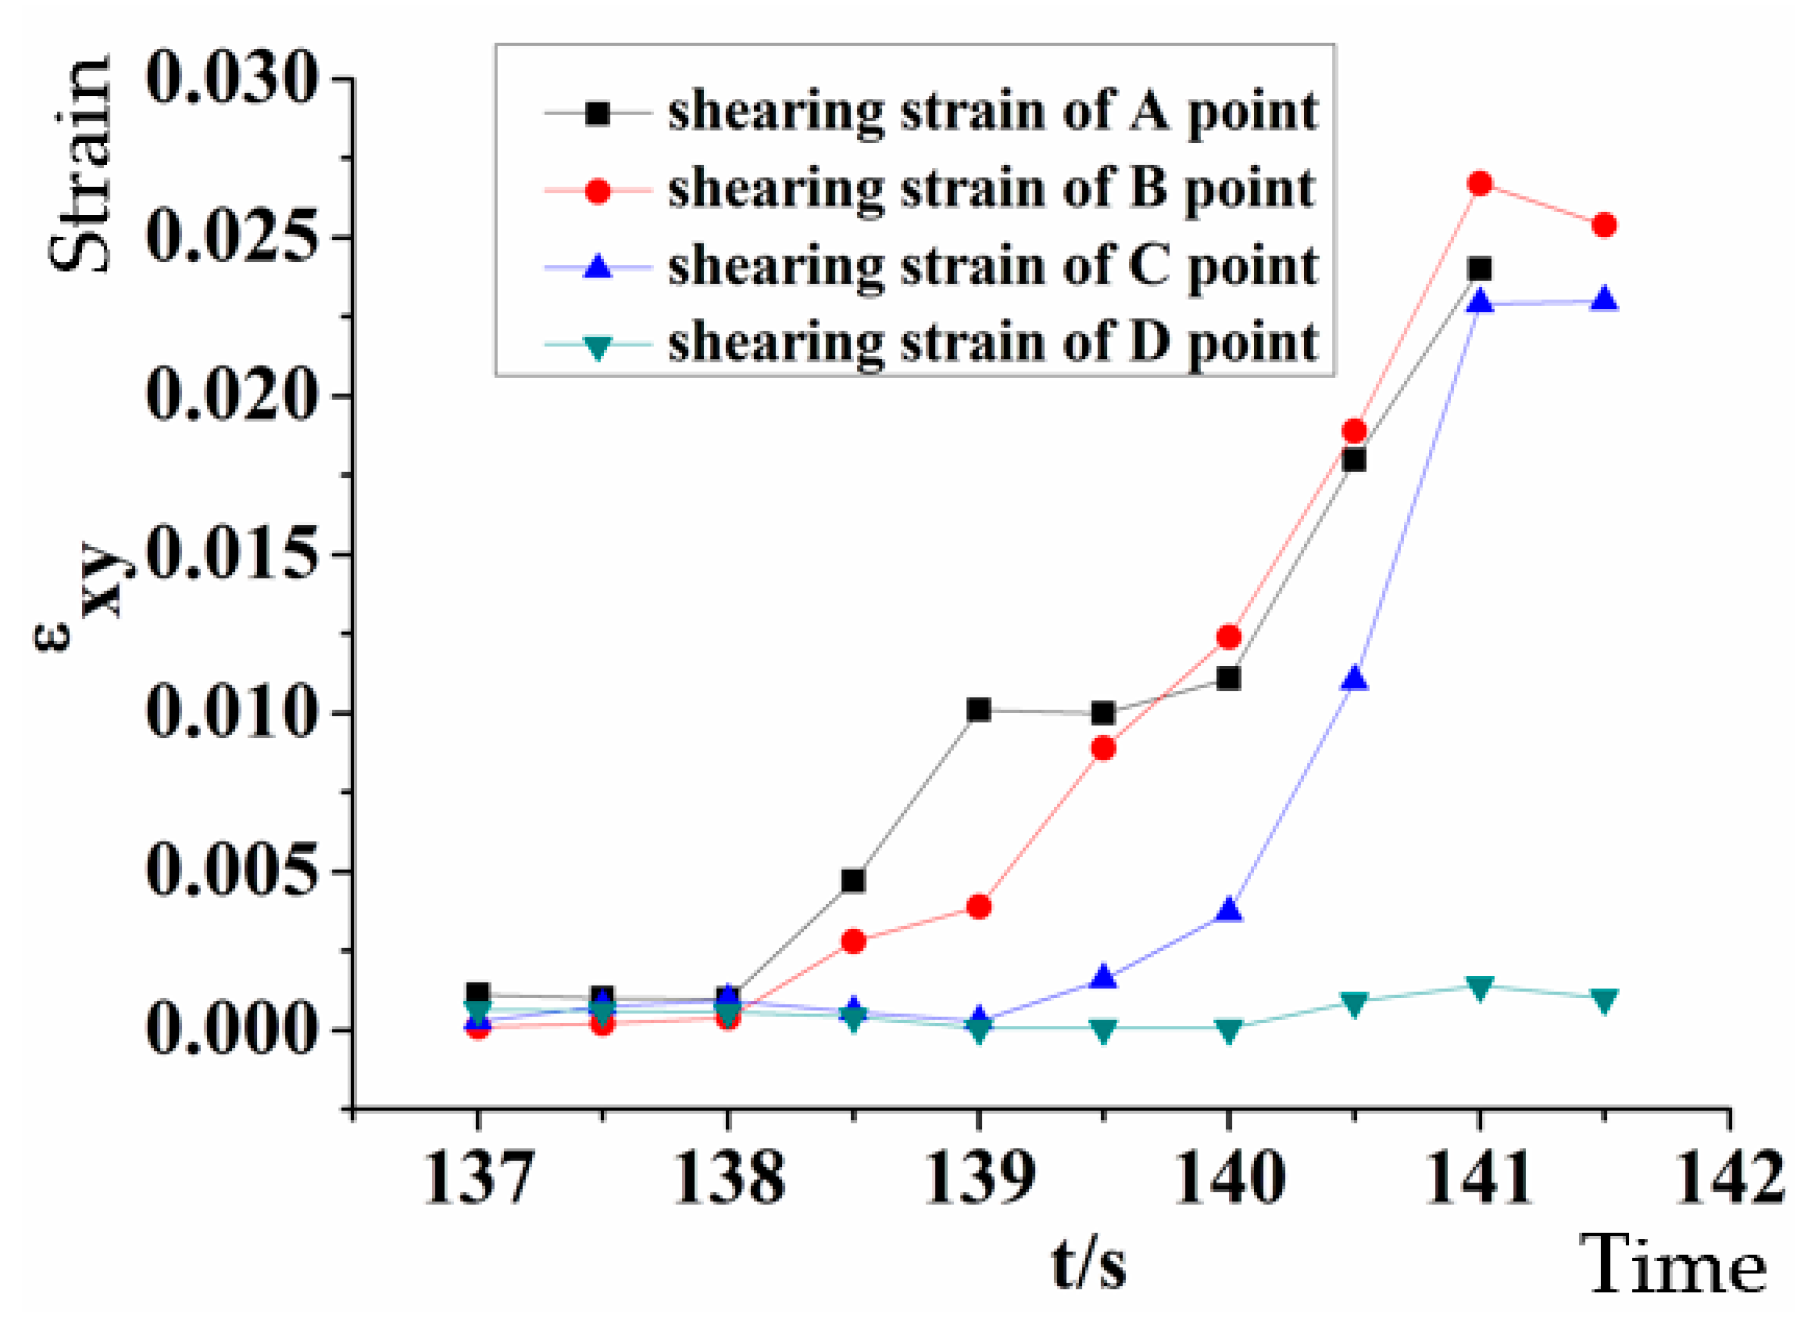
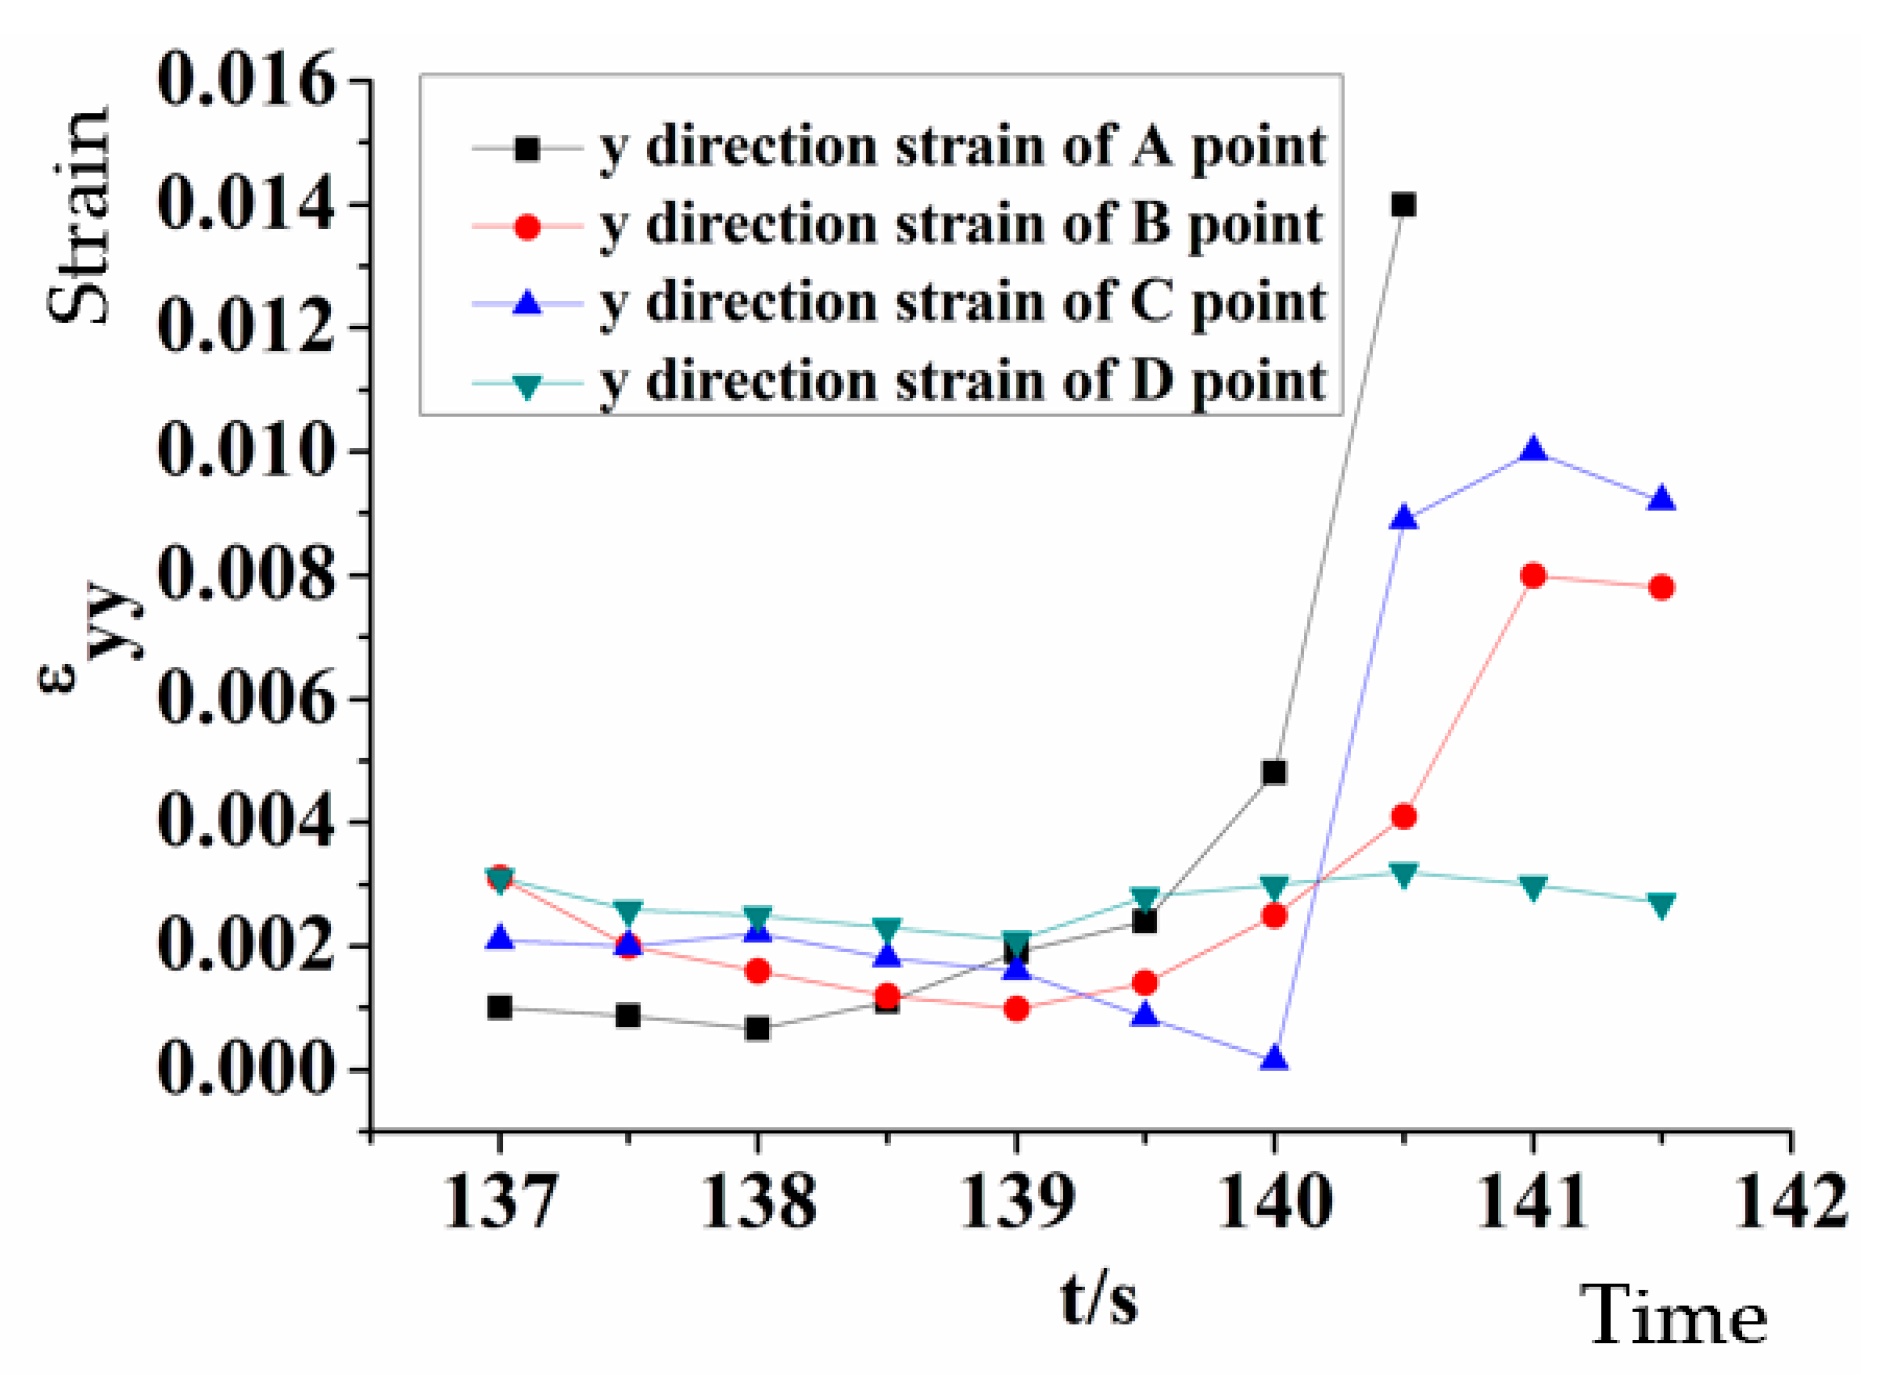
Based on Figure 6, the time of failure for point A is t = 131 s, for point B is t = 139 s, and for point C is t = 140 s. From Figure 10 and Figure 11, at points A, B, and C, the y-direction strain and shear strain do not reach the failure value at the corresponding time points under study. That is to say, the failure effects caused by the y-direction strain and shear strain are not the main factors affecting the failures at points A, B, and C.

5.2. Scenario 2: Loading Rate at 0.3 MPa/s

In order to examine the influential effects of different loading speeds on failure strain, another series of experiments with a speed of 0.3 MPa/s were carried out. To ensure an effectual investigation, in the following experiments, the test conditions were controlled to be comparable with that in Scenario 1 (where the loading rate was 0.1 MPa/s), except for loading speed difference. The sandstone test-piece had the equal dimension sizes as the one used above.

5.2.1. Results on X-Direction Strain Dynamics

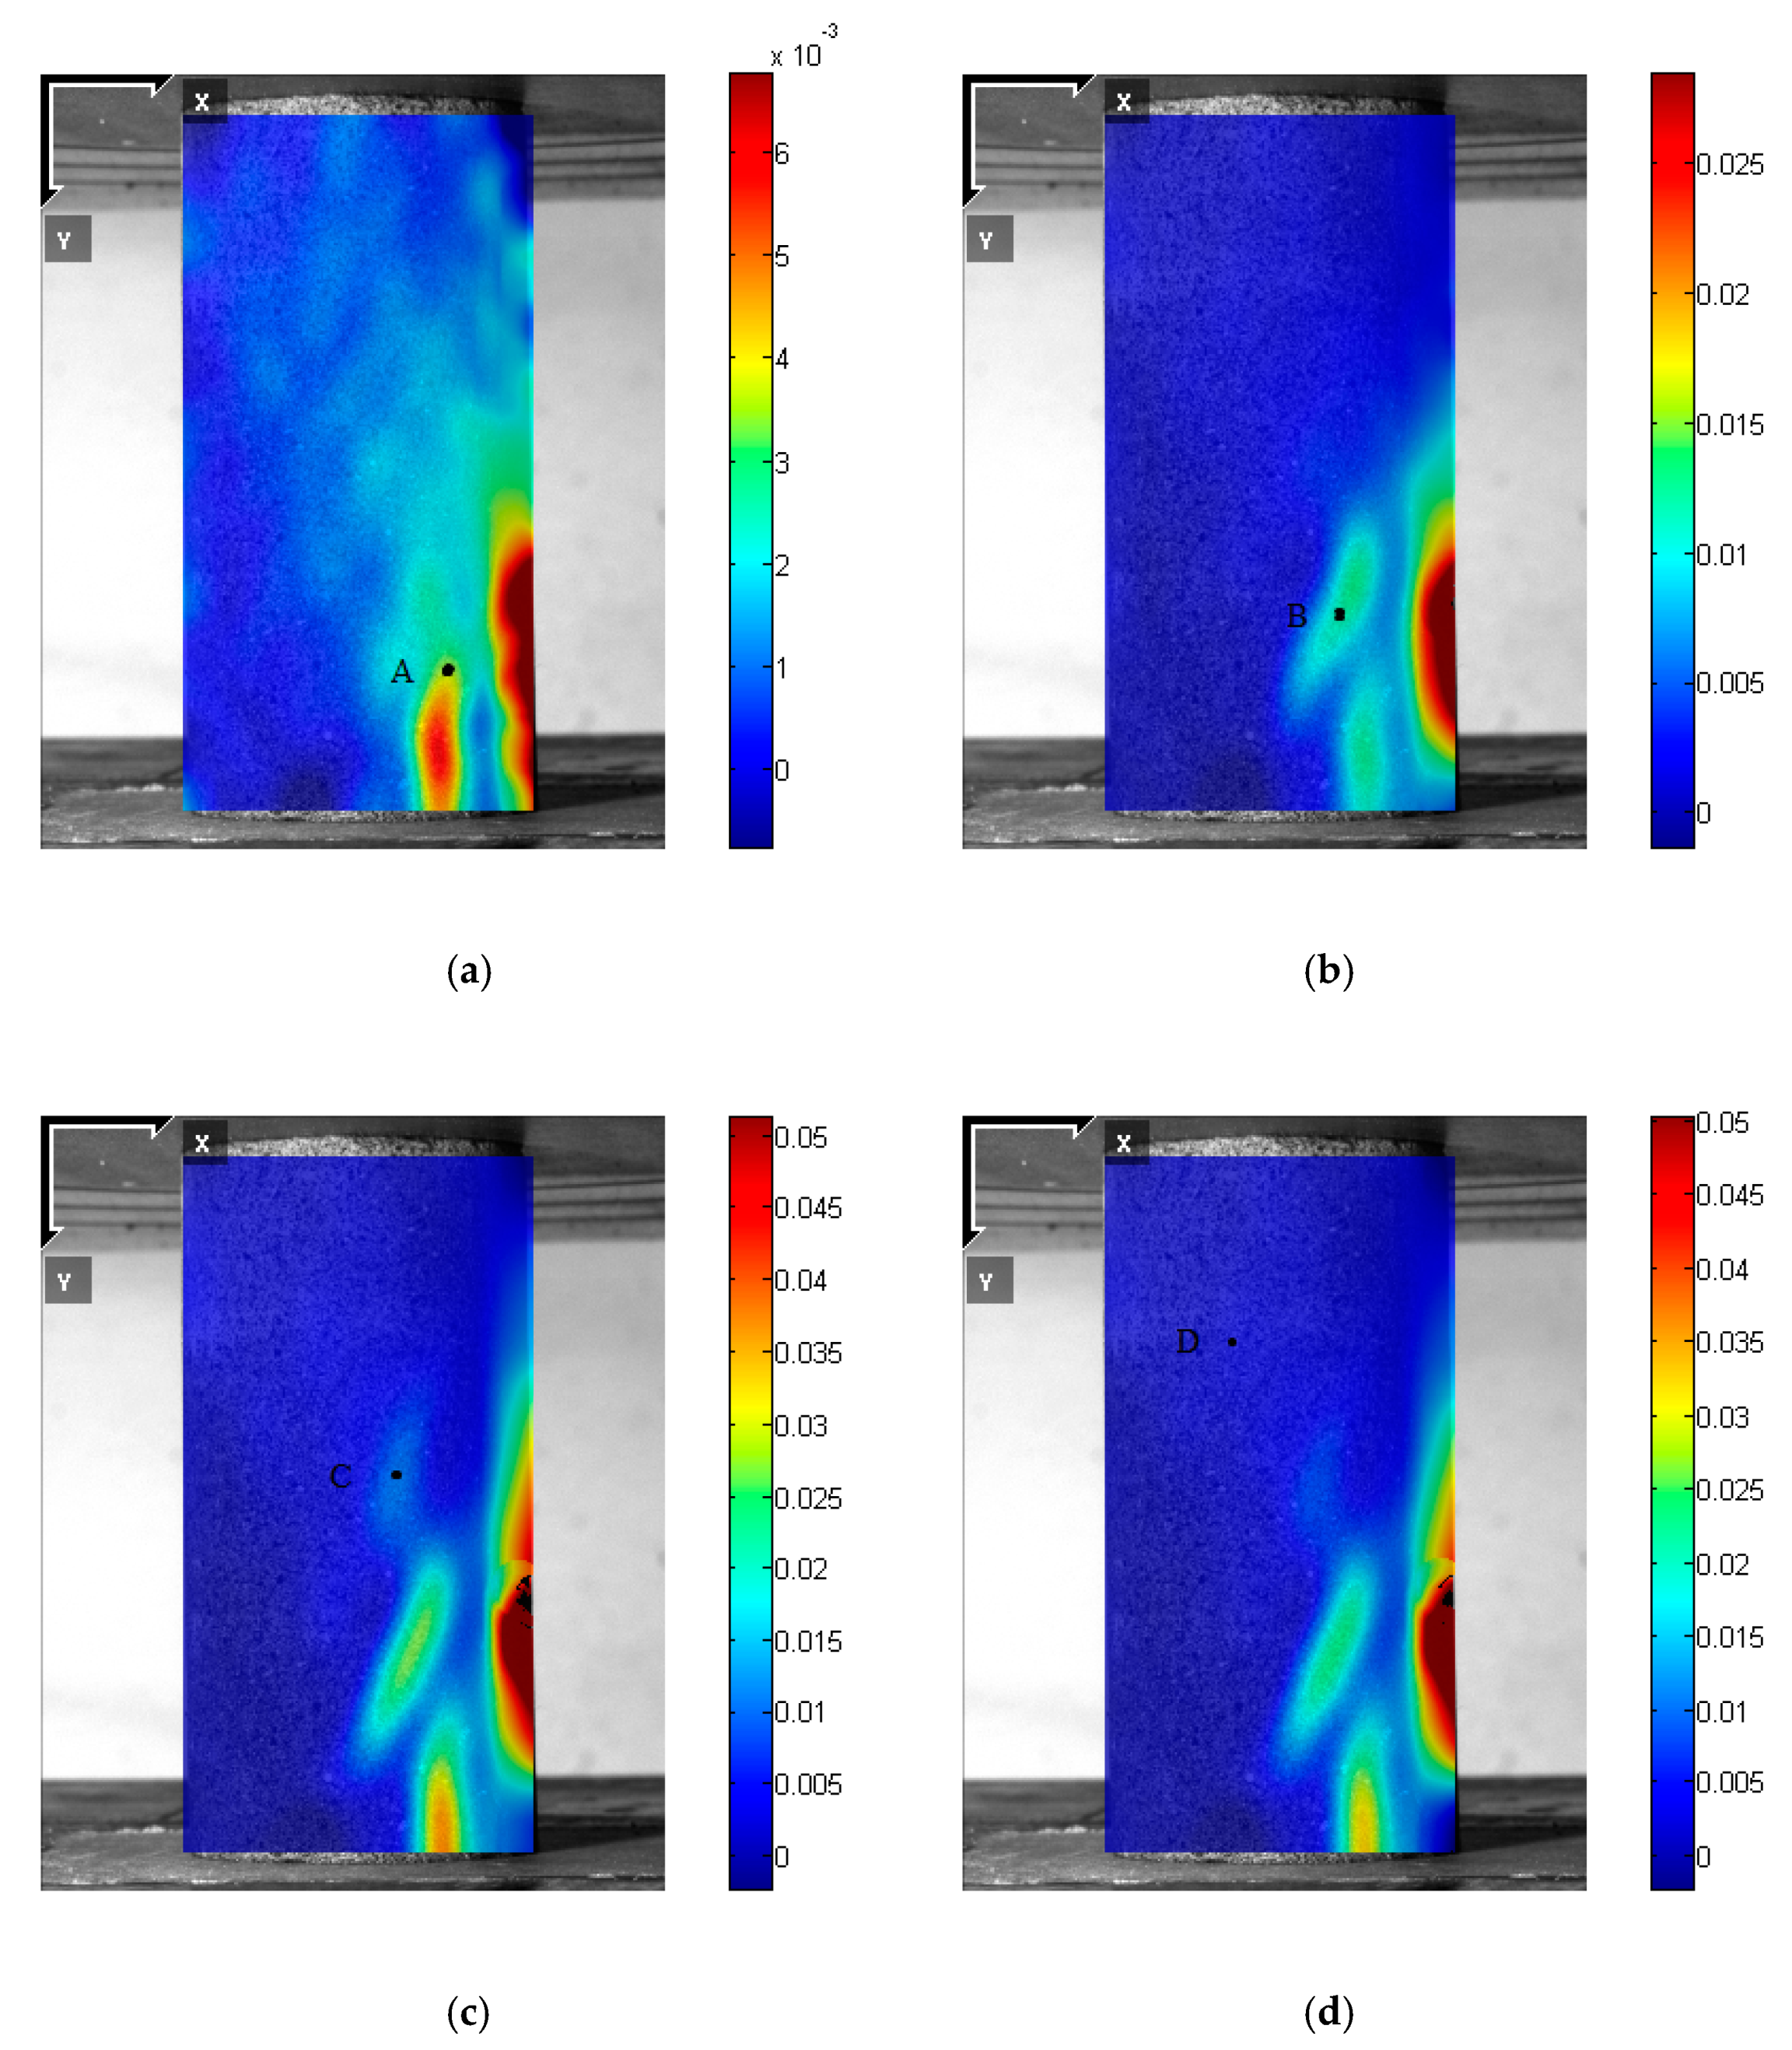
The same experiment procedure was followed. Four typical points A, B, C, and D were chosen to study the failure mode when the loading speed equals 0.3 MPa/s. Points A, B, and C represent the three point positions where failure occurs at different times, and D indicates the point location where no failure occurs during the whole loading process. Figure 12 shows the strain variations in the x direction throughout the compression process at the loading rate of 0.3 MPa/s. Figure 12a–d plots the strain profiles at t = 58, 71.5, 72.5, and 78 s, respectively, characterizing the failure time of three points of A, B, C, and the compression end event. In the early stage of the compression course, no failure occurs at any point, while local strain values slowly increase but still with linear elastic deformation. At t = 58 s, as shown in Figure 12a, the strain value at point A exceeds the linear elastic strain range extremely and failure occurs. From Figure 12a, it can be clearly seen that the strain at A point is relatively large. As the compression course proceeds further, the crack continues to expand from point A and a new crack occurs at the upper side, as shown in Figure 12b. Point B is right on the new crack, and at t = 71.5 s, the new crack turns significantly larger, and then failure occurs at point B. As shown in Figure 12b, the strain value at point B is relatively high. Quickly, in the following one second, there appears a fresh crack over the old fracture, and as shown in Figure 12c, point C, which is right on the new crack, fails at t = 72.5 s.
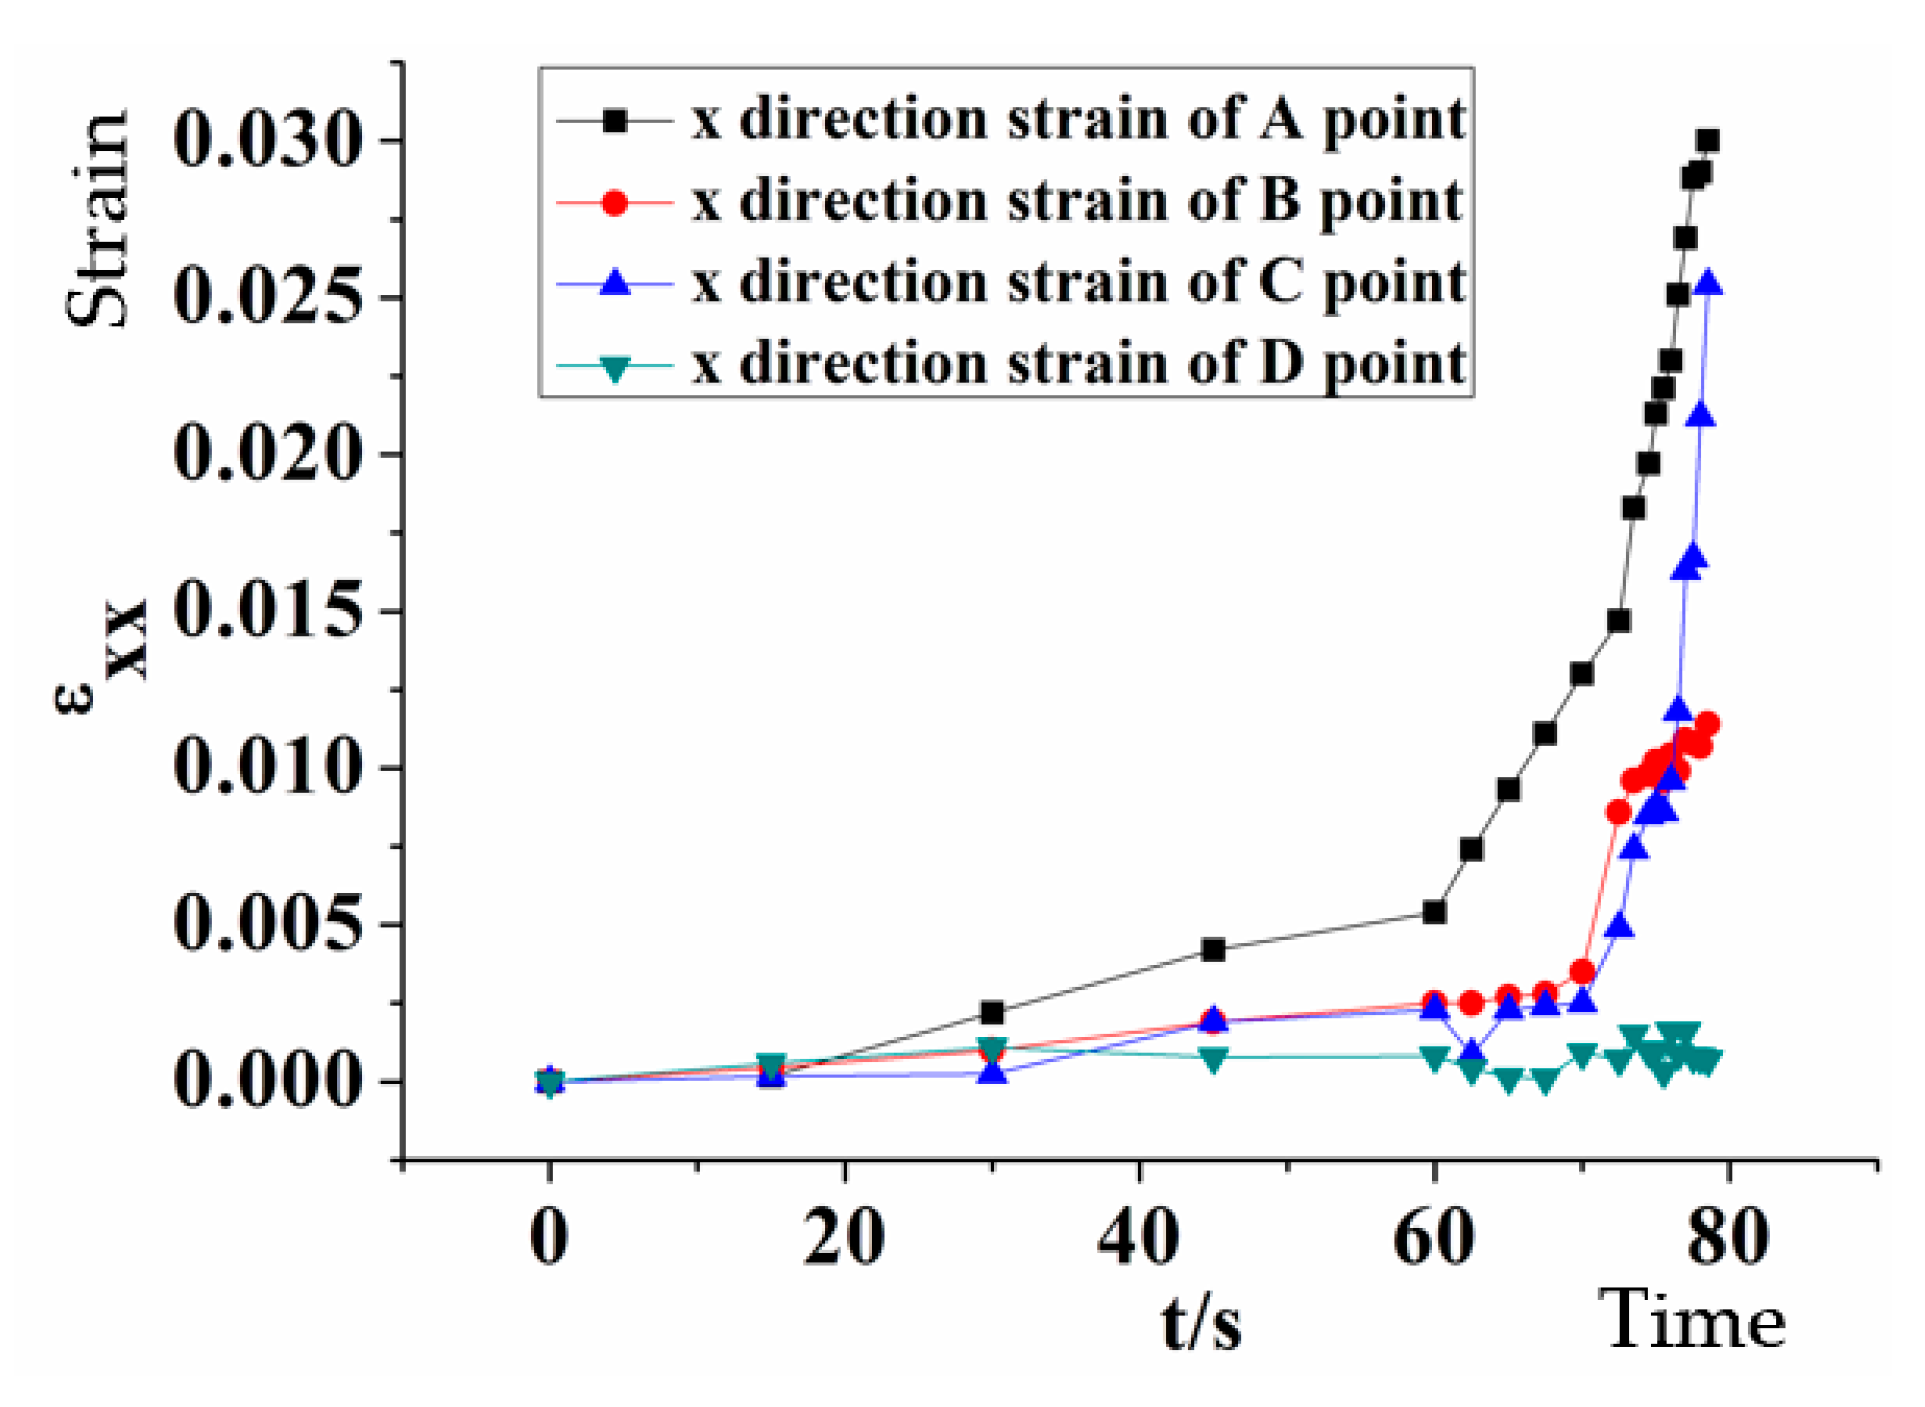
Figure 13 shows the temporal dynamics of strain at points A, B, C, and D with the loading speed of 0.3 MPa/s. It can be learned from Figure 13 that the strain values at points A, B, and C increase over time, displaying a linear or near-linear trend in the early stage. Up to this point, the specimen is undergoing elastic change and the failure does not occur. As the loading process continues, all the three points A, B, and C may be subjected to sharp strain changes where the tested specimen generally goes beyond its elastic range and eventually fails. In order to further uncover the detailed information of failure processes at individual points, individualized deeper analyses were executed to each single point.
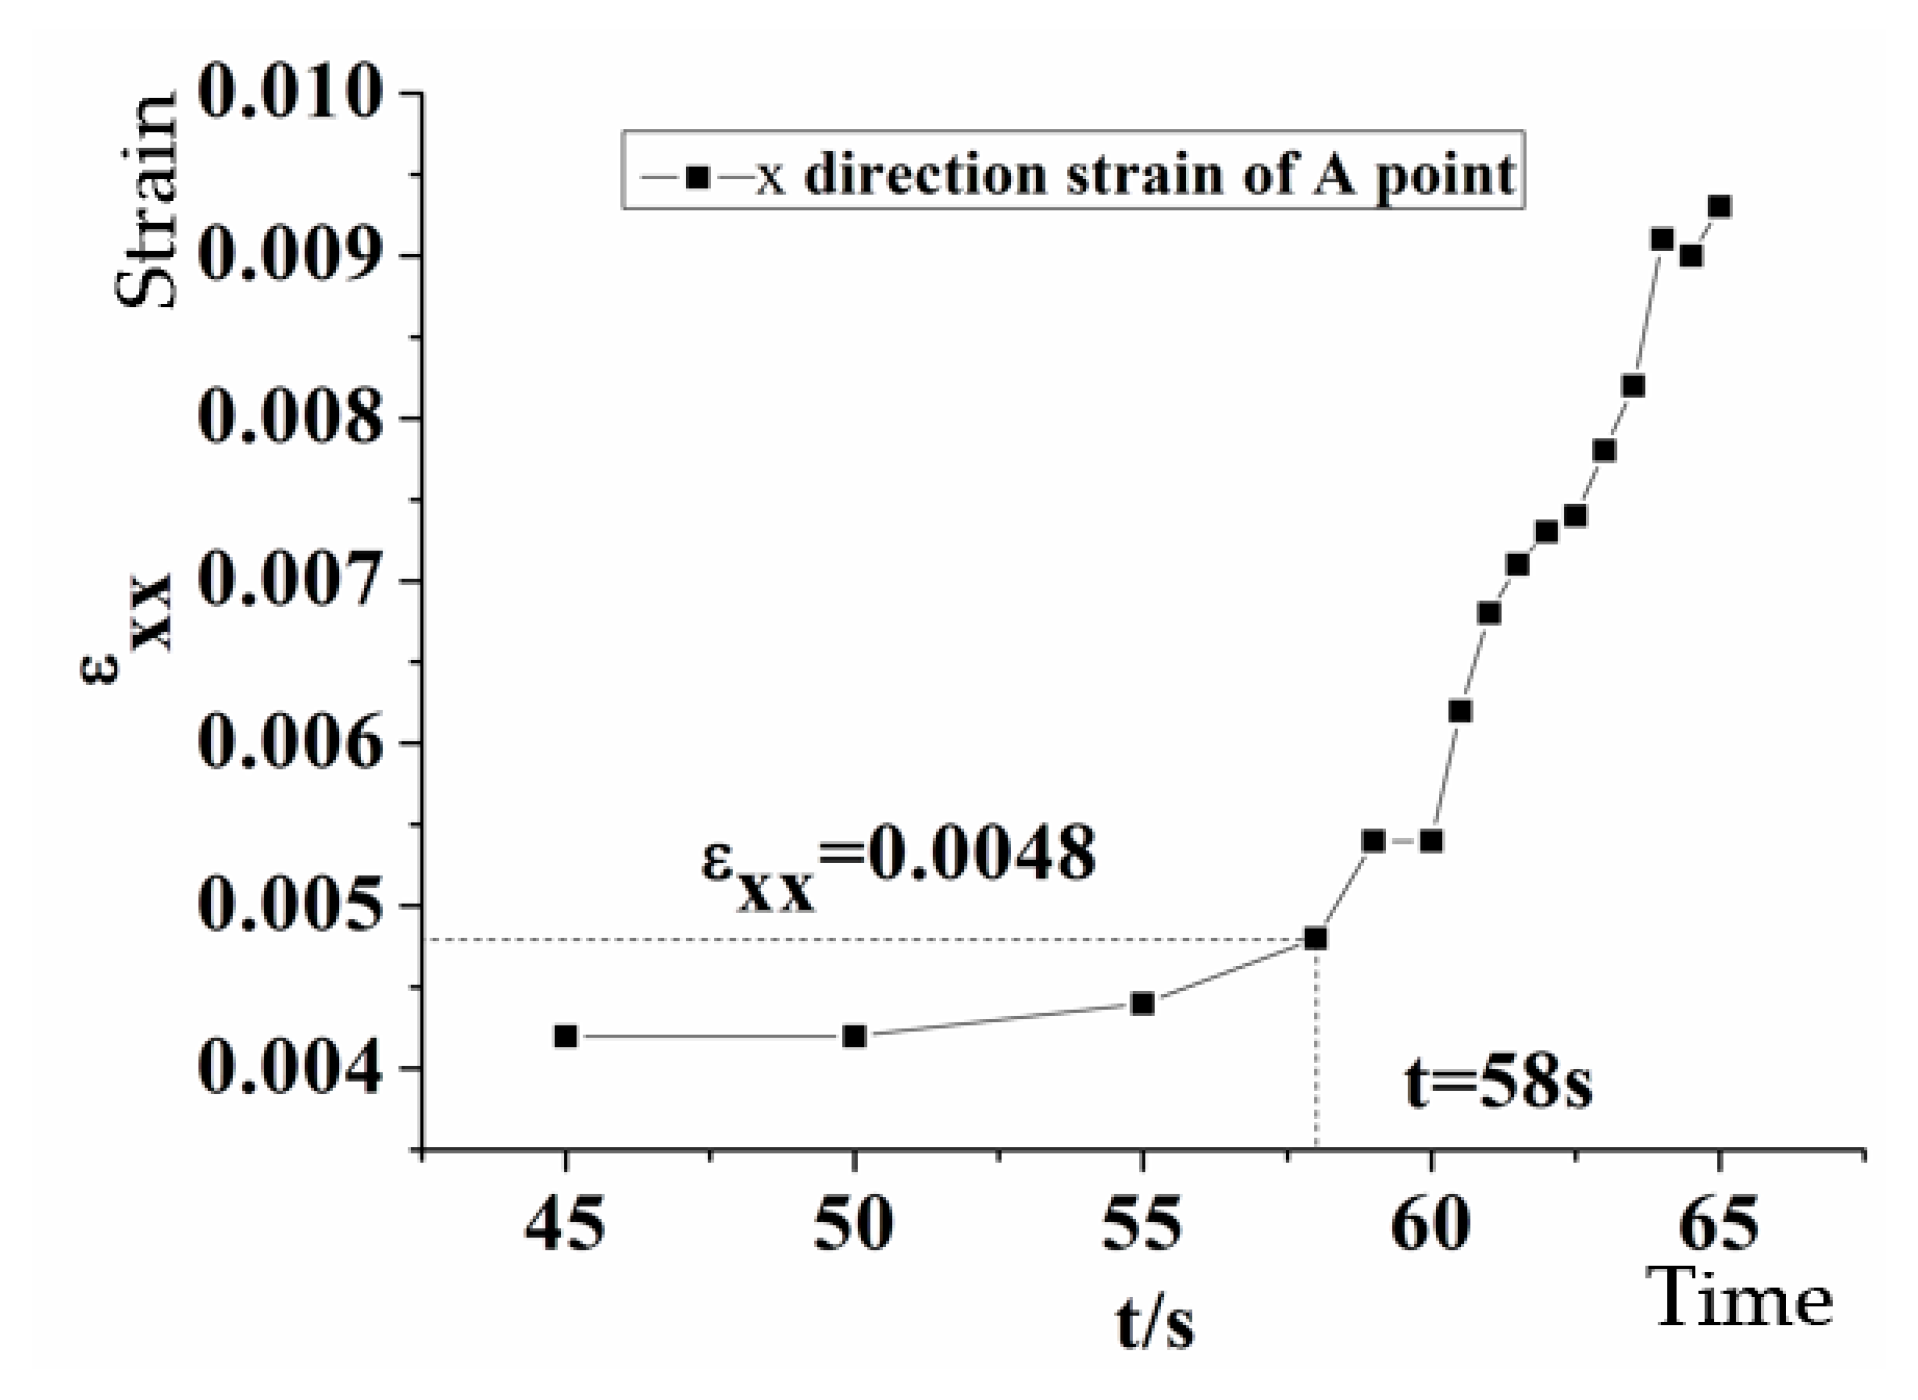
In Figure 14, before t = 58 s, the variation of strain values at point A is relatively even and in a linear pattern relative to the time dimension without presenting sharp turns. However, starting from t = 58 s, the strain values change nonlinearly, and the strain values increase sharply after t = 60 s. A strain limit may present at t = 58 s. As a result, it can be inferred that the failure strain value for the sandstone sample may lie between 0.0048–0.0093.
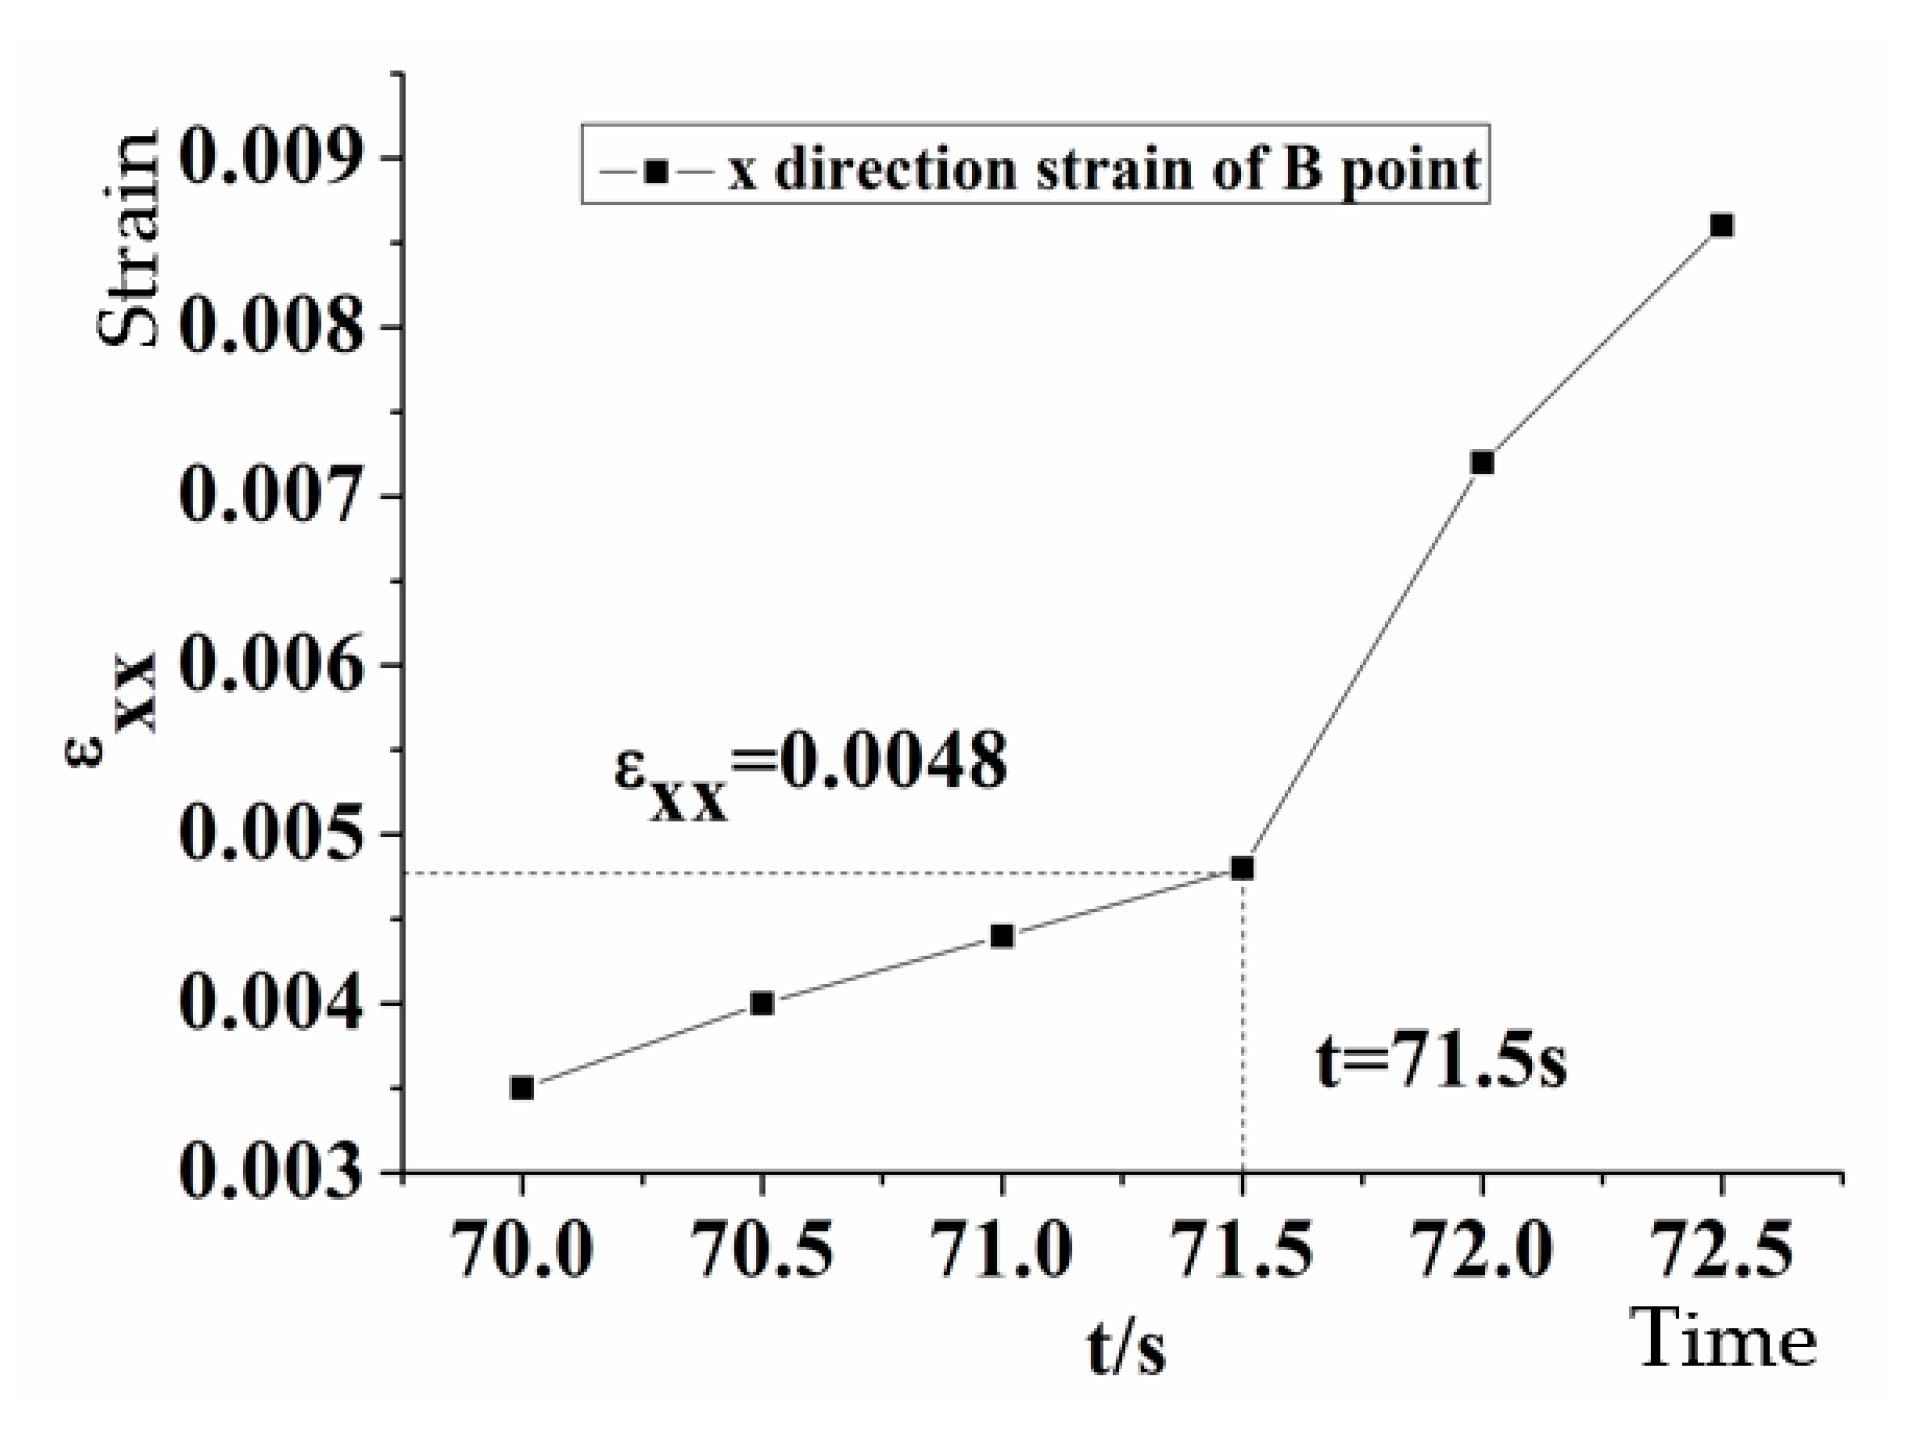
As seen from Figure 15, before t = 71.5 s, the strain values of point B vary little and display a near-linear elastic mode. At t = 71.5 s, the strain value of point B is 0.0048, while at t = 72 s, it reaches 0.0086. During this period, the strain values increase more dramatically than before; it is then determined that the failure strain value at B point lies within the range 0.0048–0.0086.
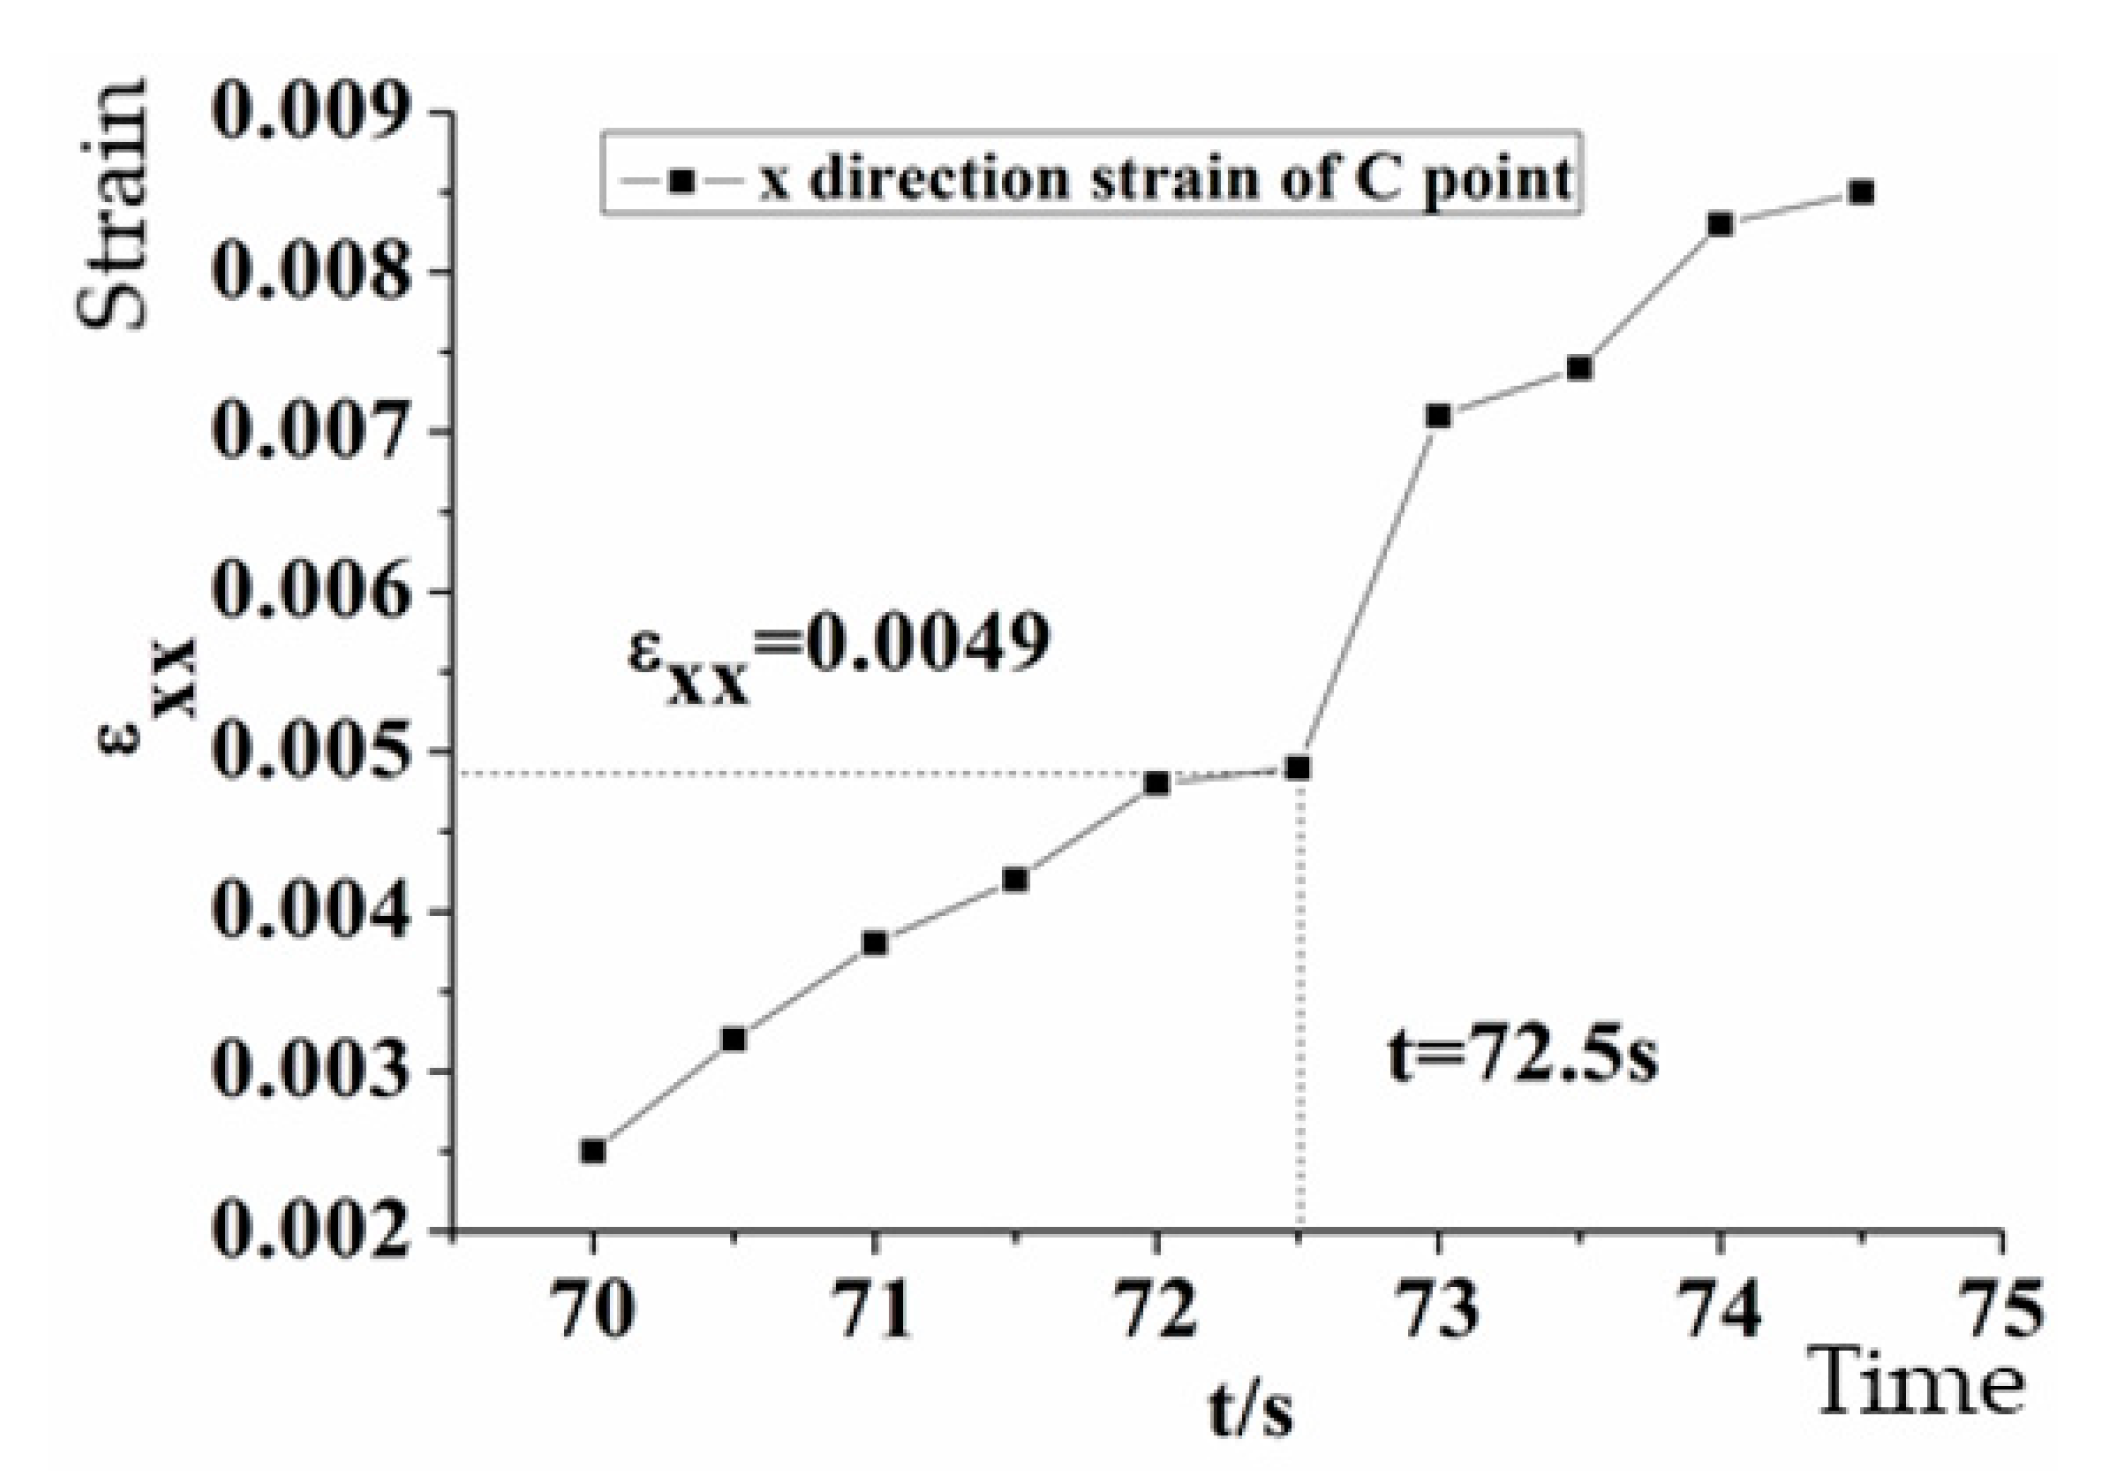
From Figure 16, before t = 72.5 s, the strain values of point C vary slightly, showing a near-linear elastic mode. From t = 72.5 s to t = 73 s, the strain values rise significantly, and it is likely that the failure begins at this point. The failure strain at point C is estimated to be within the range 0.0049–0.0071.
The failure occurs successively at points A, B, and C during the loading process. Through the detailed analyses on the failure process of every point, the strain ranges of failure at point A, B, and C were derived. Basically, it can be inferred that, when the loading speed is at 0.3 MPa/s, the failure strain value of sandstone is roughly estimated to be between 0.0048 and 0.093 versus the projection between 0.004 and 0.011 at the loading speed of 0.1 MPa/s (as shown above). It can be seen that little disparity exists between these estimated strain values, which may indicate that the magnitude of the failure strain value of sandstone will not be largely affected when loading speed is changed from 0.1 MPa/s to 0.3 MPa/s (which are at low loading rates).

5.2.2. Results on Shear Strain and Y-Direction Strain Dynamics

Through detailed calculation, it is found that, when the loading speed was at 0.3 MPa/s, the strain values in the shear direction and y-direction were not the main factors affecting sandstone’s failure phenomenon, as was found in Scenario 1, where the loading rate was at 0.1 MPa/s.

5.3. Contrasting Physical Experiment Results against Finite Element Analysis Outcomes

In order to test the accuracy of the experiment results, a finite element simulation was carried out on the sandstone specimen using the common FEM software Abaqus for the cross-check process. Damage evolution was not considered in the simulation considering the fragility of sandstone materials and the short periods of experiments. The main purpose of the cross-check process was to verify the reliability of strain patterns obtained from DIC by qualitatively examining the consistency between the corresponding strain patterns and trends received from the two methods: DIC analysis and Abaqus simulation.

5.3.1. Model Development

Previous studies showed that sandstone materials involved in the compression experiment share common mechanical properties and constitutive relations with autoclaved aerated concrete (AAC) [28]. Thus, an eight nodded linear brick (C3D8R) element was adopted in this study for the numerical simulation on the sandstone specimen [29]. As seen from the above, sandstone failure occurs at the last moment of the compression process, and before failure, the related deformation shows elastic characteristics. Therefore, only the elastic model was used in the finite element simulation based on Abaqus.

5.3.2. Constraint Definition and Loading Method

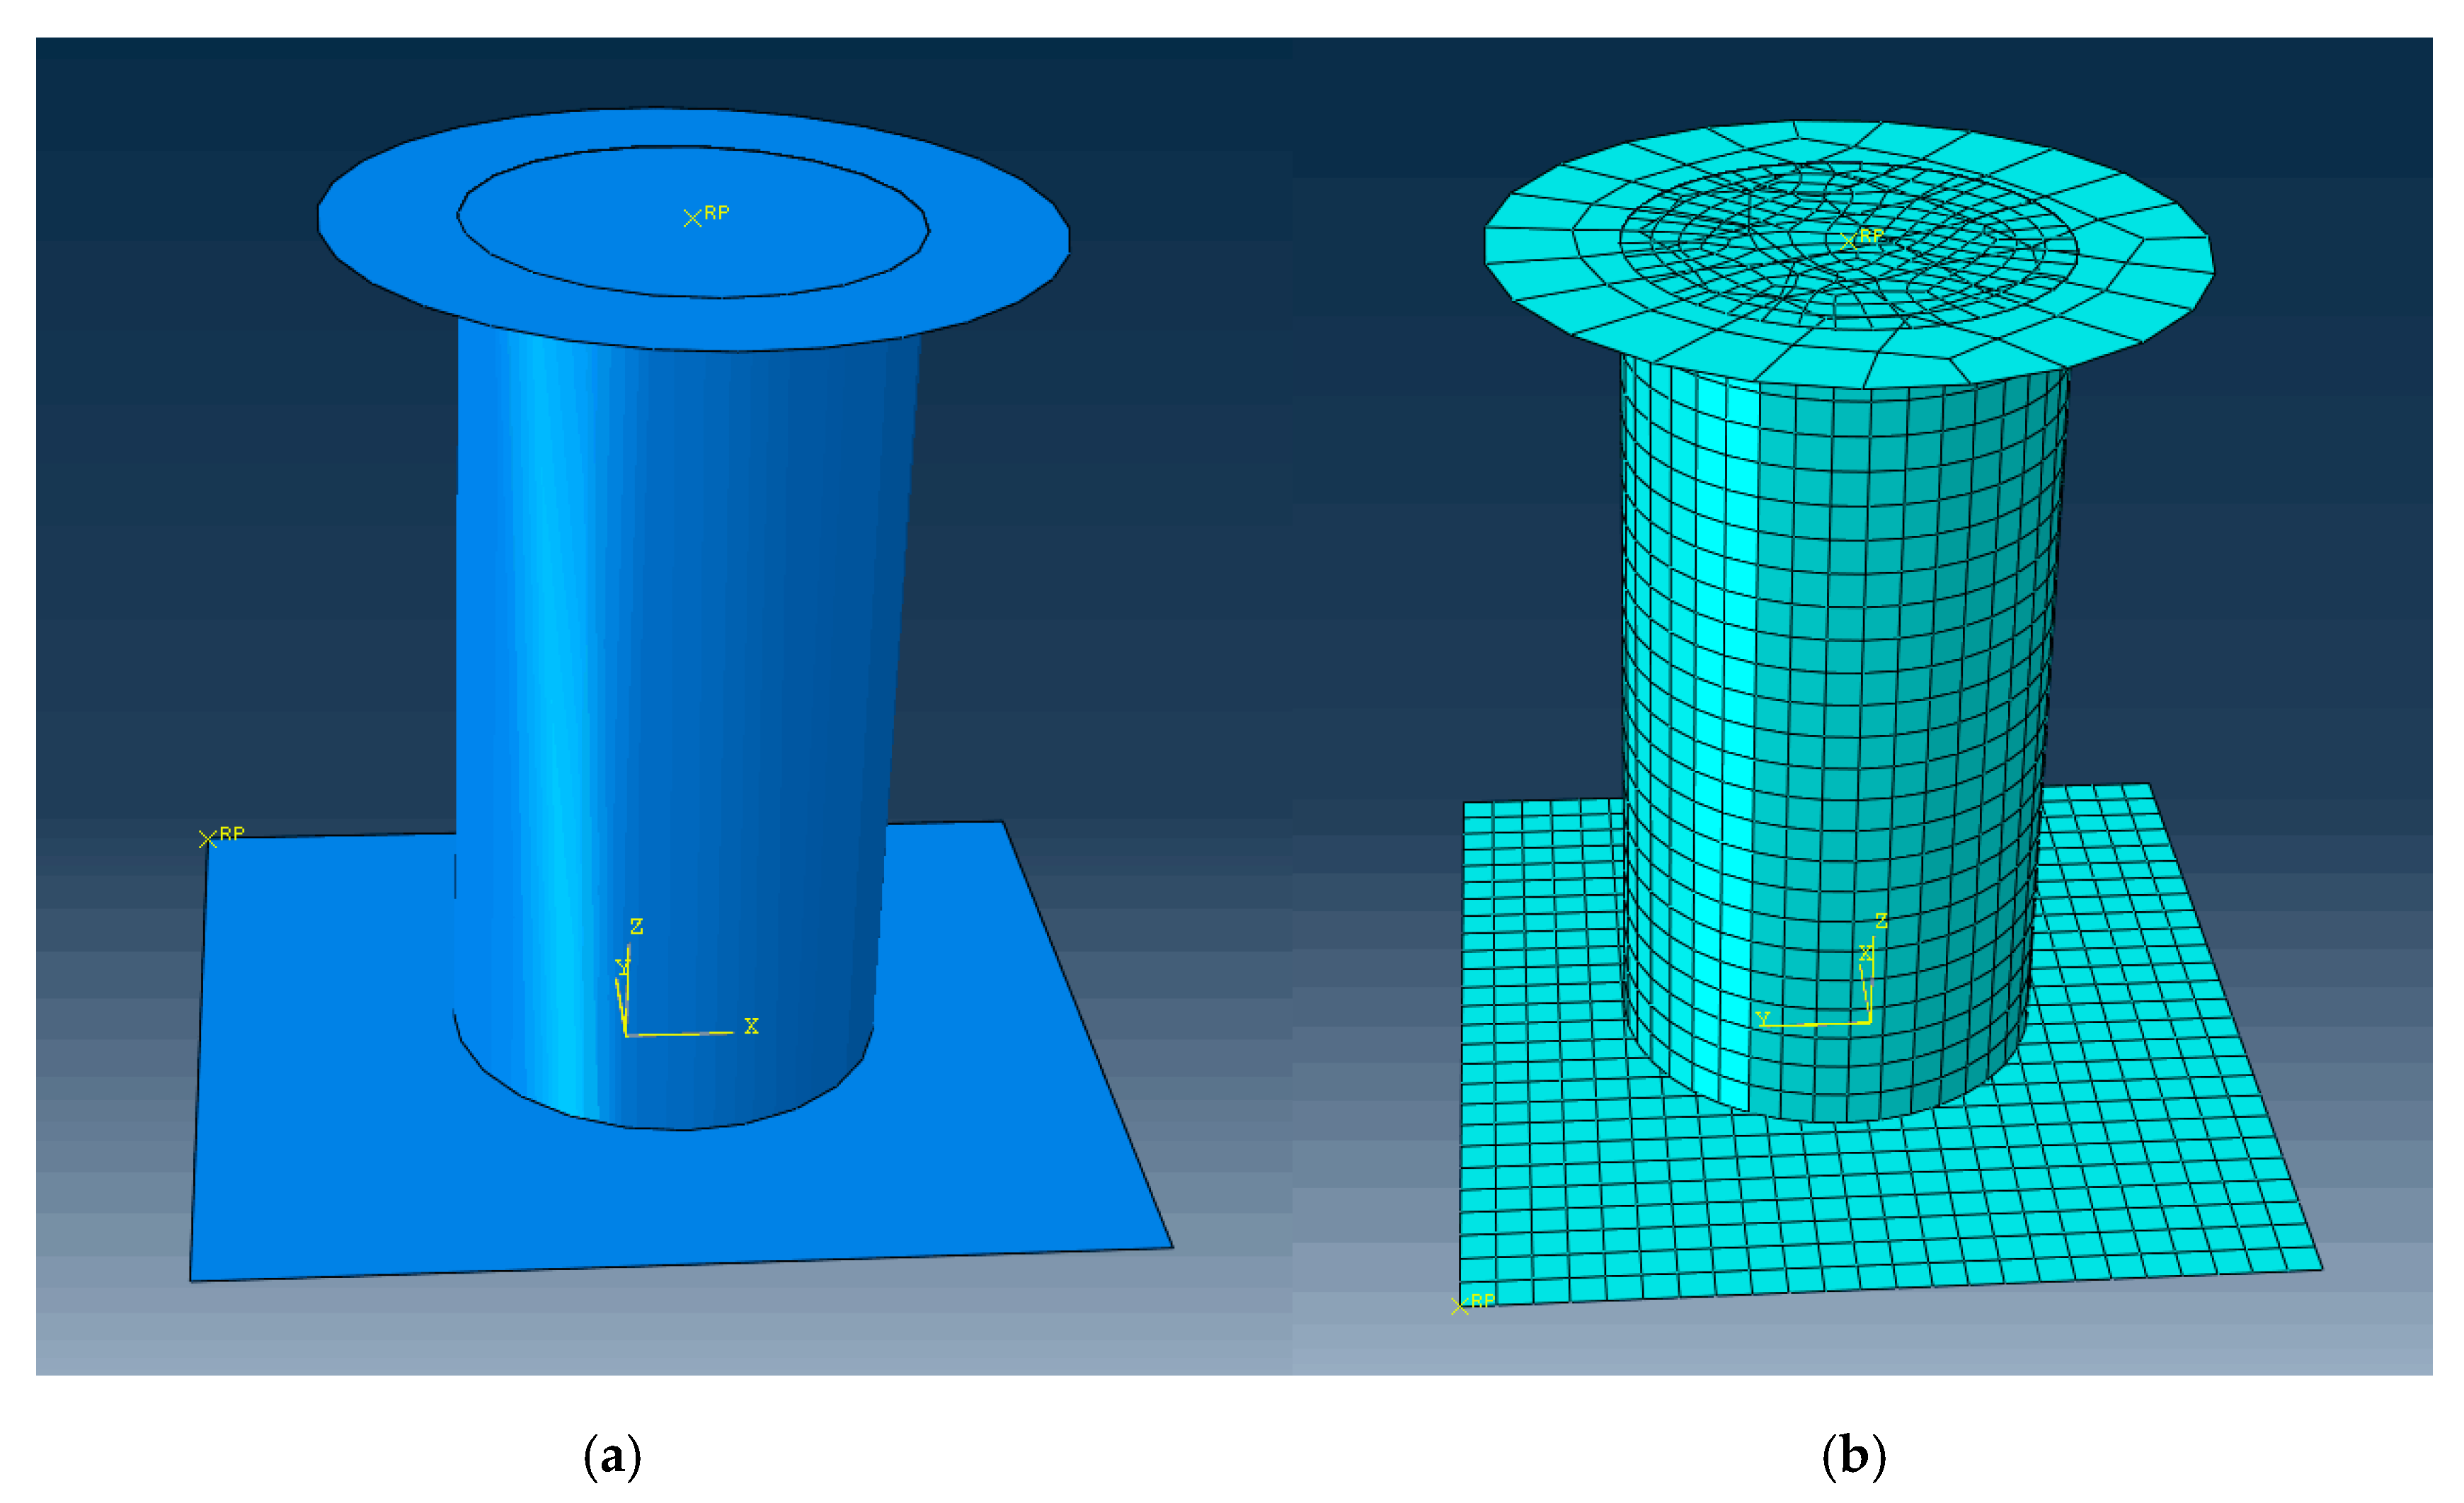
For the simulation on the uniaxial compression process of sandstone, the bottom surface was set to be fixed while the loads were exerted to the head surface. A virtual model with the same size as the physical sandstone specimen was built in the Part section in a module of Abaqus. Figure 17a shows the cylinder part (radius = 25 mm, height = 100 mm), while it also presents the upper (Part 2) and lower (Part 3) compression surfaces which are larger than the cylinder base area. In the Property section of Abaqus, the cylinder object was set to be of elastic materials with the elastic modulus of 5 × 10³ MPa and Poisson’s ratio of 0.25. Part 2 and Part 3 were set to be rigid, without any deformation during the loading process. Finally, by defining the coupling constraints, three parts were coupled together, as is shown in Figure 17a.
Meshing (Figure 17b) is critical to the accuracy of the finite element analysis results. In this paper, the three-dimensional cylinder model was divided into grids by gridding seeds with the element division size of 0.01 mm. Then, the axial compressive load was applied to Part 2 by stress with the loading speed at 0.1 MPa/s. Since the above two loading scenarios only have a difference in loading speed, numerical simulation produces similar pattern results. Therefore, only the scenario with the loading speed at 0.1 MPa/s was investigated by the Abaqus simulation.
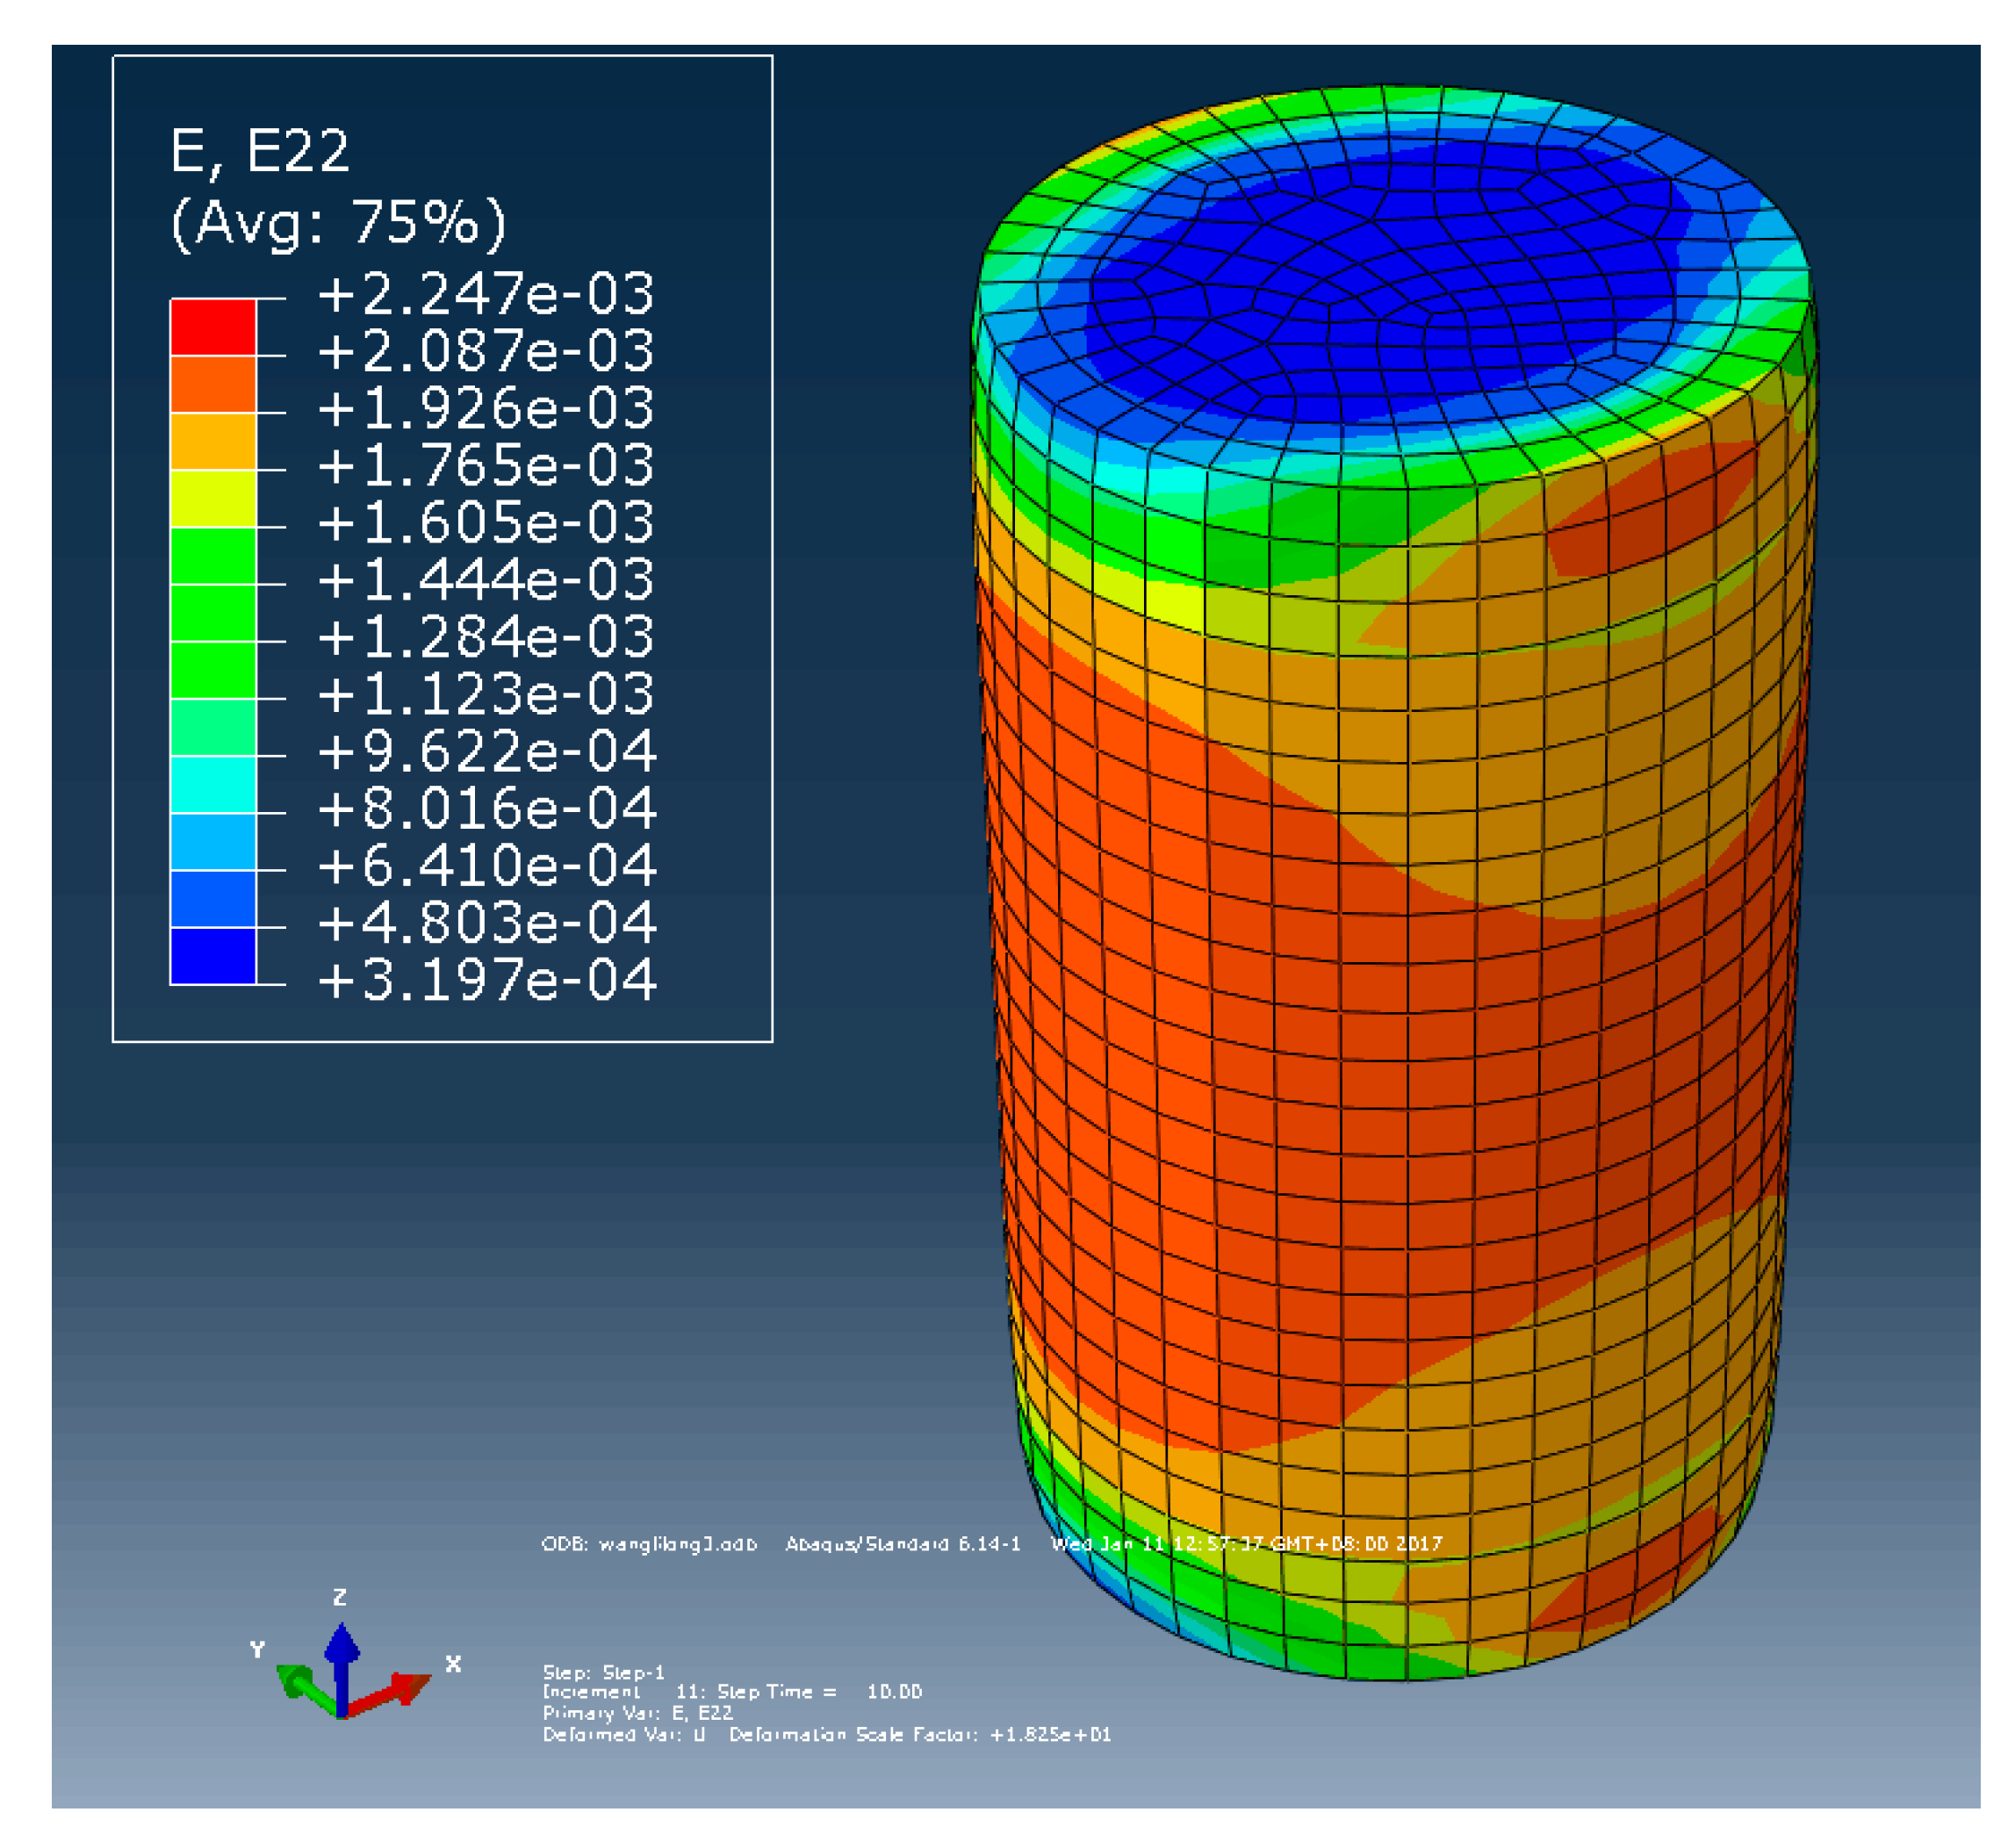
During the physical experiments, when the loading reaches the compression limit, a principal crack along the vertical direction appears with multiple minor cracks with an axial angle of around 45°. In Figure 18, it is found that during the compression process, larger strain (shown in red color) occurs in some end areas, as well as the central area, with certain angles away from the axle, which is well consistent with the experiment results shown in Figure 5, Figure 6, Figure 7, Figure 8, Figure 9, Figure 10 and Figure 11. The perceived pattern and trend consistency between the strain profiles obtained from the two methods of the Abaqus simulation and DIC analysis helps to verify the reliability of DIC results in this study.
This study predicts that when the loading speed is 0.1 MPa/s, the failure strain lies between 0.004 and 0.011, while for the loading speed of 0.3 MPa/s, the counterpart strain value is between 0.0048 and 0.0093. The projected information should be useful for the prediction of failure on sandstone in real-world engineering applications.
For the sake of safety, the weakest point of failure should always be given priority. That is to say, for sandstone components under safety monitoring, if the strain value reaches 0.004, there will exist risks of failure which may further lead to accidents. Assuming the safety coefficient is to be 1.5, the calculated allowable strain is then about 0.0027 (=0.004/1.5), and this value is lower than the theoretical result of 0.0037 obtained from the Hill–Tsai criterion. That is to say, when the monitored sandstone strain value reaches 0.0027, caution should be taken, and more attention needs to be paid to strain dynamics to prevent structural damage and engineering failure.

6. Conclusions

Reliable prediction of failure strain for sandstone is critical for engineering security in the construction industry given the wide use of sandstone materials in infrastructure systems. For the first time, through uniaxial compression experiments on sandstone specimens, combining the advanced noncontact digital image correlation (DIC) method, this paper studied the deformation process of sandstone to estimate its full-field failure strain. On classical digital photography principles, digital image correlation contrasts pre- and post-deformation images to obtain numerical strain information by image processing and statistical correlation techniques. A sandstone cylinder 50 mm in diameter and 100 mm in height was adopted as a specimen by considering two loading speed scenarios (loading speeds at 0.1 and 0.3 MPa/s, respectively). Four typical points were selected to obtain detailed investigations, with the strain values along the x-direction, y-direction, and shear direction being analyzed.
It was observed that in both scenarios with the loading speeds of 0.1 and 0.3 MPa/s, the strain–time relationships at all the four selected points displayed linearity before failure occurred. Nevertheless, when strain approaches some critical value of failure, a sharp rise occurs. We defined the identified critical value to be the failure threshold. After comprehensive analysis on the four selected typical points at two different speeds, we concluded that failure may occur if the strain reaches or exceeds 0.004. Sandstone failure mode detected in the physical experiment process was additionally cross-checked by finite element analysis and the Hill–Tsai criterion. In this study, some resulting errors may exist, attributed to the fact that the Cartesian coordinate system was employed to define strain parameters, which may embed uncertainties for cylindrical surfaces subjected to investigation. This study provides a potential basis for future research on mechanical properties of prefabricated rocks associated with the process of failure, and their applications for life cycle deterioration modeling of various structure systems [30].

Author Contributions

Conceptualization, F.C., E.W., B.Z., L.Z., and F.M.; methodology, F.C.; software, F.C.; validation, E.W., B.Z., L.Z., and F.M.; formal analysis, F.C. and E.W.; investigation, F.C.; resources, F.C.; data curation, F.C.; writing—original draft preparation, F.C. and E.W.; writing—review and editing, F.C. and E.W.; visualization, F.C.; supervision, F.C.; project administration, F.C.; funding acquisition, F.C. All authors have read and agreed to the published version of the manuscript.

Funding

This research was funded by NATIONAL NATURAL SCIENCE FOUNDATION OF CHINA, grant number #11942203 and grant number #11472145.

Conflicts of Interest

The authors declare no conflict of interest. The funders had no role in the design of the study; in the collection, analyses, or interpretation of data; in the writing of the manuscript, or in the decision to publish the results.

References

  1. Zhou, Z.; Cai, X.; Chen, L.; Cao, W.; Zhao, Y.; Xiong, C. Influence of cyclic wetting and drying on physical and dynamic compressive properties of sandstone. Eng. Geol. 2017, 220, 1–12. [Google Scholar] [CrossRef]
  2. Verstrynge, E.; Adriaens, R.; Elsen, J.; Van Balen, K. Multi-scale analysis on the influence of moisture on the mechanical behavior of ferruginous sandstone. Constr. Build. Mater. 2014, 54, 78–90. [Google Scholar] [CrossRef]
  3. Chen, X.; Yu, J.; Li, H.; Wang, S. Experimental and numerical investigation of permeability evolution with damage of sandstone under triaxial compression. Rock Mech. Rock Eng. 2017, 50, 1529–1549. [Google Scholar] [CrossRef]
  4. Wu, H.; Zhao, G.; Liang, W.; Wang, E.; Ma, S. Experimental investigation on fracture evolution in sandstone containing an intersecting hole under compression using DIC technique. Adv. Civ. Eng. 2019, 2019, 1–12. [Google Scholar] [CrossRef] [Green Version]
  5. Tating, F.; Hack, R.; Jetten, V. Weathering effects on discontinuity properties in sandstone in a tropical environment: Case study at Kota Kinabalu, Sabah Malaysia. Bull. Eng. Geol. Environ. 2015, 74, 427–441. [Google Scholar] [CrossRef] [Green Version]
  6. Ma, X.; Haimson, B.C. Failure characteristics of two porous sandstones subjected to true triaxial stresses: Applied through a novel loading path. J. Geophys. Res. Solid Earth 2017, 122, 2525–2540. [Google Scholar] [CrossRef]
  7. Peng, J.; Han, H.; Xia, Q.; Li, B. Evaluation of the pore structure of tight sandstone reservoirs based on multifractal analysis: A case study from the Kepingtage Formation in the Shuntuoguole uplift, Tarim Basin, NW China. J. Geophys. Eng. 2018, 15, 1122–1136. [Google Scholar] [CrossRef] [Green Version]
  8. Yue, Z.; Song, Y.; Li, P.; Tian, S.; Ming, X.; Chen, Z. Applications of digital image correlation (DIC) and the strain gage method for measuring dynamic mode I fracture parameters of the white marble specimen. Rock Mech. Rock Eng. 2019. [Google Scholar] [CrossRef]
  9. Lavrov, A.; Gawel, K.; Stroisz, A.; Torsæter, M.; Bakheim, S. Failure modes in three-point bending tests of cement-steel, cement-cement and cement-sandstone bi-material beams. Constr. Build. Mater. 2017, 152, 880–886. [Google Scholar] [CrossRef]
  10. Wang, H.; Xu, W. Relationship between permeability and strain of sandstone during the process of deformation and failure. Geotech. Geol. Eng. 2013, 31, 347–353. [Google Scholar] [CrossRef]
  11. Yang, L.; Wang, Y.; Lu, R. Advanced optical methods for whole field displacement and strain measurement. In Proceedings of the 2010 International Symposium on Optomechatronic Technologies, Toronto, ON, Canada, 25–27 October 2010; IEEE: Piscataway, NJ, USA, 2011. [Google Scholar]
  12. Francis, D.; Tatam, R.P.; Groves, R.M. Shearography technology and applications: A review. Meas. Sci. Technol. 2010, 21, 102001. [Google Scholar] [CrossRef] [Green Version]
  13. Peters, W.H.; Ranson, W.F. Digital imaging techniques in experimental stress analysis. Opt. Eng. 1982, 21, 427–432. [Google Scholar] [CrossRef]
  14. Chen, F.; Chen, X.; Xie, X.; Feng, X.; Yang, L. Full-field 3D measurement using multi-camera digital image correlation system. Opt. Lasers Eng. 2013, 51, 1044–1052. [Google Scholar] [CrossRef]
  15. Shao, X.; Dai, X.; Chen, Z.; He, X. Real-time 3D digital image correlation method and its application in human pulse monitoring. Appl. Opt. 2016, 55, 696–704. [Google Scholar] [CrossRef]
  16. Chen, F.; Zhuang, Q.; Zhang, H. Mechanical analysis and force chain determination in granular materials using digital image correlation. Appl. Opt. 2016, 55, 4776–4783. [Google Scholar] [CrossRef] [PubMed]
  17. Munoz, H.; Taheri, A. Specimen aspect ratio and progressive field strain development of sandstone under uniaxial compression by three-dimensional digital image correlation. J. Rock Mech. Geotech. Eng. 2017, 9, 599–610. [Google Scholar] [CrossRef]
  18. Song, H.; Zhang, H.; Kang, Y.; Huang, G.; Fu, D.; Qu, C. Damage evolution study of sandstone by cyclic uniaxial test and digital image correlation. Tectonophysics 2013, 608, 1343–1348. [Google Scholar] [CrossRef]
  19. Stirling, R.A.; Simpson, D.J.; Davie, C.T. The application of digital image correlation to Brazilian testing of sandstone. Int. J. Rock Mech. Min. Sci. 2013, 60, 1–11. [Google Scholar] [CrossRef] [Green Version]
  20. Lin, Q.; Labuz, J.F. Fracture of sandstone characterized by digital image correlation. Int. J. Rock Mech. Min. Sci. 2013, 60, 235–245. [Google Scholar] [CrossRef]
  21. Li, W.; Shaikh, F.; Wang, L.; Lu, Y.; Wang, K.; Li, Z. Microscopic investigation of rate dependence on three-point notched-tip bending sandstone. Shock Vib. 2019, 2019. [Google Scholar] [CrossRef]
  22. Wang, B.; Pan, B.; Lubineau, G. Some practical considerations in finite element-based digital image correlation. Opt. Lasers Eng. 2015, 73, 22–32. [Google Scholar] [CrossRef]
  23. Bomarito, G.F.; Hochhalter, J.D.; Ruggles, T.J.; Cannon, A.H. Increasing accuracy and precision of digital image correlation through pattern optimization. Opt. Lasers Eng. 2017, 91, 73–85. [Google Scholar] [CrossRef]
  24. Pan, B.; Qian, K.; Xie, H.; Asundi, A. Two-dimensional digital image correlation for in-plane displacement and strain measurement: A review. Meas. Sci. Technol. 2009, 20, 062001. [Google Scholar] [CrossRef]
  25. Su, Y.; Zhang, Q.; Xu, X.; Gao, Z. Quality assessment of speckle patterns for DIC by consideration of both systematic errors and random errors. Opt. Lasers Eng. 2016, 86, 132–142. [Google Scholar] [CrossRef]
  26. Valliappan, V.; Remmers, J.J.C.; Barnhoorn, A.; Smeulders, D.M.J. A numerical study on the effect of anisotropy on hydraulic fractures. Rock Mech. Rock Eng. 2019, 52, 591–609. [Google Scholar] [CrossRef] [Green Version]
  27. Hill, R. A theory of the yielding and plastic flow of anisotropic metals. Proc. R. Soc. A 1948, 193, 281–297. [Google Scholar]
  28. Wang, Q.; Yan, X.; Ding, S.; Huo, Y. Research on the interfacial behaviors of plate-type dispersion nuclear fuel elements. J. Nucl. Mater. 2010, 399, 41–54. [Google Scholar] [CrossRef]
  29. Das, S.; Shen, L. Experimental and numerical investigation of dynamic failure of sandstone under high strain rates. In Proceedings of the 23rd Australasian Conference on the Mechanics of Structures and Materials (ACMSM23), Byron Bay, Australia, 9–12 December 2014; Southern Cross University: Lismore, Australia, 2014; Volume II, pp. 1057–1062. [Google Scholar]
  30. Wang, E.; Shen, Z. Lifecycle energy consumption prediction of residential buildings by incorporating longitudinal uncertainties. J. Civ. Eng. Manag. 2013, 19, 161–171. [Google Scholar] [CrossRef]
Figure 1. Working principle of digital image correlation.
Applsci 10 01280 g001
Figure 2. Implementation of digital image correlation (DIC) for strain measurement.
Applsci 10 01280 g002
Figure 3. Relationship between yield strength and off-axis angle.
Applsci 10 01280 g003
Figure 4. Experiment set-up: (a) specimen before painting; (b) specimen after painting; (c) specimen failure; (d) measuring system.
Applsci 10 01280 g004
Figure 5. Strain dynamics along the x-direction (loading rate = 0.1 MPa/s): (a) t = 131 s; (b) t = 139 s; (c) t = 140.5 s; (d) t = 141 s.
Applsci 10 01280 g005
Figure 6. Strain–time profile along the x-direction (loading rate = 0.1 MPa/s).
Applsci 10 01280 g006
Figure 7. X-direction strain–time relationship at point A (loading rate = 0.1 MPa/s).
Applsci 10 01280 g007
Figure 8. X-direction strain–time relationship at point B (loading rate = 0.1 MPa/s).
Applsci 10 01280 g008
Figure 9. X-direction strain–time relationship at point C (loading rate = 0.1 MPa/s).
Applsci 10 01280 g009
Figure 10. Shear strain–time relationship of sandstone (loading rate = 0.1 MPa/s).
Applsci 10 01280 g010
Figure 11. Y-direction strain–time relationship of sandstone (loading rate = 0.1 MPa/s).
Applsci 10 01280 g011
Figure 12. Strain dynamics along the x-direction (loading rate = 0.3 MPa/s): (a) 58 s; (b) 71.5 s; (c) 72.5 s; (d) 78 s.
Applsci 10 01280 g012
Figure 13. Strain–time profile along the x-direction (loading rate = 0.3 MPa/s).
Applsci 10 01280 g013
Figure 14. X-direction strain–time relationship at point A (loading rate = 0.3 MPa/s).
Applsci 10 01280 g014
Figure 15. X-direction strain–time relationship at point B (loading rate = 0.3 MPa/s).
Applsci 10 01280 g015
Figure 16. X-direction strain–time relationship at point C (loading rate = 0.3 MPa/s).
Applsci 10 01280 g016
Figure 17. Coupling and meshing: (a) coupling graph; (b) meshing graph.
Applsci 10 01280 g017
Figure 18. Simulation results.
Applsci 10 01280 g018